cost-benefit analysis of the implementation of landfill ... · pdf filecost-benefit analysis...
TRANSCRIPT

Cost-benefit analysis of the implementation of landfill disposal bans in
Queensland
November 2014 Synergies Economic Consulting Pty Ltd
www.synergies.com.au

Disclaimer
Synergies Economic Consulting (Synergies) has prepared this report exclusively for the use of the
party or parties specified in the report (the client) for the purposes specified in the report
(Purpose). The report must not be used by any person other than the client or a person authorised
by the client or for any purpose other than the Purpose for which it was prepared.
The report is supplied in good faith and reflects the knowledge, expertise and experience of the
consultants involved at the time of providing the report.
The matters dealt with in this report are limited to those requested by the client and those matters
considered by Synergies to be relevant for the Purpose.
The information, data, opinions, evaluations, assessments and analysis referred to in, or relied
upon in the preparation of, this report have been obtained from and are based on sources believed
by us to be reliable and up to date, but no responsibility will be accepted for any error of fact or
opinion.
To the extent permitted by law, the opinions, recommendations, assessments and conclusions
contained in this report are expressed without any warranties of any kind, express or implied.
Synergies does not accept liability for any loss or damage including without limitation,
compensatory, direct, indirect or consequential damages and claims of third parties, that may be
caused directly or indirectly through the use of, reliance upon or interpretation of, the contents
of the report.

DEHP
Page 3 of 66
Executive Summary
The Draft Queensland Waste Avoidance and Resource Productivity Strategy (2014-2024)
(draft waste strategy) sets out many challenges and opportunities for Queensland, one
of which is increased recycling targets. However, increased recycling targets alone will
not address the disposal of recyclable material to landfill. Through stakeholder
consultation, it was noted landfill disposal bans could be used to complement the draft
waste strategy.
The Department of Environment and Heritage Protection (DEHP) has engaged
Synergies Economic Consulting (Synergies) and MRA Consulting Group (MRA) to
assess the feasibility of introducing landfill disposal bans in Queensland.
Landfill disposal bans have been typically used to reduce the environmental impact of
landfill disposal and to increase the tonnage of material recovered from waste. The most
common categories of waste that are subject to landfill disposal bans include unsorted
or untreated waste, biodegradable and organic waste, hazardous wastes and tyres.
While it is difficult to isolate the impact of landfill disposal bans from other waste
management policies (in particular landfill taxes and levies), there is evidence to suggest
landfill disposal bans have facilitated significant reductions in the proportion of waste
disposed of via landfill and a significant increase in the tonnages of waste material
recovered. Landfill disposal bans are typically introduced a number of years after the
introduction of a landfill tax or levy.
Due to the objectives of this project (i.e. to explore the feasibility of banning one or more
materials from disposal via landfills), it was considered important to ensure the
materials subject to this initial assessment would have the largest contribution to the
targets set out in the draft waste strategy. This criteria was applied while acknowledging
that there would be an opportunity to consider the inclusion of additional materials at a
later date, if DEHP decided to assess the implementation of a landfill disposal ban in
accordance with the Regulatory Impact Statement System Guidelines1.
To identify the most appropriate materials for inclusion in this preliminary cost-benefit
analysis the following issues were considered:
the economic trade-off between the cost per tonne and the diversion rate from
landfill;
11 Queensland Treasury - http://www.treasury.qld.gov.au/office/knowledge/docs/ris-system-guidelines/ris-system-guidelines.pdf (sourced 9 October 2014).

DEHP
Page 4 of 66
the existence of product stewardship schemes, either mandatory or voluntary,
aimed at recycling or developing end-use markets (and the maturity of these
schemes);
the market for reuse materials and recovery rates; and
the number of processors operating throughout Queensland.
Based on the above assessment, the following materials were identified:
concrete (sorted) – South-East and North-East regions;
concrete (mixed) – South-East and North-East regions;
tyres (passenger and small heavy vehicles) – South-East, North-East and Inland
regions;
timber (mixed) – South-East and North-East regions;
metals – South-East and North-East regions;
MSW Green (kerbside and drop-off) – South-East and North-East regions; and
MSW Green (all) – South-East and North-East regions.
The following impacts of the implementation of a landfill disposal ban were quantified
for each of the above waste materials:
reduction in the economic cost of disposal of waste via landfill;
reduction in the cost of greenhouse gas emissions from landfill;
increase in the economic value from recovered material;
increase in the cost of recovery and reprocessing;
increase in the cost of illegal dumping;
increased compliance costs;
cost of administration, monitoring and enforcement; and
cost of policy development and implementation.
The following table summarises the Present Value (PV) estimates of the net economic
impact of the implementation of a landfill disposal ban for each of these waste materials
by region.

DEHP
Page 5 of 66
Net impacts of implementation of a landfill disposal ban by waste material and by region
Waste material Net impact of ban for South-East ($)
Net impact of ban for North-East ($)
Net impact of ban for Inland ($)
Concrete (sorted) 69,201,636 25,627,825 NA
Concrete (mixed) (441,665,379) (212,467,178) NA
Tyres 55,112 22,871 2,287
Timber (89,242,740) (26,142,527) NA
Metals (7,624,829) (1,636,865) NA
MSW Green (kerbside) 106,997 23,798 NA
MSW Green (mixed – all) 19,402,206 5,878,565 NA
Source: Synergies modelling.
The key drivers of the results by waste stream are as follows:
for sorted concrete waste, the significant reduction in the cost of disposal of waste
via landfill;
for mixed concrete waste, the significant increase in the cost of recovering additional
tonnages as a result of the ban;
for tyre waste, the very low tonnages currently being disposed of via landfill;
for metallic waste, the lack of value of metallic waste currently being disposed of
via landfill;
for MSW Green (kerbside), the very low tonnages currently being disposed of via
landfill; and
for MSW Green (mixed – all), the significant reduction in the cost of disposal of
waste via landfill.
Based on the analysis conducted, the implementation of a landfill disposal ban on sorted
concrete, tyres and all MSW Green material (in both the South-East and North-East
regions) would result in a net economic benefit of $119.2 million in PV terms over the 10
year evaluation period. This result includes the cost of policy development and
implementation. The implementation of a ban was found to result in a negative Net
Present Value (NPV) for all other waste materials across all regions.
Sensitivity analysis was conducted on key parameters to assess the impact on the results
of the analysis for each waste stream. The key conclusion to be drawn from this analysis
is that the estimate that is applied for the cost of recovering and reprocessing additional
material as a result of a landfill disposal ban has a significant impact on the net economic
impact of the ban.

DEHP
Page 6 of 66
Based on MRA’s analysis, there is sufficient capacity within the sorted concrete and tyre
recycling markets to accept and process the additional tonnes likely to enter the market
should a landfill disposal ban be implemented. However, additional capacity would be
required to process the additional tonnes of MSW green material. Green waste can be
recycled either through composting, mulch or as a feedstock in a waste-to-energy
process. While the infrastructure requirements vary in accordance with the form of
processing that is undertaken, a period of over 12 months is generally required to
complete the planning, approval and construction stages for any type of new facility.
Prior to the implementation of a landfill disposal ban, careful consideration should be
given to the timing of implementation and the need for complementary policies and
standards. As shown through the desktop review, the introduction of a levy, in the early
stages of the policy (i.e. to transition to a landfill disposal ban), has proved to be integral
to providing the necessary economic signals to encourage additional investment in
processing and recycling capacity. In the absence of a levy, it is important the
complementary policy settings (e.g. phase-in implementation periods, and producer
responsibility measures) are appropriate, so as to ensure any adverse unintended
consequences are minimised and industry is provided with sufficient time to invest and
to develop a good understanding of the future policy settings, including anticipated
feedstock levels.

DEHP
Page 7 of 66
Contents
Executive Summary 3
1 Introduction 10
2 Desktop review of landfill disposal bans 12
3 Potential materials for a landfill disposal ban 14
3.1 Background 14
3.2 Market assessment of potential materials 16
4 Cost-benefit analysis of landfill disposal bans 22
4.1 Approach 22
4.2 Review of targeted materials 23
4.3 Key inputs 26
4.4 Base case 31
4.5 Benefits 32
4.6 Costs 36
5 Results 41
5.1 Net economic impact 41
5.2 Employment impact 45
5.3 Sensitivity analysis 46
6 Recommendations for implementation 49
6.1 Required infrastructure for recycling 49
6.2 Implementation issues 50
6.3 Complementary policies 51
7 Conclusions 52
A Overview of landfill disposal bans 55
B PV estimates of benefits and costs by waste material and by region 64
DEHP
Page 8 of 66
Figures and Tables
Figure 1 Geographical breakdown of regions 15
Figure 2 Economic trade-off 17
Figure 3 Implementation GANTT Chart for new facilities 50
Table 1 Product Stewardship Schemes 17
Table 2 Number of recyclers for each material by region 20
Table 3 Collection and diversion data for concrete (sorted) (2012/13) 23
Table 4 Collection and diversion data for concrete (mixed) (2012/13) 23
Table 5 Collection and diversion data for tyres (2012/13) 24
Table 6 Collection and diversion data for timber waste (2012/13) 24
Table 7 Collection and diversion data for metals (2012/13) 25
Table 8 Collection and diversion data for MSW Green (kerbside) (2012/13) 25
Table 9 Collection and diversion data for MSW green (mixed – all) (2012/13) 26
Table 10 Cost of recovery and reprocessing under the base case and with a
landfill ban 28
Table 11 Market price of recovered material under the base case and with a
landfill ban 29
Table 12 PV estimates of economic costs and benefits from landfilling and
material recovery under the base case by waste material and region 31
Table 13 Economic benefit of reduced cost of landfilling by waste material 33
Table 14 Economic benefit of reduction in greenhouse gas emissions by waste
material 34
Table 15 Economic benefit of increase in recovered material by waste material 36
Table 16 Economic cost of increase in recovery and reprocessing of waste material
by waste stream 37
Table 17 Economic cost of increase in illegal dumping by waste stream 38
Table 18 Economic cost of increased business compliance costs by waste stream 39
Table 19 Economic cost of increased administration, monitoring and enforcement
costs by waste stream and by region 40
DEHP
Page 9 of 66
Table 20 PV estimates for the benefits and costs of the implementation of a
landfill disposal ban by waste material and by region 41
Table 21 Sensitivity analysis for the implementation of a landfill disposal levy on
sorted concrete, tyre waste and all MSW Green material 47
Table 22 Current capacity and potential future need for investment (t/a) 49
Table 23 Infrastructure costs required for various green waste processing
facilities 50
Table 24 NPV impacts of implementation of a landfill disposal ban by waste
material and by region 53
Table A.1 Banned materials – Australian jurisdictions 56
Table A.2 Waste categories included in landfill disposal bans in European
countries 57
Table A.3 Materials banned from landfills – USA (items banned as of 2008) 58
Table A.4 Materials banned from disposal in Nova Scotia 60
Table A.5 Results of landfill disposal ban policies in various European 61
Table A.6 Overview of complementary waste management policies in European
countries 63
Table B.1 NPV of the implementation of a landfill disposal ban by waste material
and by region 64

DEHP
Page 10 of 66
1 Introduction
The Draft Queensland Waste Avoidance and Resource Productivity Strategy (2014-2024)
(draft waste strategy) sets out many challenges and opportunities for Queensland, one
of which is increased recycling targets. However, increased recycling targets alone will
not address the disposal of recyclable material to landfills. Through stakeholder
consultation it was noted that landfill disposal bans could be used to complement the
draft strategy. Based on overseas experience, landfill disposal bans can be effective at
increasing the quantity of material recycled and recovered from waste typically
landfilled.
The Department of Environment and Heritage Protection (DEHP) has engaged
Synergies Economic Consulting (Synergies) and MRA Consulting Group (MRA) to
assess the feasibility of introducing landfill disposal bans in Queensland. The purpose
of this assessment is to:
understand how landfill disposal bans could help support the implementation of
the draft waste strategy based on a desktop review of Australian and international
jurisdictions;
identify a short list of materials that would practically and feasibly benefit from a
landfill disposal ban;
conduct a market analysis of the price and recovery trends for the targeted wastes,
existing industry capacity, and the market for the recovered materials;
undertake a high-level cost-benefit analysis on the impacts of introducing landfill
disposal bans for the short listed materials; and
provide recommendations for implementation, including design attributes,
implementation lead times, investment requirements, scope and suitability of
complementary measures and market development opportunities.
The report is structured as follows:
section 2 sets out the results of the desktop review of landfill disposal bans in other
jurisdictions;
section 3 discusses the process applied to identify a short list of materials that could
feasibility benefit from a landfill disposal ban;
section 4 describes the cost-benefit analysis conducted on the introduction of a
landfill disposal ban;
section 5 sets out the results of the cost-benefit analysis;

DEHP
Page 11 of 66
section 6 provides some recommendations for implementation; and
section 7 provides a summary of our findings.

DEHP
Page 12 of 66
2 Desktop review of landfill disposal bans
Internationally, landfill disposal bans have been implemented in a large number of
countries, mostly across Europe and North America. Europe has the highest number of
countries to implement a landfill ban and over the longest period of time. In contrast,
there has been limited use of landfill disposal bans in Australia.
Based on our desktop review, the following common attributes and learnings have been
identified:
landfill disposal bans are typically used to reduce the environmental impact of
landfill disposal and to increase the tonnage of material recovered from waste;
the common categories of waste included in landfill disposal bans are:
unsorted or untreated waste;
biodegradable and organic waste;
hazardous wastes; and
tyres;
Europe has used landfill disposal bans for the longest period of time, with many
European countries implementing bans in response to the 1999 EU Landfill
Directive (and some prior to this Directive);
landfill disposal bans typically have lengthy implementation periods, the longest
being 12 years;
there is anecdotal evidence to suggest landfill disposal bans result in increased
levels of illegally dumped waste. This includes the shipment of waste overseas to
be illegally disposed of (as observed in some European countries);
the most common complementary policy used to support landfill disposal bans are
landfill taxes or levies, which have been applied in the majority of jurisdictions.
Other complementary policies include waste sorting requirements, producer
responsibility measures and mandatory arrangements for separate collection;
in many cases, landfill disposal bans are implemented for a small number of waste
materials with additional waste materials progressively added over time; and
while it is difficult to isolate the impact of landfill disposal bans from other waste
management policies, for those jurisdictions where a landfill disposal ban has been
in place for several years, there has been a significant reduction in the proportion of
waste disposed of via landfill and a significant increase in the tonnages of waste
material recovered.

DEHP
Page 13 of 66
Attachment A provides an overview of the landfill disposal bans implemented in
Europe, North America and Australia.

DEHP
Page 14 of 66
3 Potential materials for a landfill disposal ban
3.1 Background
Based on a preliminary analysis of the current waste management and disposal sector in
Queensland, DEHP identified the following waste materials for consideration in the
initial scoping of a potential landfill disposal ban:
Concrete;
tyres (car and light passenger vehicle);
televisions and computers;
batteries (used lead acid batteries);
agricultural and veterinary chemical containers;
oil, oil filters and containers;
metals;
timber; and
MSW green (household kerbside and drop-off).
The trend in market prices and recovery rates for each of the materials identified above
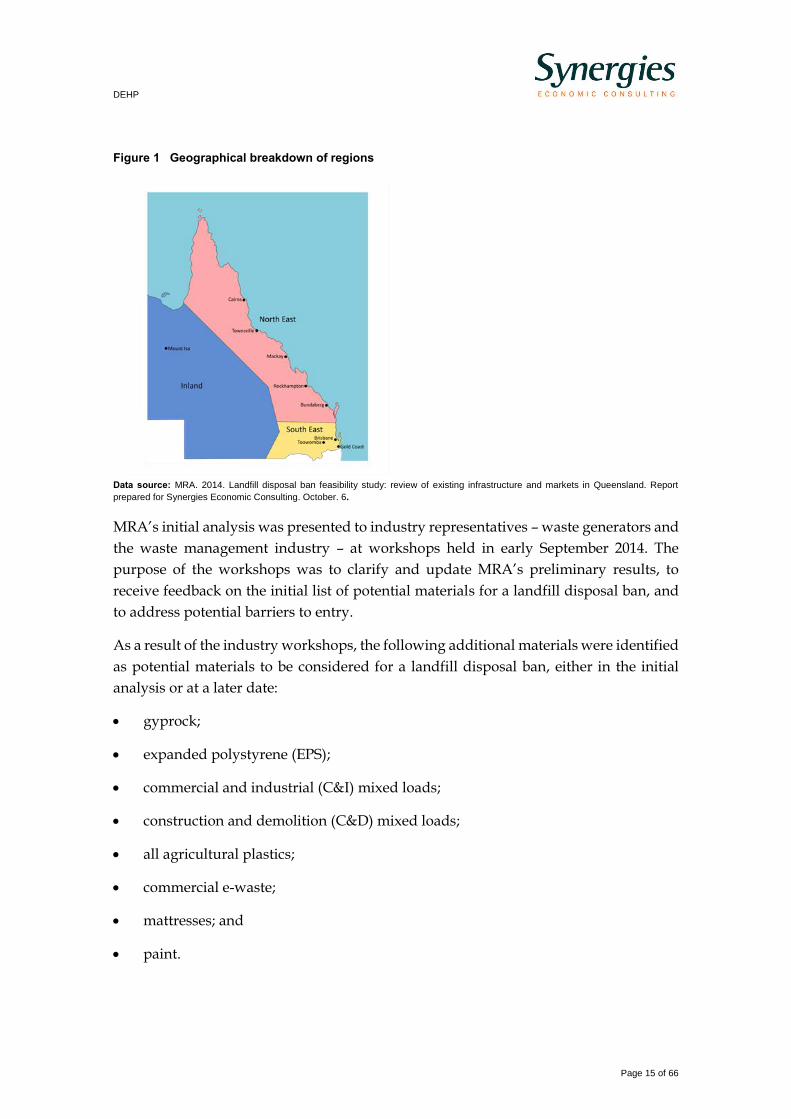
were analysed by MRA. For the purpose of this analysis, Queensland was separated into
three zones – South East region, North East region and Inland (see Figure 1). This
allowed distance and market availability factors to be included in the analysis.
DEHP
Page 15 of 66
Figure 1 Geographical breakdown of regions
Data source: MRA. 2014. Landfill disposal ban feasibility study: review of existing infrastructure and markets in Queensland. Report
prepared for Synergies Economic Consulting. October. 6.
MRA’s initial analysis was presented to industry representatives – waste generators and
the waste management industry – at workshops held in early September 2014. The
purpose of the workshops was to clarify and update MRA’s preliminary results, to
receive feedback on the initial list of potential materials for a landfill disposal ban, and
to address potential barriers to entry.
As a result of the industry workshops, the following additional materials were identified
as potential materials to be considered for a landfill disposal ban, either in the initial
analysis or at a later date:
gyprock;
expanded polystyrene (EPS);
commercial and industrial (C&I) mixed loads;
construction and demolition (C&D) mixed loads;
all agricultural plastics;
commercial e-waste;
mattresses; and
paint.
DEHP
Page 16 of 66
DEHP also sought feedback from the Local Government Association of Queensland
(LGAQ) on the use of landfill bans and other related materials2.
3.2 Market assessment of potential materials
Due to the objectives of this project (i.e. to explore the feasibility of banning one or more
materials from disposal via landfill), it was considered important to ensure the materials
subject to this initial assessment were broadly consistent with the wider policy objective
of contributing to the achievement of the recycling targets identified in the draft waste
strategy. This assessment was undertaken acknowledging that there would be an
opportunity to consider the inclusion of additional materials at a later date, if DEHP
decided to assess the implementation of a landfill disposal ban in accordance with the
Regulatory Impact Statement System Guidelines3.
To identify the most appropriate materials the following criteria was applied.
Cost trade-off
It is important to ensure the materials identified for assessment are appropriate given
the economic trade-off between the cost per tonne and the diversion rate from landfill,
as shown in Figure 2. That is, the costs of recovery are low and a significant level (tonnes)
are currently going to landfill.
2 LGAQ provided a formal submission to DEHP on 3 October 2014 on the impact of a potential landfill ban.
33 Queensland Treasury - http://www.treasury.qld.gov.au/office/knowledge/docs/ris-system-guidelines/ris-system-guidelines.pdf (sourced 9 October 2014).

DEHP
Page 17 of 66
Figure 2 Economic trade-off
Data source: MRA analysis.
Based on this assessment, mattresses, expanded polystyrene and commercial e-waste
were identified as materials to be considered at a later stage of the policy process (i.e. not
part of this preliminary assessment).
National Product Stewardship Schemes
Policy makers have increasingly turned to approaches such as product stewardship
schemes to target producers, or distributors, of products that are deemed to be
problematic.4 There are currently a number of schemes in place, either mandatory or
voluntary, that are aimed at recycling or developing end-use markets. The table below
summarises the schemes applicable to the materials identified above.
Table 1 Product Stewardship Schemes
Scheme Objectives
Government Initiated Product Stewardship Arrangements
National Television and Computer Recycling Scheme a
• A co-regulatory product stewardship scheme funded by the television and computer industry and regulated by the Australian Federal Government
• Manufactures are required to join a ‘co-regulatory arrangement’, which manages collection and recycling of televisions and computers
• The Scheme is intended to progressively increase recycling rates of televisions and computers to 80% by 2021-22 (from 30% in 2012-13)
4 Productivity Commission. 2006, Waste Management, Report no. 38, Canberra. p XXXVI.

DEHP
Page 18 of 66
Scheme Objectives
Australian Packaging Covenant b • A sustainable packaging initiative which aims to change the culture of business to design more sustainable packaging, increase recycling rates and reduce packaging litter
• A co-regulatory scheme that represents a collaboration between 900 government and industry organisations.
• The APC has overseen a 20% reduction in volume of packaging waste generated since 2005, and an increase in packaging recycling from 39% in 2003 to 64.2% in 2013.
Used Oil Recycling • Australian Government introduced a mandatory product stewardship program for used oil in 2001 to encourage increased recycling and more sustainable oil waste management
• The scheme is funded by a 5.449cpl levy on targeted oils
• The scheme has resulted in an increase in the volume of used oil being recycled from 0ML in 2000 to approximately 80ML in 2011-12
Voluntary Product Stewardship Arrangements
drumMUSTER and ChemClear c • Funded and operated by AgStewardship Australia
• drumMUSTER is the national program for the collection and recycling of eligible non-returnable crop production and animal health product chemical containers.
– As of May 2013, the program has reported the collection of more than 21 million agricultural and veterinary chemical drums for recycling purposes
• ChemClear is a chemical collection and disposal service for unwanted and unknown agricultural and veterinary chemicals.
– The ChemClear program has collected over 341 tonnes of obsolete agricultural and veterinary chemicals since 2003.
Future Product Stewardship Arrangements
Waste architectural and decorative paint d • A product stewardship pilot program involving industry groups is currently underway to gauge the effectiveness of implementing a national scheme
• The scheme will seek to increase the recovery of resources and to reduce impacts on the environment through the increased collection and recycling of waste paint
a http://www.environment.gov.au/protection/national-waste-policy/television-and-computer-recycling-scheme.
http://www.environment.gov.au/protection/national-waste-policy/publications/national-television-and-computer-recycling-scheme-
outcomes-2012-13. b http://www.packagingcovenant.org.au/data/Publications/APC_About_APC_FA.pdf.
c http://www.environment.gov.au/system/files/resources/0a517ed7-74cb-418b-9319-7624491e4921/files/factsheet-other-
arrangement.pdf d http://www.environment.gov.au/protection/national-waste-policy/product-stewardship/legislation/product-list-2013-14
Waste materials subject to product stewardship programs were not included in the
preliminary economic analysis for one of the following reasons:
the objectives of the stewardship program are the same as the landfill disposal ban
(i.e. to increase recovery rates and reduce the tonnages of waste being disposed of
via landfill).
The existence of a stewardship program indicates there is already an
established case for diverting the material from landfill; or
the stewardship program has been recently implemented or still in the
implementation phase.

DEHP
Page 19 of 66
It is acknowledged that some of the waste materials currently covered by mature
stewardship programs (i.e. agricultural and veterinary containers, oil, oil filters and
containers) could be included in a landfill disposal ban. For example, it is estimated the
drumMUSTER scheme is currently resulting in approximately 50% of agricultural and
veterinary container waste being recovered, with the remaining 50% being either
disposed of on agricultural properties or via landfill.5 Including agricultural and
veterinary containers in a landfill disposal ban would result in a further reduction in the
tonnages of this waste material that is disposed of via landfill. In the event that DEHP
decides to assess the implementation of a landfill disposal ban in accordance with the
Regulatory Impact Statement System Guidelines one or more of these waste materials could
be included in the analysis.
For those waste materials that are subject to stewardship programs that have either
recently been implemented (i.e. televisions and computers) or are currently in the
implementation stage (i.e. paint), introducing a landfill disposal ban would result in
additional costs being imposed on industry and government with minimal or no
additional economic or environmental benefits. For example, anecdotal evidence
indicates that current facilities are already struggling to meet demand for the recovery
and recycling of computers and televisions under the National Television and Computer
Recycling Scheme.6 There is therefore currently no potential for a landfill disposal ban
to increase recovery rates and divert further tonnages of computers and televisions from
landfill.7 An assessment of whether these materials should form part of a landfill
disposal ban could be undertaken once the applicable stewardship program has been
fully implemented.
Market for reuse materials and recovery rates
Through the desktop review, two key success factors were identified for the
implementation of a landfill disposal ban – access to increased recovery rates i.e.
feedstock (post implementation of the ban) and an established market for the recovered
materials.
There are currently high rates of recovery for both lead acid batteries and tyres,
particularly in the South East and North East regions.8 Through the industry workshops,
5 Based on advice provided at the industry consultation workshop.
6 Department of Sustainability, Environment, Water, Population and Communities (2013). National Waste Policy: Less Waste, More Resources. Discussion Paper on Proposed Amendments to the National Television and Computer Recycling Scheme. Australian Government.
7 A similar argument applies for the exclusion of paint from the analysis, as the Australian Government is currently implementing a pilot program as a preliminary step in implementing a national program.
8 MRA analysis.

DEHP
Page 20 of 66
it was noted that whilst there is a reasonable value attributed to the recycled materials
from lead acid batteries, the cost of recovery in the Inland region would be prohibitive.
This was less of an issue for tyre waste.
Due to the prohibitive transportation costs associated with lead acid batteries (in the
Inland region) and the high proportion of batteries that are already recovered for
recycling, lead acid batteries were not included in the preliminary assessment.
Major facilities processing targeted materials
As shown in the table below, there are a number of processors operating in the South
East and North East regions. However, there are a limited number or no processors
operating in the Inland region.
Table 2 Number of recyclers for each material by region
Material South East North East Inland
Concrete 6 3 0
Tyres 4 1 0
Timber 16 7 1
Metals (Ferrous) 40 21 1
Metals (Non-ferrous) 40 21 1
MSW Green Wast 7 7 2
Source: MRA Consulting.
Due to the limited number of processors operating in the Inland region, the initial
assessment focused on the feasibility of a ban applying to the coastal regions of
Queensland (i.e. the North and South East regions) for all materials, with the exception
of tyres.9
Summary
Based on the above assessment, the following materials were identified as suitable
materials for the preliminary assessment:
concrete (sorted) – South East and North East regions;
concrete (mixed) - South East and North East regions;
tyres (passenger and small heavy vehicles) – all regions; and
timber (mixed) - South East and North East regions
9 Tyre waste was assessed across all regions on the basis that it was the most likely to be viable for inclusion in a landfill
disposal ban for the Inland region.
DEHP
Page 21 of 66
metals - South East and North East regions;
MSW green (kerbside and drop-off) - South East and North East regions; and
MSW green (all) - South East and North East regions.
Collectively these waste streams represent approximately 38% of total waste currently
going to landfill in Queensland.
MRA’s analysis of the current market arrangements, for each of the above materials, is
provided in Attachment A.10
10 MRA. 2014. Landfill disposal ban feasibility study: review of existing infrastructure and markets in Queensland. Report
prepared for Synergies Economic Consulting. October.

DEHP
Page 22 of 66
4 Cost-benefit analysis of landfill disposal bans
The objective of a social cost-benefit analysis is to systematically identify and value the
impacts that a proposal will have on the community. This includes all benefits and costs,
whether they are private or social. These benefits and costs are all valued on the basis of
the standard principles of welfare economics (i.e. individuals’ willingness to pay and
accept change).11
This section sets out the approach used in the cost-benefit analysis on the
implementation of a landfill disposal ban for the shortlisted materials identified in
section 3.2, the base case for the analysis, and the benefits and costs of banning the
disposal of these waste materials in landfills.
4.1 Approach
The step-by-step approach that has been followed in undertaking this cost-benefit
analysis is as follows:
a review of current waste management and disposal arrangements in Queensland
was undertaken and a stakeholder workshop was held to develop a shortlist of
waste materials that could be included in a landfill disposal ban;
based on this shortlist, the waste materials considered appropriate for inclusion in
this high-level cost-benefit analysis were identified (see section 3.2);
the impacts of the implementation of a landfill disposal ban covering the identified
materials were identified (costs and benefits), in addition to the parameter estimates
required to quantify these impacts;
research was undertaken to determine estimates to be applied to the identified
parameters;
the costs and benefits of the implementation of a landfill disposal ban were
modelled individually by waste material and by region (i.e. South-East, North-East
and Inland);
sensitivity analysis was conducted on key parameters and assumptions; and
based on the results, potential options for the implementation of a landfill disposal
ban were identified (i.e. by waste material and by region).
11 Willingness to pay is the monetary value that an individual would be willing to pay for a non-monetary benefit
associated with a project. Willingness to accept is the monetary value that an individual would require in order to be willing to accept an impact.

DEHP
Page 23 of 66
4.2 Review of targeted materials
This section presents an overview of the existing infrastructure and markets in
Queensland for each of the shortlisted waste materials. The overview has been restricted
to the regions in which a ban on each material has been assessed (South-East and North-
East for all materials with the exception of tyres, which has been assessed for all three
regions).
4.2.1 Concrete (sorted)
Table 3 presents an overview of the collection and diversion volumes for sorted concrete
waste in the South-East and North-East regions.
Table 3 Collection and diversion data for concrete (sorted) (2012/13)
Region Tonnes recovered Tonnes landfilled Interstate/ overseas market
South-East 211,961 187,969 No
North-East 94,908 84,165 No
Source: Estimates provided by MRA Consulting Group.
The recovery and recycling of sorted concrete waste is very competitive in South-East
Queensland. There are six firms processing concrete and some processors currently have
plans to expand the capacity of their facilities. The lead time for expansion is 6 months.
There are fewer processors in the North-East region, however the market is considered
competitive.
There are no significant barriers to entry to the concrete processing market. This means
that to the extent that a landfill disposal ban results in a significant increase in the
tonnages of sorted concrete waste that are supplied to the market, new participants will
be able to enter the market and process these tonnages.
4.2.2 Concrete (mixed)
Table 4 presents an overview of the collection and diversion volumes for mixed concrete
waste in the South-East and North-East regions.
Table 4 Collection and diversion data for concrete (mixed) (2012/13)
Region Tonnes recovered Tonnes landfilled Interstate/ overseas market
South-East 963,460 854,403 No
North-East 431,400 382,569 No
Source: Estimates provided by MRA Consulting Group.

DEHP
Page 24 of 66
The characteristics of the markets for the recovery and recycling of mixed concrete waste
in the South-East and North-East regions are similar to those described above for sorted
concrete waste.
4.2.3 Tyres
Table 5 presents an overview of the collection and diversion volumes for tyre waste in
the South-East and North-East regions.
Table 5 Collection and diversion data for tyres (2012/13)
Region Tonnes recovered Tonnes landfilled Interstate/ overseas market
South-East 22,838 192 Yes – significant interstate and overseas markets
North-East 10,226 92 Yes – significant interstate and overseas markets
Inland 1,023 9.2 Yes – significant interstate and overseas markets
Source: Estimates provided by MRA Consulting Group.
Tyre waste that is recovered is typically shredded and granulated for processing. The
market for the processing of tyre waste in Queensland is as follows:
in the South-East, there is one large processor and a small number of lower scale
processors;
in the North-East, there is one processor; and
there are no market participants in the Inland region.
The majority of the recovered material that is produced by tyre waste processors is
supplied into overseas markets (e.g. Asia for Tyre Derived Fuels).
4.2.4 Timber
Table 6 presents an overview of the collection and diversion volumes for timber waste
in the South-East and North-East regions.
Table 6 Collection and diversion data for timber waste (2012/13)
Region Tonnes recovered Tonnes landfilled Interstate/ overseas market
South-East 73,691 245,636 No
North-East 17,950 59,833 No
Source: Estimates provided by MRA Consulting Group.
Most timber waste is generated from building demolitions. While significant tonnages
of timber waste are generated, demand for recovered timber is more limited than other
components of the Construction and Demolition (C&D) waste stream. There is therefore

DEHP
Page 25 of 66
little excess demand for recovered timber products. The markets for the recovery and
recycling of timber waste in the South-East and North-East regions are competitive.
4.2.5 Metals
Table 7 presents an overview of the collection and diversion volumes for metal waste in
the South-East and North-East regions.
Table 7 Collection and diversion data for metals (2012/13)
Region Tonnes recovered Tonnes landfilled Interstate/ overseas market
South-East 580,000 25,200 Yes – significant interstate and overseas markets
North-East 110,910 4,800 Yes – significant interstate and overseas markets
Source: Estimates provided by MRA Consulting Group.
The value of recovered metals means there are strong economic incentives for the
recovery and reprocessing of metal waste (ferrous and non-ferrous). This is
demonstrated by the fact that the vast majority of metallic waste is currently being
recovered and the large number of market participants in the South-East and North-East
regions. It is not anticipated that the market in these regions would experience any
difficulties absorbing the additional tonnages that would be created in the event of a
landfill ban on metallic waste.
The value of the material that is recovered from metallic waste is largely subject to
international market forces, with the majority of recovered material being exported
overseas. The international price of the recovered metal is highly variable (ranging from
$250/tonne to $800/tonne).
4.2.6 MSW green (kerbside)
Table 8 presents an overview of the collection and diversion volumes for MSW Green
material (kerbside) in the South-East and North-East regions.
Table 8 Collection and diversion data for MSW Green (kerbside) (2012/13)
Region Tonnes recovered Tonnes landfilled Interstate/ overseas market
South-East 25,000 170 No
North-East 5,000 30 No
Source: Estimates provided by MRA Consulting Group.
There are currently seven local councils in South-East Queensland that offer an optional
green waste collection service to approximately 113,000 households. The market for the
processing of MSW Green material in the South-East and North-East regions is

DEHP
Page 26 of 66
competitive. Almost 50% of recovered MSW Green material is sent to waste-to-energy
facilities while the other half is sent to organic processors.
4.2.7 MSW green (mixed – all)
Table 9 presents an overview of the collection and diversion volumes for MSW green
waste (mixed – all) in the South-East and North-East regions.
Table 9 Collection and diversion data for MSW green (mixed – all) (2012/13)
Region Tonnes recovered Tonnes landfilled Interstate/ overseas market
South-East 401,381 171,165 No
North-East 201,162 78,472 No
Source: Estimates provided by MRA Consulting Group.
As stated above, the market for the recovery and recycling of MSW Green material in
the South-East and North-East regions is competitive.
4.3 Key inputs
A cost-benefit analysis employs a number of key parameters to derive its results. These
parameters and the estimates that have been applied are set out in the following sections.
4.3.1 Cost of landfill disposal
There is an economic cost associated with the disposal of waste in landfills. As the
implementation of a landfill disposal ban will result in a reduction in the volume of
waste that is disposed of in landfills, the policy will result in a benefit through avoided
landfill costs. Quantifying this benefit requires an estimate to be applied for the cost of
landfilling waste.
The following estimates for the cost of landfill disposal have been applied for the
analysis of the impact of a landfill disposal ban across all waste materials:
$68.40 per tonne for all waste landfilled in the South-East region; and
$62.90 per tonne for all waste landfilled in the North-East and Inland regions.
These estimates are based on cost estimates developed by BDA Group in its 2009
assessment of the full cost of landfill disposal in Australia which was prepared for the
Department of the Environment, Water, Heritage and the Arts.12
12 BDA Group (2009). The full cost of landfill disposal in Australia. Prepared for the Department of the Environment,
Water, Heritage and the Arts.

DEHP
Page 27 of 66
4.3.2 Cost of recovery and reprocessing
The diversion of waste from landfill to recycling facilities results in an economic cost
being incurred. This cost includes:
additional waste collection and sorting costs;
increased costs associated with transporting waste to recycling facilities; and
cost of reprocessing waste material.
In order to quantify the extent to which a landfill disposal ban will result in an economic
cost through additional recovery and reprocessing costs, it is necessary to apply
estimates for the cost of recovering and reprocessing different types of waste.
The per tonnage cost that will be incurred in the recovery and reprocessing of waste will
vary under the base case and under a landfill disposal ban. The extent to which a landfill
disposal ban will result in an increase in the cost of recovery and reprocessing for a waste
material will depend on several factors including:
the equipment and infrastructure that is required for recovery and reprocessing;
the current capacity of the market for recovery and reprocessing relative to the
additional tonnages that would need to be recovered under a landfill disposal ban;
the number and location of recovery and reprocessing facilities; and
the cost of sorting and transporting the banned waste material.
Table 10 presents the estimates used for the costs of recovering and reprocessing the
different waste materials included in the cost-benefit analysis. The same cost estimates
have been applied in across all regions.

DEHP
Page 28 of 66
Table 10 Cost of recovery and reprocessing under the base case and with a landfill ban
Waste material Cost under the base case ($/tonne)
Cost with a landfill ban ($/tonne)
Concrete (sorted) 19 19
Concrete (mixed) 39 139
(additional cost of $100/tonne to account for sorting either at the site or by the waste generator)
Tyres 140 140
Timber 60 180
(additional cost of $120/tonne to account for sorting either at site or by the waste generator)
Metals 29 129
(additional cost of $100/tonne to account for sorting either at site or by the waste generator)
MSW Green (kerbside) 40 40
MSW Green (mixed – all) 40 76
(based on a lift rate of $1.10 per additional service plus bin hire fee of $0.40 per household and $40
processing fee, with a saving of $16/tonne for residual not to landfill)
Note: The additional cost of sorting waste is contingent upon the assumption that the ban structure would be a 100% ‘black and white’ ban.
This structure treats all banned materials as ‘contaminants’. This means that any load containing any banned material must be either
rejected at a landfill site and sorted at an additional rate of a minimum of $100/tonne being passed on to the waste generator.
Source: Estimates provided by MRA Consulting Group.
4.3.3 Economic value of recovered material
Diverting waste from landfill to reprocessing activities results in an economic benefit
equal to the value consumers place on the recycled materials. This is a key benefit of any
waste management policy that aims to increase waste recovery rates. In order to estimate
this impact, it is necessary to determine the opportunity cost of disposing of waste via
landfill.
The impact of a landfill disposal ban depends on the impact of a ban on demand and
supply of recycled materials. Where there is a wide range of uses and strong demand for
a recovered material (e.g. tyres or metallic waste), additional recovered tonnages are
likely to result in a greater economic value than when uses are relatively narrow and
demand is not as strong (e.g. recovered timber). In the latter scenario, the tonnages of
material that would be recovered as a result of the implementation of a landfill disposal
ban would be of lesser economic value than the tonnages of that material that are
recovered under the base case.
The economic benefit from the increased recovery of waste material is determined by:
the price of recovered material – the market price of recovered material has been
used as a proxy for the economic benefit; and

DEHP
Page 29 of 66
the tonnage of waste that is landfilled under the base case – the greater the tonnage
of waste that is landfilled, the greater the tonnage that will be recovered as a result
of the implementation of a landfill disposal ban.
Table 11 sets out the estimates for the market prices of recovered material under the base
case and with a landfill ban. The estimates do not vary by region.
Table 11 Market price of recovered material under the base case and with a landfill ban
Waste material Price under the base case ($/tonne)
Price with a landfill ban ($/tonne)
Concrete (sorted) 16 16
Concrete (mixed) 16 8
(significant increase in recovered material and weak demand for recovered concrete will result in a
50% reduction to economic value)
Tyres 100 100
Timber 108 54
(significant increase in recovered material and weak demand for recovered timber will result in a
50% reduction to economic value)
Metals 525 29
(only applies to metallic waste that is landfilled under the base case on the basis that this material
has little economic value)
MSW Green (kerbside) 44 44
MSW Green (mixed – all) 44 22
(significant increase in recovered material and weak demand for MSW Green will result in a 50%
reduction to economic value)
Source: Estimates provided by MRA Consulting Group.
4.3.4 Cost of illegal dumping
It is anticipated that there will be an increase in illegal dumping as a result of the
implementation of a landfill disposal ban.
Estimating this impact requires an estimate to be applied for the cost per tonne of
illegally dumped waste. A cost estimate of $800/tonne has been adopted across all
materials and regions, based on the median cost to councils of managing illegal dumping
estimated for the ‘State of Waste and Recycling in Queensland’ report.13
The costs of collecting and disposing of illegally dumped waste will be largely incurred
by local councils. Any additional costs, incurred due to an increase in illegal dumping
as a result of the landfill disposal ban, will represent an increased cost to local councils.
13 Department of Environment and Heritage Protection (2013). State of Waste and Recycling in Queensland.

DEHP
Page 30 of 66
4.3.5 Greenhouse gas emissions from landfilled waste
The landfilling of waste results in the emission of greenhouse gases. Australian National
Greenhouse Accounts emission factors were used to calculate the tonnes of greenhouse
gas emissions as a result of the estimated reductions in landfilled waste resulting from
the implementation of a landfill disposal ban. The factors used in the analysis are as
follows:
concrete – 0 tCO2-e per tonne of landfilled waste;
tyres – 2.5 tCO2-e14 per tonne of landfilled waste;
timber – 1.2 tCO2-e15 per tonne of landfilled waste;
metals – 0 tCO2-e per tonne of landfilled waste; and
MSW Green – 1.4 tCO2-e16 per tonne of landfilled waste.17
4.3.6 Economic cost of greenhouse gas emissions
An estimate of $10 per tonne of CO2-e has been applied to estimate the cost of
greenhouse gas emissions from the landfilling of waste. This is consistent with the cost
estimate applied in the recently released expert report on the Renewable Energy Target
Scheme.18
4.3.7 Effectiveness of the landfill ban
While it is intended that the landfill ban will prevent the landfilling of all banned
materials, experience in other jurisdictions demonstrates that there is still likely to be a
proportion of banned waste materials that will be deposited in landfills, either due to
non-compliance or lack of awareness. The following assumptions have been adopted for
the proportion of banned waste materials that will be recovered as a result of the
implementation of a landfill disposal ban:
90% of landfilled waste to be recovered as a result of the ban in years 1 and 2; and
95% of landfilled waste to be recovered as a result of the ban from year 3 onwards.
14 Based on emissions factor for ‘rubber and leather’.
15 Based on emissions factor for ‘wood’.
16 Based on the average of the emissions factors for ‘food’ and ‘garden and green’.
17 Department of Industry, Innovation, Climate Change, Science, Research and Tertiary Education (2013). Australian National Greenhouse Accounts – National Greenhouse Accounts Factors.
18 Commonwealth of Australia (2014). Renewable Energy Target Scheme – Report of the Expert Panel.

DEHP
Page 31 of 66
4.3.8 Growth rates
An annual growth rate of 1% has been applied to the tonnages of waste material to be
landfilled and recovered under the base case for all waste materials across all regions.
This assumption is based on advice provided by the MRA Consulting Group, based on
current trends in waste generation and landfill disposal.
4.4 Base case
In order to assess the impact of a policy it is necessary to define the base case (i.e. the
status quo). In this case, the base case is the continuation of current waste management
and disposal arrangements for the targeted waste materials without the implementation
of a landfill disposal ban.
The table below summarises the results of the base case in terms of the Present Values
(PV) of forward-looking costs and economic values associated with the landfilling and
recovery of waste material. The PVs have been calculated based on a 10-year evaluation
period (consistent with the draft waste strategy) and a real social discount rate of 7%,
consistent with the research paper19 released by the Productivity Commission.20
Table 12 PV estimates of economic costs and benefits from landfilling and material recovery under
the base case by waste material and region
Base case estimate PV South-East ($) PV North-East ($) PV Inland ($)
Concrete (sorted)
Cost of landfill 95,845,091 39,464,783 NA
Cost of emissions from landfilled waste - - NA
Cost of tonnes recovered 30,021,826 13,442,621 NA
Value of tonnes recovered 25,281,538 11,320,102 NA
Concrete (mixed)
Cost of landfill 435,658,718 179,385,760 NA
Cost of emissions from landfilled waste - - NA
Cost of tonnes recovered 280,108,210 125,421,587 NA
Value of tonnes recovered 114,916,189 51,455,010 NA
Tyres
Cost of landfill 97,900 43,139 4,314
Cost of emissions from landfilled waste 35,782 17,146 1,715
19 Harrison, M. (2010). Valuing the Future: the social discount rate in cost-benefit analysis. Visiting Researcher Paper.
Productivity Commission.
20 Whilst a real discount rate of 7% has been applied, Synergies is of the view that the true social discount rate is likely to be significantly lower. However, a conservative approach has been adopted by aligning with the views of the Productivity Commission.

DEHP
Page 32 of 66
Base case estimate PV South-East ($) PV North-East ($) PV Inland ($)
Cost of tonnes recovered 23,834,917 10,672,382 1,067,656
Value of tonnes recovered 17,024,941 7,623,130 762,611
Timber
Cost of landfill 125,249,402 28,055,562 NA
Cost of emissions from landfilled waste 21,973,579 5,352,412 NA
Cost of tonnes recovered 32,960,458 8,028,663 NA
Value of tonnes recovered 59,328,825 14,451,594 NA
Metals
Cost of landfill 12,849,440 2,250,709 NA
Cost of emissions from landfilled waste - - NA
Cost of tonnes recovered 125,387,295 23,977,077 NA
Value of tonnes recovered 2,269,942,415 434,067,781 NA
MSW Green (kerbside)
Cost of landfill 106,059 23,445 NA
Cost of emissions from landfilled waste 21,708 5,218 NA
Cost of tonnes recovered 119,686,273 59,983,732 NA
Value of tonnes recovered 131,654,901 65,982,105 NA
MSW Green (mixed – all)
Cost of landfill 87,276,759 36,795,348 NA
Cost of emissions from landfilled waste 17,863,664 8,189,744 NA
Cost of tonnes recovered 119,686,273 59,983,732 NA
Value of tonnes recovered 131,654,901 65,982,105 NA
Source: Estimates provided by MRA Consulting Group.
4.5 Benefits
There are three benefits associated with the reduction in waste disposed of via landfill:
a reduction in the cost of landfilling;
a reduction in the cost of greenhouse gas emissions as a result of landfilling; and
an increase in the economic value of recovered material.
4.5.1 Reduced cost of landfilling
There is an economic cost that is incurred as a result of sending waste to landfill. This
cost includes the operational costs of operating a landfill (i.e. labour, fuel and materials,
rehabilitation), the cost of the land on which the landfill site is situated, and other costs
associated with maintaining the landfill site (i.e. gas recovery and flaring, fencing,
capping and landscaping). There are also environmental costs associated with disposing

DEHP
Page 33 of 66
of waste in landfills (other than the cost of greenhouse gas emissions), including leachate
leakage and damage to amenity.
As a result of the implementation of a landfill disposal ban, less waste will be disposed
of in landfills. This will result in a reduction in the environmental cost that is incurred
as a result of the landfilling of waste, hence resulting in an economic benefit. The cost
estimates that have been applied for the landfilling of waste have been set out in section
4.3.1.
The magnitude of this benefit is primarily dictated by the tonnages of waste material
that are landfilled under the base case. For waste materials where a significant
proportion of current waste is disposed of via landfill, the implementation of a landfill
disposal ban will result in significant tonnages being diverted from landfill,
subsequently resulting in a significant economic benefit. For example, it is estimated that
871,577 tonnes of mixed concrete will be landfilled in the South-East region in 2014/15
under the base case. As a result of the implementation of a landfill disposal ban, it is
anticipated that this total will fall by 90% to 87,158 tonnes. Applying the estimate for the
cost of landfilling waste in the South-East region ($68.40/tonne) to the reduced tonnes
of landfilled waste results in an economic benefit in 2014/15 of $53,654,249.
The table below sets out the estimates for the PVs of the economic benefit resulting from
the reduced cost of landfilling by waste material and region.
Table 13 Economic benefit of reduced cost of landfilling by waste material
Waste material PV for South-East ($) PV for North-East ($) PV for Inland ($)
Concrete (sorted) 89,861,455 37,000,985 NA
Concrete (mixed) 408,460,421 168,186,656 NA
Tyres 91,789 40,445 4,045
Timber 117,430,047 26,304,045 NA
Metals 12,047,245 2,110,197 NA
MSW Green (kerbside) 99,438 21,981 NA
MSW Green (mixed – all) 81,828,046 34,498,204 NA
Source: Estimates provided by MRA Consulting Group.
4.5.2 Reduced cost of greenhouse gas emissions
There is an economic cost associated with the greenhouse gas emissions that result from
the landfilling of waste. Sections 4.3.5 and 4.3.6 set out the parameter estimates that have
been applied to estimate the greenhouse gas emissions resulting from the landfilling of
different waste materials and the cost of greenhouse gas emissions respectively. The
table below summarises the PV estimates of the economic benefit that will be derived

DEHP
Page 34 of 66
from the reduction in greenhouse gas emissions due to the reduction in landfill tonnages
under a landfill disposal ban, based on these parameter estimates.
Table 14 Economic benefit of reduction in greenhouse gas emissions by waste material
Waste material PV for South-East ($) PV for North-East ($) PV for Inland ($)
Concrete (sorted) - - NA
Concrete (mixed) - - NA
Tyres 33,548 16,075 1,608
Timber 20,601,763 5,018,260 NA
Metals - - NA
MSW Green (kerbside) 20,353 4,892 NA
MSW Green (mixed – all) 16,748,430 7,678,456 NA
Source: Estimates provided by MRA Consulting Group.
There is no benefit derived from the reduction in greenhouse gas emissions from the
diversion of concrete and metallic waste from landfills as these materials are inert waste,
and subsequently do not result in any greenhouse gas emissions.
4.5.3 Increased value of recovered material
When a waste material is sent to landfill there is an economic cost associated with the
forgone value of recycling the materials. A landfill disposal ban results in a benefit equal
to the value of the tonnage of waste that is recovered. The magnitude of this benefit is
determined by applying an estimate for the value of recovered material (i.e. the lost
commodity value of landfilled waste) to the additional tonnages of recovered waste as a
result of the landfill disposal ban.
The following approach has been applied to estimate the increase in the economic value
that is derived from recovered waste material under a landfill disposal ban:
the value of the material that is currently recovered under the base case is estimated
based on the current price of each recovered material (i.e. the current price of
recovered material is used as a proxy for the economic value that is derived);
an estimate has been derived for the price that would apply to recovered material
as a result of a landfill disposal ban. This price has been applied to the additional
tonnages of material that are to be recovered as a result of the ban to estimate the
economic value that will be derived from this material (i.e. the price of recovered
material that will apply under the ban has been used as a proxy for the value of
additional material that will be recovered as a result of the landfill disposal ban);21
21 The market price of recovered material under a landfill disposal ban has not been applied to estimate the economic
value of material that is recovered under the base case, as the introduction of a landfill disposal ban will not result in

DEHP
Page 35 of 66
the economic value of the additional tonnages that will be recovered as a result of
the ban has been added to the estimate for the economic value of material currently
being recovered under the base case (which is calculated based on the current
market value of recovered material); and
the estimate for the economic value of material that is currently recovered under
the base case is subtracted from the total economic value of recovered material
under a landfill disposal ban (including tonnages recovered under the base case and
as a result of the ban) to produce an estimate for the increase in the economic value
of recovered material as a result of the implementation of a landfill disposal ban.
It is noted that this approach represents a lower bound estimate of the economic value
that is derived as a result of the additional tonnages recovered as a result of the landfill
disposal ban, as there is likely to be consumer surplus derived by users of the material
which represents additional value beyond the market price of the recovered material.22
However, it is not possible to estimate the value of this consumer surplus as this would
require detailed information on the profile of demand for each of the recovered
materials, which is not available. Sensitivity analysis has been performed on this
parameter for key waste materials.
The estimates for market value that have been applied to the waste materials under the
base case and landfill disposal ban scenarios are set out in Table 11.
The following table presents the PVs of the economic benefit estimated for the increase
in the tonnages of recovered material by waste material and region.
a reduction in the economic value that is derived from this material. Rather, the key issue is the economic value that will be derived from material that is recovered as a direct result of the introduction of a landfill disposal ban. The market price that will apply under a landfill disposal ban is considered an appropriate proxy for the economic value of this material.
22 Consumer surplus exists where the willingness of consumers to pay for a good or service exceeds the market price. For example, if a consumer is willing to pay $150 for a tonne of recovered material but the market price is $100 per tonne, the consumer is gaining consumer surplus in relation to that tonne valued at $50.

DEHP
Page 36 of 66
Table 15 Economic benefit of increase in recovered material by waste material
Waste material PV for South-East ($) PV for North-East ($) PV for Inland ($)
Concrete (sorted) 20,796,024 7,189,109 NA
Concrete (mixed) 47,263,606 21,162,836 NA
Tyres 132,762 63,615 6,362
Timber 92,411,287 22,341,310 NA
Metals 5,053,272 962,528 NA
MSW Green (kerbside) 63,283 15,212 NA
MSW Green (mixed – all) 26,038,247 11,937,448 NA
Source: Estimates provided by MRA Consulting Group.
4.5.4 Other benefits
The implementation of a landfill disposal ban also has the potential to result in other
benefits that have not been quantified in this analysis. The two most significant of these
benefits are:
a reduction in waste generation – a landfill disposal ban increases the cost associated
with the disposal of waste material. This provides an economic incentive to reduce
the generation of waste material through up-stream process innovation in the
manufacturing and construction sectors. To the extent that these innovations reduce
the tonnages of waste material that is generated, this constitutes a resource saving
and economic benefit attributable to the landfill disposal ban; and
a reduction in the cost of greenhouse gas emissions attributable to production using
‘virgin’ materials – as previously noted, the implementation of a landfill disposal
ban will result in a significant increase in the tonnages of material that are recovered
and reprocessed. This will result in a reduction in total ‘virgin’ production (i.e.
production and manufacture of good using ‘virgin’ materials). As ‘virgin’
production is more emissions intensive than production using recovered materials,
this will translate to a reduction in the economic cost associated with greenhouse
gas emissions resulting from production and manufacturing.
4.6 Costs
There are four main costs that will be incurred in implementing a landfill disposal ban
on selected waste materials. These are:
increased resource recovery costs;
the cost of increases in illegal dumping;
compliance costs incurred by landfill operators and waste generators; and

DEHP
Page 37 of 66
monitoring and compliance costs to be incurred by government.
4.6.1 Increased resource recovery costs
The benefit that is derived from the diversion of waste from landfills (i.e. reduced cost
of landfilling and reduction in the cost of greenhouse gas emissions), also creates a cost
associated with the increase in recovery and reprocessing activities. The cost of these
activities under both the base case and a landfill ban are set out for each waste material
in section 4.3.2. The economic cost associated with the increase in recovery and
reprocessing activities under a landfill ban for each waste material will be determined
by:
the additional tonnage of waste that will be recovered and reprocessed as a result
of the implementation of a landfill ban (i.e. the tonnages that are being landfilled
under the base case) – the higher the tonnages to be recovered, the higher the
additional cost that will be incurred from recovering and reprocessing activities;
and
the cost of recovery and reprocessing under a landfill ban – for some waste
materials, the implementation of a landfill disposal ban will result in a significant
increase in the cost of recovery and reprocessing, due to the additional sorting and
treatment requirements associated with reprocessing waste material that is
currently disposed of via landfill. It is important to note that this additional cost will
only apply to the material that is recovered as a result of the landfill disposal ban
(i.e. waste that is disposed of via landfill under the base case). Based on the advice
providing by MRA, this is likely to be the case for mixed concrete waste, timber
waste, metallic waste and mixed MSW Green material.
Table 16 presents the PV estimates for the increase in the cost of the recovery and
reprocessing of waste material under a landfill disposal ban by waste stream.
Table 16 Economic cost of increase in recovery and reprocessing of waste material by waste stream
Waste material PV for South-East ($) PV for North-East ($) PV for Inland ($)
Concrete (sorted) 24,695,279 11,057,558 NA
Concrete (mixed) 821,205,160 367,704,276 NA
Tyres 185,867 89,061 8,906
Timber 308,037,625 74,471,035 NA
Metals 22,478,346 4,281,590 NA
MSW Green (kerbside) 57,530 13,829 NA
MSW Green (mixed – all) 89,950,309 41,238,458 NA
Source: Estimates provided by MRA Consulting Group.

DEHP
Page 38 of 66
The cost associated with increased recovery and reprocessing activities will be most
significant for mixed concrete, timber and mixed MSW Green materials.23 This is driven
by both the significant tonnages of these materials that will be recovered as a result of a
landfill disposal ban and the higher cost that will be incurred in reprocessing these
materials.
4.6.2 Increased cost of illegal dumping
Any policy measure that increases the cost associated with the disposal of waste material
has the potential to increase illegal dumping. The impact of the implementation of a
landfill disposal ban on illegal dumping and the associated cost is discussed in section
4.3.4. In order to account for this impact, the following parameter estimates have been
adopted:
a cost estimate of $800/tonne of illegally dumped waste (see section 4.3.4); and
an assumption that the implementation of a landfill disposal ban will result in a 1%
increase in the tonnage of illegally dumped waste across all waste materials (based
on advice provide by MRA).
Table 17 presents the PV estimates for the costs that will be incurred under a landfill
disposal ban as a result of the estimated increase in illegal dumping.
Table 17 Economic cost of increase in illegal dumping by waste stream
Waste material PV for South-East ($) PV for North-East ($) PV for Inland ($)
Concrete (sorted) 11,209,952 5,019,368 NA
Concrete (mixed) 50,954,236 22,815,359 NA
Tyres 11,450 5,487 549
Timber 4,394,728 3,568,275 NA
Metals 1,502,858 286,259 NA
MSW Green (kerbside) 12,405 2,982 NA
MSW Green (mixed – all) 10,207,808 4,679,853 NA
Source: Estimates provided by MRA Consulting Group.
23 For MSW Green material, it is noted the increased cost associated with the recovery and reprocessing of additional
material under a landfill disposal ban (due largely to the cost of providing an additional bin and collection service to households) will be incurred by local Councils and, to the extent that Councils pass on this additional cost, subsequently by ratepayers. This impact has been accounted for in the analysis of the costs and benefits of the landfill disposal ban.

DEHP
Page 39 of 66
4.6.3 Compliance costs
The implementation of a landfill disposal ban will impose an additional compliance
burden and subsequently additional costs on landfill operators and waste generators.
Based on advice provided by MRA, the cost of business compliance due to the
implementation of a landfill disposal ban is estimated at $2 per tonne across all waste
materials and regions. This estimate has been applied to the tonnage of waste that is to
be landfilled under the base case. Table 18 presents the PV estimates for this cost by
waste material and by region.
Table 18 Economic cost of increased business compliance costs by waste stream
Waste material PV for South-East ($) PV for North-East ($) PV for Inland ($)
Concrete (sorted) 2,802,488 1,254,842 NA
Concrete (mixed) 12,738,559 5,703,840 NA
Tyres 2,863 1,372 137
Timber 3,662,263 892,069 NA
Metals 375,715 71,565 NA
MSW Green (kerbside) 3,101 745 NA
MSW Green (mixed – all) 2,551,952 1,169,963 NA
Source: Estimates provided by MRA Consulting Group.
4.6.4 Administration, monitoring and enforcement costs
The implementation of a landfill disposal ban will require government to allocate
additional resources to ongoing administration, monitoring and enforcement activities.
It is anticipated that these costs will be higher in the earlier years of the ban as waste
generators and landfill site operators experience difficulties adjusting to the new
requirements. The following cost estimates have been applied to account for the
administration, monitoring and enforcement costs that will be incurred by government
as a result of the introduction of a landfill ban:
$2.66 per tonne in years 1 and 2 of the evaluation period (across all waste streams
and regions); and
$1.73 per tonne in years 3 onwards (across all waste streams and regions).24
As with the compliance cost estimates, these costs have only been applied to waste
material that is disposed of via landfill under the base case. Table 19 presents the PV
estimates for this cost by waste material and by region.
24 These cost estimates were derived by estimating the relationship between business compliance and administration,
monitoring and enforcement costs from the previous cost-benefit analysis of the implementation of an industry waste levy and applying this proportion to the compliance cost estimate of $2/tonne to be applied for this analysis.

DEHP
Page 40 of 66
Table 19 Economic cost of increased administration, monitoring and enforcement costs by waste
stream and by region
Waste material PV for South-East ($) PV for North-East ($) PV for Inland ($)
Concrete (sorted) 2,748,124 1,230,500 NA
Concrete (mixed) 12,491,452 5,593,195 NA
Tyres 2,807 1,345 135
Timber 3,591,221 874,764 NA
Metals 368,426 70,176 NA
MSW Green (kerbside) 3,041 731 NA
MSW Green (mixed – all) 2,502,448 1,147,268 NA
Source: Estimates provided by MRA Consulting Group.
4.6.5 Policy development and implementation
The development and implementation of a landfill disposal ban policy will impose an
additional up-front cost on government. The cost for year 1 of the study period (2015)
has been estimated at $1,056,500. This represents 25% of the estimate for up-front policy
development and implementation costs applied in the cost-benefit analysis of the
industry waste levy. This is based on advice provided by the Department that the cost
for the implementation of a landfill disposal ban would be significantly lower than for a
waste levy. This cost was not distributed across the waste materials, as it is not expected
to vary based on the materials included within the scope of the landfill disposal ban.

DEHP
Page 41 of 66
5 Results
This section presents the results of the modelling of the economic benefits and costs of
the implementation of a landfill disposal ban for the identified waste materials, across
the applicable regions for each material. It also presents the results of the sensitivity
analysis performed on a number of key parameters and assumptions.
5.1 Net economic impact
Table 20 summarises the total PV estimates for the benefits and costs, and the overall
NPV result, of the implementation of a landfill disposal ban by waste material and by
region (where applicable).
Table 20 PV estimates for the benefits and costs of the implementation of a landfill disposal ban by
waste material and by region
Estimate PV for South-East ($) PV for North-East ($) PV for Inland ($)
Concrete (sorted)
Total benefits 110,657,480 44,190,094 NA
Total costs 41,455,844 18,562,269 NA
Net impact of a landfill disposal ban 69,201,636 25,627,825 NA
Concrete (mixed)
Total benefits 455,724,028 189,349,492 NA
Total costs 897,389,407 401,816,670 NA
Net impact of a landfill disposal ban (441,665,379) (212,467,178) NA
Tyres
Total benefits 258,099 120,136 12,014
Total costs 202,987 97,265 9,726
Net impact of a landfill disposal ban 55,112 22,871 2,287
Timber
Total benefits 230,443,096 53,663,615 NA
Total costs 319,685,837 79,806,143 NA
Net impact of a landfill disposal ban (89,242,740) (26,142,527) NA
Metals
Total benefits 17,100,517 3,072,725 NA
Total costs 24,725,346 4,709,590 NA
Net impact of a landfill disposal ban (7,624,829) (1,636,865) NA
MSW Green (kerbside)
Total benefits 183,074 42,086 NA
Total costs 76,077 18,288 NA
Net impact of a landfill disposal ban 106,997 23,798 NA
MSW Green (mixed – all)
Total benefits 124,614,724 54,114,108 NA

DEHP
Page 42 of 66
Estimate PV for South-East ($) PV for North-East ($) PV for Inland ($)
Total costs 105,212,518 48,235,543 NA
Net impact of a landfill disposal ban 19,402,206 5,878,565 NA
Source: Synergies modelling.
A detailed breakdown of the PV estimates for the individual benefits and costs by waste
material and by region is set out in Attachment B.
The following discussion provides a summary of the key drivers of the results for each
of the waste materials included in the analysis.
5.1.1 Concrete (sorted)
The estimated net impact of the implementation of a landfill disposal ban for sorted
concrete waste is:
a net economic benefit of $69.1 million in PV terms for the South-East region; and
a net economic benefit of $25.6 million in PV terms for the North-East region.
These results are largely driven by the significant benefit associated with the reduced
cost of landfill (PVs of $89.9 million and $37.0 million respectively). This is attributable
to the significant tonnages of sorted concrete waste currently being disposed of via
landfill (i.e. the base case). In addition, given the mature market for the recovery and
reprocessing of sorted concrete waste, the cost of recovery was not assumed to increase
as a result of the implementation of a landfill disposal ban. Furthermore, it was
considered that the market would be capable of absorbing the additional tonnage of
recovered material without any reduction in market value.
5.1.2 Concrete (mixed)
The estimated net impact of the implementation of a landfill disposal ban for mixed
concrete waste is:
a net economic cost of $441.7 million in PV terms for the South-East region; and
a net economic cost of $212.5 million in PV terms for the North-East region.
These results are primarily driven by the significant increase in the cost of recovering
and reprocessing mixed concrete waste under a landfill disposal ban compared to the
base case. Due to additional costs associated with sorting, separation and storage, the
cost of recovering and reprocessing the additional tonnages is estimated at $139 per
tonne, compared to the current cost of $39 per tonne. The total costs incurred, largely as

DEHP
Page 43 of 66
a result of the increase in the cost of material recovery, are estimated at $821.2 million
and $367.7 million in PV terms for the South-East and North-East regions, respectively.
A reduced market value for the material recovered as a result of the landfill disposal ban
has also been applied, based on advice provided by MRA. The economic value of the
additional recovered material has been estimated at $8 per tonne, compared to the $16
per tonne estimate applied to tonnages recovered under the base case.
5.1.3 Tyres
The estimated net impact of the implementation of a landfill disposal ban for tyres is:
a net economic benefit of $55,100 in PV terms for the South-East region;
a net economic benefit of $22,900 in PV terms for the North-East region; and
a net economic benefit of $2,300 in PV terms for the Inland region.
The small net economic benefit of the implementation of a landfill disposal ban on tyres
is due to the small tonnages of tyres currently being disposed of via landfill in
Queensland. It is noted that this analysis was limited to tyres from passenger and small
heavy vehicles.
5.1.4 Timber
The estimated net impact of the implementation of a landfill disposal ban for timber
waste is:
a net economic cost of $89.2 million in PV terms for the South-East region; and
a net economic cost of $26.1 million in PV terms for the North-East region.
These results are primarily driven by the significant increase in the cost of recovering
and reprocessing timber waste for tonnages recovered as a result of the landfill disposal
ban. Due to the additional costs associated with sorting, separation and storage, the cost
of recovering and reprocessing these additional tonnages of timber waste under a
landfill disposal ban is estimated at $180 per tonne, compared to $60 per tonne for
material recovered under the base case. The costs incurred as a result of the increase in
material recovery were estimated at $308.0 million and $74.5 million in PV terms in the
South-East and North-East regions, respectively.
A reduced market value for the material recovered as a result of the landfill disposal ban
has also been applied, based on advice provided by MRA. The value of the additional
DEHP
Page 44 of 66
recovered timber has been estimated at $108 per tonne, compared to $54 per tonne for
material that is recovered under the base case.
5.1.5 Metals
The estimated net impact of the implementation of a landfill disposal ban for metallic
waste is:
a net economic cost of $7.6 million in PV terms for the South-East region; and
a net economic cost of $1.6 million in PV terms for the North-East region.
These results are primarily driven by the lack of value attributed to the metallic waste
that is currently being disposed of via landfill. Under the base case, the material that is
recovered from metallic waste is valued at $525 per tonne. Alternatively, for metallic
waste that is to be recovered as a result of a landfill disposal ban an estimate of $29/tonne
has been applied, based on advice provided by MRA. These estimates indicate that waste
generators are currently recovering metallic waste where it is economic to do so. Thus,
the metallic waste currently being disposed of via landfill is of little economic value.
Furthermore, the cost of recovery (i.e. sorting, separation and storage) is significantly
higher for the waste that is currently being disposed of via landfill ($129 per tonne) than
under the base case ($29 per tonne).
5.1.6 MSW Green (kerbside)
The estimated net impact of the implementation of a landfill disposal ban for MSW green
(kerbside) is:
a net economic benefit of $107,000 in PV terms for the South-East region; and
a net economic benefit of $23,800 in PV terms for the North-East region.
Similar to the results of the analysis for tyre waste, these small net benefit estimates are
attributable to the small tonnages of MSW green (kerbside) material currently being
disposed of via landfill.
5.1.7 MSW Green (mixed – all)
The estimated net impact of the implementation of a landfill disposal ban for MSW green
(mixed – all) is:
a net economic benefit of $19.4 million in PV terms for the South-East region; and
a net economic benefit of $5.9 million in PV terms for the North-East region.

DEHP
Page 45 of 66
The two main impacts of the implementation of a landfill disposal ban on all MSW green
material are the reduction in the cost of landfilling and the increase in material recovery
costs. The first of these impacts (valued at $81.8 million and $34.5 million in PV terms
for the South-East and North-East regions respectively) is attributable to the significant
tonnages of mixed MSW green material that are currently being disposed of via landfill.
The implementation of a ban results in the costs associated with the material being
disposed of via landfill being avoided.
In relation to the second impact, the cost of recovering mixed MSW green material that
is currently being disposed of via landfill is estimated at $76 per tonne, compared to the
current cost estimate of $40 per tonne. This results in total costs attributable to the
increase in material recovery as a result of the ban of $90.0 million and $41.2 million in
PV terms for the South-East and North-East regions respectively.25 This increased cost
offsets a significant proportion of the total benefits of the implementation of a landfill
disposal ban on mixed MSW green material (including the reduced cost of landfill,
greenhouse gas emissions and the increased economic value from recovered material).
5.1.8 Overall net impact
Based on the analysis conducted, the implementation of a landfill disposal ban on sorted
concrete, tyres and all MSW green material (in both the South-East and North-East
regions) would result in a net economic benefit of $119.2 million in PV terms over the 10
year evaluation period. The implementation of a ban was found to result in a negative
NPV for all other waste materials across all regions.
5.2 Employment impact
Whilst this study has not directly assessed the impact of the implementation of a landfill
disposal ban on employment, it is anticipated that the implementation of a ban would
result in a net increase in employment in the waste treatment sector. This is attributable
to resource recovery and reprocessing activities being more labour intensive than the
operation of landfill sites.26 Subsequently, any policy that results in the diversion of
waste from landfill to reprocessing facilities will have a positive net impact on
employment.
The 2010 National Waste Report estimated that for every 10,000 tonnes of waste material
that is reprocessed, approximately 9.2 jobs (direct) are created, compared to 2.8 jobs
25 As previously noted, this represents an additional cost to local government and subsequently (assuming these costs
are to be passed on) to ratepayers.
26 Department of the Environment, Water, Heritage and the Arts (2010). National Waste Report 2010.

DEHP
Page 46 of 66
(direct) for landfill disposal.27 For example, based on these estimates, the implementation
of a landfill disposal ban on sorted concrete waste would result in a net increase in
employment of 128 positions in the South-East region (based on the estimate for the
annual average of sorted concrete waste to be landfilled under the base case over the
evaluation period of 200,000 tonnes).
An increase in the tonnage of reprocessed waste material is also likely to result in an
increase in skilled labour positions, with reprocessing facilities providing employment
from entry-level unskilled labour (e.g. sorting activities) through to skilled engineering
positions (e.g. renewable energy production).28
5.3 Sensitivity analysis
Sensitivity analysis shows how the results of the analysis are affected by changes to key
parameters and assumptions. This provides policy makers with an indication of the level
of certainty associated with the modelled results in addition to identifying the critical
parameters and assumptions in terms of the impact on the net economic impact of the
policy or program.
The sensitivity analysis has been conducted in two parts:
the sensitivity of the overall net impact of a landfill disposal ban including sorted
concrete, tyres and all MSW green material has been assessed based on changes to:
the discount rate (4% and 10%);
the cost of disposing of waste via landfill (+/- 50%);
the cost per tonne of greenhouse gas emissions (+/- 50%); and
the sensitivity of the net impacts of the implementation of a landfill disposal ban on
sorted concrete and all MSW green material has been assessed (on an individual
basis) against changes to:
the cost of recovering additional material under a landfill disposal ban (+/-
50%); and
the value of material recovered as a result of a landfill disposal ban (+/- 50%).29
Table 21 presents the results on the first component of the sensitivity analysis.
27 Department of the Environment, Water, Heritage and the Arts (2010).
28 Department of the Environment, Water, Heritage and the Arts (2010).
29 Tyre waste was excluded from this part of the sensitivity analysis due to the very low economic benefit estimated for this waste material as a result of the implementation of a landfill disposal ban.

DEHP
Page 47 of 66
Table 21 Sensitivity analysis for the implementation of a landfill disposal levy on sorted concrete,
tyre waste and all MSW Green material
Parameter Net Present Value ($) % change in NPV relative to base
Base result 119,205,927 NA
Discount rate
Low (4%) 138,461,763 +16.2%
High (10%) 103,687,420 -13.0%
Cost of disposing of waste via landfill
Low (-50%) (2,399,687) -102.0%
High (+50%) 240,925,282 +102.0%
Cost of greenhouse gas emissions (tCO2-e)
Low (-50%) 106,966,868 -10.3%
High (+50%) 131,444,985 +10.3%
Source: Synergies modelling.
The results presented in the above table demonstrate that the only parameter that has a
significant effect on the net impact of the implementation of a landfill disposal ban on
sorted concrete, tyre and all MSW green material is the cost estimate that is applied per
tonne of waste that is disposed of via landfill. A significant reduction of 50% to this
parameter estimate (resulting in cost estimates of $34.20 per tonne and $31.50 per tonne
for the South-East and North-East/Inland regions respectively) results in an estimated
net economic cost of $2.4 million. However, it is important to note that it is highly
unlikely that these alternative cost estimates are accurate estimates for the economic cost
of disposing of waste via landfill.
The second component of the sensitivity analysis demonstrated the importance of the
estimate that is adopted for the cost of recovering and reprocessing additional material
as a result of a landfill disposal ban in terms of the economic impact on individual waste
streams for which it is anticipated that this cost will be significantly higher than the
current recovery and reprocessing cost (i.e. mixed concrete, timber, metals and all MSW
green). For example:
for mixed concrete waste, while the NPV estimates remained negative under all
scenarios, there was a significant reduction in the negative NPVs estimated when
the cost of recovering additional material due to the ban was reduced from $139 per
tonne to $69.50 per tonne (noting that the estimated cost of recovery and
reprocessing of mixed concrete under the base case is $39 per tonne). This
alternative estimate resulted in a reduction in the negative NPV for the South-East
region from ($441.7 million) to ($31.1 million) (a 93.0% reduction) and an equivalent
reduction from ($212.5 million) to ($28.6 million) (a 86.5% reduction) in the North-
East region;

DEHP
Page 48 of 66
for timber waste, a reduction in the cost of recovering additional material due to the
ban from $180 per tonne to $90 per tonne (noting that the estimated cost of recovery
and reprocessing of timber waste under the base case is $60 per tonne) results in the
NPV estimates for this waste material increasing from ($89.24 million) to $64.78
million (a 172.6% increase) in the South-East region and from ($26.14 million) to
$11.1 million (a 142.5% increase) in the North-East region; and
for metallic waste, a reduction in the cost of recovering additional material due to
the ban from $129 per tonne to $64.50 per tonne (noting that the estimated cost of
recovering and reprocessing of metallic waste under the base case is $29 per tonne)
results in NPV estimates for this waste material increasing from ($7.6 million) to
$3.6 million (a 147.4% increase) in the South-East region and from ($1.6 million) to
$0.5 million (a 131.3% increase) in the North-East region.

DEHP
Page 49 of 66
6 Recommendations for implementation
Based on the above analysis, where a landfill disposal ban on sorted concrete, tyres and
all MSW green material (in both the South-East and North-East regions) would result in
a net economic benefit, consideration has been given to the additional infrastructure that
would be required to process the additional materials and the complementary policy
requirements. Each of these issues is discussed below.
6.1 Required infrastructure for recycling
Based on MRA’s analysis (see Table 22) the sorted concrete and tyre recycling markets
are capable of accepting and processing the additional tonnages likely to enter the
market, should a landfill disposal ban be implemented. However, additional capacity
would be required to process the additional tonnages of MSW green material.
Table 22 Current capacity and potential future need for investment (t/a)
Material Current capacity (t) Planned investment (t)
Future needs (t) Need for investment (t)
Concrete (sorted) >2,000,000 600,000 >250,000 None
Tyres >60,000 >60,000 300 None
Green waste (total) >800,000 Unknown >200,000 >200,000
Source: MRA. 2014. Landfill disposal ban feasibility study: review of existing infrastructure and markets in Queensland. Report prepared
for Synergies Economic Consulting. October. 20
As noted by MRA, green waste can be recycled either through composting, mulch or as
a feedstock in a waste-to-energy process. The infrastructure requirements vary in
accordance with the form of processing that is undertaken. MRA’s report (Attachment
A) identifies the most common applicable technologies currently used in Queensland,
which could be reasonably expected to be expanded should all green waste be banned
from landfill.
The likely infrastructure cost, for a range of facilities capable of processing green waste
should all green waste be banned from landfill, are detailed in Table 23 ( a more detailed
summary is provided in Table 7 of the MRA report).

DEHP
Page 50 of 66
Table 23 Infrastructure costs required for various green waste processing facilities
Technology Infrastructure required
Facility examples Capital costs Operating costs
Mobile Aerated Floor Mobile floor
Air delivery pipes
Air blowers
Temp and oxygen sensors
Enclosed building
Peats Soil & Garden Supplies (SA)
$1m/10,000 tpa
(this can be used as a scaling factor to
accommodate different tonnages)
$80-$120/t
Windrow Composting Operational plant
Enclosed building
Dulverton (TAS)
Groundswell (NSW
$1m/20,000 tpa
$200,000/5,000 tpa
$60-$80/t
$50-$70/t
Tunnel Composting Enclosed concrete tunnels
Air delivery
SAWT Penrith Line (NSW)
$60m/120,000 tpa $160-$220/t
Mulching Mobile or static mulching machine
Timber Waste Recycling, Melbourne
$18,000 - $24,000 $80/t
Source: MRA. 2014. Landfill disposal ban feasibility study: review of existing infrastructure and markets in Queensland. Report prepared
for Synergies Economic Consulting. October. p 22.
6.2 Implementation issues
6.2.1 Planning and construction of new facilities
Any new development will require a lead-time for all approvals and processes to be put
in place. Figure 3 estimates the average time requirements needed for the planning,
approval and construction stages of a new facility type.
Figure 3 Implementation GANTT Chart for new facilities
Data source: MRA. 2014. Landfill disposal ban feasibility study: review of existing infrastructure and markets in Queensland. Report
prepared for Synergies Economic Consulting. October. p 24.

DEHP
Page 51 of 66
It is estimated that it may take up to six months to find a suitable site for each facility,
but this time could be reduced should a recycler already own a suitable plot of land.
Under Queensland planning law, if a ‘coordinated project’ has the potential to cause
environmental, social or economic impacts the project proponent must prepare an
Environmental Impact Statement (EIS). This would be the case for a green waste facility.
The process of consultation and approval may take up to six months, but may take
longer should any significant submissions be received, which require additional
information. Capital expenditure and site works are likely to take an additional six
months.
6.2.2 Distance
Generally, the distance travelled by processors was considered one of the inhibiting
factors to the implementation of all bans, especially for denser materials such as concrete
and timber, which are not economically viable to transport to suitable processors. Such
materials are easily recycled in the South East region where recyclers are situated close
to generators and markets.
6.2.3 Regulatory and policy framework
There are a number of relevant Queensland State Controls and Council specific controls,
which apply to the construction and functioning of sites to recycle organic waste and
other inert waste which may prove to be barriers to the implementation of a landfill
disposal ban; when there is not enough current market capacity.
6.3 Complementary policies
At the industry workshops, it was noted that further assistance was required in the area
of complementary policies and standards as these can have a material impact on the size
of the market for the recovered materials and the associated price/value of recovered
material.
For example, the State Government guidelines, requiring a minimum percentage of
recycled concrete in State construction projects, has been removed. This has caused a
reduction in the market’s capacity to absorb recycled concrete. Therefore, a landfill
disposal ban would be best implemented with a reinstatement of State Government
guidelines to utilise recovered concrete and aggregate materials.

DEHP
Page 52 of 66
7 Conclusions
There are a wide range of policy instruments that can be applied to contribute to meeting
the increased recycling targets set out in the draft waste strategy for Queensland. One of
these instruments is a ban on the disposal of specified waste materials in landfills. The
outcomes of stakeholder consultation and overseas experience indicates that landfill
disposal bans can be effective at increasing the quantity of material recovered from waste
that is typically landfilled.
A cost-benefit analysis was conducted on the implementation of a landfill disposal ban
to apply to the following waste materials:
sorted concrete;
mixed concrete;
tyres;
timber;
metals;
MSW green (kerbside); and
MSW green (mixed – all).
The following impacts of the implementation of a landfill disposal ban were quantified
for each of the above waste materials in the South-East and North-East regions (and
Inland region for tyres):
reduction in the economic cost of disposal of waste via landfill;
reduction in the cost of greenhouse gas emissions from landfill;
increase in the economic value from recovered material;
increase in the cost of recovery and reprocessing;
increase in the cost of illegal dumping;
increased compliance costs;
cost of administration, monitoring and enforcement; and
cost of policy development and implementation.
Table 24 summarises the PV estimates of the net economic impact of the implementation
of a landfill disposal ban for each of these waste materials by region.

DEHP
Page 53 of 66
Table 24 NPV impacts of implementation of a landfill disposal ban by waste material and by region
Waste material NPV of ban for South-East ($)
NPV of ban for North-East ($)
NPV of ban for Inland
Concrete (sorted) 69,201,636 25,627,825 NA
Concrete (mixed) (441,665,379) (212,467,178) NA
Tyres 55,112 22,871 2,287
Timber (89,242,740) (26,142,527) NA
Metals (7,624,829) (1,636,865) NA
MSW Green (kerbside) 106,997 23,798 NA
MSW Green (mixed – all) 19,402,206 5,878,565 NA
Source: Synergies modelling.
The key drivers of the results in the above table by waste stream are as follows:
for sorted concrete waste, the significant reduction in the cost of disposal of waste
via landfill;
for mixed concrete waste, the significant increase in the cost of recovering additional
tonnages as a result of the ban;
for tyre waste, the very low tonnages currently being disposed of via landfill;
for metallic waste, the lack of value of metallic waste currently being disposed of
via landfill;
for MSW green (kerbside), the very low tonnages currently being disposed of via
landfill; and
for MSW green (mixed – all), the significant reduction in the cost of disposal of
waste via landfill.
Based on the analysis conducted, the implementation of a landfill disposal ban on sorted
concrete, tyres and all MSW green material (in both the South-East and North-East
regions) would result in a net economic benefit of $119.2 million in PV terms over the 10
year evaluation period. This result includes the cost of policy development and
implementation. The implementation of a ban was found to result in a negative NPV for
all other waste materials across all regions.
Sensitivity analysis was conducted on key parameters to assess the impact on the results
of the analysis for each waste stream. The key conclusion to be drawn from this analysis
is that the estimate that is applied for the cost of recovering and reprocessing additional
material as a result of a landfill disposal ban has a significant impact on the net economic
impact of the ban.

DEHP
Page 54 of 66
Based on MRA’s analysis, there is sufficient capacity within the sorted concrete and tyre
recycling markets to accept and process the additional tonnages likely to enter the
market should a landfill disposal ban be implemented. However, additional capacity
would be required to process the additional tonnages of MSW green material. Green
waste can be recycled either through composting, mulch or as a feedstock in a waste-to-
energy process. Whilst the infrastructure requirements vary in accordance with the form
of processing that is undertaken, it generally takes over 12 months to complete the
planning, approval and construction stages for any type of new facility.
Prior to the implementation of a landfill disposal ban, careful consideration should be
given to the timing of implementation and the need for complementary policies and
standards. As shown through the desktop review, the introduction of a levy, in the early
stages of the policy (i.e. to transition to a landfill disposal ban), has proved to be integral
to providing the necessary economic signals to encourage additional investment in
capacity. In the absence of a levy, it is important that the complementary policy settings
(e.g. phase-in implementation periods, and producer responsibility measures) are
appropriate, so to ensure any adverse unintended consequences are minimised and
industry is provided sufficient time to invest and to develop a good understanding of
the future policy settings, including anticipated feedstock levels.

DEHP
Page 55 of 66
A Overview of landfill disposal bans
The purpose of this section is to provide an overview of the landfill disposal bans that
have been implemented in other jurisdictions, both in Australia and internationally. Of
the jurisdictions considered, Europe has had the most experience with this type of policy
instrument.
A.1 Objectives
Landfill disposal bans are typically implemented to:
increase material recovery – by imposing a ban on the landfilling of certain types of
waste, authorities can increase the proportion of waste that is diverted to recycling
facilities;
alleviate pressure on landfill capacity – if the volume of waste being landfilled is
placing pressure on the availability of landfill capacity, a ban on the landfilling of
certain types of waste can alleviate some of this demand pressure; and
reduce the adverse impact of landfills on the environment and human health – there
are negative environmental and health consequences associated with the disposal
of waste via landfill. These negative consequences are reduced when a landfill
disposal ban is implemented.
Landfill disposal bans can be implemented to address one or more of these objectives.
There are also secondary objectives underpinning some landfill disposal ban policies,
such as increasing the level of energy generated from waste material, providing
incentives for reducing the generation of waste material, and reducing the community’s
dependency on landfill as a waste treatment option.
The objectives of landfill disposal ban policies are primarily dictated by the
circumstances and context in which the ban is implemented. For example, in European
countries where land is scarce, bans are often implemented to reduce capacity issues (in
addition to other objectives) whilst in North America, there is a greater focus on material
recovery and the environmental and human health impact of landfills.
A.2 Categories of waste covered
Landfill disposal bans can be implemented on:
specific waste streams, such as Municipal Solid Waste (MSW), Commercial and
Industrial (C&I), Construction and Demolition (C&D), and hazardous or regulated
waste;

DEHP
Page 56 of 66
specific waste materials, such as tyres, timber, metals, etc;
specific properties of waste, such as Total Organic Carbon (TOC) value or waste
that is recoverable; or
any combination of the above.
The waste types or categories included within the scope of landfill disposal bans varies
significantly across jurisdictions. Based on the desktop review conducted, the four most
common types or categories included in a landfill disposal ban are:
untreated waste;
biodegradable/organic waste;
recoverable waste; and
hazardous waste (e.g. explosive).
An overview of the waste types and categories applied in the jurisdictions reviewed, is
provided in the tables below.
Table A.1 Banned materials – Australian jurisdictions
Jurisdiction Waste categories banned from landfill
Queensland • N/A
New South Wales • Tyres
• Medical waste
Victoria • Certain hazardous wastes
South Australia • Hazardous waste
• Lead acid batteries
• Liquid waste
• Medical waste
• Oil
• Whole tyres
• Aggregated cardboard and paper
• Aggregated glass and packaging
• Aggregated metals
• Aggregated PET or HDPE plastic packaging
• Vegetative matter collected by councils
• Vehicles
• PP or LDPE plastic packaging
• Whitegoods
• PVC or PS plastic packaging
• Fluorescent lighting
• Computer monitors and televisions
• Whole earth mover tyres
• Other electrical or electronic equipment
Western Australia a • Tyres

DEHP
Page 57 of 66
Tasmania • Untreated contaminated soil
Australian Capital Territory • Electronic waste
• Tires
• Mattresses
Note: a The ban is only for the Perth Metro Area.
Source: South Australia - http://www.epa.sa.gov.au/environmental_info/waste/legislation/waste_to_resources_policy/landfill_bans;
http://www.environment.gov.au/protection/national-waste-policy/publications/landfill-ban-investigation-final-report; Western Australia
http://www.wasteauthority.wa.gov.au/media/files/documents/impacts_tyre_policies.pdf.
Table A.2 Waste categories included in landfill disposal bans in European countries
Jurisdictions Waste categories included in landfill disposal ban
Austria • Sludges and similar wastes
• Liquid waste (except leachate)
• Inflammable and explosive waste
• Gasses under pressure
• Infectious wastes and wastes for which the hazardous content exceeds specified limits
Belgium (Flanders) • Unsorted household waste
• Waste collected for the purpose of recovery or that is fit for recycling
• Old and expired medication
Belgium (Wallonie) • Separated household waste
• Non-hazardous industrial and packaging waste
• Waste from pre-treatment and sorting facilities
• Non pre-treated fine residual household waste
• Bulky waste
Denmark • Untreated waste, including mixed municipal waste
Estonia • Unsorted waste
Finland • Household waste where the biodegradable component has not been separately collected
• Expanded in 2011 to cover all biodegradable waste
France • All waste types other than residual waste
Germany • Waste with an organic component that has not been stabilised and made inert
Hungary • All materials included in the EU Landfill Directive
• Tyres and rubber scrap
Ireland • All biodegradable waste that has not been subject to pre-treatment
Italy • Waste materials prescribed under the EU Landfill Directive
• Waste containing or contaminated by certain materials (e.g. PCBs, PCTs, PCDD, PCDF)
• Waste containing ozone depleting substances
• Waste with unknown effects on the environment and human health
Netherlands • Batteries
• Oil filters
• Hazardous wastes
• Paper and cardboard
• Organic waste
• Electrical and electronic equipment
• Plastic waste
• Tyres
• Building and demolition waste

DEHP
Page 58 of 66
• Wood waste
• Contaminated soil
• Household waste
Norway • Biodegradable waste
Sweden • Combustible waste
• Organic waste
Source: Hyder Consulting. 2010. Landfill Ban Investigation – Final Report. Prepared for the Department of Sustainability, Environment,
Water, Population and Communities. Various sources
Table A.3 Materials banned from landfills – USA (items banned as of 2008)
State Yard Trimmings
Containers, paper
Whole Tires
Used Oil
Lead-Acid
batteries
White goods
Electronics C&D Other
Alabama X X
Alaska X X
Arizona X X
Arkansas X X X
California X X X X X
Colorado X X X X
Connecticut X X X
Delaware X X
Florida X X X X
Georgia X X X X
Hawaii X
Idaho X
Illinois X X X X X X
Indiana X X
Iowa X X X X X X
Kansas X
Kentucky X X
Louisiana X X X X
Maine X X X X X X
Maryland X X X X
Massachusetts X X X X X X X
Michigan X X X X X
Minnesota X X X X X X X
Mississippi X X
Missouri X X X X X
Nebraska X X X X X
New Hampshire X X X X X
New Jersey X X X X X X X
New Mexico X X X
New York X
North Carolina X X X X X X X

DEHP
Page 59 of 66
North Dakota X X X
Ohio X X
Oregon X X
Pennsylvania X X X
Rhode island X X X X X X X
South Carolina X X X X X X
South Dakota X X X X X
Tennessee X X X
Texas X X X X
Utah X X X
Vermont X X X X X X
Virginia X X X
West Virginia X X X X
Wisconsin X X X X X X
Wyoming X X
Source: http://www.biocycle.net/images/art/1010/bc101016_s.pdf
A.3 Duration
Landfill disposal bans have been a key feature of waste management policies in several
European countries for over a decade. The 1999 EU Landfill Directive (the Directive)
established an overarching objective to prevent or reduce as far as possible the negative
impact of landfilling on the environment. The Directive included targets for reductions
in landfill volumes across the EU (see box below).
Box A.1 EU Landfill Directive
In 1999, The European Union (EU) introduced ‘Council Directive 99/31/EC’ (the EU Landfill Directive). The objective
of the Directive was to prevent or reduce as far as possible the negative impact of landfilling on the environment. This
was to be achieved by introducing stringent technical requirements for the landfilling of waste. The deadline for the
implementation of the Directive by EU member states was 16 July 2001.
The Directive specifies that the following wastes may not be accepted in a landfill facility:
• liquid waste
• flammable waste
• explosive or oxidising waste
• hospital and other clinical waste which is infectious
• any other type of waste that fails to meet the acceptance of criteria in Annex II.
The Directive also set out a system of operating permits for landfill sites, standard waste acceptance procedures, and
arrangements for reporting on progress to the European Commission. The Directive was later expanded to include a
ban on whole tyres (from 2003) and shredded tyres (from 2006).
The Directive also included targeted reductions in the proportion of total waste being landfilled (relative to 1995 levels):
• 75% by 2006

DEHP
Page 60 of 66
• 50% by 2009
• 35% by 2016. Data source: Waste – Landfill of Waste. European Commission; http://ec.europa.eu/environment/waste/landfill_index.htm; DOA: 27
August 2014.
Landfill disposal bans, once implemented, are maintained indefinitely. In most cases,
bans are initially introduced for a small number of waste streams or materials with
additional materials added over time. For example, in Belgium (Flanders), a landfill
disposal ban was initially implemented on unsorted wastes in 1998 before being
expanded to cover combustible residual waste in the year 2000. A similar approach was
used in Nova Scotia, as shown in the table below.
Table A.4 Materials banned from disposal in Nova Scotia
Date of ban Materials and products
Between 1996 and 1999 Beverage containers
Corrugated cardboard
Newsprint
Lead-acid batteries
Used tires
Yard waste
Paint products
Compostable organic material
Steel/tin food containers
Glass food containers
Polyethylene bags and packaging
Since 2008 Televisions
Desktop, laptop, and notebook computers
Computer accessories
Computer monitors
Printers
Since 2009 Computer scanners
Audio-video recording systems
Telephones and fax machines
Cell phones and other wireless devices
Source: http://www.novascotia.ca/nse/waste/docs/SolidWasteStrategyFinalReport1995.pdf
A.4 Effectiveness of landfill disposal bans
Based on the jurisdictions considered in the desktop review, landfill disposal bans have
facilitated large reductions in the proportion of waste being disposed of via landfill.
However, it is important to note that it is difficult to isolate the outcomes attributable to
a single waste management policy on waste disposal and diversion rates.
In most jurisdictions, landfill disposal bans are accompanied by a range of
complementary policies, most commonly landfill disposal levies or taxes, which often
precede the implementation of landfill disposal bans. The table below provides an

DEHP
Page 61 of 66
overview of the reductions to landfill disposal rates and increases in waste material
recovery rates achieved in the European jurisdictions included in the review.
Table A.5 Results of landfill disposal ban policies in various European
Jurisdiction Reduction in landfill disposal Increase in material recovery
Austria Reduction in proportion of waste being disposed of via landfill from 29% in 1999 to 4% in 2006
3% increase in waste material recovery
Belgium Reduction in proportion of waste being disposed of via landfill from 25% in 1997 to 3% in 2007
66% increase in waste material recovery
Estonia Reduction in tonnage MSW being disposed of via landfill – 267,000 tonnes in 2010 compared to 403,000 tonnes in 2001
Increase to recycling rate from 5% of MSW generated in 2001 to 20% in 2010
Finland Landfill ban has been found to be ineffective and unenforceable – government is currently in the process of redesigning a stricter ban to be implemented in the foreseeable future
Germany Reduction in proportion of waste being landfilled from 27% of total waste in 2000 to 1% in 2006
25% increase in waste material recovery
Netherlands Reduction in proportion of waste being disposed of via landfill from 35% in 1995 to 10% in 2006
27% increase in waste material recovery
Sweden Reduction in proportion of waste being disposed of via landfill from 23% in 2001 to 4% in 2007
32% increase in waste material recovery
Source: Hyder Consulting (2010). Landfill Ban Investigation – Final Report. Prepared for the Department of Sustainability, Environment,
Water, Population and Communities. various sources.
A.5 Unintended consequences
The potential unintended consequences that can arise as a result of the implementation
of a landfill disposal ban include:
an increase in the tonnages of illegally dumped waste;
significant increases in the cost of waste management for businesses due to the lack
of capacity in the recovery and processing market for waste categories or materials
included in the landfill disposal ban; and
adverse impacts in the markets for recovered waste materials due to the significant
increase in volumes as a result of the landfill disposal ban and the lack of uses for
recovered material.
There is anecdotal evidence that the implementation of policies that increase the cost of
waste disposal (including landfill taxes or levies and landfill disposal bans) result in an
increased rate of illegal dumping. For instance, a study conducted in the United
Kingdom estimated that the proportion of tyres being illegally disposed of increased
from 4% to 10% between 2003 and 2010 following the introduction of the EU Landfill

DEHP
Page 62 of 66
Directive.30 Studies have also indicated that since the implementation of landfill disposal
bans there has been an increase in the proportion of waste that is generated in European
countries being shipped internationally to be illegally disposed of.31
While little can be done to prevent the illegal dumping of waste materials, aside from
increasing expenditure on compliance monitoring and enforcement activities, the other
two unintended consequences identified above can be addressed through
complementary measures. For example, the implementation of a landfill levy or tax prior
to the implementation of a landfill disposal ban can provide economic incentives to
increase the capacity of the recovery and processing sector, so that the sector has the
capacity to accommodate the increased quantity of materials that will be made available
once the landfill disposal ban is implemented. Similarly, policies and regulations can be
implemented or adjusted, to expand the potential uses for recovered waste materials.
A.6 Complementary waste management policies
In almost all jurisdictions included in the desktop review, landfill disposal bans have
been implemented as part of a suite of waste management policies. The most common
complementary policy is a waste disposal levy or tax, which is typically implemented
several years in advance of a landfill disposal ban. The purpose of this policy is to
provide an economic incentive to increase the capacity of the waste recovery and
processing market. It also enables the market to accommodate the increased volumes
that will result from the implementation of a landfill disposal ban without significant
costs being imposed on businesses and industry. The table below provides a summary
of the complementary waste management policies that apply in the European countries
reviewed.
30 Baird, J., Curry, R. & Cruz, P. (2014). An overview of waste crime, its characteristics, and the vulnerability of the EU
waste sector. Waste Manag Res 32:97.
31 ‘A Comprehensive Assessment of Illegal Waste Dumping’ – Elizabeth Hanfman. http://www.waterhealtheducator.com/upload/Illegal%20Waste%20Dumping%20Article.pdf; DOA: 20 September 2014.

DEHP
Page 63 of 66
Table A.6 Overview of complementary waste management policies in European countries
Jurisdiction Landfill tax/levy
Incineration tax/levy
Producer responsibility
measures
Mandatory separate
collection
Variable landfill
charging
Documentation and reporting obligations
Austria
Belgium
Denmark
Estonia
Finland
France
Germany
Hungary
Ireland
Italy
Netherlands
Norway
Sweden
Austria
Belgium
Denmark
Source: Hyder Consulting (2010). Landfill Ban Investigation – Final Report. Prepared for the Department of Sustainability, Environment,
Water, Population and Communities. Various sources.

DEHP
Page 64 of 66
B PV estimates of benefits and costs by waste material and by region
Table B.1 NPV of the implementation of a landfill disposal ban by waste material and by
region
Impact PV for South-East ($)
PV for North-East ($) PV for Inland ($)
Concrete (sorted)
Reduced cost of landfilling 89,861,455 37,000,985 NA
Reduced cost of GHG emissions from landfilling - - NA
Increased value of recovered material 20,796,024 7,189,109 NA
Total benefits 110,657,480 44,190,094 NA
Increased resource recovery costs 24,695,279 11,057,558 NA
Increased cost of illegal dumping 11,209,952 5,019,368 NA
Increased compliance costs 2,802,488 1,254,842 NA
Ongoing monitoring and enforcement costs 2,748,124 1,230,500 NA
Total costs 41,455,844 18,562,269 NA
Net impact of a landfill disposal ban 69,201,636 25,627,825 NA
Concrete (mixed)
Reduced cost of landfilling 408,460,421 168,186,656 NA
Reduced cost of GHG emissions from landfilling - - NA
Increased value of recovered material 47,263,606 21,162,836 NA
Total benefits 455,724,028 189,349,492 NA
Increased resource recovery costs 821,205,160 367,704,276 NA
Increased cost of illegal dumping 50,954,236 22,815,359 NA
Increased compliance costs 12,738,559 5,703,840 NA
Ongoing monitoring and enforcement costs 12,491,452 5,593,195 NA
Total costs 897,389,407 401,816,670 NA
Net impact of a landfill disposal ban (441,665,379) (212,467,178) NA
Tyres
Reduced cost of landfilling 91,789 40,445 4,045
Reduced cost of GHG emissions from landfilling 33,548 16,075 1,608
Increased value of recovered material 132,762 63,615 6,362
Total benefits 258,099 120,136 12,014
Increased resource recovery costs 185,867 89,061 8,906
Increased cost of illegal dumping 11,450 5,487 549
Increased compliance costs 2,863 1,372 137
Ongoing monitoring and enforcement costs 2,807 1,345 135
Total costs 202,987 97,265 9,726
Net impact of a landfill disposal ban 55,112 22,871 2,287
Timber

DEHP
Page 65 of 66
Impact PV for South-East ($)
PV for North-East ($) PV for Inland ($)
Reduced cost of landfilling 117,430,047 26,304,045 NA
Reduced cost of GHG emissions from landfilling 20,601,763 5,018,260 NA
Increased value of recovered material 92,411,287 22,341,310 NA
Total benefits 230,443,096 53,663,615 NA
Increased resource recovery costs 308,037,625 74,471,035 NA
Increased cost of illegal dumping 4,394,728 3,568,275 NA
Increased compliance costs 3,662,263 892,069 NA
Ongoing monitoring and enforcement costs 3,591,221 874,764 NA
Total costs 319,685,837 79,806,143 NA
Net impact of a landfill disposal ban (89,242,740) (26,142,527) NA
Metals
Reduced cost of landfilling 12,047,245 2,110,197 NA
Reduced cost of GHG emissions from landfilling - - NA
Increased value of recovered material 5,053,272 962,528 NA
Total benefits 17,100,517 3,072,725 NA
Increased resource recovery costs 22,478,346 4,281,590 NA
Increased cost of illegal dumping 1,502,858 286,259 NA
Increased compliance costs 375,715 71,565 NA
Ongoing monitoring and enforcement costs 368,426 70,176 NA
Total costs 24,725,346 4,709,590 NA
Net impact of a landfill disposal ban (7,624,829) (1,636,865) NA
MSW Green (kerbside)
Reduced cost of landfilling 99,438 21,981 NA
Reduced cost of GHG emissions from landfilling 20,353 4,892 NA
Increased value of recovered material 63,283 15,212 NA
Total benefits 183,074 42,086 NA
Increased resource recovery costs 57,530 13,829 NA
Increased cost of illegal dumping 12,405 2,982 NA
Increased compliance costs 3,101 745 NA
Ongoing monitoring and enforcement costs 3,041 731 NA
Total costs 76,077 18,288 NA
Net impact of a landfill disposal ban 106,997 23,798 NA
MSW Green (mixed – all)
Reduced cost of landfilling 81,828,046 34,498,204 NA
Reduced cost of GHG emissions from landfilling 16,748,430 7,678,456 NA
Increased value of recovered material 26,038,247 11,937,448 NA
Total benefits 124,614,724 54,114,108 NA
Increased resource recovery costs 89,950,309 41,238.458 NA
Increased cost of illegal dumping 10,207,808 4,679,853 NA
Increased compliance costs 2,551,952 1,169,963 NA

DEHP
Page 66 of 66
Impact PV for South-East ($)
PV for North-East ($) PV for Inland ($)
Ongoing monitoring and enforcement costs 2,502,448 1,147,268 NA
Total costs 105,212,518 48,235,543 NA
Net impact of a landfill disposal ban 19,402,206 5,878,565 NA
Source: Synergies modelling.