cost concepts and analysis - asmconline.org objectives • identify different types of costs and...
TRANSCRIPT
Cost Concepts for Accounting
Analysis
LTC Steve Hanson
Director of Training
U.S. Army Financial Management School


Learning Objectives
• Identify different types of costs and their
relevance
• Understand Cost Analysis
– Calculate life-cycle cost
– Understand net present value and its use in
defense cost analysis
• Time Value of money
• Cost Accounting
• Cost Estimating techniques

Will it do the job?
When can we get it?
How much will it cost?
What can go wrong?
Key Decision Criteria

What is Cost?
Cost is a measure of the
consequences of a decision
• The real physical resources consumed
• The money equivalent of the real physical resources used.
• The value of benefits foregone in the alternative use of resources.

Cost Questions
• What would it cost if…? (P)
• What will it cost and when? (P)
• How much is it actually costing? (BE)
• How much did it cost? (E)

Why Analyze Costs?
• To compare alternatives
• To prepare budget
• To achieve economy and efficiency

Why Analyze Costs?
• To compare alternatives
• To prepare budgets
• To achieve economy and efficiency
• It’s your responsibility as financial
managers. DoD instruction 7041.3
states:
“No public investment should be undertaken without explicitly
considering the alternative use of funds which it absorbs or
displaces.”
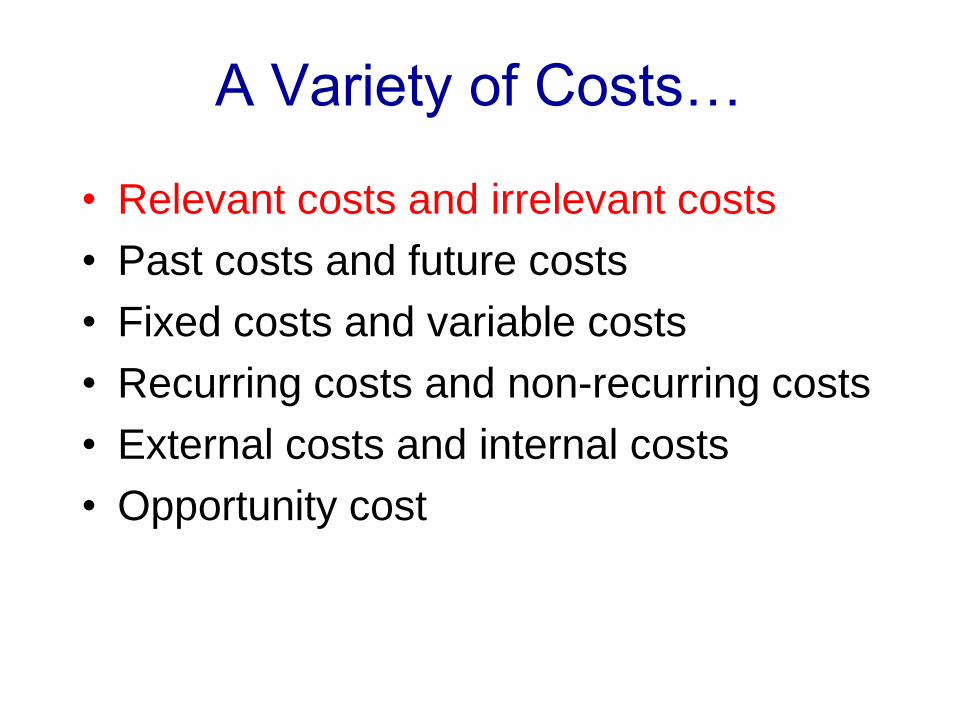
A Variety of Costs…
• Relevant costs and irrelevant costs
• Past costs and future costs
• Fixed costs and variable costs
• Recurring costs and non-recurring costs
• External costs and internal costs
• Opportunity cost

Relevant vs. Irrelevant costs
• Relevant costs—Costs that are
contingent upon a specific choice or
decision under consideration.
• Irrelevant costs—Any cost that will be
incurred regardless of the decision at
hand.

Holiday trip example
A friend with a large SUV invites you and
three other friends on a holiday trip so all
five of you can share the transportation
costs. The “round trip” journey is 500
miles. How much should each of you pay
for the trip?

Estimated annual cost of SUV ownership (10,000 miles per year)
1. Depreciation $2000
2. Interest on investment in car 740
3. License fee and taxes 1500
4. Parking ($20 per month) 240
5. Insurance 435
6. Gasoline ($.16 per mile) 1600
7. Oil/Lubrication 60
8. Tires (Replaced every 50,000 miles
at a cost of $500) 100
9. Repairs and maintenance 400
Total annual cost $7,075
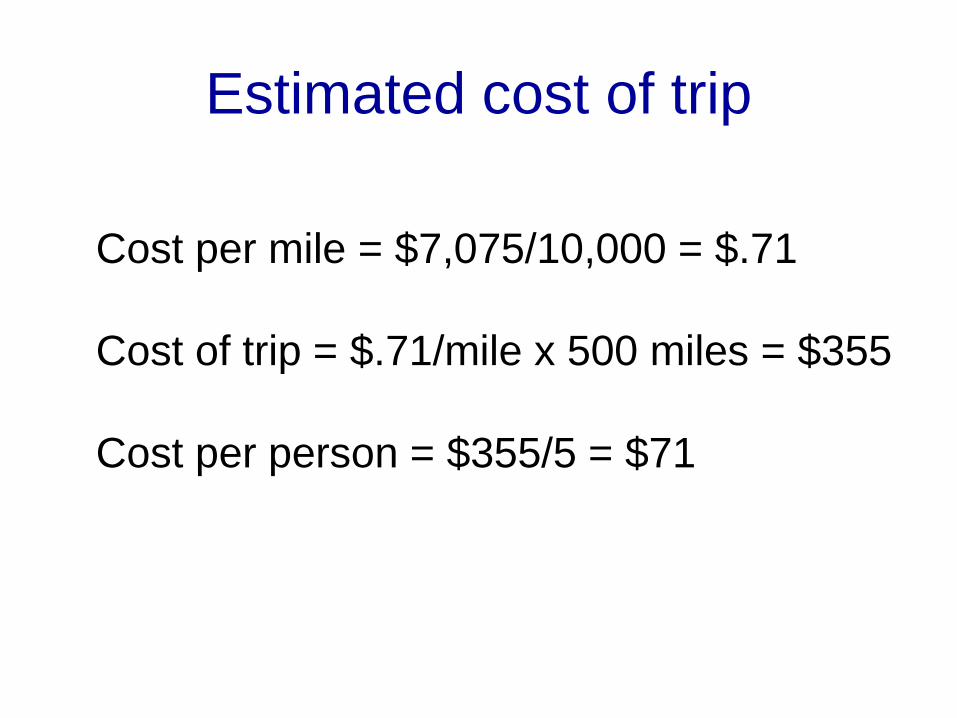
Estimated cost of trip
Cost per mile = $7,075/10,000 = $.71
Cost of trip = $.71/mile x 500 miles = $355
Cost per person = $355/5 = $71

Estimated annual cost of car ownership (10,000 miles per year)
1. Depreciation $2000
2. Interest on investment in car 740
3. License fee and taxes 1500
4. Parking ($20 per month) 240
5. Insurance 435
6. Gasoline ($.16 per mile) 1600
7. Oil/Lubrication 60
8. Tires (Replaced every 50,000 miles
at a cost of $500) 100
9. Repairs and maintenance 400
Total annual cost $7,075

Incremental costs
Gasoline ($.16 x 500) $80
Oil Lubrication ($60/10,000 x 500) 3
Tires ($100/10,000 x 500) 5
Repairs/Maintenance
($400/10,000 x 500) 20
Total Incremental Cost $108
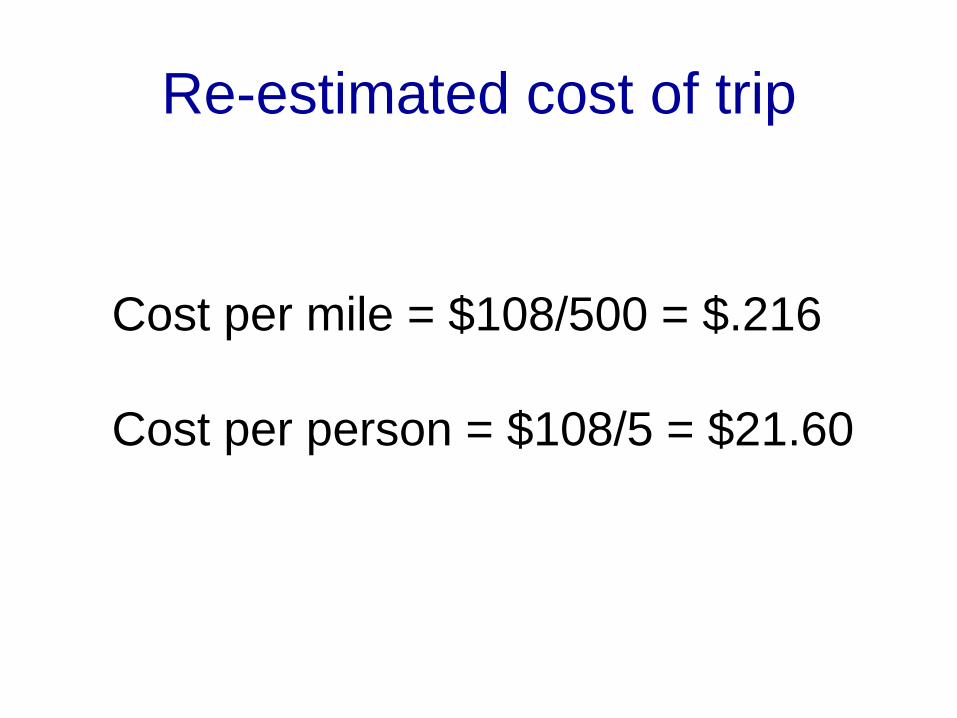
Re-estimated cost of trip
Cost per mile = $108/500 = $.216
Cost per person = $108/5 = $21.60
Check on Learning
Irrelevant costs are defined as:
a. The shoes I bought last week
(my husband, boyfriend will never know)
b. Any cost that will be incurred regardless
of the decision at hand
c. My $500 round of golf next week
at Pebble Beach
Check on Learning
Irrelevant costs are defined as:
a. The shoes I bought last week
(my husband, boyfriend will never know)
b. Any cost that will be incurred regardless
of the decision at hand
c. My $500 round of golf next week
at Pebble Beach
A Variety of Costs…
• Relevant costs and irrelevant costs
• Past (sunk) costs and future costs
• Fixed costs and variable costs
• Recurring costs and non-recurring costs
• External costs and internal costs
• Opportunity cost
Past vs. Future costs
• Costs which have already occurred
(past or sunk costs) are generally
irrelevant in a cost analysis.
• Cost analysis should focus on costs
which will be incurred in the future.
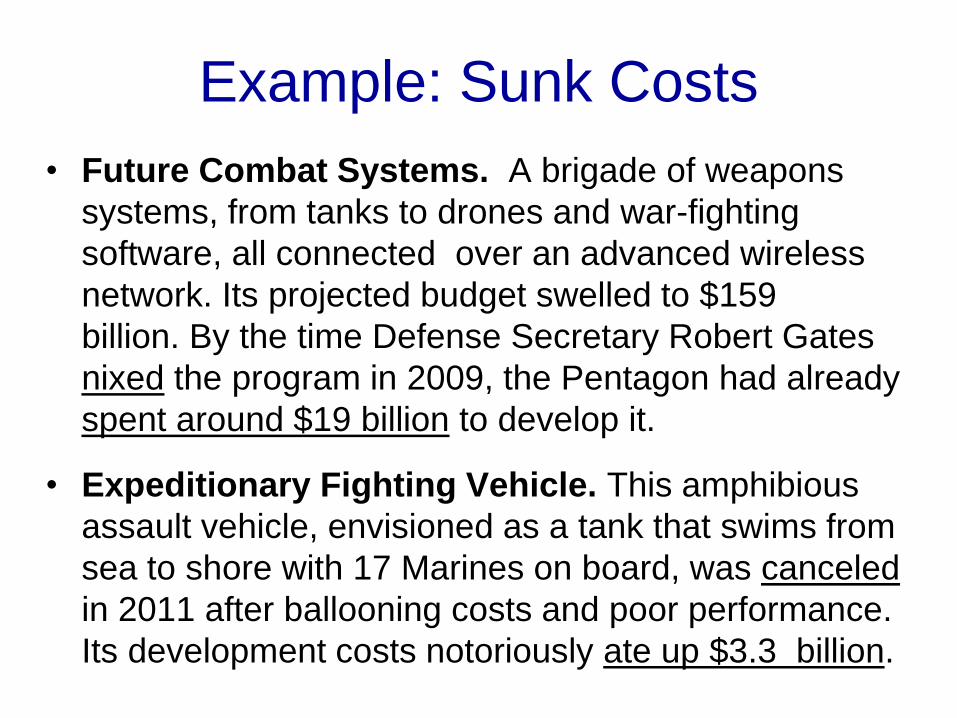
Example: Sunk Costs
• Future Combat Systems. A brigade of weapons
systems, from tanks to drones and war-fighting
software, all connected over an advanced wireless
network. Its projected budget swelled to $159
billion. By the time Defense Secretary Robert Gates
nixed the program in 2009, the Pentagon had already
spent around $19 billion to develop it.
• Expeditionary Fighting Vehicle. This amphibious
assault vehicle, envisioned as a tank that swims from
sea to shore with 17 Marines on board, was canceled
in 2011 after ballooning costs and poor performance.
Its development costs notoriously ate up $3.3 billion.

A Variety of Costs…
• Relevant costs and irrelevant costs
• Past costs and future costs
• Fixed costs and variable costs
• Recurring costs and non-recurring costs
• External costs and internal costs
• Opportunity cost
Fixed vs. Variable costs
• Variable costs are costs that tend to
vary directly with the production rate
• Fixed costs are costs that are relatively
independent of changes in the
production rate.
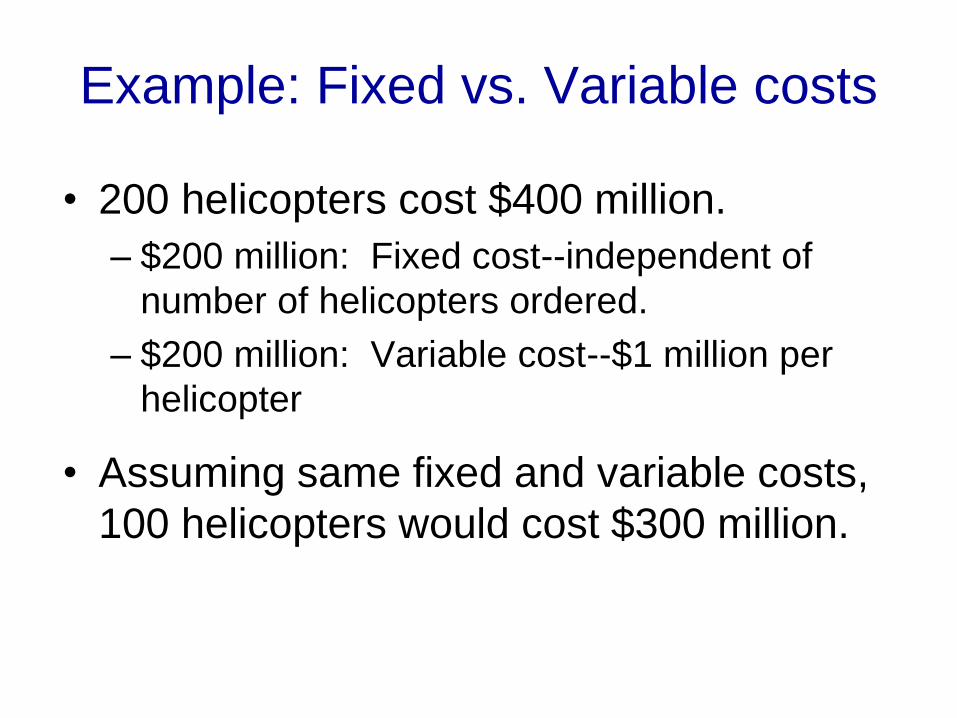
Example: Fixed vs. Variable costs
• 200 helicopters cost $400 million.
– $200 million: Fixed cost--independent of
number of helicopters ordered.
– $200 million: Variable cost--$1 million per
helicopter
• Assuming same fixed and variable costs,
100 helicopters would cost $300 million.

A Variety of Costs…
• Relevant costs and irrelevant costs
• Past costs and future costs
• Fixed costs and variable costs
• Recurring costs and non-recurring costs
• External costs and internal costs
• Opportunity cost
One-Time vs. Recurring costs
• One-time costs are costs that are paid once in the product lifecycle.
– Research and development
– Acquisition
– Disposal
• Recurring costs are costs that are paid repeatedly in most or all of the product lifecycle.
– Operations and support

Check on Learning
Recurring costs are defined as:
a. Two words – Starbucks Cappuccino
b. costs that are paid repeatedly in most
or all of a product lifecycle.
c. Margaritas on Bourbon Street
Check on Learning
Recurring costs are defined as:
a. Two words – Starbucks Cappuccino
b. costs that are paid repeatedly in most
or all of a product lifecycle.
c. Margaritas on Bourbon Street

A Variety of Costs…
• Relevant costs and irrelevant costs
• Past costs and future costs
• Fixed costs and variable costs
• Recurring costs and non-recurring costs
• External costs and internal costs
• Opportunity cost

External vs. Internal• Internal Costs are the costs that the buyer of a
good or service pays the seller.
• External Costs (or externalities), in contrast, are
the costs that people other than the buyer are
forced to pay as a result of the transaction.
(particular individuals or society at large).
• For example, the manufacturing cost of a car
reflects the internal costs for the manufacturer The
polluted waters or polluted air also created as part
of the process of producing the car is an external
cost borne by those who are affected by the
pollution The driver does not compensate for the
environmental damage caused by using the car.
A Variety of Costs…
• Relevant costs and irrelevant costs
• Past costs and future costs
• Fixed costs and variable costs
• Recurring costs and non-recurring costs
• External costs and internal costs
• Opportunity cost

Opportunity Costs
• value of the best alternative that was not
chosen in order to pursue the current
endeavor—i.e., what could have been
accomplished with the resources
expended in the undertaking. It
represents opportunities forgone
• What I WOULD do if I DIDN’T do what I
AM DOING

Cost Analysis
• A sequential process that involves the
identification, measurement and
evaluation of alternatives.
• Requires:
– Understanding objectives and alternatives
– Use of appropriate cost categories
– Discrimination between relevant and
irrelevant costs
– Emphasis on life cycle costs

Lifecycle Costs
• Research and Development
• Adquisition
• Operating and Support– Manpower
– Fuel
– Parts
– Other supplies
– Services
• Disposal/Residual
cost
time
R&D
Acquisition Operations
Residual?

A Simple Life-Cycle Cost Model
LCC = a + bx + cxy +/- d
a = one-time system costs (R&D)
b = one-time unit costs (Acquisition)
x = number of units
c = recurring (annual) operating costs
y = number of years operated
d = disposal costs (+) or residual value (-)
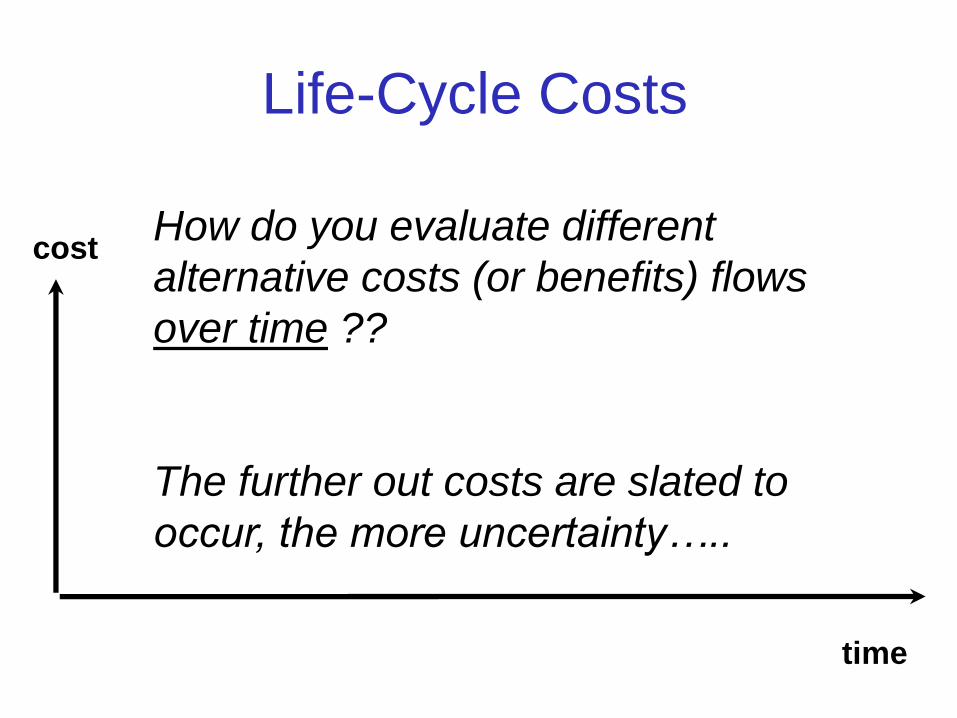
cost
time
How do you evaluate different
alternative costs (or benefits) flows
over time ??
The further out costs are slated to
occur, the more uncertainty…..
Life-Cycle Costs

38
Present Value Analysis
39
A Matter of Time
You’ve won 195 MILLION dollars!
Lump sum now or equal payments over 25 years?
40
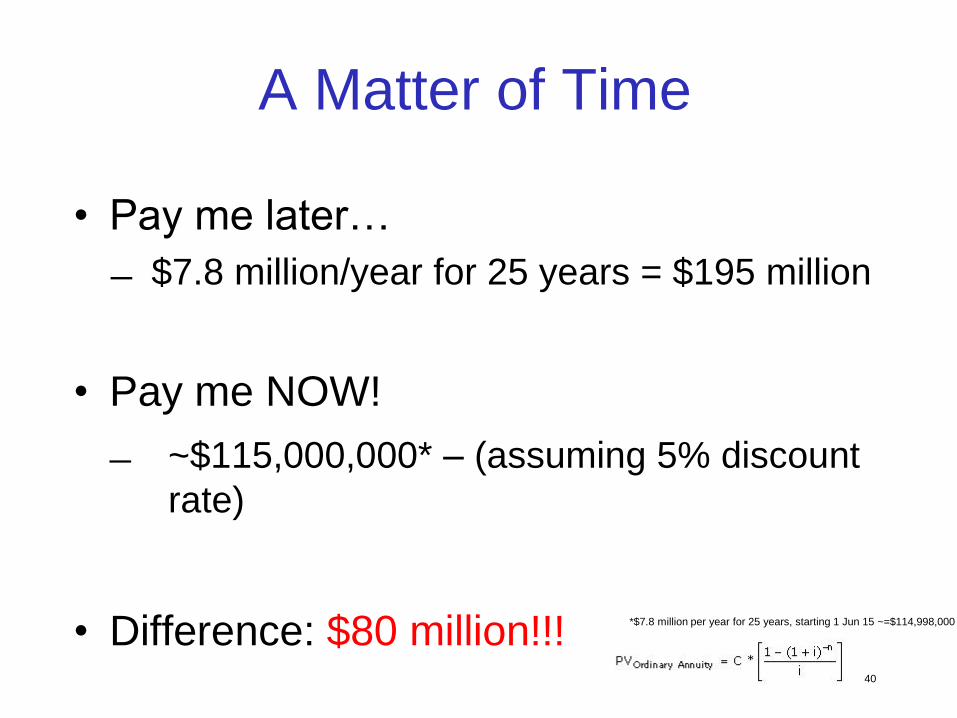
• Pay me later…
$7.8 million/year for 25 years = $195 million
• Pay me NOW!
~$115,000,000* – (assuming 5% discount
rate)
• Difference: $80 million!!!
A Matter of Time
*$7.8 million per year for 25 years, starting 1 Jun 15 ~=$114,998,000
41
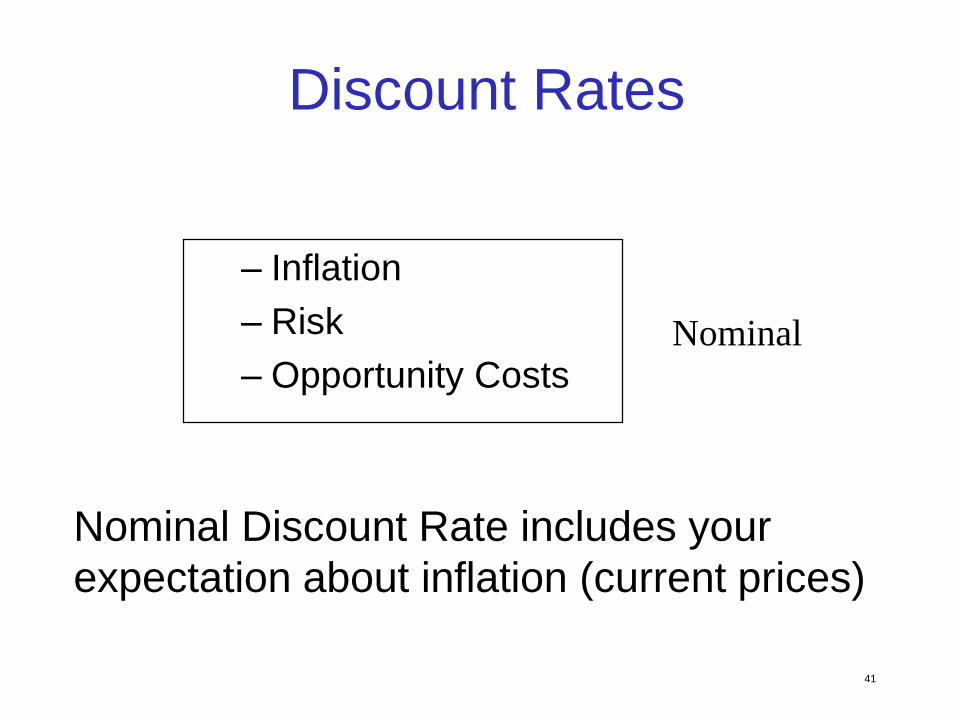
– Inflation
– Risk
– Opportunity CostsNominal
Discount Rates
Nominal Discount Rate includes your
expectation about inflation (current prices)

42
How can we evaluate
alternatives with different cash
flows over time?
Present Value Analysis
• Facilitates comparison of projects with
different cash flows over time.
• Allows comparison of a particular
program to the “expected next-best use”
of funds -- the opportunity cost of
resource allocation
• Analytical tool, not a decision rule
44
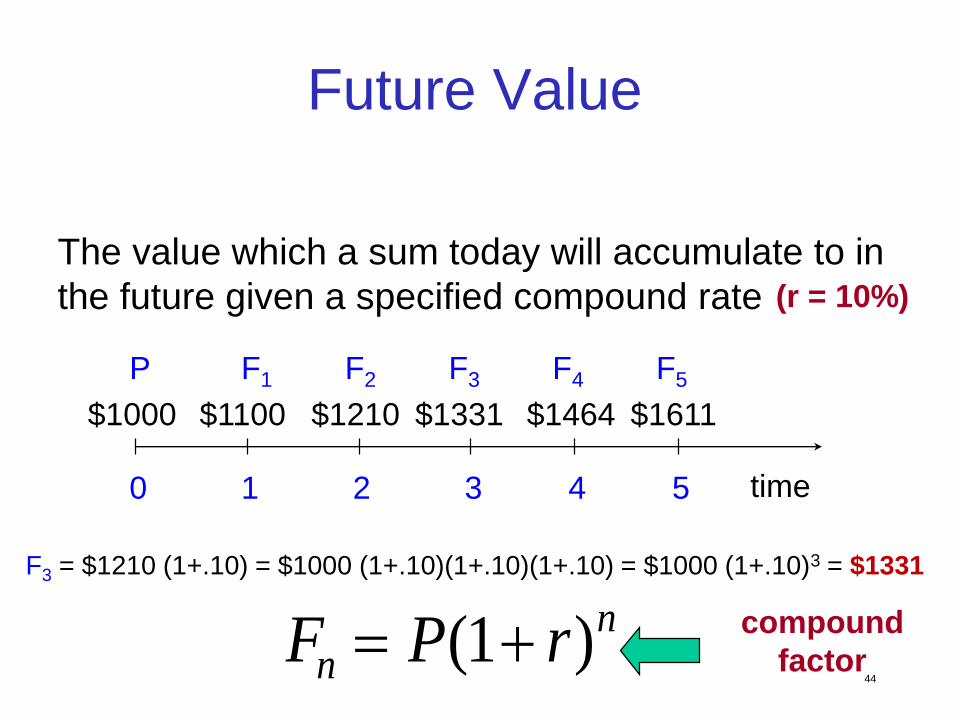
The value which a sum today will accumulate to in
the future given a specified compound rate (r = 10%)
time0 1 2 3 4 5
$1000
P F1
$1100
F2
$1210
F3
F3 = $1210 (1+.10) = $1000 (1+.10)(1+.10)(1+.10) = $1000 (1+.10)3 = $1331
$1331
F4
$1464
F5
$1611
Future Value
F P rnn ( )1 compound
factor

45
The value of expected future cash flows discounted
back to the present at a specified discount rate
(r = 10%)
time0 1 2 3 4 5
$?
P F5
$1000$621
Present Value
1
(1 )nrdiscount
factorP = Fn *

46
Discount Factor Tables
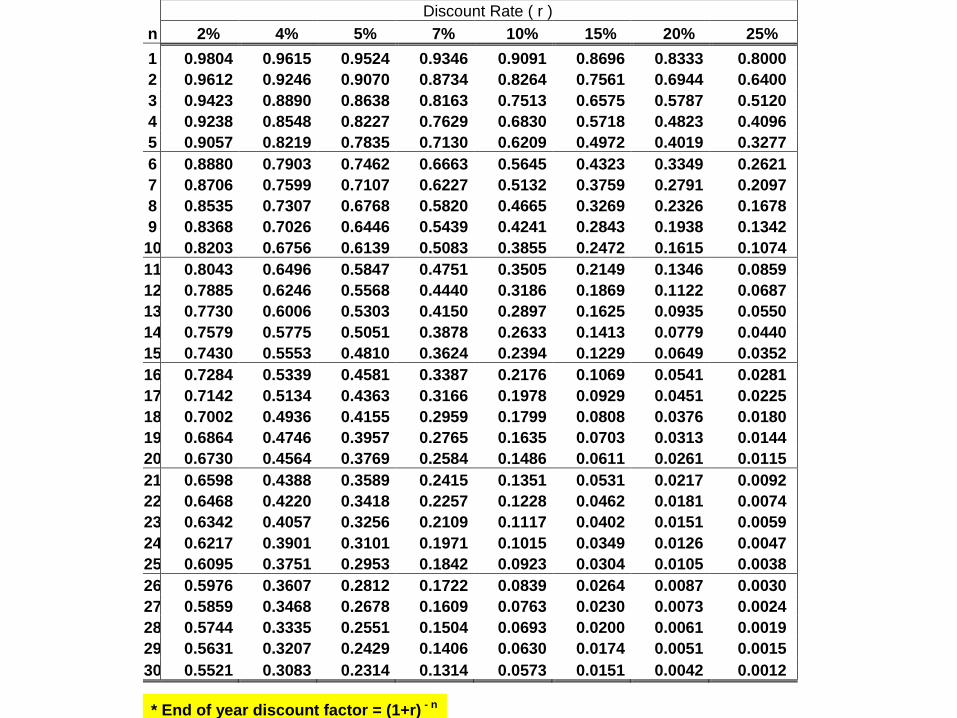
Discount Rate ( r )
n 2% 4% 5% 7% 10% 15% 20% 25%
1 0.9804 0.9615 0.9524 0.9346 0.9091 0.8696 0.8333 0.8000
2 0.9612 0.9246 0.9070 0.8734 0.8264 0.7561 0.6944 0.6400
3 0.9423 0.8890 0.8638 0.8163 0.7513 0.6575 0.5787 0.5120
4 0.9238 0.8548 0.8227 0.7629 0.6830 0.5718 0.4823 0.4096
5 0.9057 0.8219 0.7835 0.7130 0.6209 0.4972 0.4019 0.3277
6 0.8880 0.7903 0.7462 0.6663 0.5645 0.4323 0.3349 0.2621
7 0.8706 0.7599 0.7107 0.6227 0.5132 0.3759 0.2791 0.2097
8 0.8535 0.7307 0.6768 0.5820 0.4665 0.3269 0.2326 0.1678
9 0.8368 0.7026 0.6446 0.5439 0.4241 0.2843 0.1938 0.1342
10 0.8203 0.6756 0.6139 0.5083 0.3855 0.2472 0.1615 0.1074
11 0.8043 0.6496 0.5847 0.4751 0.3505 0.2149 0.1346 0.0859
12 0.7885 0.6246 0.5568 0.4440 0.3186 0.1869 0.1122 0.0687
13 0.7730 0.6006 0.5303 0.4150 0.2897 0.1625 0.0935 0.0550
14 0.7579 0.5775 0.5051 0.3878 0.2633 0.1413 0.0779 0.0440
15 0.7430 0.5553 0.4810 0.3624 0.2394 0.1229 0.0649 0.0352
16 0.7284 0.5339 0.4581 0.3387 0.2176 0.1069 0.0541 0.0281
17 0.7142 0.5134 0.4363 0.3166 0.1978 0.0929 0.0451 0.0225
18 0.7002 0.4936 0.4155 0.2959 0.1799 0.0808 0.0376 0.0180
19 0.6864 0.4746 0.3957 0.2765 0.1635 0.0703 0.0313 0.0144
20 0.6730 0.4564 0.3769 0.2584 0.1486 0.0611 0.0261 0.0115
21 0.6598 0.4388 0.3589 0.2415 0.1351 0.0531 0.0217 0.0092
22 0.6468 0.4220 0.3418 0.2257 0.1228 0.0462 0.0181 0.0074
23 0.6342 0.4057 0.3256 0.2109 0.1117 0.0402 0.0151 0.0059
24 0.6217 0.3901 0.3101 0.1971 0.1015 0.0349 0.0126 0.0047
25 0.6095 0.3751 0.2953 0.1842 0.0923 0.0304 0.0105 0.0038
26 0.5976 0.3607 0.2812 0.1722 0.0839 0.0264 0.0087 0.0030
27 0.5859 0.3468 0.2678 0.1609 0.0763 0.0230 0.0073 0.0024
28 0.5744 0.3335 0.2551 0.1504 0.0693 0.0200 0.0061 0.0019
29 0.5631 0.3207 0.2429 0.1406 0.0630 0.0174 0.0051 0.0015
30 0.5521 0.3083 0.2314 0.1314 0.0573 0.0151 0.0042 0.0012
* End of year discount factor = (1+r) - n
48
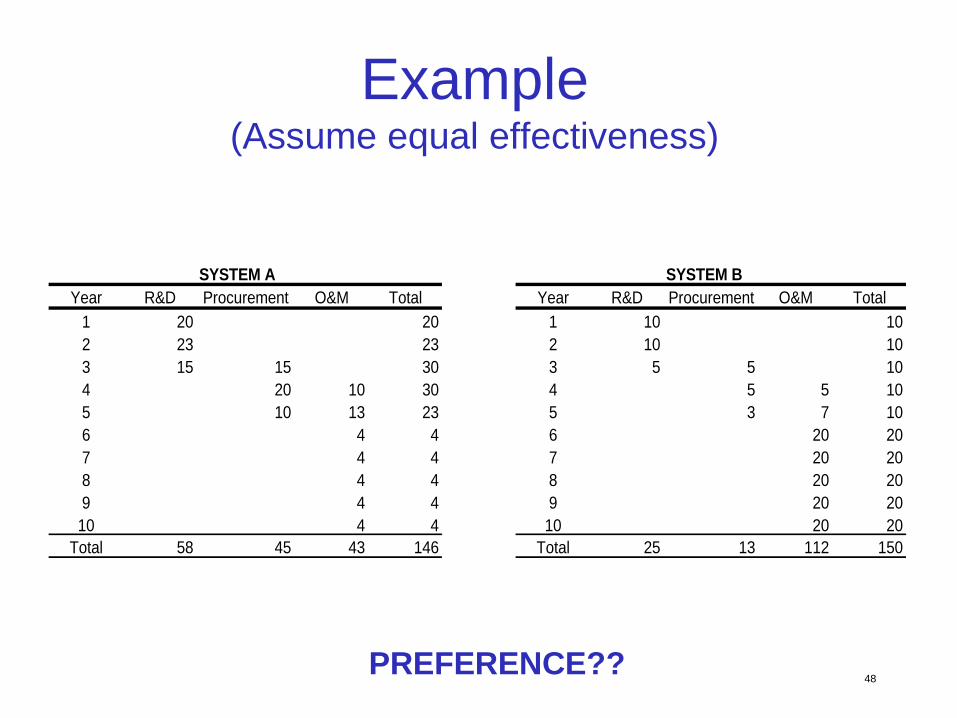
Example(Assume equal effectiveness)
SYSTEM A SYSTEM B
Year R&D Procurement O&M Total Year R&D Procurement O&M Total
1 20 20 1 10 10
2 23 23 2 10 10
3 15 15 30 3 5 5 10
4 20 10 30 4 5 5 10
5 10 13 23 5 3 7 10
6 4 4 6 20 20
7 4 4 7 20 20
8 4 4 8 20 20
9 4 4 9 20 20
10 4 4 10 20 20
Total 58 45 43 146 Total 25 13 112 150
PREFERENCE??

Example (7% mid-year)System A
Present
Year R&D Acq. O&S Total Value
1 20 20 19.33 2 23 23 20.78 3 15 15 30 25.33 4 20 10 30 23.67 5 10 13 23 16.96 6 4 4 2.76 7 4 4 2.58 8 4 4 2.41 9 4 4 2.25 10 4 4 2.10
Total 58 45 43 146 118.18

System B Present
Year R&D Acq. O&S Total Value
1 10 10 9.67 2 10 10 9.03 3 5 5 10 8.44 4 5 5 10 7.89 5 3 7 10 7.38 6 20 20 13.79 7 20 20 12.88 8 20 20 12.04 9 20 20 11.25 10 20 20 10.52
Total 25 13 112 150 102.89
Example (7% mid-year)

Uncertainties and Future Costs
• How do we identify and measure all the possible forgone future benefits?
• What inflation rate will prevail?
• What discount rate should we use?
• How do we deal with uneven project lives?
Useful tool - sensitivity analysis

Present Values for Systems A & B
0.00
20.00
40.00
60.00
80.00
100.00
120.00
140.00
160.00
0 0.05 0.10 0.15 0.2
Discount rate
PV
in
do
lla
rs
System A
System B

53
Nominal and Real Discount Rates: 2015(OMB 94)
Nominal Real
• 3-year 1.7 0.1
• 5-year 2.2 0.4
• 7-year 2.5 0.7
• 10-year 2.8 0.9
• 20-year 3.1 1.2
• 30-year 3.4 1.4
Nominal rates often used in lease-purchase analysis; Real rates often used in cost-effectiveness
analysis. Use linear interpolation for different project durations.
Ref: http://www.whitehouse.gov/omb/circulars_a094_a94_appx-c/
(no inflation premium)
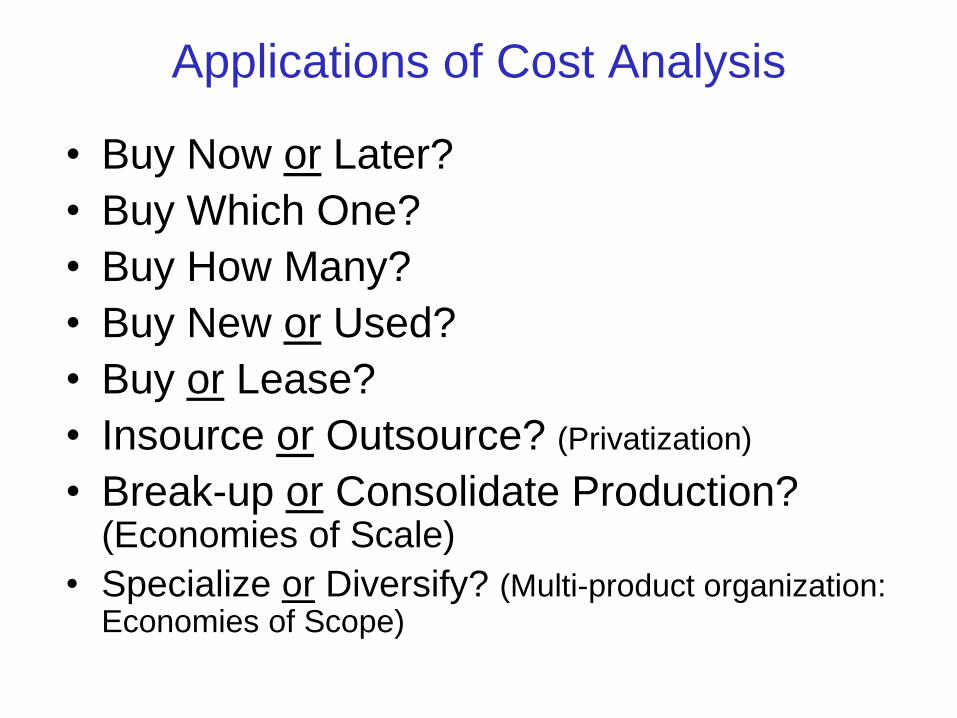
Applications of Cost Analysis
• Buy Now or Later?
• Buy Which One?
• Buy How Many?
• Buy New or Used?
• Buy or Lease?
• Insource or Outsource? (Privatization)
• Break-up or Consolidate Production? (Economies of Scale)
• Specialize or Diversify? (Multi-product organization: Economies of Scope)
“We are neither hunters nor gatherers.
We are accountants.”
Cost Accounting

What is Accounting?
The system of recording and
summarizing business and financial
transactions and analyzing, verifying,
and reporting the results*
*Webster’s dictionary, 2015

57
Types of Accounting
• Financial Accounting
– Preparation of financial
statements for external users
• Managerial Accounting
– Providing cost data for internal
users
58
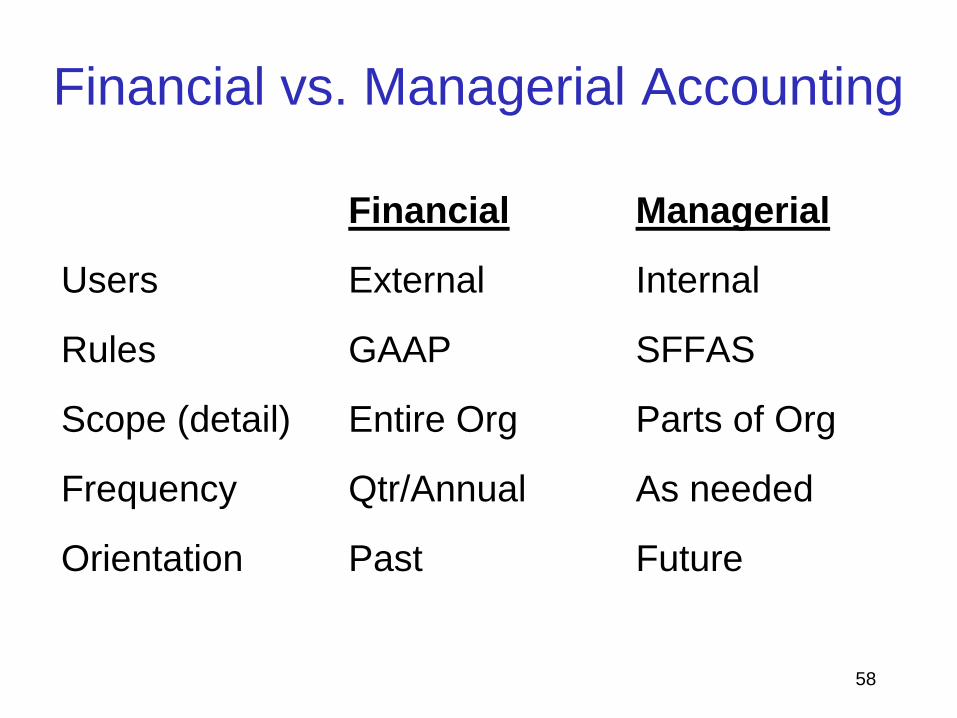
Financial Managerial
Users External Internal
Rules GAAP SFFAS
Scope (detail) Entire Org Parts of Org
Frequency Qtr/Annual As needed
Orientation Past Future
Financial vs. Managerial Accounting
59
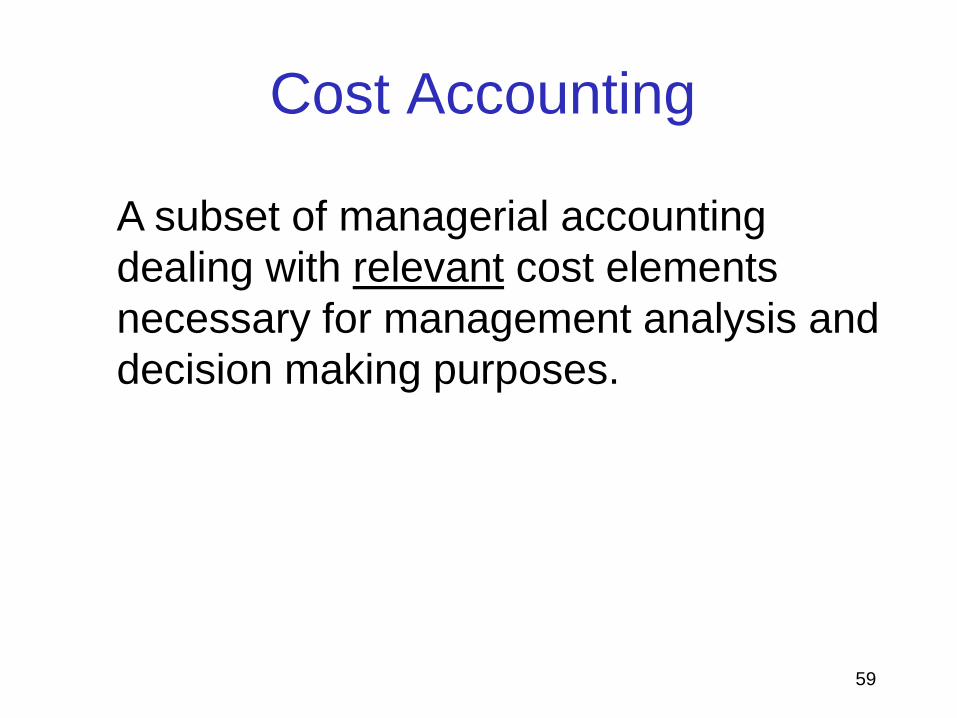
Cost Accounting
A subset of managerial accounting
dealing with relevant cost elements
necessary for management analysis and
decision making purposes.

60
Cost Accounting Uses
• Cost control
• Budgeting
• Performance measurement
• Determining reimbursements
• Setting fees and prices
• Program evaluations
• Economic choice decisions
61
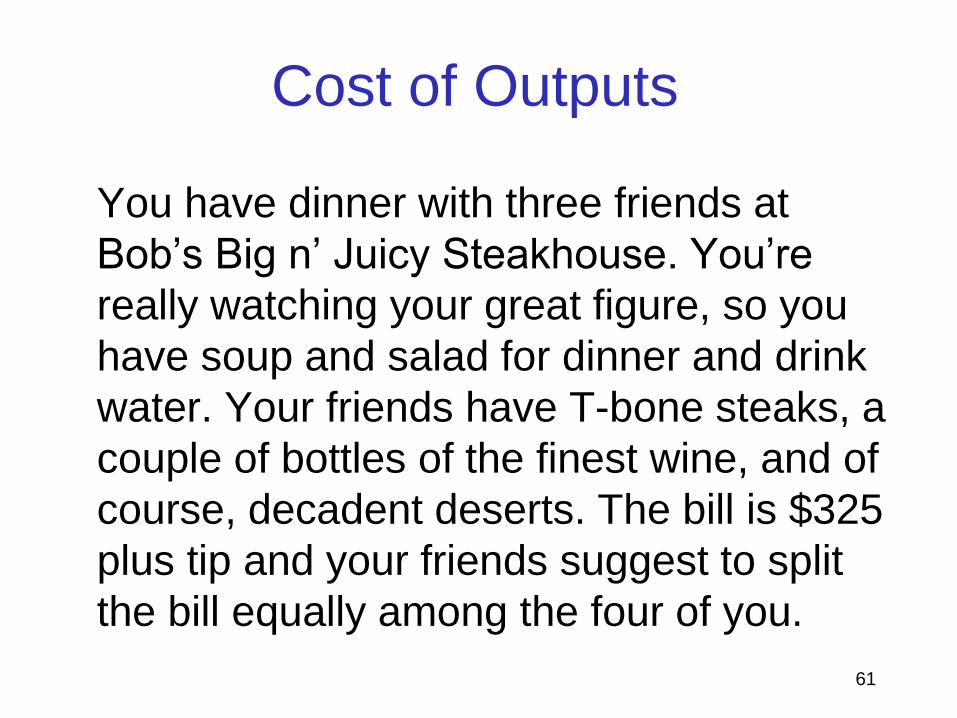
Cost of Outputs
You have dinner with three friends at
Bob’s Big n’ Juicy Steakhouse. You’re
really watching your great figure, so you
have soup and salad for dinner and drink
water. Your friends have T-bone steaks, a
couple of bottles of the finest wine, and of
course, decadent deserts. The bill is $325
plus tip and your friends suggest to split
the bill equally among the four of you.

The Myth of the $600 Hammer
When contractors allocated their
engineering expenses among the items on
the project list - a bookkeeping exercise that
had no effect on the price the Pentagon paid
overall - they simply treated every item the
same. So the hammer, originally $15, picked
up the same amount of R&D overhead,
$420, as each of the highly technical
components.
Sydney J. Friedberg, Jr. National Journal, Dec 1998

63
Cost Classifications
• Direct cost. A cost that can be easily
traced to an individual cost object.
– Direct Materials
– Direct Labor
• Indirect (overhead) cost. A cost that
supports more than one cost object.

64
Determining Costs of Outputs
• Cost accumulated by “responsibility center”
–A component of a unit or organization
–Responsible for carrying out a mission,
conducting a major activity, producing a
product or providing services.
• Cost allocated to “cost objects”
–The outputs of a responsibility center

65
Cost Accumulation
• Job Order
• Process Costing
66
Job Order Costing
• Costs are recorded for each product, batch or service separately
• Used for products, projects or assignments that differ in duration, complexity or resource requirements
– Aircraft repair
– Military Construction
– Research Projects

67
Process Costing
• Costs are recorded by department or process
• Used for continuous flow production of homogeneous units
– Immunizations
– Aircraft Refueling
– Parachute Assembly
68
Base Recycling Facility
A base Commander has decided to build
a recycling facility. You are the civil
engineer in charge of the project. How
would you determine the cost of the
facility?
Job Order

69
Suppose you are the manager of the
new recycling facility and have been
asked to determine the cost per ton of
trash. How would you go about doing
this?
Process
Base Recycling Facility
70
Cost Allocation
• Direct tracing
• Single-step allocation
• Activity-Based Costing

71
Direct Tracing
• Observing, counting and recording
consumption of resources
• Most accurate
• Most expensive and difficult

72
Single-Step Allocation
• All indirect costs allocated to units
based on a single cost driver (usually
volume, direct labor hours, machine
hours or direct materials)
• Least accurate
– Often the allocation base (cost driver) has
little relation to the consumption of
resources
• Least expensive and easiest

The Boat Company
The Boat Company makes five boats
and has $25,000 in overhead costs.
Using single-step allocation, the
overhead cost per boat would be $5,000
each.
73

74
75
Regular trash is taken directly to the dump
while recyclable trash is processed at the
facility (sorted and compacted).
How would you allocate the salaries of the
personnel that sort the recyclable trash?
How about the salaries of the truck drivers?
Direct Tracing
Direct Tracing or Single Step
Base Recycling Facility
76
The facility manager is in charge of
scheduling trash collection and
supervising processing activities. How
would you allocate his salary to each
type of trash?
Single Step
Base Recycling Facility

77
The base charges a fixed monthly fee to
provide maintenance for the trucks and
the compacting machine. How would
you allocate the cost of maintenance?
Base Recycling Facility
Which activities consume maintenance?
78
Activity-Based Costing
• Traces cost of resources used to
activities using resource drivers, then
cost of activities to outputs or cost
objects using activity drivers
• Minimizes cost distortion
• Requires more effort and expense
• Analyzes process and identifies
inefficiencies

Activity-Based Costing
Resources
Activities
Outputs (Cost objects)
Resource
Drivers
Activity
Drivers
maintenance
pick-up process dispose
regular recycle
Maintenance hours
Tons of trash
labor fuel electric

80
Suppose the base provides maintenance
for the trucks and the compacting
machine, but it’s paid out of the base
budget, not the recycling facility budget.
Is the maintenance free?
Should maintenance be included in the
cost of recycling?
Base Recycling Facility
81
DoD built and paid for the recycling
building two years ago (out of the Military
Construction appropriation). The
manager wants to calculate the average
(unit) cost of recycling a ton of trash this
year.
Should the cost of the building be
included?
Base Recycling Facility
Cost Estimating
An estimate
is a judgment, opinion, forecast, or prediction.
A cost estimate
therefore is a prediction of the likely future cost
of a process, product, project, service,
program, or system.

Cost Estimating Techniques
• Two basic approaches– Detailed (“Bottom-up”) – Prices of sub-
component costs, labor, etc.
– Order-of-Magnitude ("Top-down") A rough order of magnitude could look at what a similar project cost in the past. For example, projecting what a new computer system would cost for a multi-location business could be completed by multiplying what one location cost the last time the computers were upgraded times the number of locations.
Cost Estimating Techniques
• Methods used to support estimates– Direct assessment
– Analogy/Component Ratio
– Handbook/Catalog
– Vendor quote
– Parametric
– Resource requirements
– Actual Costs
You have been informed that funds
just became available for construction
of an air operations center, but you
need to provide a cost estimate within
24 hours so that funds can be
obligated before the end of the FY.
Besides ensuring compliance with
fiscal law, What to do??

Direct Assessment• Subjective evaluation based on
– Expertise
– Study
• Estimate without details
– Resources
– Dollars

Analogy
Estimate the cost of a new system by multiplying
the cost of a similar existing system by a
weighting factor (or index) which captures the
difference in a key system characteristic
Cost New = Cost Old x Characteristic New
Characteristic Old
Cost New = Cost Old x Index, where Index = a
complexity multiplier

New Building Construction Cost
Cost of Existing Building $2,000,000
Cost of New Building $ ?
Ft2 of Existing Building 10,000 Ft2
Ft2 of New Building 15,000 Ft2
New Building Cost = $2M x 15,000/10,000
= $3,000,000

Analogy
• Advantage:
– Can be simple, inexpensive, and quick
• Potential Problems:
– Relies on judgment of functional experts
– Ignores fixed costs
– Ignores manufacturing technology changes
– Failing to adjust for quantity/schedule differences
between the existing and the new systems

Component Ratio (Factor)• Similar to analogy
• Uses component costs (parts and/or
processes) of old but similar systems to
estimate the costs of similar components in
new systems.
• Component costs of old systems are
expressed as a percentage of total cost.

Managerial Question: What will be the annual
O&S cost for a new fighter aircraft?
Given: Life Cycle Cost data for 20 old fighter
aircraft reveal:
2% of LCC is R&D
18% of LCC is Acquisition
80% of LCC is O&S
Fighter Aircraft O&S Costs

Fighter Aircraft O&S Costs
We expect the R&D for the new fighter to be $10B
We plan to procure 1000 new aircraft
We plan to operate each aircraft for 25 years
O&S Estimate Calculation:
2% of LCC (R&D) = $10B ($500B system LCC)
18% of LCC (Acquisition) = $90B
Total O&S cost (system) = 80% of $500B = $400B
Total O&S cost (per a/c) = $400B/1000 = $400M
Annual O&S cost (per a/c) = $400M/25 years = $16M

How would you estimate the cost of
100 computers required for the AF
Pilot Training School?

Handbook/Catalog Pricing
(web pricing)
• Advantages
– Easy and inexpensive
– Provides resource requirements as well as cost
– Based on years of experience and data
– Current market prices
• Potential Problems
– Items don’t match requirements
– Information is based on old technology
Vendor Quote• Advantages
– Efficient
– Realistic
• Use 3 or more bids to check
– Reliable (firm)
• Disadvantages
– Requires preparation of RFQ
– Relies on vendor information

• Detailed description of system– WBS
• Complete list of resources required for each task– Direct
• Documents
• Materials
• Labor
– Indirect
– Time
• Unit cost of each resource
Resource Requirements(Industrial Engineering)
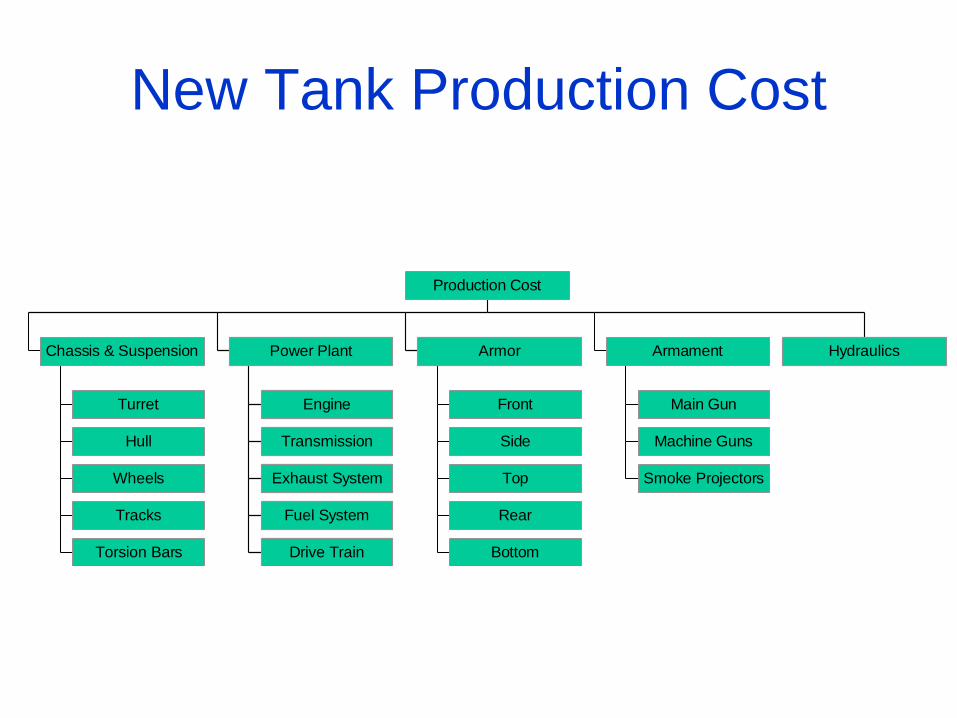
New Tank Production Cost
Turret
Hull
Wheels
Tracks
Torsion Bars
Chassis & Suspension
Engine
Transmission
Exhaust System
Fuel System
Drive Train
Power Plant
Front
Side
Top
Rear
Bottom
Armor
Main Gun
Machine Guns
Smoke Projectors
Armament Hydraulics
Production Cost
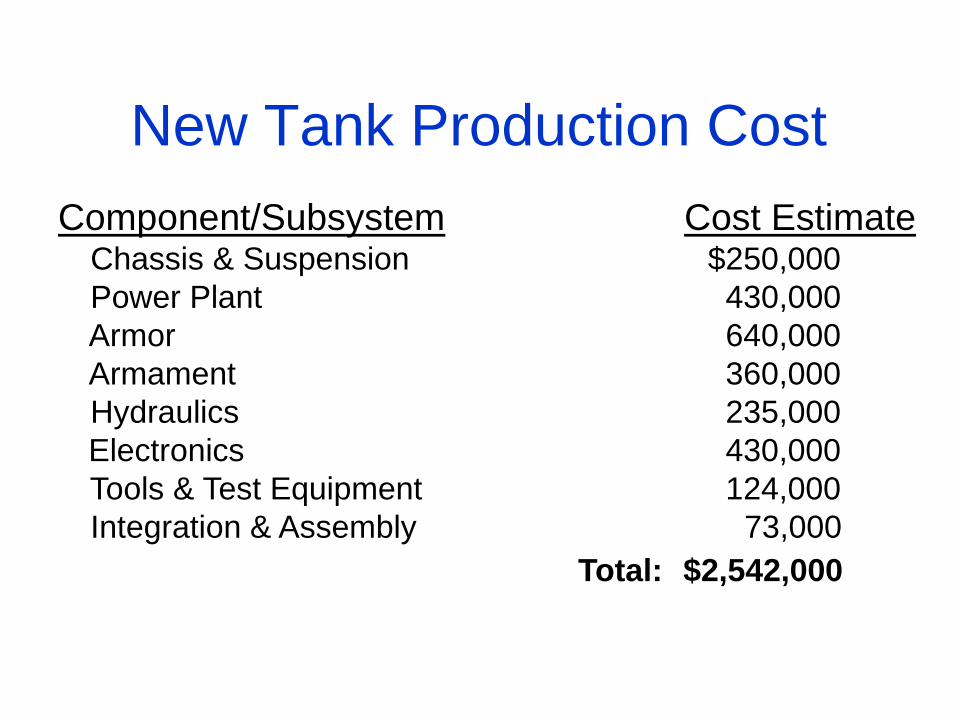
New Tank Production Cost
Component/Subsystem Cost EstimateChassis & Suspension $250,000
Power Plant 430,000
Armor 640,000
Armament 360,000
Hydraulics 235,000
Electronics 430,000
Tools & Test Equipment 124,000
Integration & Assembly 73,000
Total: $2,542,000

Resource Requirements(Industrial Engineering)
• Advantages
– Very accurate, complete
– Forces consideration of details
– Basis for cost/schedule control
• Disadvantages
– Requires detailed design
– Labor and time intensive
– Must change as design/use changes

Actual Costs
• Based on cost data from– Prototypes
– Test and Evaluation
– Limited production runs
– Fielded units
• Extrapolates cost of future units based on actual cost of prior units
• Drawbacks– Built-in inefficiencies
– Failure to normalize data
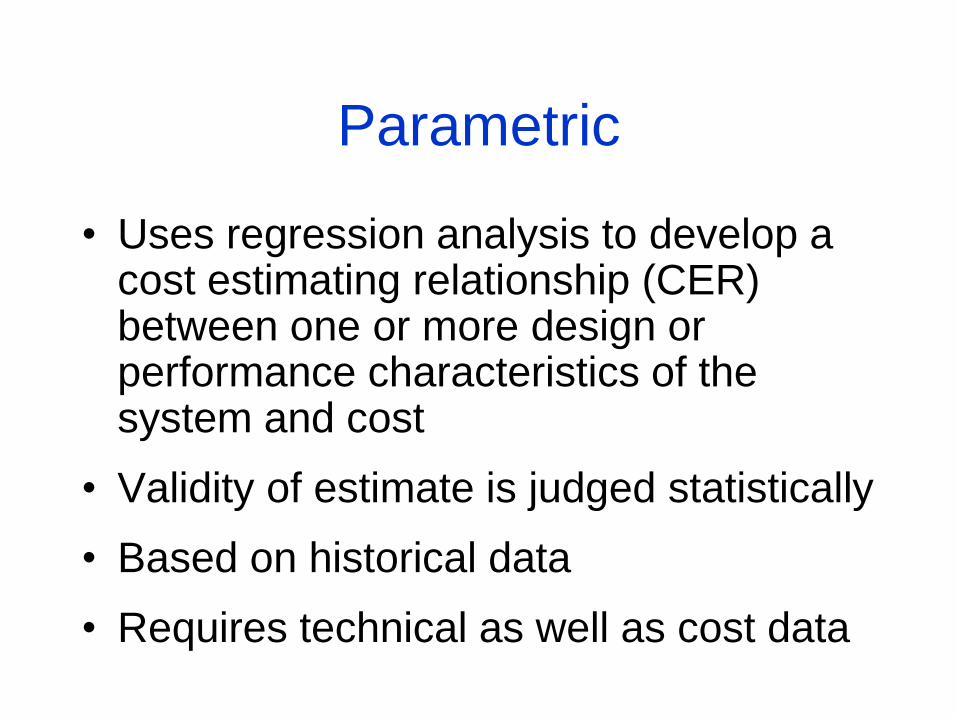
Parametric
• Uses regression analysis to develop a cost estimating relationship (CER) between one or more design or performance characteristics of the system and cost
• Validity of estimate is judged statistically
• Based on historical data
• Requires technical as well as cost data
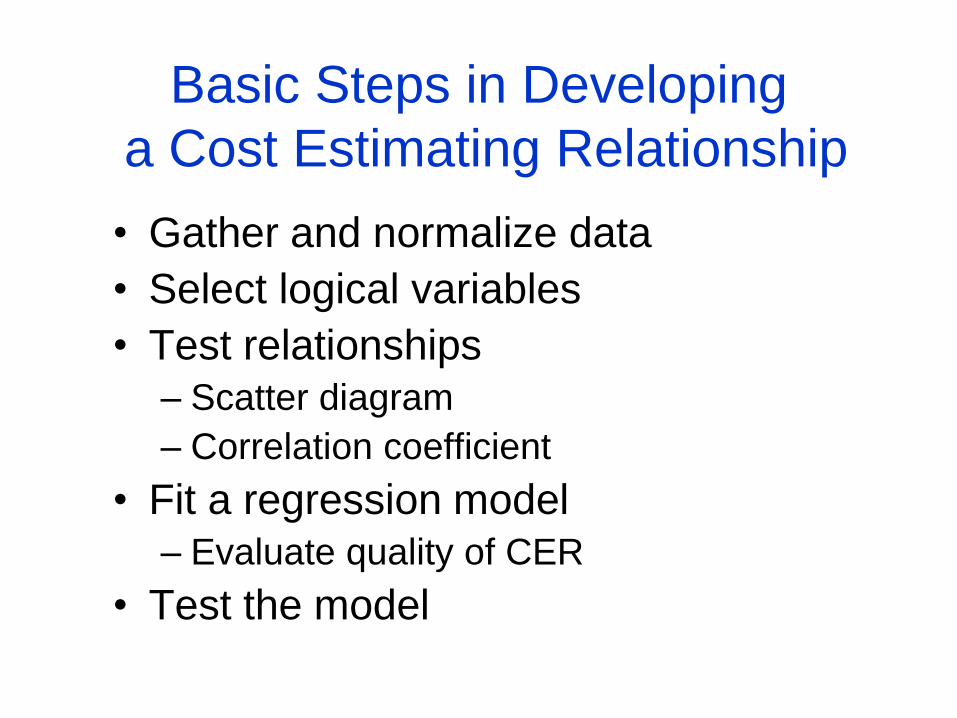
Basic Steps in Developing
a Cost Estimating Relationship
• Gather and normalize data
• Select logical variables
• Test relationships
– Scatter diagram
– Correlation coefficient
• Fit a regression model
– Evaluate quality of CER
• Test the model

All Space Vehicles Total Cost
y = 0.5294x0.8023
R2 = 0.6662
1
10
100
1,000
10,000
100,000
10 100 1,000 10,000 100,000 1,000,000
Weight (lbs)
To
tal
Co
st
(FY
01$M
)
Example

Example: New Tank Production Cost
Cost = 72.0 + 24.0W + 9.9C + 0.5H
W = Weight of Tank in tons (65)
C = Caliber of main gun in mm (120)
H = Horsepower of engine (1500)
Cost = 72 + 24 (65) + 9.9 (120) + 0.5 (1500) = $3570

Cost Estimating Relationships
Strengths and Weaknesses• Strengths
– Provide quick estimate without knowing design and WBS details
– Based on objective historical data
– Validity can be tested statistically
– Simplifies estimating
• Weaknesses– Data must be normalized
– Can be too simplistic
– No in-depth visibility to cost elements
– No cost/schedule visibility
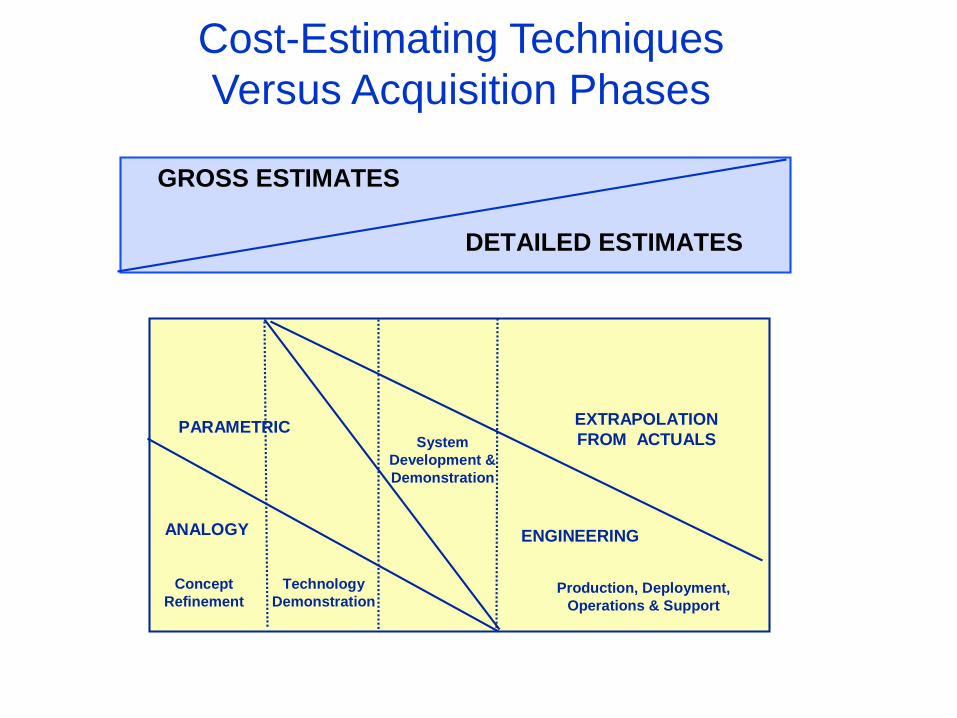
GROSS ESTIMATES
DETAILED ESTIMATES
ANALOGY
PARAMETRIC EXTRAPOLATION
FROM ACTUALS
ENGINEERING
Concept
Refinement
Technology
Demonstration
System
Development &
Demonstration
Production, Deployment,
Operations & Support
Cost-Estimating Techniques
Versus Acquisition Phases
Check on Learning
Cost estimating techniques are:
a. Honey, my new Harley was somewhere
between $50 and $20,000
b. predictions of the likely future cost of a
process, product, project, service, or system
c. Methods of determining bail for Justin
Beiber and Lindsay Lohan
Check on Learning
Cost estimating techniques are:
a. Honey, my new Harley was somewhere
between $50 and $20,000
b. predictions of the likely future cost of a
process, product, project, service, or system
c. Methods of determining bail for Justin
Beiber and Lindsay Lohan

Summary of Key Concepts
Understanding costs is essential for cost
analysis, cost accounting and decision making:
• Relevant and irrelevant costs
• Fixed vs. variable costs
• One-time vs. recurring costs
• Lifecycle costs
• Cost profiles and present value analysis
• Cost accumulation and allocation