cost-effective construction innovations/improvements for
TRANSCRIPT

CIVIL ENGINEERING STUDIES Illinois Center for Transportation Series No. 21-015
UILU-ENG-2021-2015 ISSN: 0197-9191
Cost-Effective Construction
Innovations/Improvements for CRCP:
Volume 5
Prepared By
Tyler Speakmon Mirmilad Mirsayar
Atheer Jumah Dan Zollinger
Texas A&M University
Research Report No. FHWA-ICT-21-015
A report of the findings of
ILLINOIS STATE TOLL HIGHWAY AUTHORITY Innovative Structural and Material Design for Continuously Reinforced Concrete Pavement
https://doi.org/10.36501/0197-9191/21-015
Illinois Center for Transportation
May 2021


TECHNICAL REPORT DOCUMENTATION PAGE
1. Report No.
ICT-21-015
2. Government Accession No.
N/A
3. Recipient’s Catalog No.
N/A
4. Title and Subtitle
Cost-Effective Construction Innovations/Improvements for CRCP: Volume 5
5. Report Date
May 2021
6. Performing Organization Code
N/A
7. Authors
Tyler Speakmon, Mirmilad Mirsayar, Atheer Jumah, Dan Zollinger
8. Performing Organization Report No.
ICT-21-015
UILU-ENG-2021-2015
9. Performing Organization Name and Address
Illinois Center for Transportation
Department of Civil and Environmental Engineering
University of Illinois at Urbana-Champaign
205 North Mathews Avenue, MC-250
Urbana, IL 61801
10. Work Unit No.
N/A
11. Contract or Grant No.
12. Sponsoring Agency Name and Address
Illinois State Toll Highway Authority
2700 Ogden Ave
Downers Grove, IL 60515
13. Type of Report and Period Covered
Final Report
14. Sponsoring Agency Code
N/A
15. Supplementary Notes
16. Abstract This volume addresses key factors such as cracking behavior of CRC pavement, end movements at terminal and header joints,
and interfacial bond and erosion damage between the slab and the base layer as it may pertain to punchout development and
the performance of CRCP. This volume also addresses measures to reduce initial cost of CRC pavement construction through
modification of base types, pavement and jointing configuration, and transverse crack spacing variability.
17. Key Words
Reinforced Concrete Pavements, Continuously Reinforced Concrete Pavements, Cracking Pattern, Interfacial Bond, Initial Pavement Construction Cost
18. Distribution Statement
No restrictions. This document is available through the National Technical Information Service, Springfield, VA 22161.
19. Security Classif. (of this report) Unclassified.
20. Security Classif. (of this page)
Unclassified
21. No. of Pages
82
22. Price
N/A
Form DOT F 1700.7 (8-72) Reproduction of completed page authorized

i
ACKNOWLEDGMENT, DISCLAIMER, MANUFACTURERS’ NAMES
This publication is based on the results of Illinois State Toll Highway Authority Project titled Innovative Structural and Material Design for Continuously Reinforced Concrete Pavement. This study was funded by the Illinois State Toll Highway Authority. Acknowledgement is given to Mr. Steve Gillen and Mr. Dan Gancarz.
The researchers acknowledge and appreciate the assistance of CMC Steel and the City of Victoria for their cooperation in making the test section placed on Airport Ball Road a reality. Mr. Ken Gill, the City Engineer for the City of Victoria was especially helpful in coordinating the work.
The contents of this report reflect the view of the authors, who are responsible for the facts and the accuracy of the data presented herein. The contents do not necessarily reflect the official views or policies of the Illinois Center for Transportation or Illinois State Toll Highway Authority. This report does not constitute a standard, specification, or regulation.

ii
EXECUTIVE SUMMARY
Continuously reinforced concrete (CRC) pavement is designed to naturally develop a pattern of transverse cracks at certain intervals that develop due to the contraction of the concrete due to temperature and moisture change during the hardening process. Whether these cracks occur randomly or induced at a controlled location, their intended purpose is to possess high degree of stiffness while manifesting stress relief characteristics that minimize the potential for punchout or spall development and eventual loss of ride quality. Due to the features of the cracking pattern, CRC pavements have a high potential to maintain a relatively low state of stress under load and provide excellent levels of performance as a result. Many of transverse cracks in CRC pavement form initially shortly after construction but the majority of the cracks that make up the final cracking pattern occur within the first 1 to 2 years. It is pointed out that some of the transverse cracks may not become evident for several months only after the pavement is open to traffic.
One purpose of this volume is to examine factors associated with and suggests possible mechanisms for the incidence of selected distress types in CRC pavements such as punchouts and cluster cracking and suggest methods of reduce them and extend service life while reducing the initial construction cost. A comprehensive field survey and finite element (FE) modeling of a CRC pavement structure was carried out to investigate the stresses associated with the possible formation of transverse cracking including a comparison to field and trial sections of CRC pavement such as one on Illinois Route 390 toll road near Itasca, IL. Geometrical and mechanical properties for the modelling were derived from the material and structural characteristics of the actual pavement sections. Different construction innovations were examined such as surface notches to assess their cost effectiveness. Several conclusions are listed in this volume addressing long-term performance of CRC pavement and the factors that can be enhanced to affect it.
Cracking behavior of CRC pavement has been a key aspect of how a CRC pavement performs with respect to punchouts over its life. The ideal crack pattern is one that is uniformly distributed and uniformly initiated resulting in cracks that move uniformly. The magnitude of crack opening and closing has been recognized for many years as a key component of CRC performance since if affects structural stiffness of the transverse crack as well as moisture infiltration to the interface of the slab/subbase contact. The factors that affect crack movement is tied to the following:
• Spacing between cracks,
• Season of placement,
• Percent, depth and size of steel reinforcement, and
• Subbase type and interfacial resistance.
The capability of a CRC pavement system to maintain acceptable crack movement limits depends upon the balance between each of the above as well as another factor not mentioned but could be included in the above list is timing or the uniformity of the initiation of the cracking. It is also noted that the better the balance between these factors the lower the wheel load stresses in the pavement. Random cracking patterns tend to be distributed over a range of 3 to 8 feet but spacing wider than 8

iii
feet are common. Two conditions that are related to this balance is the development of early cracks and the lack of cracking energy in the vicinity of header or terminal joints in CRC pavements. Random developing early cracks tend to be widely spaced and manifest wider movements than those that form later. Cracks that form in the vicinity of terminal joints also tend to be widely spaced and exhibit smaller movements due to the terminal joint absorbing a large portion of the slab movement. One of the findings of this study is the need to maintain a better balance in design between the above factors and different sections of a reinforced concrete pavement to more effectively affect the development of the characteristics of an ideal crack pattern.
Several measures are discussed in this volume regarding the improvement of cost effectiveness of CRC pavement. Each of these measures affect the level or degree of balance described above by either design or construction modification and consequently the wheel load stresses used in the design process. Measures discussed are listed as follows:
• Post-tensioning of the transverse reinforcement
• Lower restraining subbase types and combinations
• Use of jointed concrete shoulders
• Reduced cracking variability
The first measure involves making greater use of the transverse reinforcement to increase its utility by reducing key wheel load stress in the pavement while reducing the required design thickness and improving fatigue life. Various aspects of this measure are explored and assessed with respect to the cost effectiveness it would provide. The second measure relates to improved base design to balance the level of restraint against the potential for crack development (both vertically and horizontally) and the stresses associated with that. Base design also pertains to erosion resistance and the provision of uniform support. Most base types utilize an asphalt concrete bond breaker interlayer to transition the support from the slab into a stiffer base layer below. Crack development analysis indicates a threshold limit of friction beyond which little structural benefit is gained especially with respect to the potential for horizontal delamination at the level of the steel reinforcement. The use of jointed concrete shoulders has been used for several years by states such as Oklahoma and Illinois for CRC pavement construction and the tendency has been for the shoulder joints to reflect through the adjacent CRC. Analysis is presented to reduce the tendency for joint reflection since this tends to yield cracks that move more than they would otherwise. The last measure encompasses multiple measures related to crack control by either surface notching, use of fiber-reinforcement, or use of internal curing to limit drying shrinkage in the pavement concrete. Various aspects are considered as to the effectiveness of each measure to improve performance and reduce cost.
iv
TABLE OF CONTENTS
CHAPTER 1: CRC PAVEMENT END MOVEMENT AND CRACK DEVELOPMENT.......................... 1
1.1 END MOVEMENT OF CRC PAVEMENT .................................................................................... 1
1.1.1. Finite Element Modeling ................................................................................................ 2
1.1.2. Results ........................................................................................................................... 5
1.2. CASES FOR CRACK CONTROL IN CRC PAVEMENT................................................................. 12
1.2.1. The Case of Cluster Cracking ........................................................................................ 12
1.2.2. The Case of End Movement ......................................................................................... 17
1.3 CONCLUSIONS ...................................................................................................................... 21
CHAPTER 2: ASSESSMENT OF INTERLAYER FRICTIONAL STRESS ........................................... 22
2.1 ASSESSMENT OF INTERFACIAL BOND STRENGTH (FE) ........................................................... 23
2.2.1 Slab Effective Thickness and Interlayer Friction Stiffness Determination ....................... 25
2.2.2 Laboratory Assessment of Interfacial Bond Strength ..................................................... 29
2.2.3 Field Application ........................................................................................................... 36
2.3 EROSION TESTING AND ANALYSIS ........................................................................................ 47
2.4 CONCLUSIONS ...................................................................................................................... 50
CHAPTER 3: MEASURES TO IMPROVE COST EFFECTIVENESS OF CRC PAVEMENT ................. 52
3.1 CRC PAVEMENT AREAS OF MODIFICATION/IMPROVEMENT ............................................... 52
3.2 CRC PAVEMENT-PT CONFIGURATION AND DESIGN CONCEPT.............................................. 54
3.3 PT FIELD TRIALS .................................................................................................................... 55
3.3.1 Victoria TX. Ball Airport Rd. Test Section ....................................................................... 55
3.3.2 TAMU/TTI – Rellis Campus Test Slab ............................................................................. 57
3.4 COST ANALYSIS OF THE PT DESIGNS ..................................................................................... 59
3.5 REDUCED/MODIFIED BASE COST DESIGN ............................................................................. 60
3.5.1 Modified Bond Breaker Requirements .......................................................................... 61
3.5.2 Lower Cost Lateral Support Modification ...................................................................... 63
3.5.3 Reduced Crack Variability and Surface Notching ........................................................... 65
3.5.4 Use of Active Curing Management ................................................................................ 66
3.6 COST & LIFE CYCLE ANALYSIS OF DESIGN MODIFICATIONS .................................................. 67
v
3.6.1 Construction Costs and Structural Changes From Proposed Modification Parameters .. 68
3.7 DESIGNING A BALANCED & IMPROVED CRC PAVEMENT ..................................................... 72
3.8 CONCLUDING STATEMENTS/RECOMMENDATIONS ............................................................. 74
REFERENCES .......................................................................................................................... 76
APPENDICES .......................................................................................................................... 79
APPENDIX A................................................................................................................................ 79
A.1 Bar Layout Option 1 (Continuous Bar, One Side Post-tensioned) ..................................... 79
A.2 Bar Layout Option 2 (Coupled Bar by Lane, One Side Post-tensioned) ............................. 79
A.3 Bar Layout Option 3 (Split Bar System, Both Sides Post-tensioned) .................................. 80
A.4 Anchor, pt bar, and post-tensioner Installation................................................................ 81
A.5 Cables Replacing Rigid Bar Method.................................................................................. 82

1
CHAPTER 1: CRC PAVEMENT END MOVEMENT AND CRACK DEVELOPMENT
CRC pavement is a Portland cement concrete pavement composed of continuous longitudinal steel and transverse steel reinforcing bars. Generally, the steel bars are often placed in the vicinity of the mid-depth of the CRC layer play a key role in resisting the effects of environmental factors and maintain the stiffness of the transverse cracks. When the temperature or moisture related environmental effects occur causing a volumetric decrease within the CRC layer a pattern of tensile stresses develops both in the reinforcing steel and the concrete.
In this chapter, research on the behavioral and functionality aspects associated with continuously reinforced concrete (CRC) pavement are elaborated to gain an appreciation of the strains and stresses that develop. This topic is a prelude to subsequent discussions addressing research on the characterization of end movements and stress development in CRC pavement structures.
1.1 END MOVEMENT OF CRC PAVEMENT
There are many factors affecting on the end movements in CRC pavements. The relationships between these variables are complex and interrelated. CRC pavement structural behavior involves a greater emphasis on composite interaction due to the presence of the large amount of steel reinforcing it contains and the necessity of considering the effects of the continuity of the reinforcement with the concrete. For this reason, the importance of developing a rational method of predicting CRC pavement behavior based on the mechanics of the pavement structure, the environmental conditions, and the material properties is important [13].
As depicted in Figure 1, end movement occurs in CRC pavement due to environmentally induced strain profile throughout the slab. Investigation of the mechanism of the slab displacements due to such environmental loads is very important for design purposes. Obviously, the relationships between different variables are very complex and may not be entirely represented by the closed-form solutions. The numerical modeling can be helpful in this regard to simulate the actual conditions in the pavement.
Figure 1. Representation of CRC pavement end movement.
The objective of this part of the report is the introduction if a new approach for simulation of the behavior of CRC pavements utilizing 3D cohesive zone elements. The cohesive zone approach utilizes

2
the interfacial fracture mechanics concepts to simulate actual behavior of the concrete/subbase interface by taking into account both shear and cohesive stresses along the interface. The effects of many design factors including slab length, environmental loads, and bond strength are accounted for using the proposed approach.
1.1.1. Finite Element Modeling
Figure 2 shows a prism taken out of the middle of the edge of a typical CRC pavement structure. Since we are interested in the terminal end movement, the prism is taken out of end of the CRC pavement structure. Indeed, the corner and the edge of a CRC slab move upward in different manners. The deformation at the corners can also be easily simulated by applying the corresponding boundary conditions. However, in the present report, the end movements in the mid-plane of the concrete slab is investigated. The reinforcing bar in CRC pavement has the spacing of b, and diameter of ds placed at the distance z0 from the subbase layer. The selected prism has the length of L, and the thickness of the concrete slab and the subbase are t0 and tbase, respectively. Interface cohesive elements are used to connect concrete slab and subbase layer, as well as the concrete slab and the reinforcing steel bar.
Figure 2. Structural Idealization of a Segment of CRC pavement.
The constitutive model for the cohesive elements used for the simulation follows the traction-separation law in the commercial finite element software ABAQUS. The fracture criterion for the cohesive elements is given as;
(1)
where (GI)C and (GII)C are the mode I and mode II components of the strain energy release rate at fracture, GIC and GIIC are the critical fracture energies for pure modes, and p and q are exponents.
Since and , where for plane stress conditions and
for plane strain conditions, the related expression for the stress intensity factors can
be written as:
1)()(
=
+
q
IIC
CII
p
IC
CI
G
G
G
G
II GEK .*= IIII GEK .*= EE =*
)1/( 2* −= EE

3
(2)
The exponents may be chosen to form the best fit of experimental data or may be prescribed based on an assumed relationship. For example, if the critical fracture energy is assumed to depend only on the total fracture energy (GT = GI + GII) and not the mode mixity, p = q = 1, and GIC = GIIC. This results in squaring the stress intensity terms in Eq. (2), which being proportional to stress, provides a fracture criterion that is similar to the von Mises yield criterion. If p and q are both greater than, or equal to unity, the resulting criterion implies that the mixed mode fracture energies will be larger than the minimum of GIC and GIIC. In that case, the use of the minimum pure mode fracture energy (Min (GIC, GIIC)) would be conservative for design purposes [3].
The elastic and thermal properties of the concrete slab, reinforcing steel bar, and subbase layer assumed for the finite element modeling are listed in Table 1. Experimental observation shows that a certain amount of bonding develops while the concrete is in a fresh state to the subbase material [11]. Therefore, the bond between the concrete slab and the subbase layer breaks somewhere in the subbase material. Such observation leads to this conclusion that one can assume that the bond strength between the concrete slab and the subbase layer can be roughly considered same as the ultimate shear strength of the subbase layer.
Table 1. Selected Material Properties for Concrete, Subbase, and Steel
Material Property Value
Concrete
Density (kg/m3) 2400
Compressive strength (MPa) 19.1
Tensile strength (MPa) 2.89
Modulus of elasticity (MPa) 34000
Poisson’s ratio 0.2
Coefficient of thermal expansion (/oC) 11.3×10⁻⁶
Subbase
Density (kg/m3) 2100
Modulus of elasticity (MPa) 3500
Poisson’s ratio 0.2
Compressive strength (MPa) 1.2
Tensile strength (MPa) 0.11
Steel
Density (kg/m3) 7830
Modulus of elasticity (MPa) 210000
Poisson’s ratio 0.3
Coefficient of thermal expansion (/oC) 10.8×10⁻⁶
1)()(
22
=
+
q
IIC
CII
p
IC
CI
K
K
K
K

4
The boundary conditions used for the simulation of CRC pavement structures is illustrated in Figure 3. The length of the prism is half of the actual slab’s length and then, the boundary conditions is symmetric with respect to the x and y axes. The restrictions on x and y directions are shown in view B and view A, respectively. It is also seen according to view B that the reinforcing steel bar is restricted in x direction at the slab’s joint. There was no restriction on the area covered by the cohesive zone elements. Finite element simulations showed that applying any restrictions on the cohesive zone resulted in a significant increase of run time. Therefore, cohesive layer was not restricted in any direction. It is worth mentioning that Figure 3 illustrates a general boundary conditions which can be employed for any rigid pavement structure.
The 3D finite element solver allowed the initialization of the model to any state of deformation and stresses that may be used to represent built-in lift-off as may occur soon after construction. This is done by specifying an equivalent initial thermal and moisture gradient profiles through the slab thickness and running the model in a dynamic relaxation mode that builds up the static stresses and displacements at the specified parts of the model. After full dynamic relaxation, the model becomes deformed and loaded with stresses that simulate the state of residual stresses in a recently cured concrete pavement. A data file containing the distorted model becomes the starting file to which any magnitudes and configurations of the environmental loading are applied prior to its reprocessing in a static or dynamic mode as illustrated by the flowchart in Figure 4. In other words, the three-dimensional finite element simulation is performed at different steps to represent displacements in the concrete slab during a specific period of time.
Figure 3. Boundary conditions used for 3D finite element simulation of CRC pavement.

5
1.1.2. Results
Figure 4. Suggested 3D finite element simulation procedures.
Figure 5, illustrates deformation of the prism shown in Figure 3, subjected to a typical environmental load. The deformed shape of the mid plane is also depicted to show bond slip between the reinforcing steel bar and the concrete. Vertical and horizontal displacements are tracked at three points of the slab edge: A) top of the slab, B) bottom of the slab, and C) at the interface of reinforcing steel bar and the concrete slab. Since the reinforcing steel bar is restricted at its end, the horizontal displacement at point C represent bond slip between the concrete and the reinforcing steel bar. The peak shear strength between the concrete slab and the reinforcing bar is assumed to be τb = 5 MPa , and steel bar #6 (ds = 0.75in = 1.905cm) was used for all simulations. The zero thickness cohesive zone models are utilized for simulation of the reinforcing steel bar/concrete slab, and concrete slab/ subbase interfaces. It is expected that all dimensions shown in Figure 2 influence on the slab displacements. The pavement dimensions are selected as: tbase = 5cm, L (cm) ϵ {45.7, 76, 137}, and Z0 (cm) ϵ {13.75, 15, 16.25}.The slab thickness and width are considered as fixed values of t0 = 25cm, and b = 10.8cm, respectively.

6
Figure 5. Mesh pattern for deformed CRC pavement, as well as the deformed mid plane.
The interface between concrete slab and subbase layer were modelled using cohesive elements following traction separation law with failure parameters of (p = q) ϵ {0.5, 1, 1.5, 2, 2.5}. A one-step constant linear loading configuration through slab thickness is assumed for the environmental loads as ΔT = Tbottom – Ttop = +10oC, and ΔRH = 10%. In addition to the temperature difference, a constant temperature profile of T = +10oC is also given as an input to the model. The linear strain profile induced by moisture gradient was then obtained using Eq. (1).
(1)
The slab weight was modelled as a body force throughout the slab in which the density of concrete slab and the reinforcing steel bar were assumed 2400kg/m3, and 7830 kg/m3, respectively. Figure 6 show variation of displacements at points A, B, and C versus normalized slab length (L/b; where b = bar spacing), in horizontal and vertical directions. In Figure 6, the location of the reinforcing steel bar is fixed as Z0 = 15cm. As seen from Figure (6a) the horizontal end movement increases as the crack spacing increases. This observation can be explained easily since the greater the slab length the greater the shrinkage displacement for a same amount of shrinkage strain. For vertical displacement, except for point B which is affected by the interface, it can be seen that the slab lift-off increases as crack spacing increases up to a critical crack spacing. After the critical crack spacing, the slab tends to move downward due to the slab weight. However, the variation of the vertical displacement versus crack spacing is negligible. In the present model, the concrete slab is bonded to the subbase layer. Indeed, the effect of crack spacing on the vertical displacement must be more significant for lower bond interfaces.
3
100
)(1.
−−=
zRHsh

7
Figure 6. Variation of displacements at the slab edge versus normalized crack spacing: (a) horizontal displacement, (b) vertical displacement. p = q = 2, Z0 = 15cm, and tbase = 5cm.
The effect of location of the reinforcing steel bar on the end movements is shown in Figure 7. The crack spacing is fixed as L = 76cm. In the current model, since the temperature of the concrete slab is assumed to be lower on its top than its bottom (which happens during nighttime), the concrete slab tends to move upward and thus, the upper and lower parts of the slab are under tension and compression, respectively. The lower part of the concrete slab is also constrained by the interface bond and therefore, one can decrease slab lift-off by moving the reinforcing steel bar to the upper part of the slab (increasing Z0), which resists the moment induced by the environmental load. Figure (7b) proves this hypothesis as can be seen that the vertical displacement dramatically decreases by increasing Z0. The effect of location of the reinforcing steel bar on the horizontal end movement is expected to be negligible since changing Z0 does not make a significant change on the amount of shear stress between the reinforcing streel bar and the concrete slab, as seen in Figure (6a).
Figure 7. Variation of displacements at the slab edge versus normalized reinforcing steel bar location: (a) horizontal displacement, (b) vertical displacement. p = q = 2, L = 76cm, and tbase = 5cm.

8
The bond strength between concrete slab and the subbase layer controls separation of the slab from the subbase. It is expected that the higher bond strength, the lower slab lift-off. However, in pavement design, a strong bond strength is not always desirable. In other words, de-bonding of the concrete slab/subbase layer interface helps to release some energy induced by the environmental loads and prevents concrete slab from structural cracking. Low bond strength, on the other hand, increases end movement in CRC pavements leading to deterioration of slab edges due to traffic loads and erosion. That means the bond strength should be considered as an optimized parameter in designing CRC pavements. Figure 8 depicts variation of the interfacial fracture loci versus parameters p and q. The area surrounded by each curve and the coordinate axes represents the safe zone, and behind this area, the interface crack propagates. It is seen that as the values of p and q decrease the safe zone gets more constricted and the fracture criterion presents more conservative predictions. However, according to the literature, for many of the interface bonds available in different engineering applications, p and q parameters fall within the range of 1.5 < (p, q) < 2 (3). These parameters are fixed as p = q = 2 when investigating effect of other parameters.
Figure 8. Variation of the power law fracture envelope with different values of p and q (it is assumed p = q).
Figure 9 illustrates variation of the horizontal and vertical displacements at the edge of the concrete slab versus parameters p and q. It can be seen that both horizontal and vertical displacements dramatically decrease by increasing parameters p and q. In fact, the lower values of p and q means lower de-bonding threshold as shown in Figure 9 meaning the concrete slab has more freedom to move.
A positive temperature difference between the top and the bottom surfaces of the concrete slab (∆T = Ttop – Tbottom > 0) during daytime causes the slab edges to curl downwards while a negative temperature difference during nighttime results in the upward curling of the concrete slab. Since

9
concrete can recover its original shape after the effects of temperature variation are removed, the curling due to temperature variation from daily or seasonal weather condition can be considered as a transient component of slab curvature behavior due to environmental loading. Curling can create not only slab deformation but also internal stresses in the absence of traffic loading. Although the temperature profile through the depth of the concrete slab is nonlinear. The concept of an equivalent linear temperature profile, which simplifies calculation of the temperature induced stresses, is widely accepted as a convenient simplification. According to this concept, the total nonlinear temperature profile in a slab can be thought of as having three components: (a) uniform component causing axial expansion or contraction, (b) a linear component causing bending of pavement slab, and (c) a zero – moment nonlinear component that remains after subtraction of the uniform and linear component from total nonlinear components. It is shown by Yu et al [16] that the zero– moment nonlinear temperature component does not have a significant influence on the calculation of curling displacements. That means, any nonlinear temperature profile can be converted to its equivalent linear profile to be used by pavement engineers for designing CRC pavements.
Figure 9. Variation of the horizontal and vertical displacements at the edge of the concrete slab versus parameters p and q.
Figure 10 shows the effect of linear temperature difference on the displacements in concrete slab edge. It is seen that both horizontal and vertical displacements are dramatically influenced by the temperature gradient throughout the concrete thickness. The end movement in CRC pavement increases as the temperature difference increases. It should be noted that Figure 10 is plotted for the nighttime temperature conditions in which the top surface of the slab is cooler than its bottom surface.

10
Figure 10. Variation of displacements at the slab edge versus different temperature differences, ∆T: (a) horizontal displacement, (b) vertical displacement. p = q = 2, Z0 = 15cm, L = 76cm, and tbase = 5cm.
The moisture gradient is influenced by the daily and seasonal weather conditions and the pavement material such as permeable base and poor drainage soils (14). The variation of moisture gradient through the thickness of the concrete slab can be expressed as Eq. (2):
(2)
where, parameter n’ controls the moisture profile throughout the slab thickness. Other parameters
are assumed as: , and, . It is well-known that the RH
profile is nonlinear through a concrete slab pavement exposed to the environment on its top. In the current analysis, in order to explore the effect of RH difference (ΔRH) throughout the slab, it was
assumed n’=3, and the bottom surface is considered as fully saturated (where ).
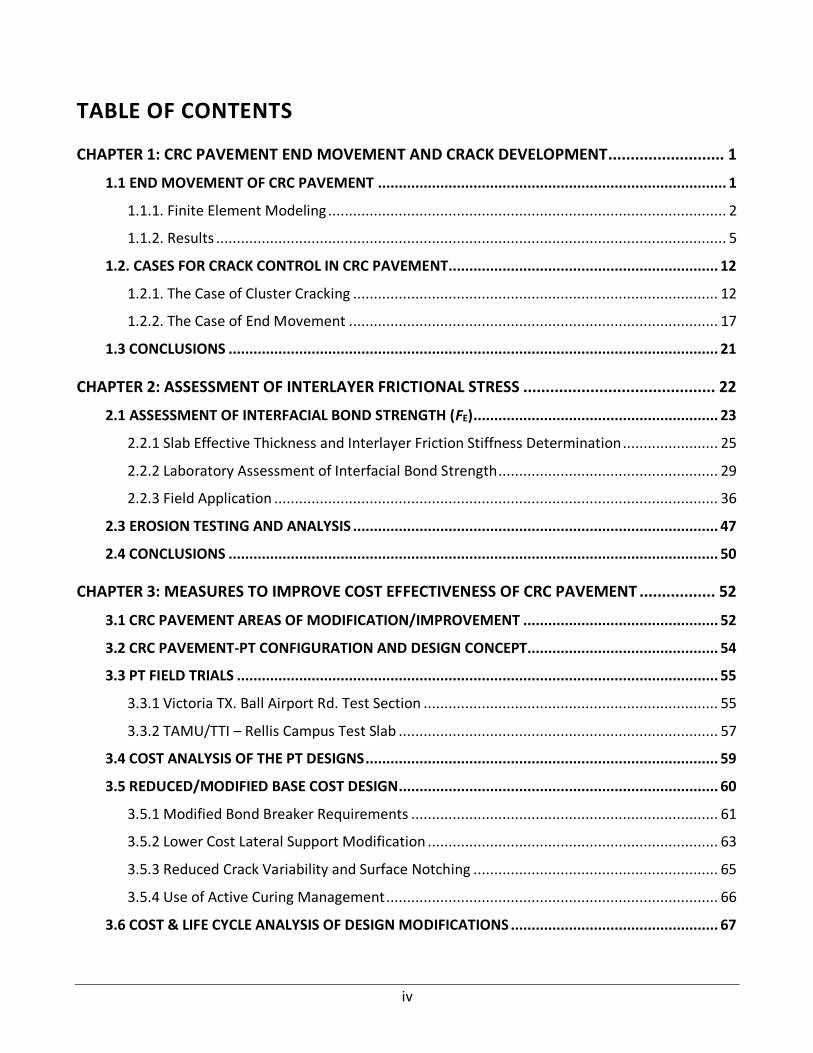
Figure 11 illustrates displacements at the edge of the concrete slab versus different values of RH difference (ΔRH). It is seen that horizontal end movement is more influenced by the moisture gradient than the vertical end movement. This can be explained by this fact that the moisture profile is one of the primary sources of concrete shrinkage which leads to significant change in slab length in the horizontal direction. However, because the concrete slab is restricted at the bottom, the moisture gradient slightly influences on vertical displacements, as shown in Figure (11b).
−−+=
n
topbottomtopt
zRHRHRHzRH )(1)()(
0
%10=−= topbottom RHRHRH %90=topRH
%100=bottomRH
11
Figure 11 Variation of displacements at the slab edge versus different values of RH difference (ΔRH): (a) horizontal displacement, (b) vertical displacement. p = q = 2, Z0 = 15cm, L = 76cm, and
tbase = 5cm.
The effect of different parameters on the end movements in CRC pavements was studied using three dimensional finite element cohesive zone modeling. The findings obtained in this report can be summarized as the following:
• The dimensions of the CRC pavement remarkably influence end movements in concrete slab. As the crack spacing increases, the horizontal end movement increases, however, the vertical displacement component does not change significantly. The location of the reinforcing steel bar has a considerable effect on the vertical end movement, but has almost no effect on the horizontal displacement of the slab edge.
• The role of bond strength on the end movements in concrete slab was investigated for the first time utilizing a sophisticated method employing the cohesive zone approach. Using the power-law fracture criterion, it was shown that the bond strength significantly influences the end movement in concrete slab. The role of power-law fracture criterion exponent, on the prediction of the horizontal and vertical displacements in CRCP was also explored. The results of this part of the report emphasizes the necessity of conducting fracture tests for evaluation of the bond strength between the concrete slab and the subbase layer for the pavement design.
• The effects of temperature and moisture gradients on the horizontal and vertical end displacements in concrete slab were explored. It was shown that the temperature gradient influences end movements in both horizontal and vertical directions, but the moisture gradient has a more effect on the horizontal displacements than the vertical component.
12
1.2. CASES FOR CRACK CONTROL IN CRC PAVEMENT
Two cases warranting the need for crack control in CRC pavement discussion are subsequently discussed both of which have relevance to the previous discussion. One pertains to the occurrence of short cracking intervals (which may occur in groups or clusters) which has been recognized as an undesirable feature for a cracking pattern to exhibit, especially in combination with eroded support conditions which all subbase types are eventually subjected to. It is of interest to characterize the occurrence of cluster-cracking in a CRC pavement system in terms of the percentage frequency of cracks occurring in clusters. Generally speaking, cluster cracks occur within a distance of 0.3, 0.6, or 0.9 m (1, 2, or 3 ft.) intervals. The probability of two, three, or four consecutive cracks occurring within a range of distances can be chosen as a basis to evaluate the evidence of cluster cracking within a particular pavement segment.
Tayabji and Zollinger [15] suggested a measurement of cluster cracking manifest by a particular crack pattern called the cluster ratio. The cluster ratio can be found from dividing the crack distance interval for 3 consecutive cracks based upon doubling the crack interval distance associated with any probability along the curve for 2 consecutive cracks by the crack location (at the same probability) corresponding to the curve associated with 3 consecutive cracks and subtracting this quantity from one as shown below:
𝐶𝑙𝑢𝑠𝑡𝑒𝑟 𝑟𝑎𝑡𝑖𝑜 = 1 −2𝑥1
𝑥2
where x1 and x2, are the crack distant intervals for 2 and 3 consecutive cracks, respectively. An additional factor appears to be the effect of transverse steel reinforcement. The abrupt change in the rigidity of concrete/steel interface is known to cause stress concentrations leading to crack development.
1.2.1. The Case of Cluster Cracking
An example of cluster cracking mapped from a crack survey section of 10.5 inch CRC pavement on IL Route 390 Tollway near Itasca, IL is shown in Figure 12. The crack survey indicated that cluster cracking occurred at intervals of approximately 250 ft. As seen in the Figure 12, the clusters consisted of a combination of transverse and Y-cracks over a length of 529 ft. The survey was facilitated by ultra-sonic tomography which indicated that some of the cracking propagated along the transverse steel bars. The dash lines indicate transverse reinforcing steel locations.
As shown in Figure 12, the pavement was 28 ft. wide which included a 2 inch of Warm Mix Asphalt (WMA) subbase. The third and fourth base layers were 4 inches of a Cement Stabilized Base (CTB) and Granular Subbase (GSB) respectively. The longitudinal reinforcing steel was distributed to be #6 at 7" c/c, whereas the transverse reinforcing steel was distributed to be #4 at 48" c/c. Due to time-consuming, a strip of 5" wide was only considered, and that presents the interior case whereby the strip will be fully restrained from both sides. Even though the Tollway has no surface notches, surface notches were made at certain intervals in order to investigate their efficiency to eliminate the clusters. Furthermore, it is pointed out that the symmetry of the road provides us with a mathematical justification for considering one half of the length in the analysis.

13
Figure 12. Cluster cracking in IL Route 390 Tollway near Itasca, IL.
Continuously Reinforced Concrete (CRC) pavement is designed to naturally develop a pattern of transverse cracks at certain intervals, and these cracks serve as contraction joints. Whether a joint occurs as a random or a controlled crack, its intended purpose is to possess high load transfer and stress relief characteristics that minimize the potential for fault or spall development and eventual loss of ride quality. Due to the features of the cracking pattern, CRC pavements have a high potential to maintain a relatively low state of stress under load and provide excellent levels of performance as a result. Many of the initial cracks in CRC pavement form shortly after construction but the majority of the final cracking pattern forms within the first 1 to 2 years after construction. Furthermore, many initial cracks may not become evident at the pavement surface for several months after construction. A review of an FHWA study on CRC pavement summarized by Zollinger and Soares [20] identified some key factors influencing the development of the crack pattern previously discussed.
1.2.1.1 FEM Modeling
The finite element modeling (FEM) was configured to conduct an analysis to facilitate examination of the nature of the stresses that may contribute to the development of cluster cracking patterns with respect to the following features:
• Presence of transverse steel,
• Presence of surface notches, and
• The effect of subbase friction

14
Figure 13. Transverse and Longitudinal Boundary. Conditions.
Finite element software (ABAQUS) was used to carry out stress analysis due to subbase friction (fτ-e) and thermal induced stresses (assuming a theoretical maximum temperature of 38 °C and a uniform temperature profile) in the concrete (fn) and the steel (fs) as depicted in Figure 13.
Figure 13 also shows all layers of the strip were restrained in both the transverse and horizontal directions. Base, subbase, and subgrade layers were similarly restrained. However, the reinforced concrete layer was only restrained at one end to represent the mid-length of the pavement and free movement was allowed at the other end to represent the end of the concrete slab as it would occur at terminal transverse joint. The subbase layer was restrained in the vertical direction. Locations and directions of stress concentration in the CRC pavement are as shown in the figure are discussed later on. Even though CRC pavement is rarely constructed with surface notches, they were considered at certain intervals in order to investigate their efficiency in minimizing cluster cracking as well as the end movement associated with a terminal joint subsequently discussed.
1.2.1.1.1 Materials
For simplicity, linear elastic materials were considered for all the pavement layers. Table 2 gives information on the material properties used in the FEM analysis.
Since it was of interest to examine the effect of bonding or frictional stress between the CRC pavement and the base, different levels of restraint were considered. A laboratory test procedure was conducted on prepared samples of concrete bonded to WMA base materials based on fracture modeling formulated by Mirsayar and Shia [11]; the procedure yields values of KI and KII which are taken components of the effective shear strength (𝑓𝜏−𝑐 being based on KI and 𝑓𝜏−𝐹being based on KII) of the interface between a concrete slab and the WMA base layer. Values of effective shear strength (fτ-e) of the interface between the base and the slab are presented in Figure 14 with respect to the

15
average of FWD derived qualities based a modification of a procedure presented by Zollinger et al (17) and Bari and Zollinger [18]. These values are presented in terms of a more conventional strength form as:
Table 2. Mechanical Properties of Pavement Layers
Materials E (psi) ν
Portland Cement Concrete (PCC) 4000000 0.2
Reinforcing Steel 29000000 0.28
Warm Mix Asphalt (WMA) 450000 0.35
Cement Stabilized Base (CTB) 120000 0.35
Granular Subbase (GSB) 35000 0.35
𝑓𝜏−𝑒 = 𝑐𝑜𝑠2𝜃(𝑓𝜏−𝑐 + 𝑓𝜏−𝐹) = 𝑐𝑜𝑠2𝜃(𝑓𝜏−𝑐 + 𝑁𝜎𝑡𝑎𝑛(∅𝐹))
Figure 14. Comparison of Field and Lab Results of Effective Interfacial Resistance.
where
𝑓𝜏−𝑐 = Cohesive shear strength of the slab/base interface
𝑓𝜏−𝐹 = Sliding or frictional strength of the slab/base interface
𝑁𝜎 = Normal stress to the slab/base interface
𝛷𝐹 = Base layer friction angle
The suggestion being that KII relates to the mechanical frictional resistance of the slab/base interface.
0.00
20.00
40.00
60.00
80.00
100.00
2" WMA/4" CTB
Ave
fb
(psi
)/C
oF
FWD/Lab
Lab fb
Ave FWD fe
µF

16
1.2.1.1.2 Analysis
Based on the aforementioned geometrical, mechanical, and contact properties, a geometrically linear analysis was performed assuming small deflections. Variation of the horizontal tensile stress in the CRC layer is the particular interest in the analysis. The resulting stress patterns should be useful to suggrest locations of crack initiation and the direction of propagation.
Figure 15. Tensile Stress near Terminal End in CRC Pavement.
Figure 16. Shear Stress along the Interlayer of CRC Pavement.
Previous research with surface notching of CRC pavement [20] infers its capability to eliminate cluster cracking. The implication is that transverse cracking in CRC pavement is likely surface initiated particularly since this is where the effects of drying shrinkage is initiated. In this regard, some interesting comparisons can be drawn among the computed stresses shown in Figure 15 at the surface notches (σn), the stress at the slab bottom (σbot), the shear stress at interface of the CRC pavement and the base layer (τ), and at the transverse reinforcement (σT). Within the vicinity of the free end, the tensile stress at the tip of the surface notches (σn) and at the transverse steel (σs) is less than at the shear stress along the interface (τ shown in Figure 16) between the slab and base of the CRC (in this case within the first 15 ft. from the free end or terminal joint); clearly, where the restraint conditions do not exist (such as when the cohesive component of the effective shear strength
0
250
500
750
1000
1250
1500
0 40 80 120 160 200 240
Ten
sile
str
ess
(psi
)
Distance from the free end (ft)
σ T σ bot σ n
-40
-30
-20
-10
0
10
20
30
40
0 40 80 120 160 200 240
τ (p
si)
Distance from free end (ft)

17
between CRC and WMA layers has been exceeded) the horizontal stress (σ) in this region is insufficient and the likelihood of transverse crack formation is small. Hence, unrestrained thermal strain and displacement dominate. Following this region there is a significant decrease in shear stress as illustrated in Figure 16.
1.2.2. The Case of End Movement
Typically, a transition joint is required to accommodate the end movements (which can range up to 1 inch annually) in a CRC pavement structure to maintain rideability, and minimizing the potential for drainage-related issues to be a factor on performance. However, moving away from the free end invokes greater lengths of restrained CRC pavement (at a distance of approximately 40 ft. in Figure 15) where both the horizontal confinement of the CRC layer and the stress at the slab bottom (σbot) increase leading to greater horizontal stress with distance from the free end within the concrete layer. It is realized that the horizontal stress level at the level of the longitudinal steel reinforcement within the concrete layer fluctuates at each induced crack location whether at a transverse bar, a surface notch location or otherwise where the same pattern in stress buildup occurs between each transverse crack [13, 20].
The objective of a transition involving segments of CRC pavement is to maintain uniformity of both support and cracking across the transition segment. Performance-wise, one function of reinforcing steel in CRC pavement is to maintain the stiffness and tightness of transverse cracks, as well as, for instance, at transverse header joints (as one type of transition). The capability of maintaining the necessary aggregate interlock and sufficient load transfer may depend upon the use of additional deformed steel (of a larger diameter) or smooth dowel bars as part of the transition. For instance, in order to supplement the load transfer capability of the reinforcing steel, a certain amount of doweling may provide a sufficient level of load transfer in a CRC to CRC transition, subsequently elaborated.
Crack formation in CRC pavement occurs in 2 phases: one related to curling and warping and the other to latent shrinkage and temperature induced strains [20, 25]. The data in Figure 15 demonstrates that tensile stress at surface notches (σn) are considerably higher than tensile stress at either the transverse bar or at the slab/base interface once the slab becomes fully essentially due to the frictional restraint of the base. Although surface notches have been shown to be effective to control cluster cracking [20], unless sufficient restrain exists, even notching is not effective in inducing cracking in CRC pavement near a free end as represented at a terminal joint.
Considering the concrete strength to be 400 psi, the tensile stress at the first three surface notches is less than that required to induce cracks. Accordingly, by changing the restraint characteristics of CRC at the terminal joint in order to increase the tensile stress at the first 3 surface notches as follows:
• Changing the cover of the longitudinal steel; it is expected that the tensile stress increases when reducing the steel cover.
• Increasing steel percentage or reducing the reinforcing bar size is also expected to increase the tensile stress.

18
Figure 17 shows the effect of cover change on the tensile stress in the pavement section. The figure shows that reducing cover increased the tensile stress slightly. Following that, the properties of steel bars were changed. The FE analysis shows that when increasing steel percentage 25%, the tensile stress increased about 30%. Hence, it is still not possible to reach 400 psi tensile stress for the first three surface notches; a special terminal design needs to be considered for a distance of 20 feet starting from the free end.
Figure 17 Effect of Cover Change on the Tensile Stress in a CRC Pavement Section.
If sawcut joints are induced at 10, and 20 feet from the free end then sufficient restraint can be realized to induce cracks at 4 foot intervals if the slab are reinforced the same as the CRC pavement. These joints will need to be sawcut to a depth of 2 in. in order to induce cracking as well as being doweled to add sufficient stiffness to each of the joints. The wider movement at these joints can be accommodated since they are dowelled. As shown in Figure 18, the dowels can be placed as a separate layer in line with the transverse steel layer. Placing the dowelled joints at 10 foot intervals should provide sufficient length to induce the necessary curling and warping stress to induce a crack at the sawcut.
𝜎𝑐&𝑤 = 𝐶𝐸𝛼∆𝑇
2
where
= Coefficient of thermal expansion
C = Bradbury coefficient (4)
= Radius of relative stiffness = √𝐸ℎ3
12 (1−𝑣2)𝑘
4
k = Modulus of sugrade reaction
0
250
500
750
1000
1250
1500
0 40 80 120 160 200 240
Ten
sile
str
ess
at s
awcu
ts (
psi
)
Distance from the free end (ft)
Cover = 4" Cover = 2"

19
The transition in Figure 18 includes two reinforced slabs (with reinforcement at the same level as the main CRC pavement) jointed at 10 foot intervals effectively lengthening the distance between the free end and the beginning of the restraint in the CRC pavement. Starting from a distance of 20 ft from the free end, 1 in surface notches can be made at at the expected mean cracking spacing; the notches placed at the mean interval should result in high tensile stress exceeding the concrete strength enough to induced cracks.
Figure 18. Plan View of Terminal End/Header Joint Transition.
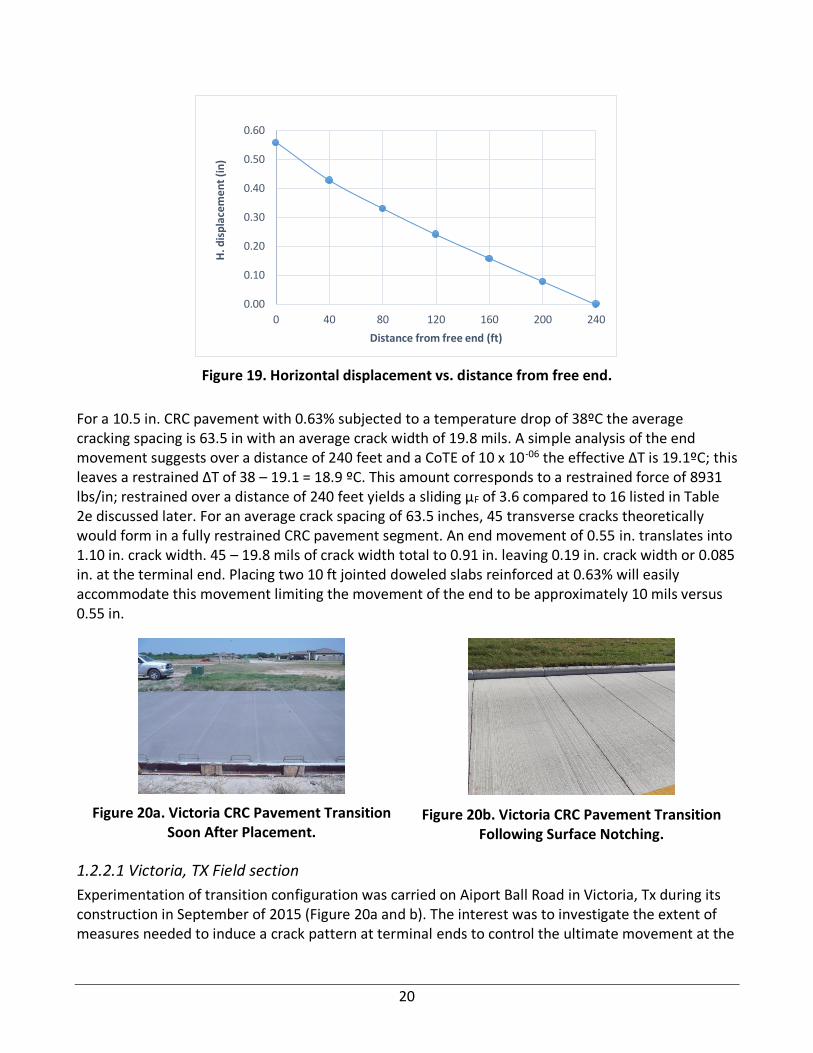
Analysis related to the end movement at a terminal joint Figure 19 shows the horizontal displacement with distance from the free end of the pavement assuming a solid pavement section 240 feet in length. The figure shows a maximum horizontal displacement – at the free end of about 0.55 inches and then decreases gradually to zero at a length of CRC pavement of approximately 240 ft.
20
Figure 19. Horizontal displacement vs. distance from free end.
For a 10.5 in. CRC pavement with 0.63% subjected to a temperature drop of 38ºC the average cracking spacing is 63.5 in with an average crack width of 19.8 mils. A simple analysis of the end movement suggests over a distance of 240 feet and a CoTE of 10 x 10-06 the effective ∆T is 19.1ºC; this leaves a restrained ∆T of 38 – 19.1 = 18.9 ºC. This amount corresponds to a restrained force of 8931 lbs/in; restrained over a distance of 240 feet yields a sliding µF of 3.6 compared to 16 listed in Table 2e discussed later. For an average crack spacing of 63.5 inches, 45 transverse cracks theoretically would form in a fully restrained CRC pavement segment. An end movement of 0.55 in. translates into 1.10 in. crack width. 45 – 19.8 mils of crack width total to 0.91 in. leaving 0.19 in. crack width or 0.085 in. at the terminal end. Placing two 10 ft jointed doweled slabs reinforced at 0.63% will easily accommodate this movement limiting the movement of the end to be approximately 10 mils versus 0.55 in.
Figure 20a. Victoria CRC Pavement Transition Soon After Placement.
Figure 20b. Victoria CRC Pavement Transition Following Surface Notching.
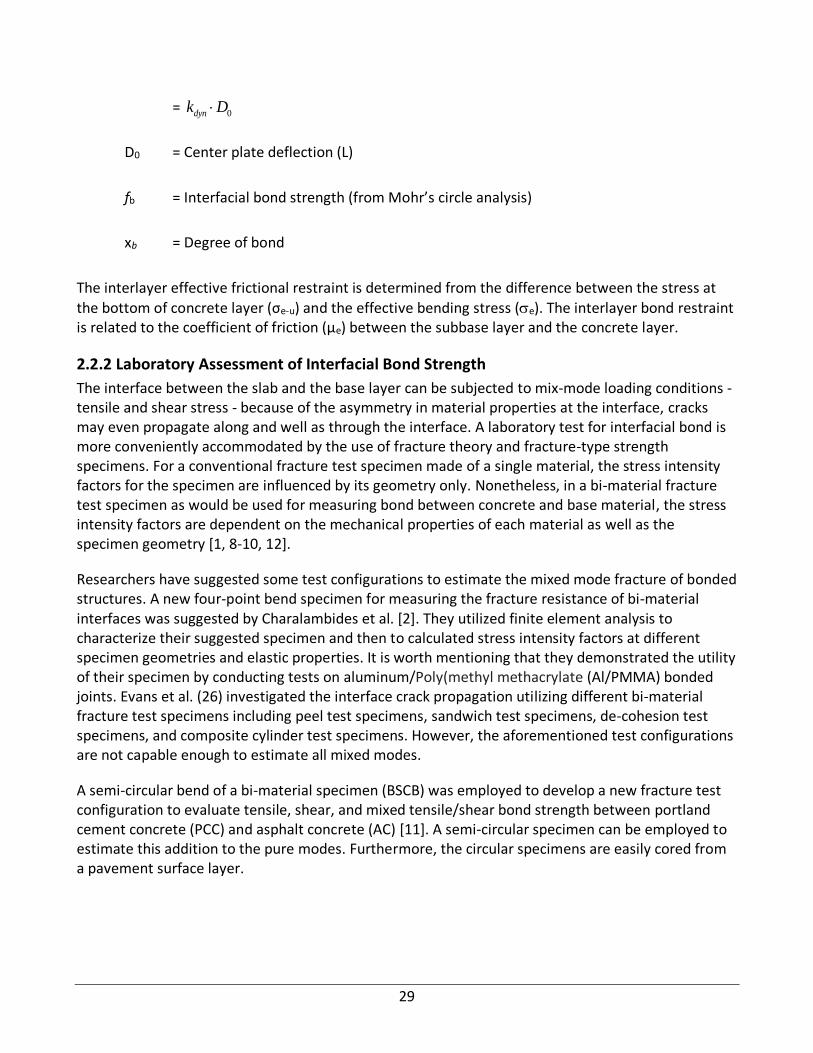
1.2.2.1 Victoria, TX Field section
Experimentation of transition configuration was carried on Aiport Ball Road in Victoria, Tx during its construction in September of 2015 (Figure 20a and b). The interest was to investigate the extent of measures needed to induce a crack pattern at terminal ends to control the ultimate movement at the
0.00
0.10
0.20
0.30
0.40
0.50
0.60
0 40 80 120 160 200 240
H. d
isp
lace
me
nt
(in
)
Distance from free end (ft)

21
end. Previous research at terminal ends in CRC pavements suggested that surface notching alone would not be sufficient to induce cracking; therefore, angle iron was placed at 24 inch intervals along with surface notching which proved to be effective to induce cracking. This transition also proved subsequently to control or limit the magnitude of the construction joint adjacent to the transition as shown in the side by side comparison shown in Figure 21. Limiting the movement at the terminal end will limit future maintenance at the construction joint.
Figure 21. Notched Transition Joint (left) versus the Conventional Transition.
1.3 CONCLUSIONS
With respect to CRCP terminal design the following conclusions can be made:
1. A transition design for CRC pavement terminals or header joints, as shown in Figure 18 should be adopted in order to control excessive movements at the terminal ends.
2. Restraint conditions within a CRC layer must be sufficiently high in order to induce transverse cracking at acceptable intervals; and that such restrain occurs at a length of more than 40 ft. from the free end of the pavement. This length may vary depending on the shear strength of the interface.
3. Use of surface notches at an early concrete age spaced at short intervals is an effective way to not only control cluster cracking but to induce cracking near the transition associated with CRC pavement header joints or end terminals.
4. A variety of combinations can be used to induce cracking at sawcut notches including depth of cover, percent of reinforcement, and the size of the reinforcement.

22
CHAPTER 2: ASSESSMENT OF INTERLAYER FRICTIONAL STRESS
Although, conventional slab theories inherently ignore it, bond between a concrete slab and its substrate has been a key component in the stiffness and longevity that a slab displays when subjected to passing loads. Bond has long been thought to be separate from sliding friction in that it mainly resists tensile forces. However, upon careful reflection it’s clear that bond also has shear as well as sliding friction components. Interfacial bond for certain base types such as those made from asphalt concrete can actually serve to maintain contact between a slab and a base as long as the tendencies for the slab to curl and warp are not too great. Maintenance of the slab/base interfacial contact helps to preserve the adhesive nature of the bond which affords the interface the capability to resist both the tensile and shear forces that result from loads applied to a pavement structure. Furthermore, interfacial bond is comprised of both chemical and mechanical components; adhesion being the chemical and sliding friction being the mechanical portion. The degree of either one or both acting on the interface determines the extent a slab will be either bonded, unbonded, or partially bonded.
It is important to model bond in design since it has a significant effect on performance as the amount of bond effects how thick the slab effectively is. In other words, a slab bonded to an HMA layer is effectively thicker than a slab that is unbonded to the same layer. However, the Pavement ME program presently only represents the extremes of the effective-thickness spectrum as either bonded or unbonded thicknesses; experience with Pavement ME software calibration has reinforced that most slabs are likely partially bonded especially along slab edges and corners where most of the change in bond occurs during the life time of a concrete slab. The cause of the variation in bond in these areas is principally from two effects:
1. Differential slip between the slab and the base layer due to loading, and
2. Vertical separation of the slab from the base layer due to climatic effects.
Vertical separation essentially eliminates the chemical component from the interfacial resistance however, the friction component is still in play whenever the bottom of the slab comes in contact (due to climatic or external loading) with the surface of the base layer. Nonetheless, the probability that the chemical component will be diminished but can be expressed in terms of the degree of bond (xb) as:
xb = p u
b u
h h
h h
−
−
where
hb = bonded slab thicknesses
hu = unbonded slab thicknesses
hp = partially bonded slab thicknesses

23
As discuss further below, the quantities of hb and hu are calculated values and hp measured. In order to characterize or model the full range of bond (fe) strength including partially bonded conditions, it will be important to addresses chemical and mechanical components as:
fe = ( ) bbx f
where
fe = effective interfacial frictional resistance or bond strength = σ𝑣𝜇e
fa = adhesive bond
fs = mechanical or frictional bond
𝜇e = effective coefficient of friction
σ𝑣 = normal loaded pressure
%E = percent of erosion damage
2.1 ASSESSMENT OF INTERFACIAL BOND STRENGTH (FE)
When a load is placed on a rigid pavement – particularly near a joint or crack, the slabs on either side of the joint will deflect in the form of a basin. The deflected shape of the basin is a function of several variables, including the thickness and stiffness of the slab, the stiffness of the underlying materials (which is indirectly affected by the interlayer bond or frictional resistance), and the magnitude of the load. Other factors that affect the shape of the basin area are the thickness and types of subbase materials, nature of load transfer devices, the texture of the aggregate interlock, and the magnitude of joint openings.
Basin area gives an indication of the deflection profiles measured using FWD, and may be calculated from sensor deflections as [6]:
o 1 2 n-1 n
o
12Area = [D +2{D +D +........D }+D ]
2*D
where
Area = basin area, inches
Di = measured sensor deflection
N = number of sensor (at 0.3m (12 in) spacing) on one side of load plate minus one.

24
This area concept combines all measured deflections in the basin into a single parameter. The area being determined is essentially ½ of the cross sectional area of the deflection basin taken through the center of the load. Each deflection reading is normalized with respect to the maximum deflection Do. Thus the basin area has the units of length and is a function of the number and location of the sensors. For any given sensor arrangement, a relationship between the basin area and the radius of
relative stiffness () exists in concept as illustrated in Figure 22. Figure 22 forms the basis of the representation of different load transfer conditions and stiffness conditions in an existing slab.
Figure 22 Variation of deflection Basin Area with [17].
A concrete pavement slab deforms under load depending upon the position, magnitude, and area of contact of the load on the pavement surface. The resistance to deformation depends upon the stiffness of the supporting medium, the pavement thickness, opening of the joint or crack, as well as the interlayer bond. One parameter that characterizes this combined resistance to deformation is
called the radius of relative stiffness () and it depends upon the above characteristics. As previously noted, the relative stiffness is defined by the following equation:
442
3
)1(12 k
D
k
Eh cc =−
=
where
Ec = concrete modulus of elasticity (FL-2)
hc = slab thickness (L)
ν = poisson's ratio
k = foundation modulus (FL-3)
0.40
0.50
0.60
0.70
0.80
0.90
1.00
1.10
1.20
1.30
0
10
20
30
40
50
60
70
0 20 40 60 80 100 120
Dim
en
sio
nle
ss B
A
Bas
in A
rea
(in
)
Radius of Relative Stiffness (in)
Basin Area Dimensionless BA

25
In terms of load transfer, representations of load transfer factors and mechanisms are reflected in
measured -values as determined by an FWD basin area. It is also noted that the principle pavement distress types associated with a crack can be tied to reduction in them, as related to the loss of support through subbase erosion or faulting in jointed concrete pavements.
Many studies have clearly indicated the important factors of load transfer which continually reminds us of a need for a systematic relationship between them and the pavement design process. Such a relationship will be subsequently described, as well as details of a load transfer model that addresses both dowel bars (or similar load transfer devices) and aggregate interlock mechanisms. Elements of the following approach [28] were incorporated into the latest version of the AASHTO Pavement ME software.
2.2.1 Slab Effective Thickness and Interlayer Friction Stiffness Determination
Field evaluation of concrete pavement using a Falling Weight Deflectometer (FWD) focuses on the loaded behavior of a joint in terms of slab deflections and deflection load transfer efficiency (LTEδ). Falling weight deflectometer (FWD) test results, provides a primary way of characterizing in-place conditions. Results of FWD testing may be described in part with respect to the plate deflection (Do) and the LTE. Load transfer efficiency may be defined as the deflection on the unloaded side of the joint divided by the deflection on the loaded side of a joint:
u
L
LTE %= 100
where
δu = unloaded deflection
δL = loaded deflection
The load transfer efficiency of a joint or crack has an important effect on the composite stiffness manifested by a concrete pavement, and therefore on the level of stress developed in the pavement structure.
Slab thickness and interlayer friction are components that have an indirect, yet important effect on slab stiffness particularly in the vicinity of a joint that can be demonstrated through consideration of slab bending behavior. This is accomplished through the application of theoretically sound, mechanistic structural evaluation concepts to slab behavior in the vicinity of a joint or crack. A rational characterization of this nature allows for consideration of the degree of bond or interlayer friction while under load on the overall joint stiffness.
There are two different extremes that will arise when considering friction effects on slab stiffness. The slab interface friction condition may range from bonded to unbonded. In the analysis of this range, the subbase is considered to be a part of the pavement system rather than part of the pavement support. Two-layer analysis may be used for an unbonded condition, whereas in a bonded

26
slab each layer is combined as one equivalent layer. In both cases the layers are combined to form a composite, single layer thickness.
The characterization of the composite slab bending moment (Me) (especially in the vicinity of a joint) effectively involves the composite sum of the bending moment within the concrete and the subbase layer. A variation of medium-thick plate theory suggests that the composite or partially-bonded bending stress (σe-p) in the composite section can be related to the wheel load stress of an unbonded slab (σe-u) where the frictional restraint (τf) afforded by the base layer as:
( )2 2
6 6
e p
e p e p e u f
h hM
−
− − −= = −
where
3 4 212(1 )dyn
e p e
c
kh
E− = −
and
ℓe = radius of relative stiffness corresponding to the basin area measured at the
slab edge or corner across a joint.
dynk =*
0
0
w P
d [26]
P = Wheel load (F)
d0 = Center plate deflection (L)
= Radius of relative stiffness (L)
*
0w =
21 1
1 ln 1.258 2 2
a a
+ + −
(center of slab loading)
A = loaded radius (L)
It is argued that e actually represents an in-place pavement stiffness at a joint as affected by the measured load transfer efficiency and the effective interlayer bond exhibited by the pavement
structural response. As such, the e term can represent a partially bonded condition where the
composite slab thickness (he-p) may be determined or associated with e as noted above. The partially bonded condition between the slab and subbase is created by a certain amount of slippage due to frictional restraint that is allowed to occur under load, but still makes a contribution to the load

27
transfer or the stiffness at a joint. This restraint is also formulated relative to the degree of bonding (x – a parameter that ranges between zero and 1.0) as:
( ) ( )1e p e u e bh x h x h− − −= − + (3)
Equation (3) can be rearranged to solve for the degree of bonding as listed in equation (1). The value of he-p will vary between the conditions of unbonded to bonded - depending of course upon the degree of bond. The composite or effective thickness for fully bonded layers [6]:
132
11
3 321 2 2
1 2 21 2
1
212
2
na
e b
na
hx h
Eh h h
E E hh x h
E
−
−
= + + + − +
;
1 21 1 2 2 1
1 1 2 2
2 2na
h hE h E h h
xE h E h
+ +
=+
Effective thickness for unbonded layers:
13
3 321 2
1
e u
Eh h h
E−
= +
where
Ec = Elastic modulus of the PCC layer (FL-2)
he-b = Effective thickness of the bonded PCC layer (L)
he-u = Effective thickness of the unbonded PCC layer (L)
υ = Concrete Poisson’s ratio
E1 or E2 = Elastic modulus for layer 1 or 2 (FL-2)
h1 or h2 = Thickness for layer 1 or 2 (L)
= Radius of relative stiffness (L)
Figure 23 depicts the relationships between the partially bonded and unbonded effective thicknesses and stresses; using simple proportioning, the effective partially bonded stress (σe-p) can be found as:
21e u
e p e
e p
h
h −
−
−
= −
(4)

28
e-u
e-p
he-uhe-p
py
eUnbonded Section Transformed Section
Figure 23. Stress Pattern of Unbonded and Partially Bonded Transformed Section of a Concrete Slab [5, 17].
In order to formulate a relationship for the effective interlayer friction coefficient (μe – since it includes both mechanical and cohesive effects), the effective bonded bending stress (σe) is equated to the difference between the unbonded bending stress (σe-u) and the effective frictional restraint (fe) at the bottom of the slab as [17]:
e u e ue e u e e e v
e u e u
s P s Pf f
h h − −
−
− −
= − = − = − (5)
Equations 4 and 5 can be rearranged to develop an expression for the effective coefficient of friction (μe) determined from FWD data as:
e e u e b be
v v v
f x f
− −
= = =
where
σe = 2
2; (for FWD plate loading)e
e e e
e
s Ps a b c
h= + +
se = Effective dimensionless stress (for the composite pavement section)
P = Applied FWD load (F)
a, b, c = 0.0006, 0.0403, and -0.0002 (for FWD plate loading)
hc = Concrete slab thickness (L)
σv = Load induced vertical pressure (FL-2) (≈ 1.0 psi)
29
= 0dynk D
D0 = Center plate deflection (L)
fb = Interfacial bond strength (from Mohr’s circle analysis)
xb = Degree of bond
The interlayer effective frictional restraint is determined from the difference between the stress at
the bottom of concrete layer (σe-u) and the effective bending stress (e). The interlayer bond restraint is related to the coefficient of friction (µe) between the subbase layer and the concrete layer.
2.2.2 Laboratory Assessment of Interfacial Bond Strength
The interface between the slab and the base layer can be subjected to mix-mode loading conditions - tensile and shear stress - because of the asymmetry in material properties at the interface, cracks may even propagate along and well as through the interface. A laboratory test for interfacial bond is more conveniently accommodated by the use of fracture theory and fracture-type strength specimens. For a conventional fracture test specimen made of a single material, the stress intensity factors for the specimen are influenced by its geometry only. Nonetheless, in a bi-material fracture test specimen as would be used for measuring bond between concrete and base material, the stress intensity factors are dependent on the mechanical properties of each material as well as the specimen geometry [1, 8-10, 12].
Researchers have suggested some test configurations to estimate the mixed mode fracture of bonded structures. A new four-point bend specimen for measuring the fracture resistance of bi-material interfaces was suggested by Charalambides et al. [2]. They utilized finite element analysis to characterize their suggested specimen and then to calculated stress intensity factors at different specimen geometries and elastic properties. It is worth mentioning that they demonstrated the utility of their specimen by conducting tests on aluminum/Poly(methyl methacrylate (Al/PMMA) bonded joints. Evans et al. (26) investigated the interface crack propagation utilizing different bi-material fracture test specimens including peel test specimens, sandwich test specimens, de-cohesion test specimens, and composite cylinder test specimens. However, the aforementioned test configurations are not capable enough to estimate all mixed modes.
A semi-circular bend of a bi-material specimen (BSCB) was employed to develop a new fracture test configuration to evaluate tensile, shear, and mixed tensile/shear bond strength between portland cement concrete (PCC) and asphalt concrete (AC) [11]. A semi-circular specimen can be employed to estimate this addition to the pure modes. Furthermore, the circular specimens are easily cored from a pavement surface layer.
30
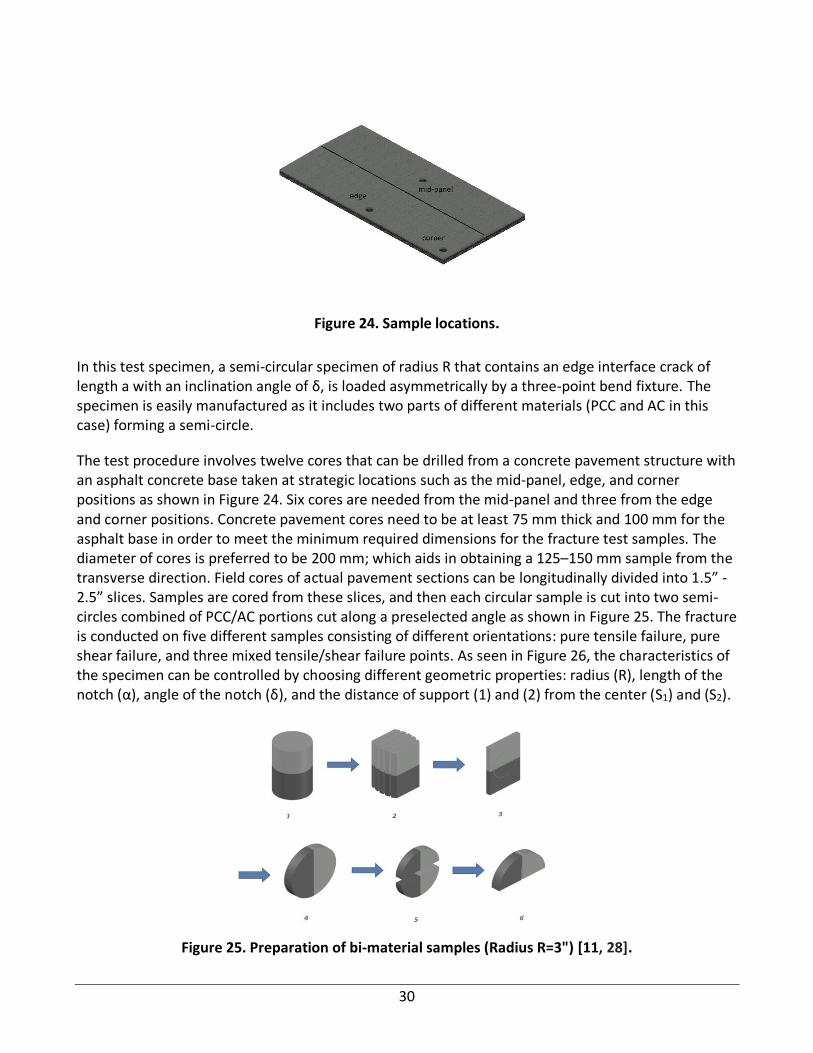
Figure 24. Sample locations.
In this test specimen, a semi-circular specimen of radius R that contains an edge interface crack of length a with an inclination angle of δ, is loaded asymmetrically by a three-point bend fixture. The specimen is easily manufactured as it includes two parts of different materials (PCC and AC in this case) forming a semi-circle.
The test procedure involves twelve cores that can be drilled from a concrete pavement structure with an asphalt concrete base taken at strategic locations such as the mid-panel, edge, and corner positions as shown in Figure 24. Six cores are needed from the mid-panel and three from the edge and corner positions. Concrete pavement cores need to be at least 75 mm thick and 100 mm for the asphalt base in order to meet the minimum required dimensions for the fracture test samples. The diameter of cores is preferred to be 200 mm; which aids in obtaining a 125–150 mm sample from the transverse direction. Field cores of actual pavement sections can be longitudinally divided into 1.5” - 2.5” slices. Samples are cored from these slices, and then each circular sample is cut into two semi-circles combined of PCC/AC portions cut along a preselected angle as shown in Figure 25. The fracture is conducted on five different samples consisting of different orientations: pure tensile failure, pure shear failure, and three mixed tensile/shear failure points. As seen in Figure 26, the characteristics of the specimen can be controlled by choosing different geometric properties: radius (R), length of the notch (α), angle of the notch (δ), and the distance of support (1) and (2) from the center (S1) and (S2).
Figure 25. Preparation of bi-material samples (Radius R=3") [11, 28].

31
In order to evaluate tensile/shear bond strength between the PCC and AC using interfacial fracture
mechanics concepts, it is necessary to define the geometry factors (YI) and (YII) relative to different
states of mode mixity (pure mode I, pure mode II, and mixed mode). Pure mode I is obtained when the surface of the interface is subjected to pure normal stress, whereas pure mode II is obtained when it is subjected to pure shear stress as seen in Figure 27.
Figure 26. Semi-circular specimen [8-10, 12].
Figure 27. (a) Pure Mode I, (b) Pure Mode II [21].
The finite element method (FE) is employed in the test to determine (YI) and (YII) using the finite
element software (ABAQUS). Unlike the single material specimens, geometry factors of the bi-material specimens are dependent on both the geometrical and material characterizations, where the elastic modulus (E) and Poisson’s (υ) ratio of the two materials affect the stress intensity factors
directly. Following that, the stress intensity factors (KI) and (KII) are calculated for different
geometrical conditions in the BSCB specimen using the following formulas.
𝐾𝐼 =𝐹
2𝑅𝑡√𝜋𝑎𝑌𝐼
𝐾𝐼𝐼 =𝐹
2𝑅𝑡√𝜋𝑎𝑌𝐼𝐼

32
where
t = specimen thickness (1.5-2.5 in)
For uniform uniaxial loaded plates
𝜎′ =𝐹
2𝑅𝑡𝑌𝐼 ≈ 𝑓𝑒
𝜏′ =𝐹
2𝑅𝑡𝑌𝐼𝐼 ≈ 𝑓𝐹 where 𝑓𝐹 represents the interfacial resistance to sliding friction of the base layer.
An alternate form of equation (1) based on analysis of Mohr’s Circle for bond strength (fb) can be
expressed as (Figure 28) with respect to xb (Note: 𝜏𝑧𝑥 = 𝑓𝑒 ; 𝑆𝑓 = 𝑓𝑏):
( )
( ) ( )
2
2 2
[ sin ]tan [1 sin ] tan
[cos ] [cos ]
e e eb
b
e e
F F
f f fx
f f r f
f f
f f f
= = =+ − − +
= =+ +
where
r = ( tan )cos ( )cos ( )cosF Ff f f f + = + = +
=3 2
2 2 5/2 2 2 1/2 2 2 1/2 2
3( ) (1 2 ) 5 2[ ]
2 4 ( ) ( ) [( ) ] 8
z x P h ha P
h a h a h a h h
+ + − + = − = + + + +
(Lab)

33
Figure 28. Mohr’s circle representation of the slab/base interface.
= σv (Field) (Note: Substitute σv for in the case of field evaluation)
1 = Vertical principle stress
3 = Horizontal principle stress
f = Cohesive shear strength of the base layer
= Angle of repose of the base layer
a = Distance to point load = 0
Using the above expressions, the degree of bonding and the interlayer bond resistance and be used to back-calculate values of fτ and for each interior FWD testing location.
2.2.2.1 Comparison of Laboratory and Field Test Results
A laboratory test program using the methods previously described to investigate the effects for four recently constructed test specimens consisting of four interface treatments between an asphalt base and concrete layers. The results of the laboratory testing is illustrated in Figure 29 where the interfacial treatments consisted of:
• No bond breaker (BB)
• 1 coat of resin curing compound (RES)
• 2 coats of resin curing compound (RES)
• 1 coast of an emulsion surface treatment (SS1)
• 2 coats of a wax-based curing compound

34
Figure 29. Test Results from Interfacial Fracture Laboratory Testing of 4 Interface Treatments.
The interfacial stress intensity factors were calculated using FE software (ABAQUS) for the following:
• Radius (R) = 3”
• S1 = 2
3R
• S2 = varied
• A = 1
2R
• Loading Rate = 0.5 mm/min
The supports were allocated to achieve the mode I failure. The results in Figure 26 also indicate the amount or the % reduction in bond strength due to the different interfacial treatments. On the other hand, the results from FWD test can also be seen in Figure 30 for the following IL Route 390 test sections:
0.00%
10.00%
20.00%
30.00%
40.00%
50.00%
60.00%
70.00%
80.00%
0.00
20.00
40.00
60.00
80.00
100.00
120.00
140.00
160.00
180.00
(psi
.√in
); p
si
Keff (psi.√in)
Ave fe -Lab
% Reduction

35
Section Abbreviated Name
1A
10.5”
HS-IC-MS/
6CTB
1B
10.5”
LS-IC-MS/
6CTB
1C
10.5”
LS-IC-2WMA/
4CTB
1E
10.5”
HS-IC-2WMA/
4CTB
3A
9.0” LS-IC-3WMA/6PG-F
3B
9.0”
HS-IC-3WMA/
3Capping/6PG
Figure 30. Abbreviated name for different sections (top); Test Results from FWD Testing of 2 Interface Treatments (bottom).
Note: MS: micro-surfacing; CTB: cement treated base; WMA: warm mix asphalt; PG: permeable graded
14.0
14.5
15.0
15.5
16.0
16.5
17.0
17.5
0.0010.0020.0030.0040.0050.0060.0070.0080.0090.00
100.00
µF
Ave
fe
(psi
)
FWD
Ave fe - FWD
Ave fb
µF

36
The analysis included the assessment of the relationship between the parameters µe and xb shown in Figure 31. Setting the degree of bond equal to zero allows for an estimate of the sliding friction (µF) which also leads to an estimate of the interfacial sliding friction angle (ϕF). The calculated interfacial strength (fe) from the laboratory testing for a no bond breaker interface condition can be found to be reasonably comparable with the average strength results from the FWD testing for the two different types of subbase materials. A positive value of the intercept for the regression shown in Figure 29 indicates the pavement section presently manifests non erosion-damaged interface.
2.2.3 Field Application
The above approach was implemented on test data collected in the Beaumont District on a section of I-10 to compare the interfacial bond properties against cracking performance of two different sections consisting of two different interlayer types. One section consisted of a new type of interlayer referred to by the district personnel as an “inverted seal coat” while the other section consisted of the typical 2 inch HMAC interlayer. A photo of the inverted layer is shown in Figure 32.
Figure 31. Abbreviations used (top); Example Illustration of Interfacial Resistance Parameters for Section 1E (bottom).
y = 0.0134x - 0.1596R² = 0.9109
0.00
0.20
0.40
0.60
0.80
1.00
1.20
0.00 20.00 40.00 60.00 80.00 100.00
µe
xb
Steel Low (LS):0.6% High (HS):0.8%
IC Yes (IC) No (NIC)
Base Micro Surfacing + 6"CTB (MS/6CTB) 2" WMA + 4" CTB (2WMA/4CTB)
Fiber Yes (F) No (-)
Porous
Granular Yes (PG) No (-)
Capping
Stone Yes (Capping) No (-)

37
Figure 32. Inverted Seal Coat – I-10 Beaumont District – 2015.
The pavement test areas in both cases consisted of a 12 inch layer of PCC with a 6 inch CTB. FWD data was collected on both sections and used to calculate deflection bowls for each load and test position. The analysis of the deflection bowl data was used to determine the section effective-slab thicknesses (i.e. a single layer representing a composite of the slab, the interlayer, and the subbase layers).
Figure 33a. Cracking Characteristics for the Standard TxDOT HMAC interlayer (Avg CS = 10.8 ft).
Figure 33b. Cracking Characteristics for the Inverted Seal Coat interlayer (Avg CS = 5.8 ft).
y = -0.0113x + 11.624R² = 0.0187
0
5
10
15
20
0.00 50.00 100.00 150.00 200.00
Cra
ck S
pac
ing,
ft
μeff
y = 0.0715x - 2.491R² = 0.502
-5
0
5
10
15
20
25
30
35
0.00 50.00 100.00 150.00 200.00 250.00 300.00
Cra
ck S
pac
ing,
ft
μeff

38
The data shown in Figures 33a and 33b illustrates an interesting correlation between the cracking pattern evident in both pavement sections and their corresponding levels of restraint represented by the effective coefficient of friction (µe) previously explained.
Horizontal Delamination
PCC CRC SLAB
Rebar
HMAC 2 inch Layer
Figure 34a. Illustration of an over-restrained section of CRC pavement.
Figure 34b. Consequences of an over-restrained section of CRC pavement; SH-130, Austin District.
The average cracking spacing for the standard HMAC interlayer was 10.8 ft while the average for the inverted interlayer was 5.8 ft. There is also a large difference in how the cracking was distributed between these sections. As can be seen in the figures, the crack spacing was relatively insensitive to the magnitude of the frictional restraint for HMAC interlayer section. This reduced sensitivity is likely due to the reduced effect of the reinforcing steel in the HMAC interlayer section in comparison to that in the inverted section. Obviously, the effect of the steel reinforcement is much more pronounced in the section constructed with the inverted interlayer since the HMAC interlayer provides a greater shear strength forcing the pavement section to effectively manifest a greater interlayer stiffness and thus effectively lowering the percentage of reinforcement resulting in a greater average crack spacing. Figure 34a illustrates conceptually how a high shear strength interface bonds the base layer to a section of CRC pavement and creating a highly restrained segment within the pavement section encompassing reinforcing steel to the bottom of the CTB layer. This ‘block’ of highly restrained layering widens the crack spacing and essentially blocks many of the transverse cracks from penetrating completely through the depth of the CRC pavement. Those cracks move very little and cause the full-depth cracks to move over a greater range than they would otherwise. This type of behavior can cause serious performance issues as is shown in Figure 34b of the CRC pavement on SH-130. Results of the analysis of the FWD data obtained from I-10 are shown in Table 3a.

39
Table 3a. Summary of Interfacial Restraint
Houston/Beaumont Section µF µe fe fb fτ %E he SH 99 0.0 0.0 89.9 95.7 145.5 248.4 0.0% 14.4 I-10 Inv CS 0.0 0.0 63.7 101.3 197.0 336.3 0.0% 15.0 I-10 Original 6.8 81.7 77.4 94.4 148.1 252.8 0.0% 14.2
Results of analysis of sections I-57 near Effingham, IL; IH-635 Ft Worth, TX; SH 121 Sam Rayburn Tollway, Frisco, TX; and IL Route 390 Test Sections 1A – 1E; 2A – 2C; 3A – 3C are shown in Tables 3b to 2e and subsequently discussed below.
Table 3b. Summary of Interfacial Restraint
I-57 Effingham
Section µF µe fe fb fτ %E he
1995/Int 0.0 0.0 133.7 37.5 50.0 85.4 0.00% 12.2
1995/Edge 26.4 5.9 33.8 57.7 2.26% 11.2
1995/OW 126.7 37.0 51.4 87.7 0.00% 13.9
1999/Int 19.1 87.0 0.9 13.6 145.5 248.4 16.4% 10.5
2001/Int 16.5 86.5 23.3 18.7 89.8 153.3 22.0% 10.4
2006/Int 17.0 86.6 30.7 21.1 83.9 143.3 8.0% 10.7

40
Table 3c. Summary of Interfacial Restraint
IH-635
Section µF µe fe fb fτ %E he
EB 1 0.0 0.0 47.6 141.1 190.0 324.4 0.0% 10.3
WP 39.3 106.6 173.2 295.6 7.7% 8.8
EB 3 36.6 88.4 80.4 127.9 156.6 267.3 0.0% 11.1
WB 3Day 0.0 0.0 192.5 122.1 154.8 264.2 0.0% 12.8
WB 3Nite 0.0 0.0 151.3 107.2 112.2 191.6 0.0% 11.8
Table 3d. Summary of Interfacial Restraint
Sam Rayburn Tollway
Section µF µe fe fb fτ %E he
Original Int 0.00 0.00 110.55 50.56 69.40 118.47 0.0% 19.25
Original Edge 39.59 28.27 84.97 145.05 5.1% 14.01
Original Edge Ln 2 23.68 25.34 95.23 162.57 9.8% 12.88
IC 7.62 82.52 47.72 48.95 86.41 147.51 0.0% 16.31
IC Edge Ln 2 17.25 32.10 296.02 505.34 26.3% 12.18
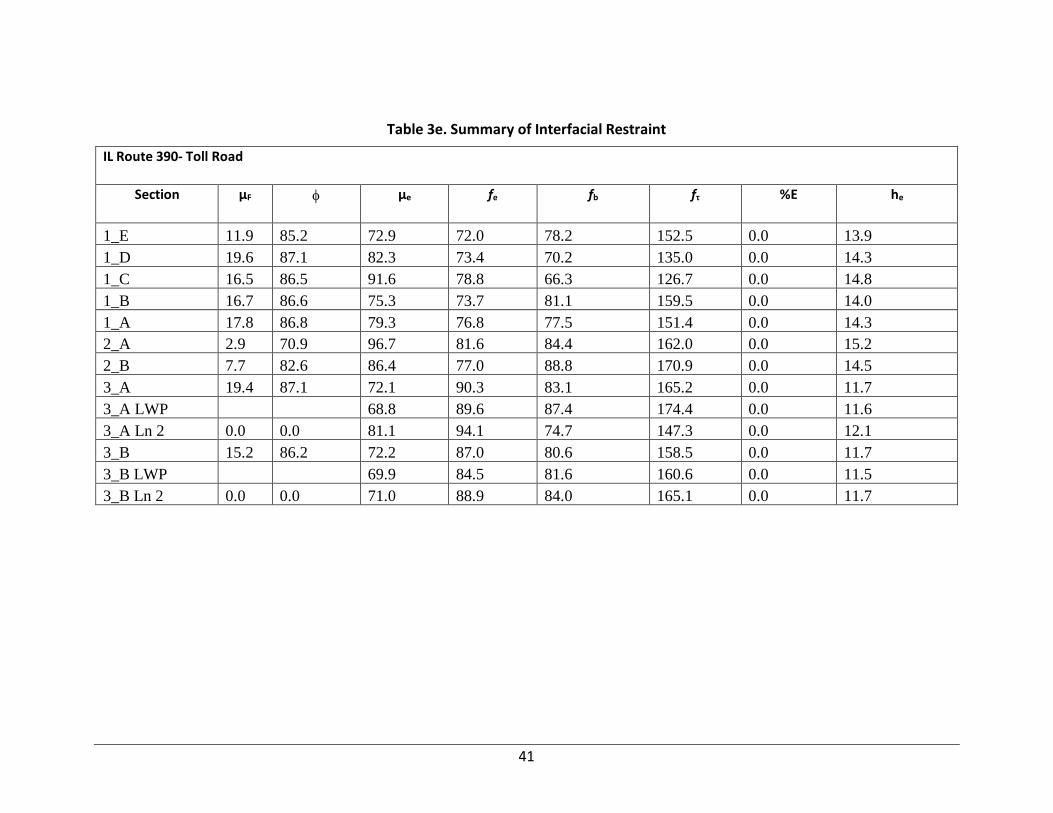
41
Table 3e. Summary of Interfacial Restraint
IL Route 390- Toll Road
Section µF µe fe fb fτ %E he
1_E 11.9 85.2 72.9 72.0 78.2 152.5 0.0 13.9
1_D 19.6 87.1 82.3 73.4 70.2 135.0 0.0 14.3
1_C 16.5 86.5 91.6 78.8 66.3 126.7 0.0 14.8
1_B 16.7 86.6 75.3 73.7 81.1 159.5 0.0 14.0
1_A 17.8 86.8 79.3 76.8 77.5 151.4 0.0 14.3
2_A 2.9 70.9 96.7 81.6 84.4 162.0 0.0 15.2
2_B 7.7 82.6 86.4 77.0 88.8 170.9 0.0 14.5
3_A 19.4 87.1 72.1 90.3 83.1 165.2 0.0 11.7
3_A LWP
68.8 89.6 87.4 174.4 0.0 11.6
3_A Ln 2 0.0 0.0 81.1 94.1 74.7 147.3 0.0 12.1
3_B 15.2 86.2 72.2 87.0 80.6 158.5 0.0 11.7
3_B LWP
69.9 84.5 81.6 160.6 0.0 11.5
3_B Ln 2 0.0 0.0 71.0 88.9 84.0 165.1 0.0 11.7

42
Figure 35a. Typical Distresses on I-57 near Effingham, IL (17).
Figure 35b. Summary of Distress (17) Interfacial Bond Conditions on I-57 near Effingham, IL.
2.2.3.1 I-57 near Effingham, IL
This 10-inch section of CRC pavement was placed as an inlay of an existing concrete surface was of interest since it did not consist of an asphalt bond breaker along the interface. The values of µe listed in Table 3b in the slab interior (int) and outer wheel path (OP) reflect the strength of the existing
0.00%
5.00%
10.00%
15.00%
20.00%
25.00%
0.0
5.0
10.0
15.0
20.0
25.0
µ o
r h
e
µF
he
%E

43
concrete base layer but apparently experienced a significant reduction within 5 years after construction of the inlay. It is likely that after and as the reduction of the interfacial bond developed that distresses such as the longitudinal cracking shown in Figure 35a may have initiated. A summary of the distress is also provided in Figure 35b.
Examination of the data shown in Figure 33b indicates the development of erosion over time. Erosion damage occurs along the slab/base interface and can effectively isolate the slab from the substrate in multiple ways. A common result of this isolation is the development of longitudinal cracking distress similar to that shown in Figure 35a. The cracking is a direct result of the reduction in the effective thickness of the pavement section. The calculated interfacial strength and friction values on this section of CRC pavement provides comparable data to those found from the laboratory testing and other good performing sections of CRC pavement. The key to good performance is to maintain contact before the slab and the underlying support.
2.2.3.2 IH-635 Ft Worth, TX
Figure 36a. Core from 8 inch section of CRC pavement on IH-635.
Figure 36b. View of 8 inch section of CRC.
This original section of 8 inch CRC pavement (Figures 36a and b) which was constructed in the late 60’s early 70’s time frame did not contain an asphalt bond breaker along the interface between the

44
concrete slab and the cement treated subbase layer; the fact that such an interlay was non-existent in this CRC pavement section is main reason why it was of interest in this study.
The summary of FWD testing that was carried out indicated effective friction values ranging from 40 to 190 which is a wide range of variation indicating the interface is wearing or wore out in places such as the wheel path; the approximate 8% erosion in the wheel path tends to validate this conclusion.
An indication of the performance of the pavement section as provides over its 35+ years of service are depicted in Figure 36b and the summary listed in Table 4. Examination of the core shown in Figure 36a suggests initial bonding between the layers that later developed into a fracture below the interface.
Table 4. Summary of Distress IH-635
TRM # Spalled Crk or Jts
% Milled
# PO
# Patches Long Cracks (ft)
Wide Long Joints (ft)
Crack Spacing < 5ft > 5ft
20 - 21 3 5 0 0 0 400 20% 80%
21 - 22 0 0 0 4 0 2000 30% 70%
22 - 23 0 0 0 6 0 100 50% 50%
23 - 24 0 0 0 3 0 0 40% 60%
24 - 25 0 50 0 0 0 0 60% 40%
TxDOT made changes to their design standard to include an interlayer when it was determined the performance could be improved by doing so but most of the distress appeared to be due to punchout development likely caused by separation similar to that shown in Figure 34a. It appears that attempting to maintain a full bond initially between a CRC pavement and the base layer either by using a cement treated base or an asphalt concrete interlayer ultimately fails with the end result being separation between the slab and base. It’s clear that if full bonding cannot be achieved unless the strength of the bond is sufficient that the stresses that cause the separation will not exceed it. Otherwise, the pavement section should be design to accommodate the separation.
2.2.3.3 Sam Rayburn Tollway, SH 121, Frisco, TX
Figure 37. Internally Cured Section of SH 121.
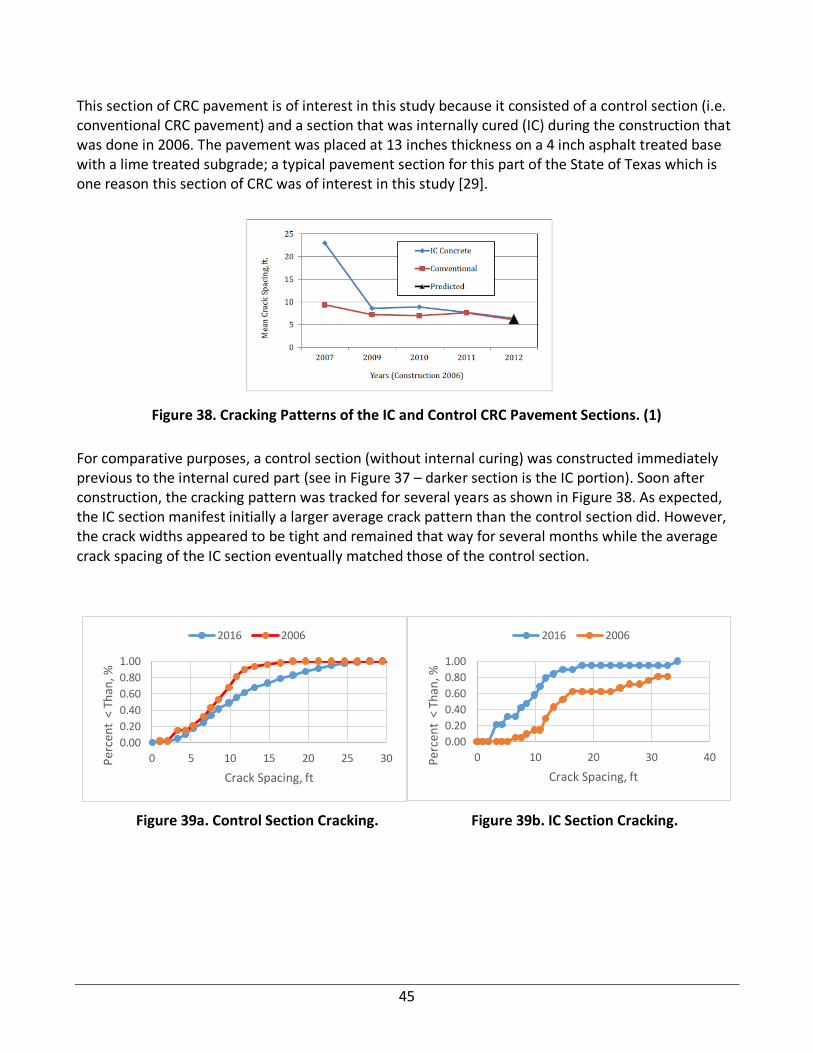
45
This section of CRC pavement is of interest in this study because it consisted of a control section (i.e. conventional CRC pavement) and a section that was internally cured (IC) during the construction that was done in 2006. The pavement was placed at 13 inches thickness on a 4 inch asphalt treated base with a lime treated subgrade; a typical pavement section for this part of the State of Texas which is one reason this section of CRC was of interest in this study [29].
Figure 38. Cracking Patterns of the IC and Control CRC Pavement Sections. (1)
For comparative purposes, a control section (without internal curing) was constructed immediately previous to the internal cured part (see in Figure 37 – darker section is the IC portion). Soon after construction, the cracking pattern was tracked for several years as shown in Figure 38. As expected, the IC section manifest initially a larger average crack pattern than the control section did. However, the crack widths appeared to be tight and remained that way for several months while the average crack spacing of the IC section eventually matched those of the control section.
Figure 39a. Control Section Cracking. Figure 39b. IC Section Cracking.
0.00
0.20
0.40
0.60
0.80
1.00
0 5 10 15 20 25 30Per
cen
t <
Th
an, %
Crack Spacing, ft
2016 2006
0.00
0.20
0.40
0.60
0.80
1.00
0 10 20 30 40Per
cen
t <
Th
an, %
Crack Spacing, ft
2016 2006

46
Figure 39c. Control Section Cluster Cracking. Figure 39d. IC Section Cluster Cracking.
Figure 39a and b compare and illustrate other aspects of the cracking pattern with respect to crack development and cluster cracking. It is interesting how the crack development of the IC section moved in an opposite direction of that in the control section. For example, in 2006 80% of the cracking in the control section was less than 10 feet while in the IC section it was 18%. In 2016, 50% of the cracking in the control section was less than 10 feet while in the IC section is was 60%. Clustering which is the occurrence of combinations of close and wide cracking intervals is also shown in Figures 37c and d. The two sections manifest similar clustering however the IC section had on the average 10% more clustering than the control section.
Figure 40a. Control Section Spalling. Figure 40b. IC Section Spalling.
A clear benefit of IC for CRC pavement is the reduction in spalling. The coarse aggregate source has been identified as the primary cause of spall distress in CRC pavement (Ref). Figure 40a and b compares and example transverse crack spalling in both sections which clearly demonstrates the role of curing quality in the occurrence of spalling. The evidence displayed in these imagines clearly again show that the process of spalling development is not temperature related as much as it is moisture, curing, and bond development related [24, 30]. IC is one form of construction methodology to improve the curing quality of CRC pavement construction.
FWD testing, as indicated previously and summarized in Table 3d, was also carried out as part of the research for this study. It is not clear why the IC section manifest a lower frictional restraint at the
0.00
0.20
0.40
0.60
0.80
1.00
0.00% 20.00% 40.00% 60.00% 80.00% 100.00%
Per
cen
t <
Th
an, %
Cluster Cracking, %
2016 2006
0.00
0.20
0.40
0.60
0.80
1.00
0.00% 20.00% 40.00% 60.00% 80.00% 100.00%
Per
cen
t <
Th
an, %
Cluster Cracking, %
2016 2006

47
slab interior position than the control section. However the difference along the edges may be explained by a higher built-in negative gradient forming in the IC section due to the effect of the higher moisture content. This is further confirmed by the greater amount of estimated erosion in the IC section compared to the control section. All of the values summarized in the Tables 3a-e are comparable with respect to both worn and good performing frictional interfaces.
2.3 EROSION TESTING AND ANALYSIS
Erosion testing was carried out for the following base materials:
A. Bank run
B. PGE
C. CA - 6
D. Rap Cap
E. Inverted prime’ Interlayer
Subbase
Concrete
Subgrade (Neoprene Pad)
1 inch
1 inch 3/8 inch
158 lb
1.85 inch
Sample Diameter = 6 inch
1 2 3 4 5 7 8 910 116
Deflection
Measuring
Points
( )
sin( ) cos( )
(1 )
1
2 1
i
i
p b u
L sb
e p
E
X
−
=
= + −
=
+
Erosion Test and Shear Stress Model
% E iDif ef
−
= =
( ) 2
F1 %E cosef f f= − +
Figure 41 HWLD Configuration for Base Layer Testing [31, 32]
The bank run and the PGE (permeable graded embankment) had fairly broad gradation bands with limited fines while the CA-6 met Illinois DOT specifications for an unbound base layer. The Rap Cap material was made up from recycled asphalt pavement. The inverted prime consisted of an emulsion spray on a fine graded sandy material. Erosion testing was carried out in the laboratory using the Hamburg Wheel Loading Device (HWLD) shown in Figure 41. A test specimen was made from each material. The load device creates a wear and pumping action which erodes the test specimen under each load application. Example test results are shown in Figures 42a and b for the PGE and the CA-6 material. The test results are best used to calibrate the loads to failure model:

48
1 2N 10k k r
f
+=
where:
ki = erosion fatigue damage calibration coefficients per base type
ri = 𝜏𝑖
𝑓𝑒+ (𝐽2)𝑚(𝛼𝐼1 + 𝐾)𝑛
τi = interfacial shear stress
fe = effective interfacial frictional resistance or bond strength = σ𝑣𝜇e = ( ) bbx f =
(1 − %𝐸)𝑐𝑜𝑠2𝜑[(1 − 𝑝𝑟𝑜𝑏(𝜎𝑛 > 0))𝑓𝜏 + 𝑓𝐹 ]
( 0)nprob = probability set gradient will cause slab separation from the subbase
σ𝑣 = normal stress
= keff δ
keff = effective modulus of subgrade reaction
δ = loaded deflection
𝜇e = effective or composite coefficient of friction
fτ = cohesive shear strength of the weakest layer adjoining the interface = σ𝑣𝜇c
𝑓F = frictional interfacial shear strength
= (𝜎𝑣)𝜇𝐹
m, n = plastic deformation coefficients per base type
This expression represents the life (Nf – shown in Figure 40c). The values of Nf are associated with respect to calibrated values of k1 and k2. These value are the number of equivalent shearing cycles that the surface of a layer of the base material could provide relative to the erosive damage caused by repeated loading. Erosion damage reduces the effective slab thickness, creates voids, and prematurely shortens pavement life. The application of the test results to field conditions is facilitated by adjustment of the parameter r for both the stress and strength conditions. It is pointed out the expression for Nf in this application is used in the following model for erosion:
%E 1 i jDib
fx e
f
−
−
= = − =

49
Where
%E = percent of erosion
fi = level of faulting
f0 = ultimate faulting
Di = erosion damage function = ∑ 𝑛𝑖
𝑁∞⋅ (%𝑊𝑒𝑡 𝐷𝑎𝑦𝑠
Ni = ∑ 𝑛𝑖 = equivalent cumulative load applications
ρ, β = erosion calibration coefficients (derived from field or lab data)
%Wet Days = percent of the year the slab/base interface is wet
Figure 42a. Erosion Test Results for PGE Base Material.
Figure 42b. Erosion Test Results for CA-6 Base Material.
0
1
2
3
4
5
6
7
0 50 100 150 200 250
Dis
pla
cem
ent,
mm
Load Applications
0
1
2
3
4
5
6
7
0 5000 10000 15000
Dis
pla
cem
ent,
mm
Load Application

50
Figure 42c. Erosion Calibration Results.
Figure 43. Erosion Performance Model.
Figure 43 is an illustration of the form of the erosion model as a function of the accumulated erosion damage (D). The model is dependent upon the ultimate value of joint faulting which is determined as part of the calibration of the model and is shown in Figure 42c for each base type. As the model suggests, as the percent of erosion advances, the degree of bond (xb) decreases and that the value of b (see Figure 31) also decreases as the level of erosion damage increases.
2.4 CONCLUSIONS
The discussion presented in this report points to the following conclusions with regard to interfacial bond:
1. Interfacial bond affects the stiffness of the pavement system.
2. Interfacial bond is made of up two components: one related to mechanical interlock and the other related to cohesive shear strength.
0
1
2
3
4
5
6
1.00E+00
1.00E+01
1.00E+02
1.00E+03
1.00E+04
1.00E+05
1.00E+06
1.00E+07
1.00E+08
1.00E+09
PGE
Ban
k R
un
Rap
Cap
CA
-6
Mic
ro S
urf
acin
g
Ult
imat
e f
Load
s to
Fai
lure
Base Type
N∞
f∞

51
3. In CRC pavement structures, excessively high bond may generate horizontal failure planes at the level of the steel reinforcement during the early stages of hardening.
4. Interfacial bond strength is dependent upon contact between the slab and the base layer and can be assessed using FWD test data and wears out over time and traffic.
5. The relationship between the degree of bond and the effective coefficient of friction appears to be linear distributed.
6. Erosion damage likely initiates when the slab and the base are not substantially in contact. Furthermore, erosion damage initiates when the degree bond becomes numerically negative.

52
CHAPTER 3: MEASURES TO IMPROVE COST EFFECTIVENESS OF CRC PAVEMENT
CRC pavement is generally thought of as a high cost pavement due to the additional cost of the continuous reinforcing steel. The reinforcing steel is an essential component to how the pavement performs and functions but with construction costs generally driving pavement designs, the common conception of a higher cost, associated with CRC pavement, limits the amount of its use. Over the years, there have been methods that have been implemented to try and offset these costs, by either by reducing pavement thickness or by creating additional benefits to the structure such as eliminating the reinforcing steel in the shoulder pavement.
In this chapter, the design of continuously reinforced concrete pavement is discussed with how traffic or wheel load stresses affect it, as compared to the construction costs associated with the pavement. Specific parameters and alterations of pavement design will be discussed in detail to demonstrate how each factor can improve pavement life or improve pavement costs. The idea behind changing the parameters is to simply yield an overall better pavement. CRC pavements are used as the basis of this report, but many of these ideas are applicable to other concrete pavements as well. Although each parameter will be discussed on how they may impact design and performance individually, the main focus will be on utilizing these parameters together to create a more balanced design. Each parameter may or may not improve pavement life while reducing or increasing construction costs, so a balanced design is critical to generate the best overall concrete pavement.
This chapter is broken down into three parts. The first portion will discuss the details or theory behind changing certain areas in design and how the change in specific parameters can impact the behavior of the pavement. The second part will relate to the costs associated with each modification, and will be summarized using different levels of emphasis for each parameter. A high and low level of change will be applied for each item and then compared with the change in costs that it results in, whether it be higher or lower. The third part of the chapter will then demonstrate how the changes in design parameters can be used together to generate the most balanced or optimized design. The balance of the design may be for the most cost effective, or for the greatest improvement in pavement life, or even a weighted average between but the main point being keeping a balance in the resulting pavement structure as well as a balance in the focus of the design and the basis of the models incorporated in it to achieve the design.
3.1 CRC PAVEMENT AREAS OF MODIFICATION/IMPROVEMENT
The following modifications/improvements are reviewed in this chapter:
• Post-tensioning of the transverse reinforcement
• Configuration of the steel reinforcement: % steel, bar size and position (i.e. cover)
• Modification of the degree of bond of the interlayer
• Surface notching

53
• Active curing management
• Use of unreinforced concrete shoulders
Each of these will be addressed in sequence. The major modification made from a typical CRC pavement is the use of transverse post-tensioning to reduce the wheel load stresses (WLS). The following expression has been used to compute WLS in CRC pavement:
1
ln
sL
a b
=
+
where
a =
( )96.4)
24.6
10.930 2.84 1
LTE
ee
− −
− + +
b = ( )2
07 30.427 9.73e LTE−+
L = mean crack spacing (L)
= radius of relative stiffness (L)
LTE = load transfer efficiency (%)
s = dimensionless stress (wlsh2/P)
wls = wheel load stress (FL-2)
h = pavement thickness (L)
P = wheel load (F)
The WLS for design of a CRC pavement, the transverse direction is the most critical which occurs at the top of the pavement. According to this expression, as the wheel load increases, the slab thickness decreases, lateral support decreases, and as crack spacing and the LTE decreases, the WLS increases. It can be seen how each of the above listed improvements can affect the computed WLS for design except the active curing, steel cover, and erosion which will be elaborated later. Reducing the wheel load stress allows the pavement to have a higher fatigue limit, as a result of changes or improvements to the design. The wheel load stresses typical for CRC pavement are associated with causing edge cracking and ultimately punchouts, the most common destructive distresses for this pavement type. The more this is reduced the more efficient the structure is for the design purpose. It is anticipated that the WLS can be reduce by 75 to 100 psi by post-tensioning the transverse reinforcement.
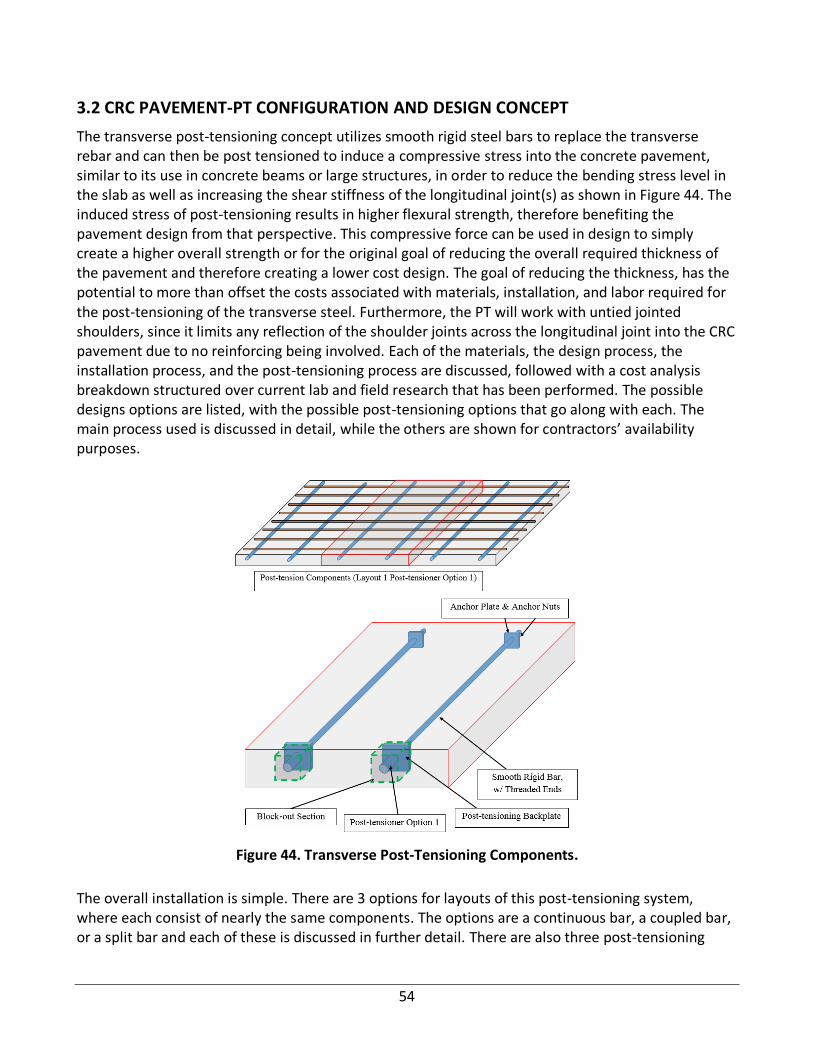
54
3.2 CRC PAVEMENT-PT CONFIGURATION AND DESIGN CONCEPT
The transverse post-tensioning concept utilizes smooth rigid steel bars to replace the transverse rebar and can then be post tensioned to induce a compressive stress into the concrete pavement, similar to its use in concrete beams or large structures, in order to reduce the bending stress level in the slab as well as increasing the shear stiffness of the longitudinal joint(s) as shown in Figure 44. The induced stress of post-tensioning results in higher flexural strength, therefore benefiting the pavement design from that perspective. This compressive force can be used in design to simply create a higher overall strength or for the original goal of reducing the overall required thickness of the pavement and therefore creating a lower cost design. The goal of reducing the thickness, has the potential to more than offset the costs associated with materials, installation, and labor required for the post-tensioning of the transverse steel. Furthermore, the PT will work with untied jointed shoulders, since it limits any reflection of the shoulder joints across the longitudinal joint into the CRC pavement due to no reinforcing being involved. Each of the materials, the design process, the installation process, and the post-tensioning process are discussed, followed with a cost analysis breakdown structured over current lab and field research that has been performed. The possible designs options are listed, with the possible post-tensioning options that go along with each. The main process used is discussed in detail, while the others are shown for contractors’ availability purposes.
Figure 44. Transverse Post-Tensioning Components.
The overall installation is simple. There are 3 options for layouts of this post-tensioning system, where each consist of nearly the same components. The options are a continuous bar, a coupled bar, or a split bar and each of these is discussed in further detail. There are also three post-tensioning

55
methods discussed which vary in cost and equipment. The variety of options make this concept applicable to more project designs and to material suppliers. The first option is Option 1, the continuous bar system with much of the preliminary trails using layout Option 1 of a threaded post tensioning nut. Regardless of choice, the installation is composed of installing the anchorage and post-tensioning components onto the bar. With those in place the smooth bars are either sleeved or greased and then placed in the same locations that the transverse steel would have been located. From there the bar functions just as transverse rebar would have, acting to support the longitudinal steel and holding it in position during placement operations. Besides double checking that the block-outs are in their right positions, the paving continues as normal. The installation of the transverse smooth bars replacing the transverse rebar is depicted below with the post tensioning components used for the research projects being shown.
The post-tensioning components consist of the smooth rigid bar, an anchorage plate, a post-tensioning plate, and the post tensioning nut or securing device depending on the post-tensioning method. The post-tensioning nut is the highest cost item suggesting that the other post-tensioning methods yield lower cost options. The original research design called for a post-tensioning nut which was over designed to ensure no failure or malfunctions that could have been harmful to researchers. Reducing the length of the PT nut is one of the cost reducing options. This also allowed for threading of the bar itself to be reduced, further improving the design. Using a post-tensioning jack instead allows for the post-tensioning nut to be replaced with either a standard nut, only needing to secure the bar, or welding, another option to hold the bar to the plate. These other options allow for variations in the design of the bar threading, but from research findings, Layout Option 1 and Post-tensioning Option 2 are proposed for optimal design and for the use in smaller roadways or entrance ramps. Again, these options are available for variety of design purpose and material availability. All the post-tensioning options are discussed further in Appendix A.
3.3 PT FIELD TRIALS
Overall for the research and initial implementation, two studies were undertaken to examine or verify the proposed transverse post-tension process. The first study involved a two-lane roadway, currently in use, and located in Victoria, TX of the United States. The second study consisted of a pair of test-slabs simulating sections of the Victoria project road design that were cast at Texas A&M University, in the Texas Transportation Institute (TTI).
3.3.1 Victoria TX. Ball Airport Rd. Test Section
The roadway in which the first study implemented the transverse post-tension design is located on Ball Airport Rd, in Victoria, TX. The test section is located within a newly constructed region at the north end of the roadway. The post-tension section consisted of a 52 feet section, using 13 smooth post-tensioning transverse bars. The 8-inch thick test section called for solid 26 ft. long, smooth #6 steel bars to span continuously across the two-lane paving section (Layout Option 1). Figure 45 is an illustration of the pavement section taken in the transverse direction, prior to paving showing the standard CRC pavement steel layout at the beginning of the post-tensioning test section with the smooth bars in place shown as highlighted.

56
The longitudinal steel was placed and wired on top of the transverse bars as normal. The bars were coated with industrial grease was used as a bond breaker to allow for slip between the bar and the concrete during the tensioning process. Strain data was collected with regard to the strain distribution along the bars, as well as strain data collection throughout the concrete to correlate the stress transferred to the concrete from the bars.
Figure 45. Project 1 (Victoria, TX) Transverse Rebar being replaced by Smooth Rigid Bars.
The other major item discovered during the installation was the difficulty of keeping the post-tensioner housing inline and sealed from the concrete, but new block-out techniques have been applied in accordance with slip form paving.
3.3.1.1 Efficiency Testing/Evaluation
In evaluation of this rigid bar post-tensioning design, the case studies performed have shown promising results in effectively distributing the stress and implementing the stress into the CRC pavement. The initial research implemented the design on a standard paving design without altering the design in any major way. The initial goals were to test the effectiveness of the system itself, along with researching the distribution of stresses through the bar and across the pavement. Currently the pavements are being tested to determine how much stress can actually be implemented with each method or option. The effectiveness of the system can be further evaluated using a number of different strain gauges placed within the pavement itself or depending on the main design goal, many other evaluation methods can be put into placed to assure that the objectives are being effectively satisfied.

57
Figure 46. Victoria TX Post-tensioning Strain Distribution Across Bar.
Figure 46 shows the initial Victoria, TX testing results from tensioning the bars for the first time implementing. Strain was distributed successfully across the bar as desired but further testing of the test slabs was required to verify the stress induced into the pavement. Upon the second visit to tension the Victoria study, a greater understanding for the relaxation and strain distribution was found. The solution of putting a sleeve over the bar settled the bonding issue, but the relaxation of the bar with time and the strain distribution per tensioning rotation were further investigated. After tensioning the bar a second time around, the strain readings were much more precise showing the stress distributing throughout the entire bar and therefore throughout the pavement.
3.3.2 TAMU/TTI – Rellis Campus Test Slab
The second PT study (Figure 47) involved the test-slab pavement sections constructed at the Texas A&M System’s Rellis Campus. This project consisted of creating a mock roadway segment, equivalent to the CRC section in Victoria, that consisted of the transverse rebar again replaced with smooth, rigid, steel bars that were to be post-tensioned. The post-tensioning was done with the threaded bar system, attempting each of the post-tensioning options, with the goal better modeling the stress distribution throughout the post-tensioning system.
The pavement sections were originally designed to be identical to the Victoria test section, being an 8 inch CRC pavement that is two lanes wide or 26 feet. Once constructed the only change to the design was to create the slabs at a higher thickness in order to further test the distribution of the stress from the post-tensioning bar into the pavement. The slabs were constructed with the dimensions of 26 feet wide (technically width to simulate the transverse direction), 7 feet long (6 feet instrumented), and 11 inches thick. Both slabs were constructed on the same base layer that was placed with a standard granular sand, which best represented no bonding to the base layer and allowed for any movement or curling with minimal restrictions. Two slabs were created using standard 4,000 psi concrete with #6 smooth steel bars. The bars consisted of two 26-foot long bars and four 13-foot bars, which combined covered all three post-tensioning designs.

58
Figure 47. Project 2 Test Slab Simulating Project 1 Roadway Conditions.
The post-tensioning was done with the threaded bar system, attempting each of the post-tensioning options, with the goal of better modeling the stress distribution throughout the post-tensioning systems. The 26-foot solid bars were place in slab #1, spaced at 48 inch on-center and in the center position of the slab depth. Slab 1 was flat or constructed with no slope, and a saw-cut was placed at the mid span to simulate the longitudinal joint that would be placed in a typical two-lane construction. Slab #2 was designed to have an arc slope, or crown, from the center to the ends. The high point, in the middle, was created by grading the base to follow the slope while the forms were placed to represent a 3% slope. The bars in slab 1 were placed with the anchorage ends in-place each at the same end so that the tensioning was to be performed from one end. Both bars being tensioned from the same end allowed for validation of the tensioned stress being transferred into the pavement at both ends evenly. For slab 2, the coupled bar design and the split bar design was applied. The split bar design was anchor from the center of the slab section and tensioned from both sides, while the coupled bar design was tensioned from one side. All the bars, in both slabs, were sleeved with a thin plastic cover, which assured no bonding between the bars and the pavement, and the tensioning ends were block out with Styrofoam so that no concrete infiltrated the tensioning area. The sleeving of the bars also allowed for the tension to be removed and each tensioning procedure was applied to evaluate effectiveness.
Slab 1 had more instrumentation than slab 2, with slab 1 being the main testing section. Slab 2 allowed the other designs to be implemented and most of the instrumentation in slab 2 was there to either verified numbers collected from slab 1, or to test other parameters within the designs. Slab 1 was instrumented with strain gauges on the steel itself, strain gauges placed throughout the concrete, dial gauges on one end of the pavement and at the center of the pavement. An additional

59
crack width gauge was placed on the saw-cut crack and the tensioning jack apparatus made had a pressure gauge applied to it. For the steel strain gauges standard linear strain gauges (Omega Pre-wired Linear Planar X-Y Gauges) were used, and a higher concentration of gauges were placed at the tensioning and anchorage ends of the bar. Compared to the first study in Victoria, an overall higher amount of gauges were used on the bars. The concrete strain gauges used, Vibrating Wire Gauges (RST Instruments Vibrating Wire Strain Gauges), were placed, at even intervals, along the length parallel to the bar. The gauges were also placed, three across the width, (between the bars) at the tensioning end, at the quarter mark of the slabs longer length, and at the middle of the slab. These gauges were placed strategically to map out the stress induced into the concrete and to confirm that stress was being distributed into all areas, while also checking that stresses are not exceeded in any area (particularly in the tensioning end area). Two more of the VBW strain gauges were placed at the top and bottom depths of the slab, at the mid-point of the slab. These two gauges were used to back calculate the stress of slab curl and warping. Also to directly measure curling/warping, or slab lift/movement, a dial gauge was implemented at the end of the slab and at the middle of the slab. Underneath the slab and sand base layer was older concrete pavement, which was used to anchor the dial gauges to measure the movement, if any of the slab. Throughout the test monitoring, the dial gauges did show some difference in readings but due to the surrounding construction and the obstructions from the lawn maintenance personnel, the readings were disregarded. With most of the instrumentation on the main slab (slab 1), slab 2 had additional gauges located in some areas respective to the first slab, but also had more gauges at the center point where the split bar design was anchored and where the coupler was in the couple bar side.
The data collected from the research showed a few conclusions that would be expected while some data showed more success than expected. The expected results of the stress distributed to both ends of the bar was executed, as well as a higher stress induced into the concrete closer to the ends were both found. The decrease in stress at the middle of the slab was more drastic than expected but there was still some stress induced found. The dial gauges did not prove effective, but the strain gauges implemented at the top and bottom of the mid-point to show changes in strain representative of curling, did not show any differential. This can be interpreted as reduced or minimal curling of the slab and with the saw-cut not cracking/breaking for the first 6 months, the post-tensioning shows promise in negating transverse curling. These findings also show potential in the reduction of longitudinal cracking and to hold slabs tighter together, increasing load transfer and minimizing slab movement. The findings of the test sections also showed that each post-tensioning system is feasible and sufficient to meet the goals of transverse post-tensioning implementation.
3.4 COST ANALYSIS OF THE PT DESIGNS
In breakdown the CRC post-tensioning concept many factors come into play but each of the design methods and post-tensioning process result in overall savings. The ideal method/option of the ones listed, is the use of a post-tensioning jack on the continuous or coupled bar system. The savings shown in Figure 48 currently calculated are for a small-scale construction with limited provider, meaning that the savings calculated should only result in even more savings with larger scale or increased production. We find that CRC pavement post-tensioned in the transverse direction can
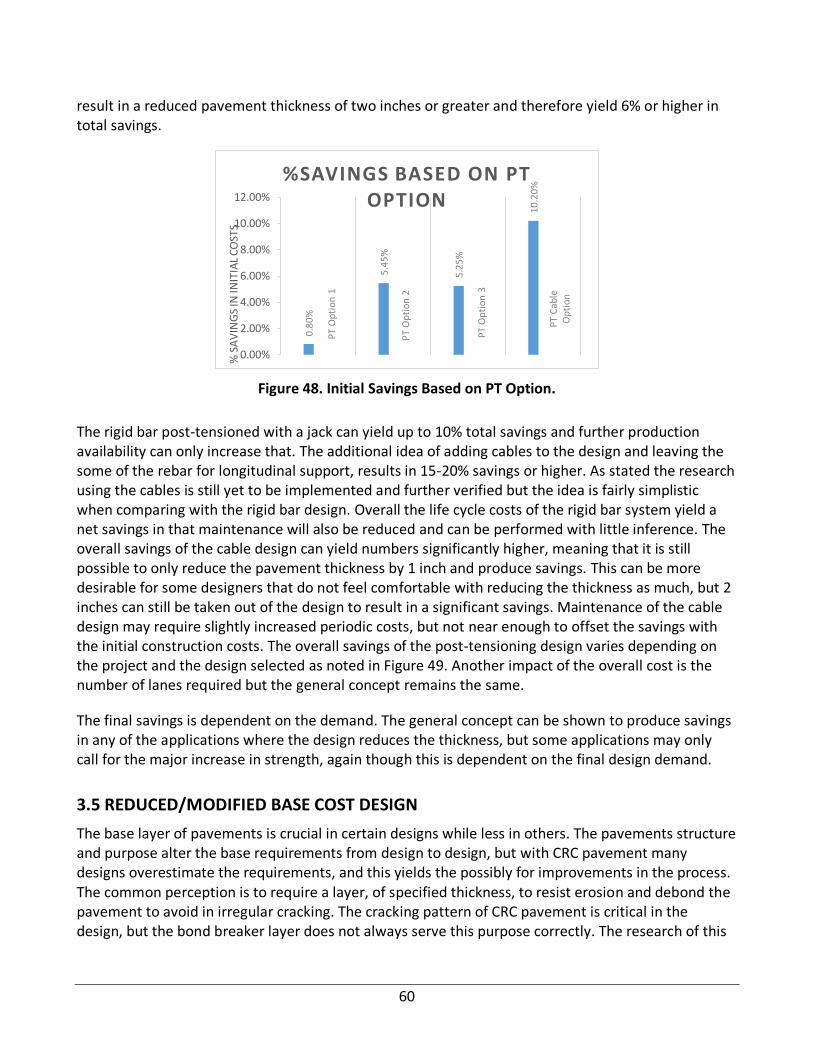
60
result in a reduced pavement thickness of two inches or greater and therefore yield 6% or higher in total savings.
Figure 48. Initial Savings Based on PT Option.
The rigid bar post-tensioned with a jack can yield up to 10% total savings and further production availability can only increase that. The additional idea of adding cables to the design and leaving the some of the rebar for longitudinal support, results in 15-20% savings or higher. As stated the research using the cables is still yet to be implemented and further verified but the idea is fairly simplistic when comparing with the rigid bar design. Overall the life cycle costs of the rigid bar system yield a net savings in that maintenance will also be reduced and can be performed with little inference. The overall savings of the cable design can yield numbers significantly higher, meaning that it is still possible to only reduce the pavement thickness by 1 inch and produce savings. This can be more desirable for some designers that do not feel comfortable with reducing the thickness as much, but 2 inches can still be taken out of the design to result in a significant savings. Maintenance of the cable design may require slightly increased periodic costs, but not near enough to offset the savings with the initial construction costs. The overall savings of the post-tensioning design varies depending on the project and the design selected as noted in Figure 49. Another impact of the overall cost is the number of lanes required but the general concept remains the same.
The final savings is dependent on the demand. The general concept can be shown to produce savings in any of the applications where the design reduces the thickness, but some applications may only call for the major increase in strength, again though this is dependent on the final design demand.
3.5 REDUCED/MODIFIED BASE COST DESIGN
The base layer of pavements is crucial in certain designs while less in others. The pavements structure and purpose alter the base requirements from design to design, but with CRC pavement many designs overestimate the requirements, and this yields the possibly for improvements in the process. The common perception is to require a layer, of specified thickness, to resist erosion and debond the pavement to avoid in irregular cracking. The cracking pattern of CRC pavement is critical in the design, but the bond breaker layer does not always serve this purpose correctly. The research of this
0.8
0%
5.4
5%
5.2
5%
10
.20
%
PT
Op
tio
n 1
PT
Op
tio
n 2
PT
Op
tio
n 3
PT
Cab
le
Op
tio
n
0.00%
2.00%
4.00%
6.00%
8.00%
10.00%
12.00%
% S
AV
ING
S IN
INIT
IAL
CO
STS
%SAVINGS BASED ON PT OPTION

61
topic will look into previous bond breaker layers and their effectiveness, based of cracking patterns, and then will look into the effectiveness of some new ideas more recently being implemented. The idea is to have a base layer of sufficient erosion resistance and while allowing the main pavement layer to function at the highest efficiency.
Figure 49. Initial Savings Based on Design Lane Requirement.
3.5.1 Modified Bond Breaker Requirements
Modification of bond-breaker requirements, in order to improve the balance of the need for erosion resistance or friction, combined with the use of transverse PT may facilitate improved cost effectiveness of CRC pavement. The bond breaker layer entails material costs, labor costs, and time delay costs, all while still impacting the overall life cycle of the pavement by a potentially unwarranted, overly conservative, benefit. Many engineers and researchers have different opinions on the necessity of a bond breaker layer leaving many questions on the overall effectiveness of it. Not only does it increase paving costs but also can have an impact on the pavement later on in the life cycle of it. Whether this impact is a benefit or a detriment to the pavement is currently being researched but some of our findings do suggest that modification or simply reduction of this layer may prove more beneficial than many of the current designs.
Figure 50a. Erosive Effects of Wet Days and Traffic on CRC Pavement Performance.
5.4
5%
6.0
6%
6.1
2% 7
.02
%
2 L
ane
Des
ign
3 L
ane
Des
ign
4 L
ane
Des
ign
6 L
ane
Des
ign
0.00%
1.00%
2.00%
3.00%
4.00%
5.00%
6.00%
7.00%
8.00%
% S
AV
ING
S IN
INIT
IAL
CO
STS
% SAVINGS BY DESIGN LANES REQUIRED
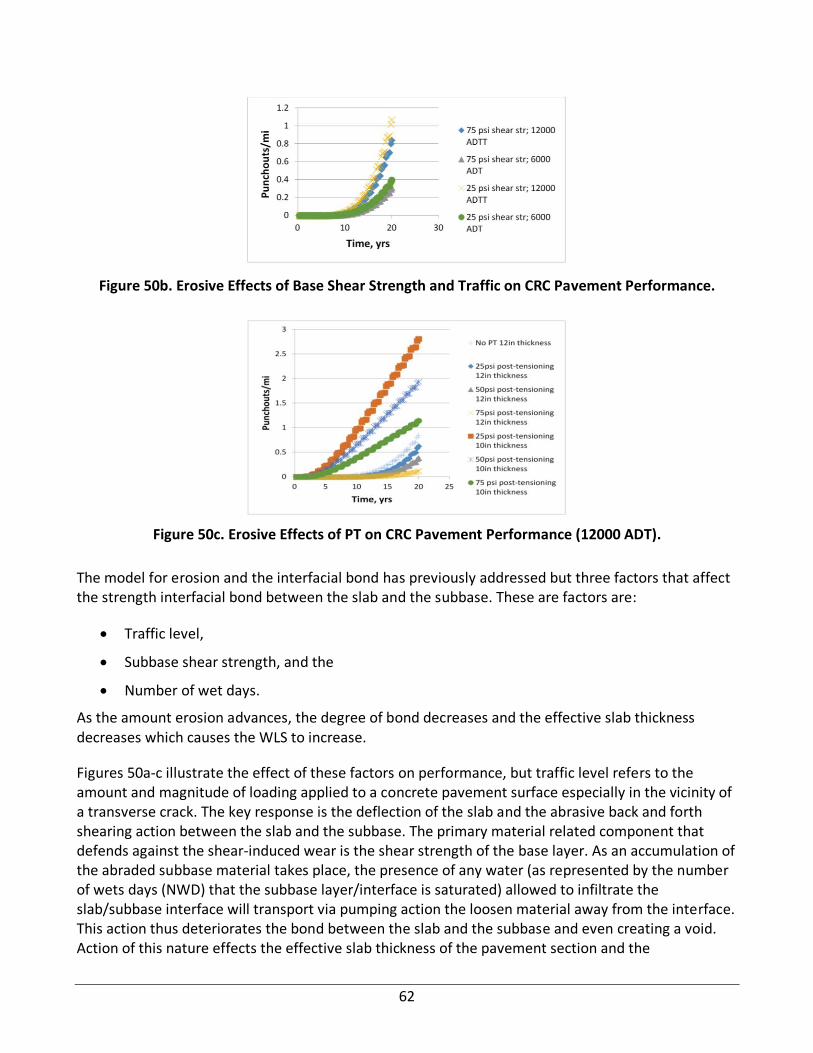
62
Figure 50b. Erosive Effects of Base Shear Strength and Traffic on CRC Pavement Performance.
Figure 50c. Erosive Effects of PT on CRC Pavement Performance (12000 ADT).
The model for erosion and the interfacial bond has previously addressed but three factors that affect the strength interfacial bond between the slab and the subbase. These are factors are:
• Traffic level,
• Subbase shear strength, and the
• Number of wet days.
As the amount erosion advances, the degree of bond decreases and the effective slab thickness decreases which causes the WLS to increase.
Figures 50a-c illustrate the effect of these factors on performance, but traffic level refers to the amount and magnitude of loading applied to a concrete pavement surface especially in the vicinity of a transverse crack. The key response is the deflection of the slab and the abrasive back and forth shearing action between the slab and the subbase. The primary material related component that defends against the shear-induced wear is the shear strength of the base layer. As an accumulation of the abraded subbase material takes place, the presence of any water (as represented by the number of wets days (NWD) that the subbase layer/interface is saturated) allowed to infiltrate the slab/subbase interface will transport via pumping action the loosen material away from the interface. This action thus deteriorates the bond between the slab and the subbase and even creating a void. Action of this nature effects the effective slab thickness of the pavement section and the

63
accumulation of fatigue damage. Thus, as the degree of bond varies over the design life due to erosion damage or due to separation between the slab and the base layer. These effects apply to the prediction of punchout distress in CRC pavement as illustrated in Figures 48a-c. Percent of erosion relates directly to the traffic level and the number of wet days the subbase layer is saturated in a given year. It is interesting to see how the effect of PT compensates for nearly 2 inches of CRC slab thickness. Figure 51 illustrates a comparison of the sensitivity of the discussed erosion factors on performance. The role of PT is comparable to the effect of subbase shear strength or the NWD.
Figure 51. Sensitivity Comparison of Erosion Related Factors on Performance.
3.5.2 Lower Cost Lateral Support Modification
The concept of lowering the construction costs for creating lateral support of the pavement design deal directly with modification of the shoulder area. The pavement shoulder is typically a lane wide, fully reinforced and tied to the main pavement structure. Modification of this segment includes shortening the shoulder width, reducing steel that ties the shoulder to the pavement, or widening the paving lane and eliminating the concrete shoulder all the way around. The widened lane with little or no shoulder is typically the simplest solution, but many designers require the shoulder for any number of reasons including safety, access, or construction phasing, and etc. The other approach of an untied shoulder is approachable by simply taking out some or all of the steel that connects the shoulder to the pavement. One major issue with CRC pavement has been uneven cracking and reflection cracking caused by the tied shoulders. This issue could be highly combatted by reducing the steel tying the shoulder, which also yield the benefit of lower pavement costs. The major argument with this would then be the idea of increased bending stresses at the pavement edge. Applying the PT steel design discussed previously would greatly improve this and another option would be the moving the longitudinal joint in between the wheel path and the widen lane would then extend into the typical shoulder area. Each of these items would yield additional benefits to the pavement structure while also improving construction costs of the overall roadway. The following sections discuss each concept in further detail and explain how they can be a function of some of the other modification processes.

64
3.5.2.1. Use of Jointed Concrete Shoulders & Untied Concrete Shoulders
In using jointed concrete shoulders, the idea is simple, adding while saw-cuts while reducing required steel will reduce the overall construction cost of the shoulder and therefore the pavement as a whole. Additionally, untied jointed shoulders can further reduce total pavement costs. Following a standard design procedure and using a 11inch thick two-lane pavement, we estimated a total savings of slightly over 5%.This savings can then be translated to other design properties or just utilized as a lower cost. The use of jointed and untied shoulders has shown no reduction in pavement performance and over the life cycle cost can still produces savings with minor joint sealing repairs anticipated.
Figure 52a. Typical Normally Distributed Cracking Pattern for CRC Pavement.
Figure 52b. Representative Normally Distributed Crack Widths for CRC Pavement.
Figure 52c. Representative Normally Distributed Crack Widths for CRC Pavement.
Use Largest CW
Use Smallest C Spc

65
3.5.3 Reduced Crack Variability and Surface Notching
CRC pavement typically has more transverse cracks (distributed over a range of crack spacing (Figure 52a)) than a jointed or plain concrete pavement, however, the widths of the cracks will tend to be much tighter due to the effect of the longitudinal reinforcing steel. The effect of the longitudinal steel is encompassed within the following factors:
the percent of steel reinforcement (%p),
the diameter of the reinforcement (db), and
the depth of the cover of the reinforcement (ζ).
As the %p increases, and the db and ζ decrease the average crack spacing ( L ) decreases. A model for
L used in the Pavement ME software is:
12
t envki
m b
ki b
fL
U Pf
c d
−=
+
where
L = Mean crack spacing (inch, design average crack spacing).
ft = Concrete tensile strength = 10% of fc”
env ki = Environmental stress
f = Subgrade friction coefficient
Um i = Peak bond stress for age increment i, psi = 0.002 * fc”
c1 ki = First bond stress coefficient computed for each progressive seasonal time increment
i basis.
c1 ki = 0.577 – 9.499e-09( )2ln
itot
itot
−
− + 0.00502Lk (ln Lk)
Lk = kth crack spacing, in
Pb = Percent steel, in fraction
db = Reinforcing steel bar diameter, inch
and
env ki = C ki * 0 i *
−
PCCh
21
66
where
hPCC = PCC slab thickness, inch
= depth to steel, inches
This cracking is mostly induced in a random nature but there are climatic driven effects that can force initially a regular spacing within the ultimate crack pattern. The variability of cracking from project to project is often normally distributed (as suggested by Figure 50a) but it is pointed out that it is dependent on many factors but attempting to regulate or control the cracking (via surface notching) is ideal in limiting widened transverse cracks and improper load transfer conditions. The cracking pattern can be induced by the use of surface notching which lends itself to a different framework for the design of CRC pavement. Presently, wheel load stress and slab thickness in the Pavement ME design software is based on the average cracking and crack width. However, if the designs were based upon the largest crack width and the shortest crack spacing, according to the level of reliability assumed for the design, the benefit of employing a controlled crack pattern would be clearly evident. Surface notching is important to employ as well in the vicinity of terminal ends or header joints.
The cracking on concrete pavements comes in most part from either shrinkage cracking or temperature cracking. The temperature cracking is really a function of the temperature gradient causing curling or warping and the loading stresses. This type of cracking is resisting by the design aspects of thickness. The major cracking item in CRC pavement is shrinkage though. The shrinkage cracking is found in all concrete pavements but without jointing CRC pavement is more prone to issues with it. Shrinkage cracking is a function of hardening and crystalline formation as in any concrete system.
3.5.4 Use of Active Curing Management
The performance of concrete pavements, including CRC pavement, is susceptible to the degree of support it experiences over its lifetime which interestingly enough is governed to a large extent by the climatic conditions at the time of construction; ambient temperatures and humidity’s drive the tendency for a slab to warp due to their effect on non-uniform drying shrinkage profiles that develop in the pavement shortly after construction. It is pointed out that upon first drying that a concrete slab is subjected to, the induced shrinkage strain is not entirely recoverable; some of it is permanent. This means as the surface of a PCC pavement dries out and the moisture level below remains at a relatively high level, an upward warping of the slab occurs along the edges and corners. The amount of permanent strain depends on many factors, such as the type of curing as well as the PCC mix design. As part of the drying shrinkage in PCC is irreversible, the remaining reversible portion varies with the ambient relative humidity.
PCC paving is often subjected to positive temperature differences due to solar radiation and the heat of hydration. The PCC slabs are likely flat when they harden, but depending on ambient exposure conditions at the time of placement, a significant amount of positive temperature gradient (which constitutes the zero-stress gradient) may be present at the time of hardening. The temperature and moisture conditions that were present at the time of the ASTM C 403 final set of the concrete can

67
possibly serve as a reference for the zero-stress gradient (prior to creep strain shifting the reference point). Whenever the temperature gradient in the slabs fall below the amount locked (after creep has taken place) into the slab at the time of construction (the zero-stress gradient), the slabs attempts to curl upward causing tensile stress at the top of the slab, which can lead to top-down cracking. Thus, an effective negative temperature equivalent linear gradient is permanently built into the slabs in terms of the stress ratio r. The stress associated with 𝜀𝑠𝑒𝑡 is reported with respect to a ratio r between the flexural stress due to load and the flexural strength of concrete as:
𝑟𝑠𝑒𝑡 =𝜎
𝑀𝑂𝑅
where σ is the equivalent built-in curling and warping stress level derived from the set strain determination and modulus of rupture (MOR) is the modulus of rupture of the concrete. Values of rset typically range from 0.08 to 0.20.
In terms of erosion resistance, it is important to minimize the magnitude of the built-in gradient. Active curing management which includes the technique of internal curing (described in Volume 2) can be effective in reducing the built-in set. Built-in set creates an erosive condition and the loss of interfacial resistance previously discussed. This results in reduced effective thicknesses and performance life. The best use of internal curing is one is in the reduction of spalling distress in CRC pavements which is largely a function of the coarse aggregate type and the method of curing [24]. The internal curing idea commonly utilizes a modified fine aggregate that allows the pavement to properly hydrate at a slower rate, reducing shrinkage. This fine aggregate is more commonly available now and only slightly increases the concrete cost of roughly 1.5%, if any increase at all. Since internal curing is not effective in reducing the built-in set, its effect is not included in the analysis of performance carried out in the following section.
3.6 COST & LIFE CYCLE ANALYSIS OF DESIGN MODIFICATIONS
The previous four subjects discussed are broken down into seven main design related parameters that can be directly changed to represent a cost variation and pavement life variation. The change in pavement life will be directly related to reduction in wheel load stress that is applied. These seven modifications include alterations to the:
• percent of steel (%p);
• cover or position of steel;
• build-in set of the pavement or curing (rset);
• use of post-tensioning steel (PT);
• terminal end transition and use of surface notching (SN);
• degree of bond (xb); and
• amount of reinforcement in the shoulder (SLT).
The control level that is applied for comparison is relative to a basic optimized CRC pavement design.
68
For cost comparisons, each parameter will be compared to the control cost of the individual parameter itself, as well as the total cost of a CRC pavement using the control values set. This control value for cost yields a CRC pavement of 10.5 inches and is meant to be representative of nearly all applicable items from concrete material costs, to reinforcement, to labor. The value used for the control level of pavement is $46.80 per square yard. This number may vary from case to case, but for the purposes of this analysis, the cost includes relevant items that can be used to demonstrate the change in pavement costs from one parameter to the next.
In calculations of the life improvements, the modifications are changed from the control level to the high or low level and the change in wheel load stress is a representation of the increase or decrease associated with the wheel load stresses of the control level. Depending on the parameter, the analysis designates improvements in applied stresses from loading with the dominant stress that the specific parameter deals with. In summary, the stress that is most applicable to that parameter is the target stress of improvement and the basis of the comparison to the overall change in pavement life.
3.6.1 Construction Costs and Structural Changes From Proposed Modification Parameters
3.6.1.1 Percent Steel Content (%)
The percent of steel in a CRC pavement directly impacts the functionality and the cost of the pavement structure as a whole. The more steel that is in the design, the higher the cost of the pavement, but this does not necessarily mean that the life increases proportionally. There is an optimum steel content for each category of cost and pavement life. For this analysis we will use a 10.5 inch pavement, assuming that the steel is in the center location of the pavement (the next topic of Cover/Position of Steel will cover this aspect), and the remaining parameters of bar size and bar spacing that represent the percent of steel will be discussed.
Many government agencies and design consultants will have their own set of standards or guidelines to follow when selecting the bar size and spacing for the desired percent steel, which then slightly affects labor costs of placing and securing the reinforcement. For simplicity purposes, the material weight costs and labor costs will be proportionally related to the change in percent steel (i.e. change in spacing), but for the wheel load stresses and improvement of pavement life, the implications of changing bar size or spacing are discussed.
For cost analysis, percent steel is straight forward, more steel means more money. Research indicated an average percent steel of 0.63 percent in CRC pavements. This value of 0.63 will be used as a control value, so in comparing the appropriate range, a high value of 0.75 percent and a low value of 0.60 percent was used. The costs associated with percent steel are based off the most recent price of rebar at $650 per ton. This comes from a quote for 75, 40-foot length bars. Using a control level of 0.63% steel, for a 10.5 inch pavement, the cost of reinforcing steel is roughly $7.88 per square yard. The decrease in reinforcing steel to 0.60% steel then yields a $7.50 per square yard cost, or a 4.8% savings in the reinforcement of the pavement design. On the high level, 0.75% steel would then give you a $9.38 per square yard cost, or a 19% increase in reinforcement costs. When comparing this to the total cost of a 10.5 inch pavement, which equals roughly $46.80 per square yard using the

69
control levels of the improvement/modification parameters, the change in pavement cost is 3.2% increase for the high level and about a 1% savings for the low level.
Although this is only a small savings, in the analysis of pavement life, the research has found that the decrease in reinforcing steel actually results in a lower restraint to the concrete, reducing the stress induced and therefore increasing life. The low level of 0.60 only slightly reduces the stresses involved, but when compared to the high level of 0.75% steel, the reduce in stress that comes from the steel restraining the concrete is much greater and therefore results in a much better pavement design. The high level of 0.75% steel is more commonly being used and therefore lowering the value of percent steel to an extent, can increase pavement life.
3.6.1.2 Cover or Position of the Steel
The cover above the reinforcing steel plays a role in stresses induced into the concrete which affects crack formation as previously noted. Changing the amount of cover not only reduces the average crack width but also influences the stiffness of the transverse crack which improves the resistance of the pavement to wheel load stress. The higher placement of the steel leads to tighter cracks and better load transfer and lower wheel loaded stress.
The costs that are associated with changing the amount of cover are simply the costs of changing the chairs, which in a square yard of pavement there is roughly 2 or 3 chairs maximum. This change is only cents on the dollar, possibly $0.10 to $0.15 for the high level of 2.5 inches of cover, which when compared to the $46.80 per square yard cost of pavement, is less than a half a percent. Therefore, any increase in life can be considered beneficial, while remembering that too high of placement can result in spalling which is not the desired design for any pavements.
3.6.1.3 Pavement Set or Curing (Rset)
The next parameter to be modified is pavement set during hardening and will be referred to as rset. The set that is induced from the concrete drying is highly influential to the internal stresses formed and the amount of curling the pavement may experience. Controlling rset represents the effect of the curing practice and the weather conditions on set of the slab. In CRC pavement, a negative set (increased value of change) will increase the top stresses and the opposite will lower them. This also plays a role in the degree of bond by affecting the strength of the bonded interface. Active curing management is needed to lower the value of rset to prevent these stresses. So therefore, wheel load stress (WLS) is affect by the presence of a set gradient and the reduced effective thickness of the slab due to the loss of bond. Internal curing is not assumed to be an effective deterrent to the formation of a built-in set unless active curing management is employed during construction where for this analysis its effect on performance is considered negligible.
The values represented are shown as the percentages of reduced strength caused by set of the pavement. This means a lower value results in a higher pavement strength. For the control level of pavement set, a more standard use of curing is applied to yield a rset of 0.12. The control level of curing is equivalent to about $250 per day, assuming that roughly 2000 to 2400 feet can be poured per day. This cost is then related to square yards by simply converting this full length to square yards and dividing by the cost per day. The low level of rset is 0.10, which is representative of fully active

70
curing management, which is about $800 per day for the same 2400 foot long section. The high level 0.20 is representative of minimal, or virtually no proper curing, and yields a $0 value of change. This results in $0 for the high level; about $0.30 per square yard for active curing, or the low level; and $0.10 per square yard for control level of partially cured.
3.6.1.4 Post-tensioning (PT)
The next parameter is one of the new concepts, post-tensioning of the transverse reinforcement that has been previously explained in detail. Post-Tensioning (PT) will have two direct effects to the pavement, (1) to reduce the wheel load stress level by a counter horizontal stress level and (2) it will reduce slab curvature thus improving slab/subbase contact. So wheel load stress is then affected by the reduced stress and the improved interfacial bond.
The post-tensioning steel can also function as an induced compressive strength and when applying stress sufficiently, can allow for a thinner pavement design. This idea of increased strength allowing for a thinner pavement design can more than offset the increased costs of the post-tensioning steel. A 1 inch reduction in pavement thickness is close to offsetting the increase, and a 2 inch thickness reduction results in a net savings. This application has been a part of this research, but for the cost and life comparison analysis, the post-tensioning is applied with NO reduction in thickness applied.
Considering fully post-tensioning 100% of the transverse steel as the high level of modification, the low and control levels of modification will simply be no post-tensioning or a value of 0. The post-tensioning is the most expensive of the modification parameters, but essentially would be offset if reduced pavement thickness was used. The post-tensioning was calculated to be an increase costs by up to $15.08 per square yard. The benefit in life is substantial but depending on the how the dollar value of the pavement restricts the design, the feasibility of this modification alone is only applied in certain cases. The use of multiple combinations of the parameter modifications can create an overall balance and beneficial design or application for all situations.
3.6.1.5 Surface Notching or Terminal End Design Improvement (SN)
If the smallest crack spacing and tightest crack width as previously described is employed to unmask the effect of the variance with random cracking, the effect of induced cracks, or surface notching, to control cracking will become evident. The effect on wheel load stress will be indirect via the crack spacing and crack width. Surface notching is one of two methods for inducing cracks and this idea of inducing cracks is predominantly necessary to use at the proposal transition shown in the Figure 18 terminal end transition for CRC pavements. Terminal ends are within the last 100 feet of paving and similar to header joints or any transverse construction joints that may be present the pavement. The terminal ends show the most movement toward the middle section of the pavement and yield the larger crack spacing. Large crack spacing results in the larger crack widths, that then reduce aggregate interlock or load transfer, and allows more water infiltration. The second method of inducing cracks is the use of “crack inducers”, which are similar to pieces of angle iron or L-shape beam. They are thin, while still rigid, and are secure to the base layer to serve as a sort of saw-cut from the bottom. Each of these two methods was used in the research in Victoria, TX to test their effectiveness. Due to the much higher costs of the metal, and the constructability issues, only the surface notching will be considered in this analysis.

71
The surface notches have also been used in other cases where only half the length of the joint is saw-cut and still results in a crack formation. Utilizing this idea of half-cuts, the surface notching costs increase the cost by $0.45 to $0.90 per square yard depending on the circumstance. The more conservative value of $0.90 per square yard will be considered for this case. The benefit in life is more indirect though with the controlled cracking assuring maximum benefit of the CRCP structure. The low level and control values use are 0 to represent no notching and random cracking potential. The high level uses the surface notching and a value of 1. In applying this concept, the pavement benefit is only to be considered in the specified terminal ends.
3.6.1.6 Degree of Bond (XB) Versus Potential for Erosion
The degree of bond versus the potential for erosion is one of the main modifications to improve pavement life and reduce cost. The degree of bond is related to the amount of restriction between the concrete and base layers. If the degree of bond is too high initially as previously noted the cracking spacing to become too high, resulting in large crack widths being distributed throughout the cracking pattern. The effect on WLS from the change in percent bond will indirectly be related to the crack spacing and crack width. For the erosion modeling, the life improvement used in the analysis is more directly related to the change in wheel load stress, in that an voiding below the slab highly increases it. Any erosion relevant then affects the effective slab thickness along the edge of the CRC pavement, and a thinner pavement means a decreased life. Also, the distresses directly connected to erosion are some of the most detrimental to CRC pavements. The degree of bond is restricting to the slabs, but is desired around the edges to reduce wheel stresses or any additional bending, as discussed. With this idea, the use of a balanced bond and erosion model can be conceptualized and allow for a better performing pavement.
The degree of bond is represented as a value from 0 to 1. Typically the “bond breaker” that is specified in many design standards, is an asphalt layer which has been found to result in a fully bonded pavement structure. The HMA layer is related to 100% bonded or a value of 1 for the high level. The low level of bond is 0% or a value of 0 and is considered a design that uses no interlayer placed on the base course. The control value will represent the more recent new design of an inverted prime layer. This layer has a degree of bond equal to 30% or 0.3, and the layer is basically made of an asphalt layer sprayed down with a crushed, small, graded aggregate sprinkled over the surface. The full asphalt layer equals around $8.00 per square yard of the paving costs so the low level of no interlayer is a savings of $8.00 per square yard. The control level of using the newer inverted prime coat has a cost of roughly $2.40 or a savings of $5.60. As related to the total paving costs, using the high level of bond yields a cost of $52.40 per square yard or an increase of 12%. The low level of bond then gives a lower paving costs $44.40 or a 5% savings.
3.6.1.7 Shoulder Longitudinal and Tie Bar Steel
Reduced reinforcement in the shoulder will tend to lead to sympathy cracking in the CRC pavement mainline due to the joints in the concrete shoulder, potentially leading to widened cracks in the mainline pavement. The movement restrictions come from the difference is crack spacing of the two lanes. To avoid cracks reflecting into the main lanes, this concept will require reducing the tie bar amount in order to limit the restriction from differential movement. The effect on wheel load stress will be via the load transfer along the longitudinal joint of the shoulder joint. This concept does not

72
add any length of life to the pavement, but if properly utilized will not reduce the life any as well. The main push for this concept is the large amount of savings that is involved with taking the steel out of the shoulder. Some literature has found that limiting the tying steel or spacing of the tie bars can ultimately reduce the restriction of movement enough to not cause the widened reflection cracks to appear.
For the control and low levels of analysis, the longitudinal steel is completely removed but there is a difference in the tying steel used. For the control level, a typical design is used of #5 tie bars spaced at 30 inches on-center and is representative of a 50% load transfer value. The low level used a much lower amount of #4 tie bars spaced at 50 inches to represent a 25% load transfer. For the high level, the shoulder is full reinforced and tied with #5 bars spaced at 30 inches on-center to yield a maximum load transfer of 60%. The low level and control level yield a savings of about $9.40 per square yard when only considering the shoulder lane paving. For a typical 3 lane highway, the saving would divide into all three lanes yielding a saving slightly over $3.00 per square yard. The possibly of reduced life from reduced longitudinal load transfer can further be combatted by a widened lane concept or moving the longitudinal joint location. For the simplicity of this analysis the simple option of changing the tying steel without moving the joint will only be considered. This modification method along with some of the other may be used to benefit one another even more in designing the best possible pavement configuration.
3.7 DESIGNING A BALANCED & IMPROVED CRC PAVEMENT
A summary of the individual modification variables, the low, high and control, level considered are shown in the table 5.
Table 5. Summary of Cost Reducing Improvement/Modifications for CRC Pavement
Variable Unit Low level (-) High level (+) Control
X1) - %P % steel 0.6 0.75 0.63
X2) - Steel cover inches 5.25 in 2.5 in 4.75 in
X3) - Controlling rset % of strength as reflected by the value of rset
0.1 0.2 0.12
X4) – Post Tensioning (PT)
psi 0 100 0
X5) - Surface Notching @ 95% rel
ft Random cracking
Surface Notching Random cracking
X6) - Degree of Bond; % of full bond 0 1 0.3
X7) - Reduced shoulder reinforcement
% LT cross the shoulder joint
25 60 50 – @ standard tie bar size and spacing

73
Using each of these modifications together results in a number of different combinations that yield cost savings, increased pavement life, or a combination of both. Any measure to improve upon the performance and cost effectiveness of CRC pavement will need to maintain a balance between the following aspects of design:
• Longitudinal and transverse wheel load stresses
• Development of a uniform cracking pattern
• Maintenance of a frictional contact between and slab and the base layers
WLS in a CRC pavement develop mainly in three locations: top transverse, bottom transverse, and bottom longitudinal. The first location becomes critical in cases of low load transfer both transversely and longitudinally or when erosion develops, the section location becomes critical in cases of high longitudinal load transfer or when erosion develops, and the third location increases to a limit as the cracking spacing increases; this stress location rarely is a concern in design.
Development of a uniform cracking pattern is always of concern and any measures that limit that may lead to widened transverse cracks. Early developing cracks tend to become wide after time; use of surface notching tends to eliminate that tendency but widened cracks potentially can erode over time and punchout eventually. Even though internally cured CRC pavement tends to create widely spaced cracks initially, those thus far have not appeared to widen over time but this aspect deserves a closed look.
Full slab support has been recognized for many years in the concrete pavement design community has a key feature in pavement performance but rarely has it been discussed relative to the impact of built-in curling and warping behavior of the life of pavement structure. Built-in gradients are often drying shrinkage driven (i.e. negative warping) and are a concern in the transverse direction with regard to a CRC pavement structure. For a top-down cracking mechanism that is most predominant in a CRC pavement structure, any negative built-in gradient will diminish the structure performance of a CRC pavement with regard to two aspects:
• Loss of contact with the subbase support
• Increased WLS
Loss of contact means a lack of frictional interfacial restraint and reduced effective slab thicknesses which is also a consequence of erosion action along the base/slab interface. The entire focus of active curing management is to minimize negative built-in gradients. Internal curing did not appear to be effective in achieving this objective but further evaluation is this regard is warranted. Use of PT tended to counter the negative effects of built-in set.
The seven factors listed in the Table 5 were configured in the form of 27 factorial design in order to isolate various main effects as well as selection combinations of these main effects. Using a factorial analysis, the combinations were summarized and plotted to illustrate the breakdown of overall benefit. The cost analysis uses a reference pricing of paving CRC for a 10.5 inch pavement and then the increase or decrease in price is shown as a percent change of that reference price (in this case

74
$46.80 per square for paving using the control level parameters). In considering pavement life, the longevity of a 10.5 inch concrete pavement was analyzed with respect to the various combinations. This analysis was conducted for a set load level for each combination but the WLS level varied from combination to combination. Therefore, the proposed modifications of this study was based on changing the wheel load stresses and interpreting the results relative to the change in pavement life. Therefore in each case cost increase or decrease due to the modification and its effect on pavement life were combined in the form of a ratio where a coefficient associated with the effect of a specific combination determined. These coefficients were plotted in Figure 53 in the form of bar graph to allow for comparison. The cost effectiveness shown in Figure 53 represents the cost to improve CRC pavement performance versus the expected life extension provided by the improvement.
Figure 53. Cost Effectiveness of Selected Design Features for CRC Pavement.
The largest and most cost effective measure was the use of PT of the transverse reinforcement followed by surface notching. The most negative effect on cost and performance is ignoring the development of set and its effect on erosion potential. There is also benefit in increasing steel content and reducing the cover in order to improve crack development.
3.8 CONCLUDING STATEMENTS/RECOMMENDATIONS
This volume report addresses the following key items
• A summary of a structural analysis of CRC pavement behavior due to environmental induce loading.
• A review of an approach for the evaluation of bond along the base/slab interface of a CRC pavement structure, the development of laboratory test procedure in which to evaluate it, and a model to represent it in design and performance analysis, and
• A review and assessment of measures to enhance the cost effectiveness of CRC pavement construction.
-0.4
-0.3
-0.2
-0.1
0
0.1
0.2
0.3
%p
X1
rset
X3
SN X
5
Shld
LT
X7
X1X
3
X1X
5
X1X
7
X2X
4
X2X
6
X3X
4
X3X
6
X4X
5
X4X
7
X5X
7
X1X
2X3
X1X
2X5
X1X
2X7
X2X
3X5
X2X
3X7
X3X
4X6
X4X
5X6
X5X
6X7
X1X
2X3X
5
X1X
2X3X
7
X2X
3X4X
6
X3X
4X54
X6
X4X
5X6X
7
X1X
2X3X
4X6
X2X
3X4X
5X6
X3X
4X5X
6X7
X1X
2X3X
4X5X
7
Life
Ext
en
sio
n R
atio
Design Combinations

75
The stress analysis reviewed in Chapter 1 indicated a variety of sources of crack initiation that vary based on steel configures and amount. Varying the amount reinforcement and it cover can certainly provide benefit to the long-term performance of CRC pavement but the use of surface notching has been explored for over 20 years and the benefits that can be derived from its adoption as a standard in CRC pavement construction can no longer be dismissed. It is by far the most cost-effective means to eliminate cluster cracking and create a uniform cracking pattern. The use of the terminal end transition should also reduce maintenance of the construction joint.
CRC pavement is a good candidate for the use of stiff base support but not for highly bonded conditions. Even though further research and examination is warranted, preliminary research supports the use of an ‘inverted’ seal coat as an alternative to the use of an HMA so-called bond breaker base layer often placed between the slab and a stabilized base layer. During initial crack development, a CRC pavement structure must be afforded the freedom of movement to develop fully developed cracks that penetrate the full thickness of the slab. This can be achieved by the use of less restrictive base layers that allow the necessary movement yet limit erosion wear over time. The ‘inverted’ seal coat layer allowed initiate movements yet provide good frictional resistance subsequent to that.
The cost effective analysis shows how each modifications effects performance but the most beneficial measure is the use PT of the transverse reinforcement. It reduces WLS, counteracts built-in set, stiffens and improves the load transfer of the longitudinal joint.

76
REFERENCES
1. Ayatollahi, M. R., Mirsayar, M. M., & Nejati, M. (2010a). Evaluation of first non-singular stress term in bi-material notches. Computational Materials Science, 50(2), 752-760.
2. Charalambides, P. G., Lund, J., Evans, A. G., & McMeeking, R. M. (1989). A test specimen for determining the fracture resistance of bi-material interfaces. Journal of Applied Mechanics, 56(1), 77-82.
3. Choupani, N. (2008). Mixed-Mode Cohesive Fracture of Adhesive Joints: Experimental and Numerical Studies. Engineering fracture mechanics, 75(15): p. 4363-4382.
4. Evans, A. G., Dalgleish, B. J., He, M., & Hutchinson, J. W. (1989). On crack path selection and the interface fracture energy in bi-material systems. Acta Metallurgica, 37(12), 3249-3254.
5. Jeong, J. H, Zollinger, D. G. (2001). Characterization of stiffness parameters in design of continuously reinforced and jointed pavements. Transport Res Rec: J Transport Res Board; 1778:54–63
6. Ioannides, A.M., Khazanovich, L., and Becque, J.L. (1992). “Structural Evaluation of Base Layers in Concrete Pavement Systems.” Transportation Research Record 1370, Transportation Research Board, Washington, D.C., pp.20-28.
7. McCullough, B.F. and W.B. Ledbetter. (1960). “LTS Design of Continuously Reinforced Concrete Pavement,” Proceedings, ASCE, Vol. 86, HW4, pp. 1-24.
8. Mirsayar, M.M., Aliha, M.R.M., & Samaei, A.T. (2014). On fracture initiation angle near bi-material notches – Effect of first non-singular stress term, Engineering Fracture Mechanics, 119, 124 -131.
9. Mirsayar, M. M. (2014a). On fracture of kinked interface cracks–the role of T-stress. Materials and Design, 61, 117-123.
10. Mirsayar, M. M., & Park. P. (2015). The role of T-stress on kinking angle of interface cracks. Materials and Design, 80, 12-19.
11. Mirsayar M. M., Shia X., and Zollinger D. G. (2017). Evaluation of interfacial bond strength between Portland cement concrete and asphalt concrete layers using bi-material SCB test specimen. Engineering Solid Mechanics, Volume 5 Issue 4 pp. 293-306.
12. Mousavi, A., and Aliha, M. (2016). Determination of fracture parameters for a bi-material center cracked plate subjected to biaxial loading using FEOD method. Engineering Solid Mechanics, 4(3), 117- 124.
13. Palmer R. P. A, (1988). mechanistic model for the prediction of stresses, strains, and displacements in continuously reinforced concrete pavements [Dissertation]. College Station, Texas: Texas A&M University;.
14. Rao, S., and Roesler J.R. (2005). Characterizing effective built-in curling from concrete pavement field measurements. Journal of Transportation Engineering, 131(4): p. 320 – 327.
15. Tayabji, S. D., Zollinger, D. G., Vederey, J. R., Gagnon, J. S. “Performance of Continuously

77
Reinforced Concrete Pavement, Volume III - Summary.” Federal Highway Administration, 1998.
16. Yu, H.T., and Khazanovich, L., and M.I. Darter. Consideration of JPCP curling and warping in the 2002 design guide. Transportation Research Board 83rd Annual Meeting. Washington, D.C.: Transportation Research Board; 2004.
17. Zollinger, Corey, Dan G. Zollinger, Dallas Little, and Adel Godiwalla, (2005) Innovative Approach to Pavement Rehabilitation Analysis and Design of Runway 15L-33R at George Bush Intercontinental Airport in Houston, Tx,” Proceedings, Eighth International Conference on Concrete Pavements, August 14-18th, Vol. 3, pp. 1101-1119, Colorado Springs, Colorado.
18. Bari, Muhammad Ehsanul and Dan G. Zollinger, “New Concepts for Assessment of Concrete Slab Interfacial Effects in Pavement Design and Analysis,” International Journal of Pavement Engineering, Taylor and Francis Group (UK), 2015 http://dx.doi.org/10.1080/10298436.2014.993183
19. Mirsayar, M. “On the Use of Interfacial Fracture Mechanics Approaches for Evaluation of the End Movement in Concrete Slabs,” Ph.D. Thesis, Texas A&M University, December 2016.
20. Zollinger, Dan G., and Jorge Soares, “Performance of CRC Pavements: Volume VII: Summary,” Final Report, Final Report, FHWA-RD-98-102, PCS/Law Engineering, February 1999.
21. Fundamentals of Materials Science and Engineering – An Integrated Approach, W. D. Callister and David G. Rethwisch, 3rd Edition, Wiley (2008).
22. Roesler, J.R. and Huntley, J.G., Performance of I-57 Recycled Concrete Pavement, Final Report ICT-09-032, Illinois Center for Transportation, University of Illinois, Urbana, IL, January 2009, 117 pp.
23. Tayabji, S. D., Zollinger, D. G., Vederey, J. R., Gagnon, J. S. “Performance of Continuously Reinforced Concrete Pavement, Volume III - Summary.” Federal Highway Administration, 1998.
24. Nelson, Rick, Terry Dossey, Dan Zollinger, and B. Frank McCullough, “Evaluation of the Performance of Pavements Made with Different Coarse Aggregates,” Research Report 3925-1F, Center for Transportation Research, The University of Texas at Austin and the Texas Transportation Institute, Texas A&M University, November 1997.
25. Kadiyala, Subrahmaya M. and Dan G. Zollinger, "Analysis of CRC Pavement under Moisture, Temperature, and Creep Effects," Proceedings, Fifth International Conference on Concrete Pavement Design and Rehabilitation, April 20-22, 1993, Vol. 2, pp. 211-236, Purdue University.
26. Ioannides, A.M. (1990). “Dimensional Analysis in NDT Rigid Pavement Evaluation.” Journal of Transportation Engineering, Vol. 116, No. 1, pp. 23-26.
27. Evans, A. G., Dalgleish, B. J., He, M., & Hutchinson, J. W. (1989). “On Crack Path Selection and the Interface Fracture Energy in Bi-Material Systems,” Acta Metallurgica, 37(12), 3249-3254.
28. M Mirsayar and D Zollinger, “Factors influencing stresses and movements in continuously reinforced concrete pavements–A review,” Engineering Solid Mechanics, Growing Science, pp

78
67 -82, 2017, https://doi.org/10.5267/j.esm.2017.10.002
29. Rao, Chetana and Michael Darter, “Evaluation of Internally Cured Concrete for Paving Applications,” Applied Research Associated, Inc., Champaign, IL, Sept 2013.
30. Ye, Dan, Mukhopadhyay, Anal K, Zollinger, Dan G., “Best Practices for The Use of Siliceous River Gravel in Concrete Paving,’ Research Report 0-4826-1, Texas Transportation Institute, The Texas A&M University System, College Station, Texas, February 2009.
31. Jung, Youn, and Dan Zollinger. 2011. New laboratory-based mechanistic-empirical model for faulting in jointed concrete pavement. Transportation Research Record (2226): 60-70, http://dx.doi.org/10.3141/2226-07
32. Bakhsh, K. and Zollinger, D., “Faulting Prediction Model for Design of Concrete Pavement Structures,” Geo-Shanghai 2014, ASCE Pavement Materials, Structures, and Performance, pp. 327-342, http://dx.doi.org/10.1061/9780784413418.003

79
APPENDICES
APPENDIX A
The next section discusses how the transverse post-tension design is laid out and installed in the field. The layout of the bar placement and the overall design has three main options, as previously noted. Each option is explained but note that Option 1 is the recommended method which consists of the continuous bar system, while the project demand denotes the final decision. The post-tensioning method has some options to choose from as well, each having their own benefits applicable to the construction demands. Each option is explained, and the overall bar installation is revisited.
The bar layout simply follows the idea of replacing the transverse rebar that would have been in place in the typical CRC pavement, with smooth rigid bars. Some designs may call for additional bars or closer transverse spacing to reach required stress input. Three options are discussed and all of which use the same components but break down the bar installation according to paving width or design requirements. Option1 is a continuous bar system and the most simplistic, while Options 2 and 3 use shorter bar lengths or a combination of options as required by specific project needs. The third option varies from the other option in that it is segmented and to be post-tensioned from both edges of the pavement. Each option is discussed in further detail.
A.1 Bar Layout Option 1 (Continuous Bar, One Side Post-tensioned)
The Bar Layout Option 1 is the suggested option and the concept currently most investigated. Option 1 is a continuous span bar with the length of the bar being specific to the pavement width. In each of the layouts the bars are threaded the same and similarly installed the same. The installation of Layout 1 only requires the minimum additional labor of placing the anchorage ends and post-tensioning plate onto the bar and then having the bar placed where the transverse steel would have been. Figure A.1a depicts the layout of the continuous bar Option 1.
A.2 Bar Layout Option 2 (Coupled Bar by Lane, One Side Post-tensioned)
The second layout option requires the same components and installation as Option 1, but also includes a coupler, and small block-out that are easily installed with each lane paved. With Layout Option 2 being a more viable set up for multi-lane paving, the coupler addition allows a project to use the same bars throughout the construction. The option only calls for the installation and use of the anchorage end and post-tensioning end at the beginning and ends of the entire paving project. The cost benefit ratio of using shorter bar lengths versus increasing the number of bars to be threaded is a comparison specific to project needs. Figure A.1b shows a set-up of the coupled bar system. Each of these components are easily installed by hand and in a timely manner.

80
A.3 Bar Layout Option 3 (Split Bar System, Both Sides Post-tensioned)
Layout Option 3 (Figure A.1c) consists of a split or separate bar system that is post-tensioned from each end of the pavement. This option improves post-tensioning efficiency, while resulting in even tighter construction joints. This split bar concept can be implemented with a two-lane single paving operation or a multiple lane paving operation. This option allows for much flexibility with design in that the bars can be shorter bar lengths of only a single lane width, or each side can utilize the larger two-lane width bars. The coupling concept can also be implemented with this split bar design in the middle of the pavement width, to allow for improved stressing over the larger paving widths of five or more lanes. The image below depicts the split bar concept with the bars placed at a staggered spacing. Each of these options are summarized in Table A.1.
Figure A.1a. Bar Layout Option 1 – Continuous Bar Design.
Figure A.1b. Bar Layout Option 2 – Coupled Bar Design.
Figure A.1c. Bar Layout Option 3 – Split Bar Design.

81
Table A.1 Design Layout Options
Layout Options
Name Description Max Span Width (1 Bar = 13 ft. to 26 ft.)
Option 1 Continuous Bar
Single Continuous Bar across entire pavement width. Usually tensioned from one side.
1 Bar Length
Option 2 Coupled Bar
Coupled Bar connections across a pavement with multiple paving operations (for large projects the split bar system may also be implemented in center to increase total effective width)
4 Bar Lengths
Option 3 Split Bar
Offset Single Bars placed within a single paving operation, across a longitudinal joint or center line of pavement
2 Bar Lengths
(All Post-tensioning options are compatible with each of the layout options provided)
A.4 Anchor, pt bar, and post-tensioner Installation
The anchorage end of the bar is to be installed before the weight of the longitudinal steel is placed on top. The anchorage end is simple to apply. One nut is secured onto the bar and then the plate is placed on with the other nut securing it in-place. The anchorage ends may be welded on before, to reduce threading but this was not used in a case study for the fact that it creates a second bar type to be handled. With the current design, the bar is universally the same throughout the project.
The post-tensioning bar is simply installed by replacing the rebar with the smooth rigid bars. The bars are placed on the same chairs at the same center height of typical designs and the longitudinal steel is placed on top. Note that the sheath or greasing of the post-tensioning bars should be done before the longitudinal steel is placed.
With the anchorage end in place, the post-tensioning end is applied. The post-tensioning components applied before the bar is placed are the tensioning back plate and the block-out material. The tensioning nut, or securing nut, or jacking apparatus, depending on the option chosen, is applied at the later tensioning date. The post-tensioning options can each be applied to any of the post-tensioning layouts and use the same materials. The equipment requirements differ with options, but each carries its own advantages and disadvantages.
A.4.1 Post-tensioning Option 1
Post-tensioning Option 1 was the original method behind this design, utilizing the threading concept to facilitate constructability. This option requires a larger heavy-duty tensioning nut to pull on the

82
threads elongating the bar and tensioning the pavement system. The idea was to facilitate the use of a hand power tool to torque the tensioning nut enough to tension the bar to the desired amount. The use of a heavy-duty impact tool could be used in the field to reduce or save time with the overall concept being the least demanding on labor.
A.4.2 Post-tensioning Option 2
The second post-tensioning option still utilizes the same threading to secure the bar, but instead strains the bar using a tensioning jack. The tensioning jack adds another equipment requirement but also reduces on the material requirement of the tensioning nut. A simple locking nut is first threaded onto the bar and then the jack is threaded onto the end via a bar specific attachment.
The overall demand of the equipment is dependent of the post-tensioning option to be used but the slight modification to each item will require minimal design and should be considered universal to any project using the particular bar diameter. Each of these components could be operated by one individual from one side of the pavement.
A.4.3 Post-tensioning Option 3
Post-tensioning Option 3 is similar to Option 2 in that the same style equipment maybe use for tensioning but how the bar is secured is changed. In Option 3 the bar is not required to be threaded on the post-tensioning, instead the jacking device stresses the bar and a weld or wedge device is required to hold the bar in place. This option was least investigated to avoid the concept of welded connections.
A.5 Cables Replacing Rigid Bar Method
The idea of using a rigid bar allows for direct replacement of the rebar in-place, but the bar itself is of higher costs. Although the cost of the bar can be offset by the reduced concrete costs, the idea a adding a cable inside of conduit can also be implemented in this way. In the case of using cables, the rebar in-place will remain to support longitudinal steel and the cables will be run in between the rebar spacing. Even with the rebar not being removed, the cables greatly increase savings due to their much lower costs as compared to the rigid smooth bars. The amount of stress they are capable to induce is higher, resulting in increased strengths, and the ease of tensioning further reduces costs as compared to the rigid bars. The concept may require further maintenance costs in the life cycle breakdown, but the reduction of initial costs should still offset. This concept was not researched as the rigid bar design was the initial design idea, but after running the numbers of a cost analysis, transverse cables are a very viable method of improving CRC pavement while still producing design savings.