cost-effective youth corrections - justice … · cost-effective youth corrections: ... (juvenile...
TRANSCRIPT

COST-EFFECTIVE YOUTH CORRECTIONS: RATIONALIZING THE FISCAL ARCHITECTURE OF JUVENILE JUSTICE SYSTEMS

1
COST-EFFECTIVE YOUTH CORRECTIONS: RATIONALIZING THE FISCAL ARCHITECTURE OF JUVENILE JUSTICE SYSTEMS1 Introduction: How Does the Fiscal Structure of Juvenile Justice Funding Sometimes Cause Youth to be Sent to Secure Care?
In most states, juvenile delinquency is handled at the county-level, with youth being arrested by local police and processed in local courts. If they are adjudicated delinquent and sentenced to options such as drug treatment, mental health counseling, or community service, then the county must pay to provide these services. If the youth are sentenced to state secure confinement, however, they are sometimes sent to state institutions at little cost to the county. Locked confinement in a state institution is more expensive, sometimes running in excess of $60,000 annually compared to $10,000 or less for community supervision or services. In the 51 distinct juvenile justice systems that constitute how young people are treated in America’s justice system, it is sometimes cheaper for localities in some states and jurisdictions to send youth to state institutions than it is for communities to develop services to treat youth close to home. Such a financial architecture can lead to undesirable results. Counties often lack the financial means or incentive to expand local programs or services, so fewer of these options exist for youth than the demand would otherwise necessitate. Without local programs or services, judges may have little choice but to send youth convicted of marginal offenses to distant, locked facilities. As a result, youth have been locked in the state system simply because there was nowhere for them to go locally – and no easy way to pay for those services. Several states have altered the fiscal architecture of their juvenile justice systems to reduce the inefficient, ineffective and sometimes damaging affect of state systems that make it cheaper to send youth to state secure care. Some states provide financial reimbursement for costs incurred by counties to manage youth locally while requiring the county to pay part of the cost of confining a child in a state institution. Other states have simply increased the costs for counties to send youth to state institutions, and programs have grown naturally in localities where there had previously been no incentive to develop them before. Others have either done both or augmented both, with dedicated state funding streams, or eased the ability to pull down federal dollars to fund more local juvenile justice programming. A number of states have shown that by rethinking how they fund their juvenile justice systems, states and localities can succeed in keeping more youth at home, reduce the number of youth incarcerated, and promote better outcomes for young people moving through these systems.
1Tyler, Jasmine L.; Ziedenberg, Jason and Lotke, Eric. “Cost Effective Corrections: The Fiscal Architecture of Rational Juvenile Justice Systems” (2006). Washington, DC: The Justice Policy Institute.
2
Why Does it Matter How Many Youth Are Sent to State Institutions?
“Youth in the correctional setting learn more about how to be a criminal than about being reformed,” says Illinois Secretary of Human Services, Carol L. Adams.1
The funding incentive that drives youth towards state institutions might not be a problem if: 1) youth needed to be in secure confinement, 2) if secure confinement cost less than community services or programming, or if 3) secure care had a crime-neutral impact on recidivism and public safety. Most youth involved in the juvenile justice system can safely be managed without secure confinement. Most young people who come into the system bare little threat to public safety, and they can often be aided simply by structured or supportive interventions. Just 4 percent of people under 18 arrested in 2003 were arrested for a violent crime.2 There were 109 times as many juvenile arrests for running away as for homicide. Even deep in the system, among youth who have been adjudicated and committed, only 24 percent of youth in custody were convicted of crimes defined as seriously violent.3 State imprisonment is expensive, and it is not cost-effective to send youth to state institutions who do not need to be there. Incarceration, particularly for juveniles, is an expensive proposition. Each year, capital costs to build new facilities run in the range of $100,000 per cell and operating costs typically exceed $60,000 per cell.4 In comparison, community options such as drug treatment or counseling, including wrap-around services that make sure individuals get to school or work on time, rarely exceed $15,000 and often cost less than $5,000 per year. In the big picture, finding ways to manage youth in the community saves taxpayers’ money. In a 1998 study, Professor Mark A. Cohen of Vanderbilt University highlighted the cost of failing to provide adequate supervision and treatment to troubled youth. The study found that each teen prevented from adopting a life of crime (including, future adult offenses) could save the country between $1.7 million and $2.3 million per youth.5 Juvenile confinement reduces the chance that troubled youth will successfully transition to adulthood. New research driving local and state juvenile justice policy reform in America has shown that confinement is not only more likely to reinforce delinquent behavior in those already at-risk, but also has them picking up more delinquent skills than if they are treated individually. Congregate secure care can reinforce young people’s sense that they are not part of mainstream society, and further drives them away from it.6 Research on youth sent to state institutions has shown that incarceration correlates more highly with future criminal behavior than factors such as gang affiliation, weapons possession or family dysfunction.7 Research on detained youth has shown that: a) they are more likely to be adjudicated delinquent and committed to state institutions; b) youth who have been held in custody achieve less academically and are employed more sporadically than their similarly-situated non-confined peers.8 The costs and impact of state secure confinement is not borne equally by all young people, or all communities. Whatever the cost or impact of incarcerating youth in state facilities, that price is disproportionately paid by youth of color, and their communities. Ethnic and racial minority youth constitute roughly one-third of the total youth population in the United States, but they account for two-thirds of the youth confined in local detention and state correctional facilities.9 This disparity cannot be explained by disparate rates of unlawful behavior. One study found that among white and minority youth charged with the same offenses, African American youth with no prior admissions were six times more likely to be incarcerated than white youth. Latino youth were three times more likely to be incarcerated than white youth.10 With upwards of 50 percent of African American men under some form of criminal justice control in some cities, so many young people cycle in and out of juvenile justice institutions and prisons that some criminologists believe that mass incarceration has destabilized communities and raised their crime rates.11 In short, the experience of secure confinement can change the kind of routine law-breaking that is often part of adolescence into a stable pattern that, unfortunately, endures over time. States are actually paying additional money to generate worse outcomes in terms of future crime and criminal behavior.
Each teen prevented from adopting a life of crime (including, future adult offenses) could save the country between $1.7 million and $2.3 million per youth.
3
FIVE STATES THAT RATIONALIZED THEIR FISCAL ARCHITECTURE. Pennsylvania—“Act 148”
• State pays 80 percent of the county cost of community-based juvenile justice services. The county pays state 40 percent of the cost of state juvenile confinement.
• Three years after Act 148 was enacted in the late 1970s, there was a 75 percent increase in state subsidies for county programs; by the early 1980s, secure placements for juveniles dropped 24 percent.
California—“Realignment”
• County pays a fee, ranging from $150 to $2,600 a month, for use of state facilities, depending upon the level of offense.
• A separate, dedicated funding source (Juvenile Justice Crime Prevention Act of 2002) provides $100 million in funding each year for local juvenile justice programs. Between 1996 and 2003, the California Youth Authority’s population of incarcerated youth fell 52 percent, during a period when the juvenile crime rate fell 31 percent.
Wisconsin—“Youth Aids”
• Allocation for each county is based on the total county youth population and the number of juvenile arrests and county secure placements.
• A year after Youth Aids” was enacted in 1980, 25 counties shared $26 million in funding plus state capacity-building money for community alternative programs. Between 1995 and 2006, Milwaukee—the city within the biggest county—experienced a 74 percent decline in commitments to secure state facilities.
Ohio—“RECLAIM Ohio” • State provides counties with fixed financial support for community-based juvenile justice
services minus a fraction of the total for each youth sent to the state for handling. • Counties are allocated the savings based on their use (or lack) of commitments to state facilities
the previous year. • Between RECLAIM Ohio’s enactment in 1992 and 2004, the number of youths committed to
secure state care in Ohio fell 31 percent.
Illinois—“Redeploy Illinois” • County identifies target type of delinquent behavior or overall delinquent population and commits
to 25 percent reduction in corrections commitments from average number during the previous three years.
• State provides funding for the county to deliver services related to the targeted populations, particularly juveniles committed for court evaluations, and nonviolent offenders.
• Since starting in mid-2004, Redeploy pilot sites include the 2nd Judicial District (containing 12 rural counties) and in St. Clair, Peoria, and Macon. Preliminary projections suggest the four pilot sites will have a 33 percent reduction in commitments to the state by the end of year one, resulting in $2 million less being spent on youth incarceration costs.

4
Pennsylvania: Act 148 and Needs-Based Budgeting Pennsylvania Act 148 of 197612 changed the fiscal incentives that once encouraged counties to commit youth to state secure confinement facilities. As a result of the changes, the state and its counties are better equipped to develop and sustain a continuum of services to meet youth’s needs in their own counties. Act 148 and the resultant shift to Needs-Based Budgeting and Planning for youth services allows state funding to be used more flexibly to meet the local demand for services, and codifies public policy to develop true local continuums of services for young people.
Youth in Pennsylvania benefit from the fact that the state’s juvenile justice and child welfare programs are both administered by the state Department of Public Welfare (DPW). While other states have placed responsibility for juvenile justice in free standing agencies (such as departments of juvenile justice), Pennsylvania has kept its dependency and delinquency programs under one umbrella. This structure offers opportunities for planning services for youth who move between systems, and for breaking down the “funding silos” that often prevent services from following troubled and at-risk youth wherever they go. Pennsylvania’s juvenile justice system was once governed by the same incentives seen in other states. For example, it used to operate with the understanding that even though youth were arrested locally and could be managed with local or community resources, it often cost counties less to send delinquent children to distant institutions managed and paid for by the state. This financial architecture meant that Pennsylvania counties had little incentive to develop local programs or services for youth; consequently, there were fewer local treatment options than were needed. Judges often had little choice but to send large numbers of youth to locked state facilities.
Act 148 and the resultant shift to Needs-Based Budgeting and Planning for youth services allows state funding to be used more flexibly to meet the local demand for services, and codifies public policy to develop true local continuums of services for young people.
A 1968 juvenile case is emblematic of the funding problem Pennsylvania once shared with other states. Charles Wilson, age 16, participated in a minor street scuffle. According to the Pennsylvania Supreme Court, “No one was seriously injured in the course of the affray, and Charles’ participation was apparently confined to having thrown a few punches.”13 His previous record included an arrest (without prosecution) for using profane language and an adjudication for $8 worth of vandalism to school property when he was 13. He had received 14 months probation for that incident, which he completed successfully. Nevertheless, the juvenile court noted that Charles had missed a lot of school and had been suspended. Finding that he “seem[ed] to be in need of some stricter discipline,” the court sent him to the State Correctional Institution at Camp Hill for an indeterminate amount of time—to be released sometime before his twenty-first birthday. Eventually, this harsh sentence—longer than the adult maximum sentence for the offense—was overturned. Charles needed more intensive supervision, but there were no intermediate supervision programs in the community, largely because the funding for those services did not exist, and the state facility at Camp Hill was available. Act 148 reversed this incentive. Under Act 148, the counties pay a larger part of the cost of confining a child in a state institution than previously, encouraging them to develop local programs and services to keep troubled youth at home. Act 148: Cheaper to Treat Youth in the Counties—Close to Home Act 148 creates an incentive to develop additional capacity for local youth programs. While it does not mandate what services counties must provide, it creates an incentive structure that drives county planning in a clear direction. The DPW reimburses the counties for most of the costs of community-based services for children, while counties are required to pay 40 percent of the cost of confining a child
5
at a state facility. With such an incentive structure, counties are encouraged to develop systems that promote public safety by keeping troubled children at home or in their communities. Specific priorities include:
• Keeping children in a home environment. Act 148 provides for reimbursement of 80 percent of the cost of services designed to keep children at home. Eligible services include after-school programs, evening reporting centers, outpatient counseling, and case management services offered by private-sector providers. In appropriate cases it can include foster care or adoption, but the high reimbursement rates create an incentive to keep children in a home environment.
• Keeping children in their original communities. When judges find that youth must be
removed from their homes, Act 148 favors placements that allow them to remain in their communities. Reimbursement rates generally run at 80 percent for placement in group homes or other types of non-secure residential or treatment programs that allow children to attend public schools, use public recreational facilities, and hold jobs in their communities.
• Using less restrictive options. Act 148 discourages the most restrictive placements. It sets the
lowest reimbursement rates for secure detention in local facilities (50 percent) and secure residential or institutional commitments (60 percent). Thus, the financial cost of the most restrictive placement is the most onerous for the county.
Needs-Based Planning and Budgeting In the first few years after the Act 148 reimbursement formulas came into effect, concerns raised at both the state and county levels drove further policy refinements and inspired a budget-planning process to support and sustain local youth services. The state was concerned that Act 148 functioned like an uncapped entitlement. On the other hand, counties were concerned about being locked into an annual budget formula. If there were sudden change in the service needs for a given year—such as a increase foster care placements due to changing community conditions like increased unemployment or a drug epidemic—the counties could run out of state funds to meet local needs well before the end of the fiscal year. Act 148 was amended in the early 1990s to create a system of Needs-Based Planning and Budgeting. Under the amendment, each county’s welfare agency, with the participation and authorization of the local juvenile judge and probation department, develops a plan that shows both the predicted service needs for court-involved youth and how much those services will cost. DPW receives the submissions, tallies the approved costs for all 67 counties, and submits an aggregate budget allocation request to the legislature that takes into account the state share of county services. Needs-Based Planning and Budgeting allows counties to plan more accurately and request funding for the services they need, and allows the state to better meet the demand for services. In 2004, Needs-Based Planning and Budgeting was administratively incorporated into a larger Integrated Children’s Services Plan at the county level. This expanded the number of child-serving systems at the table to include other systems such as mental health and drug and alcohol services. This effort began a process of eliminating the “silos” of service delivery.
6
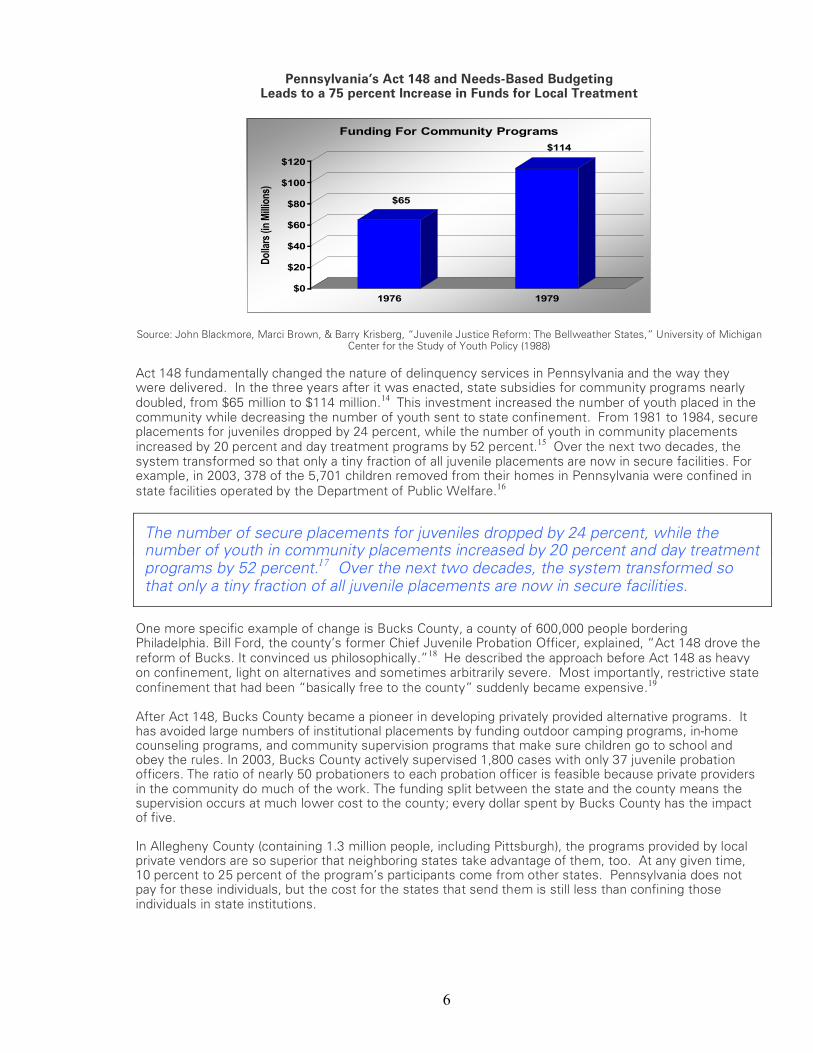
Pennsylvania’s Act 148 and Needs-Based Budgeting Leads to a 75 percent Increase in Funds for Local Treatment
$65
$114
$0
$20
$40
$60
$80
$100
$120
Dol
lars
(in
Mill
ions
)
1976 1979
Funding For Community Programs
Source: John Blackmore, Marci Brown, & Barry Krisberg, “Juvenile Justice Reform: The Bellweather States,” University of Michigan Center for the Study of Youth Policy (1988)
Act 148 fundamentally changed the nature of delinquency services in Pennsylvania and the way they were delivered. In the three years after it was enacted, state subsidies for community programs nearly doubled, from $65 million to $114 million.14 This investment increased the number of youth placed in the community while decreasing the number of youth sent to state confinement. From 1981 to 1984, secure placements for juveniles dropped by 24 percent, while the number of youth in community placements increased by 20 percent and day treatment programs by 52 percent.15 Over the next two decades, the system transformed so that only a tiny fraction of all juvenile placements are now in secure facilities. For example, in 2003, 378 of the 5,701 children removed from their homes in Pennsylvania were confined in state facilities operated by the Department of Public Welfare.16
The number of secure placements for juveniles dropped by 24 percent, while the number of youth in community placements increased by 20 percent and day treatment programs by 52 percent.17 Over the next two decades, the system transformed so that only a tiny fraction of all juvenile placements are now in secure facilities.
One more specific example of change is Bucks County, a county of 600,000 people bordering Philadelphia. Bill Ford, the county’s former Chief Juvenile Probation Officer, explained, “Act 148 drove the reform of Bucks. It convinced us philosophically.”18 He described the approach before Act 148 as heavy on confinement, light on alternatives and sometimes arbitrarily severe. Most importantly, restrictive state confinement that had been “basically free to the county” suddenly became expensive.19 After Act 148, Bucks County became a pioneer in developing privately provided alternative programs. It has avoided large numbers of institutional placements by funding outdoor camping programs, in-home counseling programs, and community supervision programs that make sure children go to school and obey the rules. In 2003, Bucks County actively supervised 1,800 cases with only 37 juvenile probation officers. The ratio of nearly 50 probationers to each probation officer is feasible because private providers in the community do much of the work. The funding split between the state and the county means the supervision occurs at much lower cost to the county; every dollar spent by Bucks County has the impact of five. In Allegheny County (containing 1.3 million people, including Pittsburgh), the programs provided by local private vendors are so superior that neighboring states take advantage of them, too. At any given time, 10 percent to 25 percent of the program’s participants come from other states. Pennsylvania does not pay for these individuals, but the cost for the states that send them is still less than confining those individuals in state institutions.

7
The Federal Role in Pennsylvania Federal funding sources that are available to most states supplement Act 148 funds. In particular, the Title IV-E Placement Maintenance Program has long been a major source of funding for delinquency services in Pennsylvania. This program is not expressly designed for delinquents, but its existence is critically important. The way Act 148 is structured, state money is not used until federal sources have been exhausted. Title IV-E provides funds for maintaining indigent children in court-ordered, non-secure placements. While most Title IV-E money funds foster care for dependent children and youth, the Department of Health and Human Services has been approving reimbursements for juvenile justice placements since the mid-1980s.20 The General Accounting Office reports that Pennsylvania, California and New York have been among the states that most aggressively claim Title IV-E funds for delinquency placements.

8
California: Reducing Commitments to the California Youth Authority (CYA) CYA: History of Progress? California, one of nation’s most populous states, operates the largest system of youth incarceration facilities in the world. Under the provision of the Division of Juvenile Justice (DJJ), formerly California Youth Authority, a bureau within the California Department of Corrections and Rehabilitation (DOCR, formerly the Youth and Adult Corrections Agency), California has sometimes confined more than 10,000.21 While the state accounted for 13 percent of the national youth population in 1999, it accounted for 1 in five juveniles confined.22 When the population crested in the five-digits, sliding scale fees were imposed to reduce counties’ use of secure confinement for lower-level offenders. After the imposition of this system in 1996, secure commitments decreased dramatically and the November 2005 population held within DOCR juvenile institutions is just over 3,100.23 Historically, the California Youth Authority was a national model in juvenile justice and crime prevention. The CYA was established by the Youth Corrections Act of 1941, a revolutionary law that recognized the importance of providing youth with training and treatment programs instead of retributive punishment. Since its creation, the CYA’s mission has been to protect the public “by providing education, training, and treatment services for youthful offenders committed by the courts.”24 In California, a youth can serve in time in the CYA up to age 24, something that affords prosecutors and judges more options than consigning older youth to adult prison. The success of the CYA is a recognition of development differences that were progressive then and now.
Historically, the California Youth Authority was a national model in juvenile justice and crime prevention. The CYA was established by the Youth Corrections Act of 1941, a revolutionary law that recognized the importance of providing youth with training and treatment programs instead of retributive punishment.
CYA: The Continuing Crisis In the nationwide crackdown on crime of the 1980s and 1990s, criminal justice philosophy quickly morphed from rehabilitation to imprisonment. Consequentially across the nation, juvenile arrest and incarceration rates climbed. Between 1987 and 1991, the youth population in CYA facilities averaged 139 percent of bed capacity,25 something that the Independent Review Panel, struck by Governor Schwarzenegger, recognized to be contributing to dangerous conditions and violent environment for youth: “With the overcrowding came increased violence in youth correctional facilities – group disturbances, suicidal behavior, escape attempts and other acts of destructive conduct. There have been several successful litigations which have placed several DJJ facilities under consent decrees managed by the Alameda County Superior Court. Within the last two years, there have been five suicides in DJJ facilities and experts have condemned the CA DJJ for deficiencies in programming services (including educational, mental health and medical services) and high levels of institutional violence have been documented by the Inspector General.26 In an escalating cycle, increased violence led to longer stays, still more overcrowding, and still more violence.”
“With the overcrowding came increased violence in youth correctional facilities – group disturbances, suicidal behavior, escape attempts and other acts of destructive conduct. In an escalating cycle, increased violence led to longer stays, still more overcrowding, and still more violence.” ---California’s Independent Review Panel on Corrects, 2004
Under the financial stress of a growing population and lengthened sentences, the CYA’s historical treatment-educational obligation began to erode.27 Further, California has historically issued the longest training-school stays in the U.S., and while counties pay for a portion of the period of detention, they have no say in the length of stay. Currently, the average length of stay is 22.5 months.28

9
Between 1984 and 1990, Commonweal published three books that revealed “a pattern of fear and gang violence in the institutions.” Commonweal attributed the situation to “crowding in the institutions and the state’s policy of allowing counties to commit too many property and drug offenders to CYA.”29 In the late 1990s, California began taking measures to prevent the overuse of incarceration of youth and restore its juvenile justice system. The chargeback structure was one of the cornerstones of reform. Juvenile Justice Realignment Until 1996, counties paid a modest monthly fee of $25 to the state for each youth they committed to the CYA, a fraction of the actual cost to the state for confining a juvenile. As this was less costly for the counties, these localities committed large numbers of youth to state facilities. In 1996, the California legislature responded to this problem by enacting a sliding- scale law that gave counties a financial disincentive for sending youth who had not committed serious offenses to the CYA.2 Under the fiscal scheme, counties pay the state on a sliding-fee scale based on the seriousness of the offense, with fees to send youth to the CYA increasing as the severity of the offense decreases. In 1996, at minimum, counties pay a fee of $150 monthly for sending any youth to the CYA.30 The current cost is statutorily set at $175, monthly. The full cost of incarcerating one individual for one year in the CYA is approximately $92,545.31 The Board of Parole Hearings—formerly known as the Youth Authority Board, and before that as the Youthful Offender Parole Board—determines the sliding scales fees based on the category assigned to each youth at his or her initial parole board hearing. The commitment is based on the current charge or violation, not the underlying or initial adjudication. The board assigns each juvenile committed to the Youth Authority a category number—I to VII, based on the commitment offense. Because most juveniles are committed on the basis of their entire records, this number would correspond to the most serious offense in their records, not necessarily their most recent offense.32 Categories I through IV are considered more serious, while V through VII are less serious.33 The “sliding scale” law requires counties to pay a baseline $150 for the most serious offenses in categories I through IV.34 The rates then rise to 50 percent of the confinement costs for level V (moderate) offenses, 75 percent for level VI (less serious) offenses, and 100 percent of the costs associated with the commitment of level VII (least serious) offenses.35
2 This was not the first program California hoped to utilize. The first choice was a Massachusetts-like incentive program that would transfer funds used to house low-level offenders into less expensive community-based programs. However, the State Legislature imposed the sliding scale disincentive system because the counties and state could not come to an agreement.
10
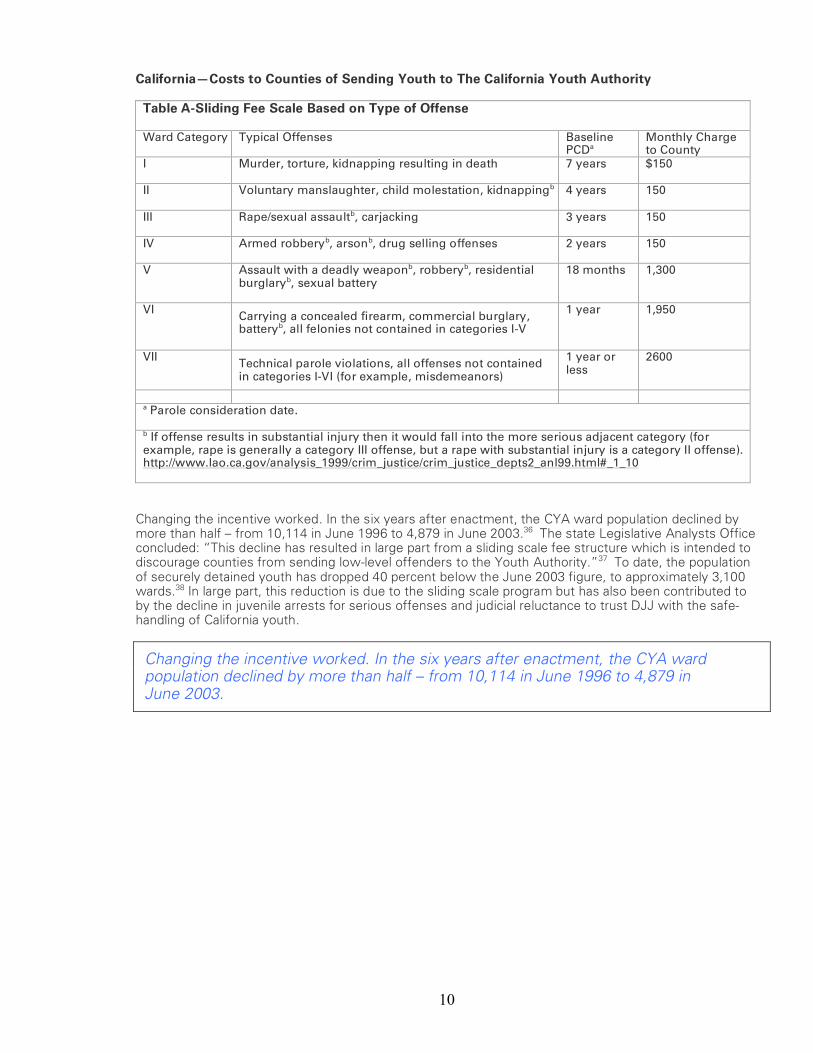
California—Costs to Counties of Sending Youth to The California Youth Authority
Table A-Sliding Fee Scale Based on Type of Offense Ward Category Typical Offenses Baseline
PCDa Monthly Charge to County
I Murder, torture, kidnapping resulting in death
7 years $150
II Voluntary manslaughter, child molestation, kidnappingb
4 years 150
III Rape/sexual assaultb, carjacking
3 years 150
IV Armed robberyb, arsonb, drug selling offenses
2 years 150
V Assault with a deadly weaponb, robberyb, residential burglaryb, sexual battery
18 months 1,300
VI Carrying a concealed firearm, commercial burglary, batteryb, all felonies not contained in categories I-V
1 year 1,950
VII Technical parole violations, all offenses not contained in categories I-VI (for example, misdemeanors)
1 year or less
2600
a Parole consideration date. b If offense results in substantial injury then it would fall into the more serious adjacent category (for example, rape is generally a category III offense, but a rape with substantial injury is a category II offense). http://www.lao.ca.gov/analysis_1999/crim_justice/crim_justice_depts2_anl99.html#_1_10
Changing the incentive worked. In the six years after enactment, the CYA ward population declined by more than half – from 10,114 in June 1996 to 4,879 in June 2003.36 The state Legislative Analysts Office concluded: “This decline has resulted in large part from a sliding scale fee structure which is intended to discourage counties from sending low-level offenders to the Youth Authority.”37 To date, the population of securely detained youth has dropped 40 percent below the June 2003 figure, to approximately 3,100 wards.38 In large part, this reduction is due to the sliding scale program but has also been contributed to by the decline in juvenile arrests for serious offenses and judicial reluctance to trust DJJ with the safe-handling of California youth.
Changing the incentive worked. In the six years after enactment, the CYA ward population declined by more than half – from 10,114 in June 1996 to 4,879 in June 2003.
11
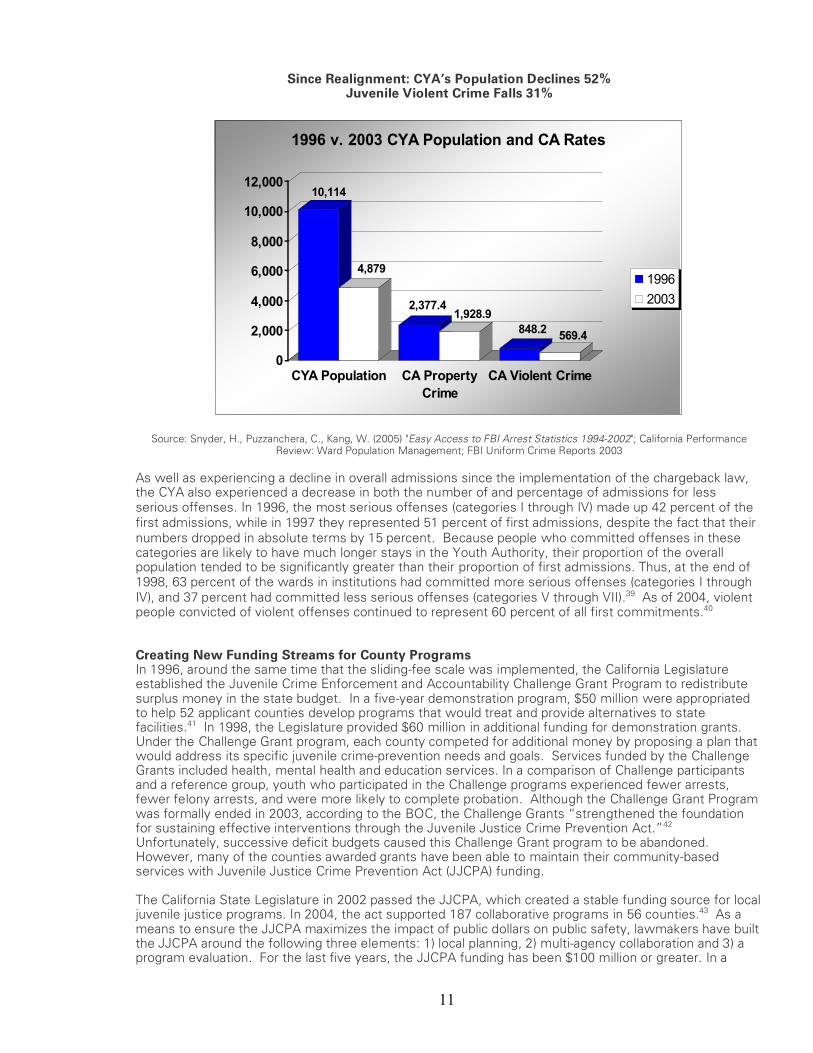
Since Realignment: CYA’s Population Declines 52% Juvenile Violent Crime Falls 31%
10,114
4,879
2,377.41,928.9
848.2569.4
0
2,000
4,000
6,000
8,000
10,000
12,000
CYA Population CA Property
Crime
CA Violent Crime
1996 v. 2003 CYA Population and CA Rates
1996
2003
Source: Snyder, H., Puzzanchera, C., Kang, W. (2005) "Easy Access to FBI Arrest Statistics 1994-2002"; California Performance Review: Ward Population Management; FBI Uniform Crime Reports 2003
As well as experiencing a decline in overall admissions since the implementation of the chargeback law, the CYA also experienced a decrease in both the number of and percentage of admissions for less serious offenses. In 1996, the most serious offenses (categories I through IV) made up 42 percent of the first admissions, while in 1997 they represented 51 percent of first admissions, despite the fact that their numbers dropped in absolute terms by 15 percent. Because people who committed offenses in these categories are likely to have much longer stays in the Youth Authority, their proportion of the overall population tended to be significantly greater than their proportion of first admissions. Thus, at the end of 1998, 63 percent of the wards in institutions had committed more serious offenses (categories I through IV), and 37 percent had committed less serious offenses (categories V through VII).39 As of 2004, violent people convicted of violent offenses continued to represent 60 percent of all first commitments.40 Creating New Funding Streams for County Programs In 1996, around the same time that the sliding-fee scale was implemented, the California Legislature established the Juvenile Crime Enforcement and Accountability Challenge Grant Program to redistribute surplus money in the state budget. In a five-year demonstration program, $50 million were appropriated to help 52 applicant counties develop programs that would treat and provide alternatives to state facilities.41 In 1998, the Legislature provided $60 million in additional funding for demonstration grants. Under the Challenge Grant program, each county competed for additional money by proposing a plan that would address its specific juvenile crime-prevention needs and goals. Services funded by the Challenge Grants included health, mental health and education services. In a comparison of Challenge participants and a reference group, youth who participated in the Challenge programs experienced fewer arrests, fewer felony arrests, and were more likely to complete probation. Although the Challenge Grant Program was formally ended in 2003, according to the BOC, the Challenge Grants “strengthened the foundation for sustaining effective interventions through the Juvenile Justice Crime Prevention Act.”42 Unfortunately, successive deficit budgets caused this Challenge Grant program to be abandoned. However, many of the counties awarded grants have been able to maintain their community-based services with Juvenile Justice Crime Prevention Act (JJCPA) funding. The California State Legislature in 2002 passed the JJCPA, which created a stable funding source for local juvenile justice programs. In 2004, the act supported 187 collaborative programs in 56 counties.43 As a means to ensure the JJCPA maximizes the impact of public dollars on public safety, lawmakers have built the JJCPA around the following three elements: 1) local planning, 2) multi-agency collaboration and 3) a program evaluation. For the last five years, the JJCPA funding has been $100 million or greater. In a

12
move that showed the state’s continued commitment, the JJCPA was tied to a funding stream that supports local enforcement. This was done to for two reasons: 1) to build public support for the initiative, and 2) to ensure that the stream could weather the political storms in the state budget process.
In order to be eligible for JJCPA funding, California’s counties must develop an assessment of their current juvenile justice status, including identifying their specific service needs and creating a proposal for local action strategy. Counties are expected to both implement these strategies to fit local conditions, and to review or modify their plans annually.44
Counties must also form a multi-agency Juvenile Justice Coordinating Council. These coordinating councils help to bridge the gaps between different agencies that play a role in caring for children and advancing public safety. The Coordinating Council is chaired by the chief probation officer of each county and includes representatives of law enforcement and criminal justice agencies, as well as boards of supervisors, social services, education, mental health, and community-based organizations. The purpose of the Coordinating Council is to create and update plans that document the condition of the local juvenile justice system and provide integrated services.
Under the law, counties are required to collect and report information on annual program expenditures and juvenile justice outcomes. The reporting accomplishes two important tasks. It both enables stakeholders to reassess and refine the program and allows the Legislature to monitor the state’s investment in JJCPA and the impact on juvenile crime. The Correction Standards Authority, formerly the Board of Corrections, administers the JJCPA and must submit an annual report to the Legislature that catalogs the effectiveness of local planning, program expenditures, and result of measured outcome variables.45
By June 30, 2004, participating counties had obligated 99.8 percent of the nearly $116.3 million allocated for the third year of the JJCPA. Local programs served 106,055 youth who were at-risk or involved in the juvenile justice system in 2003-04. Most importantly, for the 56 counties that participated in the JJCPA, the arrest rate per 100,000 juveniles went from 5,250 in 2002 to 4,940 in 2003, a reduction of 5.9 percent. This follows an 8.5 percent reduction from 2001 to 2002, and a 5.4 percent reduction from 2000 to 2001.46 The results for the six statutorily-mandated outcomes indicate that the JJCPA programs, as a whole, are making a significant difference in reducing juvenile crime and delinquency. In 2004, over 60 percent of the participating counties experienced a decrease in the number of youth arrested, incarcerated, or who violated probation; 57 percent to 60 percent of participating counties experienced an increase in the number of youth who completed probation, restitution or community service.47 These results are clearly associated with the new program’s resources.
JJCPA: Juvenile Justice Program Completion Rates Soar Over 50% Incarceration Rate Decline More Than 50%
Arrest Rate
Incarceration Rate
Probation Violation
Rate
Completion of
Probation Rate
Completion of
Restitution Rate
Completion of
Community Service
-80%
-60%
-40%
-20%
0%
20%
40%
60%
80%
Summary of Program Goals for Mandated Outcomes (CA) Change
Source: California Board of Corrections. Juvenile Justice Crime Prevention Act. Annual Report, 2005.
13
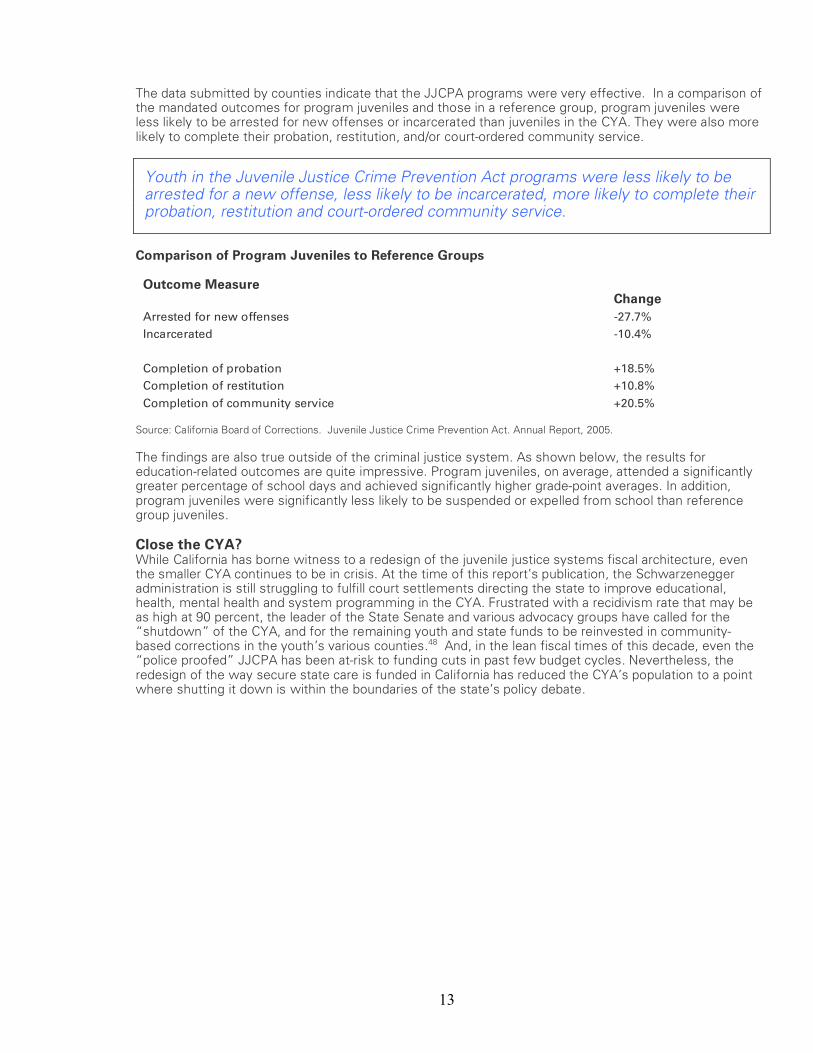
The data submitted by counties indicate that the JJCPA programs were very effective. In a comparison of the mandated outcomes for program juveniles and those in a reference group, program juveniles were less likely to be arrested for new offenses or incarcerated than juveniles in the CYA. They were also more likely to complete their probation, restitution, and/or court-ordered community service.
Youth in the Juvenile Justice Crime Prevention Act programs were less likely to be arrested for a new offense, less likely to be incarcerated, more likely to complete their probation, restitution and court-ordered community service.
Comparison of Program Juveniles to Reference Groups
Outcome Measure Change Arrested for new offenses -27.7% Incarcerated -10.4% Completion of probation +18.5% Completion of restitution +10.8% Completion of community service +20.5%
Source: California Board of Corrections. Juvenile Justice Crime Prevention Act. Annual Report, 2005. The findings are also true outside of the criminal justice system. As shown below, the results for education-related outcomes are quite impressive. Program juveniles, on average, attended a significantly greater percentage of school days and achieved significantly higher grade-point averages. In addition, program juveniles were significantly less likely to be suspended or expelled from school than reference group juveniles. Close the CYA? While California has borne witness to a redesign of the juvenile justice systems fiscal architecture, even the smaller CYA continues to be in crisis. At the time of this report’s publication, the Schwarzenegger administration is still struggling to fulfill court settlements directing the state to improve educational, health, mental health and system programming in the CYA. Frustrated with a recidivism rate that may be as high at 90 percent, the leader of the State Senate and various advocacy groups have called for the “shutdown” of the CYA, and for the remaining youth and state funds to be reinvested in community-based corrections in the youth’s various counties.48 And, in the lean fiscal times of this decade, even the “police proofed” JJCPA has been at-risk to funding cuts in past few budget cycles. Nevertheless, the redesign of the way secure state care is funded in California has reduced the CYA’s population to a point where shutting it down is within the boundaries of the state’s policy debate.

14
Wisconsin: The Community Youth and Family Aids Program. Since the early 1980s, Wisconsin has held counties fiscally responsible for state institutions by utilizing an allocation program known as Youth Aids Program. Prior to this, counties’ social service agencies were financially responsible for community-based programming but not for paying for secure placement in a juvenile correctional institution.49 Under the reforms to the state’s juvenile code, the state redirected funding from the Department of Health and Human Services to the counties to diminish the reliance on state commitments. The pilot program only included 10 cities in 1980, but by 1981, the 72 Wisconsin counties shared $25.5 million in youth aid funding, plus capacity-building money put towards community alternative program development. The original allocation formula for each county depended on three factors: 1) the total county youth population, 2) county juvenile arrests per the federal Uniform Crime Reporting System for 1975-1978, and 3) secure juvenile placements for the same period. Additionally, an override factor was made to ensure no county received more than 115 percent or less than 93 percent of the sum it would have received based solely on juvenile correctional placements. In 1982, an additional override was created that stipulated no county would be given less than $19,000 or 65 percent of what it would have been allocated utilizing the original formula.50 This second override ensured smaller counties would obtain at least a minimum allocation. Although the formula has not changed over the last 24 years, inflation and the rate of use of state-provided services generally determined the amount that could be incorporated into a county’s base youth aids allocation. The number of youth using state-funded services in a county by and large determined the funding each county received from the state for these services. Each county’s base funds are made up of its original base allocation and its share of any adjustments to their base. In addition, counties receive their share of monies allotted according to three factors: 1) daily rate increases of programs, 2) possible increase in funds due to inflation, and 3) an allocation for program maintenance. The hope was that the Youth Aids formula would provide the money necessary for counties in total.
Between 1997 and 2003, along with falling youth crime rates, the Youth Aids formula has been associated with a 23 percent drop in the population of youth in secure confinement, a 39 percent drop in property offenders, and a 57 percent drop in drug offenders.
There are two groups of youths whose incarceration costs are not funded by county the Youth Aids allocations. The two groups were created in 1996, when the Wisconsin Act 27 became effective. This meant that youth aged 17 would be treated like adults, not juveniles. Their cases, therefore, were handled in criminal court, with them comprising the first group.51 The act also created the Serious Juvenile Offender (SJO) program, which is responsible for funding the treatment of youth who are adjudicated in serious offenses such as sexual assault, armed robbery, or homicide52, which became the second group. However, across the state, the Youth Aids allocation covers approximately only one-third of the county’s juvenile justice costs. By 1997, Youth Aids allocations only covered 45.4 percent of the $181.4 million that counties reported spending on juvenile justice services.53 In 2005, $186.5 million were provided in Youth Aids funds to Wisconsin’s counties—only a $5.1 million increase in eight years.54 Although counties are under pressure to keep their community-based programs afloat, they are finding creative ways to continue the spirit of the Youth Aids program by matching dollars from private and government grants and taxation. While there is a movement to update the Youth Aids formula utilizing most recent data so that fourteen counties would benefit, the Wisconsin Counties Association has resisted changing the formula because fifty-eight counties would actually lose funding.55 Milwaukee, one of five counties who would gain more than 25 percent in funding if the formula were updated, currently has a cap on the amount of money it receives from Youth Aids; it receives 91 percent of the formula total for their jurisdiction. Milwaukee’s juvenile justice budget is $60 million, yet it receives only $32, 548,040 in Youth Aids dollars, $9.6 million of which is directed to community programs. Due to state fiscal shortfalls, the allocations for counties have been frozen for almost ten years, but the costs of youth incarceration keep rising. The cost of housing a youth in a secure facility has increased 42.5
15
percent, rising from $108.75 in 1992 to $154.94 in 1998.56 The increase in cost may actually be a negative affect of the Youth Aids allocations, as sending fewer children to secure placement means secure placement costs more. This also means that counties must find the additional funds to make up for the difference between community services and state secure care. Despite all these challenges the program and its advocates have faced, the Youth Aids formula has had an impact on expanding community-based option for young people, and reducing the number of secure commitments. Between 1997 and 2003, along with falling youth crime rates, the Youth Aids formula has been associated with a 23 percent drop in the population of youth in secure confinement, a 39 percent drop in property offenders, and a 57 percent drop in drug offenders.57
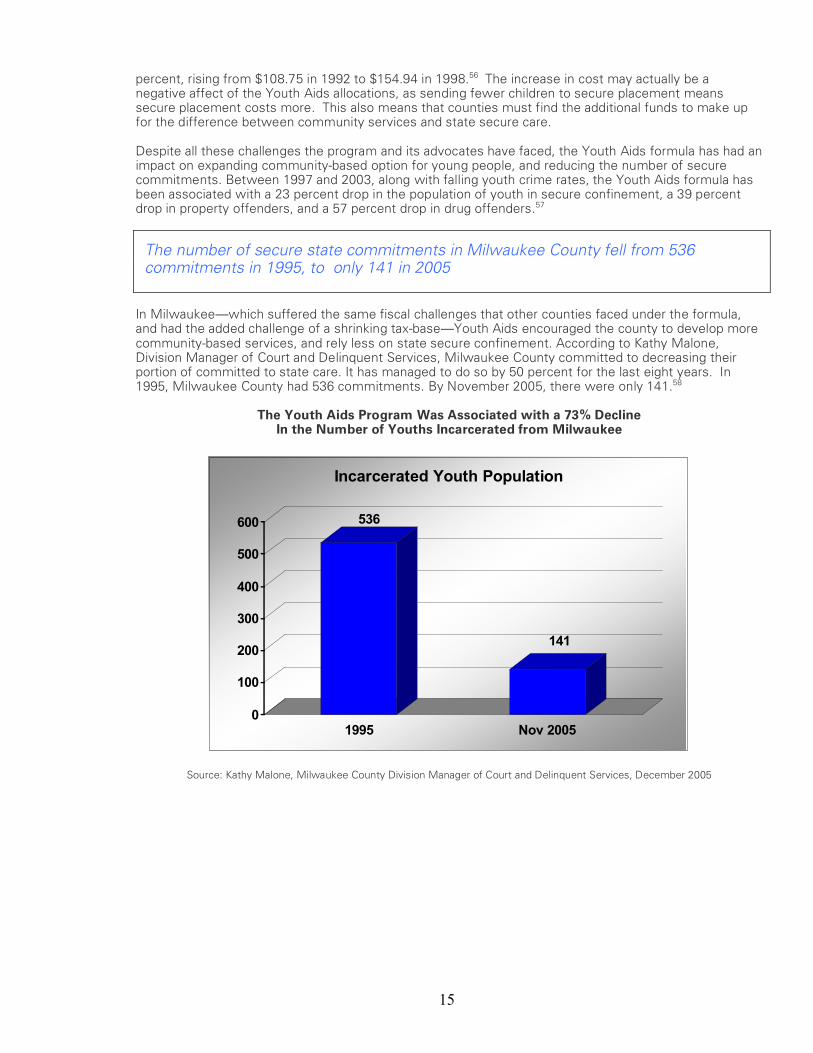
The number of secure state commitments in Milwaukee County fell from 536 commitments in 1995, to only 141 in 2005
In Milwaukee—which suffered the same fiscal challenges that other counties faced under the formula, and had the added challenge of a shrinking tax-base—Youth Aids encouraged the county to develop more community-based services, and rely less on state secure confinement. According to Kathy Malone, Division Manager of Court and Delinquent Services, Milwaukee County committed to decreasing their portion of committed to state care. It has managed to do so by 50 percent for the last eight years. In 1995, Milwaukee County had 536 commitments. By November 2005, there were only 141.58
The Youth Aids Program Was Associated with a 73% Decline In the Number of Youths Incarcerated from Milwaukee
536
141
0
100
200
300
400
500
600
1995 Nov 2005
Incarcerated Youth Population
Source: Kathy Malone, Milwaukee County Division Manager of Court and Delinquent Services, December 2005

16
Ohio: RECLAIM-ing Reasoned and Equitable Juvenile Justice Funding Before 1994, Ohio counties paid nothing to send adolescents to locked confinement under the state’s Department of Youth Services (DYS). All of the DYS funding came from the state budget. This structure gave counties a fiscal incentive to commit youth to state institutions, even if many of the youth committed to DYS could be better served in their local communities.
In response to a growing need for local alternatives for juvenile courts and overcrowding in the Ohio Department of Youth Services (ODYS) institutions, the Ohio State Legislature created RECLAIM Ohio (Reasoned and Equitable Community and Local Alternatives to the Incarceration of Minors) in July of 1993. In January 1994, the RECLAIM Ohio pilot program was launched with nine participating counties. That first year, those counties experienced a 42.7 percent decrease in commitments to DYS compared to the previous year.59
RECLAIM Ohio operates by giving its counties a fixed allocation from the state based upon a four-year average of felony adjudications. Thus, counties with higher crime rates receive more funds, but the dollars are tied to a reduction in the proportion to the amount of ODYS bed space that each county used in the previous year. The fewer youth the county sends to ODYS, the more money it will receive in the next year. This funding structure encourages counties to develop or purchase a range of community-based options to meet the needs of juveniles who have been adjudicated or who are at-risk of engaging in unlawful behavior.
In January 1994, the RECLAIM Ohio pilot program was launched with nine participating counties. That first year, those counties experienced a 42.7 percent decrease in commitments to DYS compared to the previous year.
In its inception, the RECLAIM formula created very strong incentives for local community- based programming as the counties received their sum of money based on the four-year felony average. After receiving these funds, the counties have to pay the state for each ODYS bed they use at 75 percent the total daily cost of housing the youth, or half the cost of locally operated Community Corrections Facilities. Secure Care for the Most Serious Cases RECLAIM recognizes in its design that some crimes are more legitimately transferred to ODYS, and it focuses on redirected offenses where the transfer is more optional. The financial incentive is to find ways to keep youth with a lower public safety risk closer to home. The formula specifically excludes serious and violent crimes,60 and RECLAIM funding is not reduced for counties if a youth is sent into the system for a “public safety bed day.” By 2004, the Ohio Department of Youth Services dispersed $30 million in funds to all 88 counties through the RECLAIM Ohio subsidy.61 The funds help to subsidize local opportunities for the treatment and rehabilitation of each county’s at-risk youth. Partly as a result of these funding mechanisms, the population within ODYS has decreased from an unmanageable high of more than 2,600 youth in May 1992 to less than 1,800 individuals in July 2004.62 Since RECLAIM commenced in 1995, counties have retained over $274 million dollars at the local level and served thousands of youth.

17
12 Years After RECLAIM Ohio Enactment, 31% Fewer Youths Committed to Secure Placement
2600
1800
0
500
1000
1500
2000
2500
3000
May 1992 June 2004
ODYS Commitment Population
Source: DYS 2004 Statistics. RECLAIM Ohio succeeded beyond expectation, and for a time, ODYS was faced with the possibility of budget cuts as well as the closing one of its juvenile correctional facilities. State policymakers redesigned the RECLAIM Ohio formula to keep state facilities in business.3
RECLAIM Ohio has been diluted by the perceived need to keep state beds open. Some counties are struggling to maintain their community-based alternatives. The concept, however, is still a sound one, and counties remain committed to retaining their RECLAIM programs.
RECLAIM Ohio succeeded beyond expectation, and for a time, Ohio considered closing one of its juvenile correctional facilities.
3 The new formula assigned each county a total number of credits based on the county’s four-year average of youth adjudicated for felony offenses. The number of credits is now reduced for each chargeable ODYS bed day used during the previous year (one credit), and for each chargeable community corrections facility bed day (two-thirds credit) used during the previous year, with ODYS retaining the remaining portion of credit. Each county's percentage of the remaining credits statewide translates into that county’s percentage of the total RECLAIM funds allocated to the counties.

18
What Local Officials Are Saying About Reclaim Ohio: “The Gallia County Juvenile Court would have extreme problems operating without RECLAIM funding. RECLAIM allows our court to operate community-based programs, including probation supervision, education services, wraparound coordination, drug testing, communications, employee educational training, occasional respite, community service and other needed programming to keep youth out of DYS institutions and foster placement.” Greg Shrader, director Gallia County Probate/Juvenile Court “In 1993 (before RECLAIM OHIO), Lucas County committed 244 youth to the Ohio Department of Youth Services and revoked ODYS parole on another 30 youth. In 2003 (after RECLAIM OHIO), we committed 70 and revoked another six youth. This significant reduction in commitments was done without compromising the safety of the community, because RECLAIM made it possible for us to create corrections services in the community.” Judge Jim Ray Lucas County “Since its inception, RECLAIM has been a life saver and lifeline for Greene County Juvenile Court and the youth we serve. It has allowed this court to provide services and programs that we believe otherwise would not have been fiscally available to us. Clearly, as a result, we have been able to reduce commitments to DYS and reduce other out-of-home placements as well.” Jan A. White, Court Administrator Green County Juvenile Court Source: 2004 Ohio DYS Annual Report (2004)63

19
Redeploy Illinois: Building on Success The state where the nation’s juvenile justice system was born is embarking on its own experiment. Illinois has begun its own program, “Redeploy Illinois4,” which is modeled after RECLAIM Ohio. It has a stronger emphasis on community involvement and public safety and is seeking to build stronger efficiencies into the delivery of juvenile justice services. The Redeploy Illinois pilot program gives counties the financial support to provide comprehensive services to delinquent youth in their home communities who might otherwise be sent to the Illinois Department of Corrections (IDOC). As is the case in other states, many counties in Illinois lack the programming to effectively serve delinquent youth locally—something that plays a significant role in a court’s decision to commit a youth to IDOC. The funds provided to the Redeploy Illinois pilot sites are intended to fill in the gaps in their continuum of programs and services for delinquent youth, allowing them to serve youth locally in a cost-effective way and reduce their reliance on IDOC .64 Under Redeploy Illinois, participating counties agree to cut the number of juveniles they send to state juvenile prisons by at least 25 percent below the average of the previous three years. The reduction can be seen in the overall population or in any specific population. In return, the state reimburses the counties for funds they spend managing the adjudicated youth locally. Approximately $2 million was budgeted for this purpose in fiscal year 2004, and in 2005, Redeploy funding was renewed. “It is clear that this program has the potential to save the State of Illinois significant dollars that would otherwise be spent on incarcerating nonviolent juvenile offenders.”—Redeploy Illinois Amended Legislative Report: Implementation and Impact (January, 2006).
Background: Too Many Youth Sent to the State Who Could Be Served Locally. Since 2000, approximately 1,800 youths have been committed each year to the Illinois Department of Corrections (IDOC), costing the state more than $100 million annually. Approximately 45 percent of total admissions were for a property offense, and 30 percent for a court evaluation (a short-term 30-90-day commitment, during which time the youth's needs are evaluated). During calendar year 2004 alone, of the 1,729 new court admissions to IDOC, just under one-half (792) of the youths were admitted for a property offense and approximately one-third (610) for court evaluations. Redeploy Illinois was motivated by the recognition that the average cost of committing a nonviolent youth to the IDOC is $51,525, and the average cost of sending a youth sent for a court evaluation $13,955—an expensive proposition if these young people could be more effectively supervised, held accountable, and receive services in the communities they are from.65 Along with costs, Illinois state legislators were aware that troubled youths are less likely to become further involved in delinquent or criminal behavior if they remain in their home communities. Legislators recognized that it is simpler, cheaper, and more effective to keep youth close to home. “Youth in the correctional setting learn more about how to be a criminal than about being reformed,” says state Secretary of Human Services Carol L. Adams.66
4Unless otherwise noted, this chapter is primarily sourced from Redeploy Illinois Amended Legislative Report: Implementation and Impact (January, 2006).

20
Illinois Public Act 93-0641: Redeploy Illinois Purpose: “To encourage the deinstitutionalization of juvenile offenders by establishing pilot projects in counties or groups of counties that reallocate state funds from juvenile correctional confinement to local jurisdictions, which will establish a continuum of local, community-based sanctions and treatment alternatives for juvenile offenders who would be incarcerated if those local services and sanctions did not exist. “The allotment of funds will be based on a formula that rewards local jurisdictions for the establishment or expansion of local alternatives to incarceration, and requires them to pay for utilization of incarceration as a sanction.” Goals: “(1) The juvenile justice system should protect the community, impose accountability to victims and communities for violations of law, and equip juvenile offenders with competencies to live responsibly and productively. (2) “Juveniles should be treated in the least restrictive manner possible while maintaining the safety of the community. (3) “A continuum of services and sanctions from least restrictive to most restrictive should be available in every community.”
Involving Communities One of the key goals of the Redeploy implementation plan was to continue to include local communities in key decisions and important strategic points throughout the process. Just before the kickoff of Redeploy, the Illinois Juvenile Justice Initiative, a private nonprofit organization, teamed up with government agencies and local stakeholders and held four informational forums across the state regarding pilot sites’ efforts to address disproportionate minority contact and confinement (DMC). Meanwhile, the Redeploy Partnership Oversight Board filed the request for funds to set the program in motion. This request was drafted by the Department of Human Services and afforded the most directly affected communities the opportunity to influence the drafting and progression of the plan. Initially, state and local decision makers expressed concern that the Redeploy funding would compete with other DHS programs, putting other projects at risk. The Redeploy Partnership Oversight Board continued to stress in outreach efforts that the money for those services would come from a dedicated funding stream, with the savings eventually coming from the savings generated through fewer commitments to the Department of Corrections.
One of the key goals of the Redeploy implementation plan was to continue to include local communities in key decisions and important strategic points throughout the process…afforded the most directly affected communities the opportunity to influence the drafting and progression of the plan.
Built into the program is an evaluation process designed to measure the outcome and impact of Redeploy work. The evaluation requires data collection in the sites designed to answer the following questions:
• What are the number of juveniles committed to DOC by age, offense, length of stay, and ethnicity?
• What is the recidivism rate of juveniles in Redeploy Illinois while actively involved in the program, six months after discharge from the program, and twelve months after discharge?
• What is the utilization and length of stay in secure detention for the total juvenile population as well as the juveniles involved with Redeploy Illinois?
• What is the level of involvement of community stakeholders?

21
The Redeploy Pilot Sites Redeploy Illinois began in late 2004 with pilot projects in four regions. The first group of youths was admitted to programs in January 2005, and the first round of evaluations was scheduled for completion in January 2006. The pilot sites included Macon, Peoria, and St. Clair counties and the 2nd Judicial District, comprised of 12 independent rural counties. Counties have responded to the requests for proposals and are in the process of developing a range of local services that fit with the goals of the Redeploy pilot program. The 2nd Judicial Circuit The 2nd Judicial Circuit is comprised of 12 rural counties in southeastern Illinois: Crawford, Edwards, Franklin, Gallatin, Hamilton, Hardin, Jefferson, Lawrence, Richland, Wabash, Wayne, and White. The goal of the 2nd Judicial Circuit Redeploy program is to utilize individualized and evidence-based practices to address the needs of medium- and high-risk juvenile offenders. In the 2nd Judicial District, Redeploy is supporting probation department staff and community-based service providers in developing three evidence-based practice programs (Aggression Replacement Training, Functional Family Therapy and Multisystemic Therapy). Redeploy funds also support psychiatric evaluations and the development of Global Position System Monitoring. St. Clair County St. Clair County is the home of East St. Louis. The profile of the typical youth sent to state custody from St. Clair was that of an African-American male between the ages of 14 and 16 who has been sent for an evaluation due to a nonviolent offense—not necessarily the profile of serious offenders requiring locked custody. From 2001 to 2004, the number of St. Clair youth committed to the Illinois Department of Corrections increased by 43 percent. 67 The goal of St. Clair’s Redeploy program is to direct services at youth between the ages of 13 and 17 who have one prior delinquent offense, who are currently adjudicated for an offense that is punishable by an IDOC commitment, and who are at medium or high risk for re-offending. Youth who are involved in both the juvenile justice and child welfare systems are also priority service targets. St. Clair has used its Redeploy funds to support evidence-based programs (Functional Family Therapy, Multisystemic Therapy, and Aggression Replacement Training), and Family Group Conferencing. The county intends to both create a court-community liaison and to improve collaboration with existing mental health counseling, substance abuse, vocational, and other youth and family services.
Macon County In Macon County, the Redeploy program (locally called “Community ACCESS,” Alternative Collaborative Change Education Support Success) is working to create a collaborative and community-based approach to increasing access to services for juveniles, their families, victims, and the community. Juvenile served by the Redeploy program in Macon receive a continuum of services based upon their specific needs and risk levels, and services are dually aimed at individual youths and their families. The continuum of services provided by the Macon County Redeploy program consists of strategies and sanctions ranging from least restrictive to most restrictive settings. Macon’s continuum includes a quality assessment process (initial and ongoing), cognitive education and treatment, teen court, victim-related services, life skills, community restorative boards, substance abuse treatment, gender-specific services, mental health treatment, parent-family support services, and home detention. Peoria County The goal of the Redeploy program in Peoria County is to serve youths on probation who are at greatest risk of being sent to IDOC for a court evaluation as well as youths who are at risk of being sent to IDOC for a full commitment. In Peoria, Redeploy is being run as a collaborative partnership between Peoria County Court Services and the Children's Home Association of Illinois.

22
Redeploy work in Peoria has focused on providing a more thorough assessment of young people and their families’ needs to help develop a service plan for youths and their families. Once assessed, program staff are working to ensure that young people receive:
• a minimum of three contacts per week, which can consist of counseling, skill building, collateral contact, curfew checks, and/or staffings with the probation officer
• transportation to and from court hearings, meetings with probation officers, treatment sessions/meetings, or other related appointments/meetings
• linkage to community resources • Aggression Replacement Training group counseling sessions, and evidence-based practice.
Instead of a short-term commitment to the IDOC for an evaluation, if it is determined that a youth could benefit from a residential program, he or she can be sent to one of two local programs. There a youth receives an evaluation and assessment during a 21-day stabilization period and then transitions back to the community and into the program group. Expected Outcomes of Redeploy Illinois. While the full impact of Redeploy is not yet known, the Redeploy Illinois Amended Legislative Report, published in January, 2006, projects a significant drop in IDOC commitments from participating jurisdictions and a drop in state spending on incarcerated youth. Reduction in State Commitments: A Projected 33 Percent Decline in Number of Youth Sent to Illinois Department of Corrections from the Redeploy Sites in Year One. The table below shows how many young people from these four jurisdictions were sent to the IDOC in previous years and projects the impact of Redeploy on the number of youth committed to IDOC. Projected declines in state commitments range from 56 percent in the 12 counties making up the 2nd Judicial District to 24 percent in St. Clair County. Overall, the legislative report projects a 33 percent decline in commitments and that 83 fewer youths will be sent to the IDOC from the Redeploy sites in year one. Summary of Projected Impact of Redeploy on Commitments to the IDOC
Previous 3-Year Average IDOC Commitments
Projected Year One IDOC Commitments
Projected Year One Number of Reduced IDOC Commitments
Projected Year One Reduction in IDOC Commitments
Macon County
53
34
19
36%
2nd Judicial District
41
18
23
56%
Peoria County
71
52
19
27%
St. Clair County
90*
68
22
24%
Total
255
172
83
33%
Source: Redeploy Illinois Amended Legislative Report: Implementation and Impact, January 2006. *2004 IDOC Commitment Data Cost Effectiveness: $2 million Less Spent on State Imprisonment of Youth, $1.4 Million Increase in Local Juvenile Justice Spending in Year One. Using the assumption that without Redeploy, the current four sites would have continued to send the same number of youth to the IDOC as they had done in the previous three years, the Redeploy Amended Legislative Report projected the cost savings to the IDOC. The report projects that, in year one, Redeploy saved the state $2,123,063 in funds that would have been spent incarcerating these youth, and that an additional $1,411,000 were projected to be spent on locally based programs in year one.

23
“If the lower recidivism rates typically associated with community-based treatment are realized, the Redeploy Illinois program will have saved the State money, reduced the number of crime victims, and created safer communities.”—Redeploy Illinois Amended Legislative Report: Implementation and Impact (January, 2006).
These savings do not include long-term savings expected from lower recidivism rates associated with community-based treatment. As the Redeploy Illinois Amended Legislative Report notes, the long-term savings of lower recidivism and crime rates, while hard to quantify, include fewer crime victims, safer communities, and increased economic performance as troubled young people become workers and taxpayers and contribute to their communities. In sharp contrast to the IDOC, where close to half of juveniles who were discharged in 2001 returned to a juvenile prison within three years, the evidence-based practices being developed across the sites as part of Redeploy Illinois have a proven track record of reducing recidivism. Year One Projected Cost Effectiveness of Redeploy Pilot Sites Projected Year One
Program Costs Previous 3-Year Average IDOC Commitments
Projected Year One Number of Reduced IDOC Commitments
Projected Year One Cost Savings to IDOC
Macon County
$368,746 53 19 $486,432
2ndJudicial District
$312,254 41 23 $657,968
Peoria County
$360,000 71 19 $622.061
St. Clair County
$370,00 90* 22 $356,602
Total
$1,411,000 255 83 $2,123,063
Source: Redeploy Illinois Amended Legislative Report: Implementation and Impact, January 2006. *2004 IDOC Commitment Data. Conclusion: Redoubling Redeploy. Although Redeploy Illinois has only been in place for 18 months, the legislative report on the program suggests that the state can realize the kinds of cost savings and juvenile justice system reforms that have driven declining youth imprisonment and increased local juvenile justice spending in other states: “It is clear that this program has the potential to save the State of Illinois significant dollars that would otherwise be spent on incarcerating non-violent juvenile offenders. If the lower recidivism rates typically associated with community-based treatment are realized, the Redeploy Illinois program will have saved the State money, reduced the number of crime victims, and created safer communities. Additionally, the Redeploy Illinois program will have played a significant role in turning around the lives of a considerable number of young people, many of whom would otherwise be doomed to a cycle of arrest, incarceration, re-arrest and re-incarceration.68” As more is learned about the positive impact of Redeploy, key stakeholders are optimistic that Cook County, the state’s largest county and the home of Chicago, will participate in Redeploy and that the program will spread to other places across the state.

24
Conclusion: Rationalizing Fiscal Structure Can Reduce Juvenile Imprisonment, Promote Better Outcomes and Build Communities In the 1998 study referred to in the beginning of this report, Professor Mark A. Cohen of Vanderbilt University highlights the cost of failing to provide adequate supervision and treatment to troubled youth. The study found that each teen prevented from adopting a life of crime could save the country between $1.7 million and $2.3 million.69 Along with the long-term savings of effective investments in curbing juvenile crime at its earliest phases, the cost of sending young people to state institutions costs several times what it does for community supervision for community supervision or services. The costs of sending young people to state facilities who do not need to be there compounds when added to the impact on youth. As one state secretary of human services in the beginning of this report said, “Youth in the correctional setting learn more how to be a criminal than about being reformed.” Meanwhile, when they have been evaluated, local community services for youth have been shown to reduce re-arrests, reduce imprisonment, and increase the likelihood that youth will pay restitution, complete community service, and successfully complete probation—indicators that they are well on their way to becoming adults who can make contributions to society. While the politics of crime, punishment and imprisonment remain polarized in the states profiled here, Republicans and Democrats came together to rationalize the fiscal structures that, at one time, caused juvenile justice systems to commit youth to state institutional incarceration although the youth did not necessarily need to be there. Other states should heed the lesson that, by following the money, states and localities can better work together to reduce juvenile incarceration, reduce crime, and improve public safety.
Suggested Citation: Tyler, Jasmine L.; Ziedenberg, Jason and Lotke, Eric. “Cost Effective Corrections: The Fiscal Architecture of Rational Juvenile Justice Systems” (2006). Washington, DC: The Justice Policy Institute.
The Justice Policy Institute is a Washington DC-based think tank dedicated to ending society’s reliance on incarceration and promoting effective and just solutions to social problems. Cost-Effective Youth Corrections was written by Justice Policy Institute (JPI) staff Jasmine Tyler, Jason Ziedenberg, and Eric Lotke. The Justice Policy Institute is supported by generous grants from the MacArthur Foundation, the Open Society Institute, the Public Welfare Foundation, the Annie E. Casey Foundation, the Fund for Non-Violence, the Drug Policy Alliance and the Butler Family Fund. For more information, visit our website, www.justicepolicy.org

25
ENDNOTES 1 Illinois Department of Human Services. (Spring/Summer 2004). Solutions Newsletter. 2 Snyder, H. (2005). “Juvenile Arrests 2003”. Washington, D.C.: Office of Juvenile Justice and Delinquency Prevention. 3 Sickmund, Melissa, Sladky, T.J., and Kang, Wei. (2005). "Census of Juveniles in Residential Placement Databook." Washington, D.C.: Office of Juvenile Justice and Delinquency Prevention. 4 Donziger, Steven A. (Ed). (1996). The Real War on Crime: The Report of the National Criminal Justice Commission. New York: Perenial. 5 Cohen, Mark A. (1998). “The Monetary Value of Saving a High Risk Youth.” The Journal of Qualitative Criminology, 14 (1): 5-33. 6 Dishion, T.J., J. McCord, and F. Poulin. (1999). “When Interventions Harm: Peer Groups and Problem Behavior.” American Psychologist 54 (9): 755-764. Holman, Barry and Jason Ziedenberg. (Forthcoming). The Dangers of Detention: The Impact of Incarcerating Youth in Detention and Other Secure Congregate Facilities. Baltimore, Maryland: Annie E. Casey Foundation. 7 Benda, B.B. and C.L. Tollet. (1999). “A Study of Recidivism of Serious and Persistent Offenders Among Adolescents.” Journal of Criminal Justice 27 (2): 111-126. 8 Holman, Barry and Jason Ziedenberg. (Forthcoming). The Dangers of Detention: The Impact of Incarcerating Youth in Detention and Other Secure Congregate Facilities. Baltimore, Maryland: Annie E. Casey Foundation. 9 Jones, Michael A. and Eileen Poe-Yamagata. (April 2000). “And Justice for Some: Differential Treatment of Minority Youth in the Justice System”. Washington, D.C.: Building Blocks for Youth. 10 Ibid. 11Lotke, Eric and Jason Ziedenberg. (2005). Tipping Points: Maryland’s Overuse of Incarceration and the Impact on Public Safety. Washington, DC: Justice Policy Institute. 12 The Act is codified at 62 P.S. § 704.1. 13 In Re Wilson, 438 Pa. 425, 264 A.2d 614 (1970). 14 Blackmore, John, Marci Brown, and Barry Krisberg. (1988). “Juvenile Justice Reform: The Bellweather States.” University of Michigan Center for the Study of Youth Policy. 15 Ibid. 16 Juvenile Court Judges’ Commission. (2003). Pennsylvania Juvenile Court Dispositions. 17 Ibid. 18 Griffin, Patrick. (October 2003). “Following the Money: Funding of Juvenile Justice Services in Pennsylvania.” Pennsylvania Progress, 10(1). 19 Ibid. 20 Ibid. 21 Butts, Jeffrey A and David Steinhart. (July 2002) “Youth Corrections in California.” Urban Institute. 22 Ibid. 23 State of California Department of Corrections and Rehabilitation, Division of Juvenile Justice. (November 2005). Population Movement Summary. 24 Little Hoover Commission. (February 2005). Reconstructing Government: A Review of the Governor’s Plan Reforming the Youth and Adult Correctional Agency. 25 Department of Youth Authority, “Budget Change Proposal, Institutions and Camps Branch, Fiscal Year 2003-04, Fiscal Year 2004-05,” March 9, 2004. 26 Cate, Matthew L. (May 2005). Management Review Audit of the N. A. Chaderjian Youth Correctional Facility, Stockton, California. 27 Corrections Independent Review Panel, California Performance Review. (2004). A Reorganization Plan for Corrections. 28 State of California Department of Corrections and Rehabilitation, Division of Juvenile Justice. (November 2005). Population Movement Summary. 29 Butts, Jeffrey A and David Steinhart (July 2002). 30 Legislative Analysts Office (LAO). Board of Corrections (5430). LAO Analysis of the 1999-00 Budget Bill. 31 Steinhart, David. (June 2005). “California Budget Report.” Commonweal: The Juvenile Justice Program. 32 Legislative Analysts Office (LAO). Board of Corrections (5430). LAO Analysis of the 1999-00 Budget Bill. 33 Ibid. 34 California Welfare and Institutions Code Sec. 912.5. 35 Legislative Analysts Office (LAO). Board of Corrections (5430). LAO Analysis of the 1999-00 Budget Bill. Rates were set and frozen as of January 1, 1997 at $31,200 per year, although this does not reflect the full annual cost. LAO 9. There has been some effort lately to recalibrate the scale to reflect the actual cost, which has been estimated at $66,000 by the CYA and $80,000 by an official working group convened by the adult corrections agency. CPR. 36 California Performance Review: Ward/Parolee Population Management. (2004). 37 Legislative Analysts Office (LAO). Board of Corrections (5430). LAO Analysis of the 1999-00 Budget Bill. 38 State of California Department of Corrections and Rehabilitation, Division of Juvenile Justice. (November 2005). Population Movement Summary. 39 Ibid. 40 California Youth Authority. A Comparison of First Commitment Characteristics 1993-2004. 41 California Board of Corrections. (2004). Federal Juvenile Justice Challenge Funding Grant. 42 Ziedenberg, Jason. (2004). Fight Crime: Invest in Kids. “What Works” in California: Research Shows that Meeting Troubled Kids’ Mental Health Needs Reduces Crime. 43 California Board of Corrections. Juvenile Justice Crime Prevention Act (JJCPA). Annual Report. 2005. 44 Ibid. 45 California Board of Corrections. Juvenile Justice Crime Prevention Act. Annual Report, 2004. 46 Ibid. 47 Ibid. 48 Anderson, Lenore. 2005. “Public Safety Comes with Helping Troubled Kids Change Their Lives.” Contra Costa Times and San Diego Union-Tribune. January 3, 2005. 49 Zimmerman, Art. (January 2005). “Juvenile Justice and Youth Aids Program.” Wisconsin Legislative Fiscal Bureau. 50 Wisconsin Legislative Fiscal Bureau, “Juvenile Justice and Youth Aids Program Informational Paper 55,” January 2005. 51 Zimmerman, Art. (January 2005). “Juvenile Justice and Youth Aids Program.” Wisconsin Legislative Fiscal Bureau. 52 Wisconsin Legislative Audit Bureau Audit Summary, January 1999.

26
53 Ibid. 54 Zimmerman, Art. (January 2005). “Juvenile Justice and Youth Aids Program.” Wisconsin Legislative Fiscal Bureau. 55 Thieme, Jeanne. “An Evaluation: Youth Aids Program Department of Corrections,” Legislative Audit Bureau, January 1999. 56 Ibid. 57 Sickmund, Melissa, Sladky, T.J., and Kang, Wei. (2005) "Census of Juveniles in Residential Placement Databook." 58 Kathy Malone, Milwaukee County Division Manager of Court and Delinquent Services, December 8, 2005 59 Lowenkamp, Christopher T. and Latessa, Edward J., “Evaluation of Ohio’s RECLAIM Funded Programs, Community Corrections Facilities, and DYS Facilities.” Cincinnati, OH, August, 17, 2005. 60 These include all Category One offenses and most Category Two offenses: Aggravated Murder, Attempted Aggravated Murder, Murder, Attempted Murder; Kidnapping, Rape, Voluntary Manslaughter, Involuntary Manslaughter (only Felony 1 is a public safety bed), Felonious Sexual Penetration, Aggravated Arson. Ohio Department of Youth Services. Annual Report Fiscal Year 2004. 61 Ibid. 62 Ibid. 63 Ibid. 64Non-violent youth sentenced to IDOC have an average length of stay of 9.6 months, the average cost of incarcerating a non-violent offender is $51,525; Youth sent to IDOC for a court evaluation serve an average of 2.6 months, resulting in an average State cost of $13,955. Redeploy Illinois Amended Legislative Report: Implementation and Impact, January 2006. 65 Ibid. 66 Illinois Department of Human Services. (Spring/Summer 2004). Solutions Newsletter. 67 These figures are from the St. Clair county response to the state request for proposals under Redeploy Illinois. 68 Ibid. 69Cohen, Mark A. (1998), “The Monetary Value of Saving a High Risk Youth.” The Journal of Qualitative Criminology, 14 (1): 5-3.
