cost efficient vdi - boston...
TRANSCRIPT

1
Cost Efficient VDI XenDesktop 7 on
Commodity Hardware

2
Introduction
An increasing number of enterprises are looking towards desktop virtualization to help them
respond to rising IT costs, security concerns, the user demands of BYOD and mobile
working strategies. But can a desktop virtualization solution have a lower or equivalent Total
Cost of Ownership (TCO) when compared to the traditional approach of procuring physical
desktops? Is there a solution which delivers all the benefits of scalability and performance
while maintaining a lower TCO?
Leveraging commodity hardware is the answer – by enabling the delivery of a desktop
virtualisation infrastructure that modernises the workforce and enhances user productivity
while maintaining a lower TCO. Citrix has collaborated with Boston Limited to leverage their
Supermicro based commodity hardware stack to design a robust and scalable XenDesktop
architecture.
The solution works using software components such as Citrix XenDesktop 7.1 in
combination with Microsoft Hyper-V 2012 R2 and Windows Storage Spaces. The hardware
stack includes rack based servers equipped with SATA 6Gb/s 7mm 2.5" SSD for hosting the
IOPS hungry Write Cache and four AMD 12 Core Opteron processors for servicing the
Hosted Shared Desktop workloads; catering for heavy task based and knowledge workers.
The architecture does away with the need for SAN and relies on traditional JBOD managed
by Windows Server 2012 R2 clustered file services for hosting user data.
Solution Objective
The objective of this guide is to validate a Citrix XenDesktop Hosted Shared Desktop
architecture on commodity hardware whilst keeping in consideration the business needs of
an organization. The solution is designed to deliver performance and reliability at par with
enterprise class hardware yet keeping the per user capital expenditure for storage, compute
and network well within the range of $125 USD for concurrency greater than 1000 users.

3
The Relevance of Commodity Hardware
‘Commodity Hardware’ is hardware that is easily and affordably available. A device that is
said to use “commodity hardware” is one that uses components that were previously
available or designed and are thus not necessarily unique to that device. Commodity
hardware are often employed and used as file servers or are clustered together by
enterprises to provide large-scale computing power, or to maximize savings in IT design.
Based on ongoing research efforts, and the continuing advancements of computing and
networking technology, it is believed that use of commodity hardware is vital in creating a
cost effective and easily scalable cloud solution. And this is poised to have a major impact
on our society’s data centric commercial and scientific endeavours.
So applying the same concept, Citrix and Boston Limited have built a cost-effective yet
powerful and scalable virtual desktop infrastructure at a price point lower or equivalent to
that of a traditional PC.
XenDesktop 7 on Commodity Hardware
Each of the desktop class servers is equipped with 48x 2.8 GHz AMD Opteron processor
cores and 256GB RAM to satisfy the compute needs of shared desktop workloads for up-to
200 users. A key differentiator is the use of enterprise class SATA Solid State Drives which
provide excellent endurance from low-cost 19nm NAND. The cost of these drives is 1/3 that
of SLC NAND based SAS SSDs. Each server is equipped with 3 x SanDisk CloudSpeed
1000 series SSDs. Two of these drives configured with Windows Server 2012 R2 Storage
Spaces are utilized to host the volatile Write Cache and can service write IOPS in the range
of 100 per user thus effectively managing boot / login storms and IO intensive operations
such as antivirus scanning.
The construct of this Citrix Validated Solution is based on many decisions that were made
during validation testing. Testing was carried out using the Login VSI 4.0 virtual Session
Indexer (VSI), an industry standard tool for user / session benchmarking. Login VSI allows
comparisons of platforms and technologies under the same repeatable load. The “Medium”
VSI workload is expected to approximate the average office worker during normal activities
and was the workload used throughout testing.
The testing was conducted on a scaled down replica of the expected production
environment. Only the Hosted Shared Desktop FlexCast model workloads were tested using
the XenDesktop Template Policy “High Server Scalability” running in “Legacy Graphics
mode”. Therefore the Bill of Materials described within this document is extrapolated based
on single server scalability test results with these policy settings in place. Using these Citrix
Policies allows the greatest host density for each FlexCast model.
The following figure depicts the solution architecture that make up the requirements for
delivering a XenDesktop 7 Hosted Shared Desktop solution onto commodity hardware.

4
The following Citrix and Microsoft components are required to deploy the reference
architecture:
• Citrix XenDesktop 7.1: Hosted Shared Desktop and App virtualization platform
• Citrix Provisioning Server 7.1: Workload delivery platform
• Citrix StoreFront Services 2.1: Desktop and app resource enumeration
• Microsoft SQL 2012 SP1: Database Platform
• Microsoft Hyper-V Windows Server 2012 R2: Hypervisor platform
• Microsoft Windows Storage Server 2012 R2: Storage management platform
• Hardware: Boston Servers, Switches and Storage
5
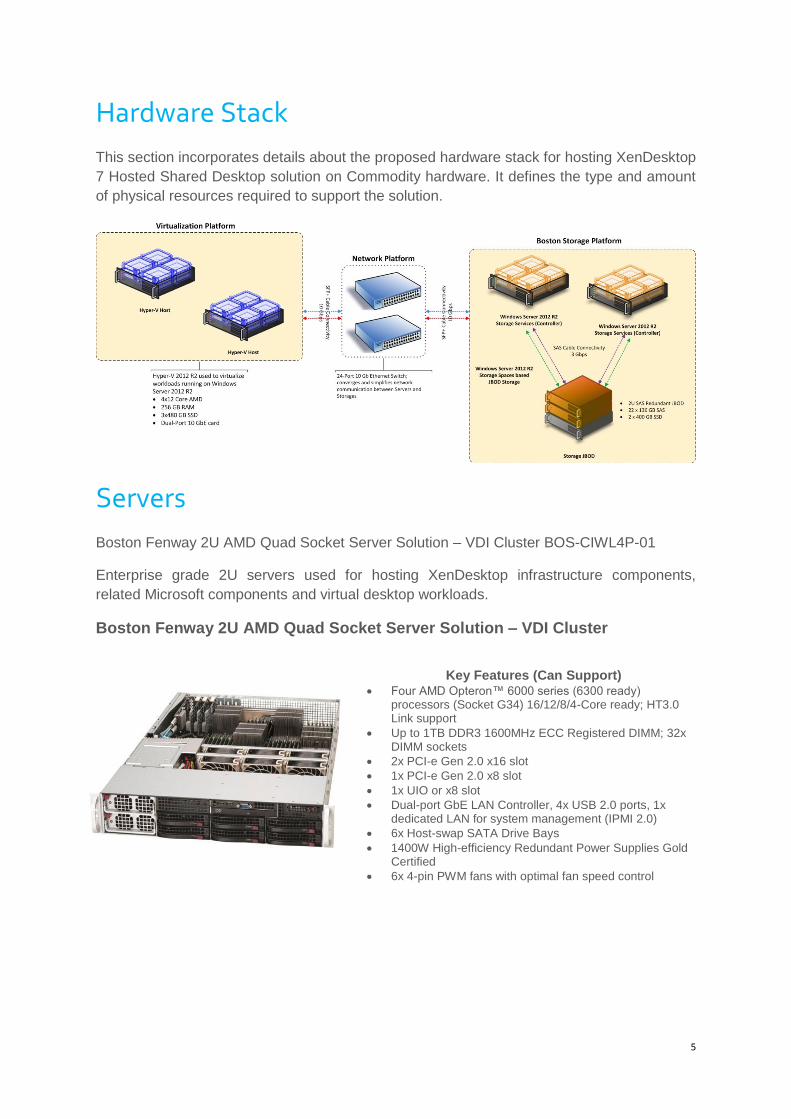
Hardware Stack
This section incorporates details about the proposed hardware stack for hosting XenDesktop
7 Hosted Shared Desktop solution on Commodity hardware. It defines the type and amount
of physical resources required to support the solution.
Servers
Boston Fenway 2U AMD Quad Socket Server Solution – VDI Cluster BOS-CIWL4P-01
Enterprise grade 2U servers used for hosting XenDesktop infrastructure components,
related Microsoft components and virtual desktop workloads.
Boston Fenway 2U AMD Quad Socket Server Solution – VDI Cluster
Key Features (Can Support) Four AMD Opteron™ 6000 series (6300 ready)
processors (Socket G34) 16/12/8/4-Core ready; HT3.0 Link support
Up to 1TB DDR3 1600MHz ECC Registered DIMM; 32x DIMM sockets
2x PCI-e Gen 2.0 x16 slot
1x PCI-e Gen 2.0 x8 slot
1x UIO or x8 slot
Dual-port GbE LAN Controller, 4x USB 2.0 ports, 1x dedicated LAN for system management (IPMI 2.0)
6x Host-swap SATA Drive Bays
1400W High-efficiency Redundant Power Supplies Gold Certified
6x 4-pin PWM fans with optimal fan speed control
6
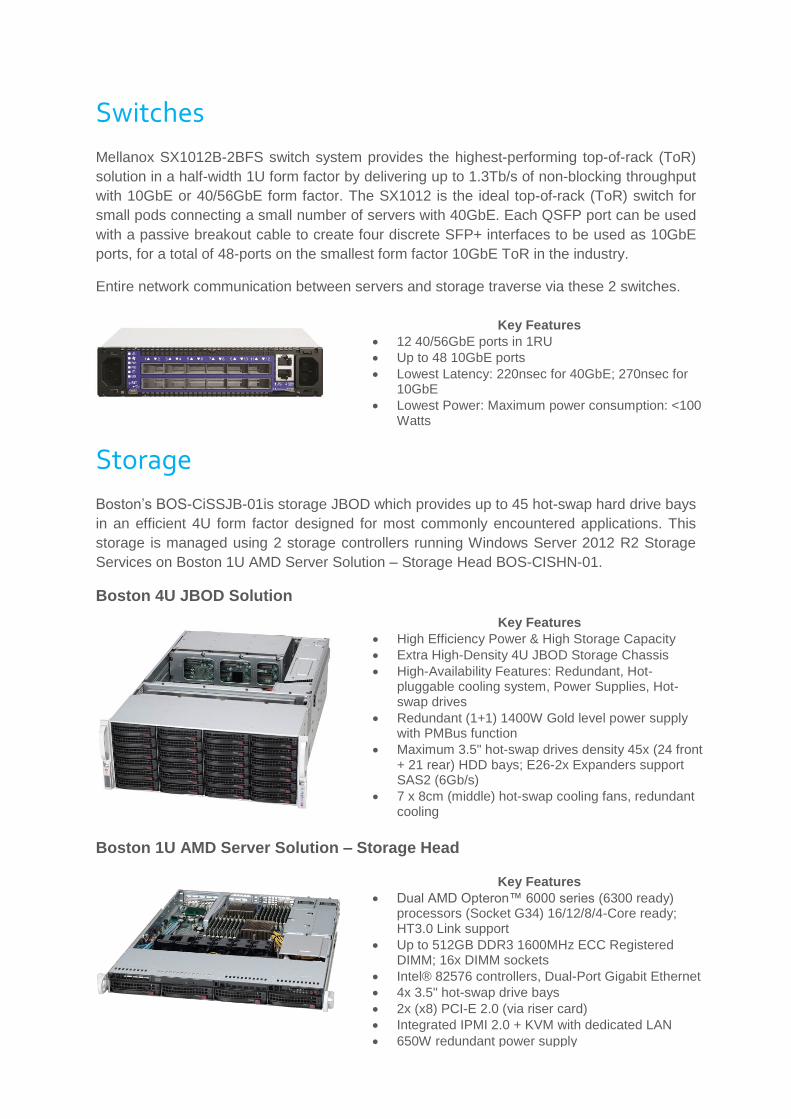
Switches
Mellanox SX1012B-2BFS switch system provides the highest-performing top-of-rack (ToR)
solution in a half-width 1U form factor by delivering up to 1.3Tb/s of non-blocking throughput
with 10GbE or 40/56GbE form factor. The SX1012 is the ideal top-of-rack (ToR) switch for
small pods connecting a small number of servers with 40GbE. Each QSFP port can be used
with a passive breakout cable to create four discrete SFP+ interfaces to be used as 10GbE
ports, for a total of 48-ports on the smallest form factor 10GbE ToR in the industry.
Entire network communication between servers and storage traverse via these 2 switches.
Storage
Boston’s BOS-CiSSJB-01is storage JBOD which provides up to 45 hot-swap hard drive bays
in an efficient 4U form factor designed for most commonly encountered applications. This
storage is managed using 2 storage controllers running Windows Server 2012 R2 Storage
Services on Boston 1U AMD Server Solution – Storage Head BOS-CISHN-01.
Boston 4U JBOD Solution
Boston 1U AMD Server Solution – Storage Head
Key Features
12 40/56GbE ports in 1RU
Up to 48 10GbE ports
Lowest Latency: 220nsec for 40GbE; 270nsec for 10GbE
Lowest Power: Maximum power consumption: <100 Watts
Key Features
High Efficiency Power & High Storage Capacity
Extra High-Density 4U JBOD Storage Chassis
High-Availability Features: Redundant, Hot-pluggable cooling system, Power Supplies, Hot-swap drives
Redundant (1+1) 1400W Gold level power supply with PMBus function
Maximum 3.5" hot-swap drives density 45x (24 front + 21 rear) HDD bays; E26-2x Expanders support SAS2 (6Gb/s)
7 x 8cm (middle) hot-swap cooling fans, redundant cooling
Key Features
Dual AMD Opteron™ 6000 series (6300 ready) processors (Socket G34) 16/12/8/4-Core ready; HT3.0 Link support
Up to 512GB DDR3 1600MHz ECC Registered DIMM; 16x DIMM sockets
Intel® 82576 controllers, Dual-Port Gigabit Ethernet
4x 3.5" hot-swap drive bays
2x (x8) PCI-E 2.0 (via riser card)
Integrated IPMI 2.0 + KVM with dedicated LAN
650W redundant power supply

7
Scalability & Performance Testing
The focus of testing was on capturing the performance of commodity hardware and its
resiliency during the entire process of the virtual desktop lifecycle.
Test metrics are gathered for all components under test such as the hypervisor, virtual
desktop, network and storage and from the workload generation system, Login VSI, to
determine the overall success of a test run. A repeated test methodology is followed to
provide consistency between runs.
Test Methodology
The following test methodology is used for each test run to ensure consistent results:
• Before each test, all desktop VMs and clients are cleanly started
• All VMs and client launchers are idle before test for consistent results
• Boot phase – All desktop VMs are powered ON and registered
• Logon phase – All user session are launched and active in Login VSI
• Test phase – At least 2 Login VSI loops are executed in each active session
• Logoff phase – All users logged off after VSI completion
• Test run reports and data are gathered
• All desktop VMs and clients are shut down.
Test Methodology Physical Hardware – Storage &
Compute
Function Citrix Infrastructure
Virtualization Hosted Shared
Desktops Windows Storage
Server
Hardware Model Boston VDI Cluster BOS-CIWL4P-01
Boston VDI Cluster BOS-CIWL4P-01
Boston VDI Cluster BOS-CIWL4P-01
Host Count 1 1 2
Processor 12 core x 4 sockets 12 core x 4 sockets 8 core x 2 socket
Memory 256GB 256GB 64GB
Network 10GbE 10GbE 10GbE
Storage Type Local SSD Local SSD JBOD SSD & SAS
Drives
Operating System Windows Server 2012
R2 Hyper-V Windows Server 2012
R2 Hyper-V Windows Storage Server 2012 R2
HA/Resiliency Configuration
No HA No HA No HA

8
Virtual Machines – XenDesktop Infrastructure and Virtual Desktops
Function Citrix Desktop
Delivery Controllers
Citrix Provisioning
Server
Citrix License Server
Citrix StoreFront
Server
Citrix Hosted Shared
Desktop VM
Hardware Model
Hyper-V VM Hyper-V VM Hyper-V VM Hyper-V VM Hyper-V VM
VM Count 2 2 1 2 8
Number of Cores
4 6 2 4 6
Memory 4GB 16GB 4GB 4GB 28GB
Hard Drive 40GB 40GB 500GB (SOFS)
40GB 40GB 40GB
Operating System
Windows Server 2012
R2
Windows Server 2012
R2
Windows Server 2012
R2
Windows Server 2012
R2
Windows Server 2012
R2
Other Infrastructure
Function Domain
Controller DNS DHCP
SQL 2012 SP1 Server
Citrix Consoles
SCVMM 2012 R2
SCOM & SCEP 2012
R2
LoginVSI Launcher
Hardware Model
Hyper-V VM Hyper-V VM Hyper-V VM Hyper-V VM Hyper-V VM
VM Count 1 1 1 1 4
Number of Cores
2 4 2 2 2
Memory 4GB 6GB 6GB 4GB 4GB
Hard Drive 40GB 500GB (SOFS)
40GB 40GB 40GB
Operating System
Windows Server 2012
R2
Windows Server 2012
R2
Windows Server 2012
R2
Windows Server 2012
R2
Windows Server 2012
R2

9
Storage Performance Results
For the test setup, the Boston JBOD solution is configured with 22 x 10K RPM 140GB SAS
drives and 2 x SanDisk dOptimus Eco SSDs. The SSDs are primarily used for storage tiering
and write-back cache.
The storage head servers are configured with Windows Storage Spaces and clustering to
achieve better performance and resiliency. Storage server is used as file share for storing
user profiles; redirected folders; home drives (for storing user data) and as SOFS for storing
vDisk and Data store. This data relies on a storage server configured with Storage space 2
way mirror resilience; auto-tier and write cache features.
CPU Idle time on storage controllers
CPU Usage on storage controllers
The following graph shows disk transfers/sec (IOPS) on different volumes and drives:

10
IOPS for PVS vDiskStore on SOFS
IOPS for User Data Share (SSD + SAS Drives)
IOPS for User Data Share (2 x SSD drives)

11
IOPS for User Data Share (22 xSAS drives)
The following graph shows the network utilization:
Bytes Sent/sec from the Storage controllers
Bytes Received/sec by the Storage controllers
From above graphs it’s clear that the storage performance is up to the mark as expected and
CPU utilization very minimal. Most of the operations are served by SSD drives which are
used for caching. The network utilization is also very minimal.

12
Note: Above storage statistics for user data share is in relation to the LoginVSI Medium
Workload. The actual usage in production will vary from environment to environment based
on end user activity.
In addition we also performed storage cluster failover testing in order to understand the
impact on live user sessions. During failover there was no impact on user session as none of
the sessions failed. A spike in response time is observed during the fail-over activity.
The following graph shows the change in ownership post failover as well as the spike in
response time.
Ownership changes from Storage Head WSS2 to Storage Head WSS1
Spike in response time observed during failover

13
Host Performance Results
A Boston VDI Cluster BOS-CIWL4P-01 enterprise class server is dedicated to host the
Hosted Shared Desktop workloads. One of the three SanDisk CloudSpeed 1000 SSDs is
used for host OS installation. The remaining two SSDs are configured as Simple Space
using Storage Spaces and store the WriteCache for the Hosted Shared Desktop VMs.
The single server scalability testing using the LoginVSI 4.0 “Medium Workload” revealed that
each Boston VDI Cluster BOS-CIWL4P-01 host can sustain ~186 concurrent user sessions.
The following graph shows CPU utilization for Host and VMs.
CPU Utilization by Host and Guest VMs
Disk Queue length for VM

14
Disk Queue length for Physical server (Write Cache Drive)
IOPS on WriteCache Drive
The following graph shows the network utilization:
Total Bytes/Sec per VM

15
The following graph shows the total user sessions run during the testing:
Total User Sessions
Conclusion
The primary objective of testing was to validate that Citrix XenDesktop 7 supports
Commodity Hardware and delivers a high performance virtual desktop at a price point lower
or equivalent to that of standard PC. The defined success criteria were:
• No server CPU utilization average to be over 90% while under load
• Storage and network to perform within guidelines
• 180-200 users connect, complete a test run, and disconnect cleanly
The testing was executed as planned, the success criteria were met, and it was shown that
commodity hardware did meet the initial objective.

16
Powered By