cost of illiquidity
TRANSCRIPT
Aswath Damodaran 1
The Cost of Illiquidity
Aswath Damodaran
Aswath Damodaran 2
What is illiquidity?
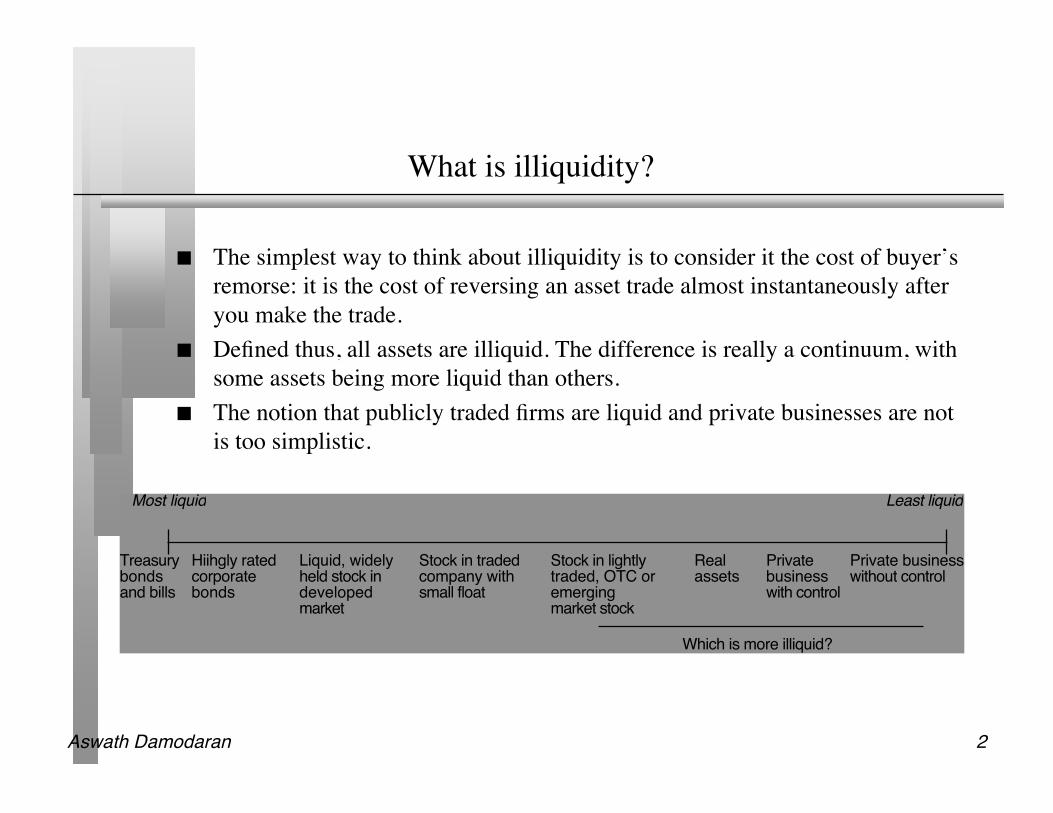
The simplest way to think about illiquidity is to consider it the cost of buyer’sremorse: it is the cost of reversing an asset trade almost instantaneously afteryou make the trade.
Defined thus, all assets are illiquid. The difference is really a continuum, withsome assets being more liquid than others.
The notion that publicly traded firms are liquid and private businesses are notis too simplistic.
Liquid, widely held stock in developed market
Stock in traded company with small float
Stock in lightly traded, OTC or emerging market stock
Treasury bonds and bills
Hiihgly rated corporate bonds
Real assets
Private business with control
Private business without control
Which is more illiquid?
Most liquid Least liquid
Aswath Damodaran 3
The Components of Trading Costs for an asset
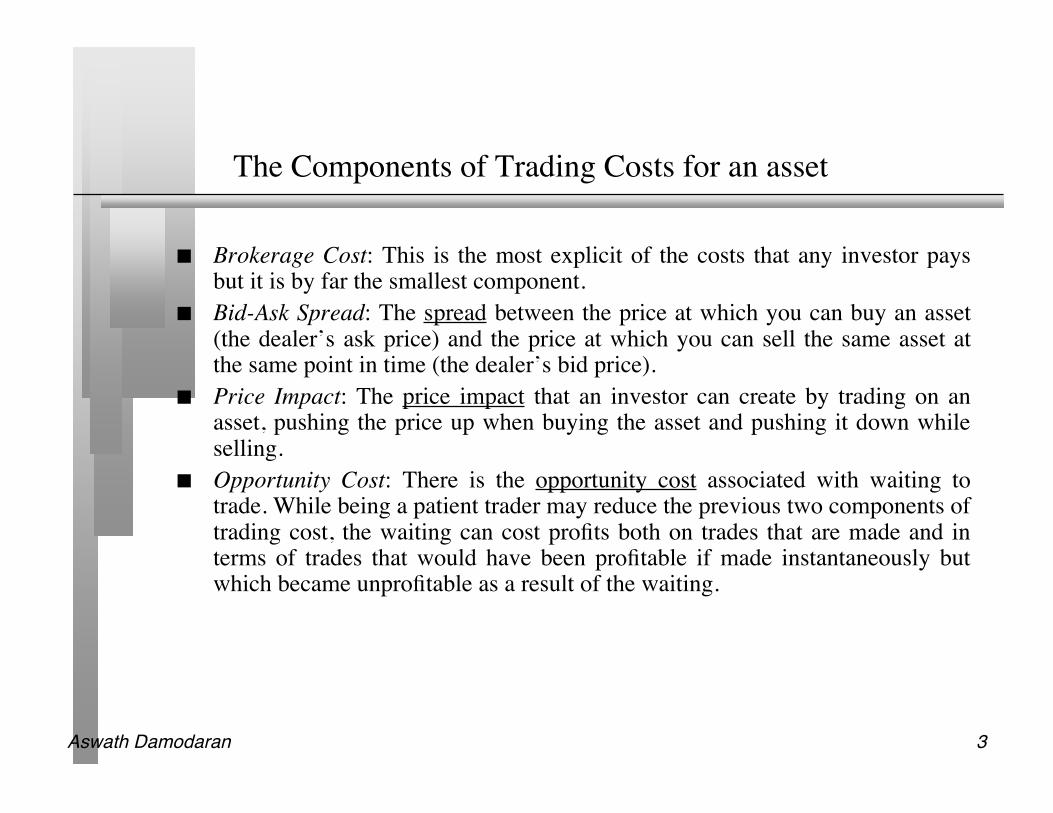
Brokerage Cost: This is the most explicit of the costs that any investor paysbut it is by far the smallest component.
Bid-Ask Spread: The spread between the price at which you can buy an asset(the dealer’s ask price) and the price at which you can sell the same asset atthe same point in time (the dealer’s bid price).
Price Impact: The price impact that an investor can create by trading on anasset, pushing the price up when buying the asset and pushing it down whileselling.
Opportunity Cost: There is the opportunity cost associated with waiting totrade. While being a patient trader may reduce the previous two components oftrading cost, the waiting can cost profits both on trades that are made and interms of trades that would have been profitable if made instantaneously butwhich became unprofitable as a result of the waiting.
Aswath Damodaran 4
Why is there a bid-ask spread?
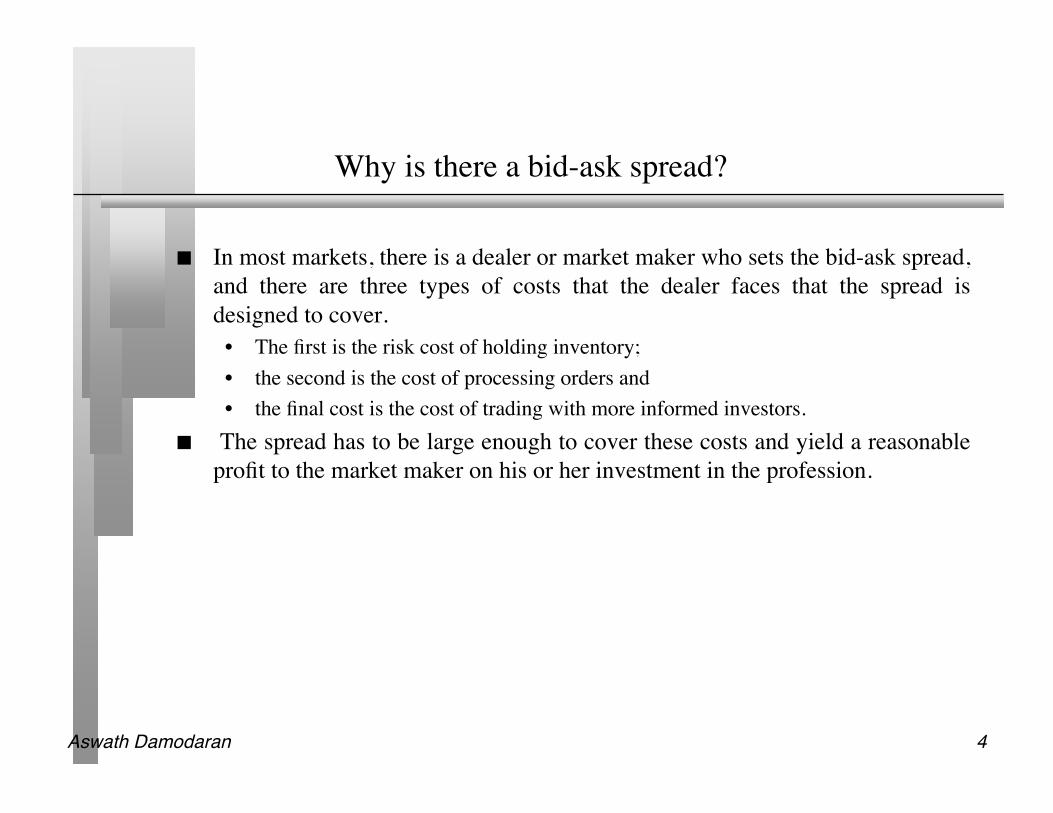
In most markets, there is a dealer or market maker who sets the bid-ask spread,and there are three types of costs that the dealer faces that the spread isdesigned to cover.
• The first is the risk cost of holding inventory;• the second is the cost of processing orders and• the final cost is the cost of trading with more informed investors.
The spread has to be large enough to cover these costs and yield a reasonableprofit to the market maker on his or her investment in the profession.
Aswath Damodaran 5
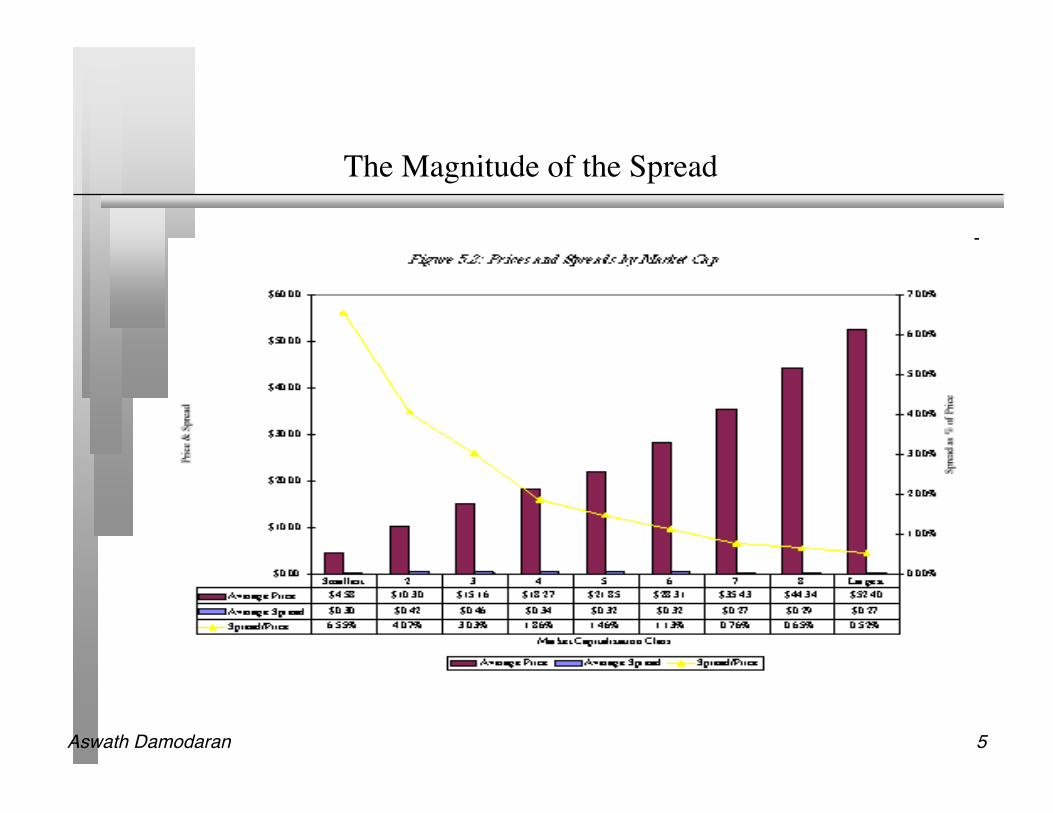
The Magnitude of the Spread
Aswath Damodaran 6
More Evidence of Bid-Ask Spreads
The spreads in U.S. government securities are much lower than the spreads ontraded stocks in the United States. For instance, the typical bid-ask spread on aTreasury bill is less than 0.1% of the price.
The spreads on corporate bonds tend to be larger than the spreads ongovernment bonds, with safer (higher rated) and more liquid corporate bondshaving lower spreads than riskier (lower rated) and less liquid corporatebonds.
The spreads in non-U.S. equity markets are generally much higher than thespreads on U.S. markets, reflecting the lower liquidity in those markets and thesmaller market capitalization of the traded firms.
While the spreads in the traded commodity markets are similar to those in thefinancial asset markets, the spreads in other real asset markets (real estate,art...) tend to be much larger.

Aswath Damodaran 7
The Determinants of the Bid-Ask Spread
Studies by Tinic and West (1972), Stoll (1978) and Jegadeesh andSubrahmanyam (1993) find that spreads as a percentage of the price arecorrelated negatively with the price level, volume and the number of marketmakers, and positively with volatility. Each of these findings is consistent withthe theory on the bid-ask spread.
A study by Kothare and Laux, that looked at average spreads on the NASDAQalso looked at differences in bid-ask spreads across stocks on the NASDAQ.In addition to noting similar correlations between the bid-ask spreads, pricelevel and trading volume, they uncovered an interesting new variable. Theyfound that stocks where institutional activity increased significantly had thebiggest increase in bid-ask spreads. It might also reflect the perception on thepart of market makers that institutional investors tend to be informed investorswith more or better information.
Aswath Damodaran 8
Why is there a price impact?
The first is that markets are not completely liquid. A large trade can create animbalance between buy and sell orders, and the only way in which thisimbalance can be resolved is with a price change. This price change, thatarises from lack of liquidity, will generally be temporary and will be reversedas liquidity returns to the market.
The second reason for the price impact is informational. A large trade attractsthe attention of other investors in that asset market because if might bemotivated by new information that the trader possesses. This price effect willgenerally not be temporary, especially when we look at a large number ofstocks where such large trades are made. While investors are likely to bewrong a fair proportion of the time on the informational value of large blocktrades, there is reason to believe that they will be right almost as often.
Aswath Damodaran 9
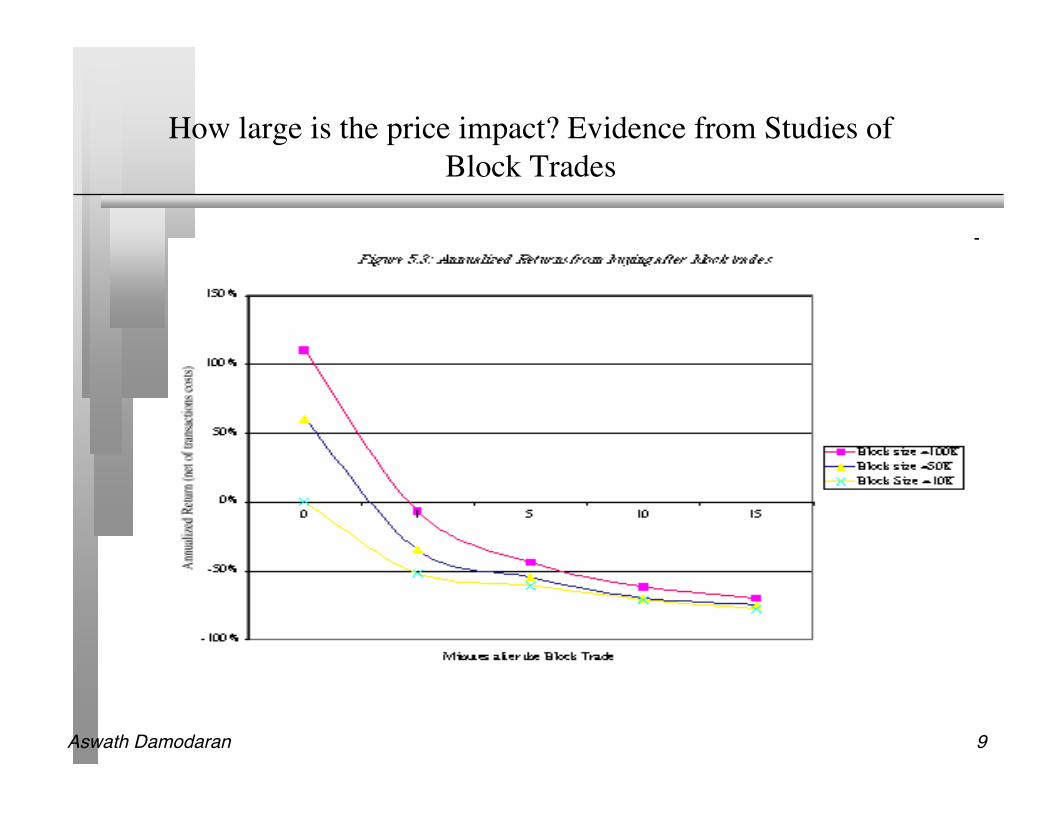
How large is the price impact? Evidence from Studies ofBlock Trades
Aswath Damodaran 10
Limitations of the Block Trade Studies
These and similar studies suffer from a sampling bias - they tend to look atlarge block trades in liquid stocks on the exchange floor – they also sufferfrom another selection bias, insofar as they look only at actual executions.
The true cost of market impact arises from those trades that would have beendone in the absence of a market impact but were not because of the perceptionthat it would be large.
Aswath Damodaran 11
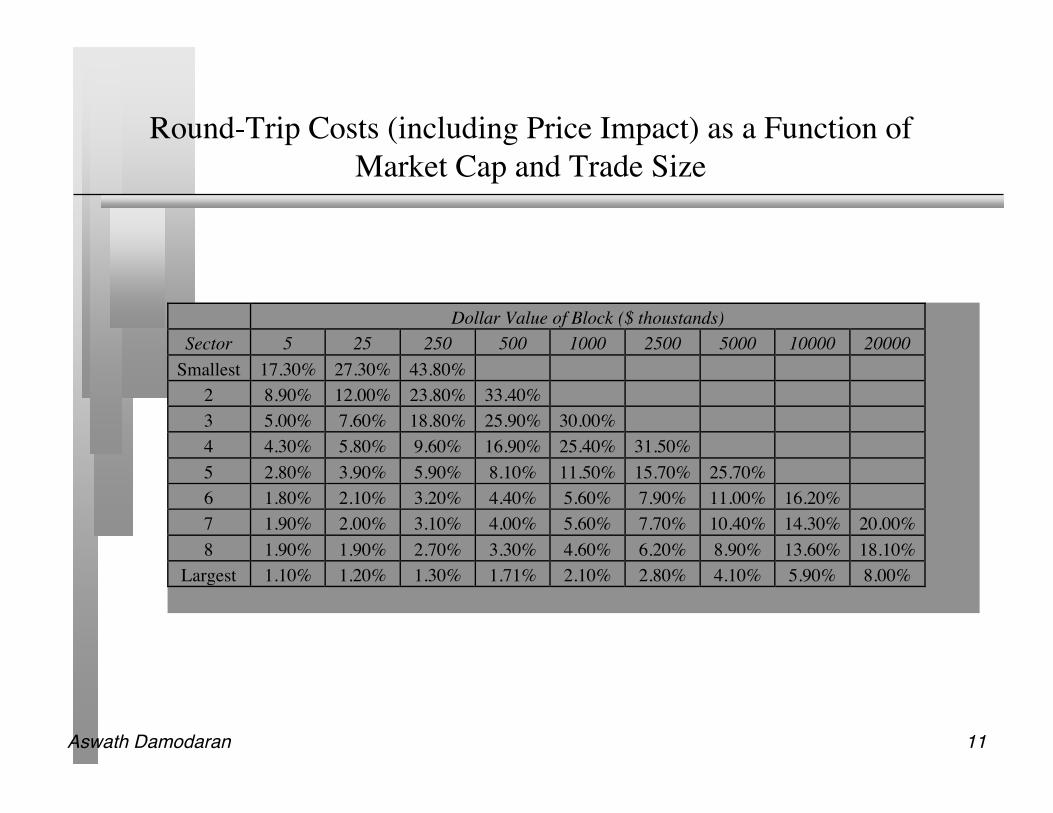
Round-Trip Costs (including Price Impact) as a Function ofMarket Cap and Trade Size
Dollar Value of Block ($ thoustands)
Sector 5 25 250 500 1000 2500 5000 10000 20000
Smallest 17.30% 27.30% 43.80%
2 8.90% 12.00% 23.80% 33.40%
3 5.00% 7.60% 18.80% 25.90% 30.00%
4 4.30% 5.80% 9.60% 16.90% 25.40% 31.50%
5 2.80% 3.90% 5.90% 8.10% 11.50% 15.70% 25.70%
6 1.80% 2.10% 3.20% 4.40% 5.60% 7.90% 11.00% 16.20%
7 1.90% 2.00% 3.10% 4.00% 5.60% 7.70% 10.40% 14.30% 20.00%
8 1.90% 1.90% 2.70% 3.30% 4.60% 6.20% 8.90% 13.60% 18.10%
Largest 1.10% 1.20% 1.30% 1.71% 2.10% 2.80% 4.10% 5.90% 8.00%
Aswath Damodaran 12
Determinants of Price Impact
Looking at the evidence, the variables that determine that price impact oftrading seem to be the same variables that drive the bid-ask spread. Thatshould not be surprising. The price impact and the bid-ask spread are both afunction of the liquidity of the market. The inventory costs and adverseselection problems are likely to be largest for stocks where small trades canmove the market significantly.
In many real asset markets, the difference between the price at which one canbuy the asset and the price at which one can sell, at the same point in time, isa reflection of both the bid-ask spread and the expected price impact of thetrade on the asset. Not surprisingly, this difference can be very large inmarkets where trading is infrequent; in the collectibles market, this cost canamount to more than 20% of the value of the asset.
Aswath Damodaran 13
The Theory on Illiquidity Discounts
Illiquidity discount on value: You should reduce the value of an asset by the expectedcost of trading that asset over its lifetime.
• The illiquidity discount should be greater for assets with higher trading costs• The illiquidity discount should be decrease as the time horizon of the investor holding the asset
increases Illiquid assets should be valued using higher discount rates
• Risk-Return model: Some illiquidity risk is systematic. In other words, the illiquidity increaseswhen the market is down. This risk should be built into the discount rate.
• Empirical: Assets that are less liquid have historically earned higher returns. Relating returns tomeasures of illiquidity (turnover rates, spreads etc.) should allow us to estimate the discountrate for less liquid assets.
Illiqudiity can be valued as an option: When you are not allowed to trade an asset, youlose the option to sell it if the price goes up (and you want to get out).
Aswath Damodaran 14
a. Illiquidity Discount in Value
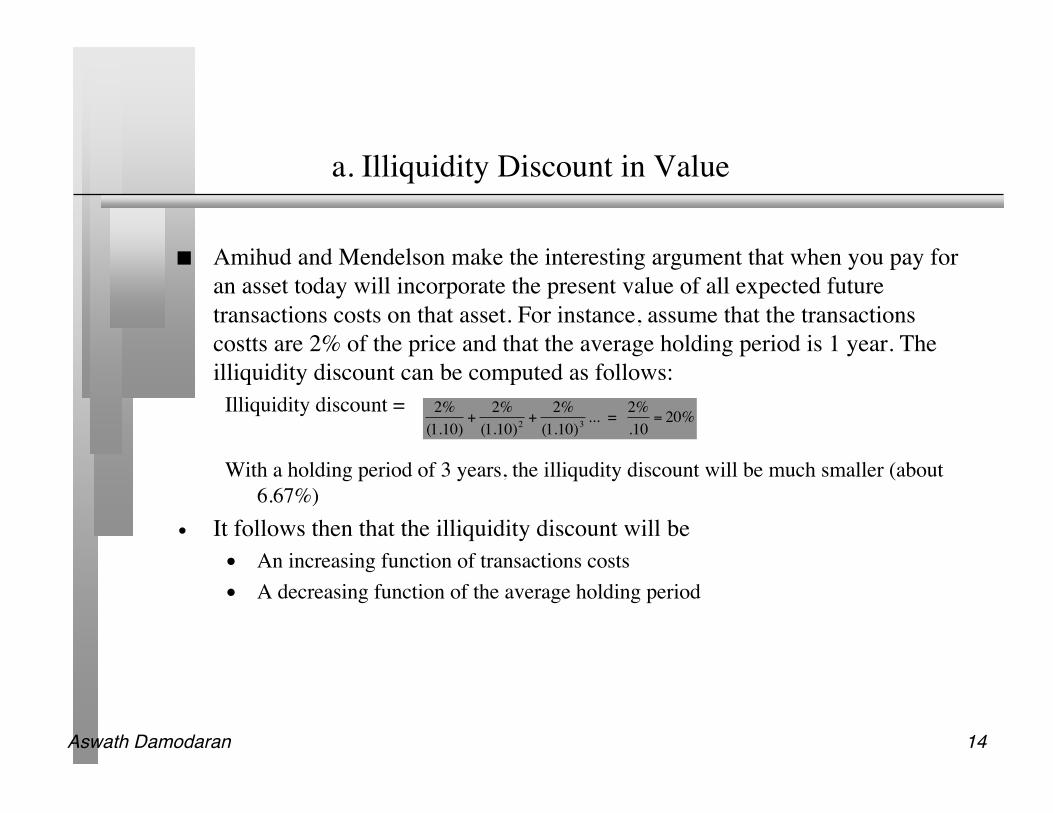
Amihud and Mendelson make the interesting argument that when you pay foran asset today will incorporate the present value of all expected futuretransactions costs on that asset. For instance, assume that the transactionscostts are 2% of the price and that the average holding period is 1 year. Theilliquidity discount can be computed as follows:
Illiquidity discount =
With a holding period of 3 years, the illiqudity discount will be much smaller (about6.67%)
• It follows then that the illiquidity discount will be• An increasing function of transactions costs• A decreasing function of the average holding period
!
2%
(1.10)+
2%
(1.10)2
+2%
(1.10)3
... = 2%
.10= 20%
Aswath Damodaran 15
b. Adjusting discount rates for illiquidity
Liquidity as a systematic risk factor• If liquidity is correlated with overall market conditions, less liquid stocks should
have more market risk than more liquid stocks• To estimate the cost of equity for stocks, we would then need to estimate a
“liquidity beta” for every stock and multiply this liquidity beta by a liquidity riskpremium.
• The liquidity beta is not a measure of liquidity, per se, but a measure of liquiditythat is correlated with market conditions.
Liquidity premiums• You can always add liquidity premiums to conventional risk and return models to
reflect the higher risk of less liquid stocks.• These premiums are usually based upon historical data and reflect what you would
have earned on less liquid investments historically (usually smaller stocks withlower trading volume) relative to more liquid investments. Amihud and Mendelsonestimate that the expected return increases about 0.25% for every 1% increase inthe bid-ask spread.
Aswath Damodaran 16
c. Illiquidity as a lookback option
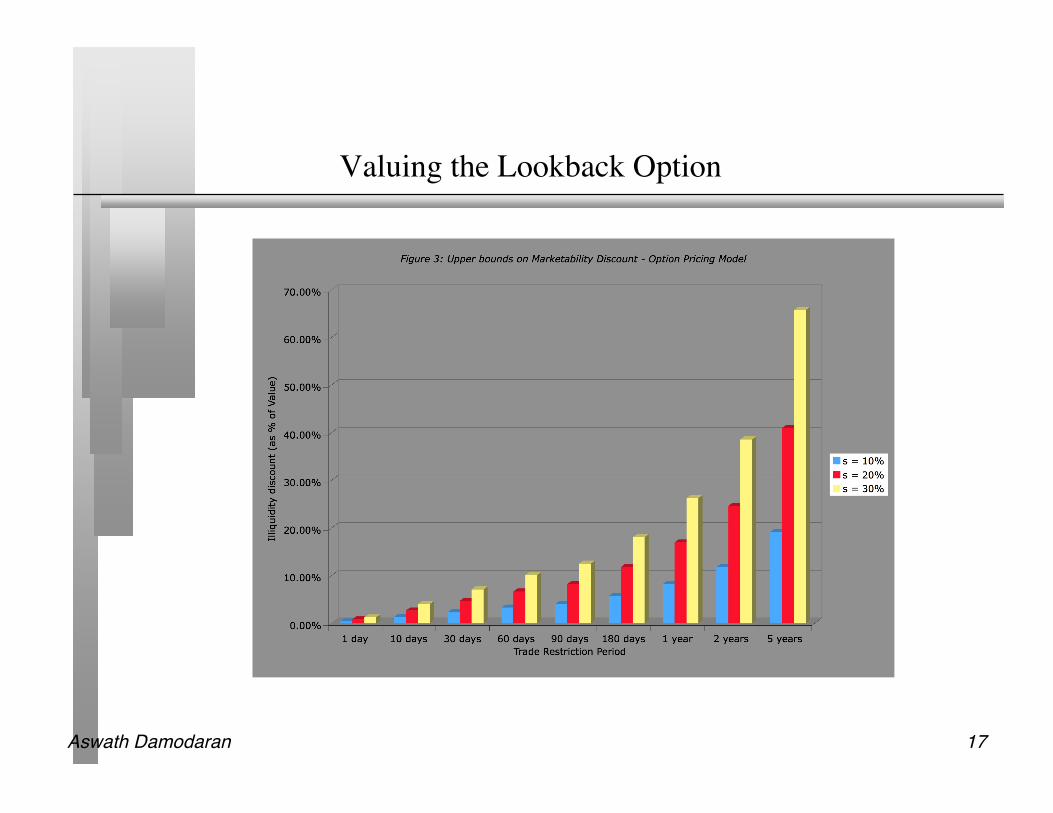
Longstaff (1995) presents an upper bound for the option by considering aninvestor with perfect market timing abilities who owns an asset on which sheis not allowed to trade for a period.
In the absence of trading restrictions, this investor would sell at the maximumprice that an asset reaches during the time period and the value of the look-back option estimated using this maximum price should be the outer bound forthe value of illiquidity. Using this approach,
Aswath Damodaran 17
Valuing the Lookback Option
Aswath Damodaran 18
The Cost of Illiquidity: Empirical EvidenceBond Market
T.Bills versus T.Bonds: The yield on the less liquid treasury bond was higheron an annualized basis than the yield on the more liquid treasury bill, adifference attributed to illiquidity.
Corporate Bonds: A study compared over 4000 corporate bonds in bothinvestment grade and speculative categories, and concluded that illiquid bondshad much higher yield spreads than liquid bonds. This study found thatliquidity decreases as they moved from higher bond ratings to lower ones andincreased as they move from short to long maturities.
Overall: The consensus finding is that liquidity matters for all bonds, but that itmatters more with risky bonds than with safer bonds.

Aswath Damodaran 19
The Cost of Illiquidity:Equity Markets - Cross Sectional Differences
Trading volume: Brennan, Chordia and Subrahmanayam (1998) find thatdollar trading volume and stock returns are negatively correlated, afteradjusting for other sources of market risk. Datar,
Turnover Ratio: Nair and Radcliffe (1998) use the turnover ratio as a proxy forliquidity. After controlling for size and the market to book ratio, they concludethat liquidity plays a significant role in explaining differences in returns, withmore illiquid stocks (in the 90the percentile of the turnover ratio) havingannual returns that are about 3.25% higher than liquid stocks (in the 10th
percentile of the turnover ratio). In addition, they conclude that every 1%increase in the turnover ratio reduces annual returns by approximately 0.54%.
And it is not a size or price to book effect: Nguyen, Mishra and Prakash(2005) conclude that stocks with higher turnover ratios do have lowerexpected returns. They also find that market capitalization and price to bookratios, two widely used proxies that have been shown to explain differences instock returns, do not proxy for illiquidity
Aswath Damodaran 20
Controlled Studies
All of the studies noted on the last page can be faulted because they cannotcontrol for liquidity perfectly. Illiquid stocks are more likely to be in smallercompanies that are not held by institutional investors. No matter how carefullya study is done, it will be difficult to categorically state that the observedreturn differences are due to liquidity.
The studies that carry the most weight for measuring illiquidity, therefore, arestudies where we can control for the difference. Usually, they involved sharesissued by the same company, with the only difference being that one set ofshares is liquid and the other is not. The difference in price can then beattributed entirely to illiquidity.
Aswath Damodaran 21
a. Restricted Stock Studies
Restricted securities are securities issued by a company, but not registeredwith the SEC, that can be sold through private placements to investors, butcannot be resold in the open market for a one-year holding period, and limitedamounts can be sold after that. Restricted securities trade at significantdiscounts on publicly traded shares in the same company.
• Maher examined restricted stock purchases made by four mutual funds in theperiod 1969-73 and concluded that they traded an average discount of 35.43% onpublicly traded stock in the same companies.
• Moroney reported a mean discount of 35% for acquisitions of 146 restricted stockissues by 10 investment companies, using data from 1970.
• In a recent study of this phenomenon, Silber finds that the median discount forrestricted stock is 33.75%.
Many of these older studies were done when the restriction stretched to twoyears. More recent studies since the change in the holding period come backwith lower values for the discount (20-25%).
Aswath Damodaran 22
The problems with restricted stock
There are three statistical problems with extrapolating from restricted stockstudies.
• First, these studies are based upon small sample sizes, spread out over long timeperiods, and the standard errors in the estimates are substantial.
• Second, most firms do not make restricted stock issues and the firms that do makethese issues tend to be smaller, riskier and less healthy than the typical firm. Thisselection bias may be skewing the observed discount.
• Third, the investors with whom equity is privately placed may be providing otherservices to the firm, for which the discount is compensation.
Bajaj, Dennis, Ferris and Sarin compute a discount of 9.83% for privateplacements, where there is no illiquidity, and argue that controlling fordifferences across companies making restricted stock results in an illiquditydiscount of 7.23% for restricted stock.
Aswath Damodaran 23
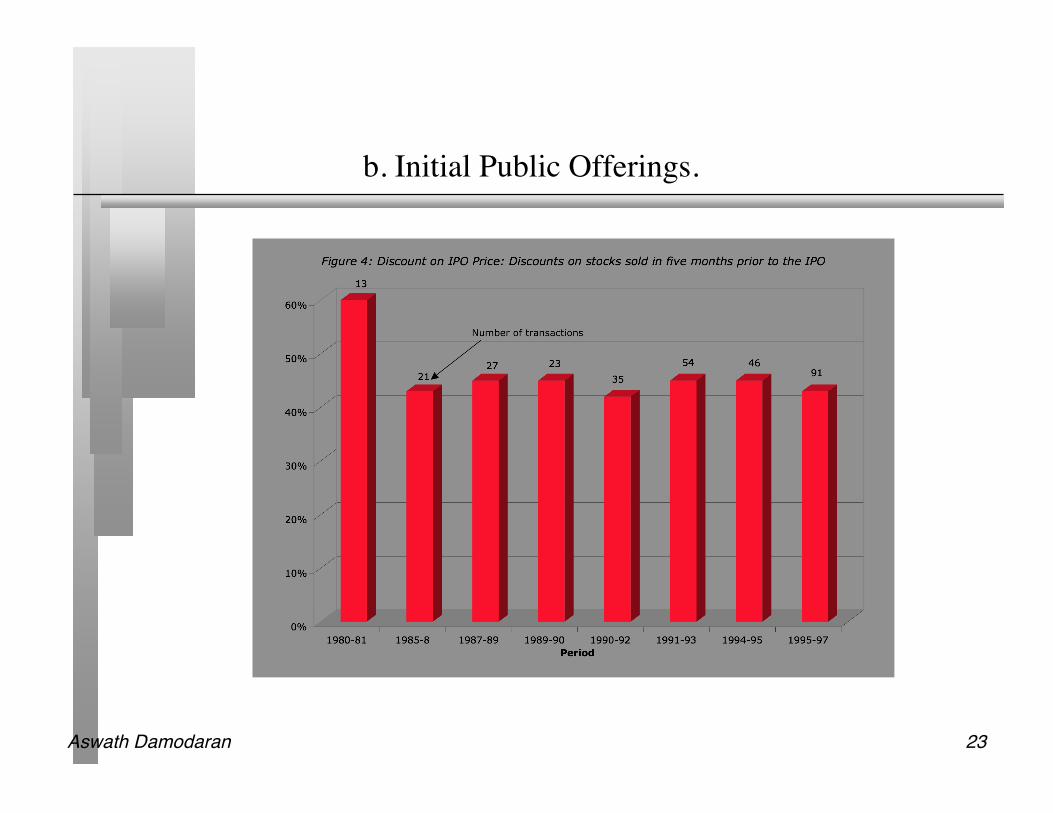
b. Initial Public Offerings.
Aswath Damodaran 24
The problem with IPOs: Side Bets and Other Uncertainties
There are two problems with the IPO studies that make us reluctant toconclude that it is illiquidity.
• The first is the sheer size of the discount suggests that there may be something elsegoing on in these transactions. In particular, these might not be arms lengthtransactions and the sellers of these shares may be getting compensating benefitselsewhere.
• The second is that there may be uncertainty about whether the IPO will go throughand if it does, the price at which the company will go public. The discount mayreflect how much the sellers are willing to pay to accept a certainty equivalent of arisky cash flow.
Aswath Damodaran 25
c. Companies with different share classes
Some companies have multiple classes of shares in the same market, withsome classes being more liquid than others. If there are no other differences(in voting rights or dividends, for instance) across the classes, the difference inprices can be attributed to liquidity.
Chen and Xiong (2001) compare the market prices of the traded commonstock in 258 Chinese companies with the auction and private placement pricesof the RIS shares and conclude that the discount on the latter is 78% forauctions and almost 86% for private placements.
There are companies in emerging markets with ADRs listed for their stock inthe US. The ADRs historically have traded at significant premiums over thedomestic listings and some of the difference can be attributed to the higherliquidity of the US market.

Aswath Damodaran 26
Dealing with illiquidity in valuation
If we accept that illiquidity affects value, and both the theory and empiricalevidence suggest that it does, the question becomes how best to bring it intothe value.
There are three choices:• Estimate the value of the asset as if it were a liquid asset and then discount that
value for illiquidity• Adjust the discount rates and use a higher discount rate for illiquid companies• Estimate the illiquidity discount by looking at comparable companies and seeing
how much their values are impacted by illiquidity
Aswath Damodaran 27
a. Illiquidity DiscountThe Rule of Thumb approach
In private company valuation, illiquidity is a constant theme that analysts talkabout.
All the talk, though, seems to lead to a rule of thumb. The illiquidity discountfor a private firm is between 20-30% and does not vary much across privatefirms.
In our view, this reflects the objective of many appraisers of private companieswhich has been to get the largest discount that the courts will accept ratherthan the right illiquidity discount.
Aswath Damodaran 28
Determinants of the Illiquidity Discount
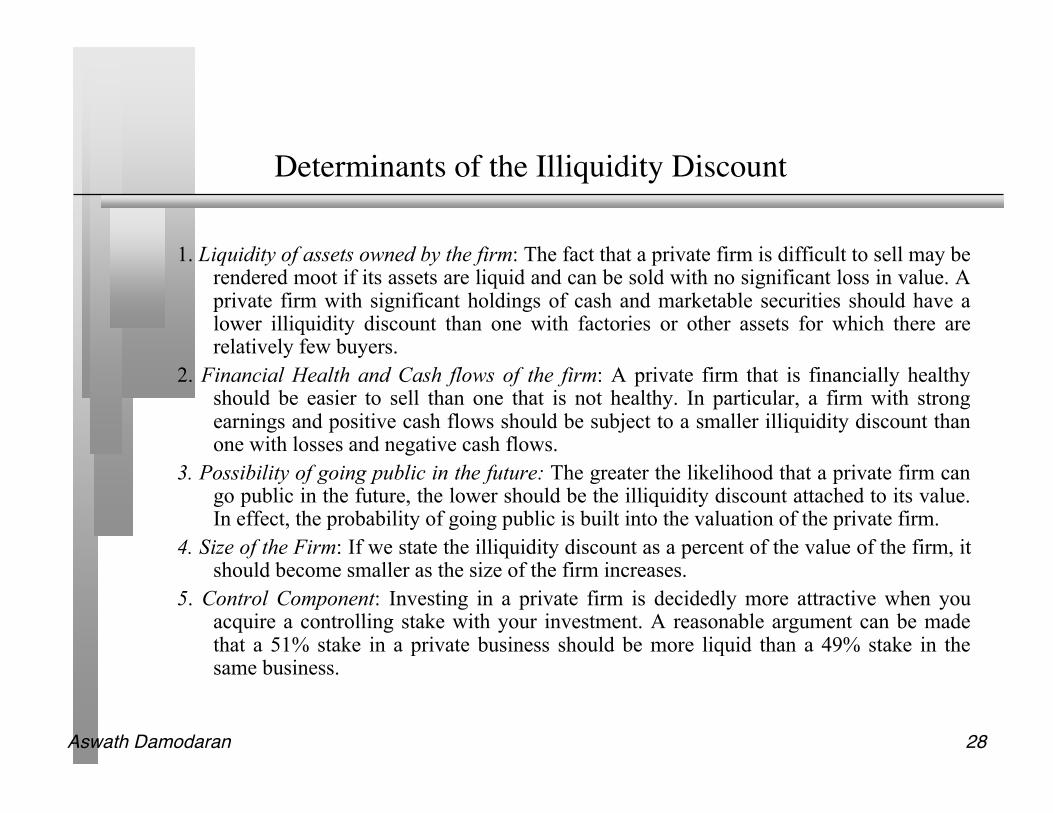
1. Liquidity of assets owned by the firm: The fact that a private firm is difficult to sell may berendered moot if its assets are liquid and can be sold with no significant loss in value. Aprivate firm with significant holdings of cash and marketable securities should have alower illiquidity discount than one with factories or other assets for which there arerelatively few buyers.
2. Financial Health and Cash flows of the firm: A private firm that is financially healthyshould be easier to sell than one that is not healthy. In particular, a firm with strongearnings and positive cash flows should be subject to a smaller illiquidity discount thanone with losses and negative cash flows.
3. Possibility of going public in the future: The greater the likelihood that a private firm cango public in the future, the lower should be the illiquidity discount attached to its value.In effect, the probability of going public is built into the valuation of the private firm.
4. Size of the Firm: If we state the illiquidity discount as a percent of the value of the firm, itshould become smaller as the size of the firm increases.
5. Control Component: Investing in a private firm is decidedly more attractive when youacquire a controlling stake with your investment. A reasonable argument can be madethat a 51% stake in a private business should be more liquid than a 49% stake in thesame business.
Aswath Damodaran 29
Illiquidity Discounts and Type of Business
Rank the following assets (or private businesses) in terms of the liquiditydiscount you would apply to your valuation (from biggest discount tosmallest)
A New York City Cab Medallion A small privately owned five-and-dime store in your town A large privately owned conglomerate, with significant cash balances and real
estate holdings. A large privately owned ski resort that is losing money
Aswath Damodaran 30
Illiquidity DiscountFirm-specific discounts
Intuitively, it seems reasonable that illiquidity discounts should be differentfor different firms and assets.
In practice, there are three ways in which we can adjust discounts for differentbusinesses.
• Look at differences in discounts across companies that make restricted stock issuesor private placements
• Estimate a synthetic bid-ask spread for a private busiiness using data from publiclytraded stocks
• Estimate a discount based upon an option pricing model
Aswath Damodaran 31
1. Exploiting Cross Sectional Differences : Restricted Stock
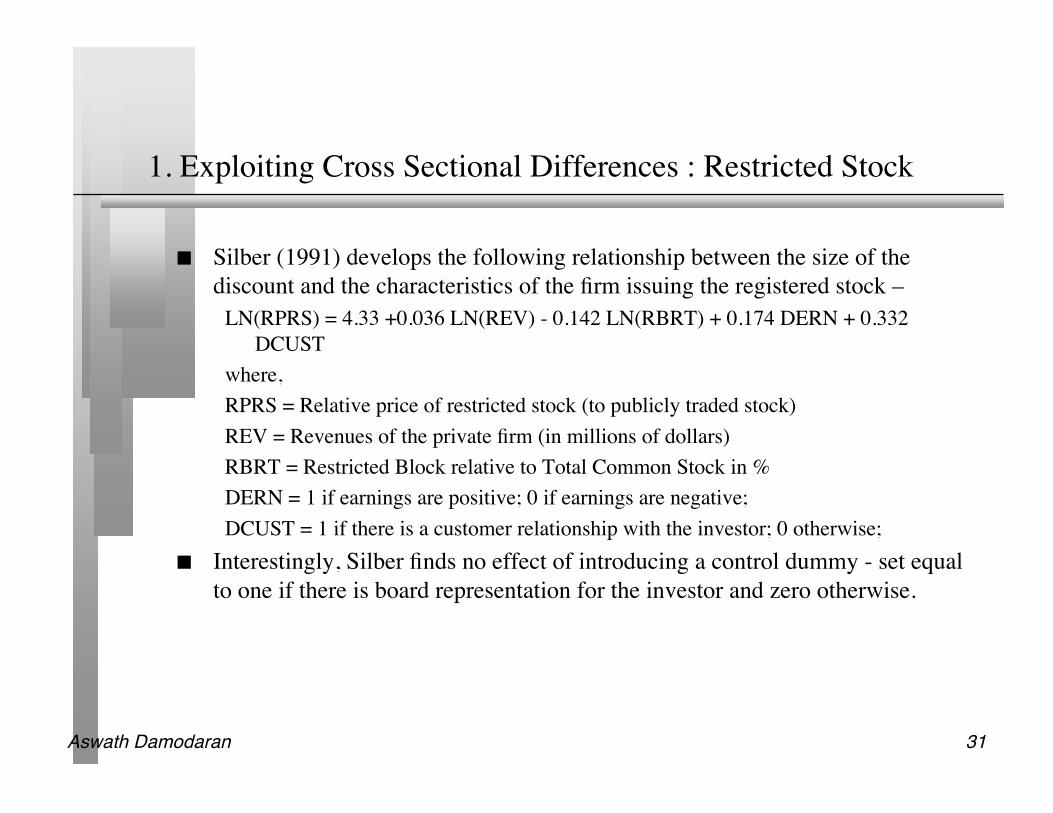
Silber (1991) develops the following relationship between the size of thediscount and the characteristics of the firm issuing the registered stock –
LN(RPRS) = 4.33 +0.036 LN(REV) - 0.142 LN(RBRT) + 0.174 DERN + 0.332DCUST
where,RPRS = Relative price of restricted stock (to publicly traded stock)REV = Revenues of the private firm (in millions of dollars)RBRT = Restricted Block relative to Total Common Stock in %DERN = 1 if earnings are positive; 0 if earnings are negative;DCUST = 1 if there is a customer relationship with the investor; 0 otherwise;
Interestingly, Silber finds no effect of introducing a control dummy - set equalto one if there is board representation for the investor and zero otherwise.

Aswath Damodaran 32
Adjusting the average illiquidity discount for firmcharacteristics - Silber Regression
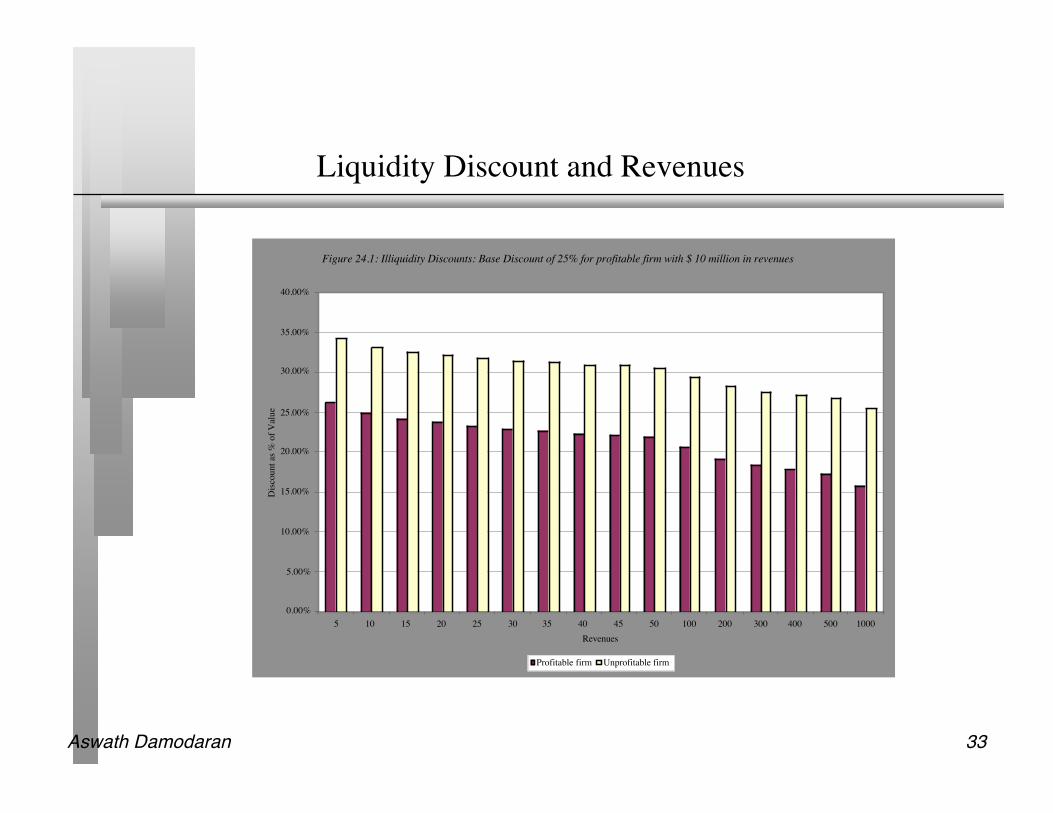
The Silber regression does provide us with a sense of how different thediscount will be for a firm with small revenues versus one with large revenues.
Consider, for example, two profitable firms that are equal in every respectexcept for revenues. Assume that the first firm has revenues of 10 million andthe second firm has revenues of 100 million. The Silber regression predictsilliquidity discounts of the following:
• For firm with 100 million in revenues: 44.5%• For firm with 10 million in revenues: 48.9%• Difference in illiquidity discounts: 4.4%
If your base discount for a firm with 10 million in revenues is 25%, theilliquidity discount for a firm with 100 million in revenues would be 20.6%.
Aswath Damodaran 33
Liquidity Discount and Revenues
Figure 24.1: Illiquidity Discounts: Base Discount of 25% for profitable firm with $ 10 million in revenues
0.00%
5.00%
10.00%
15.00%
20.00%
25.00%
30.00%
35.00%
40.00%
5 10 15 20 25 30 35 40 45 50 100 200 300 400 500 1000
Revenues
Dis
count
as %
of
Val
ue
Profitable firm Unprofitable firm
Aswath Damodaran 34
Application to a private firm: Kristin Kandy
Kristin Kandy is a profitable firm with $ 3 million in revenues. We computed the Silber regression discount using a base discount of 15% for
a healthy firm with $ 10 million in revenues. The difference in illiquidity discount for a firm with $ 10 million in revenues
and a firm with a firm with $ 3 million in revenues in the Silber regression is2.17%.
Adding this on to the base discount of 15% yields a total discount of 17.17%.
Aswath Damodaran 35
2. An Alternate Approach to the Illiquidity Discount: BidAsk Spread
As we noted earlier, the bid-ask spread is one very important component of thetrading cost on a publicly traded asset. It can be loosely considered to be theilliquidity discount on a publicly traded stock.
Studies have tied the bid-ask spread to• the size of the firm• the trading volume on the stock• the degree
Regressing the bid-ask spread against variables that can be measured for aprivate firm (such as revenues, cash flow generating capacity, type of assets,variance in operating income) and are also available for publicly traded firmsoffers promise.
Aswath Damodaran 36
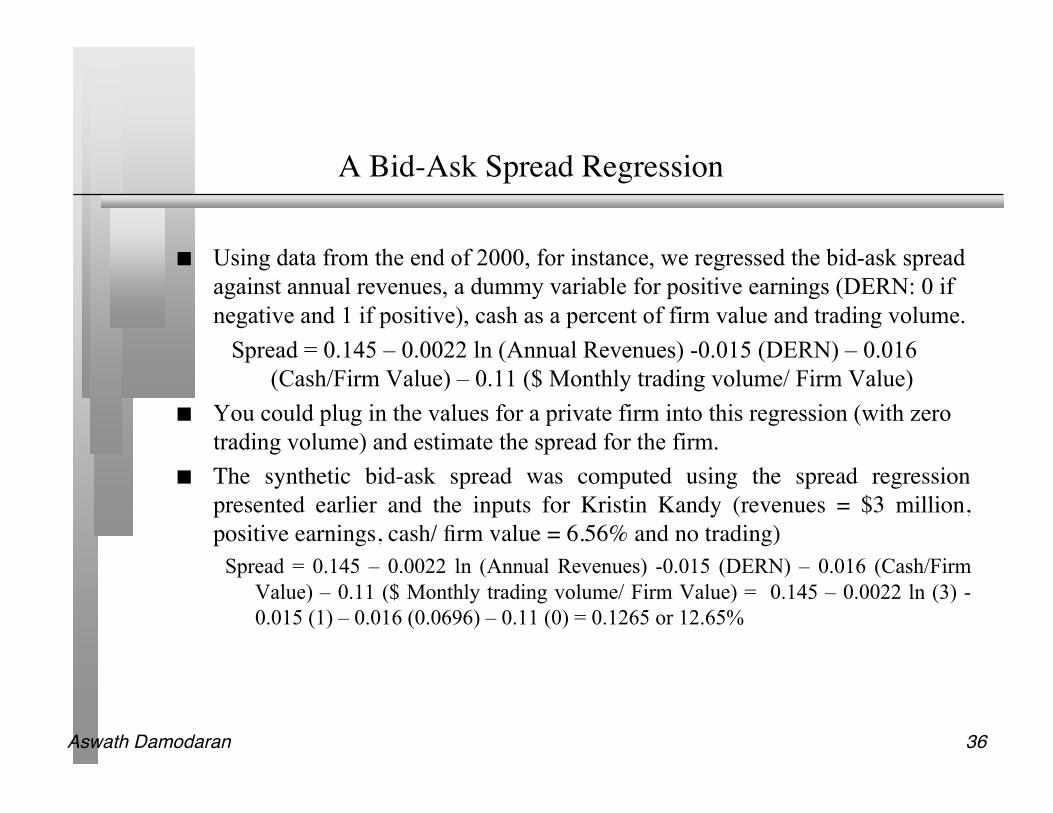
A Bid-Ask Spread Regression
Using data from the end of 2000, for instance, we regressed the bid-ask spreadagainst annual revenues, a dummy variable for positive earnings (DERN: 0 ifnegative and 1 if positive), cash as a percent of firm value and trading volume.
Spread = 0.145 – 0.0022 ln (Annual Revenues) -0.015 (DERN) – 0.016(Cash/Firm Value) – 0.11 ($ Monthly trading volume/ Firm Value)
You could plug in the values for a private firm into this regression (with zerotrading volume) and estimate the spread for the firm.
The synthetic bid-ask spread was computed using the spread regressionpresented earlier and the inputs for Kristin Kandy (revenues = $3 million,positive earnings, cash/ firm value = 6.56% and no trading)
Spread = 0.145 – 0.0022 ln (Annual Revenues) -0.015 (DERN) – 0.016 (Cash/FirmValue) – 0.11 ($ Monthly trading volume/ Firm Value) = 0.145 – 0.0022 ln (3) -0.015 (1) – 0.016 (0.0696) – 0.11 (0) = 0.1265 or 12.65%
Aswath Damodaran 37
3. Option Based Discount
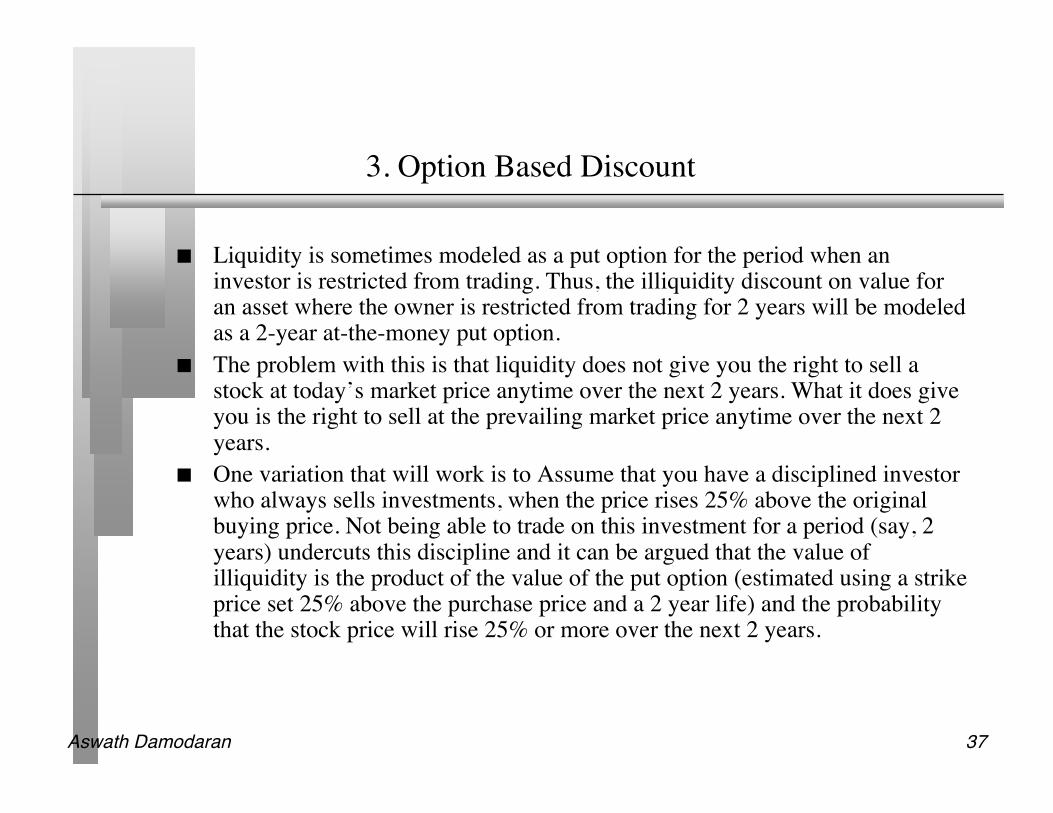
Liquidity is sometimes modeled as a put option for the period when aninvestor is restricted from trading. Thus, the illiquidity discount on value foran asset where the owner is restricted from trading for 2 years will be modeledas a 2-year at-the-money put option.
The problem with this is that liquidity does not give you the right to sell astock at today’s market price anytime over the next 2 years. What it does giveyou is the right to sell at the prevailing market price anytime over the next 2years.
One variation that will work is to Assume that you have a disciplined investorwho always sells investments, when the price rises 25% above the originalbuying price. Not being able to trade on this investment for a period (say, 2years) undercuts this discipline and it can be argued that the value ofilliquidity is the product of the value of the put option (estimated using a strikeprice set 25% above the purchase price and a 2 year life) and the probabilitythat the stock price will rise 25% or more over the next 2 years.
Aswath Damodaran 38
An option based discount for Kristin Kandy
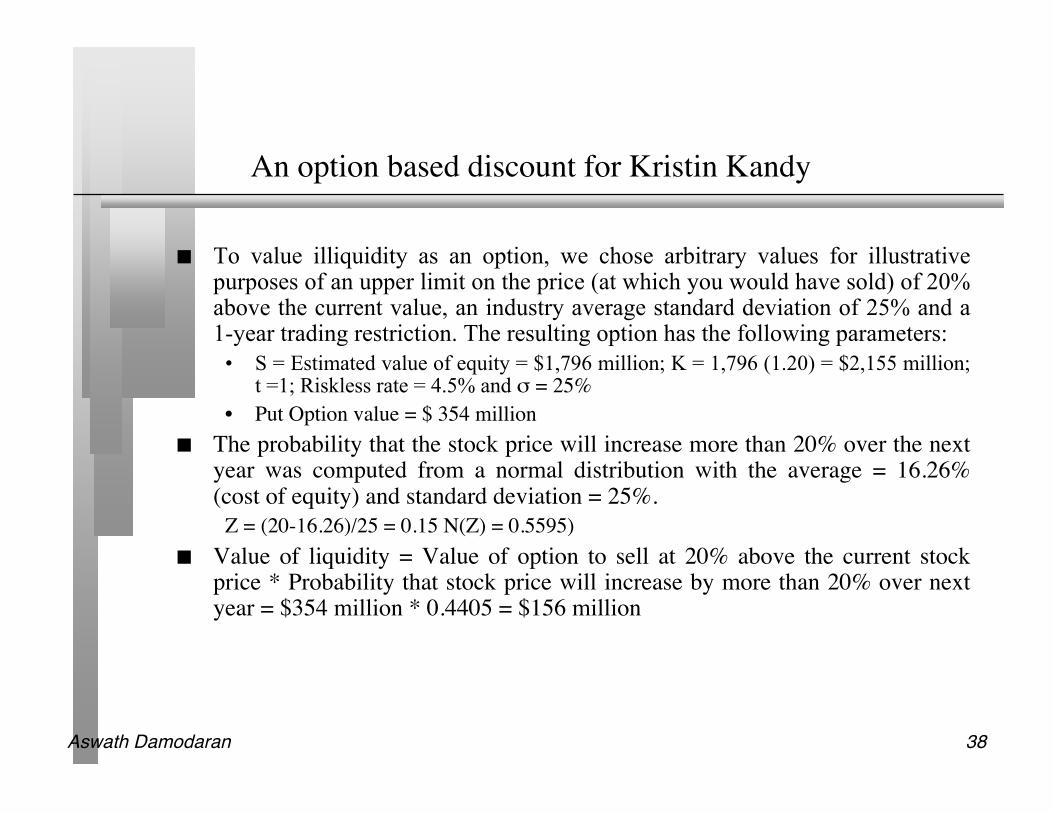
To value illiquidity as an option, we chose arbitrary values for illustrativepurposes of an upper limit on the price (at which you would have sold) of 20%above the current value, an industry average standard deviation of 25% and a1-year trading restriction. The resulting option has the following parameters:
• S = Estimated value of equity = $1,796 million; K = 1,796 (1.20) = $2,155 million;t =1; Riskless rate = 4.5% and σ = 25%
• Put Option value = $ 354 million The probability that the stock price will increase more than 20% over the next
year was computed from a normal distribution with the average = 16.26%(cost of equity) and standard deviation = 25%.
Z = (20-16.26)/25 = 0.15 N(Z) = 0.5595) Value of liquidity = Value of option to sell at 20% above the current stock
price * Probability that stock price will increase by more than 20% over nextyear = $354 million * 0.4405 = $156 million
Aswath Damodaran 39
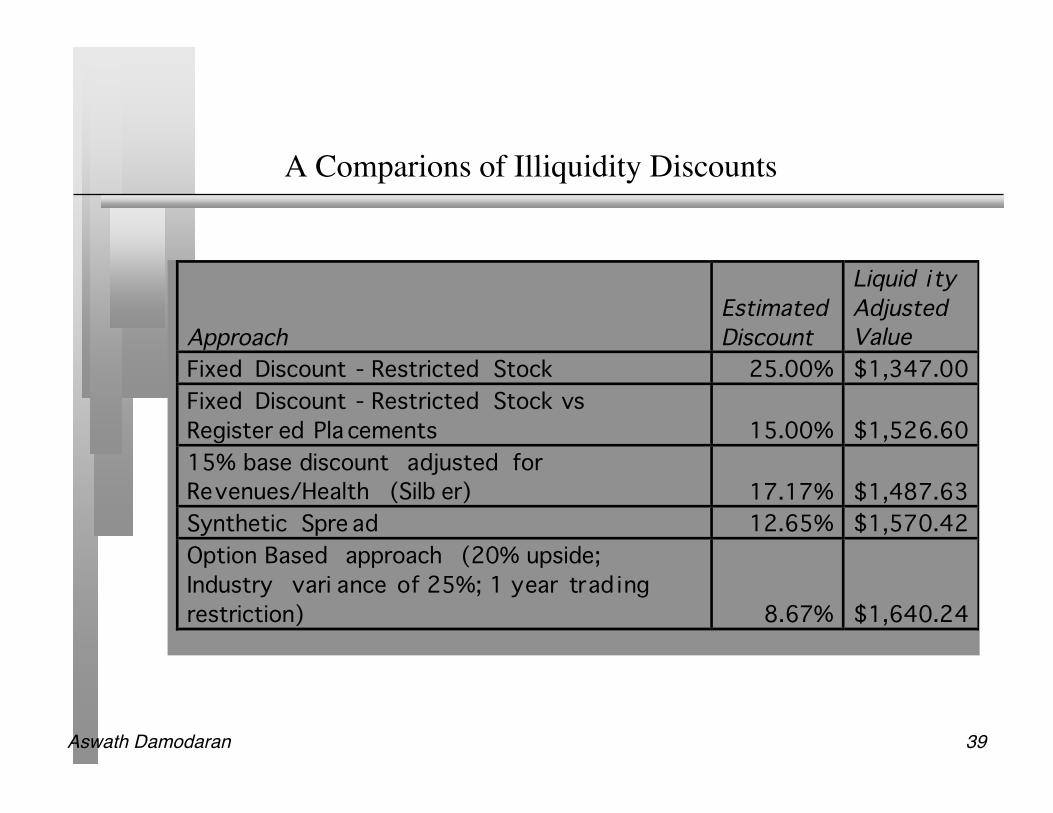
A Comparions of Illiquidity Discounts
Approach
Estimated Discount
Liquid i ty Adjusted Value
Fixed Discount - Restricted Stock 25.00% $1,347.00
Fixed Discount - Restricted Stock vs
Register ed Pla cements 15.00% $1,526.60
15% base discount adjusted for Revenues/Health (Silb er) 17.17% $1,487.63
Synthetic Spre ad 12.65% $1,570.42
Option Based approach (20% upside;
Industry vari ance of 25%; 1 year trad ing
restriction) 8.67% $1,640.24
Aswath Damodaran 40
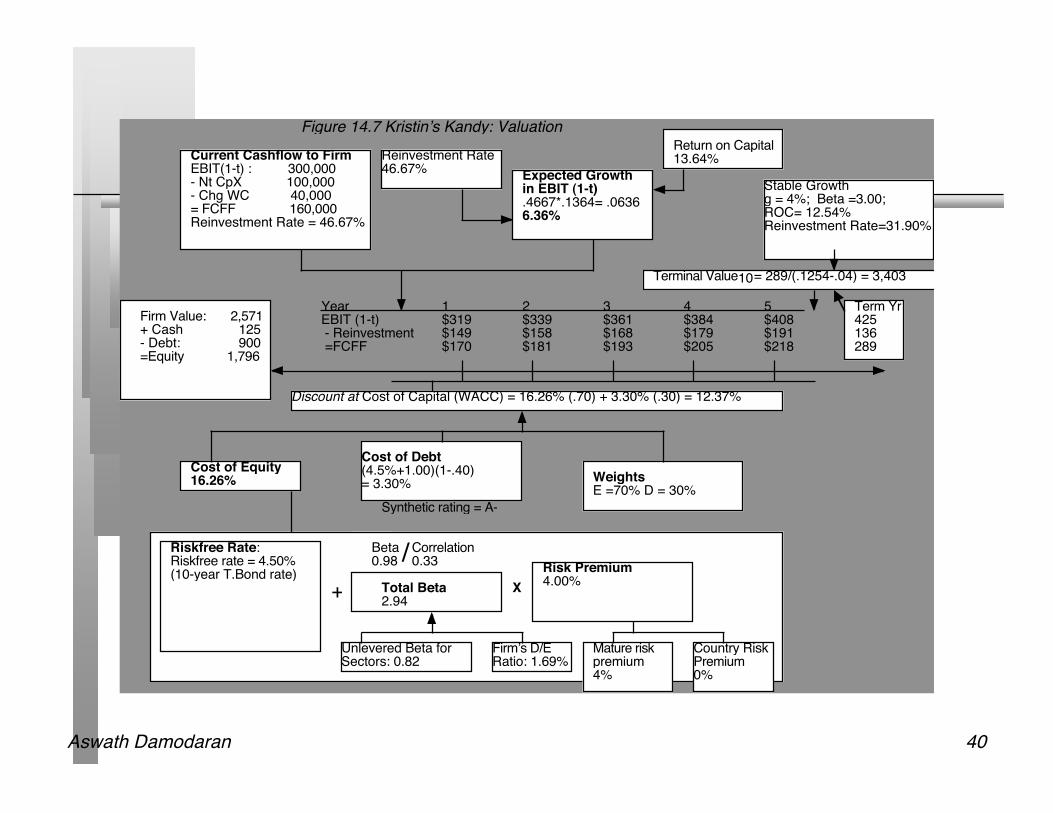
Current Cashflow to FirmEBIT(1-t) : 300,000- Nt CpX 100,000- Chg WC 40,000= FCFF 160,000Reinvestment Rate = 46.67%
Expected Growth in EBIT (1-t).4667*.1364= .06366.36%
Stable Growthg = 4%; Beta =3.00; ROC= 12.54%Reinvestment Rate=31.90%
Terminal Value10= 289/(.1254-.04) = 3,403
Cost of Equity16.26%
Cost of Debt(4.5%+1.00)(1-.40)= 3.30%
WeightsE =70% D = 30%
Discount at Cost of Capital (WACC) = 16.26% (.70) + 3.30% (.30) = 12.37%
Firm Value: 2,571+ Cash 125- Debt: 900=Equity 1,796
Riskfree Rate:Riskfree rate = 4.50%(10-year T.Bond rate)
+ Total Beta 2.94
X
Risk Premium4.00%
Unlevered Beta for Sectors: 0.82
Firm!s D/ERatio: 1.69%
Mature riskpremium4%
Country RiskPremium0%
Figure 14.7 Kristin!s Kandy: Valuation
Reinvestment Rate46.67%
Return on Capital13.64%
Term Yr425136289
Synthetic rating = A-
Year 1 2 3 4 5EBIT (1-t) $319 $339 $361 $384 $408 - Reinvestment $149 $158 $168 $179 $191 =FCFF $170 $181 $193 $205 $218
Correlation0.33/Beta
0.98
Aswath Damodaran 41
b. Illiquidity Adjustments to the Discount Rate
1. Add a constant illiquidity premium to the discount rate for all illlquid assets to reflectthe higher returns earned historically by less liquid (but still traded) investments, relativeto the rest of the market.
• Practitioners attribute all or a significant portion of the small stock premium of 3-4% reportedby Ibbotson Associates to illiquidity and add it on as an illiquidity premium. Note, though, thateven the smallest stocks listed in their sample are several magnitudes larger than the typicalprivate company and perhaps more liquid.
• An alternative estimate of the premium emerges from studies that look at venture capitalreturns over long period. Using data from 1984-2004, Venture Economics, estimated that thereturns to venture capital investors have been about 4% higher than the returns on tradedstocks. We could attribute this difference to illiquidity and add it on as the “illiquiditypremium” for all private companies.
2. Add a firm-specific illiquidity premium, reflecting the illiquidity of the asset beingvalued: For liquidity premiums that vary across companies, we have to estimate ameasure of how exposed companies are to liquidity risk. In other words, we needliquidity betas or their equivalent for individual companies.
3. Relate the observed illiquidity premium on traded assets to specific characteristics ofthose assets. Thus healthier firms with more liquid holdings should have a smallerliquidity premium added on to the discount rate than distressed firms with non-marketable assets.
Aswath Damodaran 42
Illiquidity Discount Rate adjustments for Kristin Kandy
Adding an illiquidity premium of 4% (based upon the premium earned acrossall venture capital investments) to the cost of equity yields a cost of equity of20.26% and a cost of capital of 15.17%. Using this higher cost of capitallowers the value of equity in the firm to $1.531 million, about 15.78% lowerthan the original estimated.
Allowing for the fact that Kristin Kandy is an established business that isprofitable would allow us to lower the illiquidity premium to 2% (based uponlate stage venture capital investments). This will lower the cost of equity to18.26%, the cost of capital to 13.77% and result in a value of equity of $1.658million. The resulting illiquidity discount is 7.66%.
Aswath Damodaran 43
c. Relative Valuation adjustment to value
You can value an illiquid company by finding out the market prices of othercompanies that were similarly illiquid.
There are two variations that can be used• Use data on private company transactions to estimate the multiple of earnings, book
value or revenues that this company should trade for• Use data on publicly traded firms and adjust the resulting multiple for illiquidity of
a private business
Aswath Damodaran 44
Private Company Transactions Approach: Requirements forSuccess
There are a number of private businesses that are similar in their fundamentalcharacteristics (growth, risk and cashflows) to the private business beingvalued.
There are a large enough number of transactions involving these privatebusinesses (assets) and information on transactions prices is widely available.
The transactions prices can be related to some fundamental measure ofcompany performance (like earnings, book value and sales) and thesemeasures are computed with uniformity across the different companies.
Other information encapsulating the risk and growth characteristics of thebusinesses that were bought is also easily available.
Aswath Damodaran 45
Publicly Traded Company Approach: Variations
Use an illiquidity discount, estimated using the same approaches describedearlier, to adjust the multiple: For instance, an analyst who believes that afixed illiquidity discount of 25% is appropriate for all private businesseswould then reduce the public multiple by 25% for private company valuations.An analyst who believes that multiples should be different for different firmswould adjust the discount to reflect the firm’s size and financial health andapply this discount to public multiples.
Instead of estimating a mean or median multiples for publicly traded firms,relate the multiples of these firms to the fundamentals of the firms (includingsize, growth, risk and a measure of illiquidity). The resulting regression canthen be used to estimate the multiple for a private business.
Aswath Damodaran 46
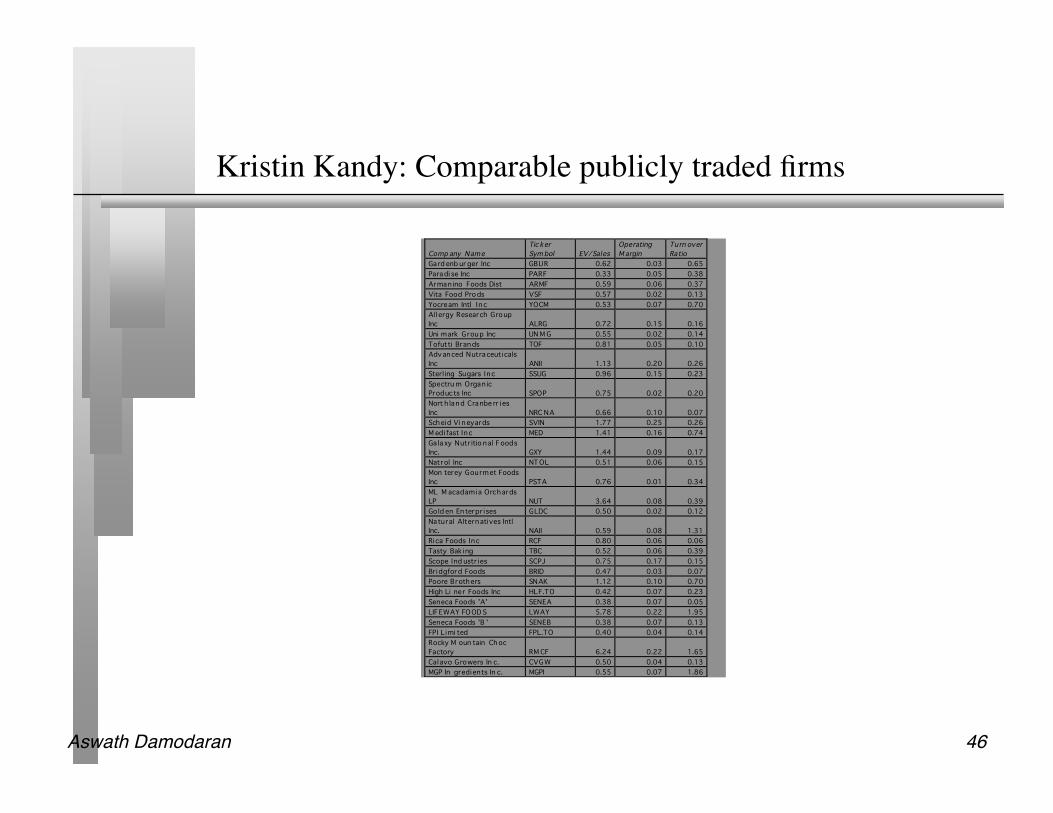
Kristin Kandy: Comparable publicly traded firms
Comp any Name
Tic ker
Sym bol EV/Sales
Operating
M argin
Turn over
Ratio
Gard enb ur ger Inc GBUR 0.62 0.03 0.65
Paradi se Inc PARF 0.33 0.05 0.38
Arman ino Foods Dist ARMF 0.59 0.06 0.37
Vita Food Prods VSF 0.57 0.02 0.13
Yocream Intl In c YOCM 0.53 0.07 0.70
Al lergy Research Group
Inc ALRG 0.72 0.15 0.16
Uni mark Group Inc UN M G 0.55 0.02 0.14
Tofutti Brands TOF 0.81 0.05 0.10
Advanced Nutraceuticals
Inc ANII 1.13 0.20 0.26
Sterl ing Sugars Inc SSUG 0.96 0.15 0.23
Spectru m Organ ic
Products Inc SPOP 0.75 0.02 0.20
Nort h land Cranbe rr ies
Inc NRC NA 0.66 0.10 0.07
Scheid Vi neyards SVIN 1.77 0.25 0.26
M edifast Inc MED 1.41 0.16 0.74
Galaxy Nutr itio nal F oods
Inc. GXY 1.44 0.09 0.17
Natrol Inc NT OL 0.51 0.06 0.15
Mon terey Gourmet Foods
Inc PSTA 0.76 0.01 0.34
ML M acadamia Orchards
LP NUT 3.64 0.08 0.39
Gold en Enterpr ises GLDC 0.50 0.02 0.12
Natural Alternatives Intl
Inc. NAII 0.59 0.08 1.31
Ri ca Foods Inc RCF 0.80 0.06 0.06
Tasty Bak ing TBC 0.52 0.06 0.39
Scope Ind ustr ies SCPJ 0.75 0.17 0.15
Bridgford Foods BRID 0.47 0.03 0.07
Poore Brothers SNAK 1.12 0.10 0.70
High Li ner Foods Inc HLF.TO 0.42 0.07 0.23
Seneca Foods 'A' SENEA 0.38 0.07 0.05
LIFEWAY FOOD S LWAY 5.78 0.22 1.95
Seneca Foods 'B ' SENEB 0.38 0.07 0.13
FPI L imi ted FPL.TO 0.40 0.04 0.14
Rocky M oun tain Ch oc
Factory RM CF 6.24 0.22 1.65
Calavo Growers In c. CVGW 0.50 0.04 0.13
MGP In gredients In c. MGPI 0.55 0.07 1.86
Aswath Damodaran 47
Estimating Kristin Kandy’s value
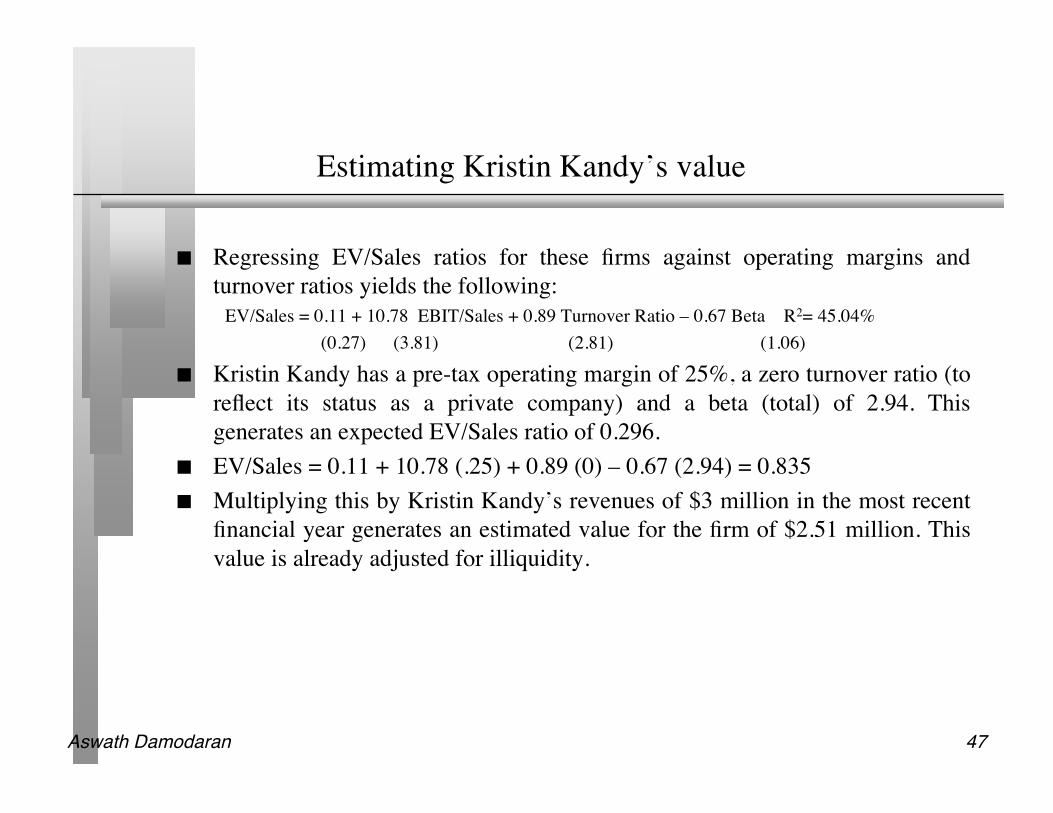
Regressing EV/Sales ratios for these firms against operating margins andturnover ratios yields the following:
EV/Sales = 0.11 + 10.78 EBIT/Sales + 0.89 Turnover Ratio – 0.67 Beta R2= 45.04%(0.27) (3.81) (2.81) (1.06)
Kristin Kandy has a pre-tax operating margin of 25%, a zero turnover ratio (toreflect its status as a private company) and a beta (total) of 2.94. Thisgenerates an expected EV/Sales ratio of 0.296.
EV/Sales = 0.11 + 10.78 (.25) + 0.89 (0) – 0.67 (2.94) = 0.835 Multiplying this by Kristin Kandy’s revenues of $3 million in the most recent
financial year generates an estimated value for the firm of $2.51 million. Thisvalue is already adjusted for illiquidity.
Aswath Damodaran 48
Conclusion
All assets are illiquid, but there are differences in the degree of illiquidity. Illiquidity matters to investors. They pay lower prices and demand higher
returns from less liquid assets than from otherwise similar more liquid assets The effect of illiquidity on value can be estimated in one of three ways
• The value of the asset can be computed as if it were liquid, and then adjusted forilliquidity at the end (as a discount)
• The discount rate used for illiquid assets can be set higher than that used for liquidassets
• The illiquidity effect can be built into value by looking at how similar illiquidcompanies have been priced in transactions or by adjusting publicly tradedcompany multiples for illiquidity