cost of illness study of anxiety disorders for the
TRANSCRIPT

University of Tennessee Health Science Center University of Tennessee Health Science Center
UTHSC Digital Commons UTHSC Digital Commons
Theses and Dissertations (ETD) College of Graduate Health Sciences
12-2013
Cost of Illness Study of Anxiety Disorders for the Ambulatory Cost of Illness Study of Anxiety Disorders for the Ambulatory
Adult Population of the United States Adult Population of the United States
Elaheh Shirneshan University of Tennessee Health Science Center
Follow this and additional works at: https://dc.uthsc.edu/dissertations
Part of the Health and Medical Administration Commons
Recommended Citation Recommended Citation Shirneshan, Elaheh , "Cost of Illness Study of Anxiety Disorders for the Ambulatory Adult Population of the United States" (2013). Theses and Dissertations (ETD). Paper 370. http://dx.doi.org/10.21007/etd.cghs.2013.0289.
This Dissertation is brought to you for free and open access by the College of Graduate Health Sciences at UTHSC Digital Commons. It has been accepted for inclusion in Theses and Dissertations (ETD) by an authorized administrator of UTHSC Digital Commons. For more information, please contact [email protected].

Cost of Illness Study of Anxiety Disorders for the Ambulatory Adult Population of Cost of Illness Study of Anxiety Disorders for the Ambulatory Adult Population of the United States the United States
Abstract Abstract Background:Background: Anxiety disorders are the most common psychiatric illness in the United States. However, economic burdens of this category of mental illnesses have not been well studied yet. The objective of this study was to estimate the societal cost of anxiety disorders for the ambulatory adult population of the U.S.
Data and Method:Data and Method: Data was collected from the 2009 and 2010 Medical Expenditure Panel Survey (MEPS), Bureau of Labor Statistics (BLS), and National Vital Statistics System (NVSS). Cost components included in the analyses were direct medical costs (i.e. cost for inpatient visits, outpatient visits, emergency room visits, office-based visits, prescription medications, and other services), and indirect cost (i.e. morbidity and mortality costs). Anxiety patients were identified using MEPS data. More specifically, individuals 18 years and older, who reported a diagnosis of, or had a medical event associated with anxiety disorder(s), were classified as anxiety population. Number of suicides due to anxiety disorders was estimated using the NVSS data. Direct medical costs attributable to anxiety disorders were estimated as the expenditures incurred by anxiety patients in excess of those incurred by anxiety-free population. Several multivariate regression analyses, using generalized linear models, were conducted to calculate the overall incremental direct medical costs associated with anxiety disorders, as well as cost by healthcare delivery setting, and cost for different sub-populations. Indirect costs were estimated using the Human Capital Approach (HCA). Morbidity cost was estimated by valuing the time period in which individuals had to stay in bed due to anxiety disorders. Mortality cost was estimated as the productivity loss from age at death to life expectancy.
Results:Results: Among adult participants in 2009-2010 MEPS, 30.35 million (8.74%) reported being diagnosed with anxiety disorder(s). It was also estimated that in 2010, 3,497 suicides were due to anxiety disorders. The annual overall direct medical costs associated with anxiety disorders was estimated at $1657.52 per person (SE: $238.83; p <0.001), or $33.71 billion in total. Inpatient visits, prescription medications, and office-based visits together accounted for almost 93% of the overall cost. The increase in direct medical cost due to anxiety disorders was higher among White non-Hispanics ($1879.31) than Black non-Hispanics ($1459.30). For nonHispanics, anxiety was not associated with a statistically significant increase in medical expenditure. Regarding aspects of indirect cost, morbidity and mortality cost were estimated at $12.72 billion and $2.34 billion in 2013 US dollars, respectively. The 2013 societal cost of anxiety disorders was estimated at $48.72 billion.
Conclusion:Conclusion: The current study demonstrates conclusively that anxiety disorders, with the annual cost of $48.72 billion in 2013 US dollars, absorb a significant portion of US healthcare resources and should be prioritized by policymakers and healthcare providers who aim to reduce downstream costs of mental disorders.
Document Type Document Type Dissertation
Degree Name Degree Name Doctor of Philosophy (PhD)
Program Program Health Outcomes and Policy Research

Research Advisor Research Advisor David K. Solomon, Pharm.D.
Keywords Keywords Anxiety Disorders, Medical Expenditure Panel Survey (MEPS), Cost of Illness, Direct Cost, Expenditure, Generalized Linear Model (GLM).
Subject Categories Subject Categories Health and Medical Administration | Medicine and Health Sciences
Comments Comments One year embargo expired in December 2014
This dissertation is available at UTHSC Digital Commons: https://dc.uthsc.edu/dissertations/370

Cost of Illness Study of Anxiety Disorders for the Ambulatory Adult Population of the United States
A Dissertation Presented for
The Graduate Studies Council The University of Tennessee
Health Science Center
In Partial Fulfillment Of the Requirements for the Degree
Doctor of Philosophy From The University of Tennessee
By Elaheh Shirneshan
December 2013

ii
Copyright © 2013 by Elaheh Shirneshan. All rights reserved.

iii
DEDICATION This dissertation is dedicated to my wonderful parents, Fatemeh and Masoud, to whom I owe every bit of my existence, to my beloved husband Ali, who has always believed in me and pushed me to do my best, and to my siblings, Emad and Afrooz, for their unconditional love and support.

iv
ACKNOWLEDGEMENTS First, I would like to thank Dr. Lawrence M. Brown, and Dr. David K. Solomon, my research advisors, for all of their support and guidance. In addition, I would also like to thank my other committee members, Mr. Georg Relyea, Dr. Brandi E. Franklin, and Dr. Jim Bailey. Without their diligence and dedication, this dissertation would not have been possible.

v
ABSTRACT Background: Anxiety disorders are the most common psychiatric illness in the United States. However, economic burdens of this category of mental illnesses have not been well studied yet. The objective of this study was to estimate the societal cost of anxiety disorders for the ambulatory adult population of the U.S. Data and Method: Data was collected from the 2009 and 2010 Medical Expenditure Panel Survey (MEPS), Bureau of Labor Statistics (BLS), and National Vital Statistics System (NVSS). Cost components included in the analyses were direct medical costs (i.e. cost for inpatient visits, outpatient visits, emergency room visits, office-based visits, prescription medications, and other services), and indirect cost (i.e. morbidity and mortality costs). Anxiety patients were identified using MEPS data. More specifically, individuals 18 years and older, who reported a diagnosis of, or had a medical event associated with anxiety disorder(s), were classified as anxiety population. Number of suicides due to anxiety disorders was estimated using the NVSS data. Direct medical costs attributable to anxiety disorders were estimated as the expenditures incurred by anxiety patients in excess of those incurred by anxiety-free population. Several multivariate regression analyses, using generalized linear models, were conducted to calculate the overall incremental direct medical costs associated with anxiety disorders, as well as cost by healthcare delivery setting, and cost for different sub-populations. Indirect costs were estimated using the Human Capital Approach (HCA). Morbidity cost was estimated by valuing the time period in which individuals had to stay in bed due to anxiety disorders. Mortality cost was estimated as the productivity loss from age at death to life expectancy. Results: Among adult participants in 2009-2010 MEPS, 30.35 million (8.74%) reported being diagnosed with anxiety disorder(s). It was also estimated that in 2010, 3,497 suicides were due to anxiety disorders. The annual overall direct medical costs associated with anxiety disorders was estimated at $1657.52 per person (SE: $238.83; p <0.001), or $33.71 billion in total. Inpatient visits, prescription medications, and office-based visits together accounted for almost 93% of the overall cost. The increase in direct medical cost due to anxiety disorders was higher among White non-Hispanics ($1879.31) than Black non-Hispanics ($1459.30). For non-Hispanics, anxiety was not associated with a statistically significant increase in medical expenditure. Regarding aspects of indirect cost, morbidity and mortality cost were estimated at $12.72 billion and $2.34 billion in 2013 US dollars, respectively. The 2013 societal cost of anxiety disorders was estimated at $48.72 billion. Conclusion: The current study demonstrates conclusively that anxiety disorders, with the annual cost of $48.72 billion in 2013 US dollars, absorb a significant portion of US healthcare resources and should be prioritized by policymakers and healthcare providers who aim to reduce downstream costs of mental disorders.

vi
TABLE OF CONTENTS
CHAPTER 1. INTRODUCTION .....................................................................................1
Importance of Conducting a Cost of Illness Study for Anxiety Disorders ......................1 Why a Cost of Illness Analysis? ..................................................................................1 Why Examining Costs by Service Category and for Different Sub-populations? .......2 Why Anxiety Disorders? ..............................................................................................2
The Existing Gap in the Literature ..................................................................................3 Potential Contributions of This Research to the Current Literature ................................4 Specific Aims ...................................................................................................................6
CHAPTER 2. LITERATURE REVIEW .........................................................................7
An Overview of Anxiety Disorders .................................................................................7 Description of Anxiety Disorders ................................................................................7 Acute Stress Disorder ..................................................................................................7 Agoraphobia (with or without a History of Panic Disorder) .......................................8 Generalized Anxiety Disorder (GAD) .........................................................................8 Obsessive-compulsive Disorder (OCD).......................................................................9 Panic Disorder (with or without Agoraphobia) ...........................................................9 Phobias (Including Social Phobia) ...............................................................................9 Post-traumatic Stress Disorder (PTSD) .....................................................................10
Epidemiology of Anxiety Disorders ..............................................................................10 Treatment of Anxiety Disorders ....................................................................................10
Medication .................................................................................................................11 Antidepressants ..................................................................................................... 11 Anti-anxiety drugs ................................................................................................ 12 Betablockers .......................................................................................................... 12
Psychotherapy ............................................................................................................12 Diagnosis Specific Treatment ....................................................................................13
An Overview of Cost of Illness Analysis ......................................................................14 Description of Cost of Illness Analysis......................................................................14
Direct and indirect costs........................................................................................ 14 Perspective ............................................................................................................ 14 Incidence-based versus prevalence-based approach ............................................. 14 Measuring indirect costs ....................................................................................... 15 Top-down or bottom-up approach ........................................................................ 15
History of Cost of Illness Studies ..............................................................................15 Review of Cost of Illness Studies for Anxiety Disorders ..............................................16
Studies in Which the Main Purpose Was to Calculate COI for Anxiety Disorders ..16 COI studies for multiple diagnoses of anxiety disorders ...................................... 16 COI studies for a particular diagnosis of anxiety disorders .................................. 16
Studies in Which Obtaining the COI Was Not the Main Purpose of the Study ........17 Specific Features of the COI Studies for Anxiety Disorders .....................................17
Source of data ....................................................................................................... 17 Top-down or bottom-up approach ........................................................................ 17

vii
Perspective of the study ........................................................................................ 19 Cost categories ...................................................................................................... 19 Incremental cost approach .................................................................................... 19
CHAPTER 3. METHODOLOGY ..................................................................................21
Research Design ............................................................................................................21 Perspective .................................................................................................................21 Approach ....................................................................................................................21 Data ............................................................................................................................21 Sampling ....................................................................................................................22
MEPS sampling plan............................................................................................. 22 Sample size ........................................................................................................... 23 Study sample ......................................................................................................... 24
Data Overview ...............................................................................................................24 MEPS Data Files ........................................................................................................24
Variables used in analyses from MEPS data files ................................................ 25 Summary variables................................................................................................ 25
BLS Data ....................................................................................................................31 NVSS Data .................................................................................................................31
Analysis Technique ........................................................................................................32 SA1: Estimating the Societal Cost of Anxiety Disorders for the U.S. Adult Population ..................................................................................................................32
Overall direct medical cost. .................................................................................. 32 Morbidity cost ....................................................................................................... 35 Mortality cost ........................................................................................................ 37
SA2: Estimating the Incremental Direct Medical Expenditures Associated with Anxiety Disorders by Service Category.....................................................................38 SA3: Estimating the Incremental Direct Medical Expenditures Associated with Anxiety Disorders for Different Sub-populations ......................................................38 General Notes .............................................................................................................39
CHAPTER 4. RESULTS .................................................................................................41
Descriptive Statistics ......................................................................................................41 Prevalence of Self-reported Anxiety Disorders in MEPS ..........................................41 Characteristics of the Study Population .....................................................................41
Direct Medical Costs Attributable to Anxiety Disorders ...............................................46 Preliminary Statistical Analyses ................................................................................46
Checking for multicollinearity .............................................................................. 46 Finding the distribution of cost data ..................................................................... 48
Overall Incremental Direct Medical Expenditure Attributable to Anxiety Disorders ....................................................................................................................52 Incremental Direct Medical Expenditure by Health Delivery Setting (SA2) .............52 Incremental Direct Medical Expenditure for Different Sub-populations (SA3) ........52
Morbidity Cost Associated with Anxiety Disorders ......................................................59 Number of Missed Work Days due to Anxiety Disorders for Employed Individuals ..................................................................................................................59

viii
Checking for multicollinearity .............................................................................. 59 Finding the distribution of missed work days ....................................................... 61
Number of Days Stayed in Bed due to Anxiety Disorders for Unemployed Individuals ..................................................................................................................61 Daily Wage for Employed Individuals ......................................................................64 Average Daily Wage of Household Services for Unemployed Individuals ..............64 Summary of Analyses ................................................................................................64
Mortality Costs Associated with Anxiety Disorders .....................................................64 Number of People Who Committed Suicide due to Anxiety Disorders and Age at Death ..........................................................................................................................66 Life Expectancy at Age of Death by Race/Ethnicity and Gender..............................66 Labor Force Participation Rate and Wage .................................................................69 Summary of Analyses ................................................................................................69
The Societal Cost of Anxiety Disorders for the U.S. Adult Population in 2010 (SA1) ..............................................................................................................................69
CHAPTER 5. DISCUSSION ..........................................................................................72
Direct Medical Costs .....................................................................................................72 General Notes .............................................................................................................72 Overall Direct Medical Cost ......................................................................................73 Cost by Category of Healthcare Services ..................................................................73 Cost for Different Sub-populations ............................................................................74
Indirect Costs .................................................................................................................75 Societal Cost ..................................................................................................................76 Limitations .....................................................................................................................77
LIST OF REFERENCES ................................................................................................79
VITA..................................................................................................................................87

ix
LIST OF TABLES
Table 2-1. Prevalence of anxiety disorders for the U.S. adult population. ....................11
Table 2-2. Data sources used in COI studies of anxiety disorders. ................................18
Table 2-3. Cost categories included in cost of illness studies. .......................................20
Table 3-1. Data sources for calculation of each cost component. ..................................22
Table 3-2. List of variables in MEPS data files used in the current study. ....................26
Table 3-3. List of categorical variables. .........................................................................29
Table 3-4. Outcome variables and the initial set of covariates for estimating the incremental number of missed work days/ bed days due to anxiety disorders. ......................................................................................................36
Table 3-5. Sub-populations along with model specifications. .......................................40
Table 4-1. Comparison of demographic characteristics between adults with and without anxiety disorders. ............................................................................42
Table 4-2. Comparison of CCI clinical conditions between anxiety and non-anxiety patients. ........................................................................................................45
Table 4-3. Results of regression analysis to check for multicollinearity. ......................47
Table 4-4. Results of the Breusch-Pagan/Cook-Weisberg test for heteroskedasticity. ..51
Table 4-5. Results of Park test........................................................................................51
Table 4-6. Comparison of Poisson and Gamma variance functions. .............................51
Table 4-7. Results of regression analysis to estimate the overall incremental direct medical expenditure associated with anxiety disorders. ..............................53
Table 4-8. Results of regression analyses to estimate the incremental expenditures of anxiety disorders by service category. .....................................................54
Table 4-9. Incremental direct medical expenditures associated with anxiety disorders for different sub-populations. .......................................................56
Table 4-10. Breaking down the cost of anxiety disorders among different race/ethnicities by gender, age, and geographic region. ..............................58
Table 4-11. Results of multicollinearity analysis for modeling the number of missed work days. ....................................................................................................60

x
Table 4-12. Results of the Breusch-Pagan/Cook-Weisberg test for heteroskedasticity. ..63
Table 4-13. Results of Park test........................................................................................63
Table 4-14. Incremental number of missed work days due to anxiety disorders. ............63
Table 4-15. Incremental number of bed days due to anxiety disorders. ..........................63
Table 4-16. Average daily wage for unemployed individuals based on BLS data. .........65
Table 4-17. Summary of results: Morbidity cost. ............................................................65
Table 4-18. Number of suicides in 2010 by age, gender, and race/ethnicity. ..................67
Table 4-19. Life expectancy at selected ages by race, Hispanic origin, race for non-Hispanic population, and sex: United States, 2010. .....................................68
Table 4-20. Labor force participation rate by age, gender, and race/ethnicity. ................70
Table 4-21. Median usual weekly earnings in current dollar from current population survey for 2010. ...........................................................................................70
Table 4-22. Mortality cost: Summary of results...............................................................71
Table 4-23. The societal cost of anxiety disorders for the U.S. adult population in 2010. .............................................................................................................71

xi
LIST OF FIGURES
Figure 3-1. Overlapping design of MEPS sample. ..........................................................23
Figure 4-1. Distribution of the overall healthcare cost for the study population. ............49
Figure 4-2. Distribution of the log-transformed overall healthcare cost for the study population. ....................................................................................................50
Figure 4-3. Distribution of the number of missed work days for employed individuals. ...................................................................................................62
Figure 5-1. Percentage of each cost component from the societal cost. ..........................77

xii
LIST OF ABBREVIATIONS ACA Affordable Care Act AHRQ Agency for Healthcare Research and Quality BLS Bureau of Labor Statistics CBT Cognitive Behavioral Therapy CC Clinical Classification CCI Charlson Comorbidity Index CI Confidence Interval CMS Centers for Medicare & Medicaid Services COI Cost of Illness CPI Consumer Price Index DSM IV-TR Diagnostic and Statistical Manual of Mental Disorders, fourth
edition, text revision GAD Generalized Anxiety Disorder GDP Gross Domestic Product GED Graduate Equivalency Degree GLM Generalized Linear Model HMO Health Maintenance Organization ICD-9 International Classification of Diseases, Ninth Revision LFPR Labor Force Participation Rate MEPS Medical Expenditure Panel Survey MEPS-HC Medical Expenditure Panel Survey -Household Component MOI Monoamine Oxidase Inhibitor

xiii
MSA Metropolitan Statistical Area NCHS National Center for Health Statistics NCS-R National Comorbidity Survey Replication NIMH National Institute of Mental Health NVSS National Vital Statistics System cost of illness (COI) OCD Obsessive Compulsive Disorder OECD Organization for Economic Cooperation and Development OLS Ordinary Least Square PHS Perceived Health Status PTSD Post-traumatic Stress Disorder SA Specific Aim SE Standard Error SSRI Selective Serotonin Reuptake Inhibitor VIF Variance Inflation Factor
1
CHAPTER 1. INTRODUCTION
Data on the economic burden of anxiety disorders are limited. But this category of mental illnesses is known to be the most prevalent, and one of the most expensive psychiatric disorders in the U.S. The current study intends to answer the following research question: What are the economic burdens of anxiety disorders to the ambulatory adult population of the U.S.? The following sections describe the importance of conducting a cost of illness study for anxiety disorders, the existing gap in the relevant literature, the potential contributions of this research to the current literature, and detailed explanation of specific aims of the study.
Importance of Conducting a Cost of Illness Study for Anxiety Disorders Why a Cost of Illness Analysis? According to Centers for Medicare & Medicaid Services (CMS) “U.S. health care spending reached $2.7 trillion in 2011, or $8,680 per person.”1(p. 2) There has been a growing rate of 3.9 percent in health spending since 2009. Also from 2009 to 2011, health spending was 17.9 percent of Gross Domestic Product (GDP). In comparison with other countries in the Organization for Economic Cooperation and Development (OECD), the United States has the highest health spending in terms of share of GDP. In fact, “Americans spent more than twice as much as relatively rich European countries such as France, Sweden and the United Kingdom.”2(p. 1) CMS has projected for this share to rise to 20 percent of GDP by 2020. There is no simple and straightforward solution for controlling this high and ever-increasing rate of spending on healthcare in the United States; but, identifying the most expensive medical conditions and trying to alleviate their economic burden, through disease management interventions, is definitely a required step to be undertaken in this way. According to Joel & Segel, “Cost-of-illness studies measure the economic burden of a disease or diseases and estimate the maximum amount that could potentially be saved or gained if a disease were to be eradicated.”3(p. 2) In developing cost-containment policies and interventions, cost of illness (COI) analysis enables policymakers to identify diseases which need to be addressed with the highest priority. No one can argue that healthcare resources, like many other forms of resource, are scarce; and the more resources absorbed by heath sector, the less will be left for other sectors such as education, defense, etc. A cost of illness study is not enough to set priorities for the objective of resource allocation (for that purpose, one needs effectiveness data as well as cost data). However, it is a main component of any cost-effectiveness or cost-utility analysis. Nowadays, cost of illness studies are being widely

2
used by health economists, pharmaceutical companies, clinicians, and policymakers to set research agendas and allocate resources.4,5 Why Examining Costs by Service Category and for Different Sub-populations? Even though cost of illness analysis is a crucial primary step in identifying costly medical conditions, further information is needed if effectively reducing the burden of these conditions is desired. To reduce the burden of illness, just knowing the dollar amount in terms of cost of illness is not enough. In fact, one also needs to know the distribution of costs among different health sectors (inpatient, outpatient, emergency room, prescription medication …) and subpopulations (based on gender, race, age …) to find out if resources are being distributed disproportionally. Knowing which subpopulations or health sectors incur higher costs, policymakers can come up with tailored disease management interventions to address high costs specifically in those sub-populations/health sectors. Healthcare costs are not distributed proportionally among different sub-populations. According to the Medical Expenditure Panel Survey (MEPS), in 2010, individuals with some college degree had the highest total healthcare expenditure in comparison with those in other educational levels. The same can be said for Whites, females, and married individuals. So having the estimation of cost of illness for the whole population (who suffer from that disease), one also needs to know how this burden is distributed among different groups of people. In the same manner, distribution of cost among different service categories will yield useful information as to which category of health services may benefit the most from disease management programs. Why Anxiety Disorders? Costly medical conditions can be amongst the underlying causes of skyrocketing healthcare expenditures in the U.S. In this regard, it is good to know that one group of these expensive medical conditions are anxiety disorders. Anxiety is a natural response and a necessary warning adaptation in humans. Everybody has experienced anxiety in the form of increased heart rate and tensed muscles. However, anxiety can become a pathologic disorder when it is excessive and uncontrollable; In other words, when it occurs without any recognizable reason or when the reason does not warrant such a reaction. If no medical condition accounts for symptoms, they are attributed to anxiety disorders.6 According to the Diagnostic and Statistical Manual of Mental Disorders, fourth edition, text revision (DSM IV-TR),7 anxiety disorders categorize a large number of disorders including acute stress disorder, post-traumatic stress disorder (PTSD), phobias (including social phobia), agoraphobia (with or without a history of panic disorder), panic disorder (with or without agoraphobia), generalized anxiety disorder (GAD), obsessive-compulsive disorder (OCD), and anxiety disorders due to known physical causes (these

3
include general medical conditions or substance abuse). The primary feature of these disorders is abnormal or inappropriate anxiety. These disorders usually interfere with a patient’s work, schooling, and family life so that in severe cases, they can adversely affect their function. For instance, anxiety disorders can be an underlying cause of alcohol and substance abuse. Fortunately, anxiety disorders are highly treatable, and most people with these conditions can have fulfilling lives if they receive appropriate treatment. In general, anxiety disorders are treated with medication, specific types of psychotherapy, or both. “Treatment choices depend on the problem and the person’s preference. Before treatment begins, a doctor must conduct a careful diagnostic evaluation to determine whether a person’s symptoms are caused by an anxiety disorder or a physical problem.”8(p. 14)
Each year, almost one out of three Americans age 18 years or older (12-month prevalence=26.2%), will experience at least one form of mental disorders (i.e. anxiety disorders, mood disorders, impulse-control disorders, and substance use disorders).9 More than two thirds of these individuals (12-month prevalence=18.1%) suffer from one (or more) form of anxiety disorders (alone or along with another mental condition).9 In other words, anxiety disorders represent the most common psychiatric illnesses in the U.S. The annual societal cost of anxiety disorders in the U.S. in 1990 was estimated to range from US$42 to US$47 billion, nearly approaching the estimates of the cost of depression (from US$44 to US$53 billion) for the same time frame.5,10 With respect to the high prevalence of anxiety disorders in the U.S. and evidence from previous research,5,10 it is expected that this category of mental illnesses imposes a significant economic burden to society. In this regard, a more current and comprehensive evaluation of healthcare expenditures attributable to anxiety disorders is warranted. Such evaluation may guide clinicians and policymakers in developing and improving disease management programs, and provide a basis for conducting cost-effectiveness analysis of new treatment interventions.
The Existing Gap in the Literature In order to have a reliable estimation of the economic burden of a disease to society, there are several factors that must be taken into account:
Both direct and indirect costs should be included in the analysis.
The sample should be representative of the entire population in which results are to be generalized to.
If there is more than one diagnosis for a condition, all possible diagnoses should
be considered.
In estimating the costs, not only the costs directly due to the condition of interest should be included, but also costs due to the comorbidities and complications resulted from that condition should be considered.

4
When using different data sources, the potential inconsistency between these data sources should be taken into account.
An overview of the literature on cost of illness studies for anxiety disorders reveals that there are a limited number of studies in this field. In fact, the only studies that estimated direct and indirect costs of anxiety disorders from a societal perspective in the U.S. were conducted far back, in 1996 and 1999 by DuPont et al.5 and Greenberg et al.10 DuPont et al.5 conducted a cost of illness analysis from a societal perspective, by including direct medical costs, direct non-medical costs, and indirect costs (morbidity and mortality costs). The major limitation of their study is that in estimating the cost of illness for anxiety disorders, they only considered the costs that were incurred directly due to anxiety disorders; but they did not account for the increase in general use of medical services in patients suffering from anxiety disorders. In addition, they did not include all diagnoses of anxiety disorders in their analysis (data on costs due to PTSD and acute stress disorder were not collected). All of this might have led to an underestimation of the true burden of anxiety disorders. Another limitation of the study is related to the data collection process. Data on utilization and cost was collected from several different data sources. For instance, they used more than six databases (such as National Hospital Discharge Survey, National Nursing Home Survey, Pharmaceutical Data Source …) for calculating direct medical costs. The potential inconsistencies between different data sources may later cast doubt on the reliability of results. Greenberg et al.10 reduced the inconsistency in data by using less data sources. They collected the majority of data from the National Comorbidity Survey. The cost components included in their study were direct psychiatric costs, direct non-psychiatric costs, and indirect costs (morbidity and mortality costs). Direct non-psychiatric costs accounted for most of the cost of illness for anxiety disorders. However, estimation of this cost component (which accounted for more than half of their estimated cost of illness) was based on results from a single staff–model HMO that may not be fully generalizable to the entire population. So, their estimation of cost of illness for anxiety disorders may not be representative of the true burden of this condition to the whole society. In addition, they did not include all diagnoses of anxiety disorders in their analysis (data on costs due to OCD and acute stress disorder were not collected). In more recent studies, the study population is either not from the U.S. or not representative of the whole U.S. population,11-15 the perspective is not societal,11,16-22 both direct and indirect costs are not estimated,11,15-23 or not all anxiety diagnoses are included in the study.16,17,24-29
Potential Contributions of This Research to the Current Literature Due to the high prevalence of anxiety disorders in the U.S. and the evidence from previous research on anxiety-related costs,5,10 it is expected that this category of mental illnesses imposes a significant economic burden to society. Considering the fact that

5
costly medical conditions have been always a high priority to policymakers in their effort to reduce healthcare costs, a well-conducted cost of illness for anxiety disorders can provide them with a reliable estimation of the economic burden of these conditions. Moreover, identifying the distribution of costs among different sub-populations and health sectors may enable them to come up with tailored disease management programs to reduce the costs. The specific features of the study which distinguish it from the previous works, and also add to the current knowledge are as follows:
Results of this research will provide the most comprehensive and updated estimate of cost of illness for anxiety disorders, for the ambulatory adult population of the U.S.
It is the first study that measures costs at the population level, as well as for
different sub-populations.
The sample is representative of the whole U.S civilian non-institutionalized population 18 years of age and older. So, results can be generalized to this group of individuals (Civilian-non-institutionalized population refers to community-dwelling population or ambulatory population. individuals in the military and those residing in nursing homes, assisted living facilities, and prisons are not included in the civilian-non-institutionalized population. Throughout this research, civilian non-institutionalized population and ambulatory population phrases are used alternatively).
The societal perspective enables the researcher to measure the economic burdens
of anxiety disorders to the whole society regardless of who incurred the costs.
Instead of getting data from several different data sources, which may lead to inconsistency in data and later affect the reliability of results, only one database will be used to collect data on healthcare utilization and costs.
All possible diagnoses of anxiety disorders will be included in the analysis.
The estimation of cost of illness will not only capture the costs directly due to
anxiety disorders, but it will also include cost of their comorbidities and complications.
The analysis technique used will control for all factors that may affect healthcare
expenditures, therefore, researchers can estimate costs solely due to anxiety disorders.

6
Specific Aims Specific aims of the study are presented in this section. For all specific aims, estimates will be provided for the ambulatory adult (18 years and older) population of the U.S.
Specific Aim 1 (SA1): To estimate direct medical cost and indirect costs (morbidity cost, mortality cost) of anxiety disorders.
Specific Aim 2 (SA2): To estimate direct medical costs attributable to anxiety
disorders by major service categories (i.e. inpatient visits, outpatient visits, office-based medical visits, emergency room visits, prescription medications, and other services).
Specific Aim 3 (SA3): To estimate direct medical costs attributable to anxiety
disorders for different sub-populations (based on gender, race/ethnicity, age, marital status, poverty category, education, geographic region, Metropolitan Statistical Area (MSA), and insurance coverage).

7
CHAPTER 2. LITERATURE REVIEW The goal of this chapter is to provide a review of literature relevant to the purpose of this research. It has two main sections. The first section provides an introduction to anxiety disorders, their epidemiology and treatments. The second section is devoted to cost of illness studies. It starts with description and history of cost of illness studies and continues with reviewing the cost of illness studies for anxiety disorders. In order to find these studies, we conducted a search in Pubmed, Ovid, PsycINFO, and Google Scholar for articles published after 1990. The search words were cost, expenditure, cost of illness, burden, and anxiety disorders.
An Overview of Anxiety Disorders Description of Anxiety Disorders According to the American Psychiatric Association,7 anxiety disorders categorize a large number of disorders including acute stress disorder, agoraphobia (with or without a history of panic disorder), generalized anxiety disorder (GAD), obsessive-compulsive disorder (OCD), panic disorder (with or without Agoraphobia), phobias (including social phobia), and post-traumatic stress disorder (PTSD). The primary feature of these disorders is abnormal or inappropriate anxiety. Everybody has experienced anxiety in forms of increased heart rate and tensed muscles. But anxiety becomes a problem when it occurs without any recognizable reason, or when the reason does not warrant such a reaction. If no medical condition accounts for symptoms, they are attributed to anxiety disorders.6 The following sections provide information on etiology, symptoms and prognosis of different diagnoses of anxiety disorders, quoted from AllPsych Online (http://allpsych.com/disorders/anxiety/index.html).6 Acute Stress Disorder
Etiology: “By definition, acute stress disorder is a result of a traumatic event in which the person experienced or witnessed an event that involved threatened or actual serious injury or death and responded with intense fear and helplessness.”6
Symptoms: “Symptoms include dissociative symptoms such as numbing, detachment, a reduction in awareness of the surroundings, derealization, or depersonalization; re-experiencing of the trauma, avoidance of associated stimuli, and significant anxiety, including irritability, poor concentration, difficulty sleeping, and restlessness. The symptoms must be present for a minimum of two days and a maximum of four weeks and must occur within four weeks of the

8
traumatic event for a diagnosis to be made.”6
Prognosis: “Prognosis for this disorder is very good. If it should progress into another disorder, success rates can vary according to the specific of that disorder.”6
Agoraphobia (with or without a History of Panic Disorder)
Etiology: “Agoraphobia can develop out of simple phobias or it can be a result of extreme trauma, although it is often a result of numerous panic attacks such as those found in panic disorder.”6
Symptoms: “Agoraphobia, like other phobias, is made up of extreme anxiety and
fear. Different from other phobias, however, is the generalization which occurs. Agoraphobia is the anxiety about being in places where escape might be difficult or embarrassing or in which help may not be available should a panic attack develop. It can be sub diagnosed as either ‘with’ or ‘without’ panic disorder. Typically situations that invoke anxiety are avoided and in extreme cases, the person may never or rarely leave their home.”6
Prognosis: “Prognosis is good, especially if the individual has some insight into
the development of the disorder and if their fears are irrational and there is insight into this.”6
Generalized Anxiety Disorder (GAD)
Etiology: “Often anxiety gets generalized to other situations, and can then become overwhelming or associated with life in general. Typically GAD develops over a period of time and may not be noticed until it is significant enough to cause problems with functioning.”6
Symptoms: “As its name implies, GAD is evidenced by general feelings of anxiety such as mild heart palpitations, dizziness, and excessive worry. The symptoms are difficult to control for the individual and are not related to a specific event (such as in PTSD) and are not as severe as those found with Panic Disorder.”6
Prognosis: “Prognosis is good for the more extreme symptoms, but those
associated with underlying fears are more difficult to treat (such as excessive worry). Working through childhood issues can be helpful as these tend to get distorted as they follow us into adulthood (e.g., over-controlling parental styles, sexual abuse, and childhood phobias).”6

9
Obsessive-compulsive Disorder (OCD)
Etiology: “Both biological and psychological causes have been found in OCD.”6
Symptoms: “The key features of this disorder include obsessions (persistent, often irrational, and seemingly uncontrollable thoughts) and compulsions (actions which are used to neutralize the obsessions). A good example of this would be an individual who has thoughts that he is dirty, infected, or otherwise unclean which are persistent and uncontrollable. In order to feel better, he washes his hands numerous times throughout the day, gaining temporary relief from the thoughts each time. For these behaviors to constitute OCD, it must be disruptive to everyday functioning (such as compulsive checking before leaving the house making you extremely late for all or most appointments, washing to the point of excessive irritation of your skin, or inability to perform everyday functions like work or school because of the obsessions or compulsions).”6
Prognosis: “Prognosis for this disorder has a wide range, depending upon how the
individual responds to medication and how deep rooted the underlying issues are.”6
Panic Disorder (with or without Agoraphobia)
Etiology: “Often the symptoms of this disorder come on rapidly and without an identifiable stressor. The individual may have had periods of high anxiety in the past, or may have been involved in a recent stressful situation. The underlying causes, however, are typically subtle.”6
Symptoms: “Panic Disorder is characterized by sudden attacks of intense fear or
anxiety, usually associated with numerous physical symptoms such as heart palpitations, rapid breathing or shortness of breath, blurred vision, dizziness, and racing thoughts. Often these symptoms are thought to be a heart attack by the individual, and many cases are diagnosed in hospital emergency rooms.”6
Prognosis: “Prognosis for this disorder is very good if the above conditions are
met. Left untreated, however, symptoms can worsen and Agoraphobia can develop. In these cases, the individual has developed such an intense fear that leaving the safety of home feels impossible.”6
Phobias (Including Social Phobia)
Etiology: “Often a traumatic event is the precursor for a phobia, which may or may not be at the conscious level.”6
Symptoms: “Symptoms include either extreme anxiety and fear associated with

10
the object or situation or avoidance. To be diagnosed, the symptoms must be disruptive to everyday functioning (such as quitting a great job merely because you have to use an elevator).”6
Prognosis: “Prognosis is very good if treated effectively.”6
Post-traumatic Stress Disorder (PTSD)
Etiology: “By definition, PTSD always follows a traumatic event which causes intense fear and/or helplessness in an individual. Typically the symptoms develop shortly after the event, but may take years. The duration for symptoms is at least one month for this diagnosis.”6
Symptoms: “Symptoms include re-experiencing the trauma through nightmares,
obsessive thoughts, and flashbacks (feeling as if you are actually in the traumatic situation again). There is an avoidance component as well, where the individual avoids situations, people, and/or objects which remind him or her about the traumatic event (e.g., a person experiencing PTSD after a serious car accident might avoid driving or being a passenger in a car). Finally, there is increased anxiety in general, possibly with a heightened startle response (e.g., very jumpy, startle easy by noises).”6
Prognosis: “Prognosis ranges from moderate to very good. Those with the best
prognosis include situations where the traumatic event was acute or occurred only one time (e.g., car accident) rather than chronic or on-going trauma (e.g., ongoing sexual abuse, war).”6
Epidemiology of Anxiety Disorders For any anxiety disorder, 12-month prevalence is 18.1% of the U.S. adult population.9 Lifetime prevalence is 28.8% of the U.S. adult population and 25.1% of children and adolescents.30 Women are 60% more likely than men to experience an anxiety disorder over their lifetime. Non-Hispanic Blacks are 20% less likely, and Hispanics are 30% less likely, than non-Hispanic Whites to experience an anxiety disorder during their lifetime. Individuals in the age group of 30-44 have the highest risk of developing an anxiety disorder over their lifetime (35.1%), while those who are 60 or older have the lowest risk (15.3%).30 Table 2-1 shows the epidemiology of anxiety disorders in the U.S. adult population for each specific diagnosis.
Treatment of Anxiety Disorders
According to the National Institute of Mental Health (NIMH) “anxiety disorders are treated with medication, specific types of psychotherapy, or both. Treatment choices

11
Table 2-1. Prevalence of anxiety disorders for the U.S. adult population. Diagnosis Lifetime prevalence 12-month prevalence Any Anxiety Disorder 28.8% 18.1% Acute Stress Disorder 7.8% - Agoraphobia 1.4% 0.8% Generalized Anxiety Disorder 5.7% 3.1% Social Phobias 12.1% 6.8% Specific Phobias 12.5% 8.7% Post-traumatic Stress Disorder 6.8% 3.5% Obsessive-compulsive Disorder 1.6% 1.0% Panic Disorder 4.7% 2.7%
Source: Kessler RC, Chiu WT, Demler O, Merikangas KR, Walters EE. Prevalence, severity, and comorbidity of 12-month DSM-IV disorders in the National Comorbidity Survey Replication. Arch Gen Psychiatry. Jun 2005;62(6):617-627; Kessler RC, Berglund P, Demler O, Jin R, Merikangas KR, Walters EE. Lifetime prevalence and age of-onset distributions of DSM-IV disorders in the National Comorbidity Survey Replication. Arch Gen Psychiatry. Jun 2005;62(6):593-602. depend on the problem and the person’s preference. Before treatment begins, a doctor must conduct a careful diagnostic evaluation to determine whether a person’s symptoms are caused by an anxiety disorder or a physical problem.”8(p. 14) The following sections, quoted from the Booklet of Anxiety Disorders,8 describe treatment options for anxiety disorders. Medication “Medication will not cure anxiety disorders, but it can keep them under control while the person receives psychotherapy.”8(p. 14) Antidepressants, anti-anxiety drugs, and betablockers are the three major categories medications used for anxiety disorders. Antidepressants. Even though Antidepressants were originally developed to treat depression, they are also effective in treating anxiety disorders.8 The specific antidepressant used to treat anxiety disorders are listed below:
Selective serotonin reuptake inhibitors (SSRIs): “SSRIs alter the levels of the neurotransmitter serotonin in the brain, which, like other neurotransmitters, helps brain cells communicate with one another. Fluoxetine (Prozac®), sertraline (Zoloft®), escitalopram (Lexapro®), paroxetine (Paxil®), and citalopram (Celexa®) are some of the SSRIs commonly prescribed for panic disorder, OCD, PTSD, and social phobia. SSRIs are also used to treat panic disorder when it

12
occurs in combination with OCD, social phobia, or depression. Venlafaxine (Effexor®), a drug closely related to the SSRIs, is used to treat GAD. These medications are started at low doses and gradually increased until they have a beneficial effect. SSRIs have fewer side effects than older antidepressants. Their common side effects are slight nausea or jitters (when people first start to take them) as well as sexual dysfunction.”8(p. 15)
Tricyclics: “Tricyclics are older than SSRIs and work as well as SSRIs for anxiety
disorders other than OCD. Tricyclics include imipramine (Tofranil®), which is prescribed for panic disorder and GAD, and clomipramine (Anafranil®), which is the only tricyclic antidepressant useful for treating OCD. They are also started at low doses that are gradually increased. They sometimes cause dizziness, drowsiness, dry mouth, and weight gain.”8(p. 15)
MAOIs: “Monoamine oxidase inhibitors (MAOIs) are the oldest class of
antidepressant medications. The MAOIs most commonly prescribed for anxiety disorders are phenelzine (Nardil®), followed by tranylcypromine (Parnate®), and isocarboxazid (Marplan®),which are useful in treating panic disorder and social phobia. If taken with food and beverages containing tyramine or certain medications, including some types of birth control pills, pain relievers, cold and allergy medications, and herbal supplements drug interaction will occur which leads to increase in blood pressure.”8(p. 16)
Anti-anxiety drugs. “High potency benzodiazepines combat anxiety and its main side effect is that patient may get dependent to it. Clonazepam (Klonopin®) is used for social phobia and GAD, lorazepam (Ativan®) is helpful for panic disorder, and alprazolam (Xanax®) is useful for both panic disorder and GAD. This drug in now less prescribed due to its side effects.”8(p. 16) Betablockers. “Betablockers such as propranolol (Inderal®), which is used to treat heart conditions, can prevent the physical symptoms that accompany certain anxiety disorders, particularly social phobia.”8(p. 17) Psychotherapy “Psychotherapy involves talking with a trained mental health professional, such as a psychiatrist, psychologist, social worker, or counselor, to discover what caused an anxiety disorder and how to deal with its symptoms.”8(p. 17) One of the specific forms of psychotherapy, which is very effective in treating some forms of anxiety disorders, is called Cognitive Behavioral Therapy (CBT). According to the booklet of NIMH on anxiety disorders:
CBT is very useful in treating anxiety disorders. The cognitive part helps people change the thinking patterns that support their fears, and the behavioral part helps people change the way they react to anxiety-provoking situations. There is some

13
evidence that the benefits of CBT last longer than those of medication for people with panic disorder, and the same may be true for OCD, PTSD, and social phobia. If a disorder recurs at a later date, the same therapy can be used to treat it successfully a second time. Medication can be combined with psychotherapy for specific anxiety disorders, and this is the best treatment approach for many people.8(p. 17)
Diagnosis Specific Treatment The following sections, quoted from AllPsych Online (http://allpsych.com/disorders/anxiety/index.html),6 provide treatment recommendations for each specific diagnosis of anxiety disorder.
Acute Stress Disorder: “The disorder may resolve itself with time or may develop into a more severe disorder such as PTSD. Medication can be used for a very short duration (up to four weeks) or psychotherapy can be utilized to assist the victim in dealing with the fear and sense of helplessness.”6
Agoraphobia: “(with or without a history of panic disorder): Treatment may
involve anxiety reduction techniques aimed at increasing the control a person feels over his or her anxiety and fears. Other approaches require the individual to work through their anxiety in relation to interpersonal or childhood issues.”6
Generalized Anxiety Disorder (GAD): “Medication and/or psychotherapy have
been found to be helpful, especially therapy aimed at teaching the client how to gain control over the symptoms.”6
Obsessive-compulsive Disorder (OCD): “Medication is often prescribed for
individuals with OCD. Psychotherapy can be helpful in learning ways to feel more in control, cope better with stressors, and explore the underlying issues associated with the obsessive thoughts.”6
Panic Disorder (with or without Agoraphobia): “Although medication can be
useful, psychotherapy (especially behavioral and cognitive/behavioral approaches have proved quite successful). The key to treatment is accepting the panic attacks as psychological rather than physical (once these causes have been ruled out by a physician), practicing relaxation exercises, and working through the underlying issues.”6
Phobias (including Social Phobia): “Treatment is often behavioral in nature, with
the therapist guiding the client through exercises more closely resembling the feared object or situation. Exploring underlying issues can also be beneficial.”6
Post-traumatic Stress Disorder (PTSD): “Psychological treatment is considered
the most effective means to recovery from PTSD, although some medications

14
(such as anti-anxiety meds) can help alleviate some symptoms during the treatment process.”6
An Overview of Cost of Illness Analysis Description of Cost of Illness Analysis According to Joel & Segel, “Cost-of-illness studies measure the economic burden of a disease or diseases and estimate the maximum amount that could potentially be saved or gained if a disease were to be eradicated.”3(p. 2) Both direct and indirect costs are included in a comprehensive analysis. However, based on the perspective of a study, either of these cost categories can be excluded.3 Direct and indirect costs. Direct costs refer to the opportunity cost of resources used for treating a particular disease. However in measuring indirect costs, the main focus is on the value of resources lost due to a particular disease.31 According to Hodgson and Meiners, opportunity cost is defined as “the value of the forgone opportunity to use in a different way those resources that are used or lost due to illness.”3(p. 4) Direct costs include direct medical costs and nonmedical direct costs. Direct medical costs include costs for hospital inpatient stays, emergency room visits, office-based medical visits, outpatient visits, prescription medication, nursing home care, hospice care, rehabilitation care, home health care, and cost for medical supplies.31,32 Nonmedical direct costs include costs due to transportation to health care facilities; relocation and any other change in one’s life pattern due to the illness.3 Indirect costs include mortality cost (cost of premature death due to the illness) and morbidity cost (productivity loss). There are studies in which intangible costs i.e. costs of pain and suffering are included in the analysis as well. However, estimation of intangible costs is less common due to difficulty in measuring these costs.3 Perspective. One of the most important aspects of any economic evaluation is the perspective of the study. In fact, inclusion and exclusion of the above discussed cost categories depend on the perspective undertaken in the study. There are several different perspectives that can be used in economic evaluations. For instance, one perspective measures the costs to the society (societal perspective) and another one may take into account costs to the third party payer (payer perspective). There are other perspectives in which costs to businesses, the government, and participants and their families are included.4,31 Incidence-based versus prevalence-based approach. In an incidence-based study, the attempt is to estimate the lifetime cost for a patient with a particular illness. Here the lifetime cost refers to the cost of an illness from diagnosis to cure or death. On

15
the other hand, in prevalence-based studies, all costs for a particular population in a given time period (regardless of the date of onset) will be measured. Requiring less data and fewer assumptions than incidence-based studies, prevalence based studies are far more common.3 Measuring indirect costs. There are three primary approaches to estimate indirect costs including the Human Capital approach (HCA), the friction cost method, and the willingness to pay approach. In the HCA, the lost production for employed patients/caregivers is measured in terms of lost earnings.33,34 If the patient/care giver is not employed, the value of household work would be equivalent to the cost of hiring a replacement from the labor market.3 Friction cost method is a more realistic approach to measure indirect costs. The assumption here is that as long as unemployment rate is greater than zero, the market would be able to replace the lost work force. So, the loss of an employee will lead to production loss until the new employee is hired and trained.35-37 This period is called the friction period. Finally, indirect costs can be measured using the willingness to pay approach. According to Joel & Segel, “The willingness to pay approach measures the amount an individual would pay to reduce the probability of illness or mortality.”3(p. 14) Top-down or bottom-up approach. In top-down approach, highly aggregated data sources (on population-level) would be directly used. While in bottom-up approach, the individual-level data (adopted from patients, patient’s chart, epidemiological registries or cohort studies) would be aggregated to get the population-level data.38 History of Cost of Illness Studies Cost-of-illness studies were among the first economic evaluation studies and first appeared in the literature in 1913 in a paper called The value of human life.39 Later in the 1950s and 1960s, other researchers tried to develop the cost of illness methodology further.34,40,41 In 1959, Mushkin and Collings tried to clarify cost concepts in cost of illness studies. They introduced a classification of costs “based on their effects on the use, distribution, and quantity of economic resources”.40(p. 795) In 1966, Dorothy Rice developed a framework for calculating single-year costs of illness, disability, and death by major category of illness, using existing data sets. She also tried to address the problems in which a researcher encounters in measuring direct and indirect costs.34 Later, this method became a standard approach for conducting a cost of illness study. Since 1966, Rice has updated and refined her methodology. Cost of illness studies became more popular in the 1970s and 1980s, when they were used to gain support for more resources being devoted to health care.42 Later in

16
1990s, pharmaceutical companies started to use cost of illness studies to highlight the economic burden of a particular disease. The aim was to justify the fact that more resources, i.e. the company’s product, should be devoted to that particular disease.42 Nowadays, cost of illness studies are being widely used by health economists, pharmaceutical companies, clinicians, and policymakers to set research agendas and allocate resources.4,5
Review of Cost of Illness Studies for Anxiety Disorders An overview of the literature on cost of illness studies for anxiety disorders revealed that there are quite a few studies in this field. In general, these studies form up two separate categories. One category includes the studies in which the main purpose was to calculate the cost of illness for anxiety disorders. This category by itself has two different subcategories: cost of illness studies for multiple diagnoses of anxiety disorders, and cost of illness studies for a particular diagnosis of anxiety disorder. Another major category consists of studies in which obtaining the cost of illness was not the main purpose of the study. For instance, some have calculated the cost as part of a cost-effectiveness study for a particular treatment of anxiety disorders, while some tried to determine the predictors of cost for anxiety disorders. Studies in Which the Main Purpose Was to Calculate COI for Anxiety Disorders In this section, studies with the objective of calculating cost of illness for anxiety disorders are reviewed. COI studies for multiple diagnoses of anxiety disorders. DuPont et al.5 and Greenberg et al.10 estimated the direct and indirect costs of anxiety disorders in U.S. in 1990s. Goetzel et al.11 assessed the health and productivity cost burden of the top ten physical and mental health conditions, including anxiety disorders, affecting six large U.S. employers; while Marciniak et al.15 tried to estimate the cost of anxiety disorders among the employed individuals in the United States. Andlin-Sobocki et al.13 conducted a study to estimate the cost of anxiety disorders in Europe and Smit et al.14 estimated the costs of nine common mental disorders, including anxiety disorders, in Netherlands. COI studies for a particular diagnosis of anxiety disorders. Siegel et al.,24 Leon et al.,16 and Batelaan et al.28 assessed the costs of panic disorder in the U.S., and Netherlands, respectively. While Patel et al.27 and Acarturk et al.29 estimated the economic consequences of social phobia in the Great Britain and Netherlands. Rees et al.17 compared medical utilization and costs incurred by people with panic disorder to those incurred by people with social phobia.

17
Studies in Which Obtaining the COI Was Not the Main Purpose of the Study Below is the list of studies falling in this category:
Salvador-Carulla et al.26 estimated the costs before and after the diagnosis and the provision of effective treatment for panic disorder.
Souetre et al.25 examined how co-morbidity and symptom severity related to the
costs of generalized anxiety disorder (GAD).
Marciniak et al.18 examined the different clinical and demographic characteristics that could affect the cost of treating patients with anxiety disorders.
Roberge et al.23 examined healthcare services utilization and costs before and
after providing an empirically supported cognitive-behavioral treatment for panic disorder with agoraphobia.
McLaughlin et al.20 conducted a study aimed at measuring the impact of having
both depression and anxiety, having neither or either condition alone on treatment patterns, health care utilization, and cost.
Stein et al.21 tried to find out how antidepressant adherence, among patients with
anxiety disorders, will affect medical resource use and costs.
Olfson and Gameroff 22 conducted a study to evaluate the extent to which pain severity contributes to the health care costs of patients with generalized anxiety disorder (GAD).
Specific Features of the COI Studies for Anxiety Disorders In the following sections, each of the above-mentioned studies is assessed with respect to the main features of a cost of illness analysis. Source of data. In order to get data on resource use and cost, almost half of the studies used retrospective cohort study methodology. In some of these studies, patients were asked retrospectively about their utilization,16,17,24,25,29 while in other studies, medical databases providing individual information on healthcare utilization and cost were used to obtain required data.5,10,11,13,15,18,20,21 Table 2-2 shows the list of these databases. Top-down or bottom-up approach. Only two studies used the top-down approach to calculate cost of illness for anxiety disorders.5,10 Other studies used the bottom-up approach.

18
Table 2-2. Data sources used in COI studies of anxiety disorders.
Authors Data source DuPont et al.5 National Institute of Mental Health (NIMH)
National Hospital Discharge Survey American Medical Association National Center for Health Statistics National Nursing Home Survey Pharmaceutical Data Source
Greenberg et al.10 National Comorbidity Study (NCS)
A large staff–model health maintenance organization The U.S. Bureau of the Census Professional associations and news periodicals National Center for Health Statistics Industry sources
Goetzel et al.11 Health and Productivity Management (HPM)a Subset of
MedStat’s MarketScanb Database Andlin-Sobocki13 German National Health Interview and Examination
Survey - mental health supplement (GHS–MHS)c Marciniak et al.15 Health and Productivity Management (HPM) Subset of
MedStat’s MarketScan Database McLaughlin et al.20 PharMetrics Patient-Centric Databased Stein et al.21 Integrated Healthcare Information Services National
Managed Care Benchmark Databasee a The HPM database contains workplace absence, short-term disability, and worker compensation data for six fortune 200 U.S. employers. b The Market- Scan database is an annual medical database that includes private sector health data from approximately 100 payers and contains data on clinical utilization, expenditures, and enrollment across inpatient, outpatient, prescription drug, and carve-out services. This database links paid claims and encounter data to detailed patient information across sites and types of providers over time. c The survey was carried out in 1998/99 and included a community sample of 4181 (age: 18–65) individuals. d PharMetrics Patient-Centric database is composed of medical and pharmaceutical claims for approximately 36 million patients from 61 health plans across the United States. e Located in Waltham, Massachusetts, this nationally representative database includes data from 30 health plans covering more than 25 million persons.

19
Perspective of the study. Eight out of twenty one studies used payer perspective,11,15-17,19-22 while other studies used societal perspective. Cost categories. More than half of the studies included indirect costs in their analysis as well as direct costs. To estimate indirect costs, all studies used HCA. Only four studies gave an estimation of indirect costs on a population level (employed or unemployed patients).5,13,29,43 The rest reported indirect costs based on employed patients only.10,11,14,15,24-28 Specific cost categories used in these studies are shown in Table 2-3.44 As one can see, the most frequent cost categories included in the analysis were outpatient treatment cost, costs for hospital treatment, drugs, and emergency room facilities. Studies conducted by DuPont et al.5 and Greenberg et al.10 were the most comprehensive studies with respect to cost categories included in the analysis. Incremental cost approach. In estimating the cost of illness for anxiety disorders, less than half of the studies calculated the incremental healthcare cost of individuals with anxiety disorders, in excess of those who were anxiety free. In other words, not only costs directly due to anxiety disorders were included, but also costs due to comorbidities and complications of anxiety disorders were considered in their cost estimation;14,15,17,18,20,22,24,27,29 Rest of the studies only estimated the costs which were directly due to anxiety disorders.

20
Table 2-3. Cost categories included in cost of illness studies.
ER = Emergency Room. Source: Konnopka A, Leichsenring F, Leibing E, Konig HH. Cost-of-illness studies and cost-effectiveness analyses in anxiety disorders: a systematic review. Journal of Affective Disorders. Apr 2009; 114(1-3):14-31.
Direct costs Indirect costs
Outpatient
Inpatient
Medications
Rehabilitations
ER
Non-m
edical
Productivity loss
Sick-leave
Early retirem
ent
Mortality
Authors
Edlund and Sawn43 Siegel et al.24 Souetre et al.25 Salvador-Carulla et al.26 DuPont et al.5 Leon et al.16 Rees et al.17 Greenberg et al.10 Patel et al.27 Goetzel et al.11 Marciniak et al.15 Marciniak et al.18 Andlin-Sobocki et al.13 Panzer et al.19 Roberge et al.23 McLaughlin et al.20 Smit et al.14 Stein et al.21 Batelaan et al.28 Olfson and Gameroff 22 Acarturk et al.29

21
CHAPTER 3. METHODOLOGY
Research Design In order to estimate the cost of illness for anxiety disorders, a retrospective database analysis was conducted. The specific features of the research are as follows: Perspective Cost of illness for anxiety disorders was calculated from a societal perspective. In other words, this economic evaluation includes the impact of anxiety disorders on the welfare of the whole society. In order to achieve this goal, both direct and indirect costs attributable to anxiety disorders have been estimated. The costs components included in this study are as follow:
Direct medical costs: This category refers to expenditures for inpatient visits, outpatient visits, office-based medical provider visits, emergency room visits, prescription medications, and other medical expenses (other medical expenses refer to expenses not included in the above-mentioned categories, such as expenditures for home health and medical devices and supplies).
Indirect costs: This category includes morbidity and mortality costs.
Approach To estimate cost of illness, one can take either incidence-based or prevalence-based approach. As it was mentioned in the previous chapter, prevalence-based approach is far more common, since it needs less data and time in comparison with the incidence-based one. So in this research, a prevalence-based approach was adopted to estimate the cost of illness for anxiety disorders. Data Data was collected from three major databases. These databases are explained in details in the “Data Overview” section.
Medical Expenditures Panel Survey (MEPS).
The Bureau of Labor Statistics (BLS).
The National Vital Statistics System (NVSS).

22
Table 3-1 shows the exact databases used for calculation of each cost component. Using these databases, the researcher estimated costs at individual level. The bottom-up approach was undertaken to aggregate individual-level data to population-level. Sampling MEPS sampling plan. The study sample was based on the MEPS sampling plan. As it was mentioned in chapter 2, MEPS collects data on health services utilization and cost, as well as how frequently these services are used and how they are paid.45
MEPS currently has two major components: the Household Component and the Insurance Component. The Household Component provides data from individual households and their members, which is supplemented by data from their medical providers. The Insurance Component is a separate survey of employers that provides data on employer-based health insurance. The Household Component (HC) collects data from a sample of families and individuals in selected communities across the United States, drawn from a nationally representative subsample of households that participated in the prior year's National Health Interview Survey (conducted by the National Center for Health Statistics). During the household interviews, MEPS collects detailed information for each person in the household on demographic characteristics, health conditions, health status, use of medical services, charges and source of payments, access to care, satisfaction with care, health insurance coverage, income, and employment.45
Table 3-1. Data sources for calculation of each cost component.
Cost component Data source Direct Medical Cost MEPS Data Files including:
Full Year Consolidated Data File Medical Conditions File Prescribed Medicines File Hospital Inpatient Stays File Emergency Room Visits File Outpatient Visits File Office-based Medical Provider File Home Health Services File Other Medical Expenses File
Indirect cost: Morbidity MEPS Full Year Consolidated Data File
Bureau of Labor Statistics (BLS) Indirect cost: Mortality The National Vital Statistics System (NVSS)
Bureau of Labor Statistics (BLS)

23
In this study, only the household component has been used. Each year, the selected households from the prior year's National Health Interview Survey (NHIS) form a panel. Each panel is followed for a period of two years. During these two years, each household in the panel is interviewed in five rounds. Consequently, the sample for each year of the MEPS data files includes two overlapping panels. Figure 3-1 shows this overlapping panel design.46 Sample size. When using national data, a sufficient sample size must be obtained to ensure reliable survey estimates; Medical expenditure data are highly skewed. It means that a small portion of population accounts for a large portion of expenses. Medical expenditure data from MEPS follow the same pattern. Consequently, if the sample size is not large enough, “some point estimates for particular subgroups of the population may show substantial fluctuations from one year to the next that are not statistically significant.”47(p. 2615) To address this issue, the Agency for Healthcare Research and Quality (AHRQ) has set the minimum requirement of 100 un-weighted participants per cell for producing national estimates.47 Even though MEPS annual sample size is much larger than 100, the number of participants in many of the MEPS analytic and policy relevant subpopulations of interest might be less than 100. Fortunately, several consecutive years of MEPS data files can be pooled together to improve the precision of estimates and expand the types of analyses
Figure 3-1. Overlapping design of MEPS sample. Source: MEPS HC-138: 2010 Full Year Consolidated Data File. 2012; http://meps.ahrq.gov/mepsweb/data_stats/download_data/pufs/h138/h138doc.shtml#2581UnitedStates. Accessed 10/15/2012.
1/1/2011 1/1/2010
Panel 14
Round 1 Round 2 Round 3 Round 4 Round 5
Panel 15
Round 1 Round 2 Round 3 Round 4 Round 5

24
possible. For this research, data was pooled from the 2009-2010 MEPS public use files, to allow for a large enough sample size. 2009 and 2010 data were the latest available MEPS datasets at the time of study. More specifically, data files used in this study were: full year consolidated data file; medical conditions file; as well as event level files for prescribed medicines, hospital inpatient stays, emergency room visits, outpatient visits, office-based medical provider visits, home health visits, and other medical expenses from 2009 and 2010 MEPS-Household Components. The pooling was conducted according to the MEPS guidelines on pooling several years of data.48 Study sample. The study population is consisted of all survey-respondents (for the years 2009 and 2010) 18 years and older, with positive person weights. Among these, individuals who reported a diagnosis of, or had a medical event associated with anxiety disorder(s) were classified as anxiety patients. Diagnoses and events were identified using Clinical Classification (CC) code. CC code aggregates conditions and procedures into mutually exclusive and clinically homogeneous categories, using Clinical Classification Software.49 The CC code 651 is specifically assigned to anxiety disorders. The conditions included in this category are: generalized anxiety disorder, panic disorder, phobias (social phobia, specific phobia), agoraphobia, obsessive-compulsive disorder, post-traumatic stress disorder, acute stress disorder, overanxious disorder, and mixed emotional disturbances.
Data Overview As it was mentioned earlier, three major databases were used in this study as data sources. Information collected from each of these data bases is provided in the following sections: MEPS Data Files The majority of data was collected from MEPS:
MEPS is a set of large-scale surveys of families, individuals, their medical providers and employers across the United States. It is jointly sponsored by the Agency for Healthcare Research and Quality (AHRQ) and the National Center for Health Statistics (NCHS), and has been conducted annually since 1996. It has three major components; the Household Component (HC), the Insurance Component (IC), and the Medical Provider Component (MPC). The MEPS-HC collects data from a nationally representative sample of the civilian non- institutionalized population of the U.S.; and is intended to provide national estimates of healthcare utilization, cost, insurance cover- age, and sources of payment.50(p. 721)

25
The following MEPS data files were used in this research:
Full Year Consolidated Data file: Each year, the Full Year Consolidated Data file provides information collected on a nationally representative sample of the civilian non-institutionalized population of the United States for that calendar year. More specifically, this file contains the following variables: survey administration, language of interview, demographics, parent identifiers, health status, disability days, access to care, employment, quality of care, patient satisfaction, health insurance, use, income, and expenditure variables.
Medical Conditions file: For each calendar year, the Medical Conditions file
provides information on household-reported medical conditions.
MEPS Household Component Event files: There are seven event-level files in MEPS Household Component which provide information on utilization and expenditure, due to medical conditions, by type of health services received. These files are: Prescribed Medicines file, Dental Visits file (not used in this study), Other Medical Expenses file, Hospital Inpatient Stays file, Emergency Room Visits file, Outpatient Visits file, Office-Based Medical Provider Visits file, and Home Health file.
Variables used in analyses from MEPS data files. List of variables from these data files, which were used in the analyses, are provided in Table 3-2. Some of these variables are categorical while others are continuous. List of categorical variables, along with levels of each variable, is provided in Table 3-3. Summary variables. According to the MEPS survey design, each year interviewers collect data through three consecutive rounds (for each panel). Consequently for most measures, MEPS has information in each round (round-level variables) and also at the end of year. However, some variables are presented only at round-level and the researcher needs to summarize them into single variables representing the status of a whole year. In this section, list of summary variables used in the analyses and the way they were constructed are provided.
Perceived health status (RTHLTH), Sick-leave pay (SICPAY), union status (UNION), and occupation category (OCCCAT): The value of summery variable would be equal to the most frequent value of round variables. If round variables all have different values, then round variable with the longest reference period represents the summery variable.
Number of days missed work due to illness/injury (DDNWRK) and number of
days stayed in bed due to illness/injury (DDBDYS): Summery variable is equal to the sum of round-level variables.
Employment status (EMPST): In MEPS, a current main job is defined for persons
who either reported they were currently employed and identified a current main
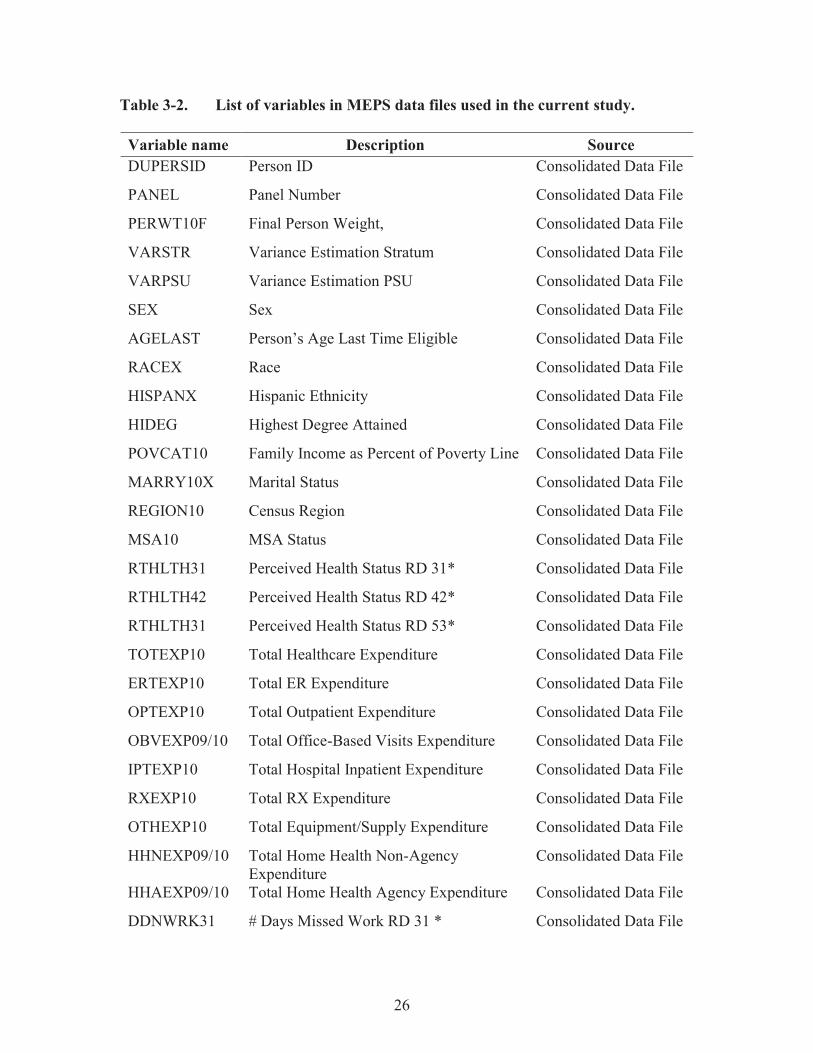
26
Table 3-2. List of variables in MEPS data files used in the current study.
Variable name Description Source DUPERSID Person ID Consolidated Data File
PANEL Panel Number Consolidated Data File
PERWT10F Final Person Weight, Consolidated Data File
VARSTR Variance Estimation Stratum Consolidated Data File
VARPSU Variance Estimation PSU Consolidated Data File
SEX Sex Consolidated Data File
AGELAST Person’s Age Last Time Eligible Consolidated Data File
RACEX Race Consolidated Data File
HISPANX Hispanic Ethnicity Consolidated Data File
HIDEG Highest Degree Attained Consolidated Data File
POVCAT10 Family Income as Percent of Poverty Line Consolidated Data File
MARRY10X Marital Status Consolidated Data File
REGION10 Census Region Consolidated Data File
MSA10 MSA Status Consolidated Data File
RTHLTH31 Perceived Health Status RD 31* Consolidated Data File
RTHLTH42 Perceived Health Status RD 42* Consolidated Data File
RTHLTH31 Perceived Health Status RD 53* Consolidated Data File
TOTEXP10 Total Healthcare Expenditure Consolidated Data File
ERTEXP10 Total ER Expenditure Consolidated Data File
OPTEXP10 Total Outpatient Expenditure Consolidated Data File
OBVEXP09/10 Total Office-Based Visits Expenditure Consolidated Data File
IPTEXP10 Total Hospital Inpatient Expenditure Consolidated Data File
RXEXP10 Total RX Expenditure Consolidated Data File
OTHEXP10 Total Equipment/Supply Expenditure Consolidated Data File
HHNEXP09/10 Total Home Health Non-Agency Expenditure
Consolidated Data File
HHAEXP09/10 Total Home Health Agency Expenditure Consolidated Data File
DDNWRK31 # Days Missed Work RD 31 * Consolidated Data File

27
Table 3-2. (Continued).
Variable name Description Source DDNWRK42 # Days Missed Work RD 42 * Consolidated Data File
DDNWRK53 # Days Missed Work RD 53 * Consolidated Data File
WKINBD31 # Days Stayed in Bed RD 31 * Consolidated Data File
WKINBD42 # Days Stayed in Bed RD 42 * Consolidated Data File
WKINBD53 # Days Stayed in Bed RD 53* Consolidated Data File
EMPST31 Employment Status RD 31* Consolidated Data File
EMPST42 Employment Status RD 42* Consolidated Data File
EMPST53 Employment Status RD 53* Consolidated Data File
HRWG31X Hourly Wage RD 31 * Consolidated Data File
HRWG42X Hourly Wage RD 42 * Consolidated Data File
HRWG53X Hourly Wage RD 53 * Consolidated Data File
SELFCM31 Self-Employed RD 31 * Consolidated Data File
SELFCM42 Self-Employed RD 42 * Consolidated Data File
SELFCM53 Self-Employed RD 53 * Consolidated Data File
UNION31 Union Status RD 31 * Consolidated Data File
UNION42 Union Status RD 42 * Consolidated Data File
UNION53 Union Status RD 53 * Consolidated Data File
SICPAY31 Paid Sick Leave RD 31* Consolidated Data File
SICPAY42 Paid Sick Leave RD 42* Consolidated Data File
SICPAY53 Paid Sick Leave RD 53 * Consolidated Data File
NUMEMP31 Number of Employees RD 31 * Consolidated Data File
NUMEMP42 Number of Employees RD 42 * Consolidated Data File
NUMEMP53 Number of Employees RD 53 * Consolidated Data File
OCCCAT31 Occupation Group RD 31 * Consolidated Data File
OCCCAT42 Occupation Group RD 42 * Consolidated Data File
OCCCAT53 Occupation Group RD 53 * Consolidated Data File
INS10X Insurance Indicator Variable Consolidated Data File

28
Table 3-2. (Continued).
Variable name Description Source INSCOV10 Health Insurance Coverage Indicator Consolidated Data File
MCAID10X Covered by Medicaid Consolidated Data File
MCARE10X Covered by Medicare Consolidated Data File
TRICR10X Covered by Tricare Consolidated Data File
OTPUBA10, OTPUBB10, STAPR10
Covered by Other Public Insurances Consolidated Data File
PUB10X Covered by Public Insurance Consolidated Data File
CONDIDX Condition ID Medical Conditions File
ICD9CODX ICD-9-CM Code For Condition Medical Conditions File
CCCODEX CC Code in Conditions File Medical Conditions File
RXCCC1X-3X CC Code in RX File RX File
ERCCC1X-3X CC Code in ER Visit File ER visits File
OPCCC1X-4x CC Code in Outpatient Visit File Outpatient Visits File
IPCCC1X-4X CC Code in Hospital Inpatient File Hospital Inpatient File
OBCCC1X-4X CC Code in Office-Based Visit File Office-Based Visits File
Notes: Name of variables in this table are as shown in MEPS 2010 data files. In the previous years of MEPS data files, most variables have the same names. Variables ending in 10 represent the values as of 12/31/2010. So for each year of data collection, these variables would end in XX, where XX are the last two digits of the year data was collected for; Variables ending in 31, 42, or 53 are round specific variable and the last two digits at the end specify the round in which data was collected (i.e. round 1, 2, 3 of the panel started in the current year (the first digit) or round 3, 4, 5 of the panel started in the previous year (the second digit)). * These variables haven’t been used directly in the analyses. Instead, they have been used to construct summary variables, and the summary variables were included in the analyses. PSU=Primary Sampling Unit; MSA = Metropolitan Statistical Area; RD = Round; ER = Emergency Room; RX = Prescribed Medicine; # = Number; CC = Clinical Classification.

29
Table 3-3. List of categorical variables.
Variable(s) Level Value Sex 1 Male
2 Female AGE CATEGORYa 1 18-24
2 25-44 3 45-64 4 65+
RACE/ETHNICITYb 1 White-non Hispanic
2 Black-non Hispanic 3 Hispanic 4 Other
REGION10 1 Northeast
2 Midwest 3 South 4 West
MSA10 1 Non-MSA
2 MSA POVCAT10 (Poverty Category)
1 Poor 2 Near poor 3 Low income 4 Middle income 5 High income
MARRY10X (Marital Status)
1 Married 2 Widowed/Divorced/Separated 3 Never Married
INSCOVc
(Insurance Coverage) 1 Uninsured 2 Dual Eligible 3 Medicare 4 Medicaid 5 Other Public 6 Private
SELFCM UNION SICPAY
1 Yes
2 No

30
Table 3-3. (Continued).
Variable(s) Level Value EMPST31/42/53 (Employment Status)
1 Currently employed 2 Has a job to return to 3 Employed during the reference period 4 Not employed with no job to return to
OCCCAT (Occupation Category)
1 Management, business, and financial operations 2 Professional and related occupations 3 Service occupations 4 Sales and related occupations 5 Office and administrative support 6 Farming, fishing, and forestry 7 Construction, extraction, and management 8 Production, Transportation, and material moving
HIDEG (Education)
1 No degree 2 GED/High school diploma 3 Bachelor’s degree 4 Master/PhD 5 Other degree
RTHLTH (Perceived Health Status)
1 Excellent 2 Very good 3 Good 4 Fair 5 Poor
CCIfreq (D’Hoore Adaptation of Charlson Comorbidity Index)d
0 Zero comorbidity 1 One comorbidity 2 Two comorbidities 3 Three or more comorbidities
Note: The levels reported for some categorical variables here, do not exactly match the levels originally provided in MEPS data files. For some variables, we had to combine two or more levels to summarize data, or to get enough sample size in each level. a This variable was constructed using the continues variable “AGELAST”; b This variable was constructed using “RACEX” and “HISPANX” variables; c This variable was constructed using the following variables: INS10X, INSCOV10, MCAID10X, MCARE10X, TRICR10X, OTPUBA10, OTPUBB10, STAPR10, and PUB10X; d This variable was constructed using ICD-9-CM cods, according to the conditions and weights listed in the D’Hoore adaptation of CCI. GED = Graduate Equivalency Degree; MSA = Metropolitan Statistical Area.

31
job (at the time of interview), or those who reported and identified a job to return to. So, If an individual had a current main job for at least one round in year (at least one of the round-level variables was equal to 1 or 2), then he/she was considered as being employed (EMPST=1).
Hours worked per week (HOUR), number of employees (NUMEMP), and hourly
wage (HRWG): Summery variable is equal to the mean of round-level variables.
Self- employment status (SELFCM): For employed individuals, If at least in one of the reported current main jobs, the person was self-employed, he/she is considered as self-employed (SELFCM=1).
BLS Data “The Bureau of Labor Statistics (BLS) is an independent national statistical agency that collects, processes, analyzes, and disseminates essential statistical data to the American public, the U.S. Congress, other federal agencies, state and local governments, business, and labor. The BLS also serves as a statistical resource to the Department of Labor.”51 Examples of information that BLS provides are: employment cost trends, national compensation data, wages by area and occupation, earnings by demographics, earnings by industry, employee benefits … The specific information collected from BLS is:
Weekly & Hourly Earnings:52 The BLS reports (median) weekly earnings by industry type, occupation type, sex, race, ethnicity, age, education level, class of worker and labor force status. This information is based on the Current Population Survey (CPS).The CPS is a monthly survey of households (the sample represents the civilian non-institutional population of the U.S.) conducted by the Bureau of Census for the BLS. It provides a comprehensive body of data on the labor force, employment, unemployment, persons not in the labor force, hours of work, earnings, and other demographic and labor force characteristics.
Labor Force Statistics:53 The data contains Labor Force Participation Rate (LFPR)
by age, race, and gender. This information is also based on the CPS.
Healthcare component of the Consumer Price Index(CPI) as well as CPI for all items: This information is available in the CPI Detailed Report Data for March 2013.54
NVSS Data The National Center for Health Statistics (NCHS) is a component of the Centers for Disease Control and Prevention (CDC), and “its mission is to provide statistical

32
information that will guide actions and policies to improve the health of the American people. To carry out its mission, NCHS conducts a wide range of annual, periodic, and longitudinal sample surveys and administers the National Vital Statistics Systems.”55 The NVSS collects data on vital events including births, deaths, marriages, and divorces in the United States. The researcher used the following reports to collect required data. Number of deaths due to anxiety disorders were extracted from the first three reports, while the fourth one was used to collect information on life expectancy.
Deaths, percent of total deaths, and death rates for the 15 leading causes of death in 5-year age groups, by race and sex: United States, 1999-2010.56
Deaths, percent of total deaths, and death rates for the 15 leading causes of death
in 10-year age groups, by Hispanic origin, race for non-Hispanic population and sex: United States, 2010.57
Deaths, percent of total deaths and rank order for 113 selected causes of death and
Enterocolitis due to Clostridium difficile, by Hispanic origin, race for non-Hispanic origin and sex, United States, 2010.58
Deaths: Final data for 2010.59
Analysis Technique In this section, the analysis technique for each specific aim of the study is explained. SA1: Estimating the Societal Cost of Anxiety Disorders for the U.S. Adult Population According to Equation 3-1, the societal cost of anxiety disorder(s) is equal to summation of its direct and indirect costs.
Total cost = Overall direct medical cost + Indirect cost (Eq. 3-1)
In the following sections, the methodology used to estimate each component of Equation 3-1 is explained. Overall direct medical cost. Overall direct medical cost incorporates costs due to prescription medications, office-based medical provider visits, inpatient visits, outpatient visits, ER visits, and other medical expenses. In this section, we explain the methodology used to estimate the overall direct medical costs due to anxiety disorders. Estimating direct medical cost by category of health service (SA2), is explained in the next section.

33
To estimate overall direct medical expenditures attributable to anxiety disorders, we used the incremental cost approach. This method, suggested by the AHRQ for estimating cost of illness with MEPS data, has been widely used by previous researchers.60-66 The incremental cost approach provides an estimate of disease-attributable expenses by calculating expenditures incurred by a disease population in excess of those incurred by a disease free population. This difference in expenses by the two populations represents the total cost of illness, including treatment expenses, as well as expenses related to complications of the disease and its comorbidities.65 To adjust for potential differences in socioeconomic and clinical characteristics of the two populations, which are considered to have an impact on cost, a multivariate regression analysis is conducted. As such, this approach estimates expenditures solely associated with the disease of interest.64 To estimate direct medical costs associated with anxiety disorders, first an appropriate multivariate regression analysis needed to be developed to explain healthcare costs through a set of explanatory variables. The outcome variable of the model was the overall healthcare expenditure. Expenditure (cost) refers to what is actually paid for healthcare services and is defined as the sum of direct payments by different sources such as out-of-pocket payments, as well as payments by private insurance, Medicaid, and Medicare. Expenditures are more accurate than charges for cost estimation purposes. Charges vary from what is actually paid, due to uncollected liability, bad debt, charitable care, and implementing contract negotiations.46 The main explanatory variable of the model was a disease- indicator variable, indicating whether each individual in the sample suffered from anxiety disorder(s) or not. Other covariates of the model were respondents’ gender, age, race/ethnicity, marital status, education, poverty category, geographic region, metropolitan statistical area (MSA), perceived health status (PHS), health insurance coverage, and the D’Hoore adaptation of Charlson Comorbidity Index (CCI). The D’Hoore adaptation of CCI controls for 17 medical conditions which are myocardial infarct, congestive heart failure, peripheral vascular disease, cerebrovascular disease, dementia, chronic pulmonary disease, connective tissue disease, ulcer disease, mild liver disease, hemiplegia, moderate or severe renal disease, diabetes , any tumor, leukemia, lymphoma, moderate or severe liver disease, and metastatic solid tumor.67 These covariates were selected based on the literature review and the availability of data in MEPS. After developing and running the regression model, the estimated coefficients of the model were used to calculate two predicted expenses for each individual. The first predicted expenses assumed the individual had anxiety disorder(s) (by setting the disease-indicator variable to one), and the second predicted expenses assumed the individual was anxiety-free (by setting the disease-indicator variable to zero). The average per-person increase in medical expenses attributable to anxiety disorders was calculated by taking the difference in predicted expenses for each person and computing the weighted average of the difference across the entire sample. Finally, the average per-person increase in expenses was multiplied by the weighted number of individuals with anxiety disorders in the sample, to get the total medical cost of anxiety disorders.

34
In modeling healthcare cost data, the specific distributional characteristics of the data must be taken into consideration. These characteristics are: (1) non-negative observations; (2) excessive zero (i.e. there are a large number of individuals with zero cost); and (3) highly skewed data (i.e. the majority of cost is incurred by a few patients).68 These characteristics make traditional Ordinary Least Square (OLS) regression inefficient in modeling healthcare cost data. Alternatively, OLS with natural log-transformed cost has been widely used to deal with heavily skewed data. However, this approach has some limitations as well.68 First, the outcome variable is the logarithm of cost. So in order to draw useful conclusions about the cost, the predicted values need to be retransformed back to the original scale. While retransforming the outcome variable, by using smearing factor, seems straightforward, interpretation of parameter estimates may still be challenging. Second, in the presence of heteroskedasticity, using one smearing factor to retransform the predicted values leads to biased estimates, i.e. under-estimation or over-estimation of the actual cost. In such scenarios, a Generalized Linear Model (GLM), with appropriate variance and link functions, is more efficient to model cost data. GLM directly models both the variance and mean functions on the original scale of dependent variable. As such, results can be interpreted with no need for retransformation from log scale to the original scale.68 “The mean function, E(y|x) is represented as μ(x β), where μ is the inverse link between the expectation of the observed raw-scale y and the linear predictor x β.”68(p. 529) The link function generally used with healthcare cost data is the log-link function.68 “Then μ is the exponential function. A commonly used family of variance functions includes the power functions of the form v(x) = (μ(x β))λ.”68(p. 529) The specific type of variance functions depends on the value of λ. for instance, if the λ is equal to 1 it means that variance is proportional to meant. So, it would be a Poisson like model If the λ is equal to 2, it means that variance is proportional to mean squared, as in a Gamma-like model.68 In order to find out which type of regression model was most appropriate for our data, several diagnostics tests needed to be performed. First of all, we needed to find the distribution of cost data to see if data was really skewed or not. Then, appropriateness of using OLS regression with log-transformed data needed to be examined. This was achieved by conducting the Breusch-Pagan/Cook-Weisberg test for heteroskedasticity. One of the assumption of OLS is that variance of error terms (εj) should be constant (εj =
2; for all j). If this assumption is violated, i.e. when heteroskedasticity is present, OLS estimates are no longer the best linear unbiased estimator (BLUE). One of the major consequences of heteroskedasticity is biased standard errors, in which leads to biased inference, so results of hypothesis tests are possibly wrong. The Breusch-Pagan/Cook-Weisberg test for heteroskedasticity tests the linear heteroskedasticity.69 Their null and alternative hypotheses are as follows: H0: error variances are all equal H1: error variances are a multiplicative function of one or more variables In the case that heteroskedasticity was present; we needed to conduct a Park test to see which variance function was more appropriate to be used in the context of GLM. Park test was first introduced by Park in 1966, and its use is suggested in estimation of

35
the relationship between the mean and the variance.68,70 In this regard, “the squared residuals from a provisional model (GLM or log-transformed OLS) should be regressed on the predictions (ŷ) from the same model, both log transformed.”68(p. 531) Equation 3-2 shows the regression model for Park test:
ln ((yi- ŷi)2) = λ0 + λ1 ln (ŷi) + I (Eq. 3-2) Source: untin MB, Zaslavsky AM. Too much ado about two-part models and transformation?: Comparing methods of modeling Medicare expenditures. Journal of Health Economics. 5// 2004;23(3):525-542. Morbidity cost. Indirect cost due to productivity loss (morbidity cost), have been measured using the Human Capital Approach (HCA). In the HCA, productivity loss due to an illness or injury is approximated by valuing the entire period of absence from work by average individual’s earning. Equation 3-3 shows the formula used to estimate the morbidity cost due to anxiety disorders:
Morbidity Cost (Eq. 3-3)
Where: N = Total number of individuals in the sample. Wti = Person weight for the ith individual in the sample. Wgi = Daily wage for employed individuals and average daily wage for household services if the individual is not employed. ni = Number of missed work days (due to anxiety disorders) for employed individuals and number of days stayed in bed (due to anxiety disorders) for unemployed individuals. Nanx = Weighted number of individuals in the sample with anxiety disorder(s). For individuals who were at paid employment for at least on round in year, information on wage rates are available in the MEPS (in both Consolidated Data file and Job file). For unemployed individuals, the period in which they had to stay in bed due to an illness or injury was valued by average wage for private household services. Industries in the private households are defined as those “engage in employing workers on or about the premises in activities primarily concerned with the operation of the household. These private households may employ individuals, such as cooks, maids, butlers, and outside workers, such as gardeners, caretakers, and other maintenance workers.”71 Average wage for private household services was obtained from the BLS. Information on number of missed-work-days for employed individuals, (and number of days an unemployed person had to stay in bed) due to each particular condition, is not available in MEPS. Instead, MEPS collects this information for all medical conditions an individual might have had in the survey year. So, we needed to find out what portion of missed-work-days (variable WKINBD in MEPS consolidated data file) and bed days (variable DDBDYS) were due to anxiety disorders. In this regard, researcher used the same approach used to estimate the incremental cost. In other words,

36
two separate multivariate regression analyses were conducted to estimate the incremental number of missed work days/ bed days due to anxiety disorders. This approach has been used by Akazawa, Sindelar, and Paltiel in their research on estimating the productivity loss due to Influenza related illnesses.72 Outcome variables and the initial set of covariates for estimating the incremental number of work days/ bed days due to anxiety disorders are provided in Table 3-4. These covariates have been selected based on the relevant literature and availability of data in MEPS. After developing and running regression models, the estimated coefficients of each model were used to calculate two outcomes for each individual. The first predicted outcome assumed the individual had anxiety disorder(s) (by setting the disease-indicator variable to one), and the second predicted outcome assumed that the individual was anxiety-free (by setting the disease-indicator variable to zero). The per-person increase in number of missed work days/ bed days attributable to anxiety disorders were calculated by taking the difference in predicted outcomes for each person. Morbidity cost for each individual in the study sample (per-person morbidity cost) was calculated by multiplying the predicted outcome (i.e. predicted number of missed work days due to anxiety disorders if the person was employed, and predicted number of bed days due to anxiety disorders if the person was not employed), by the average daily wage of that person. Table 3-4. Outcome variables and the initial set of covariates for estimating the incremental number of missed work days/ bed days due to anxiety disorders.
Regression model
Outcome variable
Sample for regression
analysis Initial set of covariates
Model 1 WKINBD Employed individuals in the study population (excluding self-employed persons)a
anx,b gender, race/ethnicity, age, marital status, education, poverty category, insurance coverage, MSA, region, CCI, number of employees, sick-pay, union status, occupation category
Model 2 WKINBD Unemployed individuals
in the study population anx, gender, race/ethnicity, age, marital status, education, poverty category, insurance coverage, MSA, region, CCI.
a Self-employed individuals were excluded, since information such as sick-pay benefit is not available for them. b anx represents the disease indicator variable. MSA = Metropolitan Statistical Area, CCI = Charlson Comorbidity Index.

37
Average morbidity cost was estimated by taking the weighted mean of per-person morbidity cost across the entire study sample. Finally, this average per-person cost was multiplied by the weighted number of individuals with anxiety disorders in the sample to get the total morbidity cost associated with anxiety disorders. Mortality cost. Mortality cost is productivity loss due to premature deaths. In a prevalence-based cost of illness study, productivity losses are “calculated for all patients who die or become permanently disabled in the study year for that year and each year until the expected age of death.”3(p. 9) In the HCA, mortality cost is the present value of future earnings, from age of death to life expectancy. Lost future earnings due to a medical condition can be estimated knowing the total number of deaths due to that condition, and average annual wages of deceased individuals from the year they died to their life expectancies. In calculating mortality cost, it is assumed that “people will be working and productive during their expected lifetime in accordance with the current pattern of work experience”73(p. 283) (for their age/sex/race cohort). So, no assumption needed to be made about the employment rate among deceased individuals. The researcher instead allowed the actual employment experience of each age/sex/race cohort inform the calculations. The estimated lifetime earnings (in present value terms) of a 25 year old White woman would not be the same as that of a 40 year old Black man, in part because of different LFPRs of these two cohorts. The LFPR in the BLS data already accounts for that source of difference, so no further explicit assumption or adjustment needed to be made to recognize the importance of this factor. LFPR is defined as the ratio of the civilian non-institutionalized population who are in labor force by the civilian non-institutionalized population who are eligible to be in labor force. Another point to consider is that wages usually increase as individuals get more experienced. So, average annual wage at time of death should be inflated to consider this growth. According to BLS, 12-month increase in wages and salaries for the first quarter of 2013 was equal to 1.6%.74 So, we assumed an increase of 1.6% in annual wages too. Future annual earnings should then be discounted by an appropriate discount rate. The most common discount rate used in the relevant literature is 3%, which is recommended by the Panel on Cost Effectiveness in Health and Medicine.75 Current value of future earnings should be calculated for all individuals who died due to the medical condition, in the period of study, and then added up to get the mortality cost. In the case of anxiety disorders, the researcher needed to know the number of suicides due to this medical condition. It has been shown that 10% of suicides are due to anxiety disorders.5,10 So, we multiplied the total number of suicides buy 10% to get the number of deaths.
The formula used to estimate the mortality cost associated with anxiety disorders is shown in Equation 3-4.
(Eq. 3-4)

38
Where: MTC = Mortality cost for individuals who committed suicide due to anxiety disorders in the period of study. Ad= Age of death Le= Life expectancy at age of death by race and gender. Li= Labor force participation rate by gender and race at age i. W= Average annual wage by gender and race at age of death. r = Discount rate SA2: Estimating the Incremental Direct Medical Expenditures Associated with Anxiety Disorders by Service Category Incremental direct medical expenditures associated with anxiety disorders for different healthcare delivery settings were also estimated using the incremental cost approach. We followed the exact same procedure used for estimating the overall incremental cost. More specifically, several multivariate regression analyses were developed to separately model inpatient visits expenditure, outpatient visits expenditure, emergency room visits expenditure, prescription medications expenditure, office-based visits expenditure, and other medical expenses. So for each model, the dependent variable was the cost category of interest. Regression analyses were conducted on all individuals in the study sample. For all models, the same set of covariates was used. The main independent variable of the models was the anxiety indicator variable (yes/no). Other covariates included respondents’ gender, age, race/ethnicity, marital status, education, poverty category, geographic region, metropolitan statistical area (MSA), perceived health status (PHS), health insurance coverage, and the D’Hoore adaptation of Charlson Comorbidity Index (CCI). SA3: Estimating the Incremental Direct Medical Expenditures Associated with Anxiety Disorders for Different Sub-populations Incremental direct medical expenditures associated with anxiety disorders were estimated for different sub-populations, using the incremental cost approach. These sub-populations were defined based on gender, age, race/ethnicity, marital status, education, poverty category, region, MSA, and insurance coverage. Several multivariate regression analyses were conducted to separately model overall healthcare cost for each group of individuals. The dependent variable in all models was the overall healthcare cost. To estimate the cost in each group, the regression analysis was conducted on that sub-population only and therefore, the covariate identifying that sub-population was excluded from the regression model. For instance, to estimate the incremental cost of anxiety disorders among males, the regression analysis was conducted on males, excluding gender from covariates of the model.

39
We broke down the costs among Blacks and Whites even further by gender, age, and geographic region (as you will see in the next chapter, cost of anxiety disorders was not statistically significant for Hispanics. So, there was no point in looking at the cost of anxiety disorders for Hispanics). The specific sub-populations in which incremental costs of anxiety disorders were estimated for, along with covariates of each model are provided in Table 3-5. General Notes For direct medical costs, all dollar amounts have been presented in 2013 dollars, using the healthcare component of the CPI (for all urban consumers). Also, for morbidity and mortality costs, all dollar amounts have been presented in 2013 dollars, using the CPI (for all urban consumers), for all items. The formulas used to present cost data from 2009/2010 dollars to 2013 dollars are provided below:
$2009 * (CPI2013 / CPI2009) = $2013 $2010 * (CPI2013 / CPI2010) = $2013
Where: $2009 = Cost in 2009 dollars. $2010 = Cost in 2010 dollars. $2013 = Cost in 2013 dollars. For direct medical cost: CPI2009 = Healthcare Component of CPI for the year 2009 = 379.51654 CPI2010 = Healthcare Component of CPI for the year 2010 = 391.04654 CPI2013 = Healthcare Component of CPI for the year 2013 = 424.15454 For morbidity and mortality costs: CPI2009 = CPI for all items for the year 2009 = 212.70954 CPI2010 = CPI for all items for the year 2010 = 217.63154 CPI2013 = CPI for all items for the year 2013 = 232.77354 All statistical analyses were conducted using SAS software version 9.3 (SAS Institute, Cary, NC)76 and STATA software version 12.77 All analyses accounted for the complex survey design of MEPS to obtain national-level estimates. Furthermore, subpopulation analysis was conducted to generate results for individuals 18 years and older. Thereby, all results are projected to the ambulatory adult population of the U.S. The p-value threshold was set at 0.05 to determine statistical significance of two-tailed tests.

40
Table 3-5. Sub-populations along with model specifications.
Covariates
Sub-population Levelsa
Gender
Age
Race/E
thnicity
Marital status
Education
Poverty cat
Region
MSA
Health Ins
PHS
CC
I
Gender Males, Females Age in years 18-24, 24-44, 45-46, 65+ Race/ethnicity White-non-Hispanic, Black-non Hispanic Marital Status Married, Previously Married, Never married, Education None, GED/High School Diploma, Bachelor, Master/PHD Poverty Category Poor, Near poor, Low income, Middle income, High income Region Northeast, Midwest, South, West MSA Non-MSA, MSA Insurance Coverage Uninsured, Dual Eligible, Medicaid, Medicare, Other public,
private only
Race*Gender White-Male, White-Female, Black-Male, Black-Female Rage*Age White- 18 to 44, White 45 &more, Black 18 to 44, Black 45 &
more
Race*Region White-Northeast, White-Midwest, White-South, White-West Black-Northeast, Black-Midwest; Black-South, Black-West
Race*Gender*Age White – Male- 18 to 44, White – Male- 45 & more White – Female- 18 to 44, White – Female- 45 & more Black – Male- 18 to 44, Black – Male- 45 & more Black – Female- 18 to 44, Black – Female- 45 & more
a To estimate cost for each sub-population, sample includes individuals in that population only; PHS = Perceived Health Status; MSA = Metropolitan /statistical Area, CCI = Charlson comorbidity Index; GED = Graduate Equivalency Degree.

41
CHAPTER 4. RESULTS Results of the current research are provided in this chapter. The first section provides descriptive statistics for the study population. In the second section, results of estimating direct medical costs associated with anxiety disorders are presented. Morbidity and mortality costs attributable to anxiety disorders are provided in third and fourth sections, respectively. Finally, summary of results, i.e. societal cost of anxiety disorders, is reported. Throughout this chapter, all dollar amounts are presented in 2013 dollar values, unless otherwise is specified
Descriptive Statistics Prevalence of Self-reported Anxiety Disorders in MEPS From the total survey respondents in 2009-2010 (n = 66,148), 46,572 (weighted sum = 228,987,954) were adults with positive person weights and non-missing values on all of the independent variables, and were included in the final analysis. In 2009-2010 MEPS survey, 8.74% (weighted sum = 20,337,553) of adults (95% CI: 8.32% to 9.17%) reported being diagnosed with an anxiety disorder(s). The remaining 91.26% were considered as anxiety-free population. Characteristics of the Study Population Table 4-1 compares demographic characteristics of individuals with and without anxiety disorder(s) in the study population. Compared to adults with no anxiety disorder, those who have been diagnosed with this condition were more likely to be female (66.15% versus 50.15%; p < 0.001), White-non Hispanic (79.87% versus 66.77%; p < 0.001), in the age group of 45 to 64 (40.74% versus 34.19%; p < 0.001), and have one or more comorbidities (36.48% versus 27.98%; p < 0.001). Alternatively, they were less likely to lack insurance (15.30% versus 20.77%; p < 0.001). Also, the mean ± SE of CCI score was significantly higher at 0.82 ± 0.03, for sufferers of anxiety, compared to adults without anxiety disorders at 0.51 ± 0.01. We also compared the two populations based on the 17 comorbidities used in the D’Hoore adaptation of the CCI (Table 4-2). In comparison with the anxiety-free population, adults with anxiety disorders were more likely to have congestive heart failure (1.49% versus 0.94%; p = 0.004), peripheral vascular disease (1.96% versus 1.28%; p = 0.020), dementia (0.95% versus 0.53%; p = 0.034), chronic pulmonary disease (16.02% versus 8.55%; p < 0.001), connective tissue disease (5.19% versus

42
Table 4-1. Comparison of demographic characteristics between adults with and without anxiety disorders.
Adults (unweighted n=47,388)a
Anxiety disorder(s) (unweighted n=3,610)a No anxiety disorder
(unweighted n=43,778)a
Characteristics % 95% CI % 95% CI p-value Gender < 0.001*
male 33.85 32.10-35.59 49.85 49.29-50.42 female 66.15 64.41-67.90 50.15 49.58-50.72
Age in years < 0.001* 18-24 8.61 7.18-10.30 13.22 12.65-13.79 25-44 34.30 31.76-36.84 34.97 33.97-35.98 45-64 40.74 38.55-42.94 34.19 33.32-35.07 65 and Older 16.35 14.58-18.13 17.61 16.74-18.49
Race/ethnicity < 0.001* White non-Hispanic 79.87 77.82-81.92 66.77 64.88-68.65 Black non-Hispanic 6.97 5.88-8.06 11.92 10.64-13.21 Hispanic 8.99 7.63-10.36 14.41 12.78-16.04 Other non-Hispanic 4.17 3.25-5.09 6.90 5.88-7.92
Marital Status < 0.001* Married 47.02 44.36-49.68 53.80 52.70-54.91 Previously Marriedb 29.49 27.19-31.80 19.13 18.29-19.96 Never Married 23.48 21.17-25.79 27.07 26.24-27.90
Education < 0.001* No Degree 13.09 11.75-14.42 15.88 15.09-16.67 GED/High School Diploma 52.75 50.21-55.28 48.45 47.50-49.40 Bachelor 17.60 15.79-19.41 18.10 17.27-18.94 Master/PhD 7.10 5.83-8.38 9.41 8.71-10.12 Other Degree 9.46 8.06-10.87 8.16 7.68-8.63

43
Table 4-1. (Continued).
Adults (unweighted n=47,388)a
Anxiety disorder(s) (unweighted n=3,610)a No anxiety disorder
(unweighted n=43,778)a
Characteristics % 95% CI % 95% CI p-value Poverty Category < 0.001*
Poor 16.53 14.87-18.20 12.18 11.46-12.89 Near Poor 4.07 3.24-4.89 4.37 4.06-4.67 Low Income 13.35 11.78-14.93 13.47 12.83-14.12 Middle Income 32.09 30.18-34.00 30.25 29.42-31.08 High Income 33.96 31.33-36.58 39.73 38.36-41.10
Region < 0.001* Northeast 18.34 15.74-20.95 18.48 17.06-19.91 Midwest 25.54 23.15-27.94 21.41 20.11-22.71 South 31.38 28.55-34.20 37.14 35.42-38.87 West 24.74 22.42-27.06 22.97 21.44-24.49
MSA 0.901 Non-MSA 16.00 12.62-19.38 15.85 13.35-18.35 MSA 84.00 80.62-87.38 84.15 81.65-86.66
Insurance Coverage < 0.001* Uninsured 15.30 13.53-17.06 20.77 19.72-21.81 Dual eligiblec 4.57 3.59-5.55 2.08 1.84-2.31 Medicaid 10.15 8.73-11.58 5.59 5.07-6.11 Medicare 18.32 16.44-20.20 16.94 16.09-17.79 Other Public 1.89 1.25-2.53 1.86 1.59-2.13 Private 49.76 47.33-52.20 52.77 51.47-54.06
CCI Score [mean (SE)] 0.82 (0.03) 0.51(0.01) <0.001* CCI Score (%) <0.001*
Zero Comorbidity 63.52 61.39-65.66 72.02 71.25-72.79 One Comorbidity 23.93 22.08-25.78 20.18 19.67-20.78

44
Table 4-1. (Continued). Adults (unweighted n=47,388)a
Anxiety disorder(s) (unweighted n=3,610)a No anxiety disorder
(unweighted n=43,778)
Characteristics % 95% CI % 95% CI p-value Two Comorbidity 8.74 7.56-9.92 5.63 5.29-5.97 Three or More 3.81 3.02-4.60 2.17 1.95-2.39
Notes: Unweighted numbers represent number of individuals in the sample, while weighted numbers represent projected number of individuals (i.e. national-level estimates), after controlling for the complex survey design of MEPS. CI = Confidence Interval; GED = Graduation Equivalency Degree; MSA = Metropolitan Statistical Area; CCI = Charlson Comorbidity Index; SE = Standard Error. a Sample estimates projected to 232,782,004 adults, among which 20,337,553 were classified as anxiety patients and the remaining 212,444,451 were considered as anxiety-free population. b Previously married refers to divorced, separated or widowed individuals. c Dual eligible refers to individuals who are entitled to Medicare Part A and/or Part B and also meet the eligibility requirements for Medicaid, therefore are enrolled in both programs. * p < 0.05, two-tailed.

45
Table 4-2. Comparison of CCI clinical conditions between anxiety and non-anxiety patients.
Adults (unweighted n=47,388)a
Anxiety disorder(s)
(unweighted n=3,610)a No anxiety disorder (unweighted n=43,778)a
Comorbidities % 95% CI % 95% CI p-value Myocardial infarction 3.31 2.51-4.10 2.92 2.65-3.18 0.318 Congestive heart failure 1.49 1.02-1.96 0.94 0.79-1.09 0.004* Peripheral vascular disease 1.96 1.34.2.57 1.28 1.12-1.44 0.020* Dementia 0.95 0.51-1.40 0.53 0.40-0.66 0.034* Cerebrovascular disease 0.28 0.02-0.55 0.18 0.11-0.25 0.381 Chronic Pulmonary disease 16.02 14.30-17.74 8.55 8.08-9.01 <0.001* Connective tissue disease 5.19 4.30-6.07 2.93 2.65-3.21 <0.001* Ulcer disease 0.91 0.55-1.26 0.43 0.32-0.54 0.002* Mild liver disease 0.74 0.41-1.07 0.48 0.38-0.57 0.058 Hemiplegia 3.04 2.29-3.79 2.18 1.94-2.41 0.009* Moderate or severe renal disease 0.59 0.27-0.90 0.39 0.28-0.48 0.163 Diabetes 12.24 10.93-13.54 10.78 10.28-11.28 0.032* Any tumor 7.06 5.87-8.26 6.10 5.69-6.52 0.110 Leukemia 0.11 0.00-0.25 0.15 0.09-0.21 0.621 Lymphoma 0.19 0.02-0.36 0.25 0.18-0.33 0.532 Moderate or severe liver disease 0.26 0.06-0.46 0.30 0.21-0.38 0.759 Metastasis solid tumor 0.65 0.34-0.97 0.45 0.36-0.54 0.168
a Sample estimates projected to 232,782,004 adults, among which 20,337,553 were classified as anxiety patients and the remaining 212,444,451 were considered as anxiety-free population. * p < 0.05, two-tailed. Source: D'Hoore W, Bouckaert A, Tilquin C. Practical considerations on the use of the Charlson comorbidity index with administrative data bases. J Clin Epidemiol. Dec 1996;49(12):1429-1433.

46
2.93%; p < 0.001), ulcer disease (0.91% versus 0.43%; p = 0.002), hemiplegia (3.04% versus 2.18%; p = 0.009), and diabetes (12.24% versus 10.78%; p = 0.032).
Direct Medical Costs Attributable to Anxiety Disorders Preliminary Statistical Analyses As it was mentioned in chapter 3, direct medical costs associated with anxiety disorders were estimated using the incremental cost approach. In this regard, several multivariate regression analysis were conducted to separately model overall healthcare expenditure, inpatient visits expenditure, outpatient visits expenditure, emergency room visits expenditure, prescription medications expenditure, office-based medical visits expenditure, and other medical expenses. However, we first needed to find the set of covariates for regression models, as well as the type of regression analyses used to model healthcare cost data. As such, the following preliminary analyses were conducted. Checking for multicollinearity. As it was mentioned in chapter 3, an initial set of variables, based on the relevant literature and availability of data in MEPS, was selected to be included in all regression analyses. However, in the presence of strong multicollinearity between two or more covariates of a model, predictions may be biased. In such cases, either some covariates should be excluded from the model, or those with high collinearity should be combined into a new single index Variance Inflation Factor (VIF) is highly being used by researchers to identify multicollinearity. VIF simply measures how much a variable is contributing to the standard error in the regression. If there is severe multicollinearity between two or more variables in a model, the variance inflation factor will be very large for those variables. The general rule of thumb to identify multicollinearity is to use the cut point of 10 for VIF.78 That is, if the VIF for a particular variable is higher than 10, that variable should either be excluded from the model or be combined with other variables with high VIFs. Some researchers though find the cut point of 10 to be very conservative and instead go with lower cut points such as 3 or 4.78 The VIF cut point of 4 was selected in this study. In order to find out if there is multicollinearity in our data, we run an OLS regression and asked for the VIF to be displayed in the output. The results are shown in Table 4-3. According to Table 4-3, the mean VIF for the set of covariates is equal to 2.03. Also; the majority of independent variables have VIFs less than 4. The only variables with high VIFs are age 65 to 85 (VIF=7.48), and Medicare (VIF=5.71). It means that there is possibly a high collinearity between these two variables (people 65 years and older are more likely to be enrolled in Medicare). However, we still can’t say that there is a severe collinearity between these two variables, since neither of the VIFs exceeds 10. Also, we cannot eliminate any of these two variables since they are all specific levels of other categorical variables (age and insurance). Finally, insurance coverage and age are shown to have significant impact on healthcare cost.79-83 Taking all these into account and after consulting with the biostatistician expert of the project,

47
Table 4-3. Results of regression analysis to check for multicollinearity.
Variable VIF Variable VIF No anxiety disordera Poora
Anxiety disorders 1.06 Low income 1.70 Malea Middle Income 2.39
Female 1.05 High income 2.87 Age 18 to 24a Uninsureda
Age 25 to 44 3.09 Dual eligible 1.72 Age 45 to 64 3.67 Medicaid 1.34 Age 65 and more 7.48 Medicare 5.71
Whitea Other public insurances 1.08 Black 1.32 Private insurance only 2.01 Hispanic 1.57 Northeasta Other 1.18 Midwest 1.88
Marrieda South 2.23 Previously married 1.27 West 2.08 Never married 1.73 Non MSAa
No Degreea MSA 1.09 GED/high school diploma 1.90 Excellent PHSa Bachelor 1.87 Very good PHS 1.63 Master/PhD 1.53 Good PHS 1.72 Other degree 1.37 Fair PHS 1.56
Poora Poor PHS 1.30 Near poor 1.27 Charlson Comprbidity Index 1.34
Note: Mean VIF = 2.03. a Reference Category. VIF = Variance Inflation Factor.

48
we decided to keep all covariates in the model. Finding the distribution of cost data. In modeling healthcare cost data, the specific distributional characteristics of the data must be taken into consideration. These characteristics are: (1) non-negative observations; (2) excessive zero (i.e. there are a large number of individuals with zero cost); and (3) highly skewed data (i.e. the majority of cost is incurred by a few patients).68 These characteristics make traditional Ordinary Least Square (OLS) regression inefficient in modeling healthcare cost data. Figure 4-1 shows the distribution of overall healthcare cost for the study population. As it was expected, healthcare cost data is highly skewed. So, OLS regression could not be used to model this type of data. Alternatively, OLS with natural log-transformed cost data has been widely used to deal with heavily skewed data. However, this approach has some limitations as well.68 First, the outcome variable is the logarithm of cost. So in order to draw useful conclusions about the cost, the predicted values need to be retransformed back to the original scale. While retransforming the outcome variable, by using smearing factor, seems straightforward, interpretation of parameter estimates may still be challenging. Second, in the presence of heteroskedasticity, using one smearing factor to retransform the predicted values leads to biased estimates, i.e. under-estimation or over-estimation of the actual cost. Figure 4-2 depicts the distribution of the log-transformed overall cost for the study population. As it is shown in this figure, log-normal distribution is a perfect fit to our data and therefore, OLS with log-transformed cost data seems to be an appropriate regression model. However, we still needed to check for heteroskedasticity in log-transformed data. Table 4-4 shows the result of Breusch-Pagan / Cook-Weisberg test for heteroskedasticity. According to this result, error terms have non-constants standard deviation. In other forms, heteroskedasticity is present with log-transformed data. So, OLS regression with log-transformed cost data was also ruled out. In such scenarios, a Generalized Linear Model (GLM), with appropriate variance and link functions, is more efficient to model cost data. GLM directly models both the variance and mean functions on the original scale of dependent variable. As such, results can be interpreted with no need for retransformation from log scale to the original scale.68 The link function generally used with healthcare cost data is the log-link function.68 In order to identify the appropriate variance function, a Park test was conducted. Result of this test, which is shown in Table 4-5, suggested that both Poisson and Gamma variance function might be appropriate for our data. We modeled overall healthcare cost data once using log-link GLM with Poisson distribution and then with log-link GLM with Gamma distribution These two models were compared based on (1) correlation between the predicted and observed expenditures (to see how well predictions of each model matched the observed data), and (2) mean squared error (as a summary of overall goodness of fit for each model). The comparison is shown in Table 4-6. Finally, a log-link GLM with Poisson distribution was selected as the best fitting model for modeling the overall healthcare expenditure, as well as all categories of expenditure.

49
Figure 4-1. Distribution of the overall healthcare cost for the study population. Mu = Mean, Sigma = Standard Deviation.

50
Figure 4-2. Distribution of the log-transformed overall healthcare cost for the study population. Mu= Mean, Sigma=Standard Deviation, totlog=log-transformed overall cost.

51
Table 4-4. Results of the Breusch-Pagan/Cook-Weisberg test for heteroskedasticity.
Variable Chi-square P-value totlog 360.07 < 0.0001*
Note: The null hypothesis in the Breusch-Pagan / Cook-Weisberg test is that all error terms have constant variance. Since the P-value is less than 0.05, we reject the null hypothesis. In other words, heteroskedasticity is present. totlog = log-transformed overall cost. Table 4-5. Results of Park test.
Parameter estimate (λ) SE 95% CI p-value 1.64 0.01 1.61-1.66 < 0.0001*
Note: Since the parameter estimate for the λ is between 1 and 2, it means that both Poisson variance function (λ=1), and Gamma variance function (λ=2) could be appropriate candidates. SE = Standard Error, CI = Confidence interval. * p < 0.05, two-tailed. Table 4-6. Comparison of Poisson and Gamma variance functions.
Variance function
Correlation between predicted and observed values
Mean square error (MSE)
Poisson 0.39 1.19e+08 Gamma 0.34 2.07e+08

52
After deciding on the best fitting regression model, several multivariate regression analyses were conducted to separately model overall healthcare expenditure, inpatient visits expenditure, outpatient visits expenditure, emergency room visits expenditure, prescription medications expenditure, office-based medical visits expenditure, and other medical expenses. Results are provided in the following sections. Overall Incremental Direct Medical Expenditure Attributable to Anxiety Disorders Table 4-7 shows the result of regression analysis to estimate the overall incremental direct medical expenditure attributable to anxiety disorders. After controlling for gender, age, race/ethnicity, marital status, education, poverty category, geographic region, MSA, PHS, health insurance coverage, and the CCI, adults with anxiety disorders had 33% higher overall medical expenditure than those without anxiety disorders (parameter estimate: 1.33; p < 0.001). The adjusted annual overall incremental medical expenditure associated with anxiety disorders was estimated at $1657.52 per person (SE: $238.83; p < 0.001).The total annual incremental direct medical expenditures attributable to anxiety disorders, for the U.S. ambulatory adult population, is at $33.71 billion in 2013 US dollars. This figure was obtained by multiplying the per-capita incremental cost of anxiety ($1657.52) by the national estimated prevalence of anxiety disorders in MEPS (20.34 million persons). Incremental Direct Medical Expenditure by Health Delivery Setting (SA2) Results from individual regression models of the incremental expenditure attributable to anxiety disorders, by service category, are described in Table 4-8. The adjusted annual incremental medical expenditure associated with anxiety disorders by health service category are as follow: Inpatient care, estimated at $567.83 (SE: 176.65, p = 0.001) accounted for the largest proportion of the overall medical expenditures. Prescription medications at $531.83 (SE: 64.34; p < 0.001) accounted for the second largest proportion of the overall expenditures, followed by office-based medical provider visits at $362.41(SE: 79.58, p < 0.001). Although statistically significant, emergency room visits and other medical expenses together explained less than 8% of the overall medical expenditure. These cost categories were estimated at $37.02 (SE: 18.28; p = 0.043) and $80.85 (SE: 38.87, p = 0.038), respectively. Cost of outpatient visits estimated at $42.52 (SE: 54.69; p = 0.437), was not statistically significant. Incremental Direct Medical Expenditure for Different Sub-populations (SA3) In order to estimate the incremental direct medical expenditures associated with anxiety disorders for different sub-populations (based on gender, age, race/ethnicity, marital status, education, poverty category, region, MSA, and insurance coverage), separate multivariate regression analyses (GLM with Poisson distribution and log-link function) were conducted. To estimate the costs in each sub-population, the regression

53
Table 4-7. Results of regression analysis to estimate the overall incremental direct medical expenditure associated with anxiety disorders.
Parameter Parameter estimate SE 95% CI p-value
No anxiety disorderb Anxiety disorders 1.33 0.05 1.24-1.43 < 0.001
Maleb Female 1.17 0.03 1.11-1.24 < 0.001
Age 18 to 24b Age 25 to 44 1.08 0.06 0.97-1.21 0.174 Age 45 to 64 1.51 0.09 1.34-1.71 < 0.001 Age 65 and Older 1.33 0.11 1.13-1.57 0.001
Whiteb Black 0.94 0.04 0.88-1.02 0.113 Hispanic 0.74 0.03 0.68-.80 < 0.001 Other 0.71 0.04 0.64-0.78 < 0.001
Marriedb Previously marriedc 0.99 0.03 0.93-1.06 0.873
Never married 0.91 0.04 0.84-0.98 0.016 No Degreeb
GED/high school diploma 1.17 0.05 1.07-1.27 0.001
Bachelor 1.39 0.08 1.25-1.55 < 0.001 Master/PhD 1.42 0.09 1.26-1.61 < 0.001 Other degree 1.25 0.08 1.11-1.41 < 0.001
Poorb Near poor 0.93 0.05 0.83-1.05 0.238 Low income 1.02 0.05 0.93-1.12 0.689 Middle Income 1.02 0.05 0.93-1.12 0.687 High income 1.16 0.06 1.04-1.30 0.006
Uninsuredb Dual eligibled 3.63 0.35 3.00-4.40 < 0.001 Medicaid 2.28 0.17 1.97-2.63 < 0.001 Medicare 2.92 0.23 2.50-3.41 < 0.001 Other public 2.10 0.18 1.77-2.50 < 0.001 Private 1.93 0.12 1.71-2.17 < 0.001
Northeastb Midwest 1.04 0.05 0.96-1.14 0.345 South 0.94 0.04 0.86-1.02 0.136 West 0.99 0.04 0.91-1.08 0.759

54
Table 4-7. (Continued).
Parameter Parameter estimate SE 95% CI p-value
Non MSAb MSA 1.14 0.04 1.06-1.23 0.001
Excellent PHSb Very good PHS 1.36 0.06 1.25-1.49 < 0.001 Good PHS 2.02 0.09 1.86-2.20 < 0.001 Fair PHS 3.12 0.18 2.78-3.51 < 0.001 Poor PHS 4.50 0.32 3.91-5.18 < 0.001
CCI 1.19 0.01 1.17-1.21 < 0.001 Intercept 627.05 63.76 513.14-766.24 < 0.001
Notes: Results are based on generalized linear model with log-link function and Poisson distribution. Unweighted number of individuals = 46,572. SE = Standard Error; CI = Confidence Interval; GED= Graduation Equivalency Degree; MSA = Metropolitan Statistical Area; PHS= Perceived Health Status; CCI = Charlson Comorbidity Index. a Sample estimates projected to 228,987,954 adults with positive person weights and non-missing values on all of the independent variables; b Reference Category; c Previously married refers to divorced, widowed, or separated individuals; d Dual eligible refers to individuals who are entitled to Medicare Part A and/or Part B and also meet the eligibility requirements for Medicaid, therefore are enrolled in both programs. Table 4-8. Results of regression analyses to estimate the incremental expenditures of anxiety disorders by service category.
Service category AIC ($) SE p-value Total costa %b Inpatient visits 567.83 176.65 0.001 $11.55 B 35.00% Outpatient visits 42.52 54.69 0.437 $864.75 M 2.62% Office-based visits 362.41 79.58 <0.001 $7.37 B 22.34% Emergency room visits 37.02 18.28 0.043 $752.90 M 2.28% Prescription medications 531.83 64.34 <0.001 $10.82 B 32.78% Other medical expenses 80.85 38.87 0.038 $1.64 M 4.98% Overall expenditure 1657.52 238.83 <0.001 $33.71 B 100.00%
Note: All costs are presented in 2013 US dollars. AIC = Average Incremental Cost; SE = Standard Error; B = Billion; M = Million. a Calculated by multiplying the average incremental cost by the prevalence of anxiety disorders in MEPS (i.e. 20.34 million persons). b Percent of overall expenditure.
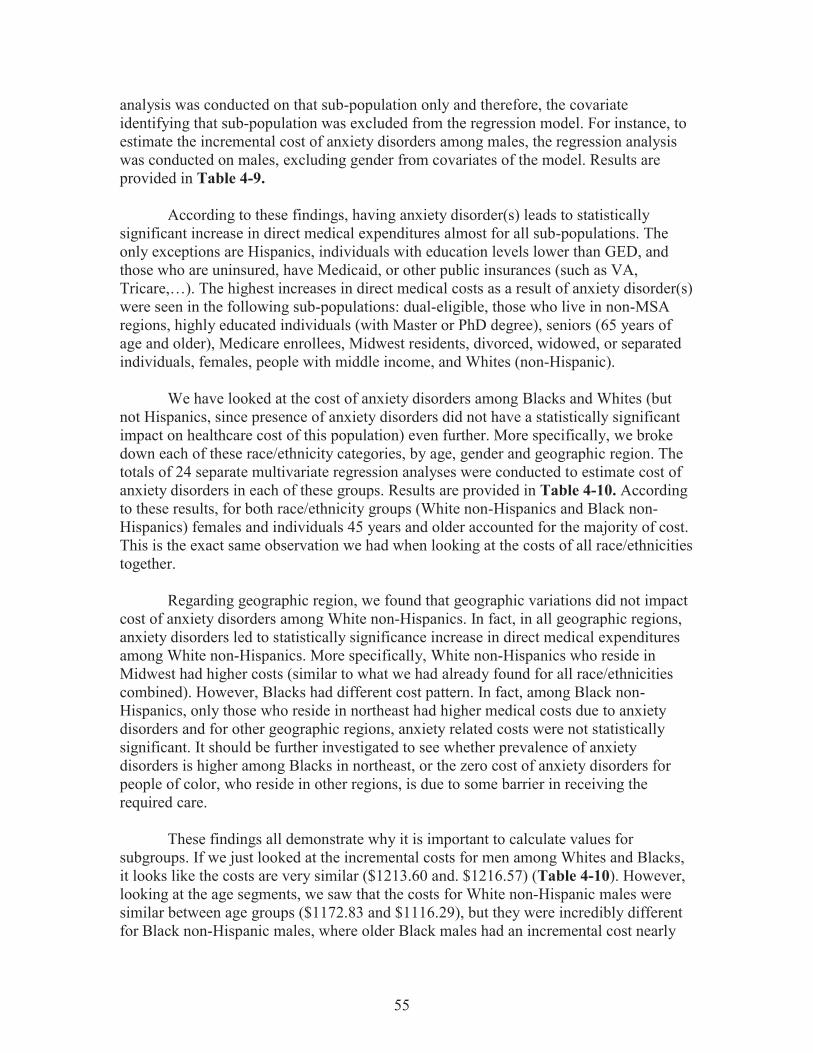
55
analysis was conducted on that sub-population only and therefore, the covariate identifying that sub-population was excluded from the regression model. For instance, to estimate the incremental cost of anxiety disorders among males, the regression analysis was conducted on males, excluding gender from covariates of the model. Results are provided in Table 4-9. According to these findings, having anxiety disorder(s) leads to statistically significant increase in direct medical expenditures almost for all sub-populations. The only exceptions are Hispanics, individuals with education levels lower than GED, and those who are uninsured, have Medicaid, or other public insurances (such as VA, Tricare,…). The highest increases in direct medical costs as a result of anxiety disorder(s) were seen in the following sub-populations: dual-eligible, those who live in non-MSA regions, highly educated individuals (with Master or PhD degree), seniors (65 years of age and older), Medicare enrollees, Midwest residents, divorced, widowed, or separated individuals, females, people with middle income, and Whites (non-Hispanic). We have looked at the cost of anxiety disorders among Blacks and Whites (but not Hispanics, since presence of anxiety disorders did not have a statistically significant impact on healthcare cost of this population) even further. More specifically, we broke down each of these race/ethnicity categories, by age, gender and geographic region. The totals of 24 separate multivariate regression analyses were conducted to estimate cost of anxiety disorders in each of these groups. Results are provided in Table 4-10. According to these results, for both race/ethnicity groups (White non-Hispanics and Black non-Hispanics) females and individuals 45 years and older accounted for the majority of cost. This is the exact same observation we had when looking at the costs of all race/ethnicities together. Regarding geographic region, we found that geographic variations did not impact cost of anxiety disorders among White non-Hispanics. In fact, in all geographic regions, anxiety disorders led to statistically significance increase in direct medical expenditures among White non-Hispanics. More specifically, White non-Hispanics who reside in Midwest had higher costs (similar to what we had already found for all race/ethnicities combined). However, Blacks had different cost pattern. In fact, among Black non-Hispanics, only those who reside in northeast had higher medical costs due to anxiety disorders and for other geographic regions, anxiety related costs were not statistically significant. It should be further investigated to see whether prevalence of anxiety disorders is higher among Blacks in northeast, or the zero cost of anxiety disorders for people of color, who reside in other regions, is due to some barrier in receiving the required care. These findings all demonstrate why it is important to calculate values for subgroups. If we just looked at the incremental costs for men among Whites and Blacks, it looks like the costs are very similar ($1213.60 and. $1216.57) (Table 4-10). However, looking at the age segments, we saw that the costs for White non-Hispanic males were similar between age groups ($1172.83 and $1116.29), but they were incredibly different for Black non-Hispanic males, where older Black males had an incremental cost nearly
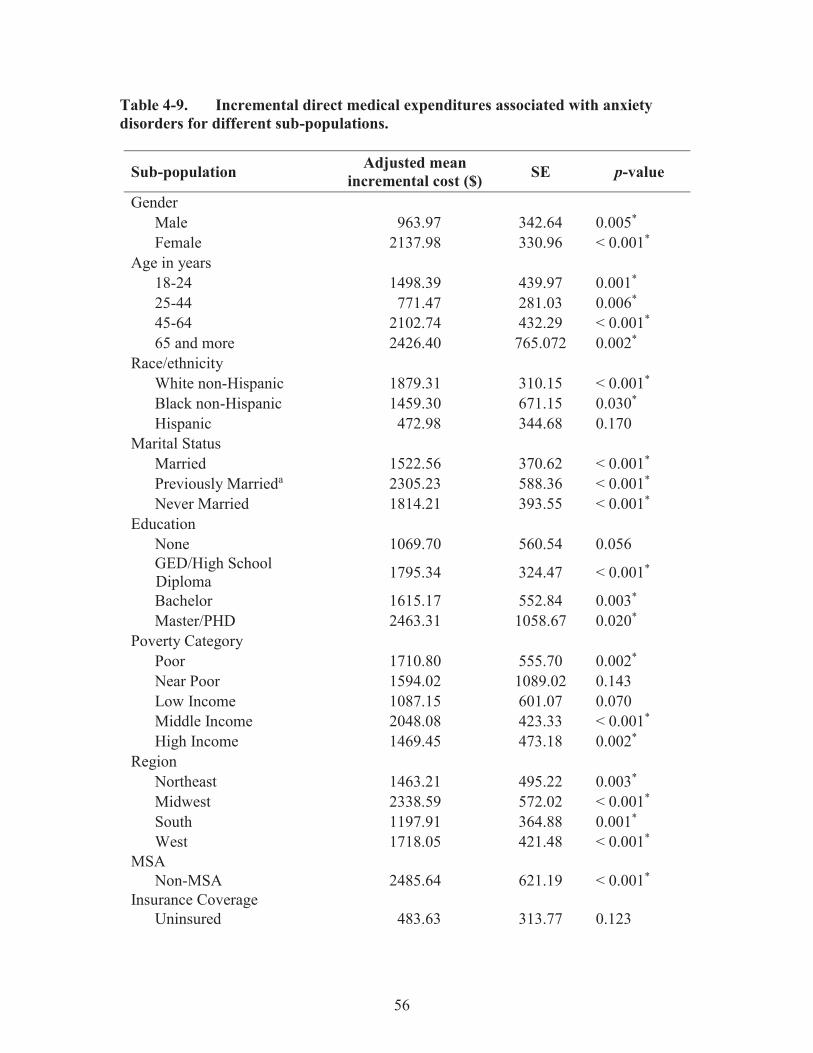
56
Table 4-9. Incremental direct medical expenditures associated with anxiety disorders for different sub-populations.
Sub-population Adjusted mean incremental cost ($) SE p-value
Gender Male 963.97 342.64 0.005* Female 2137.98 330.96 < 0.001*
Age in years 18-24 1498.39 439.97 0.001* 25-44 771.47 281.03 0.006* 45-64 2102.74 432.29 < 0.001* 65 and more 2426.40 765.072 0.002*
Race/ethnicity White non-Hispanic 1879.31 310.15 < 0.001* Black non-Hispanic 1459.30 671.15 0.030* Hispanic 472.98 344.68 0.170
Marital Status Married 1522.56 370.62 < 0.001* Previously Marrieda 2305.23 588.36 < 0.001* Never Married 1814.21 393.55 < 0.001*
Education None 1069.70 560.54 0.056 GED/High School Diploma 1795.34 324.47 < 0.001*
Bachelor 1615.17 552.84 0.003* Master/PHD 2463.31 1058.67 0.020*
Poverty Category Poor 1710.80 555.70 0.002* Near Poor 1594.02 1089.02 0.143 Low Income 1087.15 601.07 0.070 Middle Income 2048.08 423.33 < 0.001* High Income 1469.45 473.18 0.002*
Region Northeast 1463.21 495.22 0.003* Midwest 2338.59 572.02 < 0.001* South 1197.91 364.88 0.001* West 1718.05 421.48 < 0.001*
MSA Non-MSA 2485.64 621.19 < 0.001*
Insurance Coverage Uninsured 483.63 313.77 0.123

57
Table 4-9. (Continued).
Note: All costs are presented in 2013 US dollars. a Previously married refers to divorced, widowed, or separated individuals. b Dual eligible refers to individuals who are entitled to Medicare Part A and/or Part B and also meet the eligibility requirements for Medicaid, therefore are enrolled in both programs. SE = Standard Error; GED= Graduation Equivalency Degree; MSA = Metropolitan Statistical Area. * p < 0.05, two-tailed
Sub-population Adjusted mean incremental cost ($) SE p-value
Dual Eligibleb 6455.84 1990.81 0.001* Medicaid 1129.83 769.44 0.142 Medicare 2354.90 778.10 0.002* Other Public 781.37 891.45 0.381 Private Only 1571.62 319.97 < 0.001*

58
Table 4-10. Breaking down the cost of anxiety disorders among different race/ethnicities by gender, age, and geographic region.
Incremental direct medial cost (SE) Sub-population White non-Hispanic Black non-Hispanic Gender
Male 1213.60 (475.32)* 1216.57 (920.13) Female 2318.78 (424.48)* 1797.20 (865.29)*
Agea 18-44 1060.49 (307.34)* 1268.23 (803.82) 45 and over 2431.47 (497.92) * 2189.18 (995.05) *
Region Northeast 1406.38. (532.84) * 3899.40 (1890.84) * Midwest 2071.76 (600.52) * 824.05 (1054.74) South 1413.00 (435.31) * 491.19 (645.86) West 1478.93 (450.03) * 2001.25 (1459.93)
Gender - Age Male - 18 to 44 Male - 45 and over
1172.83 (444.11) * 650.61 (417.22) 1116.29 (738.16) 3932.22 (1767.89) *
Female - 18 to 44 Female - 45 and over
1235.21 (456.88) * 2315.74 (1277.64) 3150.09 (696.68) * 1843.72 (1314.72)
Note: All costs are presented in 2013 U.S. dollars; Results are not provided for the Hispanics, since presence of anxiety disorder(s) did not have a statistically significant impact on healthcare cost of this population. a Age groups were combined to get enough sample size in each cell. SE = Standard Error. * p < 0.05, two-tailed.

59
six times that of the 18-44 year old ($3932.22 and $650.61). For women, we saw a difference in the costs by age group, but older White women had a higher cost (nearly as much as older Black men) and for Black women we saw higher cost is in the younger age group. So, there is a need for future studies to figure out why all of these incremental costs vary so much.
Morbidity Cost Associated with Anxiety Disorders As it was mentioned in the third chapter, morbidity cost was measured using the Human Capital Approach (HCA). In the HCA, productivity loss due to an illness or injury is approximated by valuing the entire period of absence from work by average individual’s earning. For individuals who are at paid employment for at least one round in the year, information on wage rates are available in the MEPS (in both Consolidated Data file and Job file). For unemployed individuals, the period in which they had to stay in bed due to an illness or injury is valued by the average wage for private household services. Equation 4-1 shows the formula to calculate the morbidity cost.
Morbidity Cost (Eq. 4-1)
Where: N = Total number of individuals in the sample. Wti = Person weight for the ith individual in the sample. Wgi = Daily wage for employed individuals and average daily wage for household services if the individual is not employed. ni = Number of missed work days (due to anxiety disorders) for employed individuals and number of days stayed in bed (due to anxiety disorders) for unemployed individuals. Nanx = Weighted number of individuals in the sample with anxiety disorder(s). Number of Missed Work Days due to Anxiety Disorders for Employed Individuals Since MEPS reports the total number of missed work days for each individual (due to all medical conditions he/she might have), we needed to find the incremental number of missed work days specifically due to anxiety disorders. A multivariate regression analysis was conducted (the very same approach we used to estimate the incremental direct medical costs). The outcome variable was the total number of missed work days and the covariates were gender, age, race/ethnicity, marital status, education, geographic region, MSA, Charlson comorbidity index, occupation category, union status, number of employees, and sick pay (whether or not the person has the sick pay benefit). Checking for multicollinearity. Table 4-11 shows the results of multicollinearity analysis. VIF for insurance coverage and poverty category were estimated at 5.78 and 4.91 respectively. Since both of these values exceeded the cut point of 4, and also there is no evidence in the literature supporting the impact of these

60
Table 4-11. Results of multicollinearity analysis for modeling the number of missed work days.
Variable VIF Variable VIF No anxiety disordera Management, business, and financial operationsa
Anxiety disorders 1.03 Professional and related occupations 2.31 Malea Service Occupations 2.37
Female 1.22 Sales and related occupations 1.75 Age 18 to 24a Office and administrative support 2.11
Age 25 to 44 3.53 Farming, fishing, forestry 1.14 Age 45 to 64 3.97 Construction. Extraction, and maintenance 1.64 Age 65 to 85 1.44 Production, transportation 2.06
Whitea Sick-pay benefita Black 1.24 No sick-pay benefit 1.34 Hispanic 1.30 Uniona Other 1.12 Non-union 1.13
Marrieda Number of employees 1.11 Previously married 1.19 Northeasta Never married 1.46 Midwest 2.10
No Degreea South 2.35 GED/high school diploma 3.08 West 2.14 Bachelor 3.03 Non MSAa Master/PhD 2.35 MSA 1.06 Other degree 1.95 Charlson Comprbidity Index 1.08
Note: Mean VIF = 1.85. a Reference Category. VIF = Variance Inflation Factor.

61
variables on the number of missed work days,72 they were excluded from the model. There is no multicollinearity with the remaining set of covariates. Finding the distribution of missed work days. Figure 4-3 shows the distribution of number of missed work days (“wkinbd” variable in the MEPS data file). Since the “wkinbd” had a highly-skewed distribution, use of OLS regression would have led to biased estimates. So, OLS with log-transformed data and GLM regression were considered. OLS with log-transformed data was ruled out; due to the heteroskedasticity in data (result of the test for heteroskedasticity is provided in Table 4-12). Therefore, we conducted the park test to identify the best variance function to be used in the GLM regression (Table 4-13). According to the results of Park test, both Poisson and Gamma variance functions were appropriate fit to our data. We conducted a. log-link GLM with Poisson distribution (to be consistent with the methodology used in estimating the direct medical costs), on the employed individuals 18 years and older. Self-employed individuals were not included in the analysis since information such as sick leave is not provided for them in the MEPS. Table 4-14 shows the result of regression analysis to estimate the incremental number of days missed work due to anxiety disorders. Based on these results, having anxiety disorder(s) has increased the number of missed work days by almost 2.5 days. Number of Days Stayed in Bed due to Anxiety Disorders for Unemployed Individuals For unemployed individuals, MEPS collects the total number of days each individual had to stay in bed (due to all medical conditions he/she might have had during the survey year). The variable representing this information in the MEPS consolidated data file is called “ddbdys”.we needed to find the incremental number of bed days specifically due to anxiety disorders. Distributional characteristics of the variable “ddbdys” were pretty the same as they were for the variable “wkinbd”. In other words, “ddbdys” was also highly skewed and error terms from the OLS regression on log-transformed “ddbdys” were also heteroskedastic. So, we conducted a log-link GLM with Poisson distribution on the unemployed individuals in the sample to estimate the incremental number of bed days due to anxiety disorder (s). The dependent variable in the regression model was “ddbdys” and independent variables were gender, age, race/ethnicity, education, marital status, geographic region, MSA, and Charlson comorbidity index. Poverty category and insurance coverage were excluded from the set of covariates due to their high multicollinearity with other variables (high VIF). Table 4-15 shows the result of regression analysis to estimate number of bed days due to anxiety disorders for unemployed individuals. As one can see, having anxiety disorders has increased the number of bed days by more than 12 days, for unemployed individuals.

62
Figure 4-3. Distribution of the number of missed work days for employed individuals. WKINBD = Number of missed work days.

63
Table 4-12. Results of the Breusch-Pagan/Cook-Weisberg test for heteroskedasticity.
Variable Chi-square p-value wkinbd_log 218.33 < 0.0001*
Note: The null hypothesis in the Breusch-Pagan / Cook-Weisberg test is that all error terms have constant variance. Since the P-value is less than 0.05, we reject the null hypothesis. In other words, heteroskedasticity is present. wkinbd_log = log-transformed missed work days. Table 4-13. Results of Park test.
Parameter estimate (λ) SE 95% CI p-value 1.90 0.04 182-1.98 < 0.0001*
Note: Since the parameter estimate for the λ is between 1 and 2, it means that both Poisson variance function (λ=1), and Gamma variance function (λ=2) could be appropriate candidates. SE = Standard Error, CI = Confidence interval. * p < 0.05, two-tailed. Table 4-14. Incremental number of missed work days due to anxiety disorders.
Incremental estimate SE 95% CI p-value 2.18 0.57 1.05,3.30 < 0.0001*
SE = Standard Error, CI = Confidence interval. * p < 0.05, two-tailed. Table 4-15. Incremental number of bed days due to anxiety disorders.
Incremental estimate SE 95% CI p-value 12.55 1.62 9.38,15.72 < 0.0001*
SE = Standard Error, CI = Confidence Interval. * p < 0.05, two-tailed.

64
Daily Wage for Employed Individuals For individuals who were employed for at least one round during the survey year, MEPS collects information on hourly wages, as well as the number of hours a person works during a week. To convert hourly wages to daily wages, we assumed that each individual worked 5 days a week. So, daily wage for employed individuals was calculated according to the Equation 4-2.
DW= hours worked per day* HW = (hours worked per week/5) * HW (Eq. 4-2) Where: DW = Daily wage. HW = Hourly wage as it comes in the MEPS consolidated data file. Average Daily Wage of Household Services for Unemployed Individuals As it was mentioned in the chapter 3, in the HCA, morbidity cost for unemployed individuals is calculated by valuing the time period in which an individual had to stay in bed, due to an illness or injury (bed days).the assumption is that daily wage for unemployed individuals is equal to the daily wage for services usually being done at home (household services). For each survey year (2009 and 2010), we used the average daily wage for cooks, maids and maintenance services, as the average daily wage for household services. Results are provided in Table 4-16. Summary of Analyses Having all the information required to calculate the morbidity cost attributed to anxiety disorders (according to Equation 4-1), summary of results are provided in Table 4-17. The adjusted mean incremental morbidity cost due to anxiety disorders was estimated at $625.73 in 2013 US dollars. Multiplying this figure by the weighted number of individuals with anxiety disorder(s) in this period (i.e. 20,337,553 adults), the total morbidity cost associated with this category of mental illnesses was estimated at $12.72 billion in 2013 US dollars.
Mortality Costs Associated with Anxiety Disorders As it was already defined in the chapter 3, mortality cost is productivity loss due to premature deaths. In the HCA, mortality cost is the present value of future earnings, from age of death to life expectancy. In this regard, mortality cost in HCA is calculated using the formula in Equation 4-3.
(Eq. 4-3)

65
Table 4-16. Average daily wage for unemployed individuals based on BLS data. Weekly wage ($)a Daily wage ($)b Gender Service category 2009 2010 2009 2010 Men Cook 400 401
Maid 444 455 Maintenance 488 493
Average 444 450 97 96 Women Cook 371 381
Maid 371 376 Maintenance 388 391
Average 377 383 82 82 Note: Wage data for specific service categories is not available by further details such as race/ethnicity. a In the current dollar value; b In 2013 dollar value. Table 4-17. Summary of results: Morbidity cost.
Cost Adjusted incremental estimate ($) SE 95% CI p-value
Average 625.73 7.40 611.14,640.32 < 0.0001* Total 625.37*20,337,553= $12.72 billion in 2013 US dollars
SE = Standard Error, CI = Confidence interval. * p < 0.05, two-tailed.

66
Where: MTC = Mortality cost for individuals who committed suicide due to anxiety disorders in the period of study. Ad= Age of death. Le= Life expectancy at age of death by race/ethnicity and gender. Li= Labor force participation rate by gender and race/ethnicity at age i. W= Average annual wage by gender and race/ethnicity at age of death. Discount rate is equal to 3%. Number of People Who Committed Suicide due to Anxiety Disorders and Age at Death NVSS provides number of deaths by age group, gender, Hispanic origin, and race for non-Hispanic origin for different causes of death. These statistics are reported in several different formats, based on the age group (5-year age group or 10-year age group) and causes of death (for 15 major causes of death or for 113 causes of death).56-58 We started collecting the number of deaths due to suicides for 2010, using the number of deaths provided by 15 major causes of death in 5-year age groups, by Hispanic origin, race for non-Hispanic population and sex. However, if for some specific sub-populations suicide did not appeared in the first 15 causes of death, we had to use other data tables to collect as much information as possible. Number of deaths due to suicide by age, gender, and race/ethnicity are provided in Table 4-18. You may see that for some sub-populations the number of suicides is provided for 5-year age groups and for others in 10-year age group. Since we had the number of deaths for each age group but not at each specific age, we assumed that all deaths in each age group (either 5 or 10 year age groups) have occurred in the middle point of that range. For instance, we assumed that for all deaths between the ages of 20 to 25, the age at death was 22. In the same way, we assumed that for all deaths occurred between the ages 65 to 75, the age at death was 70. It has been shown that 10% of suicides are due to anxiety disorders.5,10 So, to get the number of suicide due to anxiety disorders at certain age by gender and race/ethnicity, we multiplied the figures in Table 4-18 by 10%. Life Expectancy at Age of Death by Race/Ethnicity and Gender NVSS also provides statistics on life expectancy at age of death by race/ethnicity and gender.59 This information is provided in Table 4-19. If the age at death was a multiplication of 10 (for 10-year age group), then we already have the life expectancy at that age. However, for 5-year age groups (for instance 20 to 25), the life expectancy at the age of death (22) is equal to the mean of life expectancies at the beginning (20) and end (25) of that range.

67
Table 4-18. Number of suicides in 2010 by age, gender, and race/ethnicity.
Age group
White Black Hispanic Male Female Male Female Male Female n % n % n % n % n % n %
20-24 1,717 84% 335 16% 259 84% 49 16% 307 82% 68 18% 25-29 1,822 82% 410 18% 239 85% 43 15% 272 84% 51 16% 30-34 1,658 79% 445 21% 186 88% 26 12% 232 88% 33 12% 35-39 1,887 77% 567 23% 180 79% 47 21% 211 78% 59 22% 40-44 2,213 76% 692 24% 160 77% 48 23% 196 83% 39 17% 45-49 2,928 77% 878 23% 140 80% 36 20% 197 82% 42 18% 50-54 2,996 76% 953 24% 119 76% 37 24% 150 82% 33 18% 55-59 2,549 76% 821 24% 97 48%
36 18% 138 83% 29 17%
60-64 1,806 76% 558 24% 70 34% 67 78% 19 22% 65-69 1,210 79% 322 21% 66 94% 4 6% 57 78% 16 22% 70-74 972 84% 179 16% 40 78% 11 22% 75-79 878 47%
246 13%
38 79%
10 21%
59 89%
7 11% 80-84 761 40% 85+ 791 88% 110 12% 9 75% 3 25% 29 97% 1 3% Total 24,188 79% 6,516 21% 1,563 82% 339 18% 1,955 83% 408 17%
Sources: Deaths, percent of total deaths, and death rates for the 15 leading causes of death in 10-year age groups, by Hispanic origin, race for non-Hispanic population and sex: United States, 2010. Mortality Tables 2012; http://www.cdc.gov/nchs/nvss/mortality_tables.htm. Accessed 11/25/2012 ; Deaths, percent of total deaths, and death rates for the 15 leading causes of death in 5-year age groups, by Hispanic origin, race for non-Hispanic population and sex: United States, 2010. Mortality Tables 2012; http://www.cdc.gov/nchs/nvss/mortality_tables.htm. Accessed 11/25/2012; Deaths, percent of total deaths and rank order for 113 selected causes of death and Enterocolitis due to Clostridium difficile, by Hispanic origin, race for non-Hispanic origin and sex, United States, 2010, Mortality Tables 2012.

68
Table 4-19. Life expectancy at selected ages by race, Hispanic origin, race for non-Hispanic population, and sex: United States, 2010.
Hispanic White non-Hispanic Black non-
Hispanic Age at death Male Female Male Female Male Female
20 59.3 64.4 57.2 61.1 52.9 58.8 25 54.6 59.5 52.5 56.9 48.4 54.0 30 49.8 54.6 47.9 52.0 43.9 49.2 35 45.1 49.7 43.2 47.2 39.4 44.5 40 40.4 44.8 38.6 42.5 34.9 39.8 45 35.7 40.0 34.0 37.8 30.5 35.3 50 31.2 35.3 29.7 33.2 26.3 31.0 55 26.6 30.8 25.5 28.8 22.5 26.8 60 22.8 26.3 21.5 24.4 19.0 22.9 65 18.8 22.0 17.7 20.3 15.8 19.1 70 15.1 18.0 14.2 16.4 12.8 15.7 75 11.7 14.1 11.0 12.8 10.1 12.5 80 8.7 10.7 8.1 9.6 7.8 9.6 85 6.1 7.7 5.8 6.9 5.9 7.1 90 4.2 5.4 4.0 4.8 4.4 5.2 95 2.9 3.7 2.8 3.3 3.3 3.8 100 2.1 2.6 2.1 2.3 2.6 2.8
Source: Murphy SL, Xu JQ, Kochanek KD. Deaths: Final Data for 2010. National Vital Statistics Reports. Hyattsville, MD: National Center for Health Statistics;2013.
69
Labor Force Participation Rate and Wage We collected information on LFPR and wage from the BLS.52,53 This information is provided in Tables 4-20 and 4-21 respectively. In BLS, wage data are available only for age groups of 16-24, 25-54, and 55+. So, we could not break down the wage data into finer age groups. Summary of Analyses Having all the information required to calculate mortality cost according to Equation 4-3, results of this section are provided in Table 4-22. Assuming that 10% of suicides are due to anxiety disorders, 3,497 individuals committed suicide in 2010, with anxiety disorder(s) as primary reason. This resulted in $2.34 billion (in 2013 US dollars) loss in terms of mortality cost. White-non Hispanics accounted for almost 90% of this figure, mainly because of significantly higher number of suicides in this sub-population. Among White-non Hispanics, males between the ages of 25 and 44 years, had the highest mortality cost (37.71% of total mortality cost). The Societal Cost of Anxiety Disorders for the U.S. Adult Population in 2010 (SA1)
The societal cost of anxiety disorders was estimated, by adding-up the overall direct medical cost, morbidity cost, and mortality cost, at almost $49 billion in 2013 US dollars. Direct medical cost accounted for the majority of this figure (69.12%), followed by morbidity cost at 26.08% and mortality cost at 4.81%. These results are provided in Table 4-23.

70
Table 4-20. Labor force participation rate by age, gender, and race/ethnicity.
White non-Hispanic Black non-Hispanic Hispanic Age group Men Women Men Women Men Women
20-24 77.0 69.7 66.9 66.9 80.0 61.6 25-29 90.0 76.2 82.3 76.7 91.9 67.7 30-34 92.3 73.6 84.7 79.3 93.5 64.9 35-39 93.3 73.7 86.8 78.2 94.1 66.7 40-44 91.6 76.2 85.5 77.1 91.5 69.3 45-49 89.7 77.2 79.6 75.3 88.6 72.2 50-54 86.5 75.3 75.1 70.6 86.7 67.7 55-59 79.7 69.4 65.2 63.6 77.1 60.5 60-64 61.3 51.7 46.7 44.2 57.8 44.5 65-69 37.2 27.6 27.9 24.2 38.7 24.3 70-74 22.5 15.0 16.3 13.0 23.4 10.4 75+ 10.5 5.3 9.3 5.6 10.9 5.5
Source: Labor Force Statistics from the Current Population Survey. Bureau of Labor Statistics. http://bls.gov/data/. Accessed 11/05/2012. Table 4-21. Median usual weekly earnings in current dollar from current population survey for 2010.
White non-Hispanic Black non-Hispanic Hispanic Age group Men Women Men Women Men Women 16-24 453 424 403 404 395 392 25-54 878 715 656 615 587 529 55+ 990 734 740 614 617 521
Notes: Wage data are in 2010 US dollars; in converting weekly wages to annual wages, the assumption was that each year is consisted of 52 weeks. Source: Weekly and Hourly Earnings from the Current Population Survey Bureau of Labor Statistics. http://bls.gov/data/. Accessed 11/05/2012

71
Table 4-22. Mortality cost: Summary of results.
White non-Hispanic Black non-Hispanic Hispanic Age group %/$a Male Female Both sexes Male Female Both sexes Male Female Both sexes
18-24 $ 247.09 M 32.23 M 279.33 M 24.46 M 3.99 M 28.45 M 29.62 M 4.36 M 33.98 M % 10.54 1.38 11.92 1.04 0.17 1.21 1.26 0.19 1.45
25-44 $ 883.91 M 159.56 M 1.04 B 58.92 M 10.31 M 69.23 M 71.43 M 9.31 M 80.75 M % 37.71 6.81 44.52 2.51 0.44 2.95 3.05 0.40 3.45
45-65 $ 591.12 M 114.36 M 705.48 M 14.25 M 3,06 M 17.31 M 21.1 M 2.90 M 23.99 M % 25.22 4.88 30.10 0.61 0.13 0.74 0.90 0.12 1.02
65+ $ 33.50 M 26.63 M 60.13 M 500,945 27,077 528,022 988,306 112,941 1.10 M % 1.43 1.14 2.57 0.02 0.00 0.02 0.04 0.00 0.05
All Ages
$ 1.76 B 332.79 M 2.09 B 98.13 M 17.34 M 115.52 M 123.14 M 16.67 M 139.82 M % 74.91 14.20 89.11 4.19 0.74 4.93 5.25 0.71 5.97
Total mortality cost in 2013 US dollar 2,343,749,010 a $ represents the actual cost in 2013 US dollars, while % represents the share of cost in each cell from the total mortality cost, in terms of percentage. For instance, White- non Hispanic males between the ages of 18 and 24, had $247.09 million mortality cost, which accounts for 10.54% of the total mortality cost. M = Million; B = Billion. Table 4-23. The societal cost of anxiety disorders for the U.S. adult population in 2010.
Indirect cost Overall direct medical cost Morbidity cost Mortality cost Societal cost $33,709,900,849 (69.12%) $12,718,495,520 (26.08%) $2,343,749,010 (4.81%) $48,772,145,379
Note: Costs are in 2013 US dollar values.

72
CHAPTER 5. DISCUSSION
Direct Medical Costs General Notes Our results showed that almost 9% of the ambulatory adult population of the U.S. in 2009-2010 was diagnosed with anxiety disorder(s). This estimate is lower than the 18.1% estimate for the 12-month prevalence of any anxiety disorder, reported by the National Comorbidity Survey Replication (NCS-R).9 This difference could be explained by the fact that in MEPS, medical conditions are self-reported; while in the NCS-R, a fully structured diagnostic interview was conducted to identify individuals with a particular mental disorder. So, it is possible that some individuals with mild or moderate anxiety disorder did not receive the diagnosis at the time of interview. Another possibility is that some persons did not report their anxiety, simply because of the social stigma attached to mental disorders. All these can lead to under-representation of anxiety disorders in MEPS. Consistent with the NCS-R’s findings, this study also found that prevalence of anxiety disorders is higher among women. Unlike the previous researchers, who collected data from several different data sources, only one database was used in the current study to estimate direct medical costs. Using multiple data sources may lead to data inconsistency. To avoid this issue, we used MEPS as the only data source for all analyses related to direct medical costs, since it contains comprehensive information regarding the health care utilization and cost for participants in the survey. MEPS has been widely used by previous researchers for the estimation of disease-attributable expense.60-64,66,84-86 In fact, when it comes to highly prevalent diseases, MEPS is superior to administrative databases for cost estimation purposes in several ways. First of all, it contains detailed information on demographic and clinical characteristics of individuals, as well as their health care utilization and expenses. So, by controlling for all factors that may affect healthcare expenditures in analysis, researchers can estimate costs solely due to the condition of interest. Second of all, disease-attributable expenses can be presented as point estimates, as well as percentage of total costs of the disease population. This information, which cannot be gained using administrative data, provides a more sensible picture of the economic burden of a disease;65 Finally, MEPS is the only database which contains all required information to estimate direct medical expenditures attributable to a disease. So instead of getting data from several different data sources, which may lead to data inconsistency and later cast doubt on the reliability of results, only one database is used to collect data on healthcare utilization and costs. The confidence in the current findings is also derived from the adaptation of a robust statistical analysis technique. In modeling healthcare cost data, an attempt was

73
made to reduce bias in estimates by selecting statistical techniques that considered the skewed nature of such data. Overall Direct Medical Cost Using estimates from this study, the annual incremental direct medical expenditures attributable to anxiety disorders, for the U.S. ambulatory adult population, is at $33.71 billion in 2013 US dollars. This figure, representing more than 69% of the estimated societal cost, is obtained by multiplying the per-capita incremental cost of anxiety ($1657.52) by the national estimated prevalence of anxiety disorders in MEPS (20.34 million persons). Previous estimates of direct medical costs of anxiety disorders, which were obtained in the late 90’s, range from $28.73 billion to $98.26 billion in 2013 US dollars.5,10 Even though our estimate falls within this range, it is not quite comparable with the previous findings. The type of methodology used to estimate the costs has a significant impact on results. DuPont et al.5 estimated the medical expenditures as the product of volume of services and unit prices or charges, and Greenberg et al.10 estimates were derived from a two-step multivariate regression approach, while we used the incremental cost approach. In addition, their study population was not limited to the U.S. ambulatory adult population, as ours was. Also, they did not include all diagnoses of anxiety disorders in their analysis and considered different cost categories in estimating cost of illness. For instance, DuPont et al.5 used charges instead of costs, did not include costs due to PTSD, and almost 70% of their cost estimate ($19.9 billion) was due to costs for institutionalized population, i.e. those who reside in nursing homes and specialty mental health organizations. Greenburg et al.10 estimated cost of anxiety for individuals aged 15 to 54. They found that more than half of the costs of these disorders ($53 billion) were attributable to non-psychiatric direct medical expenditures. Interpreting this result, Greenburg et al. explained that “estimation of this component was based on results from a single staff–model HMO that may not be fully generalizable to the entire population.”10(p. 431) Cost by Category of Healthcare Services With respect to categories of direct medical cost, inpatient visits (35.00%), prescription medications (32.78%), and office-based medical provider visits (22.34%) together accounted for almost 93% of the overall incremental costs associated with anxiety disorders. Emergency room cost, representing almost 3% of overall medical costs, was also slightly higher for sufferers of anxiety. These findings are consistent with the known healthcare utilization pattern and treatment seeking behavior of individuals with anxiety disorders. Marciniak, Lage, Landbloom, Dunayevich, and Bowman15 estimated the medical and productivity cost of anxiety disorders using data from a large employer database. Their results showed that employees with anxiety disorders had

74
higher inpatient hospital costs as well as higher prescription medications, medical provider visits, and emergency care costs. The high cost of office-based medical provider visits and prescription medications can also be explained through the treatment seeking behavior of individuals with anxiety disorders. Treatment options for anxiety disorders include pharmacotherapy, psychotherapy, or combination of both. With the recent advances in psychotherapy techniques and pharmacotherapy products, such as Cognitive-Behavioral Therapy (CBT) and Selective Serotonin Reuptake Inhibitors (SSRIs) proven to be very effective in treating anxiety disorders, treatment utilization for these conditions has significantly increased throughout the time.87,88 As such, office-based medical provider visits and prescription medications are expected to account for the majority of overall cost of illness associated with anxiety disorders. . To effectively reduce the cost of anxiety disorders, more attention needs to be geared towards these three categories of care. For instance, further studies should investigate the underlying reasons for high hospitalizations in patients with anxiety disorders, and examine whether these hospitalizations are potentially preventable. Cost for Different Sub-populations Knowing which sub-population incurs higher costs, policymakers and clinicians will be able to develop tailored disease management programs, by considering the specific characteristics of the target sub-populations. Our results showed that the following sub-populations accounted for the majority of the overall direct medical costs associated with anxiety disorders in their category: Females ($2137.98), individuals 65 years and older ($2426.40), White non-Hispanics ($1879.31), previously married individuals ($2305.23), those with high levels of education (i.e. master/PhD) ($2463.31), middle-income earners ($2048.08), those who reside in the Midwest ($2338.59), non-MSA residents ($2485.64), and dual eligible ($6455.84). The only sub-populations, in which having anxiety disorder(s) was not associated with higher medical cost, were Hispanics, individuals with less than a high school diploma/GED, the uninsured, and those who were covered only by Medicaid, or other public insurances (such as Tricare). Higher costs for females and White non-Hispanics can be explained through the higher prevalence of anxiety disorders among these sub-populations.30 With respect to insurance coverage, dual eligible followed by Medicare enrollees and private insurance holders had the highest portion of medical costs. These plans usually offer more generous benefits than Medicaid and other forms of public insurance. As such, it is expected for their members to have higher utilization and cost for services such as psychotherapy session, which are either not covered or limitedly covered by other plan types. The life-time prevalence of anxiety disorders is the lowest for people 65 years and older; yet we found that this group of individuals accounted for the majority of cost. This can be

75
explained through the correlation between age and Medicare insurance coverage. Patients with middle income, as well as those with high educational level had high anxiety-related costs. This observation can be justified assuming that people with higher socioeconomic status are more aware of the importance of treatment seeking for their diseases. As it was mentioned above, anxiety disorders were not associated with an increase in healthcare cost among Hispanics. Also, anxiety related costs for Black non-Hispanics, even though statistically significant, were less than costs for White non-Hispanics. One explanation for these observations could be the lower life-time prevalence of anxiety disorders among Hispanics and Black non-Hispanics, in comparison with White non-Hispanics.30 However, future research needs to be done to examine any potential barrier in receiving the treatment for anxiety disorders among minorities. To our knowledge, there is no study in the literature examining cost of anxiety among different sub-populations. Murciniak et al.18 used MarketScan Databases to examine how medical conditions and demographic characteristics affect the costs of treating anxiety patients. The only demographic characteristics included in their analyses were gender, age, and insurance coverage. Similar to our findings, they concluded that females, older individuals, and those who have more comprehensive insurance coverage incurred higher costs.18 We broke down anxiety costs for Blacks and Whites, by sex, gender and geographic region. Our findings (i.e. considerable variation in incremental costs incurred by different sub-populations), demonstrate why it is important to calculate values for sub-groups; and highlight the need for future studies to figure out the underlying causes of such variations. Of particular interest is the much larger costs for Black non-Hispanics in the Northeast ($3899.40) and for Black non-Hispanic males aged 45 and older ($3932.22). These findings deserve additional study to determine the reasons for such higher costs in theses sub-populations.
Indirect Costs Based on the prevalence of self-reported anxiety disorders in MEPS and suicide data from NVSS, the total annual indirect cost attributable to anxiety disorders was estimated at $15.06 billion in 2013 US dollars ($12.72 for morbidity $2.34 for mortality cost). This figure represents almost 31% of the estimated societal cost of anxiety disorders. Like direct medical cost, the estimated morbidity cost is also based on the prevalence of self-reported anxiety disorders in MEPS. So, there is a possibility of under-estimation of morbidity cost in this study (due to potential under-reporting of anxiety disorders in MEPS). There are only two studies that provided national estimates of indirect costs for anxiety disorders. Greenberg et al.10 estimations of morbidity and mortality costs are

76
$7.44 billion and $2.12 billion (in 2013 US dollars) respectively. Even though their analysis technique for mortality cost is pretty similar to ours, their estimation of morbidity cost is not quite comparable with our results, because:
They estimated productivity loss due to anxiety disorders only for the employed individuals, while we considered both employed and unemployed individuals in the analysis.
For employed individuals, they defined morbidity cost as the cost due to
absenteeism, plus reduced productivity while at work. The latter represented more than 87% of their estimated morbidity cost. However, we did not include this component (reduced productivity while at work) in our analysis.
To get the number of missed work days due to anxiety disorders, we used
regression analysis while they applied a 40% impairment rate to the total number of work cutbacks.
DuPont et al.,5 also provided estimates of morbidity and mortality cost at $59.83 billion and $2.30 billion (in 2013 US dollars), respectively. In calculating the mortality cost, they adopted the same methodology as ours, but their estimation of morbidity cost was based on impairment rate, and thus is not comparable with our findings.
Societal Cost The societal cost of anxiety disorders were estimated at 48.72 billion in 2013 US dollars. Figure 5-1 shows the proportion of each cost component from the societal cost of anxiety disorders for the ambulatory adult population of the United States. This study used nationally representative databases along with a robust statistical analysis technique to provide the most comprehensive and recent estimates of societal cost of anxiety disorders among adults in the U.S. The current study demonstrates conclusively that anxiety disorders, with the annual societal cost of $48.72 billion in 2013 US dollars, absorb a significant portion of US healthcare resources and should be prioritized by policymakers and healthcare providers who aim to reduce downstream costs of mental disorders. Almost 70% of societal cost of anxiety disorders was due to direct medical costs. We analyzed this category further by looking at the distribution of costs in different health delivery settings, and amongst different sub-populations. Our findings may also influence policy under the new Affordable Care Act (ACA). The ACA, signed into law on March 2010, aims to: expand coverage for all Americans, enhance the quality of care, and lower healthcare costs.89 In this regard, economic evaluations, such as cost of illness studies, can serve as an important tool in creating a healthcare system with lower costs and higher quality of care. Cost of illness

77
Figure 5-1. Percentage of each cost component from the societal cost. studies are also useful in being able track healthcare costs over time to see if the increase access to healthcare and the cost-reductions in the ACA are having an effect. Cost of illness studies enable policymakers to identify medical conditions that absorb a significant portion of the US healthcare budget. These costly medical conditions may be investigated further to realize if resources are being distributed inefficiently, or if there is a need to invest in new, cost-effective treatment options. All these will lead to prioritizing scarce healthcare resources in a more efficient way, which eventually may lower the cost of care. However, the ACA lacks a mechanism to directly use economic evaluations, to reach these goals. As such, new healthcare policies are needed to support research that will help prioritize allocation of scarce healthcare resources.
Limitations This study has several limitations. Most importantly, our findings might have underestimated the direct medical expenditures, as well as indirect cost aspect of morbidity, attributable to anxiety disorders. As it was discussed earlier, individuals with anxiety disorders were identified as those who reported being diagnosed with this condition. So, prevalence of anxiety disorders might be under-reported in MEPS. As such, our findings should be interpreted with caution. Results from this study, due to potential under-representation of anxiety disorders in MEPS, should be interpreted as a conservative estimate of the societal cost of these conditions in the ambulatory adult population of the U.S. If we assume that health seeking behavior and healthcare utilization of individuals with anxiety disorders, who didn’t report their condition, is not systematically different from other individuals in the study population, then we can apply the estimated per-person incremental medical cost ($1657.52) to the NCS-R’s estimate of the 12-month prevalence of anxiety disorders (i.e. 18.1% of the adult population which is equal to 42.13 million persons); and it gives us the total direct medical cost of anxiety

78
disorders at $69.84 billion in 2013 US dollars. Similarly, assuming that productivity loss of sufferers who reported their anxiety is consistent with the rest of the population, the estimated morbidity cost would be $25.36 billion. Second, some covariates such as history and severity of illness were not included in the analysis of direct medical cost, due to unavailability of this information in MEPS. Third, we studied the societal cost of anxiety disorders in the ambulatory adult population of the U.S. A more comprehensive study including all age groups, as well as patients in assisted living or nursing home facilities, in analysis would provide a more precise estimate of the economic burden of these conditions. Fourth, since only the first three digits of ICD-9 codes are shown in MEPS public use files, we couldn’t unbundle the umbrella category of anxiety disorders and report costs by each diagnosis of these conditions. Finally, in order to find the number of deaths due to anxiety disorders, we applied a 10% rate to the total number of suicides. Even though we have adopted this rate from previous relevant research, it may not be a very accurate estimate for anxiety-induced suicides. Unfortunately, the national number of suicides for each specific diagnosis of mental illnesses is not still available.

79
LIST OF REFERENCES 1. National Health Expenditures 2011 Highlights. [Centers for Medicare & Medicaid
Services]. 2012; http://www.cms.gov/Research-Statistics-Data-and-Systems/Statistics-Trends-and-Reports/NationalHealthExpendData/downloads/highlights.pdf. Accessed 01/24/2013.
2. OECD Health Data 2012 How Does the United States Compare. [Organisation for
Economic Co-operation and Development]. 2012; http://www.oecd.org/unitedstates/BriefingNoteUSA2012.pdf. Accessed 01/24/2013.
3. Joel E, Segel BA. Cost-of-Illness Studies—A Primer. RTI-UNC Center of
Excellence in Health Promotion Economics;2006. 4. Rice DP. Cost of illness studies: what is good about them? Inj Prev. Sep
2000;6(3):177-179. 5. DuPont RL, Rice DP, Miller LS, Shiraki SS, Rowland CR, Harwood HJ.
Economic costs of anxiety disorders. Anxiety. 1996;2(4):167-172. 6. Anxiety Disorders- Common Characteristics. [AllPsych Online].
http://allpsych.com/disorders/anxiety/index.html. Accessed 09/01/2012. 7. Diagnostic and Statistical Manual of Mental Disorders (4th ed., text rev.).
Washington, DC: American Psychiatric Association; 2000. 8. Anxiety Disorders. Washington, DC: U.S. DEPARTMENT OF HEALTH AND
HUMAN SERVICES; 2009. 9. Kessler RC, Chiu WT, Demler O, Merikangas KR, Walters EE. Prevalence,
severity, and comorbidity of 12-month DSM-IV disorders in the National Comorbidity Survey Replication. Archives of general psychiatry. Jun 2005;62(6):617-627.
10. Greenberg PE, Sisitsky T, Kessler RC, et al. The economic burden of anxiety
disorders in the 1990s. Journal of Clinical Psychiatry. Jul 1999;60(7):427-435. 11. Goetzel RZ, Hawkins K, Ozminkowski RJ, Wang S. The health and productivity
cost burden of the "top 10" physical and mental health conditions affecting six large U.S. employers in 1999. Journal of occupational and environmental medicine / American College of Occupational and Environmental Medicine. Jan 2003;45(1):5-14.

80
12. Andlin-Sobocki P, Jonsson B, Wittchen HU, Olesen J. Cost of disorders of the brain in Europe. European Journal of Neurology. Jun 2005;12 Suppl 1:1-27.
13. Andlin-Sobocki P, Wittchen HU. Cost of anxiety disorders in Europe. European
Journal of Neurology. Jun 2005;12 Suppl 1:39-44. 14. Smit F, Cuijpers P, Oostenbrink J, Batelaan N, de Graaf R, Beekman A. Costs of
nine common mental disorders: implications for curative and preventive psychiatry. The journal of mental health policy and economics. Dec 2006;9(4):193-200.
15. Marciniak M, Lage MJ, Landbloom RP, Dunayevich E, Bowman L. Medical and
productivity costs of anxiety disorders: case control study. Depression and anxiety. 2004;19(2):112-120.
16. Leon AC, Olfson M, Portera L. Service utilization and expenditures for the
treatment of panic disorder. General hospital psychiatry. Mar 1997;19(2):82-88. 17. Rees CS, Richards JC, Smith LM. Medical utilisation and costs in panic disorder:
a comparison with social phobia. Journal of Anxiety Disorders. Sep-Oct 1998;12(5):421-435.
18. Marciniak MD, Lage MJ, Dunayevich E, et al. The cost of treating anxiety: the
medical and demographic correlates that impact total medical costs. Depression and anxiety. 2005;21(4):178-184.
19. Panzer PE, Regan TS, Chiao E, Sarnes MW. Implications of an SSRI generic step
therapy pharmacy benefit design: an economic model in anxiety disorders. Am J Manag Care. Oct 2005;11(12 Suppl):S370-379.
20. McLaughlin TP, Khandker RK, Kruzikas DT, Tummala R. Overlap of anxiety
and depression in a managed care population: Prevalence and association with resource utilization. Journal of Clinical Psychiatry. Aug 2006;67(8):1187-1193.
21. Stein MB, Cantrell CR, Sokol MC, Eaddy MT, Shah MB. Antidepressant
adherence and medical resource use among managed care patients with anxiety disorders. Psychiatric services (Washington, D.C.). May 2006;57(5):673-680.
22. Olfson M, Gameroff MJ. Generalized anxiety disorder, somatic pain and health
care costs. General hospital psychiatry. Jul-Aug 2007;29(4):310-316. 23. Roberge P, Marchand A, Reinharz D, et al. Healthcare utilization following
cognitive-behavioral treatment for panic disorder with agoraphobia. Cogn Behav Ther. 2005;34(2):79-88.

81
24. Siegel L, Jones WC, Wilson JO. Economic and life consequences experienced by a group of individuals with panic disorder. Journal of Anxiety Disorders. // 1990;4(3):201-211.
25. Souetre E, Lozet H, Cimarosti I, et al. Cost of anxiety disorders: impact of
comorbidity. Journal of psychosomatic research. 1994;38 Suppl 1:151-160. 26. Salvador-Carulla L, Segui J, Fernandez-Cano P, Canet J. Costs and offset effect in
panic disorders. British Journal of Psychiatry - Supplement. Apr 1995(27):23-28. 27. Patel A, Knapp M, Henderson J, Baldwin D. The economic consequences of
social phobia. Journal of affective disorders. Apr 2002;68(2-3):221-233. 28. Batelaan N, Smit F, de Graaf R, van Balkom A, Vollebergh W, Beekman A.
Economic costs of full-blown and subthreshold panic disorder. Journal of Affective Disorders. Dec 2007;104(1-3):127-136.
29. Acarturk C, Smit F, de Graaf R, van Straten A, Ten Have M, Cuijpers P.
Economic costs of social phobia: a population-based study. Journal of affective disorders. Jun 2009;115(3):421-429.
30. Kessler RC, Berglund P, Demler O, Jin R, Merikangas KR, Walters EE. Lifetime
prevalence and age-of-onset distributions of DSM-IV disorders in the National Comorbidity Survey Replication. Arch Gen Psychiatry. Jun 2005;62(6):593-602.
31. Kirschstein R. Disease-Specific Estimates of Direct and Indirect Costs of Illness
and NIH Support: Fiscal Year 2000 Update. 2005; http://ospp.od.nih.gov/ecostudies/COIreportweb.htm.
32. Hodgson TA, Meiners MR. Cost-of-illness methodology: a guide to current
practices and procedures. Milbank Mem Fund Q Health Soc. Summer 1982;60(3):429-462.
33. MEPS HC-135I: Appendix to MEPS 2010 Event Files HC-135A - HC-135H
Rockville, MD: Agency for Healthcare Research and Quality-Center for Financing, Access, and Cost Trends; 2012.
34. Rice DP. Estimating the cost of illness. Am J Public Health Nations Health. Mar
1967;57(3):424-440. 35. Koopmanschap MA, van Ineveld BM. Towards a new approach for estimating
indirect costs of disease. Soc Sci Med. May 1992;34(9):1005-1010. 36. Koopmanschap MA, Rutten FF, van Ineveld BM, van Roijen L. The friction cost
method for measuring indirect costs of disease. J Health Econ. Jun 1995;14(2):171-189.

82
37. Johannesson M, Karlsson G. The friction cost method: a comment. J Health Econ. Apr 1997;16(2):249-255; discussion 257-249.
38. Encyclopedia of Public Health. Vol 1. 1 ed: Springer; 2008. 39. Chapin CV. The value of human life. American journal of public health (New
York, N.Y. : 1912). Feb 1913;3(2):101-105. 40. Mushkin SJ, Collings FD. Economic costs of disease and injury. Public health
reports (Washington, D.C. : 1974). Sep 1959;74:795-809. 41. Fein R. Economics of Public Health. New York: Basic Books; 1958. 42. Drummond M. Cost-of-illness studies: a major headache? PharmacoEconomics.
Jul 1992;2(1):1-4. 43. Edlund MJ, Swann AC. The economic and social costs of panic disorder. Hosp
Community Psychiatry. Dec 1987;38(12):1277-1279, 1288. 44. Konnopka A, Leichsenring F, Leibing E, Konig HH. Cost-of-illness studies and
cost-effectiveness analyses in anxiety disorders: a systematic review. J Affect Disord. Apr 2009;114(1-3):14-31.
45. Survey Background. 2009.
http://meps.ahrq.gov/mepsweb/about_meps/survey_back.jsp. 46. MEPS HC-138: 2010 Full Year Consolidated Data File. 2012;
http://meps.ahrq.gov/mepsweb/data_stats/download_data/pufs/h138/h138doc.shtml#2581UnitedStates. Accessed 4/01/2013.
47. Machlin SR, Zodet MW, Nixon JA. Estimates of medical expenditures from the
Medical Expenditure Panel Survey: Gains in precision from combining consecutive years of data. Paper presented at: Joint Statistical Meetings - Section on Survey Research Methods2003; Alexandria, VA.
48. MEPS HC-036BRR: 1996-2009 Replicates for Variance Estimation File.
Rockville, MD: Agency for Healthcare Research and Quality-Center for Financing, Access, and Cost Trends;2011.
49. MEPS HC-137: 2010 Medical Conditions. 2012;
http://meps.ahrq.gov/mepsweb/data_stats/download_data/pufs/h137/h137doc.shtml. Accessed 4/01/2013.

83
50. Shirneshan E, Bailey J, Relyea G, Franklin BE, Solomon DK, Brown LM. Incremental direct medical expenditures associated with anxiety disorders for the U.S. adult population: Evidence from the Medical Expenditure Panel Survey. Journal of Anxiety Disorders. 10// 2013;27(7):720-727.
51. BLS Information. [Bureau of Labor Statistics].
http://www.bls.gov/dolfaq/bls_ques26.htm. Accessed 10/01/2012. 52. Affordable Care Act. 2013;
http://www.medicaid.gov/affordablecareact/affordable-care-act.html. Accessed 08/21/2013.
53. Labor Force Statistics from the Current Population Survey. Bareau of Labor
Statistics. http://bls.gov/data/. Accessed 11/05/2012. 54. CPI Detailed Report Data for March 2013. Washington, DC U.S. Bureau of
Labor Statistics, Division of Consumer Prices and Price Indexes; 05/10/2013 2013.
55. About NCHS. [Center for Disease Control and Prevention].
http://www.cdc.gov/nchs/about/policy/quality.htm. Accessed 11/01/2012. 56. Deaths, percent of total deaths, and death rates for the 15 leading causes of death
in 5-year age groups, by Hispanic origin, race for non-Hispanic population and sex: United States, 2010. Mortality Tables 2012; http://www.cdc.gov/nchs/nvss/mortality_tables.htm. Accessed 11/25/2012.
57. Deaths, percent of total deaths, and death rates for the 15 leading causes of death
in 10-year age groups, by Hispanic origin, race for non-Hispanic population and sex: United States, 2010. Mortality Tables 2012; http://www.cdc.gov/nchs/nvss/mortality_tables.htm. Accessed 11/25/2012.
58. Deaths, percent of total deaths and rank order for 113 selected causes of death and
Enterocolitis due to Clostridium difficile, by Hispanic origin, race for non-Hispanic origin and sex, United States, 2010. Mortality Tables 2012; http://www.cdc.gov/nchs/nvss/mortality_tables.htm. Accessed 11/25/2012.
59. Murphy SL, Xu JQ, Kochanek KD. Deaths: Final Data for 2010. National Vital
Statistics Reports. Hyattsville, MD: National Center for Health Statistics;2013. 60. Balu S, Thomas J, 3rd. Incremental expenditure of treating hypertension in the
United States. Am J Hypertens. Aug 2006;19(8):810-816; discussion 817. 61. Bhattacharyya N. Incremental healthcare utilization and expenditures for allergic
rhinitis in the United States. The Laryngoscope. 2011;121(9):1830-1833.

84
62. Kamble S, Bharmal M. Incremental direct expenditure of treating asthma in the United States. Journal of Asthma. Feb 2009;46(1):73-80.
63. Kawatkar AA, Jacobsen SJ, Levy GD, Medhekar SS, Venkatasubramaniam KV,
Herrinton LJ. Direct medical expenditure associated with rheumatoid arthritis in a nationally representative sample from the Medical Expenditure Panel Survey. Arthritis care & research. Nov 2012;64(11):1649-1656.
64. Luo X, Pietrobon R, Sun SX, Liu GG, Hey L. Estimates and patterns of direct
health care expenditures among individuals with back pain in the United States. Spine. Jan 1 2004;29(1):79-86.
65. Olin G, Machlin SR, Rhoades J. Estimating the cost of illness: The case of
diabetes. 2008. 66. Raval AD, Sambamoorthi U. Incremental healthcare expenditures associated with
thyroid disorders among individuals with diabetes. Journal of thyroid research. 2012;2012.
67. D'Hoore W, Bouckaert A, Tilquin C. Practical considerations on the use of the
Charlson comorbidity index with administrative data bases. Journal of clinical epidemiology. Dec 1996;49(12):1429-1433.
68. Buntin MB, Zaslavsky AM. Too much ado about two-part models and
transformation?: Comparing methods of modeling Medicare expenditures. Journal of Health Economics. 5// 2004;23(3):525-542.
69. Breusch TS, Pagan AR. A Simple Test for Heteroscedasticity and Random
Coefficient Variation. Econometrica. 1979;47(5):1287-1294 70. Park R. Estimation with Heteroscedastic Error Terms. Econometrica.
1966;34(4):888. 71. Industries at a Glance. [Bureau of Labor Statistics].
http://www.bls.gov/iag/tgs/iag814.htm. Accessed 11/01/2012. 72. Akazawa M, Sindelar JL, Paltiel AD. Economic costs of influenza-related work
absenteeism. Value in Health. 2003;6(2):107-115. 73. Rice DP, Kelman S, Miller LS. Estimates of economic costs of alcohol and drug
abuse and mental illness, 1985 and 1988. Public health reports (Washington, D.C. : 1974). May-Jun 1991;106(3):280-292.
74. Employment Cost Index. Bureau of Labor Statistics. http://www.bls.gov/data/.
Accessed 06/ 24/2013.

85
75. Siegel JE, Torrance GW, Russell LB, Luce BR, Weinstein MC, Gold MR. Guidelines for pharmacoeconomic studies. Recommendations from the panel on cost effectiveness in health and medicine. Panel on cost effectiveness in health and medicine. PharmacoEconomics. Feb 1997;11(2):159-168.
76. SAS Institute Inc. SAS/STAT® 9.3 User’s Guide. Cary. NC: SAS Institute Inc;
2011. 77. StataCorp. Stata Statistical Software: Release 12. College Station, TX: StataCorp.
LP; 2011. 78. O’brien R. A Caution Regarding Rules of Thumb for Variance Inflation Factors.
Qual Quant. 2007/10/01 2007;41(5):673-690. 79. Schoen C, Osborn R, Squires D, Doty MM, Pierson R, Applebaum S. How health
insurance design affects access to care and costs, by income, in eleven countries. Health affairs (Project Hope). Dec 2010;29(12):2323-2334.
80. Buchmueller TC, Grumbach K, Kronick R, Kahn JG. Book Review: The Effect of
Health Insurance on Medical Care Utilization and Implications for Insurance Expansion: A Review of the Literature. Medical Care Research and Review. February 1, 2005 2005;62(1):3-30.
81. Hurd MD, McGarry K. Medical insurance and the use of health care services by
the elderly. Journal of Health Economics. 4// 1997;16(2):129-154. 82. Stanton MW, Rutherford MK. The high concentration of U.S. health care
expenditures. Rockville, MD: Agency for Healthcare Research and Quality;2005. 06-0060.
83. Alemayehu B, Warner KE. The lifetime distribution of health care costs. Health
services research. Jun 2004;39(3):627-642. 84. Kim MH, Johnston SS, Chu BC, Dalal MR, Schulman KL. Estimation of total
incremental health care costs in patients with atrial fibrillation in the United States. Circulation. Cardiovascular quality and outcomes. May 2011;4(3):313-320.
85. Yelin E, Trupin L, Cisternas M, Eisner M, Katz P, Blanc P. A national study of
medical care expenditures for respiratory conditions. European Respiratory Journal. Mar 2002;19(3):414-421.
86. Yoon D, Frick KD, Carr DA, Austin JK. Economic impact of epilepsy in the
United States. Epilepsia. Oct 2009;50(10):2186-2191.

86
87. Olfson M, Marcus SC, Wan GJ, Geissler EC. National trends in the outpatient treatment of anxiety disorders. Journal of Clinical Psychiatry. Sep 2004;65(9):1166-1173.
88. Treatment. Anxiety Disorder association of America 2013;
http://www.adaa.org/finding-help/treatment. Accessed 06/11/2013. 89. Affordable Care Act. http://www.medicaid.gov/affordablecareact/affordable-care-
act.html. Accessed 08/21/2013.

87
VITA Elaheh Shirneshan was born in Iran in 1981. She finished her bachelor’s and master’s degree in Industrial Engineering in 2005 and 2009, respectively. In fall 2010, she was accepted at the University of Tennessee Health Science Center as a graduate student in the Ph.D. program (Major: Health Outcomes and Policy Research).She graduated from this program in December 2013.