cost of production estimates for wheat, milk and pigs in...
TRANSCRIPT

Cost of production estimates for wheat, milk and pigs in selected EU member states
Institute of Farm Economics
Werner Kleinhanss Frank Offermann Jean-Pierre Butault Yves Surry
Arbeitsberichte aus der vTI-Agrarökonomie
07/2011
The research leading to these results has received funding from the European Community’s Seventh Framework Programme (FP7/2007-2013) under grant agreement no 212292 (FACEPA) and from the OECD, Agrifood and Market Directorate, Contract JA00065578
Braunschweig, November 2011

Werner Kleinhanss and Frank Offermann are senior scientists at the Institute of Farm Economics, Johann Heinrich von Thünen-Institut (vTI), Braunschweig (Germany); Jean-Pierre Butault is research director at the Institut National de la Recherche Agronomique (INRA), Paris (France); Yves Surry is Professor at the Swedish University of Agricultural Sciences (SLU), Uppsala (Sweden)
Address: Institut für Betriebswirtschaft Johann Heinrich von Thünen-Institut (vTI), Bundesforschungsinstitut für Ländliche Räume, Wald und Fischerei Bundesallee 50 38116 Braunschweig
Phone: +49 531 596-5145
E-Mail: [email protected]
Working papers are partly evaluated reports of research activities of the Institute of Farm Economics, the Institute of Rural Studies and the Institute of Market Analysis and Trade Policy of the Johann Heinrich von Thünen-Institut (vTI). Expressed opinions do not necessarily reflect the views of the institutes or of vTI. Comments are welcome and should be directed to the authors.

i Abstract/Kurzfassung
Abstract
This study summarizes cost estimates based on the EU Farm Accountancy Data Network using the General Cost of Production Model, developed, applied and tested within the FACEPA project. Results are provided for wheat, pigs and milk for the main producer countries of the EU for the period 1999 to 2007. Estimated input-output coefficients are generally based on monetary figures, expressing cost shares referring to total output. Effects of scale, specialization and location can be derived by estimates based on respective sub-samples. Costs per unit are derived based on input-output coefficients and output values, providing costs per hectare or ton for wheat and per ton of milk. There is a considerable variation between Member States not only of production costs, but also of output, and output plus subsidies (due to the national implementations of full or partially decoupling schemes), especially for wheat and milk.
Key words: econometric analysis, production costs
JEL: C39, Q12
Kurzfassung
In dieser Studie werden Schätzungen von Produktionskosten basierend auf EU-Testbetriebsdaten unter Verwendung eines in dem EU-Forschungsprojekt FACEPA entwickelten Modells durchgeführt. Ergebnisse werden bereitgestellt für Weizen, Milch sowie für Schweine für die Hauptproduktionsländer der EU und für den Zeitraum 1999 bis 2007. Die geschätzten Input-Output Koeffizienten drücken die durchschnittlichen Kostenteile zum monetären Output des zugrundeliegenden Samples dar. Einflussfaktoren auf die Kosten wie Betriebsgröße, Standort und Spezialisierung können mittels Schätzung auf Basis entsprechend geschichteter Samples analysiert werden. Die Kosten je Einheit werden basierend auf den Schätzkoeffizienten und Outputs abgeleitet, und zwar je Hektar (für Weizen) sowie je Tonne für Weizen und Milch. Zwischen den Mitgliedstaaten bestehen erhebliche Unterschiede sowohl bei den Produktionskosten, dem monetären Output als auch den gekoppelten Direktzahlungen vor allem für Weizen und Milch.
Schlüsselwörter: ökonometrische Analyse, Produktionskosten
JEL: C39, Q12

ii Executive Summary/Zusammenfassung
Executive Summary
This study summarizes cost estimates based on the EU Farm Accountancy Data Network using the General Cost of Production Model, developed, applied and tested within the FACEPA project. Results are provided for wheat, pigs and milk for the main producer countries of the EU (Germany, France, Italy, Spain, The United Kingdom, Denmark, Belgium, The Netherlands, Sweden, Poland and Hungary).
Estimated input-output coefficients are generally based on monetary figures, expressing cost shares referring to total output. They are linear-proportional to output and are representing the average shares of the farm sample. Effects of scale, specialization and location can be derived by estimates based on respective sub-samples. Estimates are realized for all sample farms and specialized farms. Data are aggregated to 3 periods referring to Common Agricultural Policy (CAP) reforms and price development: 1999-2003 (Agenda 2000); 2004-2006 (the Mid-term Review before or including the first year of decoupling of direct payments) and 2007 (including decoupling and the rise of prices for milk and arable crops). Costs per unit are derived based on I-O coefficients and output values, providing costs per hectare or ton for wheat and per ton of milk. As quantities of sales of pigs are not available, respective unit costs can only be calculated referring to Livestock Units (LU) or heads.
Analysis of yields and prices over the whole period shows the large spread and variation between EU Member States. While yields of wheat generally decreased since 2004, there was a steady increase of milk yields. Prices of wheat and milk were decreasing due to CAP reforms until 2006; they strongly increased under the price boom in 2007.
Cost estimates for wheat are given per hectare and per ton of product. For soft wheat, crop specific costs per ton in Germany increased by one third and became the most important cost item in 2007. In France costs increased mainly due to increasing crop specific costs; as for other countries, energy costs are of minor importance. Denmark shows higher shares of overheads, depreciation and other fixed costs. Costs for durum wheat per ton in Italy are almost double those of soft wheat in other Member States.
Estimates per ton of milk show more similarities between countries regarding the development of costs and output level over time. Shares of feed costs on total output are 40 % in Spain and almost 50 % in Italy. However, crop specific costs are almost zero in both countries due to production systems with high shares of purchased roughage fodder. The share of energy costs varies from 3 to 10 % and for crop specific costs from almost zero to 10 %. Other specific costs are about 5 to 20 % in Italy and Germany, respectively. The income margin is almost 40 % in Belgium, The Netherlands, Poland and Italy and 25 % in Germany, France and Sweden.

iii Executive Summary/Zusammenfassung
Costs of pigs are referring to pig livestock units. As the production system is different between countries there are large regional differences of absolute cost values. Feed cost is the most important cost item. In all countries but Italy and Spain there is an increase over time mainly due to rising prices for cereals and proteins. Energy costs play a minor role while other specific costs, depreciation and other fixed costs are important in Germany, France, Denmark and the Netherlands. Output figures vary between Member States with highest levels in Italy and lowest levels in Spain and the United Kingdom. Margins vary over time due to pig price cycles and became negative in 2007 in almost half of considered countries due to rising feed costs.
Scale effects are analysed referring to economic size classes of specialized farms. In the case of wheat production costs per hectare in most cases are decreasing with the size of wheat area. In about half of the countries considered, small farms have very small or negative margins. Productions costs of milk are decreasing with the size of the dairy herd in Germany, Italy, Sweden and the Netherlands. Medium and large sized farms in most cases have higher output (prices) per ton of milk. Higher margins in medium and large sized farms are realised in Italy, Belgium and Netherlands. In some countries, scale effects are rather low. The variation of margins between countries is rather high. In the pig sector there is no clear tendency of costs and margins by farm size. This might partly be influenced by the heterogeneity of production systems, where breeding is often concentrated in smaller farms and fattening in larger farms. Compared to milk there is a higher share of farm groups with low or negative margins.
It can be summarized, that in addition to costs also the returns should be considered simultaneously to get a full picture of the economic performance. Although most of the results look reasonable there are still some ‘outstanding results.’ Some of these problems could be solved by a further check of the data and application of the method only for large samples.
Zusammenfassung
Im Rahmen dieser Studie werden Schätzungen von Produktionskosten basierend auf EU-Testbetriebsdaten (FADN) unter Verwendung eines in dem EU-Forschungsprojekt FACEPA entwickelten Modells durchgeführt. Ergebnisse werden für Weizen, Milch sowie für Schweine für die Hauptproduktionsländer der EU (Deutschland, Frankreich, Italien, Spanien, Großbritannien, Dänemark, Belgien, Niederlande, Schweden, Polen und Ungarn) dargestellt.
Die geschätzten Input-Output Koeffizienten drücken die durchschnittlichen Kostenteile zum monetären Output des zugrundeliegenden Samples dar. Einflussfaktoren auf die Kosten wie Betriebsgröße, Standort und Spezialisierung können mittels Schätzung auf Basis entsprechend geschichteter Samples analysiert werden. Für die Schätzungen werden die

iv Executive Summary/Zusammenfassung
Daten mit Bezug zu den Rahmenbedingungen der EU Agrarpolitik zu 3 Perioden zusammengefasst: 1999-2003 (Agenda 2000); 2004–2006 (Halbzeitbewertung vor bzw. einschließlich des ersten Jahres der Entkopplung der Direktzahlungen) sowie 2007 (einschließlich der Entkopplung sowie des starken Anstiegs der Preise für Milch und pflanzliche Produkte). Die Kosten je Einheit werden basierend auf den Schätzkoeffizienten und Outputs abgeleitet, und zwar je Hektar (für Weizen) sowie je Tonne für Weizen und Milch. Da die Verkaufsmengen an Schweinefleisch nicht in den Daten verfügbar sind, beziehen sich die für Schweine ausgewiesenen Ergebnisse auf die Vieheinheit Schweine insgesamt.
Die Erträge und Preise weisen im zugrunde liegenden Zeitraum relativ große Unterschiede zwischen den EU-Mitgliedstaaten auf. Während die Hektarerträge von Weizen seit 2004 zurückgingen, stiegen die Milcherträge je Kuh kontinuierlich an. Die Preise für Weizen und Milch nahmen infolge der Stützpreissenkung im Rahmen der Reformen der EU-Agrarmarktpolitik bis 2006 ab; unter dem Preisboom in 2007 sind sie jedoch stark angestiegen.
Die Ergebnisse der Kostenschätzung für Weizen werden je Hektar und pro Tonne ausgewiesen. In Deutschland stiegen die spezifischen Kosten pro Tonne für Weichweizen um ein Drittel an. Auch in Frankreich ist eine erhebliche Zunahme festzustellen, während die Energiekosten von geringerer Bedeutung waren. Dänemark zeigt höhere Anteile bei den Gemeinkosten sowie Abschreibungen. Die Kosten für Hartweizen in Italien liegen je Hektar auf Niveau von Weichweizen in den anderen Ländern; bezogen auf eine Tonne belaufen sie sich auf annähernd das Doppelte.
Die Schätzungen pro Tonne Milch zeigen geringere Unterschiede zwischen den Ländern bezüglich der zeitlichen Entwicklung. Auf Futterkosten entfallen die höchsten Anteile in Spanien (40 %) und Italien (fast 50 %). Der Anteil der Energiekosten variiert zwischen 3 und 10 % und der spezifischen Kosten der pflanzlichen Produktion (für die Erzeugung von Grundfutter und selbsterzeugten Getreides) zwischen 0 und 10 %. Die sonstigen spezifischen Kosten belaufen sich auf 5 bis 20 % des Outputs in Italien und Deutschland. Die Nettowertschöpfung bezogen auf den Output ist mit 40 % am höchsten in Belgien, den Niederlanden, Polen und Italien; in Deutschland, Frankreich und Schweden beträgt sie 25 %.
Die Kosten für Schweine beziehen sich auf eine Schweine-Vieheinheit. Da das Produktionssystem zwischen den Ländern verschieden ist, gibt es große regionale Unterschiede in den absoluten Kostenniveaus. Futterkosten sind die wichtigste Kostenart. Mit Ausnahme von Italien und Spanien ist eine starke Zunahme hauptsächlich wegen steigender Preise für Futtermittel festzustellen. Energiekosten spielen eine geringere Rolle, während sonstige spezifische Kosten, Abschreibungen und Gemeinkosten in Deutschland, Frankreich, Dänemark und den Niederlanden bedeutender sind. Der Output weist große Unterschiede
v Executive Summary/Zusammenfassung
zwischen den Mitgliedstaaten auf mit dem höchsten Niveau in Italien und dem niedrigsten in Spanien und Großbritannien. Aufgrund niedriger Schweinepreise und stark gestiegenen Futterkosten ergeben sich in der Hälfte der betrachteten Länder negative Einkommen.
Unterschiede in den Kosten in Abhängigkeit von der Betriebsgröße werden analysiert auf Basis von Samples von Betrieben mit Erzeugung des betreffenden Produktes, differenziert in jeweils drei Gruppen nach Anbaufläche für Weizen, Milchkühen bzw. Vieheinheiten Schweine. Im Fall von Weizen sind in den meisten Ländern mit dem Anbauumfang sinkende Produktionskosten pro Hektar festzustellen. In etwa der Hälfte der betrachteten Länder erzielen kleine Betriebe nur sehr geringe oder negative Einkommen im Weizenanbau. Die Produktionskosten von Milch nehmen mit der Größenklasse des Milchviehbestandes in Deutschland, Italien, Schweden und den Niederlanden ab. Mittlere und große Betriebe erzielen in den meisten Fällen etwas höhere Erlöse je Tonne Milch. In mittleren und großen Betrieben werden in Italien, Belgien und den Niederlanden höhere Einkommen erzielt. In einigen Ländern sind allerdings nur geringe Skaleneffekte zu verzeichnen. Im Schweinesektor zeichnen sich keine klaren Tendenzen in den Kosten und Einkommen in Abhängigkeit von der Betriebsgröße ab. Im Vergleich zu Milch gibt es einen höheren Anteil von Betriebsgruppen mit niedrigen oder negativen Einkommen.
Zusammenfassend ist festzustellen, dass bei überregionalen Vergleichen eine alleinige Betrachtung der Kosten nicht hinreichend ist, sondern dass die Erlöse und Einkommen simultan mit zu berücksichtigen sind. Obwohl die meisten Schätzergebnisse plausibel erscheinen, gibt es dennoch einige ‚Ausreißer’, die u. a. auf die Modelspezifikation zurückzuführen sind. Einige dieser Probleme könnten durch eine weitere Überprüfung der Daten bzw. Anwendung des Modells nur für große Samples behoben werden.


I Contents
Contents
Abstract/Kurzfassug i
Executive Summary/Zusammenfassung ii
1 Introduction 1
2 Methodology and data 3
2.1 Methodology 3
2.2 Data 4
3 Trends in yields and prices 7
4 Results of cost estimations 11
4.1 Estimates by Member States 11 4.1.1 Production costs for wheat 11 4.1.2 Production costs of milk 15 4.1.3 Production costs of pigs 17
4.2 Differentiation of production costs by farm size 18 4.2.1 Production costs for wheat by farm size 19 4.2.2 Production costs for milk by farm size 21 4.2.3 Production costs for pigs by farm size 22
4.3 Aggregated results by old and new Member States of the EU 24
Annex 1 A1
Annex 2 A5
Annex 3 A13
5 Conclusions 29
List of References 31
Country Codes
II Abbreviations
Abbreviations
FACEPA Farm Accountancy Cost Estimation and Policy Analysis of European Agriculture
FADN Farm Accountancy Data Network
FSS Farm Structure Survey
GECOM General Cost of Production Model
LU Livestock Unit
BEL Belgium
DAN Denmark
DEU Germany
ESP Spain
FRA France
HUN Hungary
ITA Italy
NED Netherlands
POL Poland
SVE Sweden
UKI United Kingdom

III List of Figures
List of Figures
Figure 1: Development of yields of soft wheat per hectare 7
Figure 2: Development of milk yields per dairy cow 8
Figure 3: Development of soft wheat price 8
Figure 4: Development of milk price 9
Figure 5: Development of pig output 10
Figure 6: Costs of wheat production per hectare by periods (Italy: durum wheat) 12
Figure 7: Costs, output and income of wheat production (Italy: durum wheat) 12
Figure 8: Costs structure per tonne of soft wheat production (Italy: durum wheat) 13
Figure 9: Costs, output and income of soft wheat production (Italy: durum wheat), per tonne 14
Figure 10: Cost shares (aggregated) of wheat referring to output 14
Figure 11: Cost structure of milk production 15
Figure 12: Costs, output and income of milk production 16
Figure 13: Cost shares (aggregated) of milk 16
Figure 14: Cost structure of pig production 17
Figure 15: Costs, output and income of pig production 17
Figure 16: Cost shares (aggregated) of pig 18
Figure 17: Cost, output and income of wheat production by farm size (Italy Durum wheat) 20
Figure 18: Cost, output and income of milk production by farm size 21
Figure 19: Cost, output and income of pig production by farm size 23
Figure 20: Production costs of soft wheat (EUR/t), aggregated by years and EU-15 and EU-12 Member States 24
Figure 21: Production costs of cow milk (EUR/t), aggregated by years and EU-15 and EU-12 Member States 25
Figure 22: Production costs of pigs (EUR/pigLU), aggregated by years and EU-15 and EU-12 Member States 27

IV List of Tables
List of Tables
Table 1: Average output/unit and average cost shares, weighted by the aggregated output per country considered and periods 26

List of Tables in the Annex V
List of Tables in the Annex
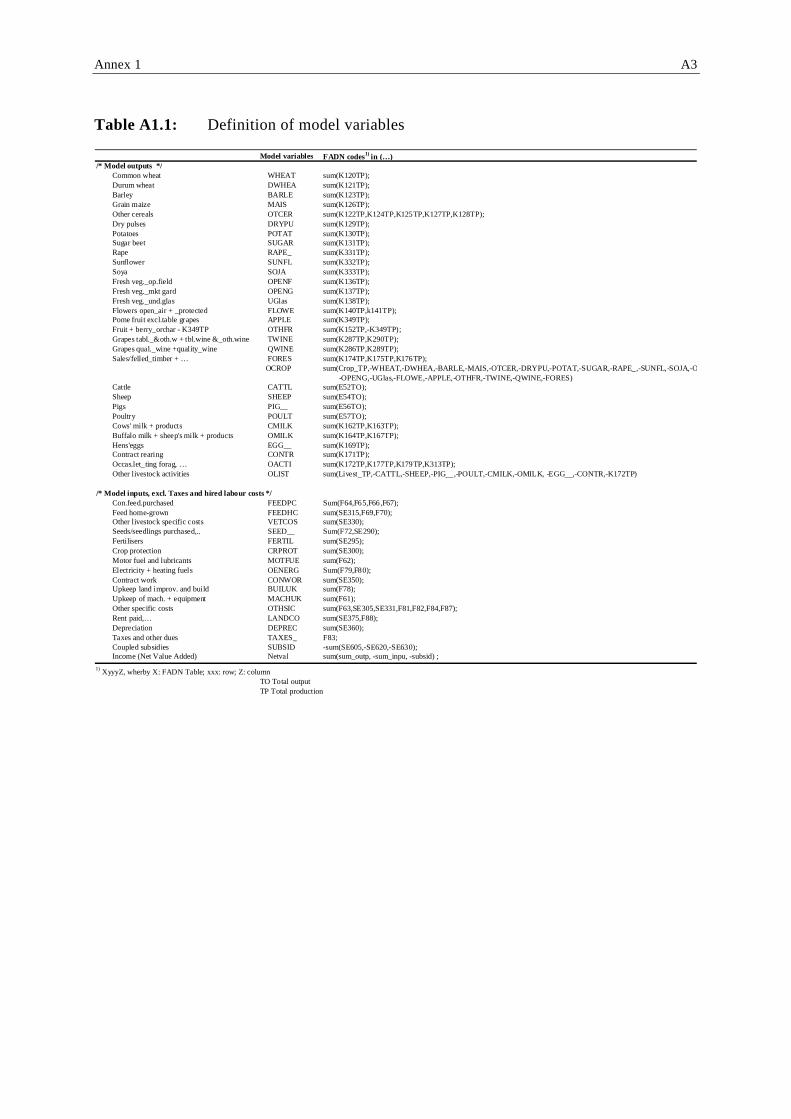
Table A1.1: Definition of model variables A3
Table A1.2: List of inputs and cost aggregation A4
Table A1.3: Country codes A4
Table A2.1: Input-Output coefficients (1) A7
Table A2.1: Input-Output coefficients (2) A8
Table A2.2: T-Values of coefficients (1) A9
Table A2.2: T-Values of coefficients (2) A10
Table A2.3: R-Suare adjusted of equations A11
Table A3.1: Cost shares of wheat A15
Table A3.2: Cost shares of milk A16
Table A3.3: Cost shares of pigs A17


1 Chapter 1 Introduction
1 Introduction
Standard farm-accounting information is typically restricted to aggregate or whole-farm input expenditures, without revealing production costs per unit of each enterprise’s output
1. Obtaining information on the per-unit production costs for the individual activities,
measured by so-called input-output coefficients, is particularly important, both from a business-management and agricultural-policy perspective. Specifically, farmers may need this kind of information for evaluating the performances of their individual enterprises. Moreover, information on enterprise-level costs of production may be helpful in preparing activity budgets, planning yearly operations, applying for operational loans, and analyzing alternative marketing strategies. Likewise, policy-makers may want to have such kind of information, as it would considerably improve their capability of properly assessing the consequences of agricultural policy and technology scenarios on the economic performances of different types of farms. If aggregated to higher levels, costs shares derived from farm accounting data may also provide a source of up-to date information for aggregated economic agricultural sector models.
Direct collection of enterprise-level information via farm surveys is time-consuming and costly, and existing studies are therefore often limited to small samples. Alternative tools based on econometric techniques may offer an attractive alternative for obtaining reliable estimates of unit cost of production in agriculture at a significantly lower cost. It is the purpose of the research project Farm Accountancy Cost Estimation and Policy Analysis of European Agriculture (FACEPA) to implement this approach for the estimation of cost of production using existing information from Farm Accountancy Data Networks (FADN) for the EU and national Member States.
The study summarizes cost estimates based on EU-FADN using the ‘General Cost of Production Model’ (GECOM) developed, applied and tested within the FACEPA project. The report includes a short description of the econometric model and data processing. Results are given for 3 main products (wheat, pigs and milk) for main producer countries
2
(Germany, France, Italy, Spain, The United Kingdom, Denmark, Belgium, The Netherlands, Sweden, Poland and Hungary). Data are pooled for three periods, which refers to breaks in price developments: the first: 1999–2003; the second: 2004-2006; and the third: 2007. In addition to average figures, results are differentiated by farm size to identify possible scale effects.
1 See http://www2.ekon.slu.se/facepa/documents/FACEPA_DoW_2010_11_05.pdf.
2 A list of country codes is given in Annex1, Table A1.3.


3 Chapter 2 Methodology and data
2 Methodology and data
2.1 Methodology
The econometric model aims at the estimation of Input-Output coefficients (better I-O shares) based on Farm Accounting Data of EU- or national FADNs. The principles were developed by POLLET et al. (2001) and PINGAULT and DESBOIS (2003). Within the FACEPA project, the method is further developed, tested in countries of project partners and applied using improved and more user-friendly software packages (OFFERMANN, 2011; KLEINHANß, 2011; OFFERMANN and KLEINHANß 2011).
The model estimates input-output coefficients from FADN data. To estimate the costallocation coefficients from farm accounting data a set of linear equations is considered where the derived demand from farm f for each input i is represented as a function of several outputs k. The output of the various products is denoted yk (k = 1,..,K) and the xi (i =1,...I) represent the non-allocated costs of the production factors. Assuming I inputs used by F farms to produce K outputs the set of equations can be written as (PEETERS and SURRY 2003):
K
xif = ∑β ik ykf + uif , [1] k =1
where
– xif is the total cost of input i paid by farm f (including subsidies and net value added),
– ykf is the total value of output k produced by farm f,
– βik is the unknown technical production coefficient, which is defined as the average (for all farms) expenditure on input i required to produce one unit of output value k,
– uif is the error term specific to each input and farm.
On each farm f, the observed costs in input i differ from the theoretical costs by a random term ujf of zero expectation and is independent from one farm to the next. In order to achieve the accounting consistency of the model, a constraint ensures that the sum of output values equals the sum of input costs plus net value added the model is estimated subject to:
K
∑ βik = 1 [2] k =1
This equation ensures that the production coefficients add up to one. Equations are specified without constant term. For the FACEPA project, the production cost analysis includes up to 18 aggregated input categories, including subsidies (defined as negative in

4 Chapter 2 Methodology and data
put) and net value added, as well as 31 output categories. The model was estimated using SAS based on the so-called seemingly unrelated regression (SUR) procedure (‘PROC SYSLIN’). A complete description of the GECOM model, the econometric specifications and estimation procedures is given in Surry et al., (forthcoming).
The subsidies enter the model as an independent variable with negative values. Thus, it is possible to derive the average amount of subsidies associated with the production of one unit of output value k. The net value added is composed of the sum of output value plus subsidies minus input costs. Using the aforementioned nomenclature this relation can be written as:
K I −1
Net value added f = ∑ ykf −∑ xif [3] k =1 i =1
If pk is the price of one ton of output k , the unit cost of production per ton in xi for yk is:
Cik = βik * pk
Similarly, it is also possible to calculate costs per hectare or per livestock unit.
Input-output (I-O) coefficients are generally based on monetary figures, expressing cost shares referring to total output. They are linear- proportional to output and are representing the average shares of the farm sample. Effects of scale, specialization and location can be derived by estimates based on respective sub-samples.
The method has some limits: estimates are sensitive to outliers, the problem of multicollinearity exists and estimates are sometimes unstable for small samples. As a general rule, a minimum sample size of at least several hundred observations is required.
3 For this
study, a procedure developed by vTI is used to delete observations with outliers (BAHTA
et al., 2011).
2.2 Data
The Farm Accountancy Data Network (FADN) is a European system of sample surveys conducted every year to collect structural and accountancy data on farms, with the aim of monitoring the income and business activities of agricultural holdings and evaluating the impact of the measures taken under the Common Agricultural Policy. The FADN survey covers only farms above a minimum size (threshold) in order to include the most relevant
3 Entropy estimators may provide an alternative for small samples (BERNER et al., 2011).

5 Chapter 2 Methodology and data
part of the agricultural activity of the EU Member States, i. e. at least 90 % of the total standard gross margin covered in the Farm Structure Survey (FSS). For 2007, the sample consists of approximately 78.000 holdings in the EU-27, which represent 5.4 million farms (39 %) out of a total of some 14 million farms included in the FSS.
4
Given the great variety within the FADN field of observation, stratified sampling is applied to ensure that the sample of farms adequately reflects this heterogeneity. Stratification as well as procedures and methodology to select sample farms vary among Member States. Weighting factors are used to extrapolate the EU FADN sample. These weighting factors also have to be taken into account when specifying a cost of production model which aims to reflect the input-output allocation on the Member State level to prevent distorted results. An analysis of the representativeness of the EU-FADN comparing a set of various structural variables between EU-FADN and the FSS (HANSEN et al., 2009) indicate that, on an EU average, the coverage and representativeness is relatively large for the variables under study. However, considering the single Member States reveals that in some cases significant differences exist cross-sectionally.
For this study, information from the EU FADN covering the period 1999–2007 was used. To increase robustness of results and facilitating interpretation, yearly data were aggregated to 3 periods (referring to CAP reforms and price development): 1999–2003 (Agenda 2000); 2004–2006 (the Mid-term Review before or including the first year of decoupling of direct payments) and 2007 (including decoupling and the rise of prices for milk and arable crops).
Costs per unit are derived based on I-O coefficients. This is done for costs per hectare or ton for arable crops and per ton of milk. As quantities of sales of pigs are not available, unit costs can only be calculated referring to Livestock Units (LU) or heads. In the analysis we use LU as denominator. Although the model is rather differentiated with regard to cost categories, we aggregate costs into main cost categories for the description of results (see Annex 1, Tables A1.1–A1.3). The income indicator used for the estimation is rather close to the definition of net value added, i. e. income in the following equals revenues including coupled subsidies minus all costs excluding land, labour and capital.
http://ec.europa.eu/agriculture/analysis/fadn/index_en.htm 4


7
3 Trends in yields and prices
Chapter 3 Trends in yields and prices
Figure 1 shows the development of yields of soft wheat derived from FADN data in the EU Member States considered. There is a wide spread of yields of about 3 tons/ha in Spain and of 8–9 tons/ha in the United Kingdom and Belgium, which is mainly determined by natural conditions. Yield trends can be characterized as follows: Almost stable yields from 1999–2001, decreasing yields until 2003, yield increases in 2004 and decreasing yields since then. In contrast to this trend there are some exceptions: almost stable yields over the whole period in Denmark and Sweden, increasing yields from 2003 to 2006 in Italy, low yields in Spain in 2005 due to draught and almost doubling of yields until 2007. In Poland and Hungary yield levels are below all other Member States but Spain; due to weather conditions yields decreased until 2006 in Poland and until 2007 in Hungary.
Figure 1: Development of yields of soft wheat per hectare
Ton
/ha
9
8
7
6
5
4
3
2
BEL
DAN
DEU
ESP
FRA
ITA
NED
POL
SVE
UKI
HUN
1999 2000 2001 2002 2003 2004 2005 2006 2007
Source: EU-FADN-DG AGRI L-3; FACEPA.
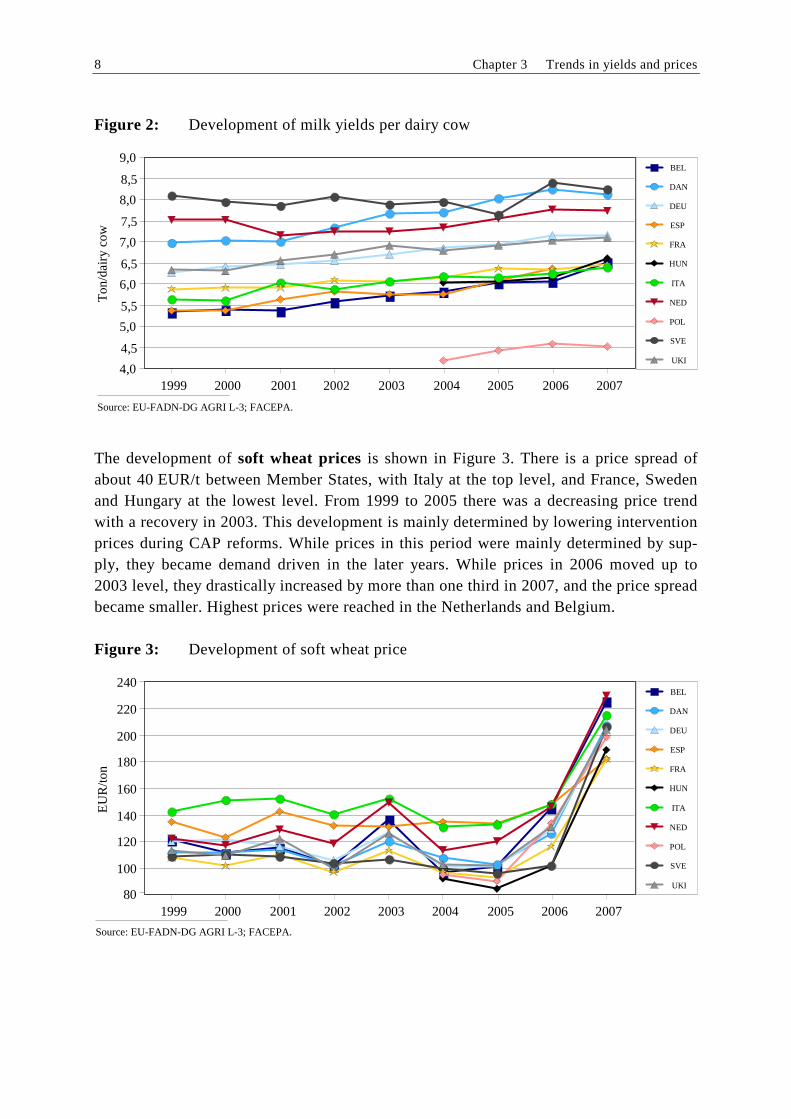
Milk yields per dairy cow were rather stable from 1999 to 2001 (Figure 2). Since then they continuously increased until 2007, resulting in an accumulated increase by approximately 1 ton/cow in most countries. Milk yields are much below averages in Poland but increased by about 0.5 ton/cow since accessing the EU. Yields in Hungary are slightly below EU average yields. Yields are highest in Sweden, Denmark and The Netherlands, of which Denmark shows highest increases of about 1.5 tons/cow in the underlying period.
9,0
8,5
8,0
7,5
7,0
6,5
6,0
5,5
5,0
4,5
4,0 1999 2000 2001 2002 2003 2004 2005 2006 2007
BEL
DAN
DEU
ESP
FRA
ITA
NED
POL
SVE
UKI
HUN
Ton
/dai
ry c
ow
Source: EU-FADN-DG AGRI L-3; FACEPA.
240
EU
R/to
n
220
200
180
160
140
120
100
80
BEL
DAN
DEU
ESP
FRA
ITA
NED
POL
SVE
UKI
HUN
1999 2000 2001 2002 2003 2004 2005 2006 2007
Source: EU-FADN-DG AGRI L-3; FACEPA.
8 Chapter 3 Trends in yields and prices
Figure 2: Development of milk yields per dairy cow
The development of soft wheat prices is shown in Figure 3. There is a price spread of about 40 EUR/t between Member States, with Italy at the top level, and France, Sweden and Hungary at the lowest level. From 1999 to 2005 there was a decreasing price trend with a recovery in 2003. This development is mainly determined by lowering intervention prices during CAP reforms. While prices in this period were mainly determined by supply, they became demand driven in the later years. While prices in 2006 moved up to 2003 level, they drastically increased by more than one third in 2007, and the price spread became smaller. Highest prices were reached in the Netherlands and Belgium.
Figure 3: Development of soft wheat price

9 Chapter 3 Trends in yields and prices
EU
R/to
n
Milk prices increased until 2001 and then decreased due to milk market reform with a lowering of intervention prices (Figure 4). The price increase in 2007 is above average in Germany, while surprisingly there were decreasing milk prices in Spain. Italy shows the highest milk price level, while it is lowest in the United Kingdom. Prices are even lower in Poland and Hungary, however in Poland they increased by more than 70 EUR/t since EU membership.
Figure 4: Development of milk price
450
400
350
300
250
200
150
Source: EU-FADN-DG AGRI L-3; FACEPA.
1999 2000 2001 2002 2003 2004 2005 2006 2007
BEL
DAN
DEU
ESP
FRA
ITA
NED
POL
SVE
UKI
HUN
Prices of pork can’t be derived from FADN data because slaughter weights are not available. Therefore pig prices are represented by sales value per Livestock Unit (LU); see Figure 5. As the intensity of pig production differs, there is a large spread of pig output from 500 to 1.000 EUR/LU. In some of the Member States, like Sweden and the United Kingdom, prices are rather stable in time, but there is a considerable variation in Denmark, Italy and Germany. The price development is largely influenced by pig price cycles, although yearly averages don’t show the rather large variations which are observed in shorter time periods.

EU
R/L
U
1200
1100
1000
900
800
700
600
500
400
BEL
DAN
DEU
ESP
FRA
ITA
NED
POL
SVE
UKI
HUN
1999 2000 2001 2002 2003 2004 2005 2006 2007
Source: EU-FADN-DG AGRI L-3; FACEPA.
10 Chapter 3 Trends in yields and prices
Figure 5: Development of pig output
11 Chapter 4 Results of cost estimations
4 Results of cost estimations
In the following, results are presented for selected EU Member States estimates based on the total sample. In a further step, results are shown differing by farm size based on subsamples of farms with positive output values of products considered. In a last step results are aggregated for Member States of EU-15 and EU-10, respectively.
4.1 Estimates by Member States
4.1.1 Production costs for wheat
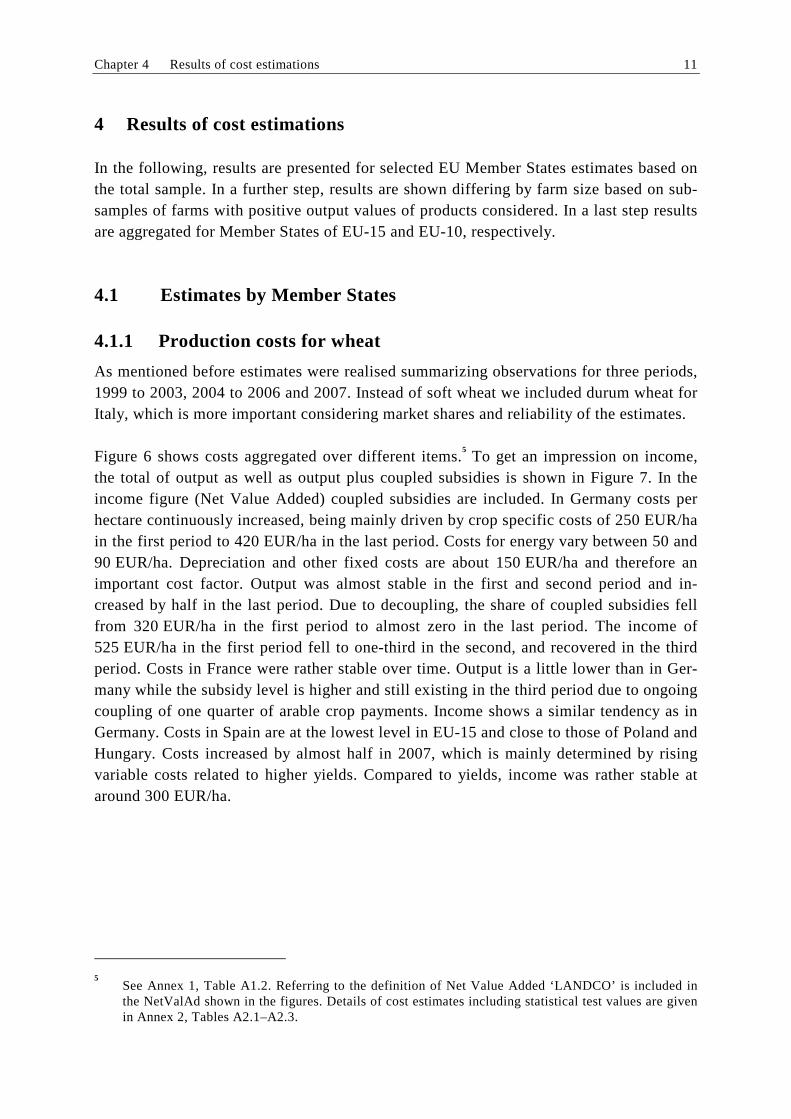
As mentioned before estimates were realised summarizing observations for three periods, 1999 to 2003, 2004 to 2006 and 2007. Instead of soft wheat we included durum wheat for Italy, which is more important considering market shares and reliability of the estimates.
Figure 6 shows costs aggregated over different items.5
To get an impression on income, the total of output as well as output plus coupled subsidies is shown in Figure 7. In the income figure (Net Value Added) coupled subsidies are included. In Germany costs per hectare continuously increased, being mainly driven by crop specific costs of 250 EUR/ha in the first period to 420 EUR/ha in the last period. Costs for energy vary between 50 and 90 EUR/ha. Depreciation and other fixed costs are about 150 EUR/ha and therefore an important cost factor. Output was almost stable in the first and second period and increased by half in the last period. Due to decoupling, the share of coupled subsidies fell from 320 EUR/ha in the first period to almost zero in the last period. The income of 525 EUR/ha in the first period fell to one-third in the second, and recovered in the third period. Costs in France were rather stable over time. Output is a little lower than in Germany while the subsidy level is higher and still existing in the third period due to ongoing coupling of one quarter of arable crop payments. Income shows a similar tendency as in Germany. Costs in Spain are at the lowest level in EU-15 and close to those of Poland and Hungary. Costs increased by almost half in 2007, which is mainly determined by rising variable costs related to higher yields. Compared to yields, income was rather stable at around 300 EUR/ha.
See Annex 1, Table A1.2. Referring to the definition of Net Value Added ‘LANDCO’ is included in the NetValAd shown in the figures. Details of cost estimates including statistical test values are given in Annex 2, Tables A2.1–A2.3.
5

1000
800 Depreciation & other fix costs
Overheads
Other specific costs
Energy
Crop specific costs
Cost aggregates
DEU FRA ESP ITA UKI DAN SVE BEL NED POL HUN
1 2 3 1 2 3 1 2 3 1 2 3 1 2 3 1 2 3 1 2 3 1 2 3 1 2 3 2 3 2 3
600
400
200
0
EU
R/h
a
Period
Periods: 1 = 1999-03; 2 = 2004-06; 3 = 2007. Source: EU-FADN-DG AGRI L-3; FACEPA.
12 Chapter 4 Results of cost estimations
Figure 6: Costs of wheat production per hectare by periods (Italy: durum wheat)
Figure 7: Costs, output and income of wheat production (Italy: durum wheat)
1800
DEU FRA ESP ITA UKI DAN SVE BEL NED POL HUN
1 2 3 1 2 3 1 2 3 1 2 3 1 2 3 1 2 3 1 2 3 1 2 3 1 2 3 2 3 2 3
Σ Costs
Output + coupled subsidies
Output
Net value added
-51
2056
EU
R/h
a
1600
1400
1200
1000
800
600
400
200
0 Period
Periods: 1 = 1999-03; 2 = 2004-06; 3 = 2007. Source: EU-FADN-DG AGRI L-3; FACEPA.
Cost estimates for Italy refer to durum wheat. Costs are at the level of soft wheat in other Member States. Income was negative in the second period due to the implementation of decoupling of most subsidies, but it recovered in the third period thanks to the rise of product price.
Costs in the United Kingdom were relatively high (about 900 EUR/ha) and almost stable in time, as were individual cost items. While output was at the total cost level, it increased to 1.550 EUR/ha in 2007. Income shows the same development and levels as in France and Germany. Total costs in Denmark and Sweden are similar but with a higher

13 Chapter 4 Results of cost estimations
share of energy costs in Sweden. The output level is slightly higher in Denmark and hence income as well. Costs for The Netherlands are only plausible in the first and second period; they are slightly increasing while incomes lowered due to decoupling. Estimates for Poland and Hungary only cover the second and third period. Costs were about 400 EUR/ha in Poland and 300 EUR/ha in Hungary in the second period; they increased to 450 EUR/ha in both countries in the third period. Output increased by two thirds. As in the New Member States subsidies are almost fully decoupled under the SAPS regime (Single Area Payment Scheme) they don’t influence the income development. Income (Net Value Added) increased from about 150 to 350 EUR/ha.
Due to the large variation of yields costs referring to quantities produced (ton) are more appropriate for an EU-wide comparison (see Figures 8 and 9). Costs for durum wheat in Italy are almost double those of soft wheat in other Member States. In the second period costs were considerably higher than output, which indicates that durum production without coupled subsidies was not competitive at that time. However it became competitive in 2007 thanks to high prices.
Figure 8: Costs structure per tonne of soft wheat production (Italy: durum wheat)
EU
R/t
on
250
200
150
100
50
0 Period
DEU FRA ESP ITA UKI DAN SVE BEL NED POL HUN
1 2 3 1 2 3 1 2 3 1 2 3 1 2 3 1 2 3 1 2 3 1 2 3 1 2 3 2 3 2 3
Depreciation & other fix costs
Overheads
Other specific costs
Energy
Crop specific costs
Cost aggregates
Periods: 1 = 1999-03; 2 = 2004-06; 3 = 2007. Source: EU-FADN-DG AGRI L-3; FACEPA.
For soft wheat, crop specific costs in Germany increased by one third and became the most important cost item in 2007. In France costs increased from 105 to 120 EUR/t mainly due to increasing crop specific costs; as for other countries, energy costs are of minor importance. In the United Kingdom the cost level is close to France but with a lower cost level in the second period. In the first and second period costs were equal to output imposing low incomes without subsidies. Cost level and development in Denmark is close to Germany but with a higher share of overheads, depreciation and other fixed costs. Costs in Sweden show a comparable development to the United Kingdom but with a higher share of energy costs. Costs in The Netherlands were rather stable in the first and

Figure 10: Cost shares (aggregated) of wheat referring to output
160
140
120
100
Depreciation & other fix costs
Overheads
Other specific costs
Energy
Crop specific costs
Cost aggregates
DEU FRA ESP ITA UKI DAN SVE BEL NED POL HUN
1 2 3 1 2 3 1 2 3 2 3 1 2 3 1 2 3 1 2 3 2 3 1 2 2 3 2 3
% o
utpu
t
80
60
40
20
0 Period
Periods: 1 = 1999-03; 2 = 2004-06; 3 = 2007. Source: EU-FADN-DG AGRI L-3; FACEPA.
Figure 9: Costs, output and income of soft wheat production (Italy: durum wheat), per tonne
250
EU
R/t
on
200
150
100
50
0 Period
DEU FRA ESP ITA UKI DAN SVE BEL NED POL HUN
1 2 3 1 2 3 1 2 3 1 2 3 1 2 3 1 2 3 1 2 3 1 2 3 1 2 3 2 3 2 3
Σ Costs
Output + coupled subsidies
Output
Net value added
333 280 325
-16
Periods: 1 = 1999-03; 2 = 2004-06; 3 = 2007. Source: EU-FADN-DG AGRI L-3; FACEPA.
14 Chapter 4 Results of cost estimations
second period. Costs in Poland are a bit lower in the two considered periods with high shares of variable costs. In Hungary costs were only 60 EUR/t in the second period, but doubled in the third period.
Cost shares for wheat are shown in Figure 10 and Annex 3, Table A3.1. As mentioned earlier, costs for land, labour and capital are not included in the cost aggregates and therefore the share of total costs is less than 100 % in most cases, even if not regarding subsidies. Energy costs are around 5 to 15 % of output. Especially depreciation and other fixed costs show a high variation between countries.

15 Chapter 4 Results of cost estimations
Generally, the results show that production costs per ton of wheat increased over the three periods in most countries. While costs as a share in total output increased from periods one to period two, in 2007 the increase in output prices was higher than that of input prices, leading to higher incomes of producers.
4.1.2 Production costs of milk
Cost estimates per ton are shown in Figures 11 and 12. Compared to wheat there are more similarities between countries regarding the development of costs and output level over time. While costs were stable in the first and second period, they increased in 2007 mainly due to increasing feed costs. Total cost level is quite different with costs of 220 to 280 EUR/ton in Germany, France, Italy, Denmark and Sweden. With the exception of Italy, price levels and income development are quite similar. Milk prices in Italy are highest, and with costs of around 250 EUR/t, the income is high and almost double that of farms in France.
Figure 11: Cost structure of milk production
Periods: 1 = 1999-03; 2 = 2004-06; 3 = 2007. Source: EU-FADN-DG AGRI L-3; FACEPA.
Depreciation & other fix costs
Overheads
Other specific costs
Energy
Crop specific costs
Feed costs
Cost aggregates
DEU FRA ESP ITA UKI DAN SVE BEL NED POL HUN
1 2 3 1 2 3 1 2 3 1 2 3 1 2 3 1 2 3 1 2 3 1 2 3 1 2 3 2 3 2 3
300
250
200
150
100
50
0
Period
EU
R/t
on
Lower costs with 170 to 200 EUR/t are given for Spain, the United Kingdom, Belgium and the Netherlands. Income in Belgium and The Netherlands is rather high. While costs are lowest in Poland, Hungary ranges at the top level, and the income situation is worse in Hungary. What’s interesting is the different cost structure, especially between feed and remaining cost categories. While feed costs are around 60 EUR/t of milk in France, Belgium and The Netherlands, they reach 160 to 180 EUR/t in Italy and also relatively high levels in Spain and Sweden. Some of these differences might be due to high shares of purchased concentrated and roughage feed.

Figure 12: Costs, output and income of milk production
400
EU
R/to
n
350
300
250
200
150
100
50
0 Period
DEU FRA ESP ITA UKI DAN SVE BEL NED POL HUN
1 2 3 1 2 3 1 2 3 1 2 3 1 2 3 1 2 3 1 2 3 1 2 3 1 2 3 2 3 2 3
Σ Costs
Output + coupled subsidies
Output
Net value added
Periods: 1 = 1999-03; 2 = 2004-06; 3 = 2007. Source: EU-FADN-DG AGRI L-3; FACEPA.
Figure 13: Cost shares (aggregated) of milk production
120
100
80
Depreciation & other fix costs
Overheads
Other specific costs
Energy
Crop specific costs
Feed costs
Cost aggregates
DEU FRA ESP ITA UKI DAN SVE BEL NED POL HUN
1 2 3 1 2 3 1 2 3 1 2 3 1 2 3 1 2 3 1 2 3 1 2 3 1 2 3 2 3 2 3
% o
utpu
t
60
40
20
0 Period
Periods: 1 = 1999-03; 2 = 2004-06; 3 = 2007. Source: EU-FADN-DG AGRI L-3; FACEPA.
16 Chapter 4 Results of cost estimations
Regarding cost shares shown in Figure 13 and Annex 3, Table A3.2, there are high shares of feed costs of 40 % in Spain and almost 50 % in Italy. On the other side crop specific costs are almost zero in both countries due to production systems with high shares of purchased roughage fodder. The share of energy costs vary from 3 to 10 % and for crop specific costs (implicit costs for roughage fodder production) from almost zero to 10 %. Other specific costs are about 5 to 20 % in Italy and Germany, respectively. Cost shares for overheads as well as depreciation and other fixed costs are in the same magnitude. The income share is almost 40 % in Belgium, The Netherlands, Poland and Italy and 25 % in Germany, France and Sweden.

17 Chapter 4 Results of cost estimations
4.1.3 Production costs of pigs
In Figure 14 and 15 costs refer to Livestock Units (LU). As the production system is different between countries there are large regional differences of absolute cost values. Of interest are therefore margins between total costs and output (=income). It has to be mentioned that no subsidies for pig production were considered in the model specification and livestock replacement is implicitly included in net-output or other specific costs.
Figure 14: Cost structure of pig production
0
200
400
600
800
1000
Periods: 1 = 1999-03; 2 = 2004-06; 3 = 2007. Source: EU-FADN-DG AGRI L-3; FACEPA.
Depreciation & other fix costs
Overheads
Other specific costs
Energy
Feed costs
Cost aggregates
EU
R/L
U
DEU FRA ESP ITA UKI DAN SVE BEL NED POL HUN
Period 1 2 3 1 2 3 1 2 3 1 2 3 1 2 3 1 2 3 1 2 3 1 2 3 1 2 3 2 3 2 3
Figure 15: Costs, output and income of pig production
EU
R/L
U
DEU FRA ESP ITA UKI DAN SVE BEL NED POL HUN
Period 1 2 3 1 2 3 1 2 3 1 2 3 1 2 3 1 2 3 1 2 3 1 2 3 1 2 3 2 3 2 3
Σ Costs
Output
Net value added
0
200
400
600
800
1000
-32 -127
Periods: 1 = 1999-03; 2 = 2004-06; 3 = 2007. Source: EU-FADN-DG AGRI L-3; FACEPA.

18 Chapter 4 Results of cost estimations
Feed cost is the most important cost item. In all countries but Italy and Spain there is an increase in time mainly due to rising prices for cereals and proteins. Energy costs play a minor role while other specific costs, depreciation and other fixed costs are important in Germany, France, Denmark and the Netherlands.
Output figures vary between Member States with highest levels in Italy and lowest levels in Spain and the United Kingdom. Thanks to price levels income is highest in Italy, followed by Spain. In main pig-producing countries, income is about 100 to 200 EUR/ LU. It varies in time due to pig price cycles and became negative in 2007 in almost half of considered countries due to rising feed costs.
Cost shares referring to output are shown in Figure 16 and Annex 3, Table A3.3. In most countries, the share of feed costs is about 45 to 55 %, while it is only 40 % in Italy. Other cost items are in a range of 30 % of output in main producer countries and the remaining income is about 15 to 25 %. The other cost items account for only 10 % of output value in Spain and Italy, so that high margins remain.
Figure 16: Cost shares (aggregated) of pig production
0
Periods: 1 = 1999-03; 2 = 2004-06; 3 = 2007. Source: EU-FADN-DG AGRI L-3; FACEPA.
DEU FRA ESP ITA UKI DAN SVE BEL NED POL HUN
1 2 3 1 2 3 1 2 3 1 2 3 1 2 3 1 2 3 1 2 3 1 2 3 1 2 3 2 3 2 3
Depreciation & other fix costs
Overheads
Other specific costs
Energy
Crop specific costs
Feed costs
Cost aggregates 120
100
80
60
40
20
Period
% o
utpu
t
4.2 Differentiation of production costs by farm size
Impacts of size, location, etc., can be assessed by estimating production costs for respectively stratified subsamples. In the following sections, the subsamples selected for the three analysed products include only farms with a positive value of wheat area, dairy cow livestock unit, or pig livestock unit, respectively. Within these subsamples a further dif

19 Chapter 4 Results of cost estimations
ferentiation is made by three size classes (S = Small; M = Medium; L = Large) according to the following delimitations:
– Total wheat area : ‘S’: >0 -<25 ha; ‘M’: 25–100 ha; ‘L’: >100 ha
– Total LU dairy cows: ‘S’: >0 -<25 LU; ‘M’: 25–100 LU; ‘L’:>100 LU
– Total pig LU : ‘S’: >0 -<50 LU; ‘M’: 50–150 LU; ‘L’: >150 LU
In case of small samples or inconsistent estimates, results were excluded in the following figures.
4.2.1 Production costs for wheat by farm size
Results for wheat are shown in Figure 17 by Member States, periods and size within the periods; they are expressed on a hectare base. In Germany, there are significant cost reductions between the 1st and 2nd size classes of about 250 EUR/ha, while there are slightly higher costs in large farms. Energy costs, other specific costs and overheads are the main determinants of higher costs of small farms. Margins are close to zero in the smallest farms and the 2nd size class achieves the highest net value added.
In France there is a continuous cost digression over all size classes and rising margins with size; this is true for all periods. Income in the 3rd size class (in period 3) is of about 450 EUR/ha higher than in small farms, which is partly due to higher returns of larger farms, especially in the last period (2007).
Results for Spain show decreasing costs with farm size in the 1st and 2nd period. While costs are significantly lower in the largest farms, size effects are rather low in period 3. Output is lower in larger farms especially in periods 1 and 3. Therefore the income variation by size is indifferent in period 1, increasing in period 2 and decreasing in period 3.
In the case of durum wheat in Italy there is a clear tendency of decreasing costs with farm size. However, in the 1st and 2nd period, the lower costs are matched by lower output values, and thus net value added is rather similar. In the last period, the net value added in large farms is almost twice that of small farms.
In the United Kingdom costs are decreasing considerably with the size of wheat area. Income in the largest farms is of about 500 EUR/ha higher than in the 1st size class. Income in small farms almost zero in the 1st period, became negative in the 2nd period and was still low in the 3rd period.
Scale effects as well as income levels and variation by farm size in Denmark are similar to the United Kingdom. Sweden shows very high costs in the smallest size class, resulting

1750
1500
1250
Σ Costs
Output + coupled subsidies
Net value added
ESU S M L S M L S M L S M L S M L S M L S M L S M L S M L S M L S M L S M L S M L S M L S M L
Period 1 2 3 1 2 3 1 2 3 1 2 3 1 2 3
DEU FRA ESP ITA UKI
1750
1500
1250
-7 -400
S M L
1 2 3
DAN SVE POL HUN
S M L S M L S M L S M L S M L S M L S M L S M L S M L 1 2 3 2 3 2 3
-309 -31 -700 -19 -59
EU
R/h
a 1000
750
500
250
0
EU
R/h
a 1000
750
500
250
0 ESU
Period
Periods: 1 = 1999-03; 2 = 2004-06; 3 = 2007. Source: EU-FADN-DG AGRI L-3; FACEPA.
20 Chapter 4 Results of cost estimations
in negative incomes in all periods. Large farms gain positive incomes, especially in the 3rd period under conditions of high wheat prices.
6
In Poland costs don’t differ much between small and medium sized farms. However, output and farm net value added is higher in larger farms.
In Hungary costs are decreasing with size (especially between small and medium size class). Output is higher in larger farms. While income is close to zero in small farms, larger farms reach net value added of about 150 to 250 EUR/ha
Figure 17: Cost, output and income of wheat production by farm size (Italy durum wheat)
Due to small sample size the cost estimates for Belgium and Netherlands are not reliable and are therefore not shown.
6

450
400
350
300
Σ Costs
Output + coupled subsidies
Net value added
EU
R/to
n 250
200
150
100
50
0 ESU
Period
450
400
350
300
EU
R/t
on
250
200
150
100
50
0 ESU
Period
S M L
1 2 3 1 2 3 1 2 3 1 2 3 1 2 3
DEU FRA ESP ITA UKI
S M L S M L S M L S M L S M L S M L S M L S M L S M L S M L S M L S M L S M L S M L
DAN SVE NED HUN
S M L 1 2
S M L S M L S M L S M L S M L S M L S M L S M L S M L S M L S M L S M L 1 2 3 1 2 3 1 2 3 2 3
BEL
Periods: 1 = 1999-03; 2 = 2004-06; 3 = 2007. Source: EU-FADN-DG AGRI L-3; FACEPA.
21 Chapter 4 Results of cost estimations
4.2.2 Production costs for milk by farm size
Results for milk are summarized in Figure 18. In Germany total costs are slightly decreasing in the 2nd and 3rd period, which is mainly due to lower other specific costs and depreciation. With the exception of the last period, the milk price is highest in larger farms. Medium sized farms realise higher margins than small farms, and, with the exception of the 2nd period, higher margins than large farms.
In France costs in small farms are lower (1st and 2nd period) or equal (3rd period) to that of large farms. This results in margins decreasing slightly with farm size, with the exception of period 3.
Figure 18: Cost, output and income of milk production by farm size

22 Chapter 4 Results of cost estimations
Compared to the small farms costs are higher in the medium sized farms in Spain. In the first two periods large farms show lower costs than the medium sized. Income in large farms is slightly or significantly higher in the 1st and 2nd period, but considerably lower in the 3rd period.
Small farms in Italy show the highest costs and lower milk prices, resulting in low incomes compared to larger farms.
In the United Kingdom significant scale effects – and rising income – can only be identified for the 1st period. Milk prices are lower than in Germany and France which leads to a rather low net value added. For Denmark, due to small sample sizes, results are only shown for the 1st and 2nd period. There are no clear scale effects on the cost side.
Sweden shows a high cost level and costs decreasing by farm size. Income is rather low compared to other countries. Costs are significantly lower in Belgium and the Netherlands and in most cases decreasing with size. In Belgium income is rising between the 1st and 2nd size class. This tendency is valid over all size classes in the Netherlands.
Compared to Poland, Hungary show high and costs rising with farm size (1st period), resulting in rather low incomes in medium and large sized farms.
4.2.3 Production costs for pigs by farm size
Results for pigs are shown in Figure 19. Cost levels, their development over time and size differ between countries. The structure of pig production is either specialised between piglets and fattening, or based on integrated production. In Germany, positive size effects on costs are only observed between small and medium sized farms, resulting in a slightly higher net value added in the latter group. Costs are higher in large farms, resulting in very low (1st and 2nd period) and negative income in the 3rd period. In France costs as well as output are considerably lower in medium sized farms. Together with higher output the income is higher in large farms, but only in the 1st and 2nd period. As in Germany, income is close to zero in the last period. In Spain costs and output are lower in medium compared to small sized farms. Only in two of 3 three periods is the income higher in medium sized farms. Italy shows a considerable cost digression especially between medium and large sized farms; this is also true for the output. Mainly influenced by the variation of output, the income is lower in large farms in the 1st and 2nd period; only in the last period it is considerably higher. In the United Kingdom costs are slightly higher in large compared medium sized farms. As output in the former is higher, income is slightly higher in the large farms.

Figure 19: Cost, output and income of pig production by farm size
0
200
400
600
800
1000
1200
EU
R/L
U
S M L ESU
Period 1 2 3 1 2 3 1 2 3 1 2 3 1 2 3
DEU FRA ESP ITA UKI
S M L S M L S M L S M L S M L S M L S M L S M L S M L S M L S M L S M L S M L S M L
Σ Costs
Output
Net value added
-147
1640
EU
R/L
U
1200
1000
800
600
400
200
0 ESU
Period
DAN SVE NED HUN
S M L 1
BEL
S M L S M L S M L S M L S M L S M L S M L S M L S M L S M L S M L 12 1 32 1 32 2
POL
32
-26 -59 -42 -171 -158 -153
Periods: 1 = 1999-03; 2 = 2004-06; 3 = 2007. Source: EU-FADN-DG AGRI L-3; FACEPA.
23 Chapter 4 Results of cost estimations
In Denmark and Sweden costs are slightly higher in the larger size class; as output is lower, the income is lower in the larger farms. In Belgium and Netherlands costs are decreasing with size (with the exception of the 2nd period in the Netherlands). Highest incomes are realized in large farms, while smaller ones make losses in the last period. As in Sweden, in Poland reliable results could only be estimated for one period. The results for Hungary in period 2 show rather high costs in small farms, but considerably lower cost in larger ones, resulting in negative incomes in small farms and positive or rising income in larger ones. The economic deteriorated situation in the 3rd period, as costs were higher than output, resulting in a high negative figure for net value added.

EU
R/to
n
250
200
150
100
50
0 1999-03 2004-06 2007 2004-06 2007
EU_9 (oldMs) EU_2 (nMs)
Depreciation & other fix costs
Overheads
Other specific costs
Energy
Crop specific costs
Output + coupled subsidies
Output
Net value added
Source: EU-FADN-DG AGRI L-3; FACEPA.
24 Chapter 4 Results of cost estimations
4.3 Aggregated results by old and new Member States of the EU
In a further step results are aggregated by old and new Member Sates considered, to test the potential of providing information on the development of costs shares for more aggregated agricultural sector models. A perfect match was not possible, because only 9 Member States (MS) of EU-15 and 2 of EU-12 are included in the study; however, these represent the main producer countries. Unit costs of the included Member States are weighted by the aggregated production quantities per Member states (tons for wheat and milk, pig LU for pigs). In contrast to previous chapters, we consider only soft wheat (also for Italy). Non-plausible estimates were excluded as discussed in chapter 4.1.
Figure 20: Production costs of soft wheat (EUR/t), aggregated by years and EU-15 and EU-12 Member States
Aggregated results for soft wheat for the old and new EU Member states are given in Figure 20. In EU-9, crop specific costs, which constitute the main cost component, amount to 40 EUR/t in the first two periods. Due to rising costs for fertilizer and crop protection they increase to 55 EUR/t in 2007. Energy costs amount to 10 EUR/t in the 1st
and 2nd and 15 EUR/t in the 3rd period. Other specific costs were almost at the same level of 15 EUR/t. Fixed costs items (overheads and depreciation,) amount to 40 EUR/t in the 1st, 50 EUR/t in the 2nd and 60 EUR/t in the 3rd period. The total of considered cost items of 100 EUR/t in the 1st period was a little less than crop output, equal to output in the 2nd
period and 70 EUR/t less than output in the 3rd period. On top of output coupled subsidies have to be considered in the income calculation; they were rather high in the 1st period (full coupled premia) and significantly reduced due to full or partial decoupling in the following periods. Income (expressed by Net Value Added) was about 65 EUR/t; it fell by half in the 2nd period and increased to 90 EUR/t in the 3rd period due to high wheat prices.

25 Chapter 4 Results of cost estimations
In the new MS, the cost level was significantly lower in the 2nd period but approaching that of the old MS level in 2007. The output level was almost similar but the influence of coupled subsidies was rather insignificant. Income was similar to old MS for the respective periods.
Cost shares referring to output are given in Table 1; they were rather similar in the 1st and 2nd period but decreasing in 2007 due the high output level.
Cost estimates for cow milk are shown in Figure 21. Feed cost is the main cost item, which amounts to 80 EUR/t in the 1st and 2nd period and to 90 EUR/t in 2007 (old MS) due to rising prices of crops products. Crop specific costs representing implicit variable cost of roughage production amount to 10–15 EUR/t; a similar cost level is for energy. Other specific costs amount to 40 EUR/t, overheads to 30 EUR/t and depreciation and other fixed costs to 40 EUR/t. The latter 3 cost items were rather constant in time. The output level was slightly decreasing to the 2nd period due to lower intervention prices, but rising in 2007 due to increased milk prices. The income level was rather stable in time with 110 EUR/t the 1st and 3rd period and of 100 EUR/t in the 2nd .
Figure 21: Production costs of cow milk (EUR/t), aggregated by years and EU-15 and EU-12 Member States
Depreciation & other fix costs
Overheads
Other specific costs
Energy
Crop specific costs
Feed costs
Output + coupled subsidies
Output
Net value added
1999-03 2004-06 2007 2004-06 2007
EU_9 (oldMs) EU_2 (nMs)
Source: EU-FADN-DG AGRI L-3; FACEPA.
In the new Member States cost and price level was lower than in the old Member States but income reached the level of old Member States in 2007. Cost shares referring to output in both aggregates (Table 1) were rather constant over time.
350
300
250
200
150
100
50
0
EU
R/to
n

26 Chapter 4 Results of cost estimations
Table 1: Average output/unit and average cost shares, weighted by the aggregated output per country considered and periods
EU_9 (oldMs) EU2 (nMS) 1999-03 04-06 2007 2004-06 2007
Soft Wheat Output EUR/t 111,4 109,5 199,1 100,1 192,8 Cost shares (% of output) CropSp % 39,2 38,2 25,9 38,8 28,1 Energy % 6,0 8,1 5,3 11,0 9,0 oSpecCo % 8,3 9,3 4,5 5,3 2,3 Overheads % 14,0 17,6 10,9 5,5 6,2 DeprFC % 22,4 25,7 14,4 16,5 12,5
Cow Milk Output EUR/t 314,3 301,8 342,8 214,3 266,8 Cost shares (% of output) LiStFeed % 24,7 27,0 26,8 27,0 26,5 CropSp % 4,1 3,8 3,8 4,8 4,9 Energy % 3,7 4,5 4,4 5,9 5,5 oSpecCo % 11,6 12,3 11,3 9,7 8,3 Overheads % 9,6 10,1 9,7 4,4 4,1 DeprFC % 13,2 12,7 11,3 9,8 9,2
Pigs Output EUR/LU 729,8 790,2 747,0 635,9 630,7 Cost shares (% of output) LiStFeed 51,1 48,8 62,4 58,3 73,0 Energy 2,8 3,5 3,6 2,8 3,2 oSpecCo 10,6 10,4 11,5 8,2 7,9 Overheads 4,5 4,3 4,0 2,9 1,6 DeprFC 8,2 7,5 7,5 4,6 4,6
Source: EU_FADN-DG AGRI L-3; FACEPA.
Aggregated results for pigs are shown in Figure 22. Feed cost is the main cost item which was 380-390 EUR/LU in the 1st and 2nd periods. They increased to 470 EUR/t in 2007 due to booming arable crop prices. While feed costs and energy costs were similar in both regions other specific costs and especially overheads and depreciation and other fixed costs were considerably higher in the old MS. Output was considerably higher than cost levels in the 1st and 2nd periods resulting in incomes of 150 to 200 EUR/LU. Rising costs and decreasing output values induced rather low incomes of 60-80 EUR/LU in the 3rd
period. Referring to cost shares shown in Table 1 it is worth mentioning the rising shares of feed costs in 2007 compared to the almost constant shares of other cost elements over time.

800 Depreciation
700 & other fix costs
Overheads 600
Other specific costs
500 Energy
EU
R/L
U
400
300
200
100
0 1999-03 2004-06 2007 2004-06 2007
EU_9 (oldMs) EU_2 (nMs)
Source: EU-FADN-DG AGRI L-3; FACEPA.
Feed costs
Output
Net value added
27 Chapter 4 Results of cost estimations
Figure 22: Production costs of pigs (EUR/pigLU), aggregated by years and EU-15 and EU-12 Member States


29
5 Conclusions
Chapter 5 Conclusions
FADN data are a useful information source for micro-level analysis. In the FACEPA project these data are used for the estimation and analysis of production costs for the main commodities. In the underlying study results are summarised for wheat, milk and pigs for the main producer countries. Estimates are undertaken using the GECOM model for the estimation of input-output coefficient and the calculation of unit costs. To avoid problems of inconsistent data an outlier procedure is applied for all considered countries and years. For this report, observations of several years were pooled for the estimation, which lead to more stable estimates especially in Member States with rather small FADN samples. In addition, statistical tests and plausibility checks of results were necessary, leading to the cancellation of a few results for wheat.
Due to variation in production conditions, intensity and cost structures, estimates should preferable be made at Member State level. Location and scale effects can be analysed with estimates based on respective sub-samples. In this study, scale effects are analysed and are shown to be rather significant in arable crop production. There is a considerable variation between Member States not only of production costs, but also of output, and output plus subsidies (due to the national implementations of full or partially decoupling schemes), especially for wheat and milk. To get a full picture on economic performance, cost analyses should be supplemented by income indicators.
Based on the results it can be concluded that in addition to costs, returns should be considered simultaneously to get a full picture on economic performance. Although most of the results look reasonable
7 there are still some ‘outstanding results.’ Some of these prob
lems could be solved by a further check of the data and application of the method only for large sized samples.
In general, the validation of the GECOM by comparing results to those of other studies as well as by a review of estimates by national experts highlighted that the quality of estimates differs by country (OFFERMANN and KLEINHANß, 2011). Overall, level and trend of total costs of the main products wheat, milk and pigs were judged to be plausible. Generally, estimated cost for crop products were less robust and in several cases implausibly variable over time.
7


31 List of References
List of References
BAHTA S, KLEINHANSS W, BERNER A (2011): Results for Germany. In: Kleinhanss, W. (ed.) (2011): Implementation, validation and results of the cost of production model using the EU FADN, FACEPA Deliverable No. 3.2 http://www2.ekon.slu.se/facepa/documents/Deliverable_D3-2_vTI.pdf
BERNER A, KLEINHANSS W, OFFERMANN F (2011): Results for German national FADN. In: OFFERMANN F (2011): Implementation, validation and results of the cost of production model using national FADN data bases. FACEPA Deliverable No. 3.1
HANSEN H, BAHTA S, OFFERMANN F (2009): The Statistical Usefulness of the EU FADN Database for Production Cost Estimations. FACEPA Deliverable No. 1.3. http://www2.ekon.slu.se/facepa/documents/Deliverable_D1-3_vTI.pdf
KLEINHANSS W (ed.) (2011): Implementation, validation and results of the cost of production model using the EU FADN, FACEPA Deliverable No. 3.2. http://www2.ekon.slu.se/facepa/documents/Deliverable_D3-2_vTI.pdf
OFFERMANN F (ed.) (2011): Implementation, validation and results of the cost of production model using national FADN data bases, FACEPA Deliverable No. 3.1 http://www2.ekon.slu.se/facepa/documents/Deliverable_D3-1_vTI.pdf
OFFERMANN F, KLEINHANß W (2011): Comparison of cost estimates based on different cost calculation methods and/or different data bases. FACEPA Deliverable_D3-3. http://www2.ekon.slu.se/facepa/documents/Deliverable_D3-3_vTI.pdf
PINGAULT N, DESBOIS D (2003) : Estimation de Couts de Productions des Principaux Produits Agricoles a Partir du Rica. Ministère de l Agriculture de l Alimentation de la Pêche et des Affaires Rurales. Notes et Etudes Economiques, No19, Dec 2003, pp. 9-51
PEETERS L, SURRY Y (2003): Farm Cost Allocation Based on the Maximum Entropy Methodology: The Case of Saskatchewan Crop Farms, Agriculture and Agri-Food Cananda, Technical Report 2121/E, Ottawa, Ontario
POLLET P, BUTAULT JP, CHANTRY E (2001): The Agricultural Production Cost Model. Agricultural Division, INSEE, ESTAT-2001-03195-00-00-EN-FRA-00(FR)
SURRY et al. (forthcoming): General cost of production model: conceptual framework, econometric specifications and estimations procedure. FACEPA Deliverable 2.2.
FACEPA Project Model Information. Detailed Information Available at: http://www2.ekon.slu.se/facepa/index.html


Annex 1

PENF,
Table A1.1: Definition of model variables
Model variables FADN codes 1) in (…) /* Model outputs */
Common wheat WHEAT Durum wheat DWHEA
Barley BARLE Grain maize MAIS Other cereals OTCER
Dry pulses DRYPU Potatoes POTAT
Sugar beet SUGAR Rape RAPE_ Sunflower SUNFL Soya SOJA
Fresh veg._op.field OPENF Fresh veg._mkt gard OPENG Fresh veg._und.glas UGlas
Flowers open_air + _protected FLOWE Pome fruit excl.table grapes APPLE
Fruit + berry_orchar - K349TP OTHFR Grapes tabl._&oth.w + tbl.wine &_oth.wine TWINE Grapes qual._wine +quality_wine QWINE
Sales/felled_timber + … FORES OCROP
Cattle CATTL Sheep SHEEP Pigs PIG__ Poultry POULT
Cows' milk + products CMILK Buffalo milk + sheep's milk + products OMILK
Hens'eggs EGG__ Contract rearing CONTR
Occas.let_ ting forag, … OACTI Other livestock activities OLIST
/* Model inputs, excl. Taxes and hired labour costs */ Con.feed.purchased FEEDPC
Feed home-grown FEEDHC Other livestock specific costs VETCOS
Seeds/seedlings purchased,.. SEED__ Fertilisers FERTIL
Crop protection CRPROT Motor fuel and lubricants MOTFUE
Electricity + heating fuels OENERG Contract work CONWOR
Upkeep land improv. and build BUILUK Upkeep of mach. + equipment MACHUK
Other specific costs OTHSIC Rent paid,… LANDCO
Depreciation DEPREC Taxes and other dues TAXES_
Coupled subsidies SUBSID Income (Net Value Added) Netval
sum(K120TP); sum(K121TP); sum(K123TP); sum(K126TP); sum(K122TP,K124TP,K125TP,K127TP,K128TP); sum(K129TP); sum(K130TP); sum(K131TP); sum(K331TP); sum(K332TP); sum(K333TP); sum(K136TP); sum(K137TP); sum(K138TP); sum(K140TP,k141TP); sum(K349TP); sum(K152TP,-K349TP); sum(K287TP,K290TP); sum(K286TP,K289TP);
sum(K174TP,K175TP,K176TP); sum(Crop_TP,-WHEAT,-DWHEA,-BARLE,-MAIS,-OTCER,-DRYPU,-POTAT,-SUGAR,-RAPE_,-SUNFL,-SOJA,-O -OPENG,-UGlas,-FLOWE,-APPLE,-OTHFR,-TWINE,-QWINE,-FORES) sum(E52TO); sum(E54TO); sum(E56TO); sum(E57TO); sum(K162TP,K163TP); sum(K164TP,K167TP); sum(K169TP); sum(K171TP); sum(K172TP,K177TP,K179TP,K313TP); sum(Livest_TP,-CATTL,-SHEEP,-PIG__ ,-POULT,-CMILK,-OMILK, -EGG__,-CONTR,-K172TP)
Sum(F64,F65,F66,F67); sum(SE315,F69,F70); sum(SE330); Sum(F72,SE290); sum(SE295); sum(SE300); sum(F62); Sum(F79,F80); sum(SE350); sum(F78); sum(F61); sum(F63,SE305,SE331,F81,F82,F84,F87);
sum(SE375,F88); sum(SE360);
F83; -sum(SE605,-SE620,-SE630);
sum(sum_outp, -sum_inpu, -subsid) ;
1) XyyyZ, wherby X: FADN Table; xxx: row; Z: column TO Total output TP Total production
Annex 1 A3

Output-Subsid
Output (y)
Cost equations FEEDPC FEEDHC VETCOS SEED__ FERTIL
Output
LiStFeed
CropSp
oSpecCo
Netval
CRPROT MOTFUE OENERG CONWOR BUILUK MACHUK OTHSIC LANDCO INTERE DEPREC
Energy
Overheads
TAXES_ SUBSID NETVAL
Source: FACEPA.
DeprFC
NetValAd
4 Annex 1
Table A1.2: List of inputs and cost aggregation
Cost aggregates Model variables Cost aggregates (figures)
Table A1.3: Country codes
FADN Code
DEU Germany
FRA France
ESP Spain
ITA Italy
UKI United Kingdom
DAN Denmark
SVE Sweden
BEL Belgium
NED Netherlands
POL Pologne
HUN Hungary

Annex 2


Annex 2 A7
Table A2.1: Input-Output coefficients (1)
DEU FRA ESP ITA UKI
Period 1) 1 2 3 1 2 3 1 2 3 1 2 3 1 2 3
Product WHEAT Output € /t 117 109 202 105 102 182 132 139 183 155 325 113 111 206 I-O-Coefficients SEED__ 0,041 0,016 0,019 0,075 0,076 0,040 0,107 0,095 0,112 0,178 0,052 0,073 0,050 0,032 FERTIL 0,109 0,141 0,135 0,155 0,157 0,107 0,172 0,155 0,102 0,209 0,099 0,131 0,150 0,098 CRPROT 0,163 0,188 0,161 0,221 0,227 0,143 0,050 0,041 0,029 0,107 0,049 0,213 0,185 0,115 MOTFUE 0,057 0,096 0,050 0,045 0,057 0,039 0,063 0,080 0,069 0,270 0,119 0,051 0,068 0,038 OENERG 0,007 0,008 0,005 0,008 0,005 0,002 0,000 0,011 -0,001 -0,011 -0,007 0,015 0,019 0,016 CONWOR 0,050 0,072 0,030 0,054 0,082 0,034 0,070 0,088 0,071 0,120 0,062 0,047 0,057 0,027 BUILUK 0,016 0,020 0,046 0,011 0,016 0,007 0,008 0,006 0,005 0,005 0,002 0,036 0,036 0,040 MACHUK 0,047 0,057 0,039 0,066 0,062 0,055 0,047 0,045 0,039 0,065 0,030 0,095 0,077 0,043 OTHSIC 0,086 0,128 0,046 0,080 0,069 0,046 0,052 0,045 0,030 0,087 -0,005 0,095 0,116 0,072 LANDCO 0,237 0,264 0,155 0,197 0,209 0,117 0,174 0,110 0,073 0,050 0,034 0,123 0,121 0,046 INTERE 0,035 0,051 0,041 0,069 0,066 0,028 0,007 -0,003 0,004 0,004 0,002 0,054 0,034 0,017 DEPREC 0,162 0,177 0,106 0,256 0,310 0,160 0,132 0,105 0,139 0,336 0,147 0,220 0,180 0,117 TAXES_ 0,007 0,011 0,006 0,020 0,020 0,011 0,001 0,000 0,000 0,032 0,013 0,000 0,002 0,001 SUBSID -0,391 -0,092 -0,012 -0,500 -0,309 -0,075 -0,466 -0,405 -0,070 -0,296 -0,027 -0,473 -0,171 -0,001 NETVAL 0,373 -0,138 0,173 0,243 -0,046 0,286 0,582 0,628 0,397 -0,157 0,432 0,322 0,076 0,338
Product PIG__ Output € /LU 767 818 800 712 755 729 553 586 551 857 857 872 650 639 617 I-O-Coefficients FEEDPC 0,376 0,373 0,535 0,525 0,487 0,620 0,483 0,515 0,445 0,392 0,357 0,348 0,517 0,476 0,573 FEEDHC 0,103 0,091 0,115 0,036 0,034 0,041 0,000 0,001 0,001 0,040 0,034 0,047 0,014 0,021 0,013 VETCOS 0,082 0,071 0,087 0,067 0,061 0,063 0,053 0,049 0,038 0,053 0,039 0,035 0,108 0,117 0,133 MOTFUE 0,009 0,011 0,011 0,003 0,005 0,006 0,003 0,004 0,001 0,005 0,005 0,004 0,008 0,012 0,011 OENERG 0,041 0,050 0,051 0,018 0,018 0,019 0,006 0,009 0,009 0,011 0,008 0,004 0,016 0,012 0,009 CONWOR 0,030 0,027 0,029 0,044 0,048 0,053 0,001 0,008 0,002 0,003 0,000 0,001 0,016 0,023 0,014 BUILUK 0,015 0,013 0,010 0,007 0,007 0,005 0,002 0,004 0,003 0,002 0,001 0,001 0,012 0,017 0,012 MACHUK 0,023 0,026 0,018 0,016 0,019 0,016 0,002 0,002 0,002 0,003 0,001 0,001 0,020 0,022 0,021 OTHSIC 0,055 0,067 0,053 0,063 0,055 0,053 0,004 0,011 0,027 0,016 0,007 0,004 0,021 0,028 0,029 LANDCO 0,028 0,018 0,024 0,007 0,005 0,004 0,004 0,038 0,052 0,003 0,002 0,004 0,001 0,011 0,014 INTERE 0,030 0,026 0,026 0,041 0,032 0,033 0,002 0,007 0,016 0,001 0,000 0,000 0,029 0,016 0,016 DEPREC 0,097 0,095 0,087 0,090 0,089 0,097 0,011 0,018 0,016 0,023 0,016 0,012 0,054 0,040 0,034 TAXES_ 0,004 0,003 0,002 0,005 0,004 0,003 0,000 0,001 0,000 0,003 0,001 0,001 0,000 0,001 0,000 NETVAL 0,109 0,130 -0,049 0,079 0,139 -0,014 0,430 0,333 0,387 0,445 0,529 0,538 0,183 0,204 0,120
Product MILK
Output € /t 314 292 380 315 295 313 300 305 242 384 380 395 278 264 315 I-O-Coefficients FEEDPC 0,011 0,188 0,183 0,151 0,159 0,178 0,319 0,309 0,324 0,283 0,282 0,247 0,222 0,247 0,267 FEEDHC 0,023 0,084 0,070 0,029 0,026 0,027 0,093 0,078 0,088 0,169 0,206 0,214 0,041 0,059 0,062 VETCOS 0,009 0,062 0,058 0,039 0,033 0,033 0,046 0,051 0,059 0,029 0,026 0,026 0,098 0,111 0,114 SEED__ 0,049 0,011 0,009 0,028 0,027 0,025 0,004 0,004 0,004 -0,017 -0,033 -0,007 0,002 -0,005 -0,006 FERTIL 0,030 0,023 0,026 0,035 0,030 0,027 0,008 0,005 0,004 0,002 0,002 0,009 0,035 0,033 0,026 CRPROT 0,034 0,009 0,007 0,013 0,015 0,016 -0,001 -0,002 0,000 0,000 -0,001 0,006 0,004 0,005 0,006 MOTFUE 0,016 0,049 0,044 0,018 0,025 0,026 0,013 0,017 0,018 0,017 0,025 0,022 0,013 0,017 0,018 OENERG 0,048 0,030 0,025 0,019 0,016 0,015 0,011 0,012 0,010 0,010 0,009 0,011 0,013 0,015 0,017 CONWOR 0,126 0,034 0,035 0,096 0,106 0,099 0,009 0,014 0,013 0,006 0,005 0,005 0,046 0,051 0,050 BUILUK 0,042 0,016 0,020 0,008 0,007 0,007 0,006 0,003 0,004 0,001 0,002 0,002 0,018 0,020 0,019 MACHUK 0,026 0,048 0,048 0,043 0,048 0,044 0,020 0,021 0,022 0,006 0,007 0,006 0,033 0,032 0,028 OTHSIC 0,118 0,126 0,089 0,108 0,103 0,103 0,012 0,019 0,051 0,007 0,012 0,015 0,044 0,052 0,040 LANDCO 0,005 0,042 0,038 0,049 0,051 0,047 0,007 0,005 0,008 0,017 0,015 0,017 0,047 0,038 0,028 INTERE -0,040 0,026 0,021 0,035 0,036 0,034 0,008 0,004 0,007 0,004 0,004 0,002 0,043 0,038 0,033 DEPREC 0,167 0,118 0,105 0,160 0,187 0,173 0,048 0,042 0,056 0,058 0,068 0,069 0,084 0,080 0,069 TAXES_ 0,183 0,005 0,005 0,009 0,010 0,007 0,000 0,000 0,000 0,007 0,003 0,003 0,000 0,001 0,000 SUBSID 0,070 -0,040 -0,009 -0,013 -0,040 0,027 0,036 -0,027 0,002 0,004 -0,027 0,001 0,029 -0,006 0,000 NETVAL 0,058 0,167 0,227 0,172 0,161 0,113 0,361 0,444 0,329 0,398 0,395 0,353 0,227 0,212 0,226
non plausible negative I-O coefficients
1) Periods 1: 1999 - 2003; 2: 2004 - 2006; 3: 2007 Source: EU-FADN-DG AGRI L-3; FACEPA.

A8 Annex 2
Table A2.1: Input-Output coefficients (2)
Period 1)
Product
1 2
DAN
3 1 2
SVE
3 1 2 3
BEL
WHEAT
1 2
NED
3 2
POL
3 2
HUN
3
Output € /t 112 I-O-Coefficients SEED__ 0,040 FERTIL 0,097 CRPROT 0,118 MOTFUE 0,038 OENERG 0,004 CONWOR 0,049 BUILUK 0,043 MACHUK 0,064 OTHSIC 0,093 LANDCO 0,218 INTERE 0,342 DEPREC 0,209 TAXES_ 0,005 SUBSID -0,381 NETVAL 0,060
Product
111
0,053 0,107 0,123 0,047 0,004 0,048 0,043 0,067 0,102 0,231 0,386 0,232 0,005
-0,093 -0,356
208
0,034 0,062 0,069 0,032 0,005 0,028 0,024 0,043 0,080 0,178 0,295 0,148 0,003
-0,003 0,002
108
0,084 0,225 0,114 0,051 0,082 0,142 0,021 0,052 0,056 0,278 0,080 0,189 0,000
-0,443 0,070
98
0,048 0,243 0,085 0,049 0,121 0,158 0,010 0,068 0,036 0,317 0,011 0,180 0,000
-0,278 -0,050
207
0,033 0,136 0,051 0,056 0,050 0,081 0,029 0,019 0,057 0,128 0,004 0,093 0,000 0,001 0,261
113 226
0,003 -0,009 0,139 0,084 0,156 0,106 0,061 0,038 0,009 0,013 0,182 0,060 0,004 0,009 0,059 0,047 0,073 0,026 0,237 0,120 0,126 0,097 0,305 0,152 0,002 -0,004
-0,159 -0,240 -0,197 0,501
PIG__
125
-0,075 0,079 0,119 0,032 0,016 0,026 0,023 0,125 0,215 0,152
-0,064 0,215 0,017
-0,476 0,598
125
-0,028 0,113 0,091 0,037 0,031 0,042
-0,011 0,134 0,245 0,004
-0,049 0,206 0,003
-0,249 0,431
104
0,060 0,236 0,140 0,098 0,003 0,027 0,005 0,026 0,023 0,060 0,016 0,192 0,000
-0,073 0,188
196
0,038 0,144 0,083 0,072 0,007 0,016 0,007 0,031 0,021 0,043 0,010 0,125 0,000
-0,010 0,415
90
0,000 0,000 0,000 0,034 0,106 0,103 0,102 0,036
-0,003 0,004 0,045 0,147 0,064 0,105 0,069
184
0,000 0,000 0,000 0,088 0,148 0,096 0,127 0,000 0,035 0,004 0,050 0,032 0,103 0,027 0,120
Output € /LU 829 891 808 757 827 864 692 783 703 786 884 790 626 628 700 659 I-O-Coefficients FEEDPC 0,406 0,408 0,535 0,436 0,432 0,501 0,552 0,528 0,705 0,507 0,474 0,665 0,430 0,512 0,000 0,012 FEEDHC 0,076 0,066 0,126 0,091 0,057 0,074 0,010 0,010 0,012 0,002 0,001 0,002 0,162 0,199 0,000 0,000 VETCOS 0,060 0,075 0,082 0,056 0,060 0,062 0,055 0,069 0,078 0,096 0,103 0,157 0,050 0,054 0,000 0,149 MOTFUE 0,008 0,007 0,006 0,007 0,006 0,007 0,001 0,001 0,002 0,001 0,001 0,001 0,012 0,010 0,000 0,000 OENERG 0,017 0,033 0,036 0,028 0,040 0,045 0,012 0,026 0,029 0,037 0,033 0,037 0,016 0,018 0,000 0,000 CONWOR 0,018 0,017 0,021 0,038 0,037 0,043 0,022 0,014 0,014 0,007 0,005 0,007 0,007 0,003 0,000 0,000 BUILUK 0,006 0,004 0,005 0,007 0,008 0,006 0,004 0,004 0,004 0,008 0,005 0,009 0,013 0,006 0,002 0,013 MACHUK 0,028 0,027 0,026 0,025 0,013 0,007 0,004 0,010 0,013 0,015 0,021 0,016 0,009 0,008 0,029 0,050 OTHSIC 0,022 0,021 0,027 0,024 0,031 0,021 0,010 0,011 0,016 0,067 0,042 0,053 0,014 0,013 0,017 0,001 LANDCO 0,007 0,023 0,029 0,031 0,070 0,082 0,004 0,004 0,005 0,012 0,013 0,019 -0,001 0,000 0,003 0,003 INTERE 0,089 0,080 0,127 0,063 0,047 0,058 0,031 0,024 0,028 0,077 0,052 0,068 0,009 0,006 0,009 0,012 DEPREC 0,096 0,103 0,112 0,143 0,113 0,080 0,070 0,062 0,072 0,107 0,077 0,092 0,048 0,046 0,123 0,114 TAXES_ 0,004 0,004 0,005 0,000 0,000 0,000 0,003 0,001 0,001 0,002 0,002 0,002 0,000 0,000 0,006 0,015 NETVAL 0,163 0,132 -0,137 0,051 0,086 0,014 0,222 0,236 0,019 0,061 0,170 -0,127 0,231 0,124 0,020 0,027
Product MILK
Output € /t 336 312 339 329 317 323 294 287 341 327 307 357 210 265 254 294 I-O-Coefficients FEEDPC 0,209 0,210 0,211 0,273 0,281 0,301 0,131 0,129 0,138 0,150 0,162 0,158 0,150 0,171 0,000 0,014 FEEDHC 0,016 0,085 0,248 0,081 0,116 0,161 0,034 0,037 0,041 0,007 0,004 0,004 0,075 0,068 0,000 -0,151 VETCOS 0,073 0,088 0,091 0,042 0,053 0,049 0,045 0,065 0,054 0,055 0,065 0,058 0,054 0,049 0,000 0,063 SEED__ 0,017 0,007 -0,029 0,003 0,004 0,003 0,016 0,019 0,015 0,001 0,008 0,005 0,011 0,004 0,347 0,350 FERTIL 0,012 0,009 0,004 0,014 0,018 0,016 0,033 0,031 0,025 0,021 0,022 0,020 0,037 0,042 0,247 0,197 CRPROT 0,008 0,006 0,003 0,000 0,004 0,006 0,009 0,014 0,010 0,003 0,005 0,004 0,004 0,004 0,087 0,067 MOTFUE 0,009 0,014 0,012 0,021 0,017 0,018 0,011 0,017 0,017 0,012 0,017 0,015 0,036 0,038 -0,018 0,016 OENERG 0,014 0,017 0,019 0,022 0,024 0,023 0,019 0,023 0,020 0,018 0,023 0,023 0,016 0,013 0,019 0,005 CONWOR 0,073 0,081 0,077 0,081 0,096 0,119 0,051 0,063 0,054 0,054 0,063 0,052 0,012 0,010 0,017 0,015 BUILUK 0,008 0,005 0,006 0,011 0,010 0,027 0,005 0,003 0,002 0,006 0,006 0,014 0,009 0,008 0,076 0,065 MACHUK 0,052 0,051 0,051 0,041 0,031 0,029 0,035 0,035 0,028 0,050 0,058 0,045 0,021 0,023 0,030 0,038 OTHSIC 0,044 0,034 0,011 0,033 0,030 0,015 0,027 0,034 0,026 0,067 0,073 0,065 0,033 0,029 0,009 0,009 LANDCO 0,034 0,048 0,041 0,047 0,043 0,067 0,044 0,054 0,033 0,056 0,053 0,048 0,008 0,008 0,005 0,002 INTERE 0,189 0,172 0,204 0,053 0,031 0,028 0,073 0,060 0,048 0,118 0,135 0,134 0,010 0,009 0,044 0,034 DEPREC 0,118 0,122 0,111 0,148 0,119 0,085 0,179 0,143 0,115 0,126 0,136 0,117 0,100 0,096 0,084 0,082 TAXES_ 0,004 0,004 0,007 0,000 0,000 0,000 0,003 0,003 0,002 0,003 0,002 0,000 0,000 0,000 0,020 0,037 SUBSID -0,005 -0,005 0,012 0,003 -0,059 -0,003 -0,021 -0,040 0,005 -0,010 -0,071 0,006 -0,006 -0,003 0,042 0,036 NETVAL 0,125 0,052 0,127 0,181 0,055 0,308 0,310 0,367 0,262 0,236 0,233 0,428 0,431 0,065 0,026 -0,081
non plausible negative I-O coefficients
1) Periods 1: 1999 - 2003; 2: 2004 - 2006; 3: 2007 Source: EU-FADN-DG AGRI L-3; FACEPA.

Annex 2 A9
Table A2.2: T-Values of coefficients (1)
DEU FRA ESP ITA UKI
Period 1 2 3 1 2 3 1 2 3 1 2 3 1 2 3
Product WHEAT SEED__ 8,4 2,8 2,9 18,9 13,8 6,5 22,9 14,0 19,9 10,2 3,4 8,7 5,0 3,1 FERTIL 51,8 54,3 41,1 65,6 51,3 30,7 47,9 24,9 16,4 50,5 35,4 49,4 57,0 30,2 CRPROT 99,8 89,6 70,4 96,3 77,7 40,1 14,2 7,4 5,4 14,7 14,2 116,9 86,2 53,9 MOTFUE 38,4 46,4 23,7 48,8 37,1 22,2 34,5 20,9 17,9 63,6 32,3 36,9 29,2 17,1 OENERG 3,6 3,2 2,1 3,2 1,1 0,4 0,1 2,7 -0,3 -2,4 -1,7 7,9 5,7 4,6 CONWOR 16,9 16,2 8,4 12,5 14,3 4,8 21,1 16,0 13,6 41,0 16,5 13,7 9,9 4,5 BUILUK 7,5 8,9 18,5 8,4 9,0 4,5 8,5 2,6 1,8 4,3 1,8 20,9 14,7 12,1 MACHUK 19,3 20,4 14,3 31,2 21,1 13,7 25,3 13,5 11,7 23,4 16,7 45,8 28,9 11,8 OTHSIC 9,5 13,0 4,7 8,8 6,1 3,3 11,5 5,6 3,5 3,8 -0,3 17,4 14,3 8,6 LANDCO 56,0 53,7 36,9 43,0 36,5 18,0 31,8 13,1 8,6 8,9 9,5 25,5 22,2 8,7 INTERE 11,3 15,8 14,8 26,3 19,9 8,4 3,9 -1,0 1,3 1,9 0,9 14,2 8,0 3,2 DEPREC 27,7 27,9 16,7 39,5 32,3 14,6 23,7 12,3 16,2 30,3 16,3 37,7 27,9 16,9 TAXES_ 8,0 11,5 7,8 18,9 13,9 6,5 1,6 -0,3 0,0 21,6 9,3 -4,4 11,8 8,4 SUBSID -74,3 -9,8 -7,7 -105,1 -34,9 -22,1 -38,7 -24,0 -10,7 -27,2 -5,9 -105,3 -18,7 -3,3 NETVAL 25,0 -6,6 10,0 15,5 -2,2 11,1 30,7 19,8 13,6 -3,8 13,8 21,3 4,1 16,6
Product PIG
FEEDPC 258,1 264,2 179,5 610,8 451,4 304,6 620,5 311,6 209,2 375,3 227,4 175,0 243,4 197,0 117,7 FEEDHC 99,1 87,9 52,0 95,6 71,3 41,3 1,6 2,0 1,8 76,7 64,6 62,6 17,1 14,5 4,3 VETCOS 84,6 79,2 51,1 287,0 235,2 133,1 399,2 150,2 118,7 184,5 195,5 105,4 152,7 102,3 61,2 MOTFUE 33,8 29,7 15,2 21,1 21,0 14,5 29,3 21,0 5,2 27,5 21,1 11,3 18,1 15,6 9,7 OENERG 110,5 99,6 60,3 43,6 29,0 19,2 65,3 52,9 33,6 52,2 31,1 10,3 28,1 10,8 5,1 CONWOR 51,1 31,6 22,4 60,5 53,0 31,5 6,6 29,7 4,8 18,9 3,1 2,8 15,4 11,2 4,7 BUILUK 34,3 28,8 10,9 29,4 24,5 11,5 29,8 39,5 14,4 24,5 16,5 8,5 22,4 20,0 7,2 MACHUK 48,4 48,9 18,8 47,4 40,8 16,4 23,0 15,7 6,5 26,2 8,6 6,8 32,6 23,4 11,2 OTHSIC 30,4 33,7 14,8 41,3 30,5 16,0 17,6 30,1 44,0 14,1 5,6 2,7 12,5 9,9 6,6 LANDCO 33,1 19,5 15,7 8,6 5,6 2,8 15,2 88,3 77,9 11,3 6,5 12,2 0,7 5,9 5,0 INTERE 48,2 41,9 26,3 92,9 60,6 41,4 20,6 46,1 56,5 9,5 -0,2 2,1 24,6 10,5 5,9 DEPREC 84,4 77,3 38,1 83,8 59,6 37,2 36,7 45,0 24,1 36,2 25,5 13,8 29,5 18,2 9,4 TAXES_ 21,9 14,4 9,2 26,6 18,1 7,8 2,6 44,8 6,6 23,2 9,1 8,4 0,7 12,0 4,7 NETVAL 36,3 37,3 -7,8 30,8 44,0 -2,5 369,3 140,6 137,9 221,9 207,9 159,7 42,4 30,4 11,0
Product MILK
FEEDPC 10,1 127,1 75,3 131,9 103,0 67,0 97,2 63,1 60,1 263,9 114,3 64,6 124,7 141,4 86,6 FEEDHC 44,2 77,8 38,3 57,4 38,4 20,5 109,6 79,3 59,8 313,4 244,4 147,4 58,5 54,5 32,5 VETCOS 22,8 66,6 41,5 124,8 88,9 53,5 81,7 53,7 72,4 97,5 82,8 40,7 162,8 133,9 83,1 SEED__ 120,4 10,1 4,6 30,2 20,9 12,6 3,8 4,5 3,5 -19,9 -22,3 -2,6 0,9 -1,8 -1,8 FERTIL 57,8 44,2 27,3 64,5 41,5 23,3 10,2 6,1 3,4 9,2 6,8 19,2 49,7 48,5 24,6 CRPROT 39,5 22,8 10,5 24,1 21,1 13,3 -1,5 -2,5 0,1 1,5 -2,3 9,3 9,1 9,2 8,7 MOTFUE 35,1 120,4 71,8 84,8 69,1 43,8 31,8 31,3 24,0 90,0 70,7 33,8 36,1 29,2 24,2 OENERG 88,4 57,8 37,3 30,8 16,7 10,6 29,0 22,1 13,8 47,6 23,4 14,7 28,0 17,8 15,1 CONWOR 62,6 39,5 33,0 95,1 78,0 42,9 12,4 17,3 13,0 41,0 20,3 8,2 51,7 35,0 25,3 BUILUK 43,8 35,1 27,7 24,0 16,9 13,0 28,9 10,1 6,4 15,1 21,4 11,2 40,3 31,5 17,0 MACHUK 41,3 88,4 59,6 88,1 68,2 32,7 47,8 44,1 34,6 51,6 29,6 17,8 59,8 47,3 23,3 OTHSIC 94,3 62,6 30,6 51,4 38,6 22,4 12,1 16,2 30,6 6,2 6,2 5,2 30,8 25,1 14,4 LANDCO 28,9 43,8 30,9 46,7 37,8 22,1 5,5 3,7 4,7 56,5 32,7 27,5 36,8 27,1 16,2 INTERE -19,2 41,3 26,3 57,6 45,9 30,5 20,2 9,6 9,9 27,0 20,9 5,3 43,3 35,1 18,7 DEPREC 38,5 94,3 56,4 106,6 82,2 47,8 38,6 34,9 32,7 86,3 73,7 43,9 54,6 48,9 30,1 TAXES_ 75,3 28,9 21,9 37,6 29,0 13,4 -0,3 0,6 -2,3 53,1 23,3 13,6 2,6 21,1 10,7 SUBSID 38,3 -19,2 -19,0 -9,7 -16,5 21,4 13,7 -11,2 1,8 5,2 -29,5 1,0 21,5 -2,6 0,1 NETVAL 41,5 38,5 42,5 45,8 30,6 12,8 62,3 58,0 41,0 174,6 89,0 48,9 52,3 39,2 29,8
not significant; '-1,95 < T-value <1.95
Source: EU-FADN-DG AGRI L-3; FACEPA.
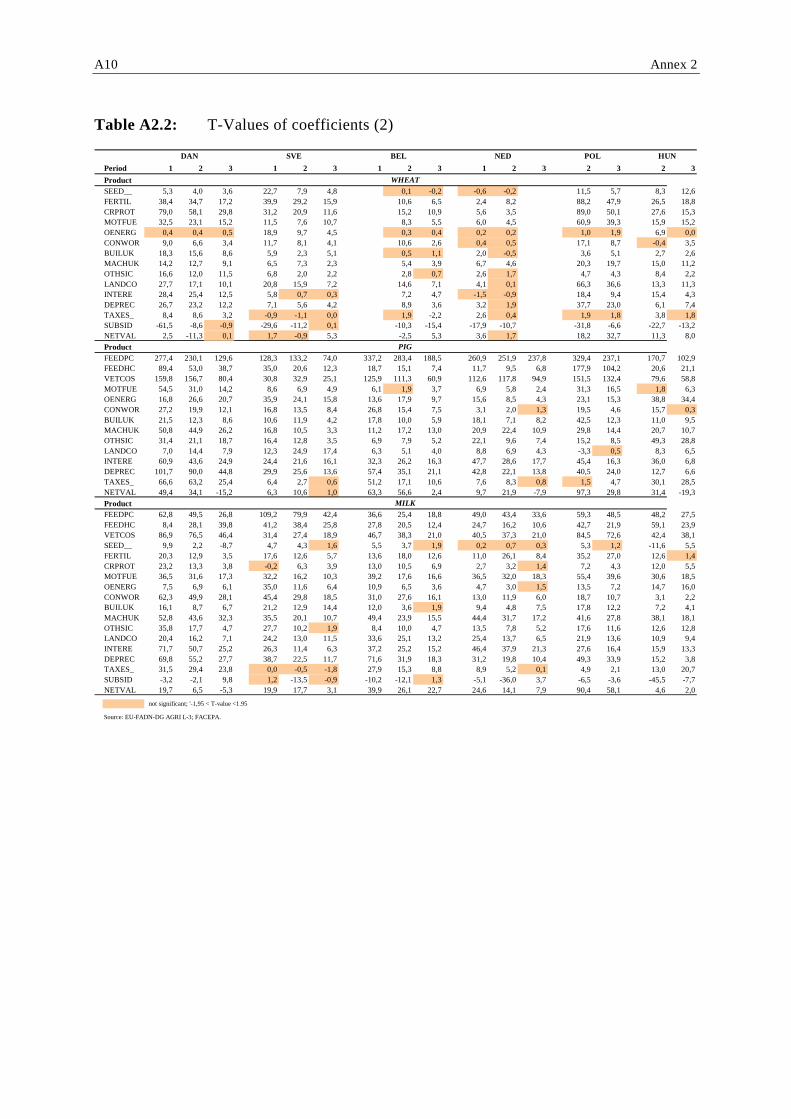
Table A2.2: T-Values of coefficients (2)
DAN SVE BEL NED POL HUN
Period 1 2 3 1 2 3 1 2 3 1 2 3 2 3 2 3
Product WHEAT SEED__ 5,3 4,0 3,6 22,7 7,9 4,8 0,1 -0,2 -0,6 -0,2 11,5 5,7 8,3 12,6 FERTIL 38,4 34,7 17,2 39,9 29,2 15,9 10,6 6,5 2,4 8,2 88,2 47,9 26,5 18,8 CRPROT 79,0 58,1 29,8 31,2 20,9 11,6 15,2 10,9 5,6 3,5 89,0 50,1 27,6 15,3 MOTFUE 32,5 23,1 15,2 11,5 7,6 10,7 8,3 5,5 6,0 4,5 60,9 39,3 15,9 15,2 OENERG 0,4 0,4 0,5 18,9 9,7 4,5 0,3 0,4 0,2 0,2 1,0 1,9 6,9 0,0 CONWOR 9,0 6,6 3,4 11,7 8,1 4,1 10,6 2,6 0,4 0,5 17,1 8,7 -0,4 3,5 BUILUK 18,3 15,6 8,6 5,9 2,3 5,1 0,5 1,1 2,0 -0,5 3,6 5,1 2,7 2,6 MACHUK 14,2 12,7 9,1 6,5 7,3 2,3 5,4 3,9 6,7 4,6 20,3 19,7 15,0 11,2 OTHSIC 16,6 12,0 11,5 6,8 2,0 2,2 2,8 0,7 2,6 1,7 4,7 4,3 8,4 2,2 LANDCO 27,7 17,1 10,1 20,8 15,9 7,2 14,6 7,1 4,1 0,1 66,3 36,6 13,3 11,3 INTERE 28,4 25,4 12,5 5,8 0,7 0,3 7,2 4,7 -1,5 -0,9 18,4 9,4 15,4 4,3 DEPREC 26,7 23,2 12,2 7,1 5,6 4,2 8,9 3,6 3,2 1,9 37,7 23,0 6,1 7,4 TAXES_ 8,4 8,6 3,2 -0,9 -1,1 0,0 1,9 -2,2 2,6 0,4 1,9 1,8 3,8 1,8 SUBSID -61,5 -8,6 -0,9 -29,6 -11,2 0,1 -10,3 -15,4 -17,9 -10,7 -31,8 -6,6 -22,7 -13,2 NETVAL 2,5 -11,3 0,1 1,7 -0,9 5,3 -2,5 5,3 3,6 1,7 18,2 32,7 11,3 8,0
Product PIG
FEEDPC 277,4 230,1 129,6 128,3 133,2 74,0 337,2 283,4 188,5 260,9 251,9 237,8 329,4 237,1 170,7 102,9 FEEDHC 89,4 53,0 38,7 35,0 20,6 12,3 18,7 15,1 7,4 11,7 9,5 6,8 177,9 104,2 20,6 21,1 VETCOS 159,8 156,7 80,4 30,8 32,9 25,1 125,9 111,3 60,9 112,6 117,8 94,9 151,5 132,4 79,6 58,8 MOTFUE 54,5 31,0 14,2 8,6 6,9 4,9 6,1 1,9 3,7 6,9 5,8 2,4 31,3 16,5 1,8 6,3 OENERG 16,8 26,6 20,7 35,9 24,1 15,8 13,6 17,9 9,7 15,6 8,5 4,3 23,1 15,3 38,8 34,4 CONWOR 27,2 19,9 12,1 16,8 13,5 8,4 26,8 15,4 7,5 3,1 2,0 1,3 19,5 4,6 15,7 0,3 BUILUK 21,5 12,3 8,6 10,6 11,9 4,2 17,8 10,0 5,9 18,1 7,1 8,2 42,5 12,3 11,0 9,5 MACHUK 50,8 44,9 26,2 16,8 10,5 3,3 11,2 17,2 13,0 20,9 22,4 10,9 29,8 14,4 20,7 10,7 OTHSIC 31,4 21,1 18,7 16,4 12,8 3,5 6,9 7,9 5,2 22,1 9,6 7,4 15,2 8,5 49,3 28,8 LANDCO 7,0 14,4 7,9 12,3 24,9 17,4 6,3 5,1 4,0 8,8 6,9 4,3 -3,3 0,5 8,3 6,5 INTERE 60,9 43,6 24,9 24,4 21,6 16,1 32,3 26,2 16,3 47,7 28,6 17,7 45,4 16,3 36,0 6,8 DEPREC 101,7 90,0 44,8 29,9 25,6 13,6 57,4 35,1 21,1 42,8 22,1 13,8 40,5 24,0 12,7 6,6 TAXES_ 66,6 63,2 25,4 6,4 2,7 0,6 51,2 17,1 10,6 7,6 8,3 0,8 1,5 4,7 30,1 28,5 NETVAL 49,4 34,1 -15,2 6,3 10,6 1,0 63,3 56,6 2,4 9,7 21,9 -7,9 97,3 29,8 31,4 -19,3
Product MILK
FEEDPC 62,8 49,5 26,8 109,2 79,9 42,4 36,6 25,4 18,8 49,0 43,4 33,6 59,3 48,5 48,2 27,5 FEEDHC 8,4 28,1 39,8 41,2 38,4 25,8 27,8 20,5 12,4 24,7 16,2 10,6 42,7 21,9 59,1 23,9 VETCOS 86,9 76,5 46,4 31,4 27,4 18,9 46,7 38,3 21,0 40,5 37,3 21,0 84,5 72,6 42,4 38,1 SEED__ 9,9 2,2 -8,7 4,7 4,3 1,6 5,5 3,7 1,9 0,2 0,7 0,3 5,3 1,2 -11,6 5,5 FERTIL 20,3 12,9 3,5 17,6 12,6 5,7 13,6 18,0 12,6 11,0 26,1 8,4 35,2 27,0 12,6 1,4 CRPROT 23,2 13,3 3,8 -0,2 6,3 3,9 13,0 10,5 6,9 2,7 3,2 1,4 7,2 4,3 12,0 5,5 MOTFUE 36,5 31,6 17,3 32,2 16,2 10,3 39,2 17,6 16,6 36,5 32,0 18,3 55,4 39,6 30,6 18,5 OENERG 7,5 6,9 6,1 35,0 11,6 6,4 10,9 6,5 3,6 4,7 3,0 1,5 13,5 7,2 14,7 16,0 CONWOR 62,3 49,9 28,1 45,4 29,8 18,5 31,0 27,6 16,1 13,0 11,9 6,0 18,7 10,7 3,1 2,2 BUILUK 16,1 8,7 6,7 21,2 12,9 14,4 12,0 3,6 1,9 9,4 4,8 7,5 17,8 12,2 7,2 4,1 MACHUK 52,8 43,6 32,3 35,5 20,1 10,7 49,4 23,9 15,5 44,4 31,7 17,2 41,6 27,8 38,1 18,1 OTHSIC 35,8 17,7 4,7 27,7 10,2 1,9 8,4 10,0 4,7 13,5 7,8 5,2 17,6 11,6 12,6 12,8 LANDCO 20,4 16,2 7,1 24,2 13,0 11,5 33,6 25,1 13,2 25,4 13,7 6,5 21,9 13,6 10,9 9,4 INTERE 71,7 50,7 25,2 26,3 11,4 6,3 37,2 25,2 15,2 46,4 37,9 21,3 27,6 16,4 15,9 13,3 DEPREC 69,8 55,2 27,7 38,7 22,5 11,7 71,6 31,9 18,3 31,2 19,8 10,4 49,3 33,9 15,2 3,8 TAXES_ 31,5 29,4 23,8 0,0 -0,5 -1,8 27,9 15,3 8,8 8,9 5,2 0,1 4,9 2,1 13,0 20,7 SUBSID -3,2 -2,1 9,8 1,2 -13,5 -0,9 -10,2 -12,1 1,3 -5,1 -36,0 3,7 -6,5 -3,6 -45,5 -7,7 NETVAL 19,7 6,5 -5,3 19,9 17,7 3,1 39,9 26,1 22,7 24,6 14,1 7,9 90,4 58,1 4,6 2,0
not significant; '-1,95 < T-value <1.95
Source: EU-FADN-DG AGRI L-3; FACEPA.
A10 Annex 2

Annex 2 A11
Table A2.3: R-Square adjusted of equations
DEU FRA ESP ITA UKI
Period 1 2 3 1 2 3 1 2 3 1 2 3 1 2 3
Observations 29,250 19,344 6,952 34,306 19,721 6,626 37,035 23,094 7,981 71,689 38,645 13,351 13,765 8,020 2,527
FEEDPC 0.85 0.88 0.90 0.95 0.95 0.96 0.92 0.83 0.87 0.83 0.76 0.78 0.91 0.94 0.94 FEEDHC 0.47 0.54 0.50 0.41 0.39 0.38 0.35 0.32 0.42 0.69 0.67 0.69 0.41 0.47 0.52 VETCOS 0.42 0.49 0.50 0.83 0.85 0.85 0.83 0.55 0.74 0.43 0.58 0.50 0.87 0.86 0.86 SEED__ 0.69 0.69 0.67 0.70 0.76 0.77 0.54 0.68 0.72 0.58 0.62 0.44 0.87 0.75 0.78 FERTIL 0.85 0.88 0.87 0.86 0.88 0.89 0.69 0.60 0.68 0.64 0.63 0.68 0.79 0.86 0.83 CRPROT 0.91 0.91 0.90 0.88 0.89 0.87 0.62 0.59 0.63 0.60 0.36 0.53 0.91 0.91 0.91 MOTFUE 0.91 0.92 0.92 0.81 0.84 0.86 0.54 0.50 0.55 0.58 0.55 0.51 0.78 0.78 0.82 OENERG 0.78 0.79 0.76 0.59 0.65 0.70 0.32 0.36 0.50 0.33 0.45 0.47 0.92 0.69 0.70 CONWOR 0.62 0.55 0.62 0.62 0.66 0.64 0.37 0.37 0.54 0.40 0.33 0.16 0.51 0.45 0.51 BUILUK 0.35 0.38 0.45 0.35 0.31 0.35 0.15 0.16 0.30 0.20 0.17 0.14 0.62 0.52 0.56 MACHUK 0.80 0.81 0.81 0.77 0.78 0.73 0.39 0.39 0.50 0.49 0.31 0.48 0.83 0.80 0.69 OTHSIC 0.76 0.78 0.74 0.75 0.81 0.80 0.67 0.60 0.63 0.69 0.60 0.57 0.94 0.86 0.86 LANDCO 0.79 0.80 0.82 0.77 0.79 0.77 0.27 0.36 0.56 0.45 0.79 0.42 0.53 0.54 0.55 INTERE 0.54 0.56 0.60 0.65 0.64 0.69 0.21 0.22 0.34 0.20 0.11 0.07 0.42 0.42 0.39 DEPREC 0.87 0.87 0.84 0.84 0.84 0.83 0.40 0.44 0.55 0.57 0.56 0.59 0.77 0.78 0.77 TAXES_ 0.48 0.49 0.53 0.55 0.55 0.52 0.11 0.20 0.41 0.32 0.31 0.34 0.19 0.56 0.52 SUBSID 0.90 0.41 0.34 0.89 0.73 0.77 0.64 0.54 0.64 0.47 0.16 0.09 0.89 0.29 0.34 NETVAL 0.65 0.37 0.57 0.80 0.76 0.76 0.90 0.83 0.92 0.86 0.96 0.90 0.85 0.72 0.80
DAN SVE BEL NED POL HUN
Period 1 2 3 1 2 3 1 2 3 1 2 3 2 3 2 3
Observations 8,761 5,534 1,849 4,182 2,514 883 5,314 3,176 1,032 5,993 3,815 1,328 32,948 11,116 5,093 1,703
FEEDPC 0.94 0.93 0.92 0.91 0.92 0.91 0.97 0.97 0.98 0.96 0.97 0.99 0.88 0.89 0.94 0.94 FEEDHC 0.51 0.46 0.69 0.51 0.66 0.67 0.41 0.42 0.39 0.27 0.18 0.18 0.58 0.54 0.69 0.62 VETCOS 0.83 0.87 0.86 0.43 0.55 0.62 0.88 0.89 0.88 0.77 0.85 0.90 0.62 0.75 0.76 0.85 SEED__ 0.72 0.58 0.81 0.83 0.82 0.78 0.66 0.78 0.78 0.62 0.61 0.63 0.56 0.48 0.82 0.86 FERTIL 0.82 0.82 0.80 0.84 0.84 0.85 0.58 0.77 0.83 0.26 0.75 0.49 0.83 0.84 0.85 0.86 CRPROT 0.88 0.86 0.86 0.77 0.82 0.80 0.89 0.87 0.93 0.67 0.68 0.72 0.79 0.82 0.86 0.86 MOTFUE 0.81 0.80 0.84 0.83 0.85 0.89 0.79 0.63 0.78 0.69 0.71 0.70 0.81 0.83 0.88 0.90 OENERG 0.87 0.87 0.90 0.79 0.81 0.89 0.87 0.87 0.81 0.79 0.81 0.86 0.90 0.88 0.76 0.79 CONWOR 0.62 0.64 0.69 0.69 0.69 0.69 0.72 0.73 0.70 0.32 0.34 0.54 0.36 0.38 0.32 0.32 BUILUK 0.57 0.59 0.61 0.53 0.58 0.59 0.62 0.54 0.49 0.27 0.17 0.47 0.21 0.28 0.61 0.25 MACHUK 0.81 0.82 0.86 0.77 0.77 0.78 0.74 0.75 0.78 0.75 0.75 0.78 0.56 0.60 0.87 0.83 OTHSIC 0.92 0.90 0.92 0.77 0.92 0.91 0.72 0.82 0.81 0.79 0.76 0.81 0.62 0.70 0.72 0.89 LANDCO 0.57 0.56 0.58 0.58 0.64 0.66 0.81 0.81 0.83 0.55 0.43 0.44 0.63 0.62 0.77 0.80 INTERE 0.82 0.79 0.79 0.63 0.61 0.65 0.72 0.69 0.69 0.72 0.74 0.76 0.51 0.47 0.72 0.66 DEPREC 0.90 0.90 0.89 0.79 0.81 0.82 0.87 0.85 0.85 0.80 0.80 0.83 0.74 0.75 0.74 0.70 TAXES_ 0.79 0.82 0.71 0.05 0.03 0.42 0.64 0.60 0.64 0.27 0.59 0.56 0.58 0.71 0.50 0.84 SUBSID 0.86 0.35 0.40 0.81 0.51 0.27 0.83 0.66 0.60 0.18 0.59 0.16 0.21 0.05 0.72 0.71 NETVAL 0.71 0.72 0.47 0.25 0.68 0.82 0.87 0.86 0.88 0.76 0.70 0.56 0.81 0.82 0.65 0.69
Source: EU-FADN-DG AGRI L-3; FACEPA.


Annex 3


Annex 3 A15
Table A3.1: Cost shares of wheat
Product Country Period € /t € /ha t Total output
CropSp in % of outputs % 1)
Energy oSpecCo Overheads DeprFC Subs_c NetValAd
WHEAT DEU 1st 117 810 31 2nd 109 795 35 3rd 202 1358 32
6 9 11 10 13 15
5 5 12
17 19 11
39 9 1
65 18 37
WHEAT FRA 1st 105 743 45 2nd 102 736 46 3rd 182 1162 29
5 8 13 6 7 16 4 5 10
28 33 17
50 31
8
51 23 43
WHEAT ESP 1st 132 398 33 2nd 139 393 29 3rd 183 718 24
6 5 13 9 5 14 7 3 12
13 11 14
47 41
7
76 73 47
DurumWheat ITA 2nd 155 495 49 3rd 325 1074 20
26 9 19 11 -1 9
37 16
30 3
-10 47
WHEAT UKI 1st 113 908 42 2nd 111 908 39 3rd 206 1545 24
7 9 18 9 12 17 5 7 11
22 18 12
47 17
0
50 23 40
WHEAT DAN 1st 112 798 26 2nd 111 773 28 3rd 208 1320 17
4 9 16 5 10 16 4 8 10
21 24 15
38 9 0
62 26 48
WHEAT SVE 1st 108 626 42 2nd 98 586 38 3rd 207 1251 22
13 6 21 17 4 24 11 6 13
19 18
9
44 28
0
43 28 39
WHEAT BEL 2nd 113 933 30 3rd 226 1658 18
7 7 24 5 3 12
31 15
16 24
17 72
WHEAT NED 1st 125 996 12 2nd 125 977 18
5 21 17 7 25 17
23 21
48 25
69 39
WHEAT POL 2nd 104 493 44 3rd 196 895 26
10 2 6 8 2 5
19 13
7 1
26 47
WHEAT HUN 2nd 90 417 24 3rd 184 653 33
14 15 5 13 3 9
8 12
20 13
54 43
1) % of total output. Source: EU-FADN-DG AGRI L-3; FACEPA.

A16 Annex 3
Table A3.2: Cost shares of milk
Product Country Period € /t
Output LiStFeed CropSp Energy oSpecCo
in % of outputs 1)
Overheads DeprFC Subs-c NetValAd
MILK DEU 1st 2nd 3rd
314 292 380
27 27 25
4 4 4
6 8 7
17 19 15
9 10 10
13 12 11
6 4 1
30 24 29
MILK FRA 1st 2nd 3rd
315 295 313
18 19 20
8 7 7
4 4 4
15 14 14
15 16 15
17 20 18
1 4
-3
26 25 19
MILK ESP 1st 2nd 3rd
300 305 242
41 39 41
1 1 1
2 3 3
6 7
11
4 4 4
5 4 6
-4 3 0
38 45 34
MILK ITA 1st 2nd 3rd
384 380 395
45 49 46
-2 -3 1
3 3 3
4 4 4
1 1 1
6 7 7
0 3 0
42 41 37
MILK UKI 1st 2nd 3rd
278 264 315
26 31 33
4 3 3
3 3 4
14 16 15
10 10 10
8 8 7
-3 1 0
32 29 29
MILK DAN 1st 2nd 3rd
336 312 339
22 29 46
4 2
-2
2 3 3
12 12 10
13 14 13
12 13 12
0 1
-1
35 27 16
MILK SVE 1st 2nd 3rd
329 317 323
35 40 46
2 3 3
4 4 4
8 8 6
13 14 18
15 12
9
0 6 0
23 25 15
MILK BEL 1st 2nd 3rd
294 287 341
16 17 18
6 6 5
3 4 4
7 10 8
9 10 8
18 15 12
2 4
-1
42 42 45
MILK NED 1st 2nd 3rd
327 307 357
16 17 16
3 4 3
3 4 4
12 14 12
11 13 11
13 14 12
1 7
-1
44 43 41
MILK POL 2nd 3rd
210 265
22 24
5 5
5 5
9 8
4 4
10 10
1 0
45 45
MILK HUN 2nd 3rd
254 294
59 55
2 4
11 10
17 15
6 5
8 4
15 3
12 11
1) % of total output. Source: EU-FADN-DG AGRI L-3; FACEPA.

Annex 3 A17
Table A3.3: Cost shares of pigs
Product Country Period Output in % of outputs % 1)
€/LU LiStFeed Energy oSpecCo Overheads DeprFC NetValAd
PIG DEU 1st 767 48 5 14 7 10 17 2nd 818 46 6 14 7 10 17 3rd 800 65 6 14 6 9 0
PIG FRA 1st 712 56 2 13 7 9 13 2nd 755 52 2 12 7 9 18 3rd 729 66 2 12 7 10 2
PIG ESP 1st 553 48 1 6 0 1 44 2nd 586 52 1 6 1 2 38 3rd 551 45 1 7 1 2 46
PIG ITA 1st 857 43 2 7 1 3 45 2nd 857 39 1 5 0 2 53 3rd 872 39 1 4 0 1 54
PIG UKI 1st 650 53 2 13 5 5 21 2nd 639 50 2 15 6 4 23 3rd 617 59 2 16 5 3 15
PIG DAN 1st 829 48 3 8 5 10 26 2nd 891 47 4 10 5 11 23 3rd 808 66 4 11 5 12 2
PIG SVE 1st 757 53 3 8 7 14 15 2nd 827 49 5 9 6 11 20 3rd 864 57 5 8 6 8 15
PIG BEL 1st 692 56 1 7 3 7 26 2nd 783 54 3 8 3 6 26 3rd 703 72 3 9 3 7 5
PIG NED 1st 786 51 4 16 3 11 15 2nd 884 48 3 15 3 8 24 3rd 790 67 4 21 3 9 -4
PIG POL 2nd 626 59 3 6 3 5 24 3rd 628 71 3 7 2 5 13
PIG HUN 2nd 700 53 3 19 3 3 19 3rd 659 90 6 18 2 4 -19
1) % of total output. Source: EU-FADN-DG AGRI L-3; FACEPA.

Arbeitsberichte aus der vTI-Agrarökonomie
Nr. 01/2008 Margarian A:
Sind die Pachten im Osten zu niedrig oder im Westen zu hoch?
Nr. 02/2008 Lassen B, Friedrich C, Prüße H:
Statistische Analysen zur Milchproduktion in Deutschland – Geografische Darstellung (Stand: Januar 2008)
Nr. 03/2008 Nitsch H, Osterburg B, von Buttlar Ch, von Buttlar HB:
Aspekte des Gewässerschutzes und der Gewässernutzung beim Anbau von Energiepflanzen
Nr. 04/2008 Haxsen G:
Calculating Costs of Pig Production with the InterPIG Network
Nr. 05/2008 Efken J:
Online-Befragung von Erhalterinnen seltener pflanzen zu Ihren Aktivitäten und Einstellungen
Nutztiere oder Nutz-
Nr. 06/2008 Rudow K, Pitsch M:
Fallstudie zur Wirkung der Ausgleichszulage im Landkreis Oberallgäu (Bayern)
Nr. 07/2008 Daub R:
Fallstudie zur Wirkung der Ausgleichszulage im Landkreis Vogelsberg (Hessen)
Nr. 08/2008 Haxsen G:
Interregionale und internationale Verflechtung der Ferkelversorgung in Deutschland – Berechnung regionaler Versorgungsbilanzen und Kalkulationen der Produktionskosten für Ferkel im interregionalen sowie inter-nationalen Vergleich
Nr. 09/2008 Lassen B, Isermeyer F, Friedrich C:
Milchproduktion im Übergang – eine Analyse von regionalen Potenzialen und Gestaltungsspielräumen
Nr. 10/2008 Gasmi S:
Fallstudie zur Wirkung der Ausgleichszulage im Landkreis St. Wendel (Saarland)

Nr. 11/2008 Pohl C:
Fallstudie zur Wirkung der Ausgleichszulage im Altmarkkreis Salzwedel (Sachsen-Anhalt)
Nr. 12/2008 Gömann H, Heiden M, Kleinhanß W, Kreins P, Offermann F, Osterburg B, Salamon P:
von Ledebur EO,
Health Check der EU-Agrarpolitik – Auswirkungen der Legislativvorschläge
Nr. 13/2008 von Ledebur EO, Ehrmann M, Offermann F, Kleinhanß W:
Analyse von Handlungsoptionen in der EU-Getreidemarktpolitik
Nr. 14/2008 Ehrmann M, Kleinhanß W:
Review of concepts for the evaluation of sustainable agriculture in Germany and comparison of measurement schemes for farm sustainability.
Nr. 01/2009 Gömann H, Kleinhanß W, Kreins P, von Ledebur EO, Offermann F, Osterburg B, Salamon P:
Health Check der EU-Agrarpolitik – Auswirkungen der Beschlüsse
Nr. 02/2009 Schmitz J, von Ledebur, EO:
Maispreisverhalten – Maispreistransmission während des Preisbooms an den Terminmärkten
Nr. 03/2009 Osterburg B, Nieberg H, Rüter S, Isermeyer F, Haenel HD, Hahne J, Krentler JG, Paulsen HM, Schuchardt F, Schweinle J, Weiland P:
Erfassung, Bewertung und Minderung von Treibhausgasemissionen des deutschen Agrarsektors und Verbraucherschutz
Nr. 04/2009 Osterburg B, Röder N, Elsasser P, Dieter M, Krug J:
Analyse ausgewählter internationaler Studien und Dokumente über Kosten und Potenziale der Minderung von Treibhausgasemissionen sowie des Aufbaus und der Erhaltung von C-Senken im deutschen Agrar- und Forstsektor
Nr. 05/2009 Lutter M:
Strukturwandel in der europäischen Milchviehhaltung: Ergebnisse einer regional differenzierten Befragung
Nr. 06/2009 Pufahl A:
Einkommens- und Beschäftigungswirkungen von Agrarumweltmaßnahmen, der Ausgleichszulage für benachteiligte Gebiete und der Ausgleichszahlung für Gebiete mit umweltspezifischen Einschränkungen

Nr. 07/2009 Osterburg B, Nitsch H, Laggner B, Roggendorf W:
Auswertung von Daten des Integrierten Verwaltungs- und Kontrollsystems zur Abschätzung von Wirkungen der EU-Agrarreform auf Umwelt und Landschaft
Nr. 08/2009 Lassen B, Busch G:
Entwicklungsperspektiven der Milchproduktion in verschiedenen Regionen Niedersachsens– ein agri benchmark dairy-Projekt
Nr. 09/2009 Pitsch M, Gasmi S:
Fallstudie zur Entwicklung der Landwirtschaft in einem benachteiligten Gebiet ohne Ausgleichszulage am Beispiel zweier Landkreise im Westharz (Niedersachsen)
Nr. 01/2010 Plankl R, Weingarten P, Nieberg H, Zimmer Y, Isermeyer F, Krug J, Haxsen G:
Quantifizierung „gesellschaftlich Leistungen“ der Landwirtschaft
gewünschter, nicht marktgängiger
Nr. 02/2010 Steinrück B, Küpper P:
Mobilität in ländlichen Räumen unter besonderer Berücksichtigung bedarfsgesteuerter Bedienformen des ÖPNV
Nr. 03/2010 Tietz A:
Auswirkungen von Health Check und EU-Konjunkturprogramm auf die ländlichen Entwicklungsprogramme der deutschen Bundesländer
Nr. 04/2010 Becker H, Strohm-Lömpcke R:
Wohnortnahe Grundschulversorgung in ländlichen Räumen – Rahmenbedingungen und Gestaltungsmöglichkeiten
Nr. 05/2010 Rothe A, Osterburg B:
Entwicklung der Biogasproduktion in Niedersachsen und Auswirkungen auf die Flächennutzung
Nr. 06/2010 Friedrich C:
Milchverarbeitung und -vermarktung in Deutschland – eine deskriptive Analyse der Wertschöpfungskette
Nr. 07/2010 Kleinhanß W, Offermann F, Ehrmann M:
Evaluation of the Impact of Milk quota – Case Study Germany
Nr. 08/2010 Wolter M, Schierholz F, Lassen B:
Künftige Veränderungen in der Lieferantenstruktur einer Molkerei an drei Standorten – Ergebnisse einer Befragung

Nr. 09/2010 Strohm K:
Stoffstromanalyse des deutschen Biokraftstoffsektors für das Jahr 2007
Nr. 10/2010 Margarian A:
Methodische Ansätze zur Quantifizierung der Arbeitsplatzeffekte von Maßnahmen zur ländlichen Entwicklung
Nr. 11/2010 Margarian A:
Gewinnentwicklung und Betriebsaufgabe in der Landwirtschaft: Angebotseffekte, Nachfrageeffekte und regionale Heterogenität
Nr. 12/2010 Deumelandt F, Lassen BJ, Schierholz F, Wagner P:
Entwicklungstendenzen der Milchproduktion in Schweden – Ergebnisse einer Befragung von Milcherzeugern
Nr. 01/2011 Mehl P:
Das agrarsoziale Sicherungssystem in Frankreich. Zentrale Merkmale und Entwicklungen aus der Sicht der landwirtschaftlichen Sozialversicherung in Deutschland
Nr. 02/2011 Kriehn C:
Erwerbstätigkeit in den ländlichen Landkreisen in Deutschland seit 1995
Nr. 03/2011 Plankl R:
Finanzielle Staatshilfen für den Agrarsektor und deren regionale Verteilung
Nr. 04/2011 Peter G:
Gemeinschaftliche Absatz- und Exportförderung für Agrarerzeugnisse und Lebensmittel in Österreich und den USA
Nr, 05/2011 von Ledebur O, Schmitz J:
Preisvolatilität auf landwirtschaftlichen Märkten
Nr. 06/2011 Klepper R:
Energie in der Nahrungsmittelkette.
Nr. 07/2011 Kleinhanß W, Offermann F, Butault JP (INRA), Surry Y:
Cost of production for major agricultural commodities in the EU member countries using farm accounting data