cost & performance analysis for thermal enhancements at
TRANSCRIPT

FINAL REPORT
Cost and Performance Analysis for Thermal Enhancements at Selected Sites
Prepared for
U.S. AIR FORCE CENTER FOR ENVIRONMENTAL EXCELLENCE
October 2005

FINAL REPORT
COST AND PERFORMANCE ANALYSIS FOR THERMAL ENHANCEMENTS AT SELECTED SITES
For
U.S. AIR FORCE CENTER FOR ENVIRONMENTAL EXCELLENCE
19 October 2005
Contract F41624-03-D-8613 Task Order 0021
Project: 743389
Parsons
406 West South Jordan Parkway, Suite 300 South Jordan, Utah 84095

ES-1
EXECUTIVE SUMMARY
The Air Force Center for Environmental Excellence (AFCEE) contracted with Parsons
Infrastructure and Technology Group, Inc. (Parsons) to conduct an evaluation of
commercially available thermal enhancement technologies for the remediation of source
areas including non-aqueous phase liquids (NAPLs). The intention of this project was to
develop a Cost and Performance Analysis for Thermal Enhancements at Selected Sites
report for AFCEE Remedial Project Managers (RPMs) which identifies positive and
negative aspects of thermal technologies and provides guidelines for the appropriate use
of thermal technologies. This Report may be used by Air Force RPMs as a tool for aiding
the selection process of source remediation technologies.
The first part of the evaluation consisted of accessing environmental databases to
identify thermally enhanced source remediation projects in the US. Twenty-seven such
projects were identified through the database search. After the projects were identified,
an initial web-based questionnaire, requesting general information about each site, was
e-mailed by AFCEE to each of the 27 government or consultant Points of Contact (POCs)
for each project. Twenty-one of the POCs completed the questionnaires and returned
them to AFCEE. Evaluation of the 21 returned questionnaires led to the following
conclusions:
� Only one respondent indicated that thermal enhancement was a failure. The other
20 respondents indicated their thermal projects were successful or somewhat
successful.
� Of the 20 respondents that felt their projects were successful or somewhat
successful (the favorable respondents), four indicated that thermal enhancement
had definitely decreased the overall remedial costs; eight stated it had probably
decreased overall costs; three indicated that thermal enhancement had definitely
increased the overall remedial costs; three responded that the cost impact was

ES-2
unknown; and two indicated thermal enhancement made no impact to overall
costs.
� Of the 20 favorable respondents that felt thermal enhancement was successful or
somewhat successful, only 14 of these stated they would use the same technology
again.
� Six of the 20 favorable respondents indicated that, knowing the results, they
would not use the same thermal technology, and four of these six indicated that,
knowing the results, they would have chosen a non-thermal technology.
� Eight of the 20 favorable respondents indicated that, knowing the results, they
would have chosen a non-thermal technology.
� Thermal enhancement was selected in decision documents at only 11 of the sites,
seven were interim actions, and 16 projects were chosen as technology
demonstrations.
� Regulatory encouragement was a factor in the selection of thermal enhancement at
10 of the sites, and vendor marketing was a factor at only five sites.
� Based on the initial questionnaires and from telephone contacts with 17 of the
POCs, it is apparent that facility personnel played a substantial role in the
selection of thermal enhancement at their respective sites.
Parsons evaluated the 21 questionnaires to reduce the number of sites for further
examination from 21 to 11, with the intention of completing more detailed questionnaires
and telephone interviews. Only 17 of the 21 responding POCs agreed to provide further
support to AFCEE, and six of those 17 would not or could not respond to later requests to
complete the more detailed questionnaires and telephone interviews. The 11 remaining
projects were selected for more detailed evaluations and telephone interviews.
A second and more detailed questionnaire was e-mailed to each of the remaining
11 POCs requesting site-specific information regarding their project, including their

ES-3
general assessment of the success or failure of their thermal enhancement project. Each
POC was interviewed by telephone and, based on the interviews, it became apparent that
success of a project did not relate directly to site closure or attainment of predetermined
cleanup objectives. In most cases, success meant mass removal was achieved or
enhanced as compared to earlier remedial efforts. In some cases, success simply meant
that thermal enhancement appeared to be less expensive than long-term groundwater
extraction and treatment.
Parsons used the information from the telephone interviews and responses to the
second questionnaire provided by the 11 site POCs to identify four sites for detailed
evaluation and generation of life cycle cost analyses. The information gathered was
summarized into six basic questions:
1) How successful was the project according to the POC?
2) Why was the project considered successful according to the POC?
3) Did the regulators agree that the project was successful?
4) What was the POC�s impression of the cost impact?
5) Based on Parsons� evaluation, were the site characteristics favorable to another
treatment technology?
6) Based on Parsons� evaluation, did thermal enhancement positively impact
overall remedial costs?
Based on the answers to these six questions, Parsons selected the following four sites
for detailed evaluations:
� Niagara Falls Air Reserve Station (ARS) Installation Restoration Program (IRP)
Site 10, a six phase soil heating project for remediation of trichloroethene (TCE)
at a fire training area.
� Savannah River Site (SRS) 321-M, a steam injection project for remediation of
TCE and tetrachloroethene (PCE) at a former storage tank.

ES-4
� Yorktown Fuels Defense Fuel Supply Point (DFSP) Navy Special Fuel Oil
(NSFO) Tank Farm, an indirect heating project that used steam recirculation to
recover free-phase naval ship fuel oil at a tank farm.
� Fort Richardson Alaska Poleline Road Disposal Area (PRDA), a six phase soil
heating project to remediate TCE and 1,1,2,2-PCAfrom a former chemical test kit
disposal area.
Parsons visited each site and collected additional information related to the site
characterization, thermally enhanced system performance and operation, project cost, and
post-treatment analytical data for each site.
Based on the evaluations of the four sites chosen for this project, thermally enhanced
source remediation was clearly an appropriate technology at only one site � Poleline Road
Disposal Area, Fort Richardson, Alaska. This site was contaminated with recalcitrant
compounds (PCE, TCE, and 1,1,2,2-tetrachloroethane) that had migrated to a depth of
38 feet below ground surface (bgs) and the areal extent of contamination was limited in
size (two areas of less than one-third acre each). Additionally, pilot testing of air
sparging and dual-phase extraction showed limited success, and off-gas treatment of
extracted soil vapor was not required, thus reducing the overall remediation costs.
Following completion of the Six Phase Soil Heating (SPSH) project, future remedial
activities at the PRDA site are now limited to natural attenuation of groundwater. The
life cycle cost analysis showed that, at the time frame of this remediation, SPSH was
more cost effective than the other remedial technologies that were evaluated in the
Corrective Measures Study (CMS).
The evaluations of the projects at Niagara Falls ARS IRP Site 10 and Yorktown Fuels
NSFO Tank Farm showed that thermally enhanced source remediation approaches were
less effective in terms of cost and removal efficiency than if soils at each site were
excavated and treated/disposed.

ES-5
Evaluation of the steam injection project at SRS 321-M site presents somewhat
inconclusive findings. The steam injection project was effective in terms of mass
recovery, in meeting soil cleanup objectives for the targeted area of soil, for removing
contaminant mass from the clayey layers present at the site, and for temporarily reducing
contaminant concentrations in groundwater below the site. However, soil vapor
extraction (SVE) without thermal enhancement was also shown to effectively remove
contaminant mass from the sandy soil regions and was less costly than the addition of
steam to enhance contaminant recovery. The effectiveness of SVE on the clayey layers
was not measured, but experience at other sites indicates its effectiveness is reduced in
clayey soil, thus reducing its overall effectiveness in achieving remediation of the vadose
zone. Remediation of groundwater at the 321-M site was not achieved. However, it
should be noted that the plume under the 321-M site is contained within a larger plume
and remediation of the plume under the 321-M site would have been only temporary as
groundwater flow from the larger plume would have re-contaminated the groundwater
under the 321-M site.
Based on the detailed evaluation of these four sites, is appears that while thermally
enhanced source remediation has in many cases significantly enhanced the recovery of
contaminant mass as compared to non-thermal technologies, implementation of thermal
enhancement did not result in the complete closure of any of these four sites.
Remediation of the soil unit at PRDA Fort Richardson, AK and of the overburden soil at
Niagara Falls ARS Site 10, are considered complete, but additional active groundwater
remediation measures are still required at the Niagara Falls site. Additionally, based on
the life cycle cost analyses, with the exception of the PRDA site in Alaska and possibly
the SRS 321-M site, implementation of thermally enhanced source remediation
technologies had significantly higher costs than non-thermal technologies.
Based on all information gathered during this project, it can be concluded that
implementation of thermal enhancement did not lead to complete site closure at any of
the 21 facilities that were evaluated under this project. Thermally enhanced soil vapor
extraction did lead to closure of the soil operable units at Air Force Plant 4, TX and at the
PRDA, Fort Richardson, AK, and of the overburden soil at Niagara Falls ARS, NY.

ES-6
Additionally, thermal enhancement did result in regulatory acceptance of monitored
natural attenuation (MNA) at the PRDA site in Alaska, and may have assisted in
acceptance of MNA at two additional sites (Edwards Air Force Base [AFB], CA, and
Whittier DFSP, AK). However, at both the Edwards AFB site and at Whittier DFSP,
MNA would likely have been accepted even in the absence of the thermal enhancement
projects. At the two remaining sites at which closure of the soil units were obtained (Air
Force Plant 4 and Niagara Falls ARS), active groundwater remediation activities are still
required.
Ultimately, it appears that thermal enhancement was effective at achieving closure of
the soil units at three of 21 sites, and resulted in regulatory acceptance of MNA,
definitively, at only one of those three sites. This translates into closure of soil units at 14
percent of sites, obtaining MNA as the sole remedy at 5 percent of sites, and achieving
complete site closure at 0 percent of sites. Although thermal enhancement intuitively
seems like a logical approach, results of this study would indicate that Air Force RPMs
should approach the technology cautiously, carefully evaluating all remedial alternatives
prior to adopting this aggressive and costly technology.

i
FINAL REPORT COST AND PERFORMANCE ANALYIS FOR
THERMAL ENHANCEMENTS AT SELECTED SITES
TABLE OF CONTENTS
PAGE EXECUTIVE SUMMARY .........................................................................................ES-1
TABLE OF CONTENTS .................................................................................................. i
LIST OF TABLES........................................................................................................... iv
LIST OF FIGURES ......................................................................................................... iv
LIST OF ACRONYMS .....................................................................................................v
1.0 INTRODUCTION.............................................................................................. 1-1
1.1 Project Description and Objectives.......................................................... 1-1 1.2 Project Approach ..................................................................................... 1-2 1.3 Report Organization................................................................................. 1-3
2.0 SCREENING AND SELECTION OF THERMAL PROJECT SITES ....... 2-1 2.1 Database Review of Potential Thermal Projects...................................... 2-1 2.2 Initial Questionnaire................................................................................. 2-2 2.3 Selection of Eleven Thermal Projects for Further Evaluation ................. 2-4 2.3.1 Analysis of Initial Questionnaire............................................ 2-4 2.3.2 Telephone Interviews with Points of Contact ........................ 2-5 2.4 Identification of Four Thermal Projects for Detailed Evaluation ............ 2-7
3.0 DESCRIPTION OF FOUR SITES SELECTED FOR LIFE CYCLE COST ANALYSIS ...................................................................................................... 3-1
3.1 Introduction.............................................................................................. 3-1
3.2 Niagara Falls Air Reserve Station, Niagara Falls, NY............................. 3-1 3.2.1 Site Description ...................................................................... 3-1 3.2.2 Thermal Technology Description........................................... 3-4
3.2.2.1 General Description of Six Phase Soil Heating Technology................................................................................... 3-4
3.2.2.2 Description of SPSH Technology Used at Niagara Fall ARS Site 10 .......................................................................... 3-5

ii
TABLE OF CONTENTS (CONTINUED) 3.2.3 Operation of SPSH System at Niagara Falls ARS Site 10 ..... 3-7 3.2.4 Contaminant Mass Removal Estimates................................ 3-11 3.2.5 Post-Implementation Sampling/Monitoring Results ............ 3-12 3.2.5.1 Soil Sample Results ...................................................... 3-12 3.2.5.2 Groundwater Monitoring Results ................................. 3-12 3.2.6 Thermal Project Cost............................................................ 3-16
3.3 Savannah River Site, 321-M Solvent Storage Tank Area, Aiken, SC .. 3-17 3.3.1 Site Description .................................................................... 3-17 3.3.2 Thermal Technology Description......................................... 3-18 3.3.2.1 General Description of DUS/HPO Technology............ 3-18 3.3.2.2 Description of DUS/HPO Technology Used at SRS .... 3-20 3.3.3 Operation of DUS/HPO System at SRS............................... 3-21 3.3.4 Contaminant Mass Removal ................................................ 3-24 3.3.5 Post-Implementation Sampling/Monitoring Results ............ 3-25 3.3.5.1 Soil Sample Results ...................................................... 3-25 3.3.5.2 Groundwater Monitoring Results ................................. 3-25 3.3.6 Thermal Project Cost............................................................ 3-26
3.4 Yorktown Defense Fuel Supply Point, Yorktown, VA.......................... 3-27 3.4.1 Site Description .................................................................... 3-27 3.4.2 Thermal Technology Description......................................... 3-31 3.4.2.1 General Description of Steam Recirculation Heating
Technology................................................................................. 3-31 3.4.2.2 Description of Steam Recirculation Technology
Used at Yorktown Fuels Site ..................................................... 3-32 3.4.3 Operation of Steam Circulation System at Yorktown Site... 3-33 3.4.4 Contaminant Mass Removal ................................................ 3-34 3.4.5 Post-Implementation Sampling/Monitoring Results ............ 3-35 3.4.5.1 Soil Sample Results ...................................................... 3-35 3.4.5.2 Groundwater Monitoring Results ................................. 3-35 3.4.6 Thermal Project Cost............................................................ 3-35
3.5 Poleline Road Disposal Area, Fort Richardson, AK.............................. 3-36 3.5.1 Site Description .................................................................... 3-36 3.5.2 Thermal Technology Description......................................... 3-38 3.5.2.1 General Description of SPSH Technology ................... 3-38 3.5.2.2 Description of SPSH Technology Used at PRDA Site . 3-40 3.5.3 Operation of SPSH Systems at PRDA ................................. 3-45 3.5.4 Contaminant Mass Removal ................................................ 3-48 3.5.5 Post-Implementation Sampling/Monitoring Results ............ 3-49 3.5.5.1 Soil Sample Results ...................................................... 3-49 3.5.5.2 Groundwater Monitoring Results ................................. 3-51 3.5.6 Thermal Project Cost............................................................ 3-52

iii
TABLE OF CONTENTS (CONTINUED)
4.0 LIFE CYCLE COSTS ANALYSES OF FOUR SELECTED SITES ........... 4-1 4.1 Introduction.............................................................................................. 4-1
4.2 Niagara Falls Air Reserve Station, Niagara Falls, NY............................. 4-1 4.2.1 Comparison of Actual Costs to Other Remedial Approaches
Discussed in the Decision Documents ......................................... 4-1 4.2.2 Other Remedial Approaches That May be Applicable to
Niagara Falls ARS IRP Site 10 ........................................................ 4-4 4.3 Savannah River Site, Aiken, SC ............................................................. 4-5
4.3.1 Comparison of Actual Costs to Other Remedial Approaches Discussed in the Decision Documents ......................................... 4-5
4.3.2 Other Remedial Approaches That May be Applicable to SRS Site 321-M ........................................................................... 4-7
4.4 Yorktown Fuels DESC, Yorktown, VA .................................................. 4-9 4.4.1 Comparison of Actual Costs to Other Remedial Approaches
Discussed in the Decision Documents ......................................... 4-9 4.4.2 Other Remedial Approaches That May be Applicable to
Yorktown Fuels NSFO Site ....................................................... 4-11 4.5 Fort Richardson Poleline Road, Fort Richardson, AK........................... 4-12
4.5.1 Comparison of Actual Costs to Other Remedial Approaches Discussed in the Decision Documents ....................................... 4-12
4.5.2 Other Remedial Approaches That May be Applicable to Fort Richardson PRDA...................................................................... 4-14
5.0 POLLUTANT EMISSIONS FROM POWER GENERATION DURING
THERMAL ENHANCEMENT PROJECTS ................................................. 5-1 6.0 SUMMARY AND CONCLUSIONS ................................................................ 6-1 6.1 Summary of Project Activities...................................................................... 6-1 6.1.1 Site Selection .................................................................................. 6-1 6.1.2 Pollutant Emissions from Power/Steam Generation...................... 6-1 6.2 Conclusions................................................................................................... 6-2 6.3 Important Considerations Regarding Appropriateness of Thermal
Enhancement ................................................................................................ 6-6 7.0 REFERENCES................................................................................................... 7-1 APPENDICES
Appendix A � Initial Questionnaire Appendix B � Second Questionnaire and Interview Summaries with Thermal Project
POCs

iv
LIST OF TABLES
TABLE NO. TITLE 2.1 AFCEE Thermal Enhancement Projects Initial Questionnaire Summary 2.2 Summary of Second Questionnaires and Interviews with Facility POCs 3.1 Soil Sampling Results Before and After Treatment Niagara Falls ARS Site 10 3.2 Mass Removal Estimates at PRDA Soil Heating Site 3.3 Average Concentrations (mk/kg) of Site COCs in Pre and Post Treatment Soil
Samples PRDA Soil Heating Site 5.1 Air Pollutant Production Rates per Unit of Fossil Fuel
LIST OF FIGURES
FIGURE NO. TITLE
3.1 Niagara Falls ARS Site 10 Site Map 3.2 Niagara Falls ARS Site 10 SPSH Array Layout 3.3 Niagara Falls ARS Site 10 Soil Heating/Venting System Cross-Section 3.4 Locations of Wells and Thermocouple/ERT Arrays Installed for SRS 321-M Site
Remediation 3.5 SRS DUS/HPO Process Flow Diagram 3.6 Navy Special Fuel Oil Area Yorktown Fuels Annex Site Plan 3.7 Yorktown Fuels Apparent NSFO Thickness Isopach, January 2004 3.8 Poleline Road Disposal Area Site Map, Fort Richardson, Alaska 3.9 Site Map for Arrays 1, 2, and 3 PRDA, Fort Richardson, Alaska 3.10 Site Map for Arrays 4, 5, and 6 PRDA, Fort Richardson, Alaska

v
LIST OF ACRONYMS
µg/kg micrograms per kilogram
µg/L micrograms per liter
A-E Architect-Engineer
AFB Air Force Base
AFCEE Air Force Center for Environmental Excellence
ARS Air Reserve Station
Battelle Battelle Science & Technology International
bgs below ground surface
BTEX benzene, toluene, ethylbenzene, and xylenes
BTU British Thermal Unit
°C degrees Celsius
CAP Corrective Action Plan
cfm cubic foot per minute
cis-DCE cis-1,2-dichloroethene
cm/sec centimeters per second
CMS Corrective Measure Study
COC contaminant of concern
DAF dissolved air floatation
DFSP Defense Fuel Supply Point
DOD Department of Defense
DOE Department of Energy
DNAPL dense non-aqueous phase liquid
DUS Dynamic Underground Stripping
DWS DNAPL-water separator
EAB Enhanced Anaerobic Bioremediation
EPA Environmental Protection Agency
ERS Science and Engineering Division
ERT Electrical Resistance Technology
ESTCP Environmental Security Technology Certification Program
FRTR Federal Remedial Technology Roundtable
°F Fahrenheit
FS Feasibility Study
ft/day feet per day
gpm gallons per minute

vi
LIST OF ACRONYMS (CONTINUED)
HDPE high-density polyethylene
hp horse power
HPO Hydrous Pyrolysis Oxidation
IRA Interim Remedial Action
IRP Installation Restoration Program
ITRC Interstate Technology Regulatory Council
kW kilowatt
kWH kilowatt-hour
LNAPL light non-aqueous phase liquid
LTM long-term monitoring
MCL Maximum Contaminant Level
mg/kg milligrams per kilogram
mg/L milligrams per liter
MNA monitored natural attenuation
MVE vapor extraction well
NAPL non-aqueous phase liquid
NPDES National Pollution Elimination Discharge System
NSFO Navy Special Fuel Oil
NYS New York State
NYSDEC New York State Department of Environmental Conservation
O&M operations and maintenance
Parsons Parsons Infrastructure and Technology Group, Inc.
PCA tetrachloroethane
PCE tetrachloroethene
PID photoionization detector
POC Point of Contact
ppm parts per million
PVC polyvinyl chloride
PRDA Poleline Road Disposal Area
psi pounds per square inch
psig pounds per square inch gauge
RBC risk-based criteria
RCRA Resource Conservation and Recovery Act
ROD Record of Decision

vii
LIST OF ACRONYMS (CONTINUED)
RPM Remedial Project Manager
RW recovery well
scfm standard cubic feet per minute
SERDP Strategic Environmental Research Development Program
SPSH Six Phase Soil Heating
SRS Savannah River Site
SSTA Solvent Storage Tank Area
SVE soil vapor extraction
SVEU soil vapor extraction unit
SVOC semi-volatile organic compound
T trench
TCA trichloroethane
TCE trichloroethene
TPH total petroleum hydrocarbon
US United States
UST underground storage tank
VOC volatile organic compound

1-1
1.0 INTRODUCTION
1.1 PROJECT DESCRIPTION AND OBJECTIVES
The Air Force Center for Environmental Excellence (AFCEE) contracted with Parsons
Infrastructure and Technology Group, Inc. (Parsons) to conduct an evaluation of
commercially available thermal enhancement technologies for the remediation of source
areas including non-aqueous phase liquids (NAPLs). Parsons identified 25 Federal
(e.g., Department of Defense [DOD], Department of Energy [DOE]) thermal projects and
two private sector projects, and gathered preliminary information from each site regarding
the thermal technology used, effectiveness for source remediation, and project cost.
Using this information, a subset of 11 sites was identified for further evaluation and
interviews with the project�s Points of Contact (POCs). The list of 11 sites was reduced
to four for detailed evaluations and development of life cycle costs for comparison to
estimated costs of alternative source remediation technologies. Parsons prepared this
Cost and Performance Analysis for Thermal Enhancements at Selected Sites report which
identifies positive and negative aspects of thermal technologies and provides guidelines
for the appropriate use of thermal technologies. This Report may be used by AFCEE
Remedial Project Managers (RPMs) as a tool for aiding the selection process of source
remediation technologies. The scope of work for this project was described in the 5 June
2003 Proposal for Architect-Engineering (A-E) Services Support To Evaluate Thermal
Enhancement For The Cost-Effective Remediation of Non-Aqueous Phase Liquids
(NAPLs), prepared by Parsons and submitted to AFCEE as Task Order Number 0021, of
Contract No. F41624-03-D-8613.
The objectives identified to support completion of this project are as follows:
� Develop a database containing detailed information on thermally enhanced source
remediation projects identified during internet searches.
� Identify four sites with sufficient available data to develop accurate life cycle
costs.

1-2
� Prepare a report that presents the findings of the project reviews and compares life
cycle costs of the four sites to the estimated costs of alternative remedial
technologies.
1.2 PROJECT APPROACH
The technical approach for this project was described in the 5 June 2003 Proposal for
Architect-Engineering (A-E) Services Support To Evaluate Thermal Enhancement For
The Cost-Effective Remediation of Non-Aqueous Phase Liquids (NAPLs) (Parsons). The
approach was broken down into four basic tasks:
Task 1 � Task order management, including program and project management cost
for the project.
Task 2 � Initial site screening to identify potential sites from available internet
databases, develop an initial questionnaire requesting information from each
potential site, and develop a database to store information generated by the
questionnaires.
Task 3 � Selection of 10 sites for further evaluation, including completion of a
secondary and more detailed questionnaire and telephone interviews with
each project�s POC, followed by selection of four of these sites for thorough
evaluations, site visits, and development of life cycle cost analyses.
Task 4 � Life cycle reporting including collection of information regarding the project
and costs, visits to each site to interview the POCs, analyze the project
designs, and audit their performance criteria, followed by development of
life cycle costs and comparison to estimated cost of alternative remedial
approaches, and preparation of a Cost and Performance Analysis for
Thermal Enhancements at Selected Sites Report.

1-3
1.3 REPORT ORGANIZATION
This report is organized into seven sections and two appendices:
Section 1.0 Introduction
Section 2.0 Screening and Selection of Thermal Project Sites
Section 3.0 Description of Four Sites Selected for Life Cycle Cost Analysis
Section 4.0 Life-Cycle Cost Analyses of Four Selected Sites
Section 5.0 Pollutant Emissions From Power Generation During Thermal Enhancement Projects
Section 6.0 Summary and Conclusions
Section 7.0 References
Appendix A Initial Questionnaire
Appendix B Second Questionnaire and Interview Summaries with Thermal Project POCs

2-1
2.0 SCREENING AND SELECTION OF THERMAL PROJECT SITES
2.1 DATABASE REVIEW OF POTENTIAL THERMAL PROJECTS
Parsons began the identification and screening of potential sites in August 2003 by
accessing several internet databases for information regarding thermal enhancement
projects in the United States (US). The following databases were accessed:
� US Environmental Protection Agency (US EPA) Clu-In website (www.clu-
in.org).
� Environmental Security Technology Certification Program (ESTCP)
(www.estcp.org).
� Strategic Environmental Research Development Program (SERDP)
(www.serdp.org).
� Federal Remedial Technology Roundtable (FRTR) (www.frtr.gov).
The searches concentrated on identification of thermal enhancement projects in the US
that were designed for the remediation of petroleum and halogenated hydrocarbon source
areas. Using these databases, 25 federal projects and two private sector projects were
identified.
Parsons then contacted the POCs for each project as identified on the databases. Most
of these POCs were vendor project managers. Parsons contacted the vendor POCs and
requested they provide the name and contact information of the government POCs (for
the 25 federal sites) or the consultant POC (for the two commercial sites). Several of the
vendor POCs did not respond to our request, and several others were no longer with the
company and could not be contacted to request their aid in identification of the
government POCs. In these instances, Parsons contacted the environmental
flight/division of each facility/base to identify the POCs.

2-2
Following identification of all 27 government/consultant POCs, Parsons contacted the
POCs and requested their support for this project and informed them that AFCEE would
contact them directly. The site and POC information was used to develop a secure
internet database from which information could be e-mailed directly to the POCs and
accessed by AFCEE and other interested parties by use of an internet link, website, and
password.
2.2 INITIAL QUESTIONNAIRE
Concurrent with development of the website database, AFCEE and Parsons developed
an initial web-based questionnaire designed to gather general information regarding each
of the 27 thermal sites. Information related to the type of contaminant, the thermal
technology used, scale of the project, relative success of the project, and availability of
cost data was requested; and questions related to the regulatory aspects of the project
were asked. A copy of this questionnaire is provided in Appendix A.
The initial questionnaire was placed on the secure website, and the link and password
information was e-mailed by AFCEE to each POC identified for the 27 project sites. The
POCs answered the questions directly on the website, and the information was stored in
the database. Twenty-one POCs responded to the request for support and completed the
initial questionnaire. Four of the 21 respondents completed the questionnaire but
declined to further participate in the AFCEE project. Six respondents, four that declined
to further participate and two others, declined to share cost data. Six POCs did not
respond to AFCEE�s request or complete the initial questionnaire. The answers from the
21 POCs who responded to the initial questionnaire are tabulated and are included in
Table 2.1. This table was submitted to AFCEE for review. The table rows in black type
indicate the POCs who were willing to further participate in the AFCEE project and to
share cost data. The rows in blue type indicate the POCs who, though willing to further
participate, were not willing to share cost data. The rows in red type indicate the POCs
who were not willing to further participate in this project.

TABLE 2.1AFCEE THERMAL ENHANCEMENT PROJECTS INITIAL QUESTIONNAIRE SUMMARY
Edwards AFB Stephen Watts CAH in Fuel Steam Pilot Complete Success Some Data Unknown No Yes Yes Yes No No No Yes Yes Yes
Cape Canaveral Jackie Quinn CAH Steam Pilot Complete Somewhat Extensive Data Unknown No No Yes No No Yes No No Yes Yes
Robert Gray AAF Fred Klinger Fuel Hydro. Steam Pilot Complete Success Some Data Definitely Decreased Yes No Yes No No Yes No No Yes Yes
Portsmouth Gaseous Diff. John Sokol CAH Steam Pilot Complete Somewhat Extensive Data Increased Cost No No Yes Yes Yes No Yes No Yes Yes
Ft. Wainright RF Heating Rielle Markey Fuel Hydro. Radio Frequency Pilot Complete Somewhat Some Data Increased Cost Yes Yes Yes Yes Yes Yes Yes Yes Yes Yes
Lowry Landfill Bill Plaehn Fuel Hydro. Electric Resistance Full-Scale Complete Somewhat Some Data Definitely Decreased Yes No Yes Yes No Yes No No Yes Yes
Niagara Falls ANG Gerry Hromowyk CAH Therm Enhance SVE Full-Scale Complete Success Extensive Data Probably Decreased No Yes Yes No No Yes No Yes Yes Yes
North Island NAS Bill Collins CAH in Fuel Steam Full-Scale In-Progress Success Extensive Data Probably Decreased No Yes Yes No Yes Yes No No Yes Yes
Lawrence Livermore Roger Aines Fuel Hydro. Steam Full-Scale Complete Success Extensive Data Definitely Decreased Yes Yes Yes Yes No Yes No No Yes Yes
Rocky Mountain Arsenal Ronald Versaw Hexachlorocy. Electric Resistance Full-Scale Complete Failure Some Data Increased Cost No No Yes Yes Yes No No Yes Yes Yes
Whittier DESC Jack Appolloni Fuel Hydro. Steam, Air and ER Full-Scale Complete Success Extensive Data Increased Cost Yes Yes No Yes No Yes Yes No Yes Yes
Yorktown DESC Jennifer Davis Fuel Hydro. Steam Full-Scale In-Progress Success Some Data Probably Decreased Yes No No No No Yes Yes No Yes Yes
Mare Island Navy Facility Christopher Lones PCBs Electric Resistance Full-Scale Complete Somewhat Some Data No Impact Yes No No No No Yes Yes Yes Yes Yes
Savannah River (DUS/HPO) Chris Bergren CAH Steam Full-Scale Complete Success Some Data Definitely Decreased No No No Yes No Yes No No Yes Yes
Air Force Plant 4 George Walters CAH Electric Resistance Full-Scale Complete Success Extensive Data Probably Decreased Yes No No No No Yes Yes No Yes Yes
Centerville Beach Navy Fac. Louis Lew PCBs In-Situ Therm Pilot Complete Somewhat Some Data Probably Decreased Yes Yes Yes Yes No No No Yes Yes No
Ft. Richardson Pole Line Dis Scott Kendall CAH Electric Resistance Full-Scale Complete Success Some Data Probably Decreased Yes No Yes No No Yes No Yes Yes No
Puget Sound Navy Yard Rod Gross Fuel Hydro. Steam Full-Scale Complete Somewhat Some Data Probably Decreased Yes No Yes Yes No Yes Yes No No No
Leemore NAS Don Roberts Fuel Hydro. Steam Pilot Complete Somewhat No Data Probably Decreased No No Yes No Yes No No Yes No No
Launch Pad 34 Mike Deliz CAH Steam Pilot Complete Somewhat Extensive Data Unknown No No Yes No No No No No No No
Kelly AFB Don Buelter CAH in Fuel Electric Resistance Pilot Complete Somewhat Some Data No Impact No No Yes No No No Yes Yes No No
Green font indicates facility is not willing to share cost data.Red font indicates facility is not willing to participate further with the project. 2-3
Did Regulators Suggest or Encourage Technology
Was Tech. selected on
Vendor Marketing
Impact to Overall Cost
Technology Selected in FS
or CMS
Was Project an Interim
Action
Was Project a Technology
Demonstration
Pilot or Full Scale Project Status Success or
Failure
Extent of Available Cost
DataSite Location/Name P.O.C. TechnologyType Source
Area
Are you willing to participate
further in this study
Are you willing to share cost
data
Knowing results, would you use the same Tech.
again
Knowing results, would you use a different Therm
technology
Knowing results, would you select
a different technology

2-4
2.3 SELECTION OF ELEVEN THERMAL PROJECTS FOR FURTHER
EVALUATION
2.3.1 Analysis of Initial Questionnaire
Seventeen of the 21 respondents stated that they were willing to further participate in
the AFCEE project. Parsons contacted each of those 17 POCs, including the two who
declined to share cost data. Each POC was asked to verify their answers to the initial
questionnaire, and Parsons assessed their willingness to provide further support for the
project (some POCs appeared to be very willing to support the AFCEE project while
others were not). The apparent willingness to support AFCEE was one factor in the
selection of the 11 projects for which further evaluation was to be conducted.
Analysis of the answers from all 21 respondents showed some interesting, though
somewhat inconsistent, results. Only one respondent indicated that thermal enhancement
was a failure. This project was unique in that the contaminant, hexachlorocylco-
pentadiene, a pesticide precursor, degraded under heat to produce pure hydrochloric acid,
which destroyed the treatment train within 10 days. The other 20 respondents indicated
their thermal projects were successful or somewhat successful. However, only four of
these 20 respondents indicated that thermal enhancement had definitely decreased the
overall remedial costs, and eight stated it had probably decreased overall costs. Of the
remaining eight respondents, three indicated that thermal enhancement had definitely
increased the overall remedial costs, three responded that the cost impact was unknown,
and two indicated thermal enhancement made no impact to overall costs. Of the
20 respondents that felt thermal enhancement was successful or somewhat successful,
only 14 of these stated they would use the same technology again. Six of those 20
respondents indicated that, knowing the results, they would not use the same thermal
technology, and four of these six indicated that, knowing the results, they would have
chosen a non-thermal technology. A total of eight of those 20 respondents (four cited in
the previous sentence and four others) indicated that, knowing the results, they would
have chosen a non-thermal technology.

2-5
There is an apparent inconsistency in the respondent�s answers as described in the
above paragraph. This conclusion is based on the findings that 20 respondents felt
thermal enhancement was successful or somewhat successful, yet only 12 indicated that
thermal enhancement had a positive impact to overall remedial costs, and only 12
indicated they would chose the same thermal technology. The definition of success was a
key question for the secondary questionnaires and telephone interviews.
Other information made available from the 21 respondents was that thermal
enhancement was selected in decision documents at only 11 of the sites. Seven of the
thermal projects were interim actions, and 16 projects were chosen for technology
demonstrations. Regulatory encouragement was a factor in the selection of thermal
enhancement at 10 of the sites, and vendor marketing was a factor at only five sites. One
apparent conclusion from these responses, as well as from telephone conversations with
17 of the POCs, is that facility personnel played a substantial role in the selection of
thermal enhancement at their respective sites.
Based on analysis of the responses to the initial questionnaires, 17 of the 27 thermal
project sites originally identified could be considered for further evaluation. Five of these
17 were not willing to conduct telephone interviews or respond to a second and more
thorough questionnaire. One other contact was not the original project POC and was not
sufficiently knowledgeable to answer additional questions regarding the thermal project at
their site (the original POC was unavailable during the time frame of this AFCEE
project). The remaining 11 POCs appeared to be very cooperative and willing to
participate further. The selection of the 11 project sites for further evaluation was based
on the availability and cooperativeness of the remaining 11 POCs.
2.3.2 Telephone Interviews with Points of Contact
The next step in the selection for sites at which detailed evaluations would be
completed was to develop a more thorough questionnaire and conduct telephone
interviews with the POCs at the 11 potential sites. Parsons developed the second

2-6
questionnaire and submitted it to AFCEE and Battelle Science & Technology
International (Battelle) for review (Battelle is conducting a related project for ESTCP).
The questionnaire requested additional information regarding the scope of the project
(pilot or full-scale), details on implementation of the thermal technology, greater detail on
what constituted success, and more detail regarding site characteristics and post-
implementation sampling. Parsons e-mailed the questionnaires to the 11 POCs and
scheduled telephone interviews after the POCs had an opportunity to review them. A
copy of the second questionnaire is included in Appendix B. Parsons conducted the
interviews from 29 January 2004 through 27 February 2004. Summaries of each
interview are also included in Appendix B.
Based on the interviews, it became apparent that success of a project did not relate
directly to site closure or attainment of predetermined cleanup objectives. In most cases,
success meant mass removal was achieved or enhanced as compared to earlier remedial
efforts. In some cases, success simply meant that thermal enhancement appeared to be
less expensive than long-term groundwater extraction and treatment, which may be a
reasonable measure of success.
Implementation of thermal enhancement did not lead to complete site closure at any of
these 11 facilities, primarily due to contaminated groundwater. However, thermal
enhancement may have assisted with regulatory acceptance of monitored natural
attenuation (MNA) at two sites (Edwards Air Force Base [AFB], CA, and Whittier
Defense Fuel Supply Point [DFSP], AK). It should be noted that at Edwards AFB, MNA
was approved before the thermal enhancement pilot study was completed. Additionally,
at Whittier DFSP, the regulators agreed that thermal enhancement did very little to
achieve site remediation, but that source removal was unnecessary as the contamination
has not and likely will not migrate off DFSP property. At two other sites, North Island
Naval Air Station, CA and Yorktown Fuels DFSP, VA, thermally enhanced remediation
is still ongoing, and may lead to site closure within the next 15 to 30 years. Additional,
non-thermal remedial actions are underway or are planned to address groundwater at the
remaining 7 sites. Thermally enhanced soil vapor extraction did lead to closure of the

2-7
soils operable units at Air Force Plant 4, TX, Niagara Falls Air Reserve Station (ARS),
NY, and the Poleline Road Site, Fort Richardson, AK.
2.4 IDENTIFICATION OF FOUR THERMAL PROJECTS FOR DETAILED
EVALUATION
Parsons evaluated the telephone interviews and responses to the second questionnaire
to identify four sites for detailed evaluation and generation of life cycle cost analyses.
The information gathered can be summarized in six basic questions:
1) How successful was the project according to the POC?
2) Why was the project considered successful according to the POC?
3) Did the regulators agree that the project was successful?
4) What was the POC�s impression of the cost impact?
5) Based on Parsons� evaluation, were the site characteristics favorable to another
treatment technology?
6) Based on Parsons� evaluation, did thermal enhancement positively impact
overall remedial costs?
The responses to these questions are tabulated in Table 2.2. The potential for each of
the 11 sites to be considered for detailed evaluation, based on the responses to the six
questions, is included in Table 2.2. Four sites were excluded from consideration for
detailed evaluation and seven were retained. The bases for a site being excluded or
retained are included in Table 2.2. Each of the seven retained sites was ranked in terms
of which would provide the most useable information for an overall evaluation of thermal
enhancement technology. The Savannah River Site (SRS) was ranked highest based on
the opinion that thermal technology may have been a reasonable choice based on the
site�s specific site conditions (e.g., dense non-aqueous phase liquid [DNAPL]
contamination to greater than 160 feet below ground surface [bgs] and groundwater at
145 feet bgs), and the technology appeared to have been effective (greater than 68,000
pounds of tetrachloroethene [PCE] and trichloroethene [TCE] were recovered). Similar

TABLE 2.2
SUMMARY OF SECOND QUESTIONNAIRES AND INVTERVIEWS WITH FACILITY POCS
FACILITY NAME Savannah River DOE, GA
Fort Richardson, AK
Niagara Falls ANG, NY
Yorktown Fuels DESC, VA
Portsmouth DOE, OH
Whittier DESC, AK
North Island NAS, CA AF Plant 4, TX Edwards AFB,
CA Lowry Landfill,
CO Rocky Mountain
Arsenal, CO Should we consider this
site for Task 4
Yes
Yes
Yes
Yes
Yes
Yes
Yes
No
No
No
No Rating to Continue to
Task 4 1 2 3 4 5 6 7 Not Applicable Not applicable Not applicable Not applicable
Basis for rating
Project is complete, soil RAOs were
achieved, and may be the only
successful (in terms of cost) application
of technology.
Project is complete, heating helped
achieve soil RAOs, and evaluation may show increased life cycle costs over dig
and haul.
Project is complete, heating helped
achieve soil RAOs, and evaluation will
likely show increased life cycle costs over SVE or
dig/haul.
Probable that technology has had
little impact and will probably
increase cost vs. other tech. such as bioventing, SVE or
dig and haul.
Project was a pilot study only and DOE has tested
several technologies, none
of which have shown much
promise.
Project is complete and evaluation may
indicate heat had no impact to site and did increase
costs.
Project is on-going and probable that
little impact would be made by any
technology due to large extent of contamination.
Lockheed not overly willing to share cost data.
Pilot study only, admitted that cost
impact was unknown, and
source removal was unnecessary due to
lack of sensitive receptors.
Client not overly willing to share
cost data.
Politically driven site, failure was not
cost driven, and system only
operated for 10 days before
complete system meltdown.
Project Status Complete Complete Complete On-going Complete Complete On-going Complete Complete Complete Complete How successful was project according to
POC
Very successful full scale project.
Very successful full scale project.
Very successful full scale project.
Somewhat successful full scale
project.
Somewhat successful pilot
study.
Very successful full scale project.
Very successful full scale project.
Very successful full scale project.
Very successful pilot study.
Somewhat successful full scale
project.
Disastrous pilot study.
Why was project successful according to
POC
Recovered 68,000 lb VOCs and met cleanup criteria
(asymptotic removal rates)
Goals of mass removal and
meeting soil RAOs were achieved.
Total VOC concentrations in
soil and GW decreased
dramatically.
System recovers 5000 gallons bunker oil per month and has
eliminated off-site migration of oil.
Cost over $1M for 50 gallons TCE
recovered. Much steam loss due to
soil heterogeneity.
Increased fuel recovery from 1 gallon/year with SVE to 15,000 gallons in 21
months with heat and SVE.
Recovered 211,000 lb fuel with heat vs. 80,000 lb with SVE
alone.
Cheaper than P&T ($6000/lb vs.
$1100/lb). Met soil RAOs.
Met expectation of project. First
project in bedrock and removed 2250
lb VOCs and diesel.
Soils met cleanup criteria of 50%
overall removal, which should have allowed capping of
the pit.
System melted from corrosion
within 10 days of start up.
Did regulators agree with success
Agreed that source removal was
complete.
Agreed that source area soil met RAOs and GW MNA ok.
Agreed that soil met cleanup criteria
but GW did not.
Agreed, good source removal
technology.
Agreed that steam injection not
appropriate at this site.
Agreed that steam not appropriate for
Whittier.
Yes and want system operation to
continue.
Yes, agreed soil RAOs were met.
Yes, and agreed full scale wasn’t necessary due to lack of receptors
No, EPA changed method for
calculating 50% removal.
No, EPA wanted Army to try again with new system.
What was POC’s impression of cost
impact
Definitely decreased
compared to endless P&T.
Probably reduced cost if MNA or TI
granted.
Probably reduced costs, but no detail,
just gut feel.
Unknown. Total cost likely equal to
dig and haul.
Definitely increased cost.
Very little return on $1M
Increased life cycle cost due to O&M and little impact.
Definitely reduced cost by increasing
mass removal.
Probably reduced cost compared to long-term P&T.
Unknown since did not have to go full
scale.
No impact due to large overall site
containing 70 disposal pits.
Increased life-cycle costs as Army wanted dig and
haul.
In our opinion were site characteristics
favorable to another treatment technology
Only other tech likely is ISCO, but probably would not
have been effective.
Continued SVE or dig and haul. Probably will
monitor site forever anyway.
SVE or dig and haul. SVE or bioventing.
Unknown. Heterogeneous soil would make SVE
difficult.
Bioventing with MNA.
SVE or biovent. Source area is 10
acres and 12’ deep with coarse grained
lithology.
SVE system was already in place prior to heating,
and is still in operation.
MNA, which is what regulators
agreed to.
SVE, bioventing, or dig and haul.
Dig and haul probably best
solution.
In our opinion, did thermal enhancement impact overall cost
Cost of $4M warranted for
37,000 CY treated ($108/CY). Depth
of 160’ is very limiting.
Increased cost. Could dig and haul for less than $800
per CY.
Increased cost. Could have
implemented SVE or dig and haul for
less cost.
Will likely increase cost as system will
have to run for more than 15 years.
Increased cost. Site has done pilots and their costs may be greater than ISCO,
which is now planned.
Increased cost because Army
wanted quick out. Regulators accept that the site will
always be contaminated.
Increased cost. Long-term SVE very likely to be
less costly.
Increased cost. Cost was $3.1M. Long-term SVE
may have been lest costly.
Increased cost and probably would’ve been unnecessary if AF pushed MNA from beginning.
No. Cleanup of one of 70 pits made no difference to site
GW.
Increased cost. Army originally proposed dig and haul. EPA forced
an innovative technology.
2-8

2-9
information was used to rank each of the seven sites, the top four of which were
recommended for completion of detailed evaluations.
Upon completion of site evaluations and preparation of Table 2.2, the table and the
POC interview summaries were submitted to AFCEE for review. AFCEE agreed with
Parsons� evaluation, and directed Parsons to proceed with detailed evaluation of the four
highest ranked sites. POCs at each of the four sites were contacted and each agreed to
assist with the detailed evaluation, and to provide additional site and cost information.
Site visits were then scheduled for each site and were conducted in May and June 2004.
Information related to each of the four sites and results of the detailed evaluations and life
cycle cost analyses are presented in the following sections.

3-1
3.0 DESCRIPTION OF FOUR SITES SELECTED FOR LIFE CYCLE COST ANALYSIS
3.1 INTRODUCTION
Four sites were selected for detailed evaluation and life cycle costs analyses. This
section contains descriptions of each site and of the thermal technology used to enhance
removal of contaminant source mass. Descriptions of the system�s operations, mass
removal, post-treatment soil and groundwater sampling results, and project costs are also
presented in this section.
3.2 NIAGARA FALLS AIR RESERVE STATION, NIAGARA FALLS, NY
Much of the information related to the Niagara Falls ARS site that is presented in this
section was provided in the Final Interim Remedial Action Report, Site 10: Fire Training
Area No. 1, Niagara Falls International Airport Air Reserve Station, Niagara Falls, New
York (Montgomery Watson, 1997).
3.2.1 Site Description
Thermally enhanced soil vapor extraction was implemented at the Niagara Falls ARS,
Niagara Falls, NY, Fire Training Area No. 1 in August 1996. This site is identified as
Installation Restoration Program (IRP) Site 10. The site was the installation�s principle
fire training area during the late 1950s and early 1960s. The burn pit was a shallow
depression approximately 100 feet in diameter and 2 feet deep, and is located
approximately 1,000 feet from the base runway. Cayuga Creek, the main drainage feature
of this portion of the base, is located approximately 400 feet south of the former burn pit.
A site map of the former burn pit is presented as Figure 3.1 (Montgomery Watson, 1997).
The geology of IRP Site 10 is characterized by a relatively thin overburden of
lacustrine sediments and glacial till on top of fractured dolostone bedrock (Montgomery
Watson, 1996). The upper overburden consists of a 4- to 8-foot-thick layer of stratified
lacustrine clay and silty clay, which sits on top of a 0- to 8-foot-thick layer of glacial till.

3-2
The layer of glacial till sits directly on top of the fractured bedrock and is not continuous
over the entire site. Groundwater is encountered at approximately 6 feet bgs, and
typically flows to the south-southwest toward Cayuga Creek. The overburden and
bedrock aquifers appear to be hydraulically connected and have similar hydraulic
conductivities. Conductivities averaged 2.8 x 10⁻⁴ centimeters per second (cm/sec) in the
overburden and 3.7 x 10⁻⁵ cm/sec in bedrock. Cayuga Creek can be either a gaining
stream or a losing stream depending on seasonal variations in the elevation of the
groundwater table. Generally, the creek is a losing stream in the late fall and winter
months and becomes a gaining stream during the spring and summer months.
A variety of combustible materials, including oils, solvents, and jet fuel (JP-4) were
placed in the burn pit, ignited, and extinguished with fire fighting foam (Montgomery
Watson, 1996). Investigations of soil and groundwater quality at IRP Site 10 detected
volatile organic compounds (VOCs), with TCE and total xylenes being the primary site
contaminants. The burn pit source area covers approximately 0.75 acre and ranges in
depth from 6 to 9 feet, the depth at which bedrock is encountered. TCE was found in
vadose zone soil samples collected from within the former burn pit at concentrations as
high as 14,000 micrograms per kilogram (µg/kg), and concentrations were higher in the
deeper samples (4 to 7 feet bgs) than in the shallow samples (0 to 2 feet bgs). Based on
the concentrations and distribution of TCE within the former burn pit, the estimated mass
of TCE present was 9 kg.
TCE has apparently migrated in NAPL form into the shallow bedrock, and was
detected in site groundwater at concentrations as high as 18,000 micrograms per liter
(µg/L). Concentrations of TCE exceeded 1,000 µg/L in three of 14 wells at the site. TCE
degradation products including cis-1,2-dichloroethene (cis-DCE) and vinyl chloride were
also detected in site groundwater. The dissolved phase VOC plume extended
approximately 200 feet south of the south boundary of the former fire-training pit. The
combination of relatively low permeability soil and the variant gaining/losing stream
nature of Cayuga Creek appear to have limited the migration and resultant extent of the
dissolved phase plume.


3-4
3.2.2 Thermal Technology Description
3.2.2.1 General Description of Six Phase Soil Heating Technology
Six Phase Soil Heating (SPSH) in conjunction with Soil Vapor Extraction (SVE) were
the technologies implemented at IRP Site 10 source area. SPSH is a patented technique
that uses low-frequency electricity to heat soils as an enhancement to SVE. Battelle
Pacific Northwest Labs, under contract to the US DOE, developed and holds a patent on
the SPSH technology, and manages the soil heating electrical power equipment and
control systems. SPSH is used primarily to remove VOCs and semi-volatile organic
compounds (SVOCs) from relatively impermeable soils where SVE alone is not normally
effective. SPSH uses conventional single-phase electric transformers to convert
commercial three-phase line power into six single-phase electric outputs. This electrical
power is then delivered throughout the soil being treated through galvanized steel
electrodes that are inserted vertically into the soil. Electrical current is conducted through
the soil, heating it resistively and increasing the contaminant�s vapor pressure, thus
increasing its potential removal rate. Additionally, the steam produced by heating the soil
reportedly steam-strips contaminants in situ. The volatilized contaminants and steam are
then removed by the SVE system and treated above ground. The only additive to SPSH
treatment is water, which must be added to soil surrounding the electrodes during
operation. This prevents the soil from drying and becoming non-conductive (Montgomery
Watson, 1996).
The basic system components used to implement SPSH include combination
subsurface electrodes/vapor extraction vents, an off-gas collection and treatment system
(including a vacuum blower, a condenser, and a treatment unit), the SPSH transformers
used to condition electric power for application to the soil, and a computer control/data
acquisition system. The electrodes/vapor extraction vents are installed in boreholes
drilled using standard drilling techniques. The electrodes are placed in the boreholes and
the annular space filled with graphite or steel shot (round pellets with diameters of
approximately 1 millimeter) to conduct electric power from the electrode into the soil.
Off-gas collection is typically accomplished by use of a high permeability gravel layer

3-5
(plenum), which is placed over the area to be treated. Slotted collection pipes are placed
in the plenum and are connected to a vacuum blower. Off-gas treatment is dependent on
the type of contaminant (halogenated or non-halogenated) and its concentrations.
Activated carbon, thermal oxidizers, catalytic oxidizers, and membrane filters are typical
treatment technologies used. The SPSH transformers are trailer-mounted units that
convert commercial three-phase power to six separate single-phase outputs with voltages
ranging from 0 to 2.4 kilovolts. Each of the single-phase outputs is connected to one of
six subsurface electrodes, which are arranged in a hexagonal array. A seventh subsurface
electrode is installed in the center of the array and acts as the neutral leg of the electric
circuit. Electricity is applied to each of the six outer electrodes and passes through the
soil toward the central neutral leg, heating the soil resistively as it passes. The central
electrode is also constructed as a vapor extraction well to facilitate the removal of vapor
generated deeper within the soil treatment area.
SPSH can be implemented in several hexagonal arrays to treat larger areas of soil
contamination. Each array can be as large as 40 feet in diameter, effectively heating a
56-foot-diameter region of soil. The heated region can extend to a depth of up to 200 feet
bgs.
3.2.2.2 Description of SPSH Technology Used at Niagara Falls
ARS Site 10
The SPSH Interim Remedial Action (IRA) performed in 1996 at IRP Site 10 was
designed to treat only the overburden soil with no direct impact on site groundwater.
Additionally, the IRA was performed to test the effectiveness of SPSH on clay soils. As
such, the arrays used to heat the soil did not extend into the bedrock below the
overburden soils. The anticipated effect was to reduce the contaminant mass in the
vadose zone, thereby reducing the potential future loading of contamination to
groundwater.
Four SPSH arrays were used to conduct the IRA and treat the source area at Niagara
Falls ARS IRP Site 10. Each array was 40 feet in diameter and used to treat regions
approximately 56 feet in diameter. Together, the four arrays were designed to treat an

3-6
area of approximately 110 feet by 110 feet with treatment extending to the top of bedrock,
or 8 to 10 feet bgs. The total treatment volume was approximately 3,600 cubic yards of
overburden soil.
Each array consisted of six positive electrodes arranged in a hexagonal pattern with a
neutral electrode in the center of each array. One additional neutral electrode was
installed in the center of the treatment area between the four arrays. All the electrodes
were constructed of carbon steel pipe with a 5-foot section of stainless steel well screen
installed from 1 to 6 feet bgs to allow extraction of soil vapor as well as induction of
electrical current into the soil. The system was designed so that soil between the arrays
would be heated by a combination of electrical interactions between the arrays and
conductive and convective heat transfer. Figure 3.2 (Montgomery Watson, 1997) depicts
the array layout at IRP Site 10. A series of grounding rods were installed between the
arrays and the transformer system to prevent stray voltages from migrating outside the
treatment area.
Maintenance of electrical conductivity at the electrode/soil interface was accomplished
by adding water to the graphite material surrounding each positive electrode. A water
addition tube was attached to the top of each positive electrode for this purpose.
Subsurface temperatures were measured at 2 and 6 feet bgs by thermocouples placed
within the treatment area. Subsurface vacuum was monitored by pressure monitoring
wells. These pressure monitoring wells were installed to ensure negative air pressure was
maintained at the edges of the treatment area. The locations of the temperature and
pressure monitoring points are shown on Figure 3.2.
Volatilized contaminants and steam were collected via the vapor extraction system.
This system included the four neutral electrode/wells installed in the center of each array,
the neutral electrode/well installed in the center of the treatment area, the six positive
electrode/wells that formed the perimeter of each of the four arrays (24 vents total), and
the gravel layer plenum installed over the treatment area. The plenum was constructed
with horizontal and slotted polyvinyl chloride (PVC) pipes covered with a layer of gravel
that was placed over the treatment area. The gravel layer was covered with a high-density

3-7
polyethylene (HDPE) liner that was keyed into the ground surface just beyond the
perimeter of the soil treatment area. The liner was covered with sand to form an
insulating barrier to prevent excess heat loss from the treatment area. A schematic
representation of the plenum is shown on Figure 3.3 (Montgomery Watson, 1997).
Vapor collected at the electrode/wells was conveyed out of the soil treatment area to a
liquid dropout tank to remove free liquids and sediment. The vapor then passed through a
heat exchanger/condenser to cool the vapor and remove condensed liquids. A positive
displacement blower was used to create the vacuum and extract soil vapor and steam
from the subsurface. The blower was located just downstream from the condenser.
Extracted soil vapor was then passed through vapor-phase activated carbon for removal
of organic contaminants prior to emission of the vapor to the atmosphere. Liquids
collected in the condenser were treated through liquid-phase activated carbon prior to
discharge to the base sanitary sewer system.
3.2.3 Operation of SPSH System at Niagara Falls ARS Site 10
The soil heating operation began at 1200 hours on 26 August 1996, and the SVE
system began operation on 27 August 1996. Soil heating continued until 1200 hours on
25 September 1996. SVE operations continued for an additional 20 days to provide
additional contaminant removal and to expedite cooling of the soil. The SVE system was
shut down on 15 October 1996.
The total energy input to the treatment area was 336,000 kilowatt-hours (kWH). An
estimated 140,000 kWH were spent to heat the soil, and 30,000 kWH were spent
evaporating the 11,200 gallons of water in the subsurface that were extracted by the vapor
extraction system. Another 30,000 kWH were lost due to conduction from the sides and
bottom of the arrays, and 60,000 kWH were lost due to convection off the top surface of
the treatment area. An additional 76,000 kWH were spent to evaporate the 7 inches of
water that fell on the treatment area during heating operations.
By the end of the first week of heating, steam was being generated, and condensate
began to collect in the condenser. After two weeks of heating, the temperatures of soil


3-10
within the arrays at the 2-foot-bgs level had reached an average of 75 degrees Celsius (ºC)
and remained relatively stable for the rest of the heating period. Soil temperatures within
the arrays at the 6-foot bgs level rose steadily but more slowly, reaching approximately 55
ºC by the end of the 30-day heating period. Temperatures at 2 and 6 feet bgs of soil
between the arrays heated more slowly than soil within the arrays, reaching 50 to 60 ºC by
the end of the heating period. Soil temperatures outside the treatment area also increased
by at least 10 ºC, reaching temperatures ranging from approximately 20 to 50 ºC
(Montgomery Watson, 1997). Overall, soil temperatures at 2 and 6 feet bgs within the
arrays increased by at least 50 ºC and 40 ºC, respectively. Temperatures of soil between
the arrays at 2 and 6 feet bgs also increased by 50 ºC and 40 ºC, respectively.
There was a consistent difference between the heating rate and ultimate temperature of
the soil at 2 feet bgs and the soil at 6 feet bgs. Three explanations were cited for this
observation (Montgomery Watson 1997), including:
� Quenching due to higher water content in the 6-foot zone than in the 2-foot zone.
� Higher electrical conductivity in the 2-foot region than in the 6-foot region.
� Greater convective loses to soil and groundwater due to the higher water content
in the 6-foot zone.
The temperature increase in the soil caused increased volatilization of organic
contaminants leading to their extraction by the SVE system and treatment through two
carbon adsorbers in series configuration. Vapor was extracted at a relatively stable rate of
approximately 250 cubic feet per minute (cfm) for the entire period of SVE operation.
The extracted vapor stream was monitored for concentrations of organic contaminants to
determine the mass removal achieved during soil heating (discussed in Section 3.2.4), and
to measure the loading onto and subsequent contaminant breakthrough of the vapor phase
activated carbon adsorbers. Photoionization detector (PID) readings, direct-read
colorimetric tubes, and vapor for laboratory analysis were collected at various times
during the IRA. Concentrations of TCE and vinyl chloride reached their maximum levels
(68 parts per million [ppm] and 64 ppm, respectively) at 23 and 16 days, respectively,
into the heating period. Concentrations of TCE and vinyl chloride decreased to 5 ppm

3-11
and less than 1 ppm, respectively, by 25 September 1996, the day before heating
operations were terminated. Concentrations of both compounds had reached non-
detectable levels by 4 October 1996, which was 11 days before SVE operations were
terminated. The lead carbon adsorber was replaced twice during the treatment period.
Four 200-pound activated carbon adsorbers were used to treat the SVE off-gas.
A total of 11,220 gallons of condensed steam was generated during the IRA. The
condensate was treated through two liquid-phase carbon adsorbers in series configuration,
then stored in a temporary storage tank. The highest dissolved phase concentration of
TCE was 260 µg/L, and the carbon adsorbers were observed to satisfactorily treat the
condensate. The treated water in the storage tank was sampled, then discharged after
sample results indicated the water met discharge requirements for the sanitary sewer
system. Two 200-pound carbon adsorbers were used to treat the condensate stream.
3.2.4 Contaminant Mass Removal Estimates
An estimated 131 pounds of the chlorinated ethenes TCE, cis-DCE, trans-1,2-
dichloroethene, and vinyl chloride were removed during the IRA. An estimated
10.1 pounds of benzene, toluene, ethylbenzene and xylenes (BTEX) were also removed.
These estimates are based on the off-gas sampling conducted during the IRA. The
estimated mass of TCE removed was 95.7 pounds, which exceeded the pre-treatment
estimate of 19.8 pounds. This discrepancy is most likely due to TCE NAPL that was not
found in the pre-characterization study but was discovered at one location (a bedrock
trough where free-phase TCE was detected) during the post-treatment sampling. The
results of the post-treatment sampling indicated that an estimated 44 pounds of TCE
remained at the site. Based on the 95.7 pounds of TCE removed from the site and the
44 pounds of TCE estimated to remain at the site, the initial amount of TCE was
approximately 139.7 pounds. The 95.7 pounds of TCE removed during the IRA
represents removal of 68.5 percent of the initial amount.
The total mass removal of TCE in the 11,200 gallons of condensate recovered during
the IRA was estimated at less than 10 grams. Less than one gram of BTEX compounds
was removed from the condensate.

3-12
3.2.5 Post-Implementation Sampling/Monitoring Results
3.2.5.1 Soil Sample Results
Soil samples were collected at 14 locations within or near the arrays before the IRA
was performed, and the same locations were sampled one month after the IRA was
completed. The results of the pre- and post-treatment soil samples collected from within
the perimeter of the arrays are summarized in Table 3.1 (Montgomery Watson, 1997).
These results showed that the average TCE concentrations declined by 35 percent, or
from an average of 1,329 µg/kg to 862 µg/kg. The variability of TCE concentrations, as
indicated by the standard deviation of the sample population, decreased even more
significantly. Pre-treatment concentrations of TCE exceeded the New York State (NYS)
cleanup criterion of 700 µg/kg at three locations within the perimeter of the array. After
completion of the IRA, TCE levels still exceed NYS cleanup criteria at those three
locations. Additionally, the average of the post-treatment samples was 862 µg/kg, which
also exceeded the NYS cleanup criterion.
The results of the post-treatment soil samples were used to estimate the residual TCE
mass left at the site after the IRA. Based on these samples, an estimated 44 pounds of
TCE remained in site soil, primarily at the soil/bedrock interface. An estimated
80 percent of this residual TCE mass is located at one location, the bedrock trough that
was cited in Section 3.2.4.
3.2.5.2 Groundwater Monitoring Results
The SPSH IRA performed in 1996 at IRP Site 10 was not designed to directly treat
contaminated groundwater, but to reduce the contaminant mass in the vadose zone,
thereby reducing the potential future loading of contamination to groundwater. Although
SPSH can be implemented to address contamination in groundwater, this was not
possible at IRP Site 10 due to the shallow bedrock. Most of the groundwater at the site
occurs either in the bedrock or in the overburden within one foot of bedrock surface. A
groundwater extraction trench was installed in June 1998 to address shallow groundwater
occurring in bedrock at the site. The trench was installed 150 feet south and

3-13

3-14

3-15

3-16
downgradient (with respect to groundwater flow) of the center of the former burn pit.
Analysis of groundwater data from late 1996 through early 1998 indicates no reduction of
contaminant concentrations in groundwater in overburden or upper bedrock wells located
within or immediately downgradient of the former burn pit (Ecology and Environment,
2003).
Several wells located between the former burn pit and the extraction trench have
shown increasing trends in VOC contaminant levels since June 1998. These trends may
be due to the presence of suspected NAPL mass on the bedrock surface that is now
migrating south due to the increased hydraulic gradient caused by groundwater pumping
at the extraction trench. This NAPL mass may have existed before the IRA or could have
collected at low points on the bedrock surface after the IRA. Other wells located near or
downgradient of the former burn pits have shown relatively stable contaminant
concentrations since 1996 and several others have shown decreasing trends in
contaminant concentrations. The overall effect of the IRA on groundwater contaminant
concentrations appears to be negligible at this time.
3.2.6 Thermal Project Cost
The total cost of the SPSH IRA was $688,000. This total included the pre-treatment
soil sampling effort; design, installation, and operation of the SPSH and SVE systems;
disposal of activated carbon adsorbers; post-treatment soil sampling effort; report
preparation; contractor fees; and utility costs. The utility costs included $50,000 for
electrical service. The total project costs also included $38,000 in project delay costs
incurred by the contractor while the ARS negotiated a Hold Harmless Agreement with the
local airport authority.
Excluding the project delay cost, the total cost would be $650,000. Based on an
estimated treatment volume of 3,600 cubic yards, the unit cost for the IRA was $180 per
cubic yard. On a per pound contaminant removed basis, the unit cost for the IRA was
$6,800 per pound of TCE.

3-17
3.3 SAVANNAH RIVER SITE 321-M SOLVENT STORAGE TANK AREA,
AIKEN, SC
Much of the information related to the SRS presented in this section was provided in
the Cost and Performance Report, Dynamic Underground Stripping-Hydrous Pyrolysis
Oxidation at the Savannah River Site 321-M Solvent Storage Tank Area, Aiken, South
Carolina (Westinghouse Savannah River Company, et al. 2003).
3.3.1 Site Description
Dynamic Underground Stripping - Hydrous Pyrolysis Oxidation (DUS/HPO) is the
form of thermal remediation that was implemented at the SRS 321-M Solvent Storage
Tank Area (SSTA) in September 2000. A 17,000-gallon storage tank was located west of
Building 321-M in the A/M area of SRS (Figure 3.4 [figure provided by Mr. James
Kupar, Becthel Savannah River, Inc.]) and used to store chlorinated solvents including
PCE, TCE, and 1,1,1-trichloroethane (1,1,1-TCA). Numerous undocumented spills and
leaks are suspected to have occurred at the 321-M tank site. One significant spill is
reported to have released an estimated 1,200 gallons of PCE to the ground surface
(Integrated Water Resources, et al., 2004). The tank, associated piping, and part of the
rail siding that serviced the tank were removed in 1997 to facilitate investigation and
remediation of the site.
Lithology at the site consists of coarse sand and sand to 160 feet bgs. Several horizons
of silty to clayey sand are present above 160 feet. A �Green Clay� horizon is located at
approximately 160 to 165 feet bgs, and is considered to be an aquitard that underlies the
entire 321-M site. Groundwater is encountered at approximately 145 feet bgs.
Previous characterization data revealed high levels of chlorinated solvents (0.2 to
0.3 percent by weight) in soil near the tank, indicating the presence of DNAPL
contamination. Surface geophysics was used to delineate the area of DNAPL
contamination, and subsequent sampling showed the NAPL composition to be 90 percent
PCE and 10 percent TCE. Characterization data suggested that the NAPL contamination
was in the form of disconnected ganglia in the saturated zone rather than as a large free-

3-18
phase layer. The extent of NAPL contamination was generally contained within an area
measuring 100 feet by 100 feet extending down to the �Green Clay� layer (160 feet bgs).
The mass of NAPL contamination within the 100-foot by 100-foot by 160-foot soil
volume was originally estimated at 26,000 pounds. The volume of soil in the treatment
area was 59,300 cubic yards.
3.3.2 Thermal Technology Description
3.3.2.1 General Description of DUS/HPO Technology
The DUS/HPO technology combines several processes to remediate soil and
groundwater contaminated with fuel and other organic compounds. It is very similar to
enhanced SVE, except that it also treats groundwater contamination. DUS/HPO injection
and extraction wells are installed so that their screened sections are in both saturated and
unsaturated zones. Steam is injected at the periphery of a contaminated area to heat
permeable subsurface areas, vaporize volatile compounds bound to the soil, and drive
contaminants to centrally located vacuum extraction wells. Electrical heating is used on
less permeable clays to vaporize contaminants and drive them into the steam zone
(electrical heating was not necessary at the SRS 321-M site). DUS/HPO also uses an
underground imaging system called Electrical Resistance Tomography (ERT) that
delineates heated areas to ensure total cleanup and process control. HPO is a process
whereby air is added to the subsurface in parallel with steam. When steam/air injection is
halted, the steam condenses, and contaminated groundwater in the heated zone mixes
with this oxygen-rich condensed steam. This enhances natural biodegradation of many
compounds by providing nutrients to microorganisms that thrive at high temperatures
(called thermophiles). When heated to temperatures near the boiling point of water
(thermal treatment technology), DNAPL and dissolved organic contaminants are
reportedly rapidly oxidized to form carbon dioxide and non-toxic ions. This remediation
method takes advantage of more rapid chemical reactions, which occur at steam
temperatures, as well as the large increase in mass transfer rates, which make the
contaminants more available for destruction.


3-20
3.3.2.2 Description of DUS/HPO Technology Used at SRS
Figure 3.4 shows a plan view of the DUS/HPO system used at the SSTA site. Three
steam injection well clusters were installed around the perimeter of the 100-foot by
100-foot treatment area (at the northwest corner, the northeast corner, and the southern
perimeter). Each well cluster consisted of three injection wells with screen intervals at 50
to 70 feet bgs, 110 to 130 feet bgs, and 150 to 160 feet bgs. One dual-phase groundwater
and vapor extraction well (DUS-10) was installed in the center of the treatment area with
a screen interval from 20 to 160 feet bgs. This well was used to extract both groundwater
and vapor from the subsurface. Groundwater was extracted from the well using a high-
temperature, electric-submersible pump placed approximately 15 feet below the static
groundwater elevation. The extracted groundwater was collected in a tank for subsequent
treatment through a facility air stripper followed by discharge to a facility National
Pollution Discharge Elimination System (NPDES) outfall.
Vapor extraction was performed using the central DUS-10 well and three existing
vadose zone vapor extraction wells (MVE-1, -2, and -3), which were located along the
perimeter of the treatment area. SRS�s 6M Soil Vapor Extraction Unit (6M-SVEU) was
used to extract vapors from the four vapor extraction wells. The vapor flow input to the
unit averaged 350 standard cubic feet per minute (scfm). The hot extracted vapors were
cooled through a heat exchanger, and condensed liquids were separated from vapors in a
knockout tank. The condensate was routed through a DNAPL-water separator (DWS),
which separated droplets of DNAPL for collection and removal. Water from the DWS
was treated through a facility air stripper prior to discharge to a NPDES outfall.
Figure 3.5 (Westinghouse Savannah River Company, et al. 2003) shows the process flow
diagram of the DUS/HPO system, with vapor and wastewater treatment. The 6M-SVEU
was operated to keep levels of contaminants in the vapor discharge below air emission
limits.
Steam for injection into the three well clusters was supplied from other industrial
operations at SRS. Facility steam pressure was reduced to 100 pounds per square inch
(psi) prior to entering the DUS/HPO system.

3-21
Subsurface temperatures were monitored using a series of 14 thermocouple strings,
each fitted with up to 24 individual Type-K thermocouples. The thermocouples allowed
measurement of subsurface temperatures at approximate 6-foot intervals from 20 feet bgs
to 160 feet bgs. In addition to the thermocouples, ERT was used to monitor subsurface
temperatures between the thermocouple locations. ERT uses low-frequency electric
current injected at one pair of metal electrodes and measuring the voltage at the second
metal electrode. The differences in voltage relate to the temperature differentials of the
soil.
3.3.3 Operation of DUS/HPO System at SRS
Operation of the DUS/HPO system began on 9 September 2000 and continued until
28 September 2001. Over the 1-year operational period, steam injection occurred
36 percent of the time, or for 3,226 hours. The total amount of steam injected was
45,400,000 pounds. The heat content of this steam was 45.4 x 10⁶ British Thermal Units
(BTUs). Sustained steam injection periods occurred during November through December
2000, January through March 2001, and April through May 2001. Steam injection
continued on a 24-hour basis during these periods.
Initial steam injection to the deep zone was conducted at a pressure of 60 pounds per
square inch gauge (psig) and at a temperature of 152 ºC. Injections in the intermediate
and upper zones were conducted at 40 and 25 psig, respectively, with temperatures of 143
ºC and 127 ºC, respectively. In addition, initial heating was performed in the saturated
zone to create a �hot plate� at the base of the treatment area. This approach helped drive
the contaminants in the saturated zone toward the central groundwater and vapor
extraction well (DUS-10) and limit the contaminant�s potential for dispersal in the
subsurface.
The steam injection rate reached a maximum of 20,000 pounds per hour in February
2001 and was held through March 2001. Steam injection was not continuous throughout
the project period. Initial steam injection occurred from September through mid-October,
then steadily in November and December. Steam injection was renewed in February to
mid-March 2001, at which time it was temporarily halted. Steam injection occurred again

Savannah River Site 321-M Solvent Storage Tank Area
U.S. Environmental Protection Agency June 2003Office of Solid Waste and Emergency ResponseTechnology Innovation Office
5
Figure 3.5 SRS DUS/HPO Process Flow Diagram
Thermal monitoring of the subsurface conditions included temperature profiles from 14 downholethermocouple arrays and electrical resistance tomography (ERT) images which displayed changes insubsurface resistance caused by differences in temperature. For ERT monitoring, 6 electrode strandswere placed through narrow boreholes: 4 on the perimeter of the treatment zone, one in the middle, andone in an abandoned groundwater monitoring well. Each borehole with an electrode also housed athermocouple string. Eight additional thermocouple strings were installed: four outside and four inside thetarget area. In addition, one thermocouple was installed at the base of each steam injection well and atthe base of the main vapor extraction well. Thermocouples ranged in depth from 3 ft bgs to 163 ft bgs,and were vertically spaced 6 ft apart on each thermocouple strand.
For the pilot demonstration, data collected included: steam flow; steam injection at each well-head; vaporextraction information from the SVE unit, including concentration data; extracted vapor temperature andpressure collected at the wellhead; cooling system data; and wastewater stream data (total flow andtemperature). In addition, regular vapor (Tedlar bag) and water samples were collected to track systemperformance. Groundwater was heated to a temperature of approximately 100 oC, while the source zonereached a temperature of approximately 87oC. Table 2 provides a summary of operational data for theDUS/HPO pilot demonstration.

3-23
in April and May 2001, then for only several days at a time in June, August, and
September 2001. Continuous steam injection was not necessary because after the target
source zone temperature of 87 ºC was reached, the soil in the treatment area was able to
hold this temperature for several weeks without the need for additional steam.
By December 2000, the average temperature of soil in the treatment area was 87 ºC
and the groundwater temperature reached 100 ºC. Steam breakthrough to DUS-10
occurred in late-November, after approximately eight weeks of steam injection.
Complete site heat up, based on the boiling point of TCE, was reached in March 2001, 20
weeks after steam injection began. The majority of the steam injection after March 2001
was into the shallow zone, as this area cooled more quickly than the deeper zones.
Air injection into the saturated zone for the purpose of enhancing the HPO process
began in December 2000. Air injection took place for 10-hour periods during manned
operational periods, and occurred at injection rates of approximately 5 scfm. Subsequent
air injection into the saturated zone occurred whenever steam was injected into the
deepest well screen intervals. During the later stages of the project, air injection into the
deep wells occurred intermittently during periods when steam was injected into the
shallow interval.
The SSTA extraction system included groundwater extraction at DUS-10 and vapor
extraction at DUS-10, MVE-1, MVE-2, and MVE-3. After steam breakthrough occurred
at DUS-10 in November 2000, the groundwater extraction rates averaged approximately
10 gallons per minute (gpm) until December 2000, at which time extraction was
discontinued due to the extraction of larger volumes of condensed steam than
groundwater.
The average vapor extraction rate from the four vapor wells was 350 sfcm at a vacuum
of 5.1 inches of mercury. The condensate load in the vapor averaged 20 gpm after steam
breakthrough occurred at DUS-10. Over 2,000,000 gallons of condensate were recovered
by the system and treated through the facility air stripper. The non-condensable vapor

3-24
extraction rate averaged 300 scfm. Treatment of this vapor stream was not required, as
the system was operated at a flow rate that ensured emission limits were not exceeded.
The vapor stream was continuously monitored for contaminants using an in-line multi-
gas monitor. In addition, samples of the condensate and vapor were collected on a daily
basis for laboratory analysis. Concentrations of PCE in the vapor stream increased
steadily over the first five months of operation, reaching levels above 1,000 ppm. In
March 2001, the emission limits for the project were increased. Less dilution air was
introduced into the vapor stream, and PCE concentrations increased to over 5,000 ppm
before falling to between 1,000 and 2,000 ppm for the remainder of the project.
3.3.4 Contaminant Mass Removal
Based on the continuous monitoring and daily sampling of the vapor stream, 66,000
pounds of PCE and 2,200 pounds of TCE were removed during the project. Daily
removal rates of total contaminants began at 16 pounds per day and reached 1,229 pounds
per day in April 2001. The average contaminant mass removal rate for the entire
operational period was 190 pounds per day.
The extent to which the HPO process destroyed additional contaminant mass in the
subsurface has not been quantified. Estimates based on other DUS/HPO projects and
experimental work suggests that the mass of dissolved phase solvent contamination
destroyed by HPO could range from 10 to 30 percent of the contaminant mass removed.
The total mass removed, excluding any mass destroyed by HPO, was 68,200 pounds,
which exceeded the pre-treatment estimate of 26,000 pounds. Estimation of contaminant
mass is difficult, particularly for sites with a deep vadose zone and DNAPL
contamination.
The total mass removal of PCE and TCE in the 2,000,000 gallons of groundwater and
condensate recovered during the project was estimated at 75 and 10 pounds, respectively.

3-25
3.3.5 Post-Implementation Sampling/Monitoring Results
3.3.5.1 Soil Sample Results
Four soil borings were completed in the treatment area following completion of the
DUS/HPO project. Post-treatment characterization of soil in the treatment zone
(i.e., below approximately 20 feet bgs) indicates that TCE soil concentrations are below
0.01 milligrams per kilogram (mg/kg), with the exception of a single analytical result of
0.1 mg/kg at a depth of 25 feet bgs. PCE soil concentration data from post-treatment
characterization indicate concentrations are below 0.1 mg/kg with the exception of two
analytical results of 0.5 mg/kg and 10 mg/kg, both at 25 feet bgs. However, as these
samples were collected from above the zone of soil remediation that was targeted by the
DUS/HPO project (the project targeted soils below 40 feet bgs), these results are not
surprising. The post-treatment characterization data also confirmed that high
concentrations in shallow (less than 20 feet bgs) clay horizons is likely responsible for the
continuing tail of PCE and TCE concentrations measured near the end of the treatment
period. The shallow soil was not targeted because of the possibility of soil expansion due
to steam injection as well as short-circuiting of injected steam that could cause a health
and safety concern.
The unresolved issue that remains is how much residual contamination remains in the
treatment zone from the ground surface to approximately 20 feet bgs. This zone is above
the depths of both the steam injection and SVE well screens. Although it has not been
totally resolved, SRS installed a shallow SVE system in 2003. This system is intended to
remove contaminant mass that remains in soil from the ground surface to 40 feet bgs.
The system removed approximately 1,100 pounds of PCE and TCE in the first four
months of operation.
3.3.5.2 Groundwater Monitoring Results
Post-treatment groundwater sampling has not been completed as of June 2004. This is
because all monitoring wells within the treatment area were grouted to the ground surface
prior to installation of the DUS/HPO system. Their removal was necessary to prevent

3-26
short-circuiting of steam that would likely occur if the wells had remained in place. New
groundwater monitoring wells have not yet been installed because soil temperatures in the
treatment zone remained above 50 ºC until early in 2004. New wells are planned for
installation in the summer of 2004.
Although no monitoring wells are currently located within the treatment area, three
facility-wide compliance monitoring wells and one area-wide groundwater recovery well
are in somewhat close proximity to the treatment area. Data from the compliance wells
showed declining or stable levels of dissolved PCE before the DUS/HPO project. These
data also show no significant effect on the trends for dissolved PCE concentrations after
more that one year post-treatment at the 321-M area. However, data from the area-wide
recovery well, RWM-2, which is located approximately 80 feet from the treatment area,
may indicate a decrease in PCE and TCE concentrations as a result of the DUS/HPO
project. For at least four years previous to the DUS/HPO project, these wells showed
relatively consistent levels of both TCE (approximately 12,000 µg/L) and PCE
(approximately 12,000 µg/L). Groundwater samples from both wells showed a marked
decrease in TCE and PCE concentrations during a sampling event two years after
completion of the DUS/HPO project (no sampling was conducted between the end of the
DUS/HPO project and October 2003 due to water temperatures in excess of 50 ºC). The
concentrations of TCE and PCE during the October 2003 sampling event were
approximately 1,500 and 2,500 µg/L, respectively. Although groundwater samples from
both wells showed rebound in concentrations to approximately 6,000 µg/L TCE and
8,000 µg/L PCE in the December 2003 sampling event, these values were still below the
12,000 µg/L average concentrations measured before the DUS/HPO project.
3.3.6 Thermal Project Cost
The total cost for this project, including the pre-characterization study and pre-project
demolition work was approximately $4,500,000 (Mr. James Kupar, Bechtel Savannah
River, Inc., personal communication, May 2004). A rough estimate of pre-project work
costs is $250,000, which leaves $4,250,000 for the DUS/HPO project. The costs for
steam generation and treatment of vapor, groundwater, and condensate were not included

3-27
in this cost as these services were provided by existing facilities at SRS, which resulted in
significant savings for the DUS/HPO project as these services did not have to be
constructed and operated for this project. Based on a treatment area of 10,000 square
feet and a depth of 160 feet, the total volume of soil treated was 59,300 cubic yards. The
unit costs based on these values, and excluding the cost for steam generation and
water/vapor treatment, is $72 per cubic yard. On a per pound of PCE and TCE removed
basis, the unit cost for the project was $64 per pound of these two contaminants. If the
costs for steam generation and the cost for treatment of vapor, groundwater, and
condensate are included, the unit costs would be an estimated $118 per cubic yard of soil
treated, or $105 per pound of PCE and TCE removed (see Section 4.3.1 for details on this
cost analysis). However, these unit costs are within the range of previously completed
soil remediation projects.
The Interstate Technology Regulatory Council (ITRC) reported the cost of this project
at $29 per cubic yard, but did not indicate what was included in the cost or how it was
calculated (ITRC DNAPL Team, 2002). The ITRC did state that the cost for steam
generation and treatment of vapor and dissolved phase contaminants were not included in
their estimated unit cost.
3.4 YORKTOWN DEFENSE FUEL SUPPLY POINT, YORKTOWN, VA
Much of the information related to the Yorktown DFSP site presented in this section
was provided in the Final Work Plan for Remediation of POL at NSFO Tank Farm, Fleet
and Industrial Supply Center, Defense Fuel Supply Point Yorktown, Virginia (OHM
Remediation Services Corp., August 13, 1999).
3.4.1 Site Description
The Yorktown DFSP, an operations unit of the Norfolk Fleet and Industrial Supply
Center, is located in central York County in Yorktown, Virginia (Figure 3.6 [OHM
Remediation Services Corp., 1999]). The US Coast Guard Reserve Training Center is
located immediately northeast of the site, and the Colonial National Historic Park is to the
west and north. The Yorktown DFSP facility is a US Navy fuel depot, which presently

3-28
stores and distributes JP-8 aviation fuel to a number of DOD customers. The Yorktown
DFSP facility is an 11-acre site that was activated in 1918 with the construction of eight
90,000-barrel (3,420,000 gallon) capacity, reinforced concrete underground storage tanks
(USTs). These USTs were approximately 162 feet square and 17 feet deep, and were
used for storage of Navy Special Fuel Oil (NSFO) until 1975. NSFO is a ship fuel, the
equivalent of No. 5 heavy fuel oil that is produced by blending No. 6 fuel oil and light
petroleum distillates (Perry, 1984). NSFO has a specific gravity similar to water, is a
light non-aqueous phase liquid (LNAPL), is very viscous, and requires heating to be
pumpable.
In 1998 the eight concrete tanks were cleaned, then demolished, and abandoned in
place. The ground cover over the tanks was removed, and the top of each tank crushed
and backfilled into the empty tank. The bottom of each tank was perforated using a
hydraulic ram, then the upper portions of the tank walls were demolished and backfilled
into the tanks. Additional crushed concrete and on-site soils were backfilled into the
tanks to allow final grading. The entire NFSO tank farm area was graded to match the
original 1918 topography. Figure 3.7 (Field Support Services, Inc. [a division of Shaw
Environmental and Infrastructure] 2004) depicts the location of the abandoned USTs.
The shallow subsurface of the site is characterized as coastal sediments consisting of
unconsolidated deposits of fine-grained sand, silts, and marine shells. The near-surface
geology is characterized by medium- to fine-grained sand with varying amounts of silt
and trace amounts of coarse sand and clay. The abandoned USTs and floating NSFO are
located within these sediments. Groundwater is encountered at depths ranging from 6 to
26 feet bgs, and flows to the southeast toward a creek located east of the site. The
reported hydraulic conductivity of the shallow aquifer is 2.41 feet per day (ft/day),
indicating the shallow aquifer has low water transmitting capability.
A floating NAPL plume, up to 12 feet thick in site monitoring wells, has been
identified over most of the former tank farm area and extends eastward beyond the tank
farm area (Figure 3.7). The estimated volume of NSFO released into the tank farm area is


3-31
3,000,000 gallons. Although NSFO is highly viscous at the average soil temperature at
the site, the Yorktown DFSP USTs contained steam heating coils to make the NSFO
pumpable. Heat from the USTs was sufficient to warm the soil and groundwater around
the tank farm area and enable the NSFO to migrate away from the USTs.
Soil samples have indicated minor concentrations of TCE (<14 µg/kg), benzene
(<3 µg/kg), PCE (<80 µg/kg), and total xylenes (<4 µg/kg). Total petroleum
hydrocarbons (TPH) have been found at concentrations as high at 36,800 mg/kg.
Groundwater samples collected outside the area of the floating NAPL plume have shown
non-detectable concentrations of organic compounds, indicating that no dissolved phase
plume exists beyond the NAPL plume.
3.4.2 Thermal Technology Description
3.4.2.1 General Description of Steam Recirculation Heating
Technology
Steam recirculation technology uses buried pipes to convey steam into the subsurface
to heat the soil and mobilize contaminants. This technique can heat volatile and semi-
volatile compounds thereby increasing their vapor pressures and making removal by
vapor extraction more efficient. The technique can also be used to heat viscous or high-
boiling point NAPL to increase its mobility and facilitate its removal via liquid extraction
(NAPL-only extraction or combined with groundwater extraction to increase hydraulic
gradients toward extraction wells). Depending on the steam pressure used, temperatures
well above 100 ºC can be achieved in soil near the recirculation pipes. Recovered vapor
and/or groundwater are treated above ground to remove contamination before discharge
to the environment. Conveyance of steam in buried pipes can result in greater control of
heat input into potentially sensitive areas such as near streams or occupied buildings. It
also may enable greater control of contaminant migration as compared to direct steam
injection, which can result in surface emission of vapors or uncontrolled migration of
contaminant laden steam away from vapor extraction wells.

3-32
3.4.2.2 Description of Steam Recirculation Technology Used at
Yorktown Fuels Site
Steam recirculation heating combined with NAPL and groundwater extraction has
been implemented over a portion of the Yorktown NSFO site (Figure 3.7). Full-scale
implementation of the technology will be conducted in a phased approach so that
hydraulic control of groundwater migration can be fully realized before heat is applied to
the entire site. Additionally, the potential of uncontrolled migration of heated NSFO was
to be determined before full-scale application. Based on the positive results of the initial
phase in 2000 through mid-2003, implementation of the technology for the remainder of
the site was approved in 2003. Construction of the full-scale system began in early 2004,
and start-up of the expanded system is planned for late 2004.
Seventeen trenches were constructed for the extraction of mobile NSFO and
groundwater (Figure 3.7). The trenches were constructed using single pass trenching
techniques, and extended to depths of at least 8 feet below the lowest measured seasonal
groundwater table. The trenches were backfilled with high-permeability gravel and were
sloped toward vertical multi-phase recovery wells. Both groundwater extraction and
NSFO skimmer pumps were installed in the recovery wells. Recovered NSFO and
groundwater were conveyed to a central treatment plant, where the NSFO was stored for
disposal, and the water was treated for discharge to the York River or for heating and re-
injection into upgradient trenches to increase hydraulic gradients and NSFO capture at
downgradient trenches.
The trench locations constructed in the initial phase of the remediation were designed
to impact the northeast corner of the tank farm and the off-tank farm areas to the east and
northeast of site. Much of the tank farm area could not be directly impacted by the
trenches due to the presence of the demolished USTs. However, because the floating
NAPL plume was well above the bottom of the USTs, the mass of NAPL under the USTs
was considered negligible compared to the floating NAPL plume.
Twelve steam recirculation pipes with a combined length of 3,370 feet were installed
using directional drilling techniques. Directional drilling was used to minimize

3-33
disturbance of the soil, which would affect the uniformity of heat transfer into the soil.
The steam pipes were installed so that their depths would be approximately 1 foot below
the stable groundwater table that would develop during active groundwater extraction.
Several thermocouple wells were installed near and between the pipe runs to monitor the
groundwater temperatures at the site.
Steam was produced by a packaged boiler system that delivered saturated steam at
116 ºC and an operating pressure of 10 psig. The boiler was sized with an 8 to 1
turndown ratio to allow operation of the boiler at approximately 25 percent capacity,
which provided sufficient steam for the initial phase of remediation. The boiler would
operate near 100 percent capacity to provide steam for the expanded heating system that
will be necessary to treat the entire NSFO plume area. The boiler system is located
within the central NSFO and groundwater treatment plant.
The central NSFO and groundwater treatment plant includes a heated tank to hold
recovered NSFO and a water treatment system to remove contaminants from recovered
groundwater prior to discharge to the York River or re-injection at upgradient recovery
trenches. The groundwater treatment system includes dissolved air flotation (DAF) for
removal of metals and NSFO, clay adsorbers to remove dissolved hydrocarbons, and bag
filters and oil-absorbent bag filters to remove additional sediment and NSFO. For water
that is discharged to the York River, additional treatment includes granular activated
carbon adsorbers to polish the water and heat exchangers to cool the water prior to
discharge. Recovered water that is re-injected into the site subsurface is treated only
through the DAF unit, the clay adosrbers, and bag filters, then is heated to approximately
60 ºC prior to re-injection.
3.4.3 Operation of Steam Circulation System at Yorktown Site
NSFO skimming began in April 2000, primarily at the property boundaries adjoining
the Coast Guard Reserve Training Center and the Colonial National Historic Park.
Skimming-only was implemented early to achieve control of NSFO migration onto those
properties prior to initiation of groundwater extraction or steam heating. Groundwater
recovery at the 17 extraction trenches began in July 2000. This was implemented so that

3-34
hydraulic control of groundwater flow could be achieved before steam injection was
initiated. Steam heating operations began in May 2001.
Groundwater and NSFO temperatures in the vicinity of the steam heating pipes are
elevated relative to the remainder of the site (Field Support Services, Inc. 2004). The
groundwater/NSFO temperatures in the vicinity of Trenches T-2 and T-4, located on US
Coast Guard property, consistently exceed 100 degrees Fahrenheit (ºF). In most of the
remaining Phase I area, the groundwater/NSFO temperature is elevated relative to
background. Background temperatures range from the low 60s to low 70s. In March
2004, groundwater/NSFO temperatures in the treatment area ranged from 38.8 ºF to 144.9
ºF. The average temperature for the site in March 2004 was 71.3 ºF.
Groundwater extraction rates range from 480,000 to 580,000 gallons per month, and
the average rate has varied little since groundwater extraction began in July 2000. Until
24 November 2002, all recovered groundwater was treated through the central treatment
plant and discharged into the York River. Compliance monitoring has shown that all
water discharged into the river has met discharge criteria.
On 24 November 2003 an infiltration pilot test was initiated at Trench T-9, located
roughly in the center of the Phase I treatment area (Field Support Services, Inc. 2004).
Groundwater that had been treated in the central treatment plant was heated to 140 ºF,
then injected back into Trench T-9. A 5 gpm infiltration rate was ultimately achieved.
Following the successful pilot test, infiltration of heated water became a regular operation
that commenced on 7 January 2004. Infiltration rates have ranged from 157,000 to over
220,000 gallons per month since injection of heated water began in January 2004. Data
from December 2003 indicated that the groundwater/NSFO temperature had increased by
30 ºF in the vicinity of Trench T-9.
3.4.4 Contaminant Mass Removal
Since system start-up in April 2000, approximately 195,400 gallons of NSFO have
been recovered from the site. This includes just over 14,000 gallons that were recovered
between July 1997 and April 2000 by hand bailing and vacuum truck pumping. From

3-35
17 April 2000 to 29 July 2000, approximately 4,000 gallons of NSFO were recovered by
skimming alone. Between July 2000 and 21 May 2001, over 55,000 gallons of NSFO
were recovered by active groundwater extraction combined with NSFO skimming. The
average recovery rate of NSFO during the July 2000 to May 2001 time period was
approximately 4,600 gallons per month. The recovery rate of NSFO appeared to drop off
in March 2001 to an average rate of approximately 1,600 gallons per month. Activation
of steam heating in May 2001 increased the recovery rate in June 2001 to almost
4,000 gallons. In the 34 months since heating began, 122,300 gallons of NSFO have been
recovered. The average recovery rate since May 2001 was 3,600 gallons per month (Field
Support Services, Inc. 2004).
3.4.5 Post-Implementation Sampling/Monitoring Results
3.4.5.1 Soil Sample Results
Because the Yorktown DFSP NSFO remediation project is ongoing, no soil samples
have been collected since operation of the NSFO heating and extraction system began.
3.4.5.2 Groundwater Monitoring Results
This project is ongoing, and NSFO NAPL still exists within the treatment area. Due to
the presence of NAPL, no groundwater samples have been collected within the treatment
area, and no conclusions could be made regarding dissolved phase contamination in
groundwater within the active treatment area. However, groundwater samples are
collected from immediately outside the NAPL plume on a quarterly basis to the east of
the plume, the direction that was downgradient with respect to groundwater flow before
groundwater extraction began. These samples have consistently shown non-detectable
levels of dissolved petroleum hydrocarbons, indicating that the dissolved plume is
contiguous with the NAPL plume (Field Support Services, Inc. 2004).
3.4.6 Thermal Project Cost
The total capital costs for Phase I of the Yorktown DFSP remediation were
$7,000,000, which included construction of the extraction trenches ($1,500,000),

3-36
installation of horizontal steam pipes ($2,000,000), installation of recovery and
monitoring wells ($700,000), and construction of the central treatment plant and boiler
($2,800,000). Operations and maintenance (O&M) costs since April 2000 have averaged
$1,200,000 per year (Mr. William Hughes, Shaw Environmental & Infrastucture, Inc.,
personal communication, May 2004).
The total amount expended to date for the Phase I remediation is $12,000,000. It is
estimated that it will require another 12 years to reach the remedial action objectives
established for the site. The additional O&M cost for these 13 years is estimated at
$14,400,000 (this assumes 12 more years at $1.2 MM per year). Based on the total
expended to date and the estimated cost to complete, the total cost expended to complete
remediation of the Phase I area could be as high as $26,400,000.
Construction of Phase II is estimated at $4,000,000, and the O&M costs for the
combined Phase I and Phase II areas is estimated at $1,600,000 per year. The estimated
total construction costs for both phases is $11,000,000, and the total O&M cost, assuming
12 more years operation of Phase 1 and 15 years operation of Phase II, are estimated at
$22,800,000 (this assumes $1,600,000 per year for 12 years and $1,200,000 per year for
three years). If remedial goals are achieved in the expected 15-year time frame, the total
remedial costs are estimated at $33,800,000. Assuming a treatment area of 11 acres and
an average depth to groundwater of 16 feet, the unit costs for remediation would be $120
per cubic yard of soil.
3.5 POLELINE ROAD DISPOSAL AREA, FORT RICHARDSON, AK
Much of the information related to the Fort Richardson, AK Poleline Road Disposal
Area presented in this section was provided in the Final Interim Remedial Action Report
Operable Unit B � Poleline Road (US Army Corps of Engineers, June 2003).
3.5.1 Site Description
The Poleline Road Disposal Area (PRDA) is located in a wooded area on Fort
Richardson, Alaska. The site was used as a chemical disposal area from 1950 to 1972.

3-37
During this time, chemical agent identification sets and other military debris were burned
and disposed of in four unlined trenches. Standard practice for disposal of the sets
consisted of placing a layer of �bleach/lime� in the bottom of a trench, then placing
materials that were contaminated with chemical agents on a pallet in the trench
(Woodward-Clyde, January 1997). Diesel fuel was then poured on the materials and
ignited with a thermal grenade. After burning was complete, a mixture of either bleach or
lime, combined with chlorinated solvents, TCE, PCE, and 1,1,2,2-tetrachloroethane
(1,1,2,2-PCA) was poured over the burn pile.
Four such trenches were used at PRDA (Figure 3.8 [US Army Corps of Engineers,
June 2003]). A removal action was conducted in 1993 and 1994, during which waste
material from two of the pits (A-3 and A-4) was excavated, treated off the PRDA site (but
on Fort Richardson property), and stockpiled near the soil treatment area. Soil and waste
were excavated to a maximum depth of 14 feet, where groundwater was encountered.
The removal actions did not address the other two trenches (A-1 and A-2) due to the
suspected presence of unexploded ordnance. Additionally, geophysical surveys of
trenches A-1 and A-2 indicated these pits contain less significant quantities of buried
waste, and therefore less contaminated soil than found in trenches A-3 and A-4.
Soil at the PRDA site consists of very dense glacial sediments and glacial till. These
deposits are up to 36 feet thick and consist of unstratified to poorly stratified clays, silts,
sands, gravels, and boulders. A basal till lies below the surficial deposits.
Four water-bearing intervals have been identified at the site: a perched zone, a
shallow groundwater zone, an intermediate zone, and a deep aquifer. The perched zone is
encountered at 4 to 10 feet bgs and is approximately 5 feet thick. The shallow zone is
encountered at 20 to 25 feet bgs and is an average of 10 feet thick. Groundwater in the
shallow zone flows to the northeast, away from a wetlands area that is located south of
the PRDA. The intermediate groundwater zone is encountered at approximately 65 to
95 feet bgs, and the deep aquifer is encountered at 80 to 125 feet bgs. Hydraulic
conductivities in all four zones are fairly low, with average values of 0.5 feet per day in
all but the intermediate zone. The hydraulic conductivity in the intermediate zone

3-38
averaged 0.05 feet per day. These low hydraulic conductivities suggest that groundwater
flow at the site would be slow and would not significantly disperse dissolved
contaminants by advective transport downgradient of the source area.
Soil sampling conducted after the wastes were excavated from trenches A-3 and A-4
indicated soil below the extent of excavation were contaminated with high concentrations
of 1,1,2,2-PCA (greater than 2,000 mg/kg). TCE was also found at concentrations as
high as 0.384 mg/kg. Lesser concentrations of chlorinated hydrocarbon contaminants
were detected in soil near trenches A-1 and A-2; however, ordnance breakdown products
were not detected. Based on the lower levels of chlorinated hydrocarbons and lack of
ordnance breakdown products near trenches A-1 and A-2, it appears that waste
contaminated with chemical agents were not disposed in those trenches.
Chlorinated solvent contamination was detected in all four water-bearing zones. TCE
concentrations exceeded the state and federal maximum contaminant level (MCL) of
5 µg/L in all four water-bearing zones. 1,1,2,2-PCA was detected in the perched interval
at concentrations as high as 1,900 milligrams per liter (mg/L). The concentrations of
1,1,2,2-PCA exceeded its risk based concentration of 52 µg/L in all four water-bearing
zones. However, based on the groundwater samples, there was no evidence that
contamination had migrated off-site (United States Army Alaska, October 2002). The
level of chlorinated hydrocarbons found in groundwater at areas A-3 and A-4 did indicate
the presence of a NAPL source for these contaminants.
3.5.2 Thermal Technology Description
3.5.2.1 General Description of SPSH Technology
Six phase soil heating was utilized at the Poleline Road site. A general description of
this technology is provided in Section 3.2.2.1 for the Niagara Falls ARS site.


3-40
3.5.2.2 Description of SPSH Technology Used at PRDA Site
SPSH was implemented in two phases at PRDA. In 1997, three arrays (Arrays 1, 2,
and 3) were used to treat soil and groundwater in the area near Trench 4. In 1999, three
more arrays (Arrays 4, 5, and 6) were used to treat soil and groundwater in the area near
Trench 3. SPSH activities were considered to be treatability tests by the Army and US
EPA. It was understood that the treatability test would hopefully lead to remediation of
portions of the site, but full-scale implementation at one time would have required
revision of the Record of Decision (ROD) for the site.
Arrays 1, 2, and 3
Arrays 1 and 2 were each 27 feet in diameter while Array 3 was 40 feet in diameter.
The total area treated by the three arrays was 4,700 square feet (Figure 3.9 [US Army
Corps of Engineers, June 2003]). The depth of treatment was 8 to 38 feet bgs. The total
volume of soil treated was approximately 5,200 cubic yards.
All three arrays were arranged in hexagonal patterns, with six positive electrodes
forming the perimeter of the array and one central neutral electrode. All electrodes were
constructed of galvanized steel pipe that was slotted from 8.5 to 18.5 feet bgs to allow for
the extraction of soil vapor and steam. Each electrode was installed to a total depth of
38 feet and constructed to heat soil from 8 to 38 feet bgs. The annular space between the
borehole walls and electrodes was filled with granular graphite. The graphite was
electrically conductive, and its granular nature allowed soil vapor and steam to pass freely
from the soil to the screened portions of the electrodes. PVC covers were installed over
the upper 8 feet of each pipe to isolate the soil interval from ground surface to 8 feet bgs.
Drip tubes were installed in the annular space at the top of each electrode so that
condensed steam (from the condenser described in the following paragraphs) could be
introduced into the graphite backfill to maintain electrical conductivity from the electrode
into the surrounding soil.
Power for Arrays 1 and 2 was supplied by a 455 kilowatt (kW) diesel generator, which
supplied 480-volt, three-phase power to the six-phase transformer and other equipment

3-41
on-site. Power for Array 3 was supplied by a 1,200 kW generator. The arrays were
operated in a sequential fashion, with only one array operating at a time. The larger Array
3 required more power than the smaller Arrays 1 and 2, thus the need for a larger
generator for Array 3.
The six-phase transformer was composed of six single-phase transformers, wired in
such a way as to convert the three-phase incoming power into six single-phase outputs.
The output from each single-phase transformer was connected to one of the six positive
electrodes, and the center electrode was connected to the neutral legs of all six
transformers.
A 20-horse power (hp) positive displacement blower was used to extract soil vapors,
which were initially treated through a condensing vapor/liquid separator then a catalytic
oxidizer. Condensate from the separator was cooled then treated through a tray-type air
stripper to remove VOCs from the water stream. Treated water from the stripper was
sampled to ensure discharge parameters were met, then discharged into Area 2 (the area
around Trench 2).
The oxidizer was only used to treat the vapor stream generated at Array 1. Stray
current from the array made operation of the oxidizer extremely difficult (the stray current
affected the oxidizers control system). Additionally, concentrations of organic
contaminants in the vapor stream were less than anticipated, which allowed direct
discharge of the vapor to the atmosphere.
Soil temperature data was collected from thermocouple borings installed in and around
each array. Each thermocouple boring was constructed with individual thermocouples at
three depths (either 10, 18, and 28 feet bgs or 24, 30, and 36 feet bgs).
Arrays 4, 5, and 6
Arrays 4, 5, and 6 were arranged differently than the first three arrays. The electrodes
were arranged in three rows with seven electrodes in each row (Figure 3.10 [US Army
Corps of Engineers, June 2003]). Electrodes were spaced 19 feet apart and offset from
adjacent rows by 9.5 feet. Although the electrodes were installed in rows, the overall
arrangement formed three individual arrays. An area of 110 feet by 50 feet and 35 feet


3-44
deep was heated by Arrays 4, 5, and 6. The treatment depth was from 8 to 35 feet bgs.
The volume of soil treated was approximately 5,500 cubic yards.
All electrodes were installed to total depths of 35 feet bgs and did not include slotted
portions for the extraction of soil vapor and steam (dedicated vapor extraction wells were
installed in the interior of each array). Steel shot was used instead of graphite to backfill
the annular space between the electrode and borehole wall. The shot was placed around
the lower two-thirds of the electrodes, and was separated into three zones, 35 to 26 feet
bgs, 25.5 to 18 feet bgs, and 17.5 to 11 feet bgs. Bentonite seals were placed between
each zone to separate the steel shot intervals. Epson salt was added to the upper two
intervals of steel shot to increase electrical conductivity between the electrodes and the
borehole walls. The bentonite seals also minimized vertical migration of the Epson salt.
Similar to Arrays 1, 2, and 3, PVC covers were placed over the top 8 feet of all the
electrodes installed at Arrays 4, 5, and 6. Drip tubes were installed at the top of the
annular space of each electrode to re-hydrate the steel shot/Epson salt backfill in the
uppermost intervals. The lower two steel shot intervals were in groundwater and did not
need drip tubes to re-hydrate the backfill material.
Power to the electrodes was supplied by the Matanuska Electric Association (local
power company) by use of a buried electric cable installed for the treatability study. The
use of diesel generators to power Arrays 1, 2, and 3 proved difficult due to the volume of
diesel required � over 1,000 gallons per day for Array 3. Additionally, because all three
arrays were operated simultaneously during the 1999 project, more power was needed
than could be provided by any single generator that was available at Fort Richardson.
The transformer arrangement was the same as that used for Arrays 1, 2, and 3. Six
single phase transformers were powered by a 480-volt, 3-phase power source. The only
difference was that each single phase transformer was connected to three electrodes, one
in each of the three arrays. This differed compared to the 1997 project in which each
transformer was connected to only one electrode at a time at Arrays 1, 2, and 3, as these
arrays were operated in a sequential fashion.

3-45
Three SVE wells were installed in the center of each array. Each well was screened
from 8 to 28 feet bgs. Additionally, four temperature monitoring wells were installed
within or near each of the three arrays. Individual thermocouples were installed at depths
of 12, 25, and 38 feet bgs in each of the 12 temperature monitoring wells.
A 20-hp positive displacement blower was used to extract soil vapors, which were
passed through a condensing vapor/liquid separator prior to discharge to the atmosphere.
Condensate from the separator was cooled, then treated through a tray-type air stripper to
remove VOCs from the water stream. Treated water from the stripper was sampled to
ensure discharge parameters were met, then discharged into Area 2 (the area around
Trench 2).
3.5.3 Operation of SPSH Systems at PRDA
Arrays 1, 2, and 3
Soil heating at Array 1 began on 11 July 1997 and continued for six weeks until
22 August 1997. Heating at Array 2 began on 24 August 1997 and continued until 9
October 1997. Heating at Array 3 began on 6 November 1997 and continued until 18
December 1997. Each array was heated for six weeks.
Soil from 10 to 24 feet bgs within Array 1 reached 100 ºC in 22 days and maintained
this temperature within 5 ºC for the remainder of the heating period. Soil from 24 to
38 feet bgs reached temperatures ranging from over 60 ºC to nearly 100 ºC over the same
period. With the exception of soil at 10 feet bgs outside Array 1, all soil within or just
outside of this array achieved temperatures of at least 75 ºC during the heating period.
Only the soil at 10 feet bgs to the east of Array 1 showed little effect of the heating, with
the temperature rising only by approximately 15 ºC. However, since this soil is outside
the array, achieving this temperature increase was still positive.
Soil temperatures inside Arrays 2 and 3 achieved similar results. The upper soil
intervals reached 100 ºC, and the lower soil intervals achieved temperatures of 80 ºC to
100 ºC. Soil temperatures outside Arrays 2 and 3 increased from 20 ºC to 60 ºC.

3-46
Over 100,000 gallons of condensate were generated during the 18 weeks of heating.
This water was sent to a tray-type air stripper where about 80,000 gallons evaporated.
The remaining 20,000 gallons were used to re-hydrate the graphite backfill and soil
around the electrodes. No water was discharged from the system. The condensate was
sampled once every two to three days for laboratory analysis. These samples were used to
determine the mass of contaminant removed in the liquid stream (which was comprised
primarily of condensed steam: no active groundwater extraction was conducted during the
heating periods).
Soil vapor was extracted at Arrays 1 and 2 at relatively stable rates of approximately
110 cfm for the entire period of SVE operation. The extracted vapor streams were
monitored for concentrations of organic contaminants to determine the mass removal
achieved during soil heating (discussed in Section 3.5.4). Vapor samples were collected
once every two days for laboratory analysis of site contaminants of concern (COCs). At
Array 1, the concentrations of most COCs reached their maximum levels within the first
two weeks of heating, approximately the same time as soil temperatures inside the arrays
reached 100 ºC. At Array 2, the soil was already warmed by heating at Array 1, and
therefore, the concentrations of COCs reached their maximum levels in the first four days
of heating. At both arrays the concentrations of all COCs, with the exception of TCE,
dropped to less than 10 ppm by the end of the heating periods. Concentrations of TCE
were at 82 ppm and 36 ppm at Arrays 1 and 2, respectively, at the end of their heating
periods. The off-gas was treated only at Array 1, and only for a limited time at that array.
Stray voltages from the array interrupted the control system of the catalytic oxidizer
causing frequent shut downs. Additionally, the contaminant concentrations in the vapor
stream were lower than anticipated and were low enough that direct discharge of the
vapor stream was permissible.
Soil vapor was extracted at Array 3 at a relatively stable rate of approximately
170 cfm for the entire period of SVE operation. Concentrations of most COCs reached
their maximum levels within the first three weeks of heating, which, similar to Arrays 1
and 2, was at approximately the same time as soil temperatures inside the array reached
100 ºC. Also similar to Arrays 1 and 2, the concentrations of all COCs, with the

3-47
exception of TCE, dropped to less than 10 ppm by the end of the heating periods. The
concentration of TCE was 20 ppm at Array 3 at the end of its heating period. Off gas
from Array 3 was discharged directly to the atmosphere.
Arrays 4, 5, and 6
Soil heating at Arrays 4, 5, and 6 began on 31 July 1999 and continued for nine weeks
until 4 October 1999. Operation of the SVE system began on 2 August 1999 and
continued until 14 October 1999, 10 days past cessation of soil heating.
Soil temperatures were measured at 12 feet bgs (above groundwater), 23 to 25 feet
bgs, and 38 feet bgs. Both lower temperature monitoring intervals were below the
groundwater table. Soil from 23 to 25 feet bgs within Arrays 4 and 6 reached 100 ºC after
eight weeks of soil heating. Only soil in these middle intervals at Arrays 4 and 6 reached
100 ºC, and no soil in Array 5 reached this temperature. Soil in the upper interval (12 feet
bgs) in all three arrays reached approximately 80 ºC while soil in the lower interval
(38 feet bgs) in all three arrays reached only approximately 60 ºC. These data suggest
that soil below the groundwater table did not heat as efficiently as soil above the
groundwater table. This is expected due to the lower conductivity of dryer soil above the
groundwater table. Soil at the deepest temperature monitoring interval (38 feet bgs) did
not heat as quickly as the shallower saturated soil (25 feet bgs). This observation is most
likely due to the deeper interval being near the lowest reaches of the electrodes, and there
is greater groundwater recharge (i.e., increased heat sink) available lower in the aquifer.
In general, operation of SPSH at Arrays 4, 5, and 6 did not achieve as high of
temperatures in soil within the arrays as were achieved for soil within Arrays 1, 2, and 3.
Temperatures in soil outside Arrays 4, 5, and 6 were increased from 40 ºC to over 90 ºC.
Almost 80,000 gallons of condensate were generated during the nine week long
heating period. Similar to the operation at Arrays 1, 2, and 3, this water was sent to a
tray-type air stripper where about 50,000 gallons were evaporated. The remaining 29,000
gallons was used to re-hydrate the steel-shot backfill and soil around the electrodes. No
water was discharged from the system. The condensate was sampled once every two to
three days for laboratory analysis. These samples were used to determine the mass of

3-48
contaminant removed in the liquid stream (which was comprised primarily of condensed
steam: no active groundwater extraction was conducted during the heating periods).
Soil vapor was extracted at Arrays 4, 5, and 6 at a relatively stable rate of
approximately 420 cfm for the entire period of SVE operation. The extracted vapor
streams were monitored for concentrations of organic contaminants to determine the mass
removal achieved during soil heating (discussed in Section 3.5.4). Vapor samples were
collected at a rate of about once every two days for laboratory analysis of site COCs.
Because all three arrays were heated at the same time and the vapor stream was sampled
only after the condenser, the vapor samples are of the combined flow from all three
arrays. No calculations of removal rates from the individual arrays could be made. The
concentrations of all COCs reached their maximum levels within the first week of heating
even though soil temperatures did not reach their maximum for another six to seven
weeks. This observation may be somewhat misleading because vapor extraction occurred
only at three extraction wells located in the center of each array, while soil heating was
concentrated at the perimeter of the arrays. This differed from the configuration at Arrays
1, 2, and 3, at which all perimeter electrodes also served as vapor extraction wells. At the
first three arrays, the maximum soil temperatures corresponded well with the maximum
vapor concentrations. Because heating and vapor extraction occurred at the same
locations, this is the expected outcome. At arrays 4, 5, and 6, the electrode locations were
about 20 feet from the vapor extraction wells, which may have resulted in the observed
lag time between maximum vapor concentrations and maximum soil temperatures.
Similar to the first three arrays, the concentrations of all COCs, with the exception of
TCE, dropped to less than 10 ppm by the end of the heating period. The concentration of
TCE was 14 ppm at the end of the heating period. All extracted vapor was discharged
directly to the atmosphere.
3.5.4 Contaminant Mass Removal
Based on vapor and condensate monitoring results, the mass of contaminant removed
from each array are summarized in Table 3.2 (US Army Corps of Engineers, June 2003).

3-49
TABLE 3.2
MASS REMOVAL ESTIMATES AT PRDA SOIL HEATING SITE
Estimated
Pre-treatment Mass (kg)
Estimated Mass
Removed in Off-gas (kg)
Estimated Mass
Removed in Condensate
(kg)
Total Estimated
Mass Removed (kg)
Percent Mass
Removed
Array 1 506 386 7.6 394 78
Array 2 211 217 2.7 220 104
Array 3 216 138 4.9 143 66
Arrays 4, 5, and 6 998 1385 65 1450 145
Mass removal rates at Arrays 2, 4, 5, and 6 were apparently greater than 100 percent.
This discrepancy is most likely due to inaccuracies in estimating the initial contaminant
mass, which was based on limited soil sample analytical results.
Mass removal estimates from all arrays shows that approximately twice as much
contaminant mass was removed from Arrays 4, 5, and 6 than from Arrays 1, 2, and 3.
Approximately 20 percent more soil volume was treated in 1999 and the heating period
was 50 percent longer (nine weeks in 1999 compared to six weeks each in 1997). The
greater soil volume and longer heating periods would account for the higher mass
removal in 1999.
TCE constituted about 80 percent of the contaminant mass in the off gas from all six
arrays. 1,1,2,2-PCA and PCE constituted the remaining 15 percent and 5 percent,
respectively. Interestingly, the concentrations of 1,1,2,2-PCA in soil were typically three
to four times higher that TCE concentrations. More rapid hydrolysis of 1,1,2,2-PCA to
TCE under heating conditions may have resulted in higher vapor-phase concentrations of
TCE. This reaction is thought to explain the apparent discrepancy.
3.5.5 Post-Implementation Sampling/Monitoring Results
3.5.5.1 Soil Sample Results
The average concentrations of TCE, PCE, and 1,1,2,2-PCA in soil in each array before
and after SPSH are shown in Table 3.3 (US Army Corps of Engineers, June 2003). With

TABLE 3.3 AVERAGE CONCENTRATIONS (MG/KG) OF SITE COCS IN PRE AND POST TREATMENT SOIL SAMPLES
PRDA SOIL HEATING SITE, FORT RICHARDSON, ALASKA
Trichloroethene Tetrachloroethene 1,1,2,2-Tetrachloroethane Array ID Before After % Removed Before After % Removed Before After % Removed
Array 1
21.53
1.60
93
2.00
0.08
96
82.34
1.17
99
Array 2
31.52
0.81
97
1.23
0.08
94
12.24
0.06
>99
Array 3
7.40
3.21
57
0.33
0.59
- 80
13.10
7.77
41
Array 4
82.5
2.28
97
15.25
0.05
>99
1513.5
0.03
>99
Array 5
11.12
1.87
83
3.22
0.09
97
124.8
0.08
>99
Array 6
26.92
8.48
68
0.60
0.12
80
70.04
0.03
>99
3-50

3-51
the exception of the results for PCE from Array 3, all arrays showed positive reductions
in contaminant concentrations. Reductions of greater than 99 percent were seen for
contaminants in several arrays. Although there were indications of PCE concentration
increases at Array 3, these increases were not of concern to regulators, as the pre- and
post-treatment concentrations were below the risk based concentrations (RBC) developed
for PRDA.
The removal of TCE, PCE, and 1,1,2,2-PCA from the soils in Arrays 1 and 2 ranged
from 93 to greater than 99 percent. This removal rate was achieved after six weeks of
treatment. The percent of contaminants removed from Array 3 was approximately
50 percent for TCE and 1,1,2,2-PCA. The concentrations of PCE in soil at Array 3
increased but were still below the RBC. The removal of TCE, PCE, and 1,1,2,2-PCA
from the soils at Arrays 4, 5, and 6 ranged from 68 to greater than 99 percent. However,
many samples that were collected after treatment at these arrays still had TCE
concentrations above the RBC.
3.5.5.2 Groundwater Monitoring Results
Groundwater sampling from monitoring wells located within the treatment area
showed marked decreases in contaminant concentrations after completion of the SPSH
projects, and these concentrations have remained below pre-treatment levels (e.g., no
rebound has been indicated). Five wells located in the treatment area and screened in the
shallow aquifer showed reductions in TCE concentrations from an average of 8,370 µg/L
in November 1997 to an average of 1,930 µg/L in October 2000. Reductions in
1,1,2,2-PCA concentrations were from an average of 22,480 µg/L in November 1997 to
an average of 3,770 µg/L in October 2000. Contaminants in groundwater at PRDA are
showing decreasing trends in concentrations in almost all monitoring wells at the site
(CH2MHill, 2004). All wells located within the treatment area are showing decreasing
trends. Two wells, one located adjacent to the former disposal trench number 2 (which
was not excavated or treated by SPSH) and one located approximately 300 feet
downgradient of Arrays 1, 2, and 3 may be showing increasing trends in TCE and
1,1,2,2-PCA concentrations. However, because the groundwater flow rate is estimated to

3-52
be less than 50 feet per year, contamination at the downgradient well may be the result of
contaminant migration that occurred before the 1997 SPSH activities at Arrays 1, 2,
and 3.
3.5.6 Thermal Project Cost
The total cost for the 1997 and 1999 SPSH projects was approximately $1,900,000
(Mr. Scott Kendall, USACE, personal communication, June 2004). This total does not
consider power generation or performance monitoring costs, which include approximately
$80,000 for diesel fuel for the first three arrays; approximately $70,000 for electric utility
costs for Arrays 4, 5, and 6; and approximately $200,000 for performance monitoring.
Inclusion of these costs brings the total cost to $2,250,000. The volume of soil treated
during both SPSH projects was approximately 10,700 cubic yards, and the total mass of
contaminant removed was approximately 2,200 pounds. Based on these numbers, the
unit cost for the SPSH projects was $210 per cubic yard or $1,020 per pound of
contaminant removed.

4-1
4.0 LIFE CYCLE COST ANALYSES OF FOUR SELECTED SITES
4.1 INTRODUCTION
Life cycle costs were estimated for each site based on actual costs incurred at each site
(provided by the POC for each site) and on the estimated costs for long-term monitoring
(LTM) provided in the Feasibility Study (FS) or Corrective Measures Study (CMS)
completed for the sites (LTM costs for the SRS site were based on Parsons� experience at
sites with similar monitoring networks and COCs). For sites at which remediation,
exclusive of LTM, is not complete, additional estimated remediation costs were provided
by the POCs. The range of unit costs for soil remediation at previously completed
projects was provided by the US EPA Clu-In website. This section presents the results of
the life cycle cost analyses for each of the four sites. Many of the costs are presented as
estimates since LTM is ongoing at all four sites studied. This section also includes
discussion of other potential technologies that were not identified in the decision
documents.
4.2 NIAGARA FALLS AIR RESERVE STATION NIAGARA FALLS, NY
4.2.1 Comparison of Actual Costs to Other Remedial Approaches
Discussed in the Decision Documents
The Resource Conservation and Recovery Act (RCRA) CMS for Sites 3, 10, and 13,
Niagara Falls IAP-ARS, Niagara Falls, New York (Ecology and Environment, 1995)
identified six alternatives for remediation of IRP Site 10. These alternatives included:
� Alternative 1 � No Action and Natural Attenuation (30 years O&M).
� Alternative 2 � Institutional Actions and Natural Attenuation (30 years O&M).
� Alternative 3 � Groundwater Extraction by Trenches, On-site Treatment of
Extracted Groundwater, and Discharge of Treated Water to Cayuga Creek
(30 years O&M).

5-2
� Alternative 4 � Soil Vapor Extraction, Groundwater Extraction by Trenches, On-
site Treatment of Extracted Groundwater, and Discharge of Treated Water to
Cayuga Creek (five years O&M).
� Alternative 5 � Excavation and Off-site Disposal of Contaminated Soil,
Groundwater Extraction by Trenches, On-site Treatment of Extracted
Groundwater, and Discharge of Treated Water to Cayuga Creek (five years
O&M).
� Alternative 6 � Excavation and Off-site Disposal of Contaminated Soil,
Groundwater Extraction by Trenches, and Discharge to Cayuga Creek (five years
O&M).
The following costs were estimated for the alternatives:
� Alternative 1 � $725,131
� Alternative 2 - $734,131
� Alternative 3 - $1,038,055
� Alternative 4 - $679,599
� Alternative 5 - $696,641
� Alternative 6 - $635,545
Annual groundwater monitoring costs were estimated at $23,004 per year. No
discount or escalation factors were used in development of the estimated costs.
The New York State Department of Environmental Conservation (NYSDEC) and the
US Air Force initially agreed that Alternative 6 was the most appropriate approach for
remediation of IRP Site 10. Niagara Falls ARS holds RCRA Part B hazardous waste
permit under which remedial actions are regulated. Their Part B permit was modified to
incorporate the recommended alternative, then was modified again to allow thermally
enhanced soil vapor extraction (in 1996, SPSH was a new technology, and the US Air

5-3
Force was interested in a technology demonstration; this interest and the flexibility of the
Part B permit drove the selection of thermally enhanced SVE over the alternative that was
recommended in the CMS).
The actual cost incurred to conduct the SPSH project in 1996 was $688,000.
However, this cost did not include annual groundwater monitoring or any actions to
address site groundwater (Alternative 6 did include groundwater extraction). For
comparison to the alternatives listed in the CMS, five years of LTM must be added to the
costs actually incurred for SPSH. Assuming the same cost for annual groundwater
monitoring, as was assumed in the CMS cost estimates ($23,004), and monitoring for five
years, the total LTM costs are estimated at $115,020 (this assumes no discount or
escalation factors were used in the calculation). Adding the cost for five years of annual
monitoring to the actual capital costs incurred results in a total estimated cost for SPSH of
$803,020. This cost is approximately 26 percent higher than the estimated cost for
Alternative 6 (excavation, off-site disposal, groundwater extraction, and discharge), and
as previously stated, did not include any measures to address contaminated groundwater
associated with the site (such measures were included in Alternative 6).
Following completion of the SPSH project, TCE levels in soil at IRP Site 10 exceeded
NYS cleanup criteria at three sample locations within the treatment area, and the average
of the post-treatment samples also exceeded the NYSDEC cleanup criterion. However,
the NYSDEC agreed that cleanup of the overburden soil was complete (Mr. Gerald
Hromowyk, personal communication, February, 2004). Additionally, NYSDEC stated
that groundwater remediation was not complete, and Niagara Falls ARS was required to
implement groundwater extraction and treatment to address the groundwater
contamination.
In 1998, Niagara Falls ARS constructed a groundwater interceptor trench, and in 2002,
installed two groundwater extraction wells to address contaminated groundwater at the
site. Extracted groundwater is treated through a bubbler-type stripper, then through
activated carbon. The total cost of the extraction and treatment system was $584,000.
Annual O&M costs of the extraction and treatment system are approximately $100,000.

5-4
Based on the capital costs of the SPSH ($688,000) and groundwater extraction and
treatment system ($584,000), the total capital costs incurred at IRP Site 10 are
approximately $1,272,000. The LTM costs from 1996 through 2003 were approximately
$161,000, and the O&M costs since 1998 were approximately $500,000. The total cost
of all remedial actions taken at IRP Site 10 since selection of SPSH in 1996 is
approximately $1,933,000, which is significantly higher than any of the alternatives listed
in the CMS, including those that included five years of LTM and O&M costs.
Additionally, this cost of $1,933,000 does not include the estimated $100,000 annual
O&M cost for the groundwater extraction and treatment system for operation after the
first five years. If this system operates for 15 more years, the O&M costs could add an
additional $1,500,000 to the $1,933,000 that has already been spent, which could bring
the total remedial costs to $3,400,000.
Based on the cost estimates included in the 1996 CMS, the total cost for excavation of
soil to bedrock and its off-site disposal, installation of a groundwater extraction system,
and discharge of extracted groundwater to Cayuga Creek was $635,545, which included
five years of LTM and O&M. Comparison of this cost to the total cost expended for
SPSH and subsequent groundwater extraction and treatment over a five year period,
$1,933,000, shows that excavation of the overburden soils would have been less
expensive than SPSH. However, it should also be noted that excavation and off-site
disposal would not have relieved the Air Force of the potential liability associated with
off-site disposal. The Air Force would have remained responsible for the contamination
associated with the disposed soil even had the soil been properly disposed in a permitted
landfill. The cost of this �potential liability� could exceed the overall cost of the remedial
actions conducted at Niagara Falls ANG, but this potential cost can not be determined.
4.2.2 Other Remedial Approaches That May be Applicable to Niagara
Falls ARS IRP Site 10
Based on the shallow nature of soil contamination, typically from 0 to less than 8 feet
bgs, the small areal extent of soil contamination, and the close proximity of a permitted
land disposal facility (Model City Landfill, approximately five miles from the site), it

5-5
appears that excavation and disposal would have been a more cost effective option for
remediation of soil at IRP Site 10. Excavation of soil down to bedrock, typically
encountered at less than 8 feet bgs, would likely have removed more contaminant mass
than did the SPSH project. While neither soil excavation of SPSH would have directly
addressed groundwater contamination, the high probability that additional contaminant
mass would have been removed by excavation would also likely have reduced the overall
time frame necessary to achieve remediation of site groundwater.
Because just over $1,100,000 has been spent to address groundwater contamination
since the completion of the SPSH project, and another $1,500,000 may be spent to
achieve groundwater remedial action objectives, the removal of additional mass may have
facilitated reaching groundwater remedial action objectives at a lower life cycle cost.
4.3 SAVANNAH RIVER SITE, AIKEN, SC
4.3.1 Comparison of Actual Costs to Other Remedial Approaches
Discussed in the Decision Documents
Savannah River Site holds a RCRA Part B permit, and the remedial actions carried out
at the 321-M site were conducted under this permit. SRS modified their Part B permit by
preparation of a Corrective Action Plan (CAP) for the Central Sector of the SRS. The
321-M site is included in the Central Sector. Under the CAP, SRS was allowed to
conduct numerous pilot studies of innovative technologies and conduct a full-scale test of
the technology that showed to be the most appropriate for a given site. The 321-M site is
a relatively small site that is similar in soil type, depth to groundwater, and contaminant
type to the much larger Area M Settling Basin. A focus of the Central Sector CAP was to
identify a technology that proved effective at the smaller 321-M site that could be
implemented at the larger Area M Settling Basin. This approach was the basis for testing
and implementing a remedial technology at the 321-M site.
Several technologies were tested at the larger M-Area, including groundwater
extraction and treatment, SVE, SVE enhanced with six-phase heating, in situ chemical
oxidation, and soil washing. SVE was able to remove PCE from the vadose zone, but the

5-6
estimated time frame to achieve cleanup of the soil operable unit was estimated at greater
than 30 years. Additionally, SVE would have had no direct effect on contaminated
groundwater. The other technologies that were tested proved to be ineffective at the -M-
area. SRS then chose to test DUS/HPO at the 321-M site based on reported successful
results at a creosote site in California. SRS planned to use the results of the DUS/HPO
project to allow its implementation at a much larger PCE site at SRS, the M-Area settling
basin.
The process of testing and implementing the most effective technologies used at SRS
did not include preparation of a CMS or FS. Because no FS or CMS was completed, a
comparative cost analysis for alternative remedial approaches was not generated, and the
actual costs of DUS/HPO can not be readily compared to the costs of other approaches.
The total cost of the DUS/HPO project at the 321-M site was $4,250,000. This cost
did not include the capital or O&M costs for steam generation and treatment of vapor,
groundwater, and condensate as these services were provided by existing facilities at
SRS. A rough estimate for the construction of a boiler and treatment plant would be
approximately $2,000,000 (based on the construction cost of the treatment plant and
boiler at the Yorktown NSFO site, which was somewhat larger and cost $2,800,000).
O&M costs for one year of operation of the DUS/HPO project would be approximately
$750,000, which is also based on the O&M costs of the somewhat larger Yorktown
NSFO project. Using these estimated costs and the actual cost incurred at the 321-M site,
the overall construction and operation costs for the DUS/HPO project are estimated at
$7,000,000. Based on a volume of soil of 59,300 cubic yards, the unit cost for the entire
DUS/HPO project is estimated at $118 per cubic yard. This unit cost is within the range
of previously completed soil remediation projects. Based on cleanup of the soil operable
unit alone, it appears that DUS/HPO was a reasonable technology in terms of
effectiveness and cost.
However, the DUS/HPO project targeted soil from 40 to 160 feet bgs, and soil above
40 feet bgs still contained significant contamination. To complete remediation of the
vadose zone soils at the 321-M site, SRS installed an SVE system, which removed over

5-7
1,100 pounds of contamination in the first four months of operation. The cost of the
shallow SVE system, including the installation and first four months of operation, was
approximately $200,000 and was not included in the cost analysis provided in the
previous paragraph. Because no off-gas treatment is required for the shallow SVE
system, the O&M costs for the system are low as they include only electric utility,
monthly vapor sampling, and reporting costs. These costs would amount to
approximately $50,000 per year. If cleanup is achieved in 30 years, the total cost of
shallow SVE system may amount to $1,700,000 ($200,000 plus 30 years O&M at an
annual cost of $50,000). Addition of this cost to the total estimated cost of the DUS/HPO
project ($7,000,000) increases the total costs at the 321-M site to $8,700,000. The unit
cost based on this total and the volume of soil treated is $147 per cubic yard, which is still
within the range for previously completed soil remediation projects, and well within the
range for sites with soil contamination at depths of over 160 feet.
Additionally, the impact of the DUS/HPO project on-site groundwater is not clear. A
large plume of contaminated groundwater exists at the Central Sector, and groundwater at
the 321-M site co-mingles with this larger plume. SRS has not subtracted the cost of
groundwater extraction and treatment for the 321-M site from the costs for the larger
plume. The cost for treatment of groundwater at the 321-M site is likely insignificant
when compared to treatment of the large plume. However, if groundwater treatment was
required based solely on contamination emanating from the 321-M site, the costs would
likely be in excess of $1,000,000 due to the depth to groundwater and slow dissolution
from the sorbed phase of the site contaminants.
4.3.2 Other Remedial Approaches That May be Applicable to SRS
Site 321-M
SRS tested several innovative and proven technologies at the M-Area. Of these, only
SVE and DUS/HPO were shown to remove significant quantities of contaminants from
the soil. DUS/HPO also positively affected groundwater contamination. However, this
affect will likely be only temporary, as groundwater at the 321-M site is within a much
larger plume, and the area impacted by DUS/HPO will be re-contaminated, as

5-8
contaminated groundwater migrates within the larger plume. While SVE was shown to
be effective, significant contaminant mass was found to reside in discontinuous and
multiple clay layers, and removal of contaminants from these layers would likely have
required a lengthy operational period.
The total cost of the DUS/HPO project was estimated at $7,000,000. An additional
$1,700,000 may be spent to complete remediation of the shallow soil (from 0 to 40 feet
bgs). If SVE was utilized as the remedial technology, the total costs may have been less,
particularly when considering that the manpower to operate the SVE system would
already have been on-site to operate the site-wide groundwater extraction and treatment
system. The 321-M site had dimensions of 100 feet by 100 feet by 160 feet. Using a
conservative radius of influence for SVE of 25 feet, 16 vapor extraction wells would
likely have been required to address the entire area of the site. A rough cost for
installation of a 4-inch well to 160 feet is $30,000 per well, totaling $480,000 for
16 wells. A 25-hp positive displacement blower system with a knockout tank, condensate
discharge pump, control panel, and system piping would cost, conservatively, $100,000.
Off-gas treatment would likely not be required, as it was not required during the
DUS/HPO project. Utility costs for the blower would be approximately $30,000 per year
(25 kWH at $0.12 per kW times 8,760 hours per year). Labor costs would include
weekly site visits (one day each), monthly maintenance visits (two days per month), and
reporting and management (two days per month). Assuming a labor cost of $50.00 per
hour for the weekly site and monthly maintenance visits, and $125.00 per hour for
reporting and management, the annual labor costs would amount to $54,400 per year.
Monthly vapor samples would cost approximately $4,000 per year. Capital costs would
total $580,000, and annual O&M costs would total $88,400. Assuming a 30 year
operational period, the total cost of an SVE system would be estimated at $3,232,000.
Based on a 30-year remediation period, implementation of SVE would cost
approximately 35 percent of the combined costs of the DUS/HPO project and shallow
SVE system. However, the effectiveness of SVE without thermal enhancement on the
clayey layers at the 321-M site would be reduced as compared to the sandy layers, which
may result in an operational period of more than 30 years.

5-9
4.4 YORKTOWN FUELS DESC, YORKTOWN, VA
4.4.1 Comparison of Actual Costs to Other Remedial Approaches
Discussed in the Decision Documents
The Final Corrective Action Plan with Supplemental Site Characterization, Fleet and
Industrial Supply Center, Yorktown Defense Fuel Supply Point Yorktown, Virginia
(Baker Environmental, 1996), identified six alternatives for remediation of the tank farm
site. These alternatives included:
� Alternative 1 � Natural Attenuation.
� Alternative 2 � Product Recovery in Trenches or Wells without Heat
Enhancement.
� Alternative 3 � Product Recovery in Trenches or Wells with Steam Injection
(Heat) Enhancement.
� Alternative 4 � Excavation and Off-Site Treatment (Incineration)/Disposal.
� Alternative 5 � Excavation and On-Site Treatment (Incineration), and On-Site
Disposal of Treated Soil/Ash.
� Alternative 6 � Excavation and Off-Site Treatment (Incineration) at Tank Farm
and Product Recovery in Trenches or Wells with Steam Injection at Wormley
Pond Area.
The following costs were estimated for the six alternatives:
� Alternative 1 ($250,000 plus LTM).
� Alternative 2 ($10,000,000 plus LTM).
� Alternative 3 ($12,500,000 plus LTM).
� Alternative 4 ($25,100,000).
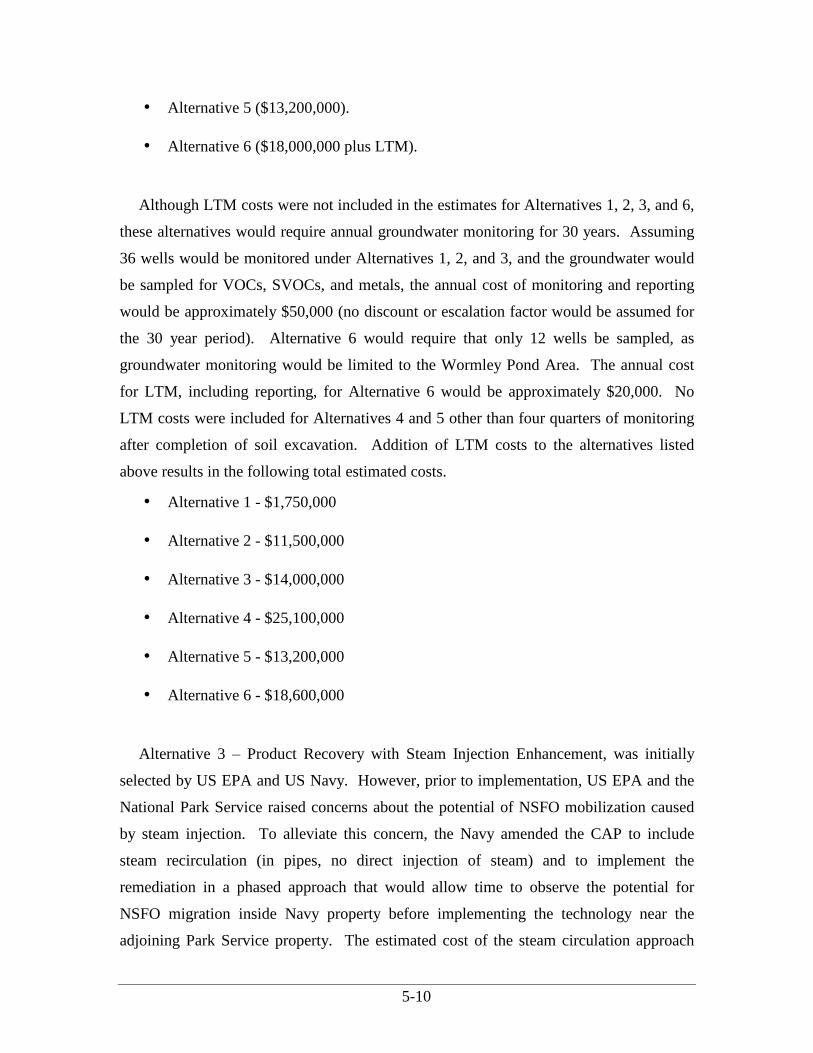
5-10
� Alternative 5 ($13,200,000).
� Alternative 6 ($18,000,000 plus LTM).
Although LTM costs were not included in the estimates for Alternatives 1, 2, 3, and 6,
these alternatives would require annual groundwater monitoring for 30 years. Assuming
36 wells would be monitored under Alternatives 1, 2, and 3, and the groundwater would
be sampled for VOCs, SVOCs, and metals, the annual cost of monitoring and reporting
would be approximately $50,000 (no discount or escalation factor would be assumed for
the 30 year period). Alternative 6 would require that only 12 wells be sampled, as
groundwater monitoring would be limited to the Wormley Pond Area. The annual cost
for LTM, including reporting, for Alternative 6 would be approximately $20,000. No
LTM costs were included for Alternatives 4 and 5 other than four quarters of monitoring
after completion of soil excavation. Addition of LTM costs to the alternatives listed
above results in the following total estimated costs.
� Alternative 1 - $1,750,000
� Alternative 2 - $11,500,000
� Alternative 3 - $14,000,000
� Alternative 4 - $25,100,000
� Alternative 5 - $13,200,000
� Alternative 6 - $18,600,000
Alternative 3 � Product Recovery with Steam Injection Enhancement, was initially
selected by US EPA and US Navy. However, prior to implementation, US EPA and the
National Park Service raised concerns about the potential of NSFO mobilization caused
by steam injection. To alleviate this concern, the Navy amended the CAP to include
steam recirculation (in pipes, no direct injection of steam) and to implement the
remediation in a phased approach that would allow time to observe the potential for
NSFO migration inside Navy property before implementing the technology near the
adjoining Park Service property. The estimated cost of the steam circulation approach

5-11
was not significantly different than the cost of direct steam injection. The higher cost of
horizontal boring was offset by the number of vertical wells that would have been
necessary for the direct steam injection approach.
The total capital costs for Phase I of the Yorktown DFSP remediation were
$7,000,000, and the total expended to date for the Phase I remediation is $12,000,000
(includes 4 years O&M at $1,200,000 per year). Construction of Phase II is estimated at
$4,000,000, and the O&M costs for the combined Phase I and Phase II areas are estimated
at $1,600,000 per year. The total O&M cost, assuming 12 more years operation of
Phase I and 15 years operation of Phase II, is estimated at $22,800,000 (this assumes
$1,600,000 per year for 12 years and $1,200,000 per year for three years). If remedial
goals are achieved in the expected 15-year time frame, the total remedial cost is estimated
at $38,800,000. This total estimated cost, which is partly based on the actual construction
and O&M costs that have been incurred during Phase I, is significantly higher than the
costs that were estimated for Alternative 3 in the CAP. Additionally, the total estimated
cost for steam recirculation is significantly higher than the cost of any of the alternatives
listed in the CAP.
The cost for Alternative 5 - Excavation and On-Site Incineration � included in the
CAP was based on the excavation of 125,000 cubic yards of soil. The unit cost for
Alternative 5 would be $106 per cubic yard. This unit cost appears to be within the range
of cost for previously completed excavation and on-site incineration projects. The
addition of a 50 percent contingency added to the cost for Alternative 5 would raise the
total estimated cost to $19,800,000. Comparison of the estimated cost for excavation and
on-site incineration, including the contingency, to the total estimated cost for steam
recirculation indicates that excavation and on-site incineration may have been a more cost
effective approach for remediation of the Yorktown NSFO site.
4.4.2 Other Remedial Approaches That May be Applicable to Yorktown
Fuels NSFO Site
Based on the site conditions of shallow soil contamination, a relatively immobile
contaminant, and lack of a dissolved contaminant plume, excavation and treatment or

5-12
thermally enhanced NAPL recovery are the most appropriate technologies for achieving
cleanup of the Yorktown Fuels NSFO site. As was stated in the preceding section, soil
excavation with on-site thermal treatment and on-site backfilling of treated soil was likely
a more cost effective approach for cleanup of the site.
4.5 FORT RICHARDSON POLELINE ROAD, FORT RICHARDSON, AK
4.5.1 Comparison of Actual Costs to Other Remedial Approaches
Discussed in the Decision Documents
The Final Feasibility Study Report for Operable Unit B Poleline Road Disposal Area
Fort Richardson, AK (Woodward-Clyde, 1997) identified six alternatives for remediation
of the PRDA. These alternatives included:
� Alternative 1 � No Action.
� Alternative 2 � Natural Attenuation including site-wide institutional controls and
groundwater monitoring.
� Alternative 3 � Containment using a synthetic liner and soil cover cap with a
bentonite slurry wall to 25 feet bgs around the hot zone, institutional controls, and
groundwater monitoring.
� Alternative 4 � Interception trench, air stripping, and soil vapor extraction. A
series of drainage trenches would intercept groundwater that would be collected
and treated via an air stripper. Soil vapor extraction would be used to remediate
soil above the lowered groundwater table.
� Alternative 5 � Air sparging and soil vapor extraction of the hot spot combined
with natural attenuation. Groundwater in the hot spot would be treated using air
sparging, and soil above the water table would be treated using soil vapor
extraction. Groundwater would be monitored for natural attenuation parameters
and VOCs.
� Alternative 6 � Soil vapor extraction of the hot spot. Dual-phase extraction would
be used to extract soil vapor and groundwater, both of which would be treated

5-13
above ground. Site-wide institutional controls and groundwater monitoring would
be implemented.
The following costs were estimated for the alternatives:
� Alternative 1 - $0
� Alternative 2 - $1,300,000
� Alternative 3 - $2,500,000
� Alternative 4 - $7,500,000
� Alternative 5 - $5,500,000
� Alternative 6 - $4,000,000
With the exception of Alternative 1 (No Action), all alternatives included annual
groundwater sampling and analysis of 17 wells for VOCs and natural attenuation
parameters and O&M costs for 30 years. Annual groundwater monitoring costs were
estimated at $29,070 per year. No discount or escalation factors were used in
development of the estimated costs.
US EPA and the US Army agreed that Alternative 6 was the most appropriate
approach for remediation of the PRDA, and this alternative was incorporated into the
ROD. The FS estimated cost of the alternative was $4,000,000. Originally, the
alternative did not include thermal enhancement. However, the ROD did incorporate
completion of treatability studies using innovative technologies that had potential to
enhance the selected remedy. The ROD also allowed implementation of innovative
technologies if the initial remedy proved ineffective. Based on this language in the ROD,
Fort Richardson conducted the two SPSH treatability studies to evaluate its potential to
enhance SVE. Based on the results of the study, and on the post-treatment soil samples
that showed greater than 90 percent mass removal, US EPA agreed that remediation of
the source area was complete and that MNA was acceptable for remediation of the
dissolved phase plume.

5-14
The actual cost incurred to conduct the SPSH projects in 1997 and 1999 was
$2,200,000. Assuming the same cost for annual groundwater monitoring ($29,070) and a
30-year time frame, the total LTM costs are estimated to be $872,100 (this also assumes
no discount or escalation factors were used). The costs developed in the FS assumed a
35 percent contingency on capital and O&M costs. Application of the contingency to the
estimated LTM costs brings those costs to $1,180,000 (no contingency would be added to
the capital costs of the SPSH projects as the $2,200,000 was the actual costs incurred).
Adding the long-term monitoring costs to the actual capital costs incurred results in a
total estimated cost for SPSH of $3,380,000.
Based on the FS-estimated cost for Alternative 6 ($4,000,000) and the life cycle cost
estimate for SPSH which included the actual construction costs and estimated LTM costs
($3,380,000)and implementation of SPSH will, over a 30-year remedial period, be less
expensive than the ROD-selected alternative. Because US EPA has agreed that
remediation of the source area is complete and the remedy was less costly than the ROD-
selected alternative, it appears that, overall, SPSH was an appropriate technology for use
at the PRDA.
4.5.2 Other Remedial Approaches That May be Applicable to Fort
Richardson PRDA
Based on the depth to groundwater (4 to 10 feet in the perched zone and 20 to 25 feet
in the shallow zone) and the depth of contamination at the PRDA (38 feet), excavation of
contaminated soil would not have been feasible. Fort Richardson had tested air sparging
and soil vapor extraction with groundwater depression at the PRDA, with limited success.
Dual-phase extraction may have been viable, but the long-term cost of groundwater
treatment would have made the technology more costly than SPSH. A possible
technology that was not available in 1997 is enhanced anaerobic biodegradation (EAB).
This technology uses carbon addition to first stimulate aerobic biodegradation leading to
oxygen depletion and the development of anaerobic conditions in groundwater. Once
anaerobic conditions are achieved, indigenous microbes can often times utilize
chlorinated hydrocarbons as an alternative electron acceptor, which results in the

5-15
reductive dechlorination of the chlorinated hydrocarbons to less chlorinated or non-
chlorinated by-products. At the PRDA, carbon addition would likely be best
accomplished by construction of a mulch wall downgradient of the source area. The wall
could be installed by a single-pass trencher to simultaneously cut a trench, backfill it with
a mixture of sand and bark mulch, and install a horizontal pipe for the introduction of
fresh carbon substrate if the source area contamination outlasts the mulch. Current
technology allows use of a single pass trencher to depths of up to 35 feet. At the PRDA
site, contamination exists to a depth of 38 feet. Therefore, a 3 to 5 foot deep bench would
be excavated for the trencher to work in and reach the required 38 foot depth. A rough
cost for construction of the mulch wall would be $1,000,000, which includes $250,000
for mobilization of specialized construction equipment and $750,000 for construction of
the wall. The addition of 30 years of LTM, at an estimated cost of $872,000, would bring
the total cost of a mulch wall to just under $2,000,000. This technology has been
successfully implemented at several DOD sites and, if available in 1997, may have been
an option at the PRDA.

5-1
5.0 POLLUTANT EMISSIONS FROM POWER GENERATION DURING THERMAL ENHANCEMENT PROJECTS
One additional aspect of thermal enhancement projects is the emission of pollutants
during the generation of the electric power and/or the steam that is necessary to heat the
subsurface soils (this aspect also applies to any remediation project that utilizes electricity
or steam). The emission of pollutants from power/steam generation may become a
consideration of the overall effects of site remediation. Combustion of fossil fuels is the
predominant means of generating electric power, which is used for the SPSH projects,
and steam, which is used for steam injection and recirculation projects. Fossil fuel
combustion releases air pollutants, including nitrogen oxides, sulfur dioxide, and heavy
metals including mercury. The emission of these pollutants can be estimated and
compared to the mass of pollutants recovered during the thermal enhancement projects.
This comparison could be used in the overall evaluation of the efficiency of thermal
enhancement technologies.
For this report, only the four sites that were evaluated in detail will be considered for
this comparison of pollutant emissions versus contaminant recoveries. Sufficient data to
allow the calculations were collected from only these four sites. Additionally, the
comparison will only utilize the pollutants generated during the combustion of fossil fuels
to generate electricity or steam. Indirect pollutant emission from power plant/steam
generator construction and maintenance will not be considered. The rates of pollutant
emissions per unit fossil fuel combusted were provided in the report, Estimating Future
Air Pollution from New Electric Power Generation (Commission for Environmental
Cooperation of North America, June 2002). This report includes a compilation of US
EPA, Environment Canada, and industry data regarding the production rates of air
pollutants during fossil fuel combustion. Some of the production rates are estimates or
are average rates and should not be considered definitive.
The pollutant production rates provided in the aforementioned report are tabulated on
Table 5.1 (Commission for Environmental Cooperation of North America, June 2002).

5-2
This table includes pollutant production rates for only the fossil fuels used to generate
electricity/steam for the four projects at which detailed evaluations were completed. The
fuels used for each site are listed below:
� Niagara Falls ARS � No fossil fuel used. Power for the City of Niagara Falls is
generated at the Robert F. Moses Hydroelectric Power Plant located on the
Niagara River in Niagara Falls, New York.
� Savannah River Site 321-M Site � Steam was provided by a central steam plant
that is fired with natural gas.
� Yorktown Fuels DFSP NSFO Tank Farm � Steam is generated by a packaged
boiler system that is fired by natural gas. However, Yorktown Fuels DFSP did not
provide the natural gas utilization rate, and therefore, calculation of pollutant
emissions can not be made.
� Fort Richardson PRDA Site � Diesel fired generators were used for Arrays 1, 2,
and 3, and the Matanuska Electric Association, which operates a fuel oil fired
steam turbine power plant, provided power for Arrays 4, 5, and 6.
TABLE 5.1
AIR POLLUTANT PRODUCTION RATES PER UNIT OF FOSSIL FUEL
Fossil Fuel Nitrogen Oxide Sulfur Dioxide Mercury
Natural Gas 320 lb/106ft
3 0.598 lb/10
6ft
3 2.6 x 10
-4 lb/10
6ft
3
Fuel Oil 5.64 kg/m3
(0.047 lb/gal) 68 kg/m
3
(0.566 lb/gal) 1.13 x 10
-7 lb/gal
Diesel Fuel 2.88 kg/m3
(0.024 lb/gal) 8.52 kg/m
3
(0.071 lb/gal) 3.9 x 10
-7 lb/gal
The volumes of natural gas, fuel oil, and diesel that were combusted must be known in
order to determine the mass of pollutants emitted during electricity/steam generation.
SRS provided the energy input to the SPSH system, 45.4 x 10⁶ BTUs. The energy
content of natural gas (1,000 BTUs per cubic foot [naturalgas.com]) must be used to
convert the energy input into the volume of natural gas combusted. Fort Richardson
provided the volume of diesel used to power the SPSH at Arrays 1, 2, and 3. To calculate

5-3
the volume of fuel oil used at the Matanuska Electric Association plant, the energy input,
700,000 kWH, must be converted to BTUs (3413 BTUs per kWH ) then to a volume by
use of the energy content of fuel oil (140,000 BTUs per gallon
[engineeringtoolbox.com]).
Savannah River Site reported the total energy input to the SPSH site was 45.4 x 10⁶
BTUs. Assuming an average efficiency for steam boilers of 35 percent, an estimated
1.30 x 10⁸ BTUs (45.4 x 10⁶ divided by 0.35) of natural gas were consumed to generate
the energy that was input into the 321-M site. Using the energy content of natural gas,
1,000 BTUs per cubic foot, the amount of natural gas used to generate steam for the SRS
SPSH project was 1.30 x 10⁵ cubic feet (1.30 x 10⁸ BTUs divided by 1,000 BTUs per
cubic foot). Based on the values provided in Table 5.1, the mass of pollutants emitted
during the combustion of 1.30 x 10⁵ cubic feet of natural gas were:
� Nitrogen Oxides: 41.6 pounds (1.30 x 10⁵ multiplied by 320 lb NOx/106ft3)
� Sulfur dioxide: 0.078 pound (1.30 x 10⁵ multiplied by 0.598 SO2lb/106ft3)
� Mercury: 0.000034 pound (1.30 x 10⁵ multiplied by 2.6 x 10⁻⁴ lb
Hg/106ft3)
These values assume that there is no emission controls equipment in operation on the
stack of the steam plant.
The first SPSH project (Arrays 1, 2, and 3) at Fort Richardson PRDA used an
estimated 70,000 gallons of diesel fuel. The second SPSH project (Arrays 4, 5, and 6)
used a total of 700,000 kWH, which equates to 2.39 x 10⁹ BTUs (700,000 kWH
multiplied by 3413 BTUs per kWH). Using the energy content of fuel oil of 140,000
BTUs per gallon, approximately 34,000 gallons of fuel oil, assuming 100 percent
efficiency, would be consumed to generate 700,000 kWH. Assuming an average
efficiency of 35 percent for fuel oil fired steam turbine power plants, the total volume of
fuel oil needed to produce 700,000 kWH of electricity would be approximately
97,000 gallons (34,000 gallons divided by 0.35). Using the estimated volumes of diesel

5-4
fuel and fuel oil, 70,000 gallons and 97,000 gallons, respectively, and the pollutant unit
production rates listed in Table 5.1, the following estimated masses of pollutants were
released during the SPSH projects at Fort Richardson PRDA:
� Nitrogen Oxides: 6,239 pounds (70,000 gallons multiplied by 0.024 lb/gal
plus 97,000 gallons multiplied by 0.047 lb/gal)
� Sulfur dioxide: 59,872 pounds (70,000 gallons multiplied by 0.071 lb/gal
plus 97,000 gallons multiplied by 0.566 lb/gal)
� Mercury: 0.0383 pound (70,000 gallons multiplied by 3.9 x 10⁻⁷
lb/gal plus 97,000 gallons multiplied by 1.13 x 10⁻⁷ lb/gal)
These values assume there is no pollution control equipment located either on the
diesel generators or at the Matanuska Electric Association plant.
Based on the calculations provided above, the pollutant emission rates during the SRS
321-M SPSH project were minimal. The pollutant emission rates of nitrogen oxides and
sulfur dioxide during the Fort Richardson PRDA were significant. The use of diesel
fueled generators and fuel oil fired steam turbine electric power plants produced greater
masses of pollutants than did the natural gas fired steam generator. The use of diesel
generators and/or fuel oil fired electric power plants may become a consideration for
future site remediation projects.

6-1
6.0 SUMMARY AND CONCLUSIONS
6.1 SUMMARY OF PROJECT ACTIVITIES
6.1.1 Site Selection
Parsons utilized internet databases to identify 25 federal and two private sector thermal
enhancement projects. The government or consultant POC for each project was
identified, and 21 of these answered an initial questionnaire regarding their project.
Seventeen of the 21 POCs agreed to participate further with the project. Parsons then
contacted those 17 POCs, of which 11 agreed to conduct telephone interviews and
provide more detailed information regarding their respective projects. Using information
from the questionnaires and interviews, Parsons selected four projects for site visits and
detailed evaluations. Parsons visited each of the four sites and gathered additional
detailed information regarding the technology selection process, implementation and
operation of the selected technology, the cost of each project, and the results of any post-
project soil and groundwater sampling.
6.1.2 Pollutant Emissions from Power/Steam Generation
The emission of pollutants during the generation of the electric power and/or the steam
that is necessary for remediation of a site may become a consideration of the overall
effects of site remediation. Combustion of fossil fuels for power generation releases air
pollutants, including nitrogen oxides, sulfur dioxide, and heavy metals including mercury.
As was shown in Section 5, the combustion of natural gas to generate the steam for the
DUS/HPO project at SRS emitted 41.6 pounds of nitrogen oxides, 0.078 pound of sulfur
dioxide, and 0.000034 pound of mercury. The combustion of diesel fuel and heavy fuel
oil during the Fort Richardson PRDA projects emitted 6,239 pounds of nitrogen oxides,
59,872 pounds of sulfur dioxide, and 0.0383 pound of mercury. Based on these estimated
values, it is readily apparent that combustion of natural gas produces significantly less air
pollutants than the combustion of fuel oils. A comparison of the relative detrimental
effects of air pollutants released versus soil and/or groundwater pollutants recovered may

6-2
be useful in determining the overall net positive effect of a site remediation. This type of
comparison was outside the scope of this project.
6.2 CONCLUSIONS
Evaluation of the responses from the 21 POCs that returned the initial questionnaires
led to the findings listed below:
� Only one respondent indicated that thermal enhancement was a failure. The other
20 respondents indicated their thermal projects were successful or somewhat
successful.
� Of the 20 respondents that felt their projects were successful or somewhat
successful (the favorable respondents), four indicated that thermal enhancement
had definitely decreased the overall remedial costs, eight stated it had probably
decreased overall costs, three indicated that thermal enhancement had definitely
increased the overall remedial costs, three responded that the cost impact was
unknown, and two indicated thermal enhancement made no impact to overall
costs.
� Of the 20 favorable respondents, only 14 of these stated they would use the same
technology again.
� Six of the 20 favorable respondents indicated that, knowing the results, they
would not use the same thermal technology, and four of these six indicated that,
knowing the results, they would have chosen a non-thermal technology.
� A total of eight of the 20 favorable respondents indicated that, knowing the
results, they would have chosen a non-thermal technology.
� Thermal enhancement was selected in decision documents at only 11 of the sites,
seven were interim actions, and 16 projects were chosen as technology
demonstrations.
� Regulatory encouragement was a factor in the selection of thermal enhancement at
only 10 of the sites, and vendor marketing was a factor at only five sites.

6-3
Based on the responses in the 21 initial questionnaires, from the telephone contacts
with the 17 POCs that initially agreed to participate further, and from the interviews with
11 POCs, almost one-half of the POCs (10 of 21) indicated that they would have either
chosen a different thermal technology (2 POCs) or would have chosen a non-thermal
technology (8 POCs). Only three of the 21 respondents indicated that the project was
both successful and had definitely decreased remedial costs. One of these three, the SRS
321-M site still requires active remedial actions to cleanup groundwater and residual soil
contamination, and based on the life cycle costs analysis (Section 4 of this report),
thermal enhancement may not have been a cost effective alternative. Of the eight
respondents that indicated thermal enhancement probably decreased cost, only one site,
the PRDA site in Alaska, could definitively show that the costs were less than other
remedial technologies (this conclusion is based on the life cycle cost analyses performed
in Section 4 of this report and on the basis that life cycle cost analyses were not
conducted for all eight of these sites). At two of those eight sites, Yorktown DFSP and
Niagara Falls ARS, it is apparent that the cost of thermal enhancement was or will be
considerably higher than the cost of other remedial approaches (also based on the
aforementioned life cycle cost analyses).
Based on the evaluations of the four sites chosen for this project, thermally enhanced
source remediation was clearly an appropriate technology at only one site � Poleline Road
Disposal Area, Fort Richardson, Alaska. This site was contaminated with recalcitrant
compounds (PCE, TCE, and 1,1,2,2-PCA) that had migrated to a depth of 38 feet bgs,
and the areal extent of contamination was limited in size (two areas of less than one-third
acre each). Additionally, pilot testing of air sparging and dual-phase extraction showed
limited success, and off-gas treatment of extracted soil vapor was not required, thus
reducing the overall remediation costs. SPSH removed greater than 90 percent of the
estimated contaminant mass and nearly all soil samples collected after the SPSH project
showed remedial action objectives for the soil unit were met. Additionally, following
completion of the SPSH project, future remedial activities at the PRDA site are now
limited to natural attenuation of groundwater. The life cycle cost analysis showed that, at
the time frame of this remediation, SPSH was more cost effective than the other remedial
technologies that were evaluated in the CMS. Newer innovative technologies such as

6-4
enhanced anaerobic bioremediation may have been viable, but were not available at that
time.
The evaluations of the projects at Niagara Falls ARS IRP Site 10 and Yorktown Fuels
NSFO Tank Farm showed that thermally enhanced source remediation approaches were
less effective in terms of cost and removal efficiency than if soils at each site were
excavated and treated/disposed. At Niagara Falls ARS IRP Site 10, soil samples
collected before and after SPSH were contaminated with TCE above NYSDEC soil
remediation limits, and additional groundwater remediation measures have been required.
At Yorktown Fuels, 198,000 gallons of NSFO have been recovered in four years of
operation, but an estimated 3,000,000 gallons were released. The depths of
contamination at both sites were shallow enough to allow conventional excavation, and
the overall cost of excavation and disposal/treatment were significantly less than the costs
of SPSH or steam recirculation heating.
Evaluation of the steam injection project at SRS 321-M site presents somewhat
inconclusive findings. The steam injection project was effective in terms of mass
recovery, in meeting soil cleanup objectives for the targeted area of soil, for removing
contaminant mass from the clayey layers present at the site, and for temporarily reducing
contaminant concentrations in groundwater below the site. However, soil vapor
extraction (SVE) without thermal enhancement was also shown to effectively remove
contaminant mass from the sandy soil regions and was less costly than the addition of
steam to enhance contaminant recovery. The effectiveness of SVE on the clayey layers
was not measured, but experience at other sites indicates its effectiveness is reduced in
clayey soil, thus reducing its overall effectiveness in achieving remediation of the vadose
zone. Remediation of groundwater at the 321-M site was not achieved. However, it
should be noted that the plume under the 321-M site is contained within a larger plume
and remediation of the plume under the 321-M site would have been only temporary as
groundwater flow from the larger plume would have re-contaminated the groundwater
under the 321-M site.

6-5
Based on the detailed evaluation of these four sites, is appears that while thermally
enhanced source remediation has in many cases significantly enhanced the recovery of
contaminant mass as compared to non-thermal technologies, implementation of thermal
enhancement did not result in the complete closure of any of these four sites.
Remediation of the soil unit at PRDA Fort Richardson, AK and of the overburden soil at
Niagara Falls ARS Site 10, are considered complete, but additional active groundwater
remediation measures are still required at the Niagara Falls site. Additionally, based on
the life cycle cost analyses, with the exception of the PRDA site in Alaska and possibly
the SRS 321-M site, implementation of thermally enhanced source remediation
technologies had significantly higher costs than non-thermal technologies.
Based on all information gathered during this project, it can be concluded that
implementation of thermal enhancement did not lead to complete site closure at any of
the 21 facilities that were evaluated under this project. Thermally enhanced soil vapor
extraction did lead to closure of the soil operable units at Air Force Plant 4, TX and at the
PRDA, Fort Richardson, AK, and of the overburden soil at Niagara Falls ARS, NY.
Additionally, thermal enhancement did result in regulatory acceptance of monitored
natural attenuation (MNA) at the PRDA site in Alaska, and may have assisted in
acceptance of MNA at two additional sites (Edwards Air Force Base [AFB], CA, and
Whittier DFSP, AK). However, at both the Edwards AFB site and at Whittier DFSP,
MNA would likely have been accepted even in the absence of the thermal enhancement
projects. At the two remaining sites at which closure of the soil units were obtained (Air
Force Plant 4 and Niagara Falls ARS), active groundwater remediation activities are still
required.
Ultimately, it appears that thermal enhancement was effective at achieving closure of
the soil units at three of 21 sites, and resulted in regulatory acceptance of MNA,
definitively, at only one of those three sites. This translates into closure of soils units at
14 percent of sites, obtaining MNA as the sole remedy at 5 percent of sites, and achieving
complete site closure at 0 percent of sites. Although thermal enhancement intuitively
seems like a logical approach, results of this study would indicate that Air Force RPMs

6-6
should approach the technology cautiously, carefully evaluating all remedial alternatives
prior to adopting this aggressive and costly technology.
6.3 IMPORTANT CONSIDERATIONS REGARDING APPROPRIATENESS
OF THERMAL ENHANCEMENT
Numerous site-specific issues must be considered when selecting a remedial
technology for addressing source areas. These issues include the size of the source area,
the depth of contamination, the geology at the source area, the nature of the contaminant,
the presence of sensitive receptors, and the time frame available for cleanup. Based on
this evaluation, the factors that appear to be the most important regarding thermal
enhancement are the nature of the contaminant, the geology of the source area, and the
time frame available for cleanup.
If the contaminant has a relatively high vapor pressure, similar to TCE or gasoline,
thermal enhancement may not be warranted. Longer operation of an SVE system may be
all that is necessary to achieve cleanup. However, the effectiveness of this technology
becomes limited as the vapor pressure of the contaminant decreases. Sites contaminated
with creosote, heavy fuel oil, or coal gasification tars will likely not respond to SVE
unless the source area is heated, but one must consider if these types of source areas need
to be addressed, if they are not significantly impacting groundwater.
Similarly, the geology of the site, most importantly the permeability of the soil or
bedrock, will affect the effectiveness of in-situ technologies. At the Fort Richardson
PRDA site, the contaminants were TCE and 1,1,2,2-PCA, both with relatively high vapor
pressures. However, the low permeability of the soil limited the effectiveness of SVE.
Application of a higher vacuum during a dual phase extraction pilot test did not
significantly affect the removal rates as compared to standard SVE. Removal rates
increased dramatically during the soil heating projects, and cleanup of the soil was
achieved.
Finally, the time frame available for cleanup of soils operable units may drive the
selection of thermal enhancement. SVE systems typically require several years to over a

6-7
decade to complete remediation of soil. As was shown in this evaluation, the soil
operable units at Niagara Falls ARS IRP Site 10, Fort Richardson PRDA, and Air Force
Plant 4 achieved regulatory closure in six to nine weeks of heating at each array. Closure
of the soil unit below 40 feet bgs at the SRS 321-M site was achieved in one year of soil
heating. Additionally, thermal enhancement may have aided the selection of MNA as the
sole remedial technology at the Edwards AFB and Whittier DFSP sites. Thermal
enhancement may be an appropriate technology for achieving cleanup of soil if the
property is to be transferred, new construction is scheduled at the site, or some other
regulatory or owner requirement exists to expedite cleanup of site soils. However, one
should consider the impact of thermal treatment on groundwater and whether or not
cleanup of soil will significantly impact groundwater contamination and therefore the life
cycle cost of completely remediating the site.

7-1
7.0 REFERENCES
Baker Environmental, Inc. 1996. Final Corrective Action Plan with Supplemental Site
Characterization, Fleet and Industrial Supply Center, Yorktown Defense Fuel Supply Point, Yorktown Virginia. October.
CH2MHill. 2004. Final Fort Richardson Operable Unit B Poleline Road Disposal Area
Groundwater Monitoring Report. January. Commission for Environmental Cooperation of North America. Estimating Future Air
Pollution from New Electric Power Generation. 2002. Ecology and Environment. 1995. RCRA Corrective Measures Study for Sites 3, 10, and
13, Niagara Falls IAP ARS, Niagara Falls, New York. Ecology and Environment. 2003. Final 2002 Sampling/Monitoring Report Installation-
Wide Groundwater Monitoring Project Niagara Falls ARS, Niagara Falls, New York. March.
Field Support Services, Inc. 2004. Quarterly Monitoring Report, Remediation of Navy,
Special Fuel Oil, Defense Fuel Supply Point, Yorktown Fuel Terminal, Yorktown, Virginia. April to June 2004.
Hromowyk, G. Niagara Falls Air Reserve Station. 2004. Personal Communication. May. Hughes, W. Shaw Environmental & Infrastructure, Inc. 2004. Personal Communication.
May. Kendall, S. USACE Alaska Division. 2004. Personal Communication. June. Kupar, J. Bechtel Savannah River, Inc. 2004. Personal Communication. May. Montgomery Watson. 1996. Draft Work Plan, Interim Remedial Action at Site 10, Fire
Training Pit 1, Niagara Falls ARS, Niagara Falls, New York. July. Montgomery Watson. 1997. Final Interim Remedial Action Report, Site 10: Fire Training
Area No. 1, Niagara Falls International Airport Air Reserve Station, Niagara Falls, New York. February
OHM Remediation Services Corporation. 1999. Final Work Plan for Remediation of POL
at NSFO Tank Farm, Fleet and Industrial Supply Center, Defense Fuel Supply Point Yorktown, Virginia. August.

7-2
Parsons. 2003. Proposal for Architect-Engineering (A-E) Services Support to Evaluate Thermal Enhancement for the Cost-Effective Remediation of Non-Aqueous Phase Liquids (NAPLs). June.
Perry, Robert H., Green, Don W., Maloney, James, O., 1984. Perry�s Chemical
Engineer�s Handbook, Sixth Edition. United States Army Alaska. 2002. Five-Year Review Report, First Five-Year Review
Report for Fort Richardson, Alaska. October. U.S. Army Corps of Engineers. 2003. Final Interim Remedial Action Report Operable
Unit B � Poleline Road. June.
Westinghouse Savannah River Company, et al. 2003. Cost and Performance Report, Dynamic Underground Stripping-Hydrous Pyrolysis Oxidation at the Savannah River Site 321-M Solvent Storage Tank Area, Aiken, South Carolina.
Woodward-Clyde. 1997. Final Treatability Study Report, Operable Unit B, Poleline Road
Disposal Area, Fort Richardson, Alaska. March.

APPENDIX A
INITIAL QUESTIONNAIRE

Questionnaire
Thermal Enhancement for the Cost-Effective Remediation of NAPLs Questionnaire Type of source area:
Fuel Hydrocarbon LNAPL Chlorinated Solvent DNAPL Chlorinated Solvent dissolved in Fuel Hydrocarbon (LNAPL)
Other: Type of Thermal Technology employed:
Steam injection Electrical Resistive Heating Conductive Heating Radio-Frequency Heating Hot water injection Thermal Enhancement for SVE (hot air, 6-phase, etc) Deep soil mixing with steam injection
Other: What is/was the Vendor’s name? Project Type:
Pilot Test Full-scale project
Project Stage:
Planning In progress Complete
Impression of success:
Project was a failure Project was somewhat successful Project was very successful
Cost Data Availability:
No cost data available Some cost data available

Extensive cost data available Impact of thermal technology on life-cycle costs:
Technology definitely decreased life-cycle cost of project Technology probably reduced life-cycle cost of project Technology had no impact on life-cycle cost of project Technology increased life-cycle cost of project Unknown
Yes No Question:
Was the thermal technology selected in a feasibility study or corrective measures study?
Was the thermal technology selected as an interim action?
Was the thermal technology selected as a technology demonstration?
Did your regulators suggest or encourage use of the thermal technology selected?
Was the technology selected based on vendor marketing efforts
Knowing project results, would you use the selected thermal technology again?
Knowing project results, would you select a different thermal technology?
Knowing project results, would you select a technology that was not dependent on any thermal enhancement technology?
Are you willing to participate further in this thermal technology evaluation?
Are you willing to share cost data for use in this life cycle cost evaluation of thermal technology enhancements?
Submit

APPENDIX B
SECOND QUESTIONNAIRE AND INTERVIEW SUMMARIES WITH THERMAL PROJECT POCs
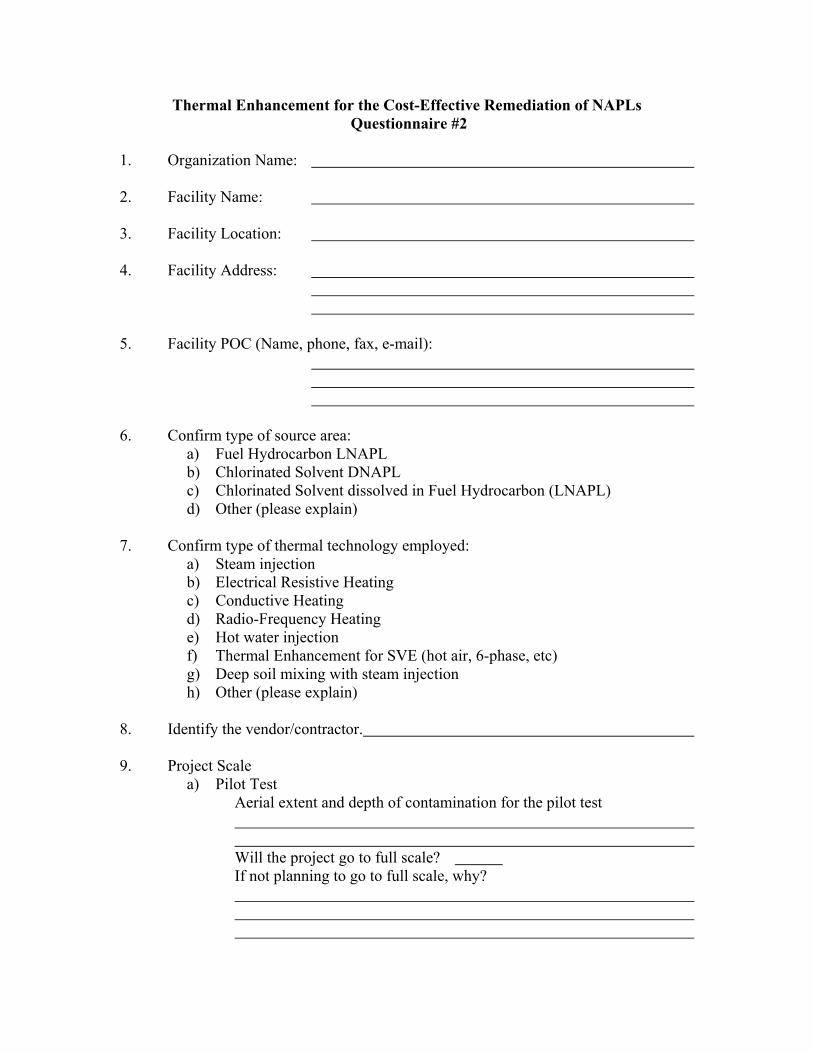
Thermal Enhancement for the Cost-Effective Remediation of NAPLs Questionnaire #2
1. Organization Name: 2. Facility Name: 3. Facility Location: 4. Facility Address: 5. Facility POC (Name, phone, fax, e-mail): 6. Confirm type of source area:
a) Fuel Hydrocarbon LNAPL b) Chlorinated Solvent DNAPL c) Chlorinated Solvent dissolved in Fuel Hydrocarbon (LNAPL) d) Other (please explain)
7. Confirm type of thermal technology employed:
a) Steam injection b) Electrical Resistive Heating c) Conductive Heating d) Radio-Frequency Heating e) Hot water injection f) Thermal Enhancement for SVE (hot air, 6-phase, etc) g) Deep soil mixing with steam injection h) Other (please explain)
8. Identify the vendor/contractor. 9. Project Scale
a) Pilot Test Aerial extent and depth of contamination for the pilot test Will the project go to full scale? If not planning to go to full scale, why?

b) Full-scale project Was a pilot study conducted before going to full scale? What was the aerial extent and depth of contamination for the full-scale treatment effort?
10. Project status
a) Planning (including design) b) In situ treatment is ongoing c) Post-treatment monitoring d) Long-term monitoring e) Complete
11. Confirm impression of success
a) Project was a failure Why was it considered a failure?
b) Project was somewhat successful. Why was it considered somewhat successful?
Is the site going full scale? What was the percent of mass removed? What was the percent reduction in mass flux?
Is there ground water contamination? What was the percent reduction in ground water concentrations? Was rebound measured?

What was the result of rebound tests?
c) Project was very successful
Why was it considered successful?
What was the percent of mass removed? What was the percent reduction in mass flux?
Is there residual ground water contamination?
What was the percent reduction in ground water concentrations? Was rebound measured? What was the result of rebound tests?
d) Is long-term monitoring planned?
Have regulators agreed upon the success of the treatment? Was this treatment applied at a full scale that could lead to a site closure? Have stakeholders approved the site closure followed by the remediation?
12. What is the lithology of the site?

A) Geology: Heterogeneous, homogenous, or moderately homogeneous? a) Sand b) Silt c) Clay d) Sedimentary e) Gravel f) Till g) Unconsolidated h) Metamorphic i) Igneous j) Consolidated k) Other l) Unknown
B. Hydrogeology:
a. Average depth to groundwater at the site? b. Confined or unconfined.
c. Vertical profile depth(s) of confining layer(s)?
d. Is there significant fracturing of the bedrock?
e. Is there a significant seasonal fluctuation in groundwater table?
f. Is the geology significantly impacted by precipitation (i.e. sandy and very permeable)?
C. Aboveground buildings or permanent structures
Are there aboveground structures that could interfere with the thermal treatment?
13. What was the nature of NAPL at the site?

a) Was NAPL mobile, immobile residual, other? b) Was the entire area impacted by NAPL addressed by the project?
If not, was the NAPL impacted area adequately characterized?
c) Was characterization satisfactorily conducted to delineate NAPL and dissolved plume at the site?
14. Cost Data Availability
a) No cost data available b) Some cost data available
Was a cost and performance report written?
c) Extensive cost data available
Was a cost and performance report written?
15. Above ground treatment system.
A. Major aboveground system components
B. Were there any equipment failures during system operation?
C. How much DNAPL was collected in the knock-out tank?
D. Approximately how much liquid was extracted from the system

E. How were the liquid phases handled, treated, disposed?
F. Extracted NAPL mass
G. Water monitoring and NPDES requirements?
H. Air monitoring and discharge requirements?
I. Activated carbon requirements?
15 Confirm impression of impact of thermal technology on life-cycle costs
a) Technology definitely decreased life-cycle cost of project b) Technology probably reduced life-cycle cost of project c) Technology had no impact on life-cycle cost of project d) Technology increased life-cycle cost of project e) Unknown For all the above, what is the basis of this impression?
16. Confirm answers to the below questions:
a) Was the thermal technology selected in a feasibility study or corrective measures study?
b) Was the thermal technology selected as an interim action?
c) Was the thermal technology selected as a technology demonstration?

d) Did your regulators suggest or encourage use of the thermal technology selected? If so, how was the selection encouraged?
e) Was the technology selected based on vendor marketing efforts?
If so, what were the primary issues that aided the selection?
f) Knowing project results, would you use the selected thermal technology again?
g) Knowing project results, would you select a different thermal technology? h) Knowing project results, would you select a non-thermal technology?
i) Are you willing to participate further in this thermal technology
evaluation?
j) Are you willing to share cost data for use in this life cycle cost evaluation
of thermal technology enhancements?

Thermal Enhancement for the Cost-Effective Remediation of NAPLs Questionnaire #2
1. Organization Name: U.S. Air Force /Lockheed 2. Facility Name: Air Force Plant 4 3. Facility Location: Texas 4. Facility POC (Name, phone, fax, e-mail): George Walters (937) 255-1988 [email protected] 5. Confirm type of source area:
a) Fuel Hydrocarbon LNAPL: b) Chlorinated Solvent DNAPL: 100% TCE from 20,000 gallon tank leak c) Chlorinated Solvent dissolved in Fuel Hydrocarbon (LNAPL) d) Other (please explain)
6. Confirm type of thermal technology employed:
a) Steam injection b) Electrical Resistive Heating: Pilot test used 6 phase while full-scale system used 3 phase. Three phase heating was recommended due to more uniform distribution of heat. Three phase electrodes can be arranged in linear arrays, while 6 phase requires a hexagonal array. c) Conductive Heating d) Radio-Frequency Heating e) Hot water injection f) Thermal Enhancement for SVE (hot air, 6-phase, etc) g) Deep soil mixing with steam injection h) Other (please explain)
7. Identify the vendor/contractor: URS and Thermal Remediation Services 8. Project Scale
a) Pilot Scale: b) Full Scale: Yes
Was a pilot study conducted before going full-scale: Yes
What was the aerial extent and depth of contamination: One-half acre inside an active aircraft parts production building. Area was 150’ by 150’ by 35 feet deep (bedrock at 35’).

9. Project status a) Planning (including design) b) In situ treatment is ongoing c) Post-treatment monitoring d) Long-term monitoring e) Complete Soil did not heat sufficiently in all areas due to highly conductive soils. Heated soils for total of 30 weeks, and 10 months later, groundwater temperature was still 30 - 50ºC. The SVE system is still in operation. The 6 phase pilot test cost $800,000 and the 3 phase full-scale system cost $2.3MM. These costs do not include the SVE system that was already in place. Total recoveries for the pilot and full scale system were 330# and 1400# TCE, respectively.
10. Confirm impression of success
a) Project was a failure: No
b) Project was somewhat successful: No c) Project was very successful: Yes
Why was it considered successful? It was cheaper than pump and treat. The facility estimated costs for P&T at $6,000 per pound TCE removed and for thermal enhancement at $1100 per pound. Also met the soil clean up RAO of 11.4 mg/kg as measured by post-heating soil samples.
What was the percent of mass removed? Unclear What was the percent reduction in mass flux? Has not been measured as site is still to hot to sample. Is there residual ground water contamination? Yes
What was the percent reduction in ground water concentrations? Limited sampling of hottest well showed a decrease in TCE concentration from 180 mg/l to 8 mg/l. Other wells had TCE ranging from 100 to 200 mg/l before heating and decreased to an average of 22 mg/L after heating. Was rebound measured? Have not collected sufficient post-heating samples to determine, but facility believes rebound is occurring.
d) Is long-term monitoring planned? Yes
Have regulators agreed upon the success of the treatment? Yes, they have agreed that the source zone soils meet the RAOs.

Was this treatment applied at a full scale that could lead to a site closure? Yes. The site has met the soil RAOs. The RAO of 10,000 µg/L in source area had not been met at all locations. The RAO of 400 µg/L in dissolved plume (within the building and adjoining parking lot) and off-site RAO of 5µg/L should be met within 15 years of pump and treat. Have stakeholders approved the site closure followed by the remediation? Yes, public appears satisfied with results, but AF Plant 4 employees 16,000 people from the surrounding community.
11. What is the lithology of the site?
a) Geology: Heterogeneous, homogenous, or moderately homogeneous? Up to 20’ of fill material sitting over limestone bedrock, which occurs at 20’ to 35’ bgs. 1) Sand 2) Silt 3) Clay 4) Sedimentary 5) Gravel 6) Till 7) Unconsolidated 8) Metamorphic 9) Igneous 10) Consolidated 11) Other 12) Unknown
b) Hydrogeology:
1) Average depth to groundwater at the site? 32‘ 2) Confined or unconfined. Unconfined 3) Vertical profile depth(s) of confining layer(s)? see above 4) Is there significant fracturing of the bedrock? No 5) Is there a significant seasonal fluctuation in groundwater table? No 6) Is the geology significantly impacted by precipitation (i.e. sandy and very
permeable)? No, the site is inside a building.
c) Aboveground buildings or permanent structures Are there aboveground structures that could interfere with the thermal treatment? Yes, the site is inside an active aircraft parts production building that contains numerous ASTs, dip lines and industrial processes.

12. What was the nature of NAPL at the site? a) Was NAPL mobile, immobile residual, other? Have not found mobile
NAPL at the site. b) Was the entire area impacted by NAPL addressed by the project? No. Uneven heating left a small portion of the source area unheated.
If not, was the NAPL impacted area adequately characterized? Yes, but complete characterization was difficult due to interference with equipment.
c) Was characterization satisfactorily conducted to delineate NAPL and
dissolved plume at the site? Yes
13. Cost Data Availability
a) No cost data available b) Some cost data available c) Extensive cost data available
Was a cost and performance report written? Yes, but data is fairly recent and is being compiled into a Final Report.
14. Above ground treatment system.
a) Major aboveground system components: Existing SVE system, condenser,
catalytic oxidizer (that was required in ROD but was not actually used), air stripper and GAC sorbers for vapor and liquid streams.
b) Were there any equipment failures during system operation? A few crossed
wires for heating system (almost killed project). System ran well after completed installation, and URS/TRS did a good job.
c) How much DNAPL was collected in the knock-out tank? None d) Approximately how much liquid was extracted from the system? System ran at
90 gpm for a total of 191,000 gallons. Only recovered 1.2# TCE from this 191,000 gallons.
e) How were the liquid phases handled, treated, disposed? Through an air stripper then GAC polish. Treated water was sent to the sanitary sewer.
f) Extracted NAPL mass: None

g) Water monitoring and NPDES requirements: No, discharge limits were set and system operated within those limits.
h) Air monitoring and discharge requirements: Used continuous air monitoring to meet OSHA breathing air limits (labor health and safety issue) within the building. The air stripper was not monitored, but the vapor phase GAC was. The total emission limit was 3# TCE per day.
i) Activated carbon requirements: No data was provided.
15 Confirm impression of impact of thermal technology on life-cycle costs
a) Technology definitely decreased life-cycle cost of project b) Technology probably reduced life-cycle cost of project: Based on life-cycle cost
of pump and treat versus 3 phase heating. c) Technology had no impact on life-cycle cost of project d) Technology increased life-cycle cost of project e) Unknown
16. Confirm answers to the below questions:
a) Was the thermal technology selected in a feasibility study or corrective measures study? No, ROD stipulated surfactant flushing with an unnamed innovative technology as a contingency. Pilot testing of surfactant flushing failed, and the regulators were flexible and agreed to soil heating.
b) Was the thermal technology selected as an interim action? No c) Was the thermal technology selected as a technology demonstration? No d) Did your regulators suggest or encourage use of the thermal technology selected?
Not really, facility proposed technology and regulators accepted. e) Was the technology selected based on vendor marketing efforts? No, the facility
sought out the technology and the contractor. f) Knowing project results, would you use the selected thermal technology again?
Would not recommend soil heating at this site, would rather have installed a high vacuum, dual-phase SVE system.
g) Knowing project results, would you select a different thermal technology? Yes
at a similar site, but would heat to much higher temperatures (600ºC) to thermally destruct/vitrify the contaminants.
h) Knowing project results, would you select a non-thermal technology? Yes, for
this site. See answer for question 16f.

i) Are you willing to participate further in this thermal technology evaluation? Yes j) Are you willing to share cost data for use in this life cycle cost evaluation of
thermal technology enhancements? Yes

Thermal Enhancement for the Cost-Effective Remediation of NAPLs Questionnaire #2
1. Organization Name: U.S. Air Force 2. Facility Name: Edwards AFB 3. Facility Location: California 4. Facility POC (Name, phone, fax, e-mail): Steven Watts (661) 277-1443 [email protected] 5. Confirm type of source area:
a) Fuel Hydrocarbon LNAPL b) Chlorinated Solvent DNAPL c) Chlorinated Solvent dissolved in Fuel Hydrocarbon (LNAPL) No evidence of DNAPL. Fuel NAPL only – no TCE dissolved in NAPL. Dissolved plume is all TCE d) Other (please explain)
6. Confirm type of thermal technology employed:
a) Steam injection High vacuum extraction with concurrent steam and compressed air injection. b) Electrical Resistive Heating c) Conductive Heating d) Radio-Frequency Heating e) Hot water injection f) Thermal Enhancement for SVE (hot air, 6-phase, etc) g) Deep soil mixing with steam injection h) Other (please explain)
7. Identify the vendor/contractor. Steam Tech – Bakersfield, CA 8. Project Scale
a) Pilot Test Aerial extent and depth of contamination for the pilot test 900 SF test area with 60’ depth. GW at 32’. HVAC radius of influence = 140’ 1 steam injection well, 4 SVE wells. Dissolved phase plume size is 40 acres. Will the project go to full scale? No

If not planning to go to full scale, why? Regulators did not require clean up to MCLs due to lack of sensitive receptors near the site (Edwards AFB). Mr. Watts was unsure whether he would recommend thermal enhancement if treatment to MCLs was required. He did believe the cost of thermal enhancement would be less in the long run than pump and treat, but the capitol cost of steam injection would make it difficult to obtain the funding. He added that if funding the capitol cost was possible and treatment to MCLs was required, he would probably recommend steam injection thermal enhancement of SVE.
9. Project status
a) Planning (including design) b) In situ treatment is ongoing c) Post-treatment monitoring d) Long-term monitoring e) Complete
10. Confirm impression of success
a) Project was a failure: No
b) Project was somewhat successful: No
c) Project was very successful Why was it considered successful? Pilot test showed recovery TCE and petroleum hydrocarbons in fractured bedrock. The pilot study performed as was expected, was the first known study performed in fractured bedrock, and the total project cost ($525,000) was within the expected budget. Total recoveries included 250 # diesel-range LNAPL and 2000# total VOCs in the off gas. Off gas constituency was 280# TCE, 370# other VOCs, and 1350# petroleum hydrocarbons. Approximately 99% of the total hydrocarbon recovery (not including the LNAPL) was in the vapor phase. Only about 1% of the recovery was in the non-NAPL liquid phase. Achieved > 100ºC in 2 extraction wells and >80ºC in other 2 extraction wells and soil temperatures in excess of 100ºC within portions of the test area and >40ºC throughout the test area. Operational time of the test was 60 days. What was the percent of mass removed? Initial mass was not estimated so the mass removal could not be quantified What was the percent reduction in mass flux? Not quantified Is there residual ground water contamination? Yes
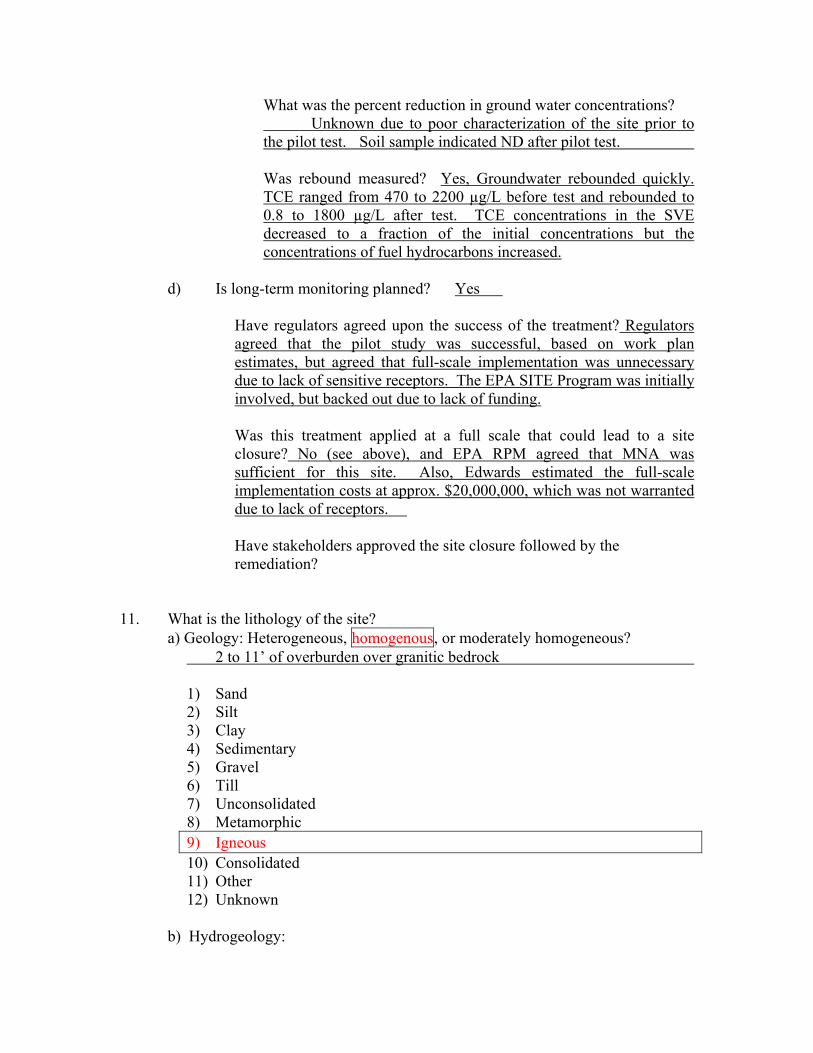
What was the percent reduction in ground water concentrations? Unknown due to poor characterization of the site prior to the pilot test. Soil sample indicated ND after pilot test. Was rebound measured? Yes, Groundwater rebounded quickly. TCE ranged from 470 to 2200 µg/L before test and rebounded to 0.8 to 1800 µg/L after test. TCE concentrations in the SVE decreased to a fraction of the initial concentrations but the concentrations of fuel hydrocarbons increased.
d) Is long-term monitoring planned? Yes
Have regulators agreed upon the success of the treatment? Regulators agreed that the pilot study was successful, based on work plan estimates, but agreed that full-scale implementation was unnecessary due to lack of sensitive receptors. The EPA SITE Program was initially involved, but backed out due to lack of funding. Was this treatment applied at a full scale that could lead to a site closure? No (see above), and EPA RPM agreed that MNA was sufficient for this site. Also, Edwards estimated the full-scale implementation costs at approx. $20,000,000, which was not warranted due to lack of receptors.
Have stakeholders approved the site closure followed by the remediation?
11. What is the lithology of the site?
a) Geology: Heterogeneous, homogenous, or moderately homogeneous? 2 to 11’ of overburden over granitic bedrock 1) Sand 2) Silt 3) Clay 4) Sedimentary 5) Gravel 6) Till 7) Unconsolidated 8) Metamorphic 9) Igneous 10) Consolidated 11) Other 12) Unknown
b) Hydrogeology:

1) Average depth to groundwater at the site? 32’ 2) Confined or unconfined. Unconfined 3) Vertical profile depth(s) of confining layer(s)? see above 4) Is there significant fracturing of the bedrock? Yes 5) Is there a significant seasonal fluctuation in groundwater table?
Minimal (< 0.1’) due to desert location 6) Is the geology significantly impacted by precipitation (i.e. sandy and very
permeable)? No, desert location
c) Aboveground buildings or permanent structures Are there aboveground structures that could interfere with the thermal treatment? No
12. What was the nature of NAPL at the site? a) Was NAPL mobile, immobile residual, other? Unsure. Did not know
NAPL existed until it was mobilized by steam during pilot test? NAPL was likely immobile under natural conditions. No DNAPL was indicated.
b) Was the entire area impacted by NAPL addressed by the project? No,
entire source area is approx 4 acres, and pilot affected only 900 SF with steam injection and approx 1 acre with SVE
If not, was the NAPL impacted area adequately characterized? No
c) Was characterization satisfactorily conducted to delineate NAPL and
dissolved plume at the site? Unclear
13. Cost Data Availability
a) No cost data available b) Some cost data available c) Extensive cost data available
Was a cost and performance report written? No but data could be gathered. Contractor developed scale-up costs based on 5 acres implementation. Cost were $3.8MM/acre for 100’ depth and $5.5MM/ acre for 200’ depth. An economy of scale would be realized for greater than 5 acres.
14. Above ground treatment system.
a) Major aboveground system components: Trailer mounted boiler, positive displacement vacuum pump, liquid/vapor separator, heat exchanger, NAPL and water tanks, GAC sorbers for liquid and vapor streams.

b) Were there any equipment failures during system operation? No other than SVE well plugging due to poorly developed wells.
c) How much DNAPL was collected in the knock-out tank? No DNAPL was
collected. All TCE came out in vapor phase with less than 1% TCE recovered in dissolved phase.
d) Approximately how much liquid was extracted from the system? 43,000 gallons
of water, as steam, was injected, and 110,000 gallons of water was extracted
e) How were the liquid phases handled, treated, disposed? Treated through GAC sorbers and discharged to sanitary sewer system
f) Extracted NAPL mass: 250#
g) Water monitoring and NPDES requirements: Discharge limits were set for discharge to sanitary sewer
h) Air monitoring and discharge requirements: No permit was required. Discharge limits were set for exhaust from GAC sorbers
i) Activated carbon requirements: 21,000 #
15 Confirm impression of impact of thermal technology on life-cycle costs
a) Technology definitely decreased life-cycle cost of project b) Technology probably reduced life-cycle cost of project c) Technology had no impact on life-cycle cost of project d) Technology increased life-cycle cost of project e) Unknown
16. Confirm answers to the below questions:
a) Was the thermal technology selected in a feasibility study or corrective measures study? No
b) Was the thermal technology selected as an interim action? Yes c) Was the thermal technology selected as a technology demonstration? Initially,
but SITE Program funding did not come through. d) Did your regulators suggest or encourage use of the thermal technology selected?
Yes If so, how was the selection encouraged?

e) Was the technology selected based on vendor marketing efforts? No If so, what were the primary issues that aided the selection?
f) Knowing project results, would you use the selected thermal technology again?
No, regulators did not force clean up to MCLs, so technology was unnecessary.
g) Knowing project results, would you select a different thermal technology? No h) Knowing project results, would you select a non-thermal technology? Yes i) Are you willing to participate further in this thermal technology evaluation? Yes j) Are you willing to share cost data for use in this life cycle cost evaluation of
thermal technology enhancements? Yes

Thermal Enhancement for the Cost-Effective Remediation of NAPLs Questionnaire #2
1. Organization Name: U.S. Army 2. Facility Name: Fort Richardson 3. Facility Location: Alaska 4. Facility POC (Name, phone, fax, e-mail): Scott Kendall (907) 753-5661 [email protected] 5. Confirm type of source area:
a) Fuel Hydrocarbon LNAPL b) Chlorinated Solvent DNAPL Used DANC to clean up chemical weapons identification kits and dilute mustard gas. DANC contains 1,1,2,2-tetrachloroethane. DNAPL was indicated in on-site well. Very little TCE in soil before soil heating. c) Chlorinated Solvent dissolved in Fuel Hydrocarbon (LNAPL) d) Other (please explain)
6. Confirm type of thermal technology employed:
a) Steam injection b) Electrical Resistive Heating 6 Phase heating in two phases, the first using 3 separate arrays and the second using a more linear arrangement of 3 arrays. c) Conductive Heating d) Radio-Frequency Heating e) Hot water injection f) Thermal Enhancement for SVE (hot air, 6-phase, etc) g) Deep soil mixing with steam injection h) Other (please explain)
7. Identify the vendor/contractor. Current Environmental Solutions 8. Project Scale
a) Pilot Test b) Full Scale
Was a pilot study conducted before going full scale? Yes, using first array. Two more arrays conducted during first phase and three more during second phase. What was the aerial extent and depth of contamination system? One acre total for both phases with 40 depth. GW at 20’. Heated soil from 8’ to 40’ bgs.

9. Project status
a) Planning (including design) b) In situ treatment is ongoing c) Post-treatment monitoring d) Long-term monitoring e) Complete Two summers of treatment. Conducted three arrays for six weeks each in 1997 and three arrays concurrently for 9 weeks each in 1998. Soil reached desired temperature within 10 days of heating. Total cost was $3MM. Used diesel generator in 1997, which used 400 – 700 gallons fuel per day. Brought in municipal power in 1998, which cost $30,000 per month.
10. Confirm impression of success
a) Project was a failure: No
b) Project was somewhat successful: No
c) Project was very successful Why was it considered successful? Goal was removal of source mass and meeting RAOs as established in ROD. Many post-heating soil samples met the RAOs (did not meet RAOs everywhere), and decreases in soil contaminant levels were from over 1000 mg/kg to non-detect. System recovered 1385# total VOCs (primarily TCE which is breakdown product that occurs when heating 1,1,2,2-TCA) in vapor phase and 65# in condensate. What was the percent of mass removed? Not completely clear, but when one outlying soil sample was not included in calculation, achieved 90-95% removal. If the one outlying sample is included, removal was 40 - 50%. What was the percent reduction in mass flux? Not quantified Is there residual ground water contamination? Yes
What was the percent reduction in ground water concentrations? 40 – 60% reduction in GW right after treatment. Was rebound measured? Yes No significant rebound compared to samples collected immediately after treatment.
d) Is long-term monitoring planned? Yes

Have regulators agreed upon the success of the treatment? Regulators agreed that source area treatment was complete, and MNA or TI is acceptable for dissolved GW plume. Was this treatment applied at a full scale that could lead to a site closure? Yes. Regulators agreed to MNA (or TI) with source control as data shows plume to be stable.
Have stakeholders approved the site closure followed by the remediation? RAB has shown little interest in this site.
11. What is the lithology of the site?
a) Geology: Heterogeneous, homogenous, or moderately homogeneous? Tight glacial till. 1) Sand 2) Silt 3) Clay 4) Sedimentary 5) Gravel 6) Till 7) Unconsolidated 8) Metamorphic 9) Igneous 10) Consolidated 11) Other 12) Unknown
b) Hydrogeology:
1) Average depth to groundwater at the site? 20’ 2) Confined or unconfined. Confined by dense till at 40’ 3) Vertical profile depth(s) of confining layer(s)? see above 4) Is there significant fracturing of the bedrock? NA 5) Is there a significant seasonal fluctuation in groundwater table?
Minimal 6) Is the geology significantly impacted by precipitation (i.e. sandy and very
permeable)? No
c) Aboveground buildings or permanent structures Are there aboveground structures that could interfere with the thermal treatment? No

12. What was the nature of NAPL at the site? a) Was NAPL mobile, immobile residual, other? Had mobile NAPL, primarily
1,1,2,2-TCA. b) Was the entire area impacted by NAPL addressed by the project? Yes c) Was characterization satisfactorily conducted to delineate NAPL and
dissolved plume at the site? Yes, source area well defined with a large dissolved plume.
13. Cost Data Availability
a) No cost data available: b) Some cost data available: Will have to work to get the data. Was a cost and performance report written? No c) Extensive cost data available:
14. Above ground treatment system.
a) Major aboveground system components: Three rows of eight galvanized steel
electrodes, a positive displacement blower, heat exchanger, and a knockout tank. b) Were there any equipment failures during system operation? In 1997 (pilot test),
technology was not all sorted out. Had quite a bit of stray voltages, particularly at the surrounding fence. No significant problems in 1998.
c) How much DNAPL was collected in the knock-out tank? None d) Approximately how much liquid was extracted from the system? Around
80,000 gallons extracted (poor monitoring) and about 29,000 re-injected around electrodes to keep the soil hydrated.
e) How were the liquid phases handled, treated, disposed? Condensed water was sent to a spray tower where it was completely evaporated. Some of water was used to hydrate electrodes and was not sent to the spray tower. No water was discharged from system.
f) Extracted NAPL mass: None.
g) Water monitoring and NPDES requirements: No water was discharged from system. No permit was required.
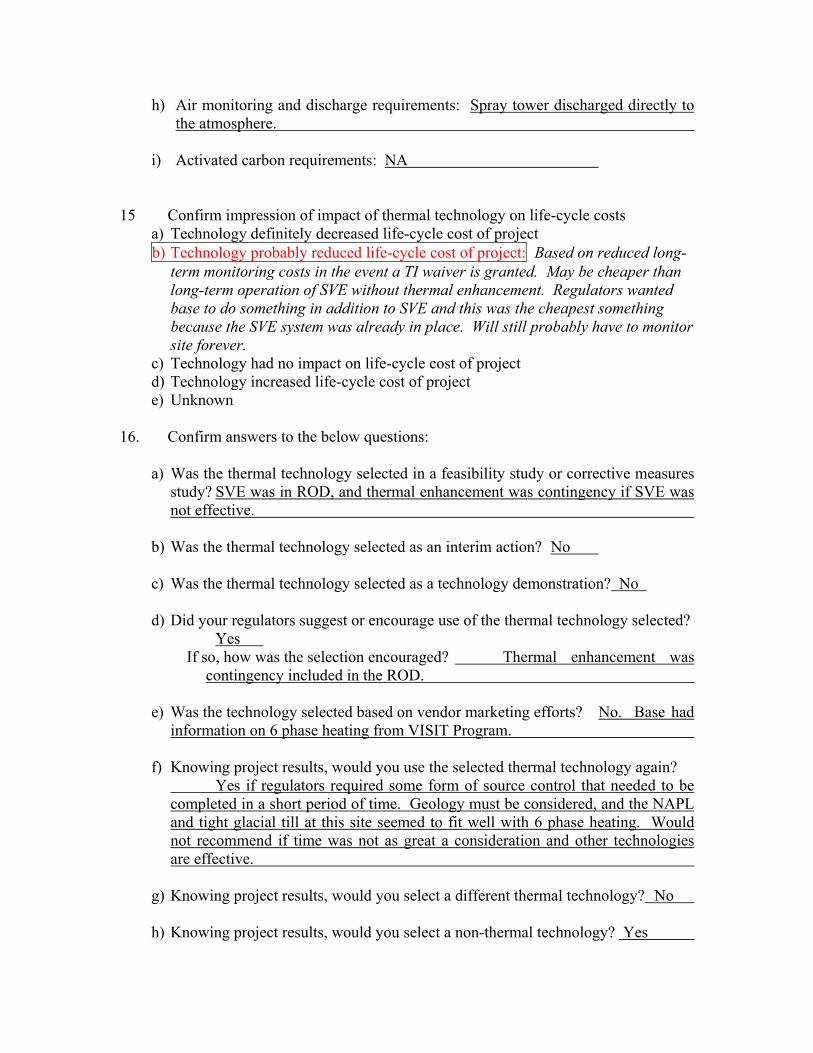
h) Air monitoring and discharge requirements: Spray tower discharged directly to the atmosphere.
i) Activated carbon requirements: NA
15 Confirm impression of impact of thermal technology on life-cycle costs
a) Technology definitely decreased life-cycle cost of project b) Technology probably reduced life-cycle cost of project: Based on reduced long-
term monitoring costs in the event a TI waiver is granted. May be cheaper than long-term operation of SVE without thermal enhancement. Regulators wanted base to do something in addition to SVE and this was the cheapest something because the SVE system was already in place. Will still probably have to monitor site forever.
c) Technology had no impact on life-cycle cost of project d) Technology increased life-cycle cost of project e) Unknown
16. Confirm answers to the below questions:
a) Was the thermal technology selected in a feasibility study or corrective measures study? SVE was in ROD, and thermal enhancement was contingency if SVE was not effective.
b) Was the thermal technology selected as an interim action? No c) Was the thermal technology selected as a technology demonstration? No d) Did your regulators suggest or encourage use of the thermal technology selected?
Yes If so, how was the selection encouraged? Thermal enhancement was
contingency included in the ROD. e) Was the technology selected based on vendor marketing efforts? No. Base had
information on 6 phase heating from VISIT Program.
f) Knowing project results, would you use the selected thermal technology again? Yes if regulators required some form of source control that needed to be completed in a short period of time. Geology must be considered, and the NAPL and tight glacial till at this site seemed to fit well with 6 phase heating. Would not recommend if time was not as great a consideration and other technologies are effective.
g) Knowing project results, would you select a different thermal technology? No h) Knowing project results, would you select a non-thermal technology? Yes

i) Are you willing to participate further in this thermal technology evaluation? Yes j) Are you willing to share cost data for use in this life cycle cost evaluation of
thermal technology enhancements? Yes

Thermal Enhancement for the Cost-Effective Remediation of NAPLs Questionnaire #2
1. Organization Name: Lowry Landfill 2. Facility Name: Lowry Landfill 3. Facility Location: Colorado 4. Facility POC (Name, phone, fax, e-mail): Bill Plaehn (303) 831-8100 [email protected] 5. Confirm type of source area:
a) Fuel Hydrocarbon LNAPL: Observed LNAPL layer with little dissolved CAHs, but CAHs may be from other disposal pits at landfill. b) Chlorinated Solvent DNAPL c) Chlorinated Solvent dissolved in Fuel Hydrocarbon (LNAPL) d) Other (please explain)
6. Confirm type of thermal technology employed:
a) Steam injection b) Electrical Resistive Heating: Three phase heating was recommended due to more uniform distribution of heat over a larger area. c) Conductive Heating d) Radio-Frequency Heating e) Hot water injection f) Thermal Enhancement for SVE (hot air, 6-phase, etc) g) Deep soil mixing with steam injection h) Other (please explain)
7. Identify the vendor/contractor: Thermal Remediation Services 8. Project Scale
a) Pilot Scale: b) Full Scale: Yes
Was a pilot study conducted before going full-scale: No
What was the aerial extent and depth of contamination: 0.7 acres with depth of 30’. Target depth for heating was 8’ to 30’ bgs.
9. Project status
a) Planning (including design) b) In situ treatment is ongoing

c) Post-treatment monitoring d) Long-term monitoring e) Complete The target disposal pit was one of 70 at the landfill. The debris/soil in this pit was highly conductive due to buried metallic debris, and this led to some non-uniform heating. The system ran for 300 days, which was longer than anticipated, and the average soil temperature reached 84ºC. Portions of system, particularly the PVC wells, were deteriorating because of the prolonged operation. The system reached asymptotic removal rates in the 300 days operation. Total VOCs, particularly acetone and MEK, in the SVE stream increased during operation. This was thought due to heating contaminants in an anoxic environment.
10. Confirm impression of success
a) Project was a failure: No
b) Project was somewhat successful: Yes
Why was it considered successful? Soils at the site reached the endpoint criteria for xylene, as was initially established by EPA. EPA also agreed to performance based criteria, which included asymptotic removal rates and temperature goals. The system achieved a 50% reduction in the concentration of xylene. The method of calculating the reduction had been accepted by EPA prior to the start of the project. EPA agreed that reaching a 50% reduction, the site could be closed by simply capping the disposal pit.
What was the percent of mass removed? 50% What was the percent reduction in mass flux? Unclear Is there residual ground water contamination? Yes
What was the percent reduction in ground water concentrations? Ranged from 75% to 85% after heating. Was rebound measured? No and EPA did not require.
c) Project was very successful: No
d) Is long-term monitoring planned? Yes
Have regulators agreed upon the success of the treatment? No, EPA reneged on earlier agreement that if 50% reduction was met, the site could be capped and closed (EPA used a different averaging technique than the earlier agreement and did not entirely agree with the 50%

number). They required Lowry to complete a focused Feasibility Study. Was this treatment applied at a full scale that could lead to a site closure? No, because EPA disagreed with 50% reduction and required a feasibility study. Have stakeholders approved the site closure followed by the remediation? The public liked the technology and the results, but wanted the system to operate for a longer period of time.
11. What is the lithology of the site?
a) Geology: Heterogeneous, homogenous, or moderately homogeneous? Man made pit filled with miscellaneous debris. There are some spotty and discontinuous clay lenses that occurred when the waste was moved around within the pit and native soils were mixed in during the moving. 1) Sand 2) Silt 3) Clay 4) Sedimentary 5) Gravel 6) Till 7) Unconsolidated 8) Metamorphic 9) Igneous 10) Consolidated 11) Other Miscellaneous debris from landfill operations. 12) Unknown
b) Hydrogeology:
1) Average depth to groundwater at the site? 15’ – 16’‘ 2) Confined or unconfined. Unconfined 3) Vertical profile depth(s) of confining layer(s)? see above 4) Is there significant fracturing of the bedrock? NA 5) Is there a significant seasonal fluctuation in groundwater table? Unclear 6) Is the geology significantly impacted by precipitation (i.e. sandy and very
permeable)? No, the existing cap is impermeable.
c) Aboveground buildings or permanent structures Are there aboveground structures that could interfere with the thermal treatment? No

12. What was the nature of NAPL at the site? a) Was NAPL mobile, immobile residual, other? Mobile petroleum
hydrocarbons with some dissolved CAHs. There was liquid product in some wells.
b) Was the entire area impacted by NAPL addressed by the project? Yes c) Was characterization satisfactorily conducted to delineate NAPL and
dissolved plume at the site? Yes
13. Cost Data Availability
a) No cost data available b) Some cost data available c) Extensive cost data available Yes, but client may not want to share data.
Was a cost and performance report written? No 14. Above ground treatment system.
a) Major aboveground system components: Engineered cap, venting layer, SVE
vacuum blower, condensate/knockout tank, two flameless thermal oxidizers with HCL scrubbers, and water storage tanks.
b) Were there any equipment failures during system operation? The HCL
scrubbers of the FTOs were problematic, several of the electrodes corroded prematurely, PVC wells softened, and some valve seal materials swelled as they were incompatible with site contaminants.
c) How much NAPL was collected in the knock-out tank? 12,000 gallons, also
recovered 17,000 kg from vapor stream. d) Approximately how much liquid was extracted from the system? EPA required
recycling of the extracted water. The water was used to wet the soils around the electrodes to maintain conductivity. Over 900,000 gallons of water was extracted and most of it was handled in this manner. Some 177,000 gallons of the extracted water contained percentile levels of contaminant. This water was incinerated.
e) How were the liquid phases handled, treated, disposed? See above
f) Water monitoring and NPDES requirements: No, most of the water was recycled, and the rest was incinerated.

g) Air monitoring and discharge requirements: Emission limits were established and system operated within limits.
h) Activated carbon requirements: Not applicable
15 Confirm impression of impact of thermal technology on life-cycle costs
a) Technology definitely decreased life-cycle cost of project b) Technology probably reduced life-cycle cost of project: c) Technology had no impact on life-cycle cost of project: Lowry landfill has 70
disposal pits, many of which contribute to the dissolved plume. Thermal enhancement at one of 70 pits had no impact to overall site remediation.
d) Technology increased life-cycle cost of project e) Unknown
16. Confirm answers to the below questions:
a) Was the thermal technology selected in a feasibility study or corrective measures study? No, ROD required an innovative technology that was as close as possible to excavation, ostensibly because of concerns over air emissions. ROD initially required that three pits be excavated, but air emissions were a problem during excavation of first pit.
b) Was the thermal technology selected as an interim action? No c) Was the thermal technology selected as a technology demonstration? Yes d) Did your regulators suggest or encourage use of the thermal technology selected?
Absolutely. EPA felt that thermally enhanced SVE was most similar to excavation.
e) Was the technology selected based on vendor marketing efforts? No, Parsons
sought out the technology and the contractor. f) Knowing project results, would you use the selected thermal technology again?
Yes, at an appropriate site. g) Knowing project results, would you select a different thermal technology? No h) Knowing project results, would you select a non-thermal technology? No i) Are you willing to participate further in this thermal technology evaluation? Yes j) Are you willing to share cost data for use in this life cycle cost evaluation of
thermal technology enhancements? Need to get client’s approval.

Thermal Enhancement for the Cost-Effective Remediation of NAPLs Questionnaire #2
1. Organization Name: U.S. Air National Guard 2. Facility Name: Niagara Falls ANG Station 3. Facility Location: New York 4. Facility POC (Name, phone, fax, e-mail): Gerald Hromowyk (716) 236-3126 [email protected] 5. Confirm type of source area:
a) Fuel Hydrocarbon LNAPL: b) Chlorinated Solvent DNAPL: TCE with little JP4 and some cis-1,2-,DCE c) Chlorinated Solvent dissolved in Fuel Hydrocarbon (LNAPL) d) Other (please explain)
6. Confirm type of thermal technology employed:
a) Steam injection: b) Electrical Resistive Heating: Six phase heating of 6’ – 10’ overburden. Used 40-mil liner over high-permeability layer on top of ground surface to extract soil vapors. c) Conductive Heating d) Radio-Frequency Heating e) Hot water injection f) Thermal Enhancement for SVE (hot air, 6-phase, etc) g) Deep soil mixing with steam injection h) Other (please explain)
7. Identify the vendor/contractor: Battelle/Montgomery Watson 8. Project Scale
a) Pilot Scale: b) Full Scale: Yes
Was a pilot study conducted before going full-scale: No
What was the aerial extent and depth of contamination: 100’ diameter fire training pit, 8 - 10’ depth.
9. Project status
a) Planning (including design) b) In situ treatment is ongoing

c) Post-treatment monitoring d) Long-term monitoring e) Complete Used four 6 phase arrays. Heated soil for 40 days and the cost of the project was $700,000.
10. Confirm impression of success
a) Project was a failure: No
b) Project was somewhat successful: No c) Project was very successful: Yes
Why was it considered successful? Total VOCs in overburden decreased dramatically (benzene from 540 mg to 20 mg) and recovered 59.75 kg of CAHs, including 43.5 kg TCE, 16.12 kg cis-1,2-DCE. Also recovered 4.6 kg of benzene.
What was the percent of mass removed? Unclear as initial mass was not known. What was the percent reduction in mass flux? Unclear Is there residual ground water contamination? Yes
What was the percent reduction in ground water concentrations? Approximately 90%: 120 mg/l total VOCs reduced to 10 mg/l. Was rebound measured? Yes What were the results of the rebound tests? One well near the source area that had 150 mg/l total VOCs in 1996 showed a reduction to 20 mg/l in 2000.
d) Is long-term monitoring planned? Yes
Have regulators agreed upon the success of the treatment? Regulators agreed that overburden meets cleanup criteria, but groundwater in fractured bedrock still must be addressed. Was this treatment applied at a full scale that could lead to a site closure? No, because no attempt was made to impact bedrock.

Have stakeholders approved the site closure followed by the remediation? Not much involvement from public. Love Canal is only 5 miles away, so public not too concerned about a little TCE and JP4.
11. What is the lithology of the site?
a) Geology: Heterogeneous, homogenous, or moderately homogeneous? Six to ten feet of clay with little sand overlying fractured dolomite bedrock. 1) Sand 2) Silt 3) Clay 4) Sedimentary 5) Gravel 6) Till 7) Unconsolidated 8) Metamorphic 9) Igneous 10) Consolidated 11) Other 12) Unknown
b) Hydrogeology:
1) Average depth to groundwater at the site? 6’ 2) Confined or unconfined. Unconfined 3) Vertical profile depth(s) of confining layer(s)? see above 4) Is there significant fracturing of the bedrock? Moderate 5) Is there a significant seasonal fluctuation in groundwater table? No 6) Is the geology significantly impacted by precipitation (i.e. sandy and very
permeable)? No, clayey soils are little influenced by precipitation.
c) Aboveground buildings or permanent structures Are there aboveground structures that could interfere with the thermal treatment? No
12. What was the nature of NAPL at the site? a) Was NAPL mobile, immobile residual, other? Only slightly mobile
TCE with some/little JP4. Free phase plume has migrated less than 100’ beyond perimeter of fire training pit. No indications of deeper DNAPL in 52’ deep well.
b) Was the entire area impacted by NAPL addressed by the project? Yes

c) Was characterization satisfactorily conducted to delineate NAPL and dissolved plume at the site? A cut-off trench was installed about 200 feet downgradient of the fire training pit. The dissolved plume is controlled by the trench.
13. Cost Data Availability
a) No cost data available b) Some cost data available: Total project cost was approximately $700,000.
Was a cost and performance report written? No c) Extensive cost data available
14. Above ground treatment system.
a) Major aboveground system components: Six phase array, surface SVE system,
knockout tank, and liquid phase GAC sorbers. No off gas treatment. b) Were there any equipment failures during system operation? One GAC
container collapsed upon start up. System was reconfigured with GAC on pressure side of vacuum blower, and no problems after that.
c) How much NAPL was collected in the knock-out tank? None d) Approximately how much liquid was extracted from the system? Data was not
recorded as water was treated through carbon and discharged to the sanitary sewer.
e) How were the liquid phases handled, treated, disposed? See above.
f) Water monitoring and NPDES requirements: No, see above.
g) Air monitoring and discharge requirements: No
h) Activated carbon requirements: A couple of 55-gallons drums
15 Confirm impression of impact of thermal technology on life-cycle costs
a) Technology definitely decreased life-cycle cost of project b) Technology probably reduced life-cycle cost of project: No detailed assessment,
just his gut feel. c) Technology had no impact on life-cycle cost of project: d) Technology increased life-cycle cost of project: e) Unknown

16. Confirm answers to the below questions:
a) Was the thermal technology selected in a feasibility study or corrective measures study? No
b) Was the thermal technology selected as an interim action? Yes c) Was the thermal technology selected as a technology demonstration? Yes d) Did your regulators suggest or encourage use of the thermal technology selected?
No, the Air Force was interested in the technology so the regulators allowed it to be implemented at the site as an IRM.
e) Was the technology selected based on vendor marketing efforts? No,
Montgomery Watson was site contractor and were able to bring technology to site.
f) Knowing project results, would you use the selected thermal technology again?
Not for bedrock. But thought technology offered faster remediation of vadose zone that simple SVE.
g) Knowing project results, would you select a different thermal technology? No, 6
phase worked well for overburden. h) Knowing project results, would you select a non-thermal technology? Yes, for
bedrock. i) Are you willing to participate further in this thermal technology evaluation? Yes j) Are you willing to share cost data for use in this life cycle cost evaluation of
thermal technology enhancements? Yes

Thermal Enhancement for the Cost-Effective Remediation of NAPLs Questionnaire #2
1. Organization Name: U.S. Navy 2. Facility Name: North Island Naval Air Station 3. Facility Location: California 4. Facility POC (Name, phone, fax, e-mail): Bill Collins (619) 556-9901 [email protected] 5. Confirm type of source area:
a) Fuel Hydrocarbon LNAPL b) Chlorinated Solvent DNAPL c) Chlorinated Solvent dissolved in Fuel Hydrocarbon (LNAPL) 80% JP5, 20% Chlorinated solvents, including TCE and DCE. Fuel loss from 1940’s into 1970’s d) Other (please explain)
6. Confirm type of thermal technology employed:
a) Steam injection b) Electrical Resistive Heating c) Conductive Heating d) Radio-Frequency Heating e) Hot water injection f) Thermal Enhancement for SVE (hot air, 6-phase, etc) g) Deep soil mixing with steam injection h) Other (please explain)
7. Identify the vendor/contractor. Shaw/IT 8. Project Scale
a) Pilot Scale: b) Full Scale: Yes
Was a pilot study conducted before going full-scale: Yes
What was the aerial extent and depth of contamination: 10 acres by 80’ deep. Initially was a SVE system for vadose zone only, though the thermally enhanced SVE system extended 2 feet below the water table. Groundwater is 10 – 12’ bgs. A NAPL area was identified after a SVE system was installed, so the facility used an Action Memo and California Remedial Action Plan to modify the system and stay within the requirements of the decision document. An estimated 24 million gallons

of off-spec fuel was dumped into unlined trenches at this site. Thermal enhancement of the SVE system was accomplished by injecting steam periodically over 14 months (to date; system is still active), with a total of about 7 months active steam injection to maintain soil temperature; the soil held heat quite well.
9. Project status
a) Planning (including design) b) In situ treatment is ongoing c) Post-treatment monitoring d) Long-term monitoring e) Complete
10. Confirm impression of success
a) Project was a failure: No
b) Project was somewhat successful: No c) Project was very successful: Yes
Why was it considered successful? A total of 80,000# total VOCs was removed using the SVE system for over one year. An estimated 211,000# total VOCs was removed in 14 months after the introduction of steam. This includes 136,000# of LNAPL and 66,000# in the vapor phase.
Is the site going full scale: The system is full scale What was the percent of mass removed? Insignificant (when compared to 24M gallons in subsurface). What was the percent reduction in mass flux? System is still in operation. Is there residual ground water contamination? Yes, at concentrations greater than 1,000 mg/L.
What was the percent reduction in ground water concentrations? System is still in operation. Was rebound measured? Not applicable as system is still in operation.
d) Is long-term monitoring planned? Site is monitored in accordance with the decision document.

Have regulators agreed upon the success of the treatment? Yes, operation of the system will continue. Was this treatment applied at a full scale that could lead to a site closure? Yes. Have stakeholders approved the site closure followed by the remediation?
11. What is the lithology of the site?
a) Geology: Heterogeneous, homogenous, or moderately homogeneous? Sand/silt/coarse sand from ground surface to 40’, a silt bed from 40’ to 45’, sand from 45’ to 80’ and clay at 80’. 1) Sand 2) Silt 3) Clay 4) Sedimentary 5) Gravel 6) Till 7) Unconsolidated 8) Metamorphic 9) Igneous 10) Consolidated 11) Other 12) Unknown
b) Hydrogeology:
1) Average depth to groundwater at the site? 10 - 12 ‘ 2) Confined or unconfined. Confined 3) Vertical profile depth(s) of confining layer(s)? see above 4) Is there significant fracturing of the bedrock? Not applicable 5) Is there a significant seasonal fluctuation in groundwater table? Tidally
influenced and average level fluctuates by about 1’ over the year. 6) Is the geology significantly impacted by precipitation (i.e. sandy and very
permeable)? Not much precipitation.
c) Aboveground buildings or permanent structures Are there aboveground structures that could interfere with the thermal treatment? No, the site used to be a series of troughs and trenches used to dispose off-spec fuel.
12. What was the nature of NAPL at the site? No mobile NAPL has been identified at the site.

a) Was NAPL mobile, immobile residual, other? Unsure, though likely some
immobile residual exists in the source area. Have near saturation levels of VOCs spread over 100 acres and 80 feet deep.
b) Was the entire area impacted by NAPL addressed by the project? Yes, the entire 10-acre source area is being addressed.
If not, was the NAPL impacted area adequately characterized? c) Was characterization satisfactorily conducted to delineate NAPL and
dissolved plume at the site? Yes
13. Cost Data Availability
a) No cost data available b) Some cost data available c) Extensive cost data available
Was a cost and performance report written? No. Cost $1.5M capitol and $2.5M O&M (to date). Of the $1.5M, only about $0.5M was added for steam as the pre-steam SVE system cost $1M.
14. Above ground treatment system.
a) Major aboveground system components: High-vacuum SVE system (total
fluids) with NAPL separator, condenser, and GAC sorbers on aqueous phase. b) Were there any equipment failures during system operation? System required a
couple months to bring fully online. After that, it operated well. c) How much DNAPL was collected in the knock-out tank? None d) Approximately how much liquid was extracted from the system? 25 gpm total
fluids extracted which contains about 2% LNAPL. 8400# of TCE has been recovered from the dissolved phase.
e) How were the liquid phases handled, treated, disposed? They are incinerated.
f) Extracted NAPL mass: 136,000#
g) Water monitoring and NPDES requirements: No, fluids are incinerated.
h) Air monitoring and discharge requirements: The facility bought air emission off-sets so no permit was required. However, GAC sorbers are used to treat the

off-gas stream.
i) Activated carbon requirements: 15,000# per every six weeks. Used on-site carbon regeneration.
15 Confirm impression of impact of thermal technology on life-cycle costs
a) Technology definitely decreased life-cycle cost of project Steam injection increased the removal rate, so that 211,000# total VOCs were recovered in 14 months.
b) Technology probably reduced life-cycle cost of project c) Technology had no impact on life-cycle cost of project d) Technology increased life-cycle cost of project e) Unknown
16. Confirm answers to the below questions:
a) Was the thermal technology selected in a feasibility study or corrective measures study? No
b) Was the thermal technology selected as an interim action? Yes c) Was the thermal technology selected as a technology demonstration? Yes d) Did your regulators suggest or encourage use of the thermal technology selected?
No, steam was added to the SVE system so that the facility could stay within the requirements of the Remedial Action Plan.
e) Was the technology selected based on vendor marketing efforts? No, the
contractor was already on site. f) Knowing project results, would you use the selected thermal technology again?
Yes. g) Knowing project results, would you select a different thermal technology? No h) Knowing project results, would you select a non-thermal technology? No i) Are you willing to participate further in this thermal technology evaluation? Yes j) Are you willing to share cost data for use in this life cycle cost evaluation of
thermal technology enhancements? Yes

Thermal Enhancement for the Cost-Effective Remediation of NAPLs Questionnaire #2
1. Organization Name: DOE 2. Facility Name: Portsmouth Gaseous Diffusion Facility 3. Facility Location: Ohio 4. Facility POC (Name, phone, fax, e-mail): John Sokol (740) 897-4426 [email protected] 5. Confirm type of source area:
a) Fuel Hydrocarbon LNAPL b) Chlorinated Solvent DNAPL TCE in vadose, groundwater and bedrock c) Chlorinated Solvent dissolved in Fuel Hydrocarbon (LNAPL) d) Other (please explain)
6. Confirm type of thermal technology employed:
a) Steam injection b) Electrical Resistive Heating c) Conductive Heating d) Radio-Frequency Heating e) Hot water injection f) Thermal Enhancement for SVE (hot air, 6-phase, etc) g) Deep soil mixing with steam injection h) Other (please explain)
7. Identify the vendor/contractor. Steam Tech 8. Project Scale
a) Pilot Test Aerial extent and depth of contamination for the pilot test 100’ by 60’ by 35’ deep System operated for 6-8 months, which was longer than planned. Will the project go to full scale? No If not planning to go to full scale, why? Steam injection was very inefficient due to loss in heterogeneous subsurface.
9. Project status
a) Planning (including design)

b) In situ treatment is ongoing c) Post-treatment monitoring d) Long-term monitoring e) Complete
10. Confirm impression of success
a) Project was a failure: No
b) Project was somewhat successful: Why was it considered somewhat successful? Approximately 50 gallons of TCE were recovered during the study. However, the costs were too great (in excess of $1MM) and the time to heat the soil was greater than expected due to steam loss in heterogeneous subsurface. There was also some concern that the steam could mobilize contaminant mass away from the study area.
Is the site going full scale: No What was the percent of mass removed? Insignificant What was the percent reduction in mass flux? Not quantified Is there residual ground water contamination? Yes
What was the percent reduction in ground water concentrations? Groundwater concentrations were not affected by the study. Was rebound measured? Yes Groundwater rebounded quickly and returned to the pre-study concentrations. In-situ oxidation was also tested, and groundwater rebounded to pre-test concentrations.
c) Project was very successful: No
d) Is long-term monitoring planned? Site is still being studied
Have regulators agreed upon the success of the treatment? Regulators agreed that steam injection at this site is not appropriate due to heterogeneous subsurface and cost associated with steam. Was this treatment applied at a full scale that could lead to a site closure? No Have stakeholders approved the site closure followed by the remediation?

11. What is the lithology of the site?
a) Geology: Heterogeneous, homogenous, or moderately homogeneous? Silty soil with clay pockets above a layer of clayey sand and gravel, above fractured shale bedrock. 1) Sand 2) Silt 3) Clay 4) Sedimentary 5) Gravel 6) Till 7) Unconsolidated 8) Metamorphic 9) Igneous 10) Consolidated 11) Other 12) Unknown
b) Hydrogeology:
1) Average depth to groundwater at the site? 30 - 35 2) Confined or unconfined. Unconfined 3) Vertical profile depth(s) of confining layer(s)? see above 4) Is there significant fracturing of the bedrock? No 5) Is there a significant seasonal fluctuation in groundwater table? No 6) Is the geology significantly impacted by precipitation (i.e. sandy and very
permeable)? No, a pump and treat system at the toe of the source area keeps the water table fairly stable.
c) Aboveground buildings or permanent structures
Are there aboveground structures that could interfere with the thermal treatment? No, the site used to be sludge lagoons used to contain material excavated from treatment ponds.
12. What was the nature of NAPL at the site? No mobile NAPL has been found at the site. a) Was NAPL mobile, immobile residual, other? Unsure, though likely some
immobile residual exists in the source area. b) Was the entire area impacted by NAPL addressed by the project? No
If not, was the NAPL impacted area adequately characterized? No

c) Was characterization satisfactorily conducted to delineate NAPL and dissolved plume at the site? No, a great deal of characterization has been completed at the site, but the source area has not been completely identified.
13. Cost Data Availability
a) No cost data available b) Some cost data available c) Extensive cost data available
Was a cost and performance report written? Yes, for EM50. Check Oakridge website for report, or contact Elizabeth Folkes at Oakridge.
14. Above ground treatment system.
a) Major aboveground system components: Facility steam, SVE system with
knockout tank. b) Were there any equipment failures during system operation? System performed
well. c) How much DNAPL was collected in the knock-out tank? Approximately 50
gallons TCE. d) Approximately how much liquid was extracted from the system? Unknown
e) How were the liquid phases handled, treated, disposed? Used facility’s central
waste water treatment plant to treat liquid phase.
f) Extracted NAPL mass:
g) Water monitoring and NPDES requirements: No, discharge to central WWTP.
h) Air monitoring and discharge requirements: No permit was required.
i) Activated carbon requirements: Air treatment was not known
15 Confirm impression of impact of thermal technology on life-cycle costs
a) Technology definitely decreased life-cycle cost of project b) Technology probably reduced life-cycle cost of project c) Technology had no impact on life-cycle cost of project d) Technology increased life-cycle cost of project Steam injection was not
appropriate for this site. There was very little return for over $1MM investment

and there was no end in site regarding system operation. DOE shut down the system due to costs.
e) Unknown
16. Confirm answers to the below questions:
a) Was the thermal technology selected in a feasibility study or corrective measures study? No, the decision document selected in-situ oxidation.
b) Was the thermal technology selected as an interim action? No c) Was the thermal technology selected as a technology demonstration? Yes d) Did your regulators suggest or encourage use of the thermal technology selected?
No e) Was the technology selected based on vendor marketing efforts? Not really.
DOE had invested in the technology then sought out a vendor to implement. f) Knowing project results, would you use the selected thermal technology again?
No, is not appropriate at this site. g) Knowing project results, would you select a different thermal technology? Are
considering 6 phase heating as it may produce more uniform heating of soil. h) Knowing project results, would you select a non-thermal technology? Yes, are
probably going to implement in-situ oxidation. They have also tested surfactant flushing, in-situ soil mixing, zero-valent iron and in-situ UV oxidation.
i) Are you willing to participate further in this thermal technology evaluation? Yes j) Are you willing to share cost data for use in this life cycle cost evaluation of
thermal technology enhancements? Yes

Thermal Enhancement for the Cost-Effective Remediation of NAPLs Questionnaire #2
1. Organization Name: U.S. Army 2. Facility Name: Rocky Mountain Arsenal 3. Facility Location: Colorado 4. Facility POC (Name, phone, fax, e-mail): Ronald Versaw (303) 980-3707 [email protected] 5. Confirm type of source area:
a) Fuel Hydrocarbon LNAPL: b) Chlorinated Solvent DNAPL: c) Chlorinated Solvent dissolved in Fuel Hydrocarbon (LNAPL) d) Other (please explain): hexachlorocyclopentadiene from pesticide production
6. Confirm type of thermal technology employed:
a) Steam injection: b) Electrical Resistive Heating: Three phase, 480-volt c) Conductive Heating d) Radio-Frequency Heating e) Hot water injection f) Thermal Enhancement for SVE (hot air, 6-phase, etc) g) Deep soil mixing with steam injection h) Other (please explain)
7. Identify the vendor/contractor: Terra Therm. Inc. 8. Project Scale
a) Pilot Scale: b) Full Scale: Yes
Was a pilot study conducted before going full-scale: No, a bench-scale characterization of site soils and contaminants was completed.
What was the aerial extent and depth of contamination: 110’ by 90’ by 12’ deep.
9. Project status
a) Planning (including design) b) In situ treatment is ongoing

c) Post-treatment monitoring d) Long-term monitoring e) Complete The remedial technology was selected in 1999, the bench scale study in 1999 and the full scale project was started and completed in 2000. The system did not reach the desired temperature of 600ºF due to complete equipment failure after ten days of heating (see below). Total cost of the project was $3MM.
10. Confirm impression of success
a) Project was a failure: Yes
Why was it considered a failure? The system operated for 10 days, then fell apart due to corrosion of all metal parts even though 304 stainless steel was used for all equipment and piping. Additionally, a fire occurred in the GAC sorber due to acid reaction with carbon. The soil heating caused a reaction with the site contaminants and produced concentrated hydrochloric acid. Generation of acid was recognized during the bench test, but the thought was the soil would buffer the acid and not cause problems. The pH of the condensate was 0.0 units. The source area was excavated and disposed of the next year.
b) Project was somewhat successful: No c) Project was very successful: No d) Is long-term monitoring planned? Yes as part of the overall site plume.
Have regulators agreed upon the success of the treatment? Regulators still liked the technology even with the acid problem, and wanted the Army to rebuild the system using different materials of construction (Teflon, etc.). The Army would not agree to try again based on health and safety issues of handling boiling hydrochloric acid. Was this treatment applied at a full scale that could lead to a site closure? No Have stakeholders approved the site closure followed by the remediation? No, site was excavated the next year.
11. What is the lithology of the site?
a) Geology: Heterogeneous, relatively homogenous, or moderately homogeneous?
A disposal pit was excavated into alluvium, and then filled with excavated soil and waste materials. Lime was added to the pit to control the pH.

1) Sand 2) Silt 3) Clay 4) Sedimentary 5) Gravel 6) Till 7) Unconsolidated 8) Metamorphic 9) Igneous 10) Consolidated 11) Other excavated soil and waste product placed into a disposal pit. 12) Unknown
b) Hydrogeology:
1) Average depth to groundwater at the site? 20’ 2) Confined or unconfined. Unconfined 3) Vertical profile depth(s) of confining layer(s)? see above 4) Is there significant fracturing of the bedrock? Not applicable 5) Is there a significant seasonal fluctuation in groundwater table? No 6) Is the geology significantly impacted by precipitation (i.e. sandy and very
permeable)? No
c) Aboveground buildings or permanent structures Are there aboveground structures that could interfere with the thermal treatment? No
12. What was the nature of NAPL at the site? a) Was NAPL mobile, immobile residual, other? NAPL was a tar-like
material composed of 90% hexachlorocyclopentadiene with the remaining 10% being mixed pesticides and pesticide precursors.
b) Was the entire area impacted by NAPL addressed by the project? Yes, a total of 276 electrodes were installed in an attempt to address the entire disposal pit. c) Was characterization satisfactorily conducted to delineate NAPL and
dissolved plume at the site? Yes, and the groundwater has not been impacted at this site.
13. Cost Data Availability
a) No cost data available b) Some cost data available: Could go through Army to get cost data.

Was a cost and performance report written? No, but Terra Therm did complete a failure report that should be available on the EPA SITE Program website. c) Extensive cost data available
14. Above ground treatment system.
a) Major aboveground system components: SVE system, cyclone separator,
condensor, flameless thermal oxidizer with acid gas scrubber, GAC sorbers for liquid treatment.
b) Were there any equipment failures during system operation? Everything failed
due to corrosion caused by concentrated hydrochloric acid. c) How much NAPL was collected in the knock-out tank? None d) Approximately how much liquid was extracted from the system? 300 gallons of
pure hydrochloric acid.
e) How were the liquid phases handled, treated, disposed? Was supposed to be treated though GAC, but the sorber caught fire.
f) Water monitoring and NPDES requirements: Not applicable
g) Air monitoring and discharge requirements: Not applicable
h) Activated carbon requirements: Not applicable
15 Confirm impression of impact of thermal technology on life-cycle costs
a) Technology definitely decreased life-cycle cost of project b) Technology probably reduced life-cycle cost of project: c) Technology had no impact on life-cycle cost of project: d) Technology increased life-cycle cost of project: Project cost $3MM plus another
$1 to $1.5 MM for preliminary work. The Army wanted to simply excavate the disposal pit but EPA forced them to try an innovative technology. This was the first full-scale application for Terra Therm, and the Army had to pay for their design learning curve.
e) Unknown
16. Confirm answers to the below questions:

a) Was the thermal technology selected in a feasibility study or corrective measures study? No, the EPA used the ROD to force the Army to select an innovative technology even though the Army wanted to excavate the material, the cost of which was much less than trying an innovative technology. Specifically, the ROD called for application of a thermal technology at one of the 31 disposal sites at the arsenal, and they (EPA) chose thermally enhanced SVE.
b) Was the thermal technology selected as an interim action? No c) Was the thermal technology selected as a technology demonstration? Yes, the
site was selected as an EPA SITE Program project. d) Did your regulators suggest or encourage use of the thermal technology selected?
Yes, see the answer for question 16a. e) Was the technology selected based on vendor marketing efforts? No, EPA
selected the technology. f) Knowing project results, would you use the selected thermal technology again?
Yes, but not at this site. Thermal technology may be good for treating the vadose zone at some sites that have lower levels of contaminants, but would probably not be cost effective.
g) Knowing project results, would you select a different thermal technology? Not at
this site. h) Knowing project results, would you select a non-thermal technology? Yes,
excavation. i) Are you willing to participate further in this thermal technology evaluation? Yes j) Are you willing to share cost data for use in this life cycle cost evaluation of
thermal technology enhancements? Yes

Thermal Enhancement for the Cost-Effective Remediation of NAPLs Questionnaire #2
1. Organization Name: DOE 2. Facility Name: Savannah River (DUS/HPO) 3. Facility Location: Aiken, South Carolina 4. Facility POC (Name, phone, fax, e-mail): Chris Bergren (803) 952-6530 [email protected] 5. Confirm type of source area:
a) Fuel Hydrocarbon LNAPL b) Chlorinated Solvent DNAPL: 90% PCE, 10% TCE c) Chlorinated Solvent dissolved in Fuel Hydrocarbon (LNAPL) d) Other (please explain)
6. Confirm type of thermal technology employed:
a) Steam injection b) Electrical Resistive Heating c) Conductive Heating d) Radio-Frequency Heating e) Hot water injection f) Thermal Enhancement for SVE (hot air, 6-phase, etc) g) Deep soil mixing with steam injection h) Other (please explain)
7. Identify the vendor/contractor: Integrated Water Resources, Santa Barbara, CA 8. Project Scale
a) Pilot Scale: b) Full Scale: Yes
Was a pilot study conducted before going full-scale: No
What was the aerial extent and depth of contamination: 1MM cubic feet. 100’ by 100’ by 160’ deep.
9. Project status
a) Planning (including design) b) In situ treatment is ongoing c) Post-treatment monitoring d) Long-term monitoring

e) Complete: System cost $4MM 10. Confirm impression of success
a) Project was a failure: No
b) Project was somewhat successful: No c) Project was very successful: Yes
Why was it considered successful? Recovered over 68,000# total VOCs in 12 months and met clean up criteria. Criteria were based on reaching asymptotic mass removal rates. System was designed to treat soil from 18’ to 160’ bgs. Sand zones heated quickly, while clay layers took longer. The system used pulsed steam injections to heat the sand layers which in turn heated the clay layers. The entire vertical profile was heated to above the boiling point for PCE.
What was the percent of mass removed? Facility believes 100% as soil in source area after treatment showed non-detectable contaminant levels. What was the percent reduction in mass flux? Unclear as groundwater has not recovered (in terms of water levels) at the site. Is there residual ground water contamination? Unknown due to low water levels in source area.
What was the percent reduction in ground water concentrations? Unknown. Was rebound measured? Not yet due to low groundwater levels.
d) Is long-term monitoring planned? Yes
Have regulators agreed upon the success of the treatment? Yes. Regulators agreed source area removal is complete, but Savannah will collect another round of soil samples to confirm. Was this treatment applied at a full scale that could lead to a site closure? Yes. Regulators allowed system to be shutdown and removed. Will require groundwater monitoring. Regulators also agreed to Savannah plan to implement steam enhanced SVE at a larger site at the facility. Have stakeholders approved the site closure followed by the remediation? Yes, both regulators an public.

11. What is the lithology of the site?
a) Geology: Heterogeneous, homogenous, or moderately homogeneous? Coastal plain sediments to at least 160’ 1) Sand 2) Silt 3) Clay 4) Sedimentary 5) Gravel 6) Till 7) Unconsolidated 8) Metamorphic 9) Igneous 10) Consolidated 11) Other 12) Unknown
b) Hydrogeology:
1) Average depth to groundwater at the site? 120‘ 2) Confined or unconfined. Unconfined 3) Vertical profile depth(s) of confining layer(s)? see above 4) Is there significant fracturing of the bedrock? Not applicable 5) Is there a significant seasonal fluctuation in groundwater table? No 6) Is the geology significantly impacted by precipitation (i.e. sandy and very
permeable)? No
c) Aboveground buildings or permanent structures Are there aboveground structures that could interfere with the thermal treatment? No
12. What was the nature of NAPL at the site? Mobile DNAPL over entire vertical profile with indication of vertical migration. a) Was NAPL mobile, immobile residual, other? See above b) Was the entire area impacted by NAPL addressed by the project? Yes, but this was one source area of a 2 square mile dissolved plume. c) Was characterization satisfactorily conducted to delineate NAPL and
dissolved plume at the site? Yes

13. Cost Data Availability a) No cost data available b) Some cost data available c) Extensive cost data available
Was a cost and performance report written? Yes, a report was written for EM50 and should be available there or on Savannah River website.
14. Above ground treatment system.
a) Major aboveground system components: Plant steam, high-vacuum SVE system
(total fluids) with NAPL separator, condenser, and an existing air stripper used to treat both aqueous steam and condensate stream.
b) Were there any equipment failures during system operation? Heat exchanger
took a few days to get operation down. Rest of system worked well. c) How much DNAPL was collected in the knock-out tank? About 3 gallons, most
PCE/TCE was recovered from vapor phase. d) Approximately how much liquid was extracted from the system? Sent more
than 2MM gallons of condensate to the air stripper.
e) How were the liquid phases handled, treated, disposed? Through an existing air stripper, treated to < 1µg/L total CAHs, then to a NPDES outfall.
f) Extracted NAPL mass: 68,000#
g) Water monitoring and NPDES requirements: Yes.
h) Air monitoring and discharge requirements: Air stripper emission had to meet OSHA levels only.
i) Activated carbon requirements: None
15 Confirm impression of impact of thermal technology on life-cycle costs
a) Technology definitely decreased life-cycle cost of project: Compared to endless pump and treat, and SVE.
b) Technology probably reduced life-cycle cost of project c) Technology had no impact on life-cycle cost of project d) Technology increased life-cycle cost of project e) Unknown

16. Confirm answers to the below questions:
a) Was the thermal technology selected in a feasibility study or corrective measures study? Yes, driven by a RCRA Part B permit.
b) Was the thermal technology selected as an interim action? No c) Was the thermal technology selected as a technology demonstration? No d) Did your regulators suggest or encourage use of the thermal technology selected?
Not really, facility proposed technology and regulators accepted. e) Was the technology selected based on vendor marketing efforts? No, they
sought out the technology and the contractor. f) Knowing project results, would you use the selected thermal technology again?
Yes, for a site with similar conditions. g) Knowing project results, would you select a different thermal technology? No h) Knowing project results, would you select a non-thermal technology? No i) Are you willing to participate further in this thermal technology evaluation? Yes j) Are you willing to share cost data for use in this life cycle cost evaluation of
thermal technology enhancements? Yes

Thermal Enhancement for the Cost-Effective Remediation of NAPLs Questionnaire #2
1. Organization Name: DESC 2. Facility Name: Whittier DFSP 3. Facility Location: Alaska 4. Facility POC (Name, phone, fax, e-mail): Jack Appollini/Wayne Barnum (907) 552-4650 or (703) 767-8314 [email protected] 5. Confirm type of source area:
a) Fuel Hydrocarbon LNAPL: JP4 loss of estimated 100,000 gallons b) Chlorinated Solvent DNAPL c) Chlorinated Solvent dissolved in Fuel Hydrocarbon (LNAPL) d) Other (please explain)
6. Confirm type of thermal technology employed:
a) Steam injection: Whittier tried SVE alone, but recovered only 1 quart during one year of operation. b) Electrical Resistive Heating: c) Conductive Heating d) Radio-Frequency Heating e) Hot water injection f) Thermal Enhancement for SVE (hot air, 6-phase, etc) g) Deep soil mixing with steam injection h) Other (please explain)
7. Identify the vendor/contractor: IT 8. Project Scale
a) Pilot Scale: b) Full Scale: Yes
Was a pilot study conducted before going full-scale: No, a bench-scale characterization of site soils and contaminants was completed.
What was the aerial extent and depth of contamination: 200’ by 300’ by 30’ deep. Smear zone is spread from 15’ to 30’ bgs as groundwater at the site is tidally and glacial melt influenced. Also, ground freeze makes year round operation difficult, and water table drops by almost 15 feet in coldest part of year.

9. Project status a) Planning (including design) b) In situ treatment is ongoing c) Post-treatment monitoring d) Long-term monitoring e) Complete No plans to reactivate system due to excessive O&M costs. DESC pushed quick remediation in order to release site for lease/sale to commercial oil storage enterprise. DESC, regulators and IT (already on site contractor) agreed steam could speed remediation. Lease/sale fell through and DESC’s interest in quick remediation died. Steam injection system allowed recovery of 15,000 gallons in vapor phase, but this is pretty insignificant compared to loss. Free product is evident in on site wells, but has not migrated off site. A dissolved plume extends off site, but it appears to be stable. DESC now plans on hot spot excavation and MNA.
10. Confirm impression of success
a) Project was a failure: No
b) Project was somewhat successful: No c) Project was very successful: Yes
Why was it considered successful? The system worked as expected and increased fuel recovery from less than one gallon in 12 months with SVE alone to approximately 15,000 gallons during 21 months of steam injection. There were not RAOs established regarding thermal enhanced SVE.
What was the percent of mass removed? Unclear, maybe 15% What was the percent reduction in mass flux? Unclear Is there residual ground water contamination? Yes
What was the percent reduction in ground water concentrations? Data is misleading due to extreme groundwater fluctuation over a 15 feet thick smear zone. Also, steam definitely mobilized contaminant mass. Was rebound measured? No
d) Is long-term monitoring planned? Yes
Have regulators agreed upon the success of the treatment? Regulators liked the technology but agreed it was misapplied at Whittier. They

have acknowledged that contamination will always be there and are not too concerned as free phase has not migrated off site. Was this treatment applied at a full scale that could lead to a site closure? No, O&M costs and amount of fuel lost made treatment ineffective. Have stakeholders approved the site closure followed by the remediation? Residents were either ok or did not care. They did not show up at the RAB meetings.
11. What is the lithology of the site?
a) Geology: Heterogeneous, homogenous, or moderately homogeneous? Fifteen feet of gravel fill (to build tanks on rocky and unlevel ground) over fractured bedrock. 1) Sand 2) Silt 3) Clay 4) Sedimentary 5) Gravel 6) Till 7) Unconsolidated 8) Metamorphic 9) Igneous 10) Consolidated 11) Other Gravel fill over bedrock. 12) Unknown
b) Hydrogeology:
1) Average depth to groundwater at the site? 15’ – 30’ 2) Confined or unconfined. Unconfined 3) Vertical profile depth(s) of confining layer(s)? see above 4) Is there significant fracturing of the bedrock? Yes 5) Is there a significant seasonal fluctuation in groundwater table? Yes 6) Is the geology significantly impacted by precipitation (i.e. sandy and very
permeable)? Groundwater impacted more by temperature, tide and glacial melt water.
c) Aboveground buildings or permanent structures
Are there aboveground structures that could interfere with the thermal treatment? A manifold building (source of fuel loss) with a dirt floor, ASTs and associated above ground piping.

12. What was the nature of NAPL at the site? a) Was NAPL mobile, immobile residual, other? Mobile fuel hydrocarbon
that moves around within a 150’ by 150’ area. b) Was the entire area impacted by NAPL addressed by the project? Yes c) Was characterization satisfactorily conducted to delineate NAPL and
dissolved plume at the site? Yes
13. Cost Data Availability
a) No cost data available b) Some cost data available c) Extensive cost data available Yes, system cost $3.8MM, over half of which was O&M costs. More data can be obtained from DESC.
Was a cost and performance report written? No 14. Above ground treatment system.
a) Major aboveground system components: SVE system, methane fired boiler,
knockout tank and condenser. b) Were there any equipment failures during system operation? Up time averaged
90%, but system had to be shut down during high glacial melt periods. c) How much NAPL was collected in the knock-out tank? 1000 gallons, also
recovered 15,000 gallons from condensed vapor stream. d) Approximately how much liquid was extracted from the system? Data was not
available.
e) How were the liquid phases handled, treated, disposed? Recovered liquid was used to feed boiler or re-injected into subsurface.
f) Water monitoring and NPDES requirements: No
g) Air monitoring and discharge requirements: Emission limits were established and system operated within limits.
h) Activated carbon requirements: Not applicable

15. Confirm impression of impact of thermal technology on life-cycle costs a) Technology definitely decreased life-cycle cost of project b) Technology probably reduced life-cycle cost of project: c) Technology had no impact on life-cycle cost of project: d) Technology increased life-cycle cost of project: O&M costs were 3 times
estimated costs and mass removed was insignificant when compared to the mass released.
e) Unknown 16. Confirm answers to the below questions:
a) Was the thermal technology selected in a feasibility study or corrective measures study? No, this was considered an IRA at a RCRA facility.
b) Was the thermal technology selected as an interim action? Yes c) Was the thermal technology selected as a technology demonstration? No d) Did your regulators suggest or encourage use of the thermal technology selected?
Regulators provided some input but did not seem to care a great deal about the site.
e) Was the technology selected based on vendor marketing efforts? No f) Knowing project results, would you use the selected thermal technology again?
Yes, but not at Whittier g) Knowing project results, would you select a different thermal technology? Yes,
but not at Whittier. h) Knowing project results, would you select a non-thermal technology? Yes, now
going with hot spot excavation and MNA. i) Are you willing to participate further in this thermal technology evaluation? Yes j) Are you willing to share cost data for use in this life cycle cost evaluation of
thermal technology enhancements? Yes

Thermal Enhancement for the Cost-Effective Remediation of NAPLs Questionnaire #2
1. Organization Name: NAVFAC/DESC 2. Facility Name: Yorktown Fuels 3. Facility Location: Virginia 4. Facility POC (Name, phone, fax, e-mail): Jennifer Davis (757) 322-4775 [email protected] 5. Confirm type of source area:
a) Fuel Hydrocarbon LNAPL: Bunker fuel loss estimated at 3MM gallons. Site used USTs (WW I vintage) to store navy fuels. Eleven acre storage site operated until 1970’s, after which the USTs were collapsed within their tank pit and the pit backfilled to grade. b) Chlorinated Solvent DNAPL c) Chlorinated Solvent dissolved in Fuel Hydrocarbon (LNAPL) d) Other (please explain)
6. Confirm type of thermal technology employed:
a) Steam injection: Was built in phases due to concern of contaminant mobilization from steam injection and to show hydraulic control at the site before steam injection was fully implemented. Skimmers were first installed and operated for about one year before steam injection was initiated. Steam was injected at only ½ the site for 3.5 years to confirm contaminant mobilization was not occurring. The final phase of the project, steam injection at the remaining ½ of the site, is scheduled to occur this year (2004). b) Electrical Resistive Heating: c) Conductive Heating d) Radio-Frequency Heating e) Hot water injection f) Thermal Enhancement for SVE (hot air, 6-phase, etc) g) Deep soil mixing with steam injection h) Other (please explain)
7. Identify the vendor/contractor: OHM 8. Project Scale
a) Pilot Scale: b) Full Scale: Yes
Was a pilot study conducted before going full-scale: Yes

What was the aerial extent and depth of contamination: 11 acres by 25 feet deep.
9. Project status
a) Planning (including design) b) In situ treatment is ongoing: Project started in 1998 with skimmers in wells. Steam injection began on ½ the site in Sept 2000 and continues. The steam injection system will be expanded to address the remaining ½ of the site and steam injection will commence there later this year. Construction costs for the first ½ of the site were $6MM and O&M costs are $1MM per year. The estimated cost for expansion of the project to address the remaining ½ of the site is $4MM. Steam injection is expected to require another 15 years before cleanup criteria are met. c) Post-treatment monitoring d) Long-term monitoring e) Complete
10. Confirm impression of success
a) Project was a failure: No
b) Project was somewhat successful: Yes
Why was it considered successful? The project is removing an average of 5000 gallons bunker fuel per month for a total of 168,000 gallons in 3.5 years. The recovered fuel is sold to a vendor, which allows for some cost recovery. Prior to steam injection, the skimming system recovered about 30,000 gallons over a one year period.
What was the percent of mass removed? Approx 6% What was the percent reduction in mass flux? Unclear, and system is still in operation Is there residual ground water contamination? Yes
What was the percent reduction in ground water concentrations? Did not provide data. Was rebound measured? NA
c) Project was very successful: No
d) Is long-term monitoring planned? Yes, quarterly for VOCs, SVOCs and metals. Also will conduct annual soil sampling for TPH.

Have regulators agreed upon the success of the treatment? Yes, and regulators recommended technology at another site in Virginia based on results from Yorktown. State has set cleanup criteria of 0.1’ free product in wells or asymptotic removal rates of fuel. Was this treatment applied at a full scale that could lead to a site closure? Not initially due to concern of mobilization of fuel by steam injection. But DESC is now expanding steam injection at remainder of site to achieve cleanup criteria. These actions are in accordance with the state approved Corrective Action Plan. Have stakeholders approved the site closure followed by the remediation? The U.S. Park Service has property adjoining site and they have expressed concern about contaminant migration. The other stakeholders (U.S. Coast Guard and private resident) are ok with actions to date.
11. What is the lithology of the site?
a) Geology: Heterogeneous, homogenous, or moderately homogeneous? Coastal plant sediments consisting of sand, silt and clay 1) Sand 2) Silt 3) Clay 4) Sedimentary 5) Gravel 6) Till 7) Unconsolidated 8) Metamorphic 9) Igneous 10) Consolidated 11) Other 12) Unknown
b) Hydrogeology:
1) Average depth to groundwater at the site? 15’ – 25’ 2) Confined or unconfined. Unconfined 3) Vertical profile depth(s) of confining layer(s)? see above 4) Is there significant fracturing of the bedrock? No 5) Is there a significant seasonal fluctuation in groundwater table? Not
much, but did drop 10 feet during drought. 6) Is the geology significantly impacted by precipitation (i.e. sandy and very
permeable)? No
c) Aboveground buildings or permanent structures

Are there aboveground structures that could interfere with the thermal treatment? Treatment system building. All USTs were collapsed and filled over.
12. What was the nature of NAPL at the site? a) Was NAPL mobile, immobile residual, other? Modeling indicates
free phase may migrate a few inches per year. b) Was the entire area impacted by NAPL addressed by the project? Not initially, but system will be expanded in 2004 to address entire source area. c) Was characterization satisfactorily conducted to delineate NAPL and
dissolved plume at the site? Yes, dissolved plume is contiguous with free phase plume.
13. Cost Data Availability
a) No cost data available b) Some cost data available c) Extensive cost data available Yes Was a cost and performance report written? Not yet. NAVFAC optimization report is scheduled for 2005.
14. Above ground treatment system.
a) Major aboveground system components:
b) Were there any equipment failures during system operation? Up time averages
99.2%. Only downtime is due to lightning strikes on Virginia power grid. c) How much NAPL was collected in the knock-out tank? Approximately 5000
gallons per month or 168,000 gallons to date. d) Approximately how much liquid was extracted from the system? Approximately
473,000 gallons per month in 2002 and 500,000 gallons per month in 2003.
e) How were the liquid phases handled, treated, disposed? Separated aqueous phase is treated through GAC and discharged to the York River.
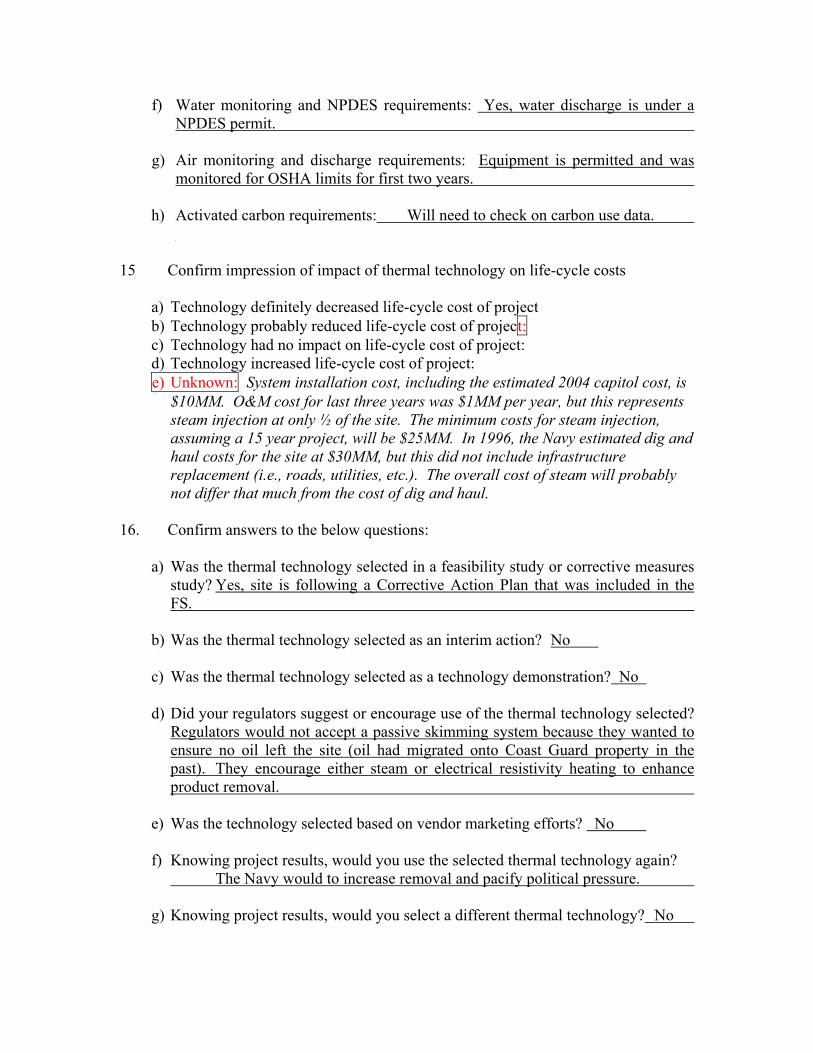
f) Water monitoring and NPDES requirements: Yes, water discharge is under a NPDES permit.
g) Air monitoring and discharge requirements: Equipment is permitted and was monitored for OSHA limits for first two years.
h) Activated carbon requirements: Will need to check on carbon use data.
15 Confirm impression of impact of thermal technology on life-cycle costs
a) Technology definitely decreased life-cycle cost of project b) Technology probably reduced life-cycle cost of project: c) Technology had no impact on life-cycle cost of project: d) Technology increased life-cycle cost of project: e) Unknown: System installation cost, including the estimated 2004 capitol cost, is
$10MM. O&M cost for last three years was $1MM per year, but this represents steam injection at only ½ of the site. The minimum costs for steam injection, assuming a 15 year project, will be $25MM. In 1996, the Navy estimated dig and haul costs for the site at $30MM, but this did not include infrastructure replacement (i.e., roads, utilities, etc.). The overall cost of steam will probably not differ that much from the cost of dig and haul.
16. Confirm answers to the below questions:
a) Was the thermal technology selected in a feasibility study or corrective measures study? Yes, site is following a Corrective Action Plan that was included in the FS.
b) Was the thermal technology selected as an interim action? No c) Was the thermal technology selected as a technology demonstration? No d) Did your regulators suggest or encourage use of the thermal technology selected?
Regulators would not accept a passive skimming system because they wanted to ensure no oil left the site (oil had migrated onto Coast Guard property in the past). They encourage either steam or electrical resistivity heating to enhance product removal.
e) Was the technology selected based on vendor marketing efforts? No f) Knowing project results, would you use the selected thermal technology again?
The Navy would to increase removal and pacify political pressure. g) Knowing project results, would you select a different thermal technology? No

h) Knowing project results, would you select a non-thermal technology? No i) Are you willing to participate further in this thermal technology evaluation? Yes j) Are you willing to share cost data for use in this life cycle cost evaluation of
thermal technology enhancements? Yes