cost reduction potential for electrolyser technology · 2019-09-06 · camao, brazil . 10 eu p2g...
TRANSCRIPT

EU P2G Platform | Berlin (DE)| 19.06.2018 1
COST REDUCTION POTENTIAL FOR ELECTROLYSER TECHNOLOGY
Denis THOMAS, Hydrogenics Europe N.V.
EU Regulatory Affairs and Business Development Manager for Renewable Hydrogen
18 June 2018, Berlin (via conference call)

EU P2G Platform | Berlin (DE)| 19.06.2018 2
Introduction video
https://youtu.be/UJXhX4dLMtA

EU P2G Platform | Berlin (DE)| 19.06.2018 3
Agenda
1. Hydrogenics & water electrolysers
2. Actual and future costs of water electrolysers
3. Concluding remarks

EU P2G Platform | Berlin (DE)| 19.06.2018 4
Leading Hydrogen TECHNOLOGY PROVIDER
Onsite Generation | Electrolysers H2O + electricity H2 + ½ O2
Industrial Hydrogen Hydrogen Fueling
Power Systems | Fuel Cell Modules H2 + ½ O2 H2O + electricity
Stand-by Power Mobility Power

EU P2G Platform | Berlin (DE)| 19.06.2018 5
Hydrogenics, a 100% global hydrogen company
Hydrogenics Corporation
Headquarter Mississauga, Ontario, Canada Since 1948 +/- 70 employees Areas of expertise: Fuel cells, PEM electrolysis, Power-to-Gas Previously: The Electrolyser Company, Stuart Energy
Hydrogenics Gmbh
Gladbeck, Germany Since 2002 +/- 15 employees Areas of expertise: Fuel cells, mobility projects, Power-to-Gas
Hydrogenics Europe
Oevel, Belgium Since 1987 +/- 70 employees Areas of expertise: pressurized alkaline electrolysis, hydrogen refueling stations, Power-to-Gas Previously: Vandenborre Hydrogen Systems
In total: +170 employees Incorporated in 2000 [NASDAQ: HYGS; TSX: HYG] More than 3,000 products deployed in 100 countries worldwide Total revenues (2017): 48.1 Mio $ Over 65 years of electrolysis leadership
Production facility
Sales office

EU P2G Platform | Berlin (DE)| 19.06.2018 6
Renewable Hydrogen

EU P2G Platform | Berlin (DE)| 19.06.2018 7
Selection of our key references
Fuel cell for mobility (H2 buses), China Fuel cell for mobility (H2 trains) Alstom Coradia iLint , Germany
1 MW stationary Fuel cell (H2 repowering) Kolon, South-Korea
1,5 MW PEM P2G (direct injection), Hamburg, Germany
1 MW alkaline P2G (methanation) BIOCAT, Copenhagen, Denmark
700 bar Hydrogen Refueling Station Aberdeen, Scotland (UK)
Elec
tro
lysi
s Fu
el c
ells

EU P2G Platform | Berlin (DE)| 19.06.2018 8
HySTAT™ 60 - alkaline electrolyser

EU P2G Platform | Berlin (DE)| 19.06.2018 9
Extensive experience with alkaline technology (>30 years)
Elemash, Russia
Kirovgrad, Russia
Saint Gobain, Colombia
Nyagan, Russia
Bushan, India
Camao, Brazil

EU P2G Platform | Berlin (DE)| 19.06.2018 10
World hydrogen market
Production Storage / Transport / Distribution End-use
But most (96%) of the hydrogen produced today is not CO2-free
(from gas, oil, coal)
If produced from renewable power via electrolysis, hydrogen is fully renewable and CO2-free.
Renewable hydrogen has the potential to decarbonize a large
range of applications
Data source: The Hydrogen Economy, M. Ball 2009 & Esprit Associates 2014
1-2 €/kg
4-10 €/kg
2-8 €/kg
>1 €/kg
20 €/MWh > 1€/kg

EU P2G Platform | Berlin (DE)| 19.06.2018 11
HyLYZER® - PEM : key milestones @ Hydrogenics
1999 2004 2012 2014 2015 2017 2018 …
R&D
Test large stack
1,5 MW cell stack Dual cell stack design
Field test 1.5 MW electrolyser
Small scale PEM electrolyser
2.5/3 MW cell stack
Multi MW design
+15 MW

EU P2G Platform | Berlin (DE)| 19.06.2018 12
New benchmark in PEM electrolysis HyLYZER®-600 3 MW cell stack from Hydrogenics for multi-MW projects
Power Input: 1.5 MW Hydrogen Output: 310 Nm3/h Design Pressure: 40 bar
Power Input: 3.0 MW Hydrogen Output: 620 Nm3/h Design Pressure: 40 bar
2014 2017
MW Scale Electrolyzer
Stack
3.0 MW industry benchmark
1
Reduction of Plant
Capital Costs
Achieved target system cost
2
Stack Efficiency
Improvements
Leading industry performance
3
Fast Response and
Dynamic Operation
Key IPR established
4
Reduced Maintenance
Limited and optimised
6
Very compact
Lowest footprint on the market
5

EU P2G Platform | Berlin (DE)| 19.06.2018 13
HySTAT®-15-10 HySTAT®-60-10 HySTAT®-100-10 HyLYZER® -300-30 HyLYZER® -1.000-30 HyLYZER® -5.000-30
Output pressure 10 barg (27 barg optional) 30 barg
Number of cell stacks 1 4 6 1 2 10
Nominal Hydrogen Flow 15 Nm³/h 60 Nm³/h 100 Nm³/h 300 Nm³/h 1.000 Nm³/h 5.000 Nm³/h
Nominal input power 80 kW 300 kW 500 kW 1.5 MW 5 MW 25 MW
AC power consumption (utilities included, at nominal capacity)
5.0-5.4 kWh/Nm³ 5.0-5.4 kWh/Nm³
Hydrogen flow range 40-100% 10-100% 5-100% 1-100%
Hydrogen purity 99.998% O2 < 2 ppm, N2 < 12 ppm (higher purities optional)
99.998% O2 < 2 ppm, N2 < 12 ppm (higher purities optional)
Tap water consumption <1.7 liters / Nm³ H2 <1.4 liters / Nm³ H2
Footprint (in containers) 1 x 20 ft 1 x 40 ft 1 x 40 ft 1 x 40 ft 2 x 40 ft 10 x 40 ft
Footprint utilities (optional) Incl. Incl. Incl. 1 x 20 ft 1 x 20 ft 5 x 20 ft
Alkaline & PEM electrolysis | Product’s line
Alkaline PEM (Proton Exchange Membrane)

EU P2G Platform | Berlin (DE)| 19.06.2018 14
2018 HyLYZER® -1000-30
5 MW PEM Electrolyser
• Containerized design & compact footprint: 2 x 40 ft • Plug&Play modular design based on 2 x 2,5 MW cell stacks • Fully tested & certified @ Hydrogenics’s factory

EU P2G Platform | Berlin (DE)| 19.06.2018 15
Learnings from demonstration projects
• System cost is coming down faster than expected
• System energy efficiency on track to achieve objectives
• System responsiveness adequate for ancillary grid services
• Maintenance cost trending towards 1% of Capex
• Footprint PEM system adequate for large-scale solutions

EU P2G Platform | Berlin (DE)| 19.06.2018 16
Renewable hydrogen Selection of recent demonstration projects
Main conclusions from these projects:
1. Hydrogen technologies work fine and deliver according to expectations.
2. There is still room for further technical improvement but no technology breakthrough is expected.
3. There is a important potential for further cost reduction: going from project manufacturing to product manufacturing
4. Energy regulatory framework is no suited for these applications and business operation of these projects remains very challenging
Country Project Size Year Electrolyser technology
Po
we
r
Gas
Ind
ust
ry
Mo
bili
ty
Fue
l
Norway Haeolus 2 MW + 100 kW FC 2018 PEM •
Germany MefCO2 1 MW 2018 PEM •
Germany WindGas Brunsbuttel 2.4 MW 2017 PEM •
Thailand EGAT 1 MW + 300 kW FC 2017 PEM •
Canada Embridge P2G 2.4 MW + 100 kW FC 2017 PEM •
Denmark HyBalance 1.2 MW 2017 PEM • •
Denmark BioCat 1 MW 2016 Alkaline •
Italy Ingrid 1 MW + 100 kW FC 2016 Alkaline • • •
UK Aberdeen 1 MW 2016 Alkaline •
Germany WindGas Reitbrook 1.5 MW 2015 PEM •
Belgium DonQuichote 150 kW + 100 kW FC 2015 Alkaline + PEM • •
Germany WindGas Falkenhagen 2 MW 2014 Alkaline •
+ CO2
+ CO2
+ CO2
+ CO2

EU P2G Platform | Berlin (DE)| 19.06.2018 17
Opex ~2%
Capex
~20%
Wholesale Price
Electricity
~30%
Grid Fees and Levies
~50%
Hydrogen Cost
Service Income (balancing)
~xx%
Renewable Credit:
Technology Push
& Market Pull
measures
~xx%
Feedstock Income
(H2, O2, Heat)
~xx%
Investor Bonus
Business Case Drivers For more information on the economics,
consult the Power-to-Gas Roadmap for Flanders: www.power-to-gas.be/roadmap-study
For good economics: low power price, high operating time and high value for end product are key !

EU P2G Platform | Berlin (DE)| 19.06.2018 18
Agenda
1. Hydrogenics & water electrolysers
2. Actual and future costs of water electrolysers
3. Concluding remarks

EU P2G Platform | Berlin (DE)| 19.06.2018 19
System boundaries for key performance indicators and techno-economic analysis
Source: FCH-JU, Development of Water Electrolysis in the European Union, February 2014, http://www.fch.europa.eu/node/783

EU P2G Platform | Berlin (DE)| 19.06.2018 20
Efficiency cost of electricity
Source: FCH-JU, Development of Water Electrolysis in the European Union, February 2014, http://www.fch.europa.eu/node/783

EU P2G Platform | Berlin (DE)| 19.06.2018 21
CAPEX driver for high operating time
Source: FCH-JU, Development of Water Electrolysis in the European Union, February 2014, http://www.fch.europa.eu/node/783
EU P2G Platform | Berlin (DE)| 19.06.2018 22
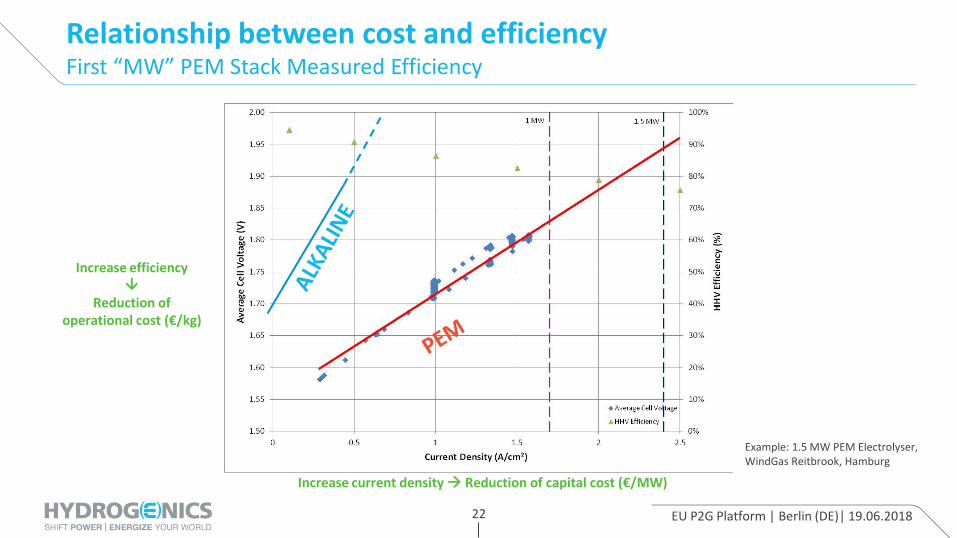
Relationship between cost and efficiency First “MW” PEM Stack Measured Efficiency
Increase current density Reduction of capital cost (€/MW)
Increase efficiency
Reduction of operational cost (€/kg)
Example: 1.5 MW PEM Electrolyser, WindGas Reitbrook, Hamburg

EU P2G Platform | Berlin (DE)| 19.06.2018 23
Size effect, output pressure, lifetime, maintenance
Item Unit 2015 2030 2050
Alkaline kW-scale
H2 nominal production capacity Nm³/h 60 300 300
Efficiency kWh/Nm³ H2 5,2 5,1 5
Electrical power kW 312 1.530 1.560
Output pressure barg 10 60 60
Water consumption with R/O liter / Nm³ H2 1,3 1,3 1,3
Price € 624.000 1.836.000 1.029.600
Price/kW - SYSTEM €/kW 2.000 1.200 660
OPEX €/kW/year 80 64 56
Expected cell stack expected lifetime hours 60.000 60.000 60.000
Cell stack cost / electrolyser cost 30% 30% 30%
PEM - MW scale
H2 nominal production capacity Nm³/h 200 200 200
Efficiency kWh/Nm³ H2 5,2 5,1 5
Electrical power kW 1.040 1.020 1.040
Output pressure barg 30 30 30
Water consumption with R/O liter / Nm³ H2 1,3 1,3 1,3
Price € 1.560.000 1.020.000 572.000
Price/kW - SYSTEM €/kW 1.500 1.000 550
OPEX €/kW/year 60 48 42
Expected cell stack expected lifetime hours 40.000 50.000 60.000
Cell stack cost / electrolyser cost 40% 40% 40%
PEM - multi-MW scale
H2 nominal production capacity Nm³/h 3120 3120 3120
Efficiency kWh/Nm³ H2 5 4,9 4,8
Electrical power kW 15.600 15.288 15.600
Output pressure barg 30 30 30
Water consumption with R/O liter / Nm³ H2 1,3 1,3 1,3
Price € 15.600.000 10.701.600 6.006.000
Price/kW - SYSTEM €/kW 1.000 700 385
OPEX €/kW/year 40 32 28
Expected cell stack expected lifetime hours 40.000 50.000 60.000
Cell stack cost / electrolyser cost 50% 50% 50%
Power-to-Gas Roadmap for Flanders; Brussels, October 2016, http://www.power-to-gas.be/roadmap-study

EU P2G Platform | Berlin (DE)| 19.06.2018 24
Cell stack replacement cost
Power-to-Gas Roadmap for Flanders; Brussels, October 2016 http://www.power-to-gas.be/roadmap-study

EU P2G Platform | Berlin (DE)| 19.06.2018 25
IEA HIA Task 38 – Brief ‘Electrolysis: What are the investment costs? State of the art and outlook’
Key takeaways:
• 750 €/kW is reachable today for atmospheric alkaline electrolysers
• 750 €/kW seems achievable today for multi-MW PEM projects
• Alkaline is very mature technology
• Cost reduction potential seems higher with PEM technology (beginning of the learning curve)

EU P2G Platform | Berlin (DE)| 19.06.2018 26
Agenda
1. Hydrogenics & water electrolysers
2. Actual and future costs of water electrolysers
3. Concluding remarks

EU P2G Platform | Berlin (DE)| 19.06.2018 27
All time-related cost predictions for solar PV have been wrong, because market uptake and technology adoption happened much faster than forecasted !

EU P2G Platform | Berlin (DE)| 19.06.2018 28
Experience curves can give a good indication, but such curves for water electrolysis do not really exist yet…
EU P2G Platform | Berlin (DE)| 19.06.2018 29
Drivers for cost reduction
• Market uptake higher volumes cost reduction
• Improvement of the supply chain: more suppliers
• Higher competition lower margins lower prices
• Product standardization
• Better products : quality, efficiency, higher pressure, lifetime…
• Decrease the use of expensive raw material (catalysts)
• Products will be more compact less BOP, logistics, civil works
• Synergies with PEM fuel cells (volumes are increasing rapidly there already). The cost of PEM electrolyzers will benefit from this synergy (+/- same suppliers).

EU P2G Platform | Berlin (DE)| 19.06.2018 30
Final comments
• Compare apples with apples: certainly not only CAPEX (€/kW)
• What matters is the €/kg H2 production cost related to water electrolysis over the entire project lifecycle (Total cost of ownership) which needs to consider at least:
– Total investment (electrolyser + compression + storage + grid connection + civil works + project costs)
– Efficiency (incl. degradation)
– Maintenance
– Lifetime
– Warranties

EU P2G Platform | Berlin (DE)| 19.06.2018 31
Thank you for your attention
Denis THOMAS | Renewable Hydrogen EU Regulatory Affairs & Business Development Manager Mobile: +32 479 909 129 | Email: [email protected]

EU P2G Platform | Berlin (DE)| 19.06.2018 32
Early business cases for H2 in energy storage and more broadly power to H2 applications
FCH-JU , Early business cases for H2 in energy storage and more broadly power to H2 applications, June 2017, http://www.fch.europa.eu/publications/study-early-business-cases-h2-energy-storage-and-more-broadly-power-h2-applications

EU P2G Platform | Berlin (DE)| 19.06.2018 33
Future cost and performance of water electrolysis: An expert elicitation study

EU P2G Platform | Berlin (DE)| 19.06.2018 34
Future cost and performance of water electrolysis: An expert elicitation study