cost-volume-profit relationships€¦ · pihcvpgh $350,000 preparing the cvp graph $300,000 choose...
TRANSCRIPT

Cost-Volume-Profit RelationshipsChapter 05
PowerPoint Authors:Susan Coomer Galbreath, Ph.D., CPACharles W Caldwell D B A CMACharles W. Caldwell, D.B.A., CMAJon A. Booker, Ph.D., CPA, CIACynthia J. Rooney, Ph.D., CPA
McGraw-Hill/Irwin Copyright © 2013 by The McGraw-Hill Companies, Inc. All rights reserved.
L i Obj i 1Learning Objective 1
Explain how changes in activity affectactivity affect
contribution margin and net operating incomenet operating income.
5-2
B i f C V l P fi A l iBasics of Cost-Volume-Profit AnalysisTh t ib ti i t t t i h l f l tTh t ib ti i t t t i h l f l tThe contribution income statement is helpful to managers The contribution income statement is helpful to managers
in judging the impact on profits of changes in selling in judging the impact on profits of changes in selling price cost or volume The emphasis is on cost behaviorprice cost or volume The emphasis is on cost behavior
Racing Bicycle CompanyContribution Income Statement
price, cost, or volume. The emphasis is on cost behavior.price, cost, or volume. The emphasis is on cost behavior.
Sales (500 bicycles) 250,000$ Less: Variable expenses 150,000
Contribution Income StatementFor the Month of June
Less: Variable expenses 150,000 Contribution margin 100,000 Less: Fixed expenses 80,000 Net operating income 20 000$
Contribution Margin (CM) is the amount remaining fromContribution Margin (CM) is the amount remaining from
Net operating income 20,000$
5-3
Contribution Margin (CM) is the amount remaining from Contribution Margin (CM) is the amount remaining from sales revenue after variable expenses have been deducted.sales revenue after variable expenses have been deducted.
B i f C V l P fi A l iBasics of Cost-Volume-Profit Analysis
Racing Bicycle CompanyContribution Income Statement
Sales (500 bicycles) 250,000$ Less: Variable expenses 150,000
For the Month of June
Less: Variable expenses 150,000 Contribution margin 100,000 Less: Fixed expenses 80,000 N t ti i 20 000$Net operating income 20,000$
CM is used first to cover fixed expenses. Any CM is used first to cover fixed expenses. Any remaining CM contributes to net operating income.remaining CM contributes to net operating income.
5-4
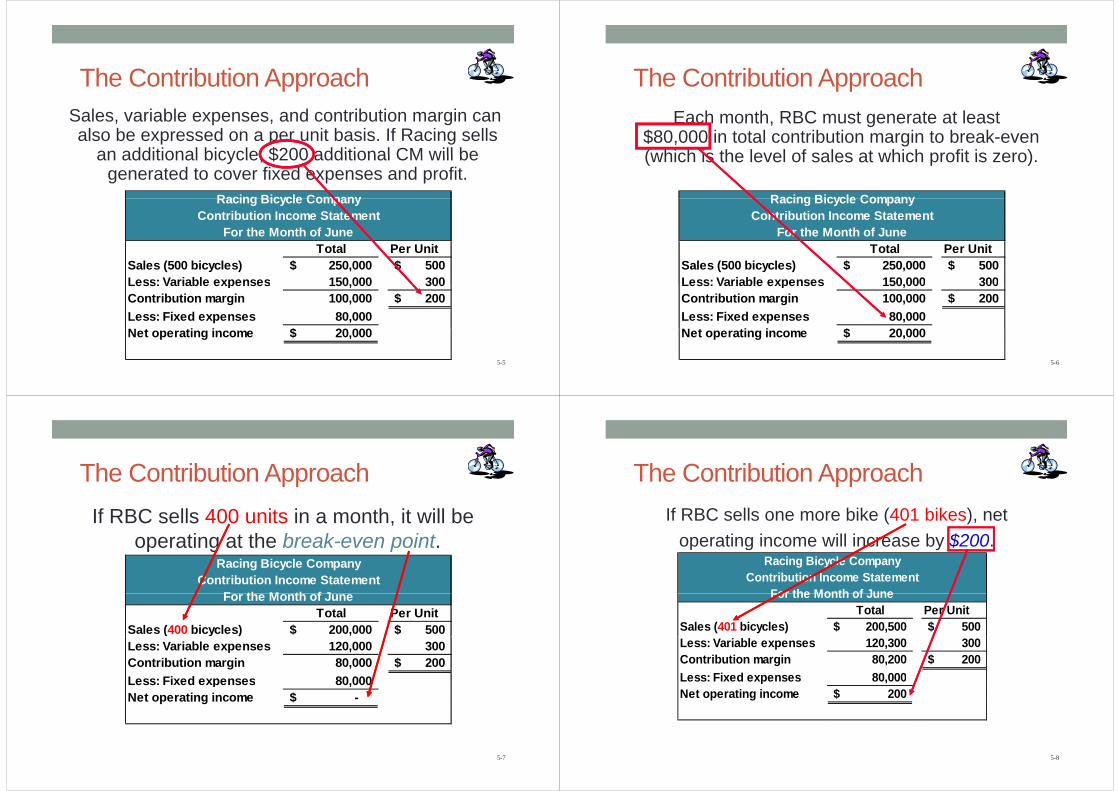
Th C ib i A hThe Contribution ApproachS l i bl d t ib ti iSales, variable expenses, and contribution margin can also be expressed on a per unit basis. If Racing sells
an additional bicycle $200 additional CM will be
Racing Bicycle Company
an additional bicycle, $200 additional CM will be generated to cover fixed expenses and profit.
Racing Bicycle CompanyContribution Income Statement
For the Month of JuneTotal Per Unit
Sales (500 bicycles) 250,000$ 500$ Less: Variable expenses 150,000 300Less: Variable expenses 150,000 300 Contribution margin 100,000 200$ Less: Fixed expenses 80,000
$
5-5
Net operating income 20,000$
Th C ib i A hThe Contribution ApproachE h th RBC t t t l tEach month, RBC must generate at least
$80,000 in total contribution margin to break-even (which is the level of sales at which profit is zero)
Racing Bicycle Company
(which is the level of sales at which profit is zero).
Racing Bicycle CompanyContribution Income Statement
For the Month of JuneTotal Per Unit
Sales (500 bicycles) 250,000$ 500$ Less: Variable expenses 150,000 300Less: Variable expenses 150,000 300 Contribution margin 100,000 200$ Less: Fixed expenses 80,000
$
5-6
Net operating income 20,000$
Th C ib i A hThe Contribution ApproachIf RBC sells 400 units in a month, it will be
operating at the break-even point.Racing Bicycle Company
Contribution Income StatementF th M th f J
p g p
Total Per UnitSales (400 bicycles) 200,000$ 500$
For the Month of June
Less: Variable expenses 120,000 300 Contribution margin 80,000 200$ Less: Fixed expenses 80 000Less: Fixed expenses 80,000 Net operating income -$
5-7
Th C ib i A hThe Contribution ApproachIf RBC sells one more bike (401 bikes), net
operating income will increase by $200.Racing Bicycle Company
Contribution Income StatementFor the Month of June
p g y
Total Per UnitSales (401 bicycles) 200,500$ 500$
For the Month of June
Less: Variable expenses 120,300 300 Contribution margin 80,200 200$ Less: Fixed expenses 80,000Less: Fixed expenses 80,000 Net operating income 200$
5-8
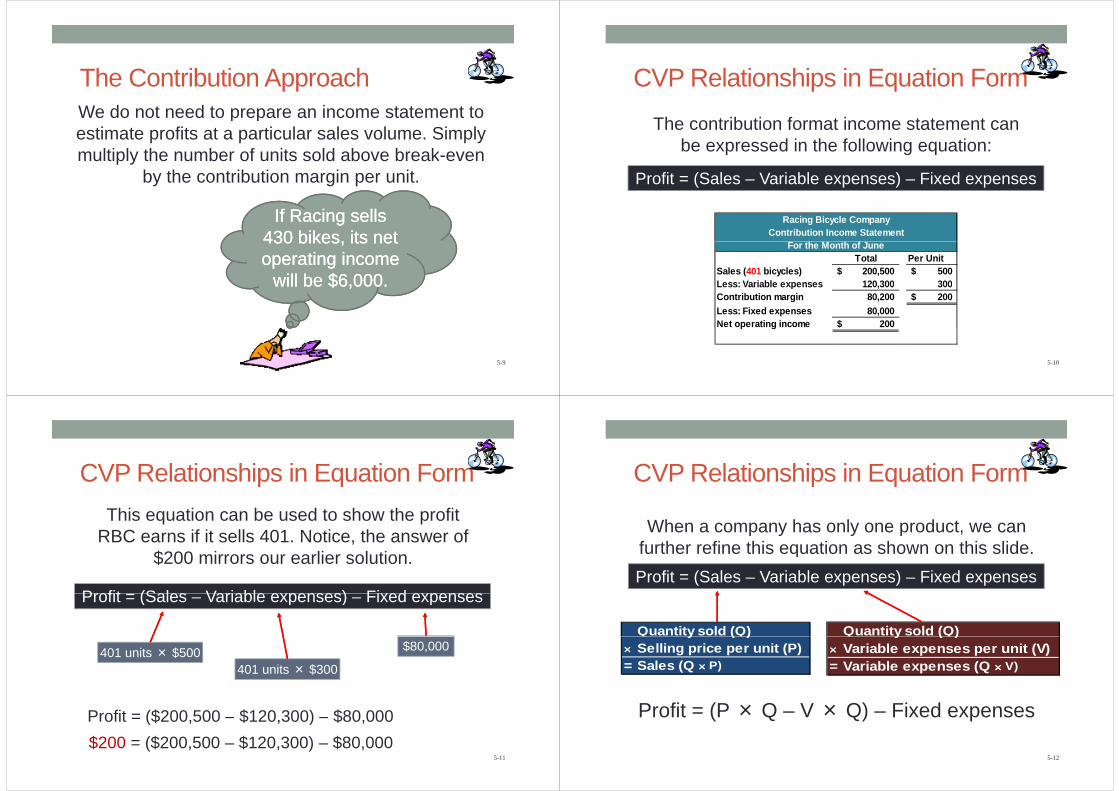
Th C ib i A hThe Contribution ApproachWe do not need to prepare an income statement toWe do not need to prepare an income statement to estimate profits at a particular sales volume. Simply multiply the number of units sold above break evenmultiply the number of units sold above break-even
by the contribution margin per unit.
If Racing sells If Racing sells 430 bikes its net430 bikes its net430 bikes, its net 430 bikes, its net operating income operating income
will be $6,000.will be $6,000.will be $6,000.will be $6,000.
5-9
CVP R l i hi i E i FCVP Relationships in Equation Form
The contribution format income statement can be expressed in the following equation:p g q
Profit = (Sales – Variable expenses) – Fixed expenses
Racing Bicycle CompanyContribution Income Statement
Total Per UnitSales (401 bicycles) 200,500$ 500$ Less: Variable expenses 120 300 300
For the Month of June
Less: Variable expenses 120,300 300 Contribution margin 80,200 200$ Less: Fixed expenses 80,000 Net operating income 200$
5-10
p g
CVP R l i hi i E i FCVP Relationships in Equation FormThis equation can be used to show the profit
RBC earns if it sells 401. Notice, the answer of $$200 mirrors our earlier solution.
Profit (Sales Variable e penses) Fi ed e pensesProfit = (Sales – Variable expenses) – Fixed expenses
401 units × $500401 units × $300
$80,000
Profit = ($200,500 – $120,300) – $80,000
5-11
($ , $ , ) $ ,$200 = ($200,500 – $120,300) – $80,000
CVP R l i hi i E i FCVP Relationships in Equation Form
When a company has only one product, we can further refine this equation as shown on this slidefurther refine this equation as shown on this slide.Profit = (Sales – Variable expenses) – Fixed expenses
Quantity sold (Q) Quantity sold (Q)y ( )× Selling price per unit (P)= Sales (Q × P)
y ( )× Variable expenses per unit (V)= Variable expenses (Q × V)
Profit = (P × Q – V × Q) – Fixed expenses
5-12
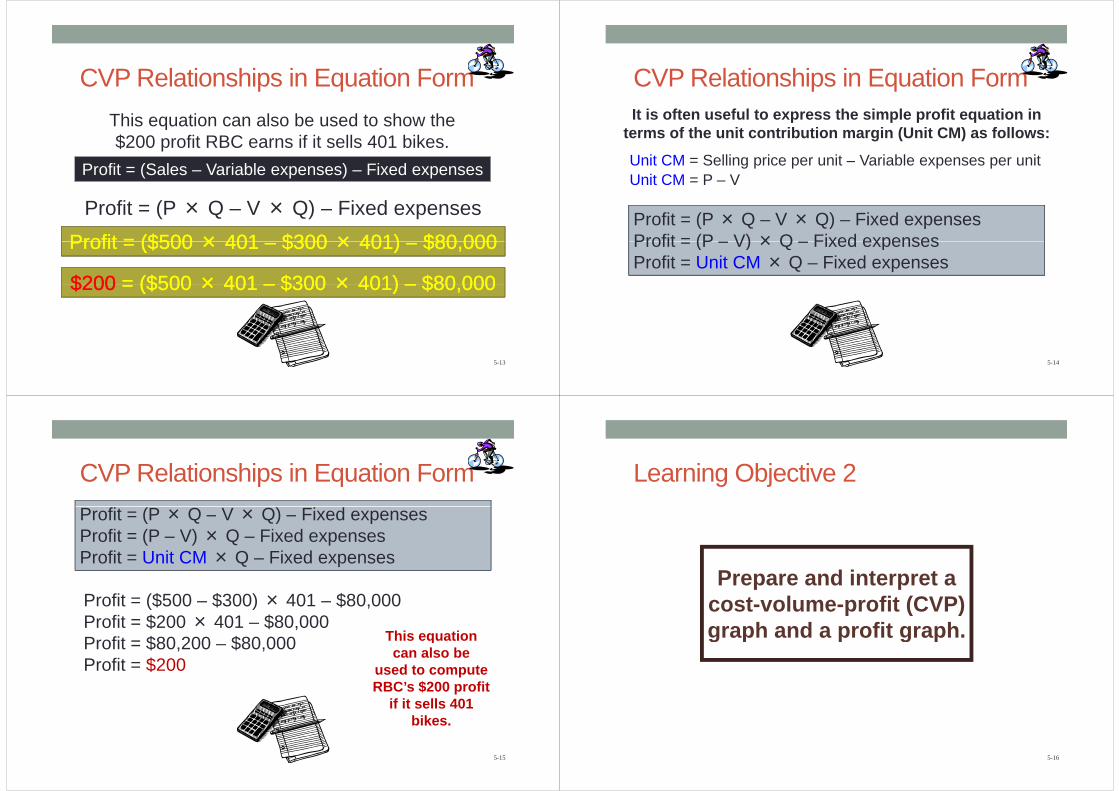
CVP R l i hi i E i FCVP Relationships in Equation FormThis equation can also be used to show the $200 profit RBC earns if it sells 401 bikes.
Profit = (Sales – Variable expenses) – Fixed expenses
Profit = (P × Q – V × Q) – Fixed expensesProfit = ($Profit = ($500500 ×× 401401 $$300300 ×× 401401)) $$8080 000000Profit = ($Profit = ($500 500 ×× 401 401 –– $$300 300 ×× 401401) ) –– $$8080,,000000
$200$200 = ($500= ($500 ×× 401401 –– $300$300 ×× 401)401) –– $80 000$80 000$200 $200 = ($500 = ($500 ×× 401 401 –– $300 $300 ×× 401) 401) –– $80,000$80,000
5-13
CVP R l i hi i E i FCVP Relationships in Equation FormIt is often sef l to e press the simple profit eq ation in
U it CM S lli i it V i bl it
It is often useful to express the simple profit equation in terms of the unit contribution margin (Unit CM) as follows:
Unit CM = Selling price per unit – Variable expenses per unitUnit CM = P – V
Profit = (P × Q – V × Q) – Fixed expensesProfit = (P – V) × Q – Fixed expensesProfit = (P – V) × Q – Fixed expensesProfit = Unit CM × Q – Fixed expenses
5-14
CVP R l i hi i E i FCVP Relationships in Equation FormProfit = (P × Q – V × Q) – Fixed expensesProfit = (P – V) × Q – Fixed expensesProfit = Unit CM × Q – Fixed expenses
f ($ $ ) $Profit = ($500 – $300) × 401 – $80,000Profit = $200 × 401 – $80,000P fit $80 200 $80 000 This equationProfit = $80,200 – $80,000Profit = $200
This equation can also be
used to compute RBC’s $200 profit
if it sells 401 bikes
5-15
bikes.
L i Obj i 2Learning Objective 2
Prepare and interpret a cost-volume-profit (CVP) graph and a profit graph.graph and a profit graph.
5-16

CVP R l i hi i G hi FCVP Relationships in Graphic FormTh l ti hi t fit d lThe relationships among revenue, cost, profit, and volume
can be expressed graphically by preparing a CVP graph. Racing Bicycle developed contribution margin income g y p g
statements at 0, 200, 400, and 600 units sold. We will use this information to prepare the CVP graph.
0 200 400 600 Sales $ 100 000$ 200 000$ 300 000$
Units Sold
Sales -$ 100,000$ 200,000$ 300,000$ Total variable expenses - 60,000 120,000 180,000 Contribution margin - 40,000 80,000 120,000 Fi d 80 000 80 000 80 000 80 000Fixed expenses 80,000 80,000 80,000 80,000 Net operating income (loss) (80,000)$ (40,000)$ -$ 40,000$
5-17
P i h CVP G h$350,000
Preparing the CVP Graph
$300,000
$350,000
$200,000
$250,000
$150,000
$200,000
$50 000
$100,000 In a CVP graph, unit volume is usually represented on the horizontal (X) axis
$0
$50,000
0 100 200 300 400 500 600
p ( )and dollars on the vertical (Y) axis.
5-18
Units
P i h CVP G h$350,000
Preparing the CVP Graph
$300,000
$350,000 Draw a line parallel to the volume axis
to represent total fixed expenses.
Draw a line parallel to the volume axis
to represent total fixed expenses.
$200 000
$250,000
$150,000
$200,000
Fixed expenses
$50 000
$100,000
$0
$50,000
0 100 200 300 400 500 600
5-19
Units
P i h CVP G h$350,000
Preparing the CVP Graph
$300,000
$350,000 Choose some sales volume, say 400 units, and plot the point representing Choose some sales volume, say 400 units, and plot the point representing
total expenses (fixed and variable). Draw a line through the data point total expenses (fixed and variable). Draw a line through the data point back to where the fixed expenses line intersects the dollar axisback to where the fixed expenses line intersects the dollar axis
Choose some sales volume, say 400 units, and plot the point representing Choose some sales volume, say 400 units, and plot the point representing
total expenses (fixed and variable). Draw a line through the data point total expenses (fixed and variable). Draw a line through the data point back to where the fixed expenses line intersects the dollar axisback to where the fixed expenses line intersects the dollar axis
$200,000
$250,000
back to where the fixed expenses line intersects the dollar axis.back to where the fixed expenses line intersects the dollar axis.back to where the fixed expenses line intersects the dollar axis.back to where the fixed expenses line intersects the dollar axis.
$150,000
$200,000
Total expenses
Fixed expenses
$50 000
$100,000
$0
$50,000
0 100 200 300 400 500 600
5-20
Units

P i h CVP G h$350,000
Preparing the CVP Graph
$300,000
$350,000 Choose some sales volume, say Choose some sales volume, say 400 400 units, and plot the point representing units, and plot the point representing total sales. Draw a line through the data point back to the point of origin.total sales. Draw a line through the data point back to the point of origin.
Choose some sales volume, say Choose some sales volume, say 400 400 units, and plot the point representing units, and plot the point representing total sales. Draw a line through the data point back to the point of origin.total sales. Draw a line through the data point back to the point of origin.
$200,000
$250,000
$150,000
$200,000
Sales
Total expenses
Fixed expenses
$50 000
$100,000
$0
$50,000
0 100 200 300 400 500 600
5-21
Units
P i h CVP G h$350,000
Preparing the CVP GraphBreakBreak--even pointeven point
$300,000
$350,000 BreakBreak even pointeven point((400 400 units or $units or $200200,,000 000 in sales)in sales) Profit Area
$200,000
$250,000
$150,000
$200,000
Sales
Total expenses
Fixed expenses
$50 000
$100,000
$0
$50,000
0 100 200 300 400 500 600
5-22
UnitsLoss Area
P i h CVP G hPreparing the CVP GraphP fit U it CM Q Fi d C t
60,000$
Profit = Unit CM × Q – Fixed Costs
40,000$
20 000$
Prof
it
20,000$
$0
An even simpler form of-$20,000
-$40,000
An even simpler form of the CVP graph is called the profit graph.
0 100 200 300 400 500 600
-$60,000
the profit graph.
5-23
Number of bicycles sold
P i h CVP G hPreparing the CVP Graph
60,000$ Break-even point, where
40,000$
20 000$
pprofit is zero, is 400
units sold.
Prof
it
20,000$
$0
-$20,000
-$40,000
0 100 200 300 400 500 600
-$60,000
5-24
Number of bicycles sold

L i Obj i 3Learning Objective 3
Use the contribution margin ratio (CM ratio) to compute changes into compute changes in
contribution margin and net operating income
resulting from changes g gin sales volume.
5-25
C ib i M i R i (CM R i )Contribution Margin Ratio (CM Ratio)The CM ratio is calculated by dividing the totalThe CM ratio is calculated by dividing the total
Racing Bicycle Company
The CM ratio is calculated by dividing the total The CM ratio is calculated by dividing the total contribution margin by total sales.contribution margin by total sales.
Racing Bicycle CompanyContribution Income Statement
For the Month of JuneTotal Per Unit CM Ratio
Sales (500 bicycles) 250,000$ 500$ 100%Less: Variable expenses 150 000 300 60%Less: Variable expenses 150,000 300 60%Contribution margin 100,000 200$ 40%Less: Fixed expenses 80,000
$Net operating income 20,000$
5-26
$100,000 ÷ $250,000 = 40%
C ib i M i R i (CM R i )Contribution Margin Ratio (CM Ratio)The contribution margin ratio at Racing Bicycle is:
CM per unitSP per unitCM Ratio = = 40%$200
$500=
The CM ratio can also be calculated by
p
The CM ratio can also be calculated by dividing the contribution margin per unit by
the selling price per unitthe selling price per unit.
5-27
C ib i M i R i (CM R i )Contribution Margin Ratio (CM Ratio)If Racing Bicycle increases sales from 400 to 500 bikes ($50 000)If Racing Bicycle increases sales from 400 to 500 bikes ($50,000),
contribution margin will increase by $20,000 ($50,000 × 40%).Here is the proof:
400 Units 500 UnitsSales 200,000$ 250,000$ Less: variable expenses 120,000 150,000 Contribution margin 80,000 100,000 L fi d 80 000 80 000Less: fixed expenses 80,000 80,000 Net operating income -$ 20,000$
A $50,000 increase in sales revenue results in a $20,000 increase in CM ($50 000 × 40% = $20 000)
5-28
increase in CM ($50,000 × 40% = $20,000).
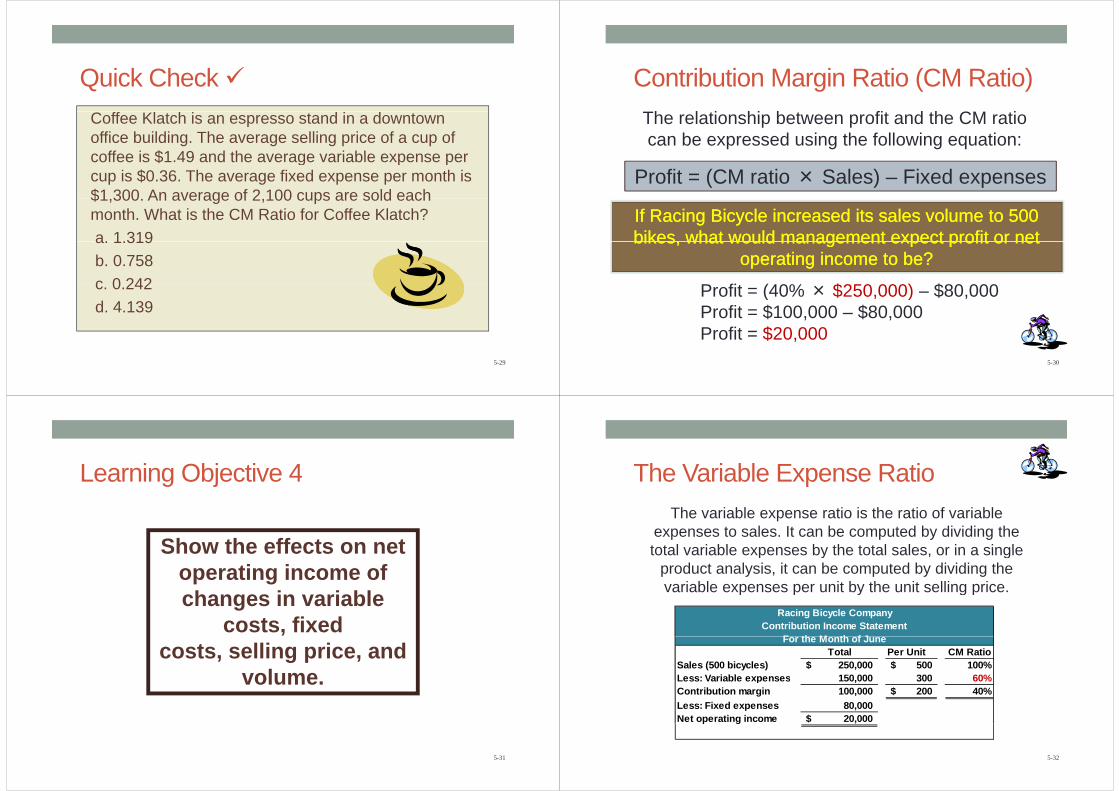
Q i k Ch kQuick Check Coffee Klatch is an espresso stand in a downtown office building. The average selling price of a cup of coffee is $1 49 and the average variable expense percoffee is $1.49 and the average variable expense per cup is $0.36. The average fixed expense per month is $1 300 An average of 2 100 cups are sold each$1,300. An average of 2,100 cups are sold each month. What is the CM Ratio for Coffee Klatch?a. 1.319a. 1.319b. 0.758c 0 242c. 0.242d. 4.139
5-29
C ib i M i R i (CM R i )Contribution Margin Ratio (CM Ratio)Th l ti hi b t fit d th CM tiThe relationship between profit and the CM ratio can be expressed using the following equation:
Profit = (CM ratio × Sales) – Fixed expenses
If Racing Bicycle increased its sales volume to If Racing Bicycle increased its sales volume to 500 500 bikes what would management expect profit or netbikes what would management expect profit or net
P fit (40% $250 000) $80 000
bikes, what would management expect profit or net bikes, what would management expect profit or net operating income to be?operating income to be?
Profit = (40% × $250,000) – $80,000Profit = $100,000 – $80,000P fit $20 000
5-30
Profit = $20,000
L i Obj i 4Learning Objective 4
Show the effects on netShow the effects on net operating income of
h i i blchanges in variable costs, fixed
costs, selling price, and volumevolume.
5-31
Th V i bl E R iThe Variable Expense RatioThe variable expense ratio is the ratio of variable
expenses to sales. It can be computed by dividing the total variable expenses by the total sales or in a singletotal variable expenses by the total sales, or in a single
product analysis, it can be computed by dividing the variable expenses per unit by the unit selling price.p p y g p
Racing Bicycle CompanyContribution Income Statement
F th M th f JTotal Per Unit CM Ratio
Sales (500 bicycles) 250,000$ 500$ 100%Less: Variable expenses 150 000 300 60%
For the Month of June
Less: Variable expenses 150,000 300 60%Contribution margin 100,000 200$ 40%Less: Fixed expenses 80,000 Net operating income 20,000$
5-32
p g ,
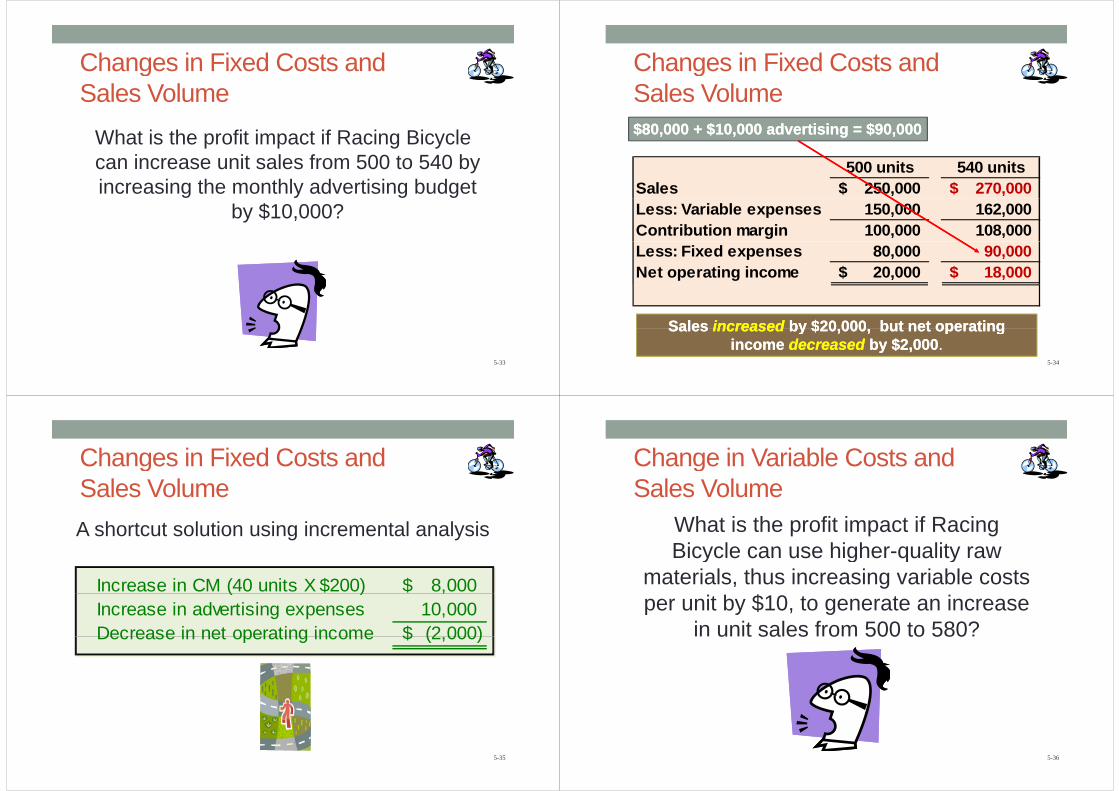
Changes in Fixed Costs andChanges in Fixed Costs andSales Volume
What is the profit impact if Racing Bicycle i it l f 500 t 540 bcan increase unit sales from 500 to 540 by
increasing the monthly advertising budget by $10,000?
5-33
Changes in Fixed Costs andChanges in Fixed Costs andSales Volume$$8080,,000 000 + $+ $1010,,000 000 advertising = $advertising = $9090,,000000
500 units 540 unitsSales 250,000$ 270,000$ Less: Variable expenses 150,000 162,000 Contribution margin 100,000 108,000 Less: Fixed expenses 80,000 90,000 Net operating income 20,000$ 18,000$
SalesSales increasedincreased by $by $2020 000000 but net operatingbut net operating
5-34
Sales Sales increasedincreased by $by $2020,,000000, but net operating , but net operating income income decreaseddecreased by $by $22,,000000..
Changes in Fixed Costs andChanges in Fixed Costs andSales VolumeA shortcut solution using incremental analysis
Increase in CM (40 units X $200) 8,000$ ( ) ,Increase in advertising expenses 10,000 Decrease in net operating income (2 000)$Decrease in net operating income (2,000)$
5-35
Change in Variable Costs andChange in Variable Costs andSales Volume
What is the profit impact if Racing Bicycle can use higher quality rawBicycle can use higher-quality raw
materials, thus increasing variable costs $per unit by $10, to generate an increase
in unit sales from 500 to 580?u t sa es o 500 to 580
5-36

Change in Variable Costs andChange in Variable Costs andSales Volume
580 580 units units ×× $$310 310 variable cost/unit = $variable cost/unit = $179179,,800800
500 units 580 unitsSales 250,000$ 290,000$ , ,Less: Variable expenses 150,000 179,800 Contribution margin 100,000 110,200 Less: Fixed expenses 80,000 80,000 Net operating income 20,000$ 30,200$
SalesSales increaseincrease by $40 000 and net operating incomeby $40 000 and net operating income
5-37
Sales Sales increaseincrease by $40,000 and net operating income by $40,000 and net operating income increasesincreases by $10,200by $10,200..
Change in Fixed Cost Sales PriceChange in Fixed Cost, Sales Price,and VolumeWhat is the profit impact if RBC (1) cuts its selling price $20 per unit (2) increases itsselling price $20 per unit, (2) increases its
advertising budget by $15,000 per month, and (3) increases sales from 500 to
650 units per month? 650 u ts pe o t
5-38
Change in Fixed Cost Sales PriceChange in Fixed Cost, Sales Price,and Volume
650 650 units units ×× $$480 480 = $= $312312,,000000
500 units 650 unitsSales 250,000$ 312,000$ Less: Variable expenses 150,000 195,000 Contribution margin 100,000 117,000 Less: Fixed expenses 80,000 95,000 Net operating income 20,000$ 22,000$
SalesSales increaseincrease by $by $6262 000000 fixed costs increase byfixed costs increase by
5-39
Sales Sales increaseincrease by $by $6262,,000000, fixed costs increase by , fixed costs increase by $$1515,,000000, and net operating income , and net operating income increasesincreases by $by $22,,000000..
Change in Variable Cost FixedChange in Variable Cost, FixedCost, and Sales VolumeWhat is the profit impact if RBC (1) pays a
$15 sales commission per bike sold instead$15 sales commission per bike sold instead of paying salespersons flat salaries that
tl t t l $6 000 th d (2)currently total $6,000 per month, and (2) increases unit sales from 500 to 575 bikes?
5-40

Change in Variable Cost FixedChange in Variable Cost, FixedCost, and Sales Volume
500 units 575 units575 575 units units ×× $$315 315 = $= $181181,,125125
500 units 575 unitsSales 250,000$ 287,500$ Less: Variable expenses 150 000 181 125Less: Variable expenses 150,000 181,125 Contribution margin 100,000 106,375 L Fi d 80 000 74 000Less: Fixed expenses 80,000 74,000 Net operating income 20,000$ 32,375$
SalesSales increaseincrease by $by $3737 500500 fixed expensesfixed expenses decreasedecrease byby
5-41
Sales Sales increaseincrease by $by $3737,,500500, fixed expenses , fixed expenses decreasedecrease by by $$66,,000000, and net operating income , and net operating income increasesincreases by $by $1212,,375375..
Ch i R l S l P iChange in Regular Sales Price
If RBC has an opportunity to sell 150 bikes to a wholesaler without disturbingbikes to a wholesaler without disturbing
sales to other customers or fixed h t i ld it t texpenses, what price would it quote to
the wholesaler if it wants to increase monthly profits by $3,000?
5-42
Ch i R l S l P iChange in Regular Sales Price
3,000$ ÷ 150 bikes = 20$ per bikeVariable cost per bike = 300 per bikeVariable cost per bike = 300 per bikeSelling price required = 320$ per bike
150 bik $320 bik 48 000$150 bikes × $320 per bike = 48,000$ Total variable costs = 45,000
$ Increase in net operating income = 3,000$
5-43
L i Obj iLearning Objective 5
Determine the level of sales needed to achievesales needed to achieve a desired target profit.
5-44

T P fi A l iTarget Profit Analysis
We can compute the number of units that must be sold to attain a targetthat must be sold to attain a target
profit using either:(1) Equation method, or
(2) Formula method.
5-45
E i M h dEquation MethodProfit = Unit CM × Q – Fixed expenses
Our goal is to solve for the unknown “Q” which represents the quantity of units that must be sold p q y
to attain the target profit.
5-46
T P fi A l iTarget Profit Analysis
Suppose RBC’s management wants to know how Suppose RBC’s management wants to know how many bikes must be sold to earn a target profit many bikes must be sold to earn a target profit y g py g p
of $of $100100,,000000..
Profit = Unit CM × Q – Fixed expenses$100 000 = $200 × Q – $80 000$100,000 $200 × Q $80,000$200 × Q = $100,000 – $80,000Q = ($100,000 + $80,000) ÷ $200Q = 900
5-47
Q = 900
Th F l M h dThe Formula Method
The formula uses the following equation.
Target profit + Fixed expensesCM per unit=Unit sales to attain
the target profit CM per unit the target profit
5-48

Target Profit Analysis in Terms ofTarget Profit Analysis in Terms of Unit SalesSuppose Racing Bicycle Company wants to know how many bikes must be sold to earn y
a profit of $100,000.
Target profit + Fixed expensesCM per unit =Unit sales to attain
the target profit pg p
$100 000 + $80 000
Unit sales = 900
$100,000 + $80,000$200Unit sales =
5-49
Unit sales = 900
T P fi A l iTarget Profit AnalysisWe can also compute the target profit in terms of sales dollars using either the equation method or
the formula method.
EquationEquation FormulaFormulaOREquationEquationMethodMethod
FormulaFormulaMethodMethod
OR
5-50
E i M h dEquation MethodProfit = CM ratio × Sales – Fixed expensesOur goal is to solve for the unknown “Sales,” which Our goal is to solve for the unknown “Sales,” which gg
represents the dollar amount of sales that must be represents the dollar amount of sales that must be sold to attain the target profit.sold to attain the target profit.g pg p
Suppose RBC management wants to know the Suppose RBC management wants to know the sales volume that must be generated to earn asales volume that must be generated to earn asales volume that must be generated to earn a sales volume that must be generated to earn a
target profit of $100,000.target profit of $100,000.$100 000 = 40% × Sales $80 000$100,000 = 40% × Sales – $80,00040% × Sales = $100,000 + $80,000Sales = ($100 000 + $80 000) ÷ 40%
5-51
Sales = ($100,000 + $80,000) ÷ 40%Sales = $450,000
F l M h dFormula MethodWe can calculate the dollar sales needed to attain a target profit (net operating profit) of
$100,000 at Racing Bicycle.
Target profit + Fixed expensesCM ratio=Dollar sales to attain
the target profit
$100,000 + $80,000Dollar sales =
Dollar sales = $450 00040%Dollar sales =
5-52
Dollar sales $450,000
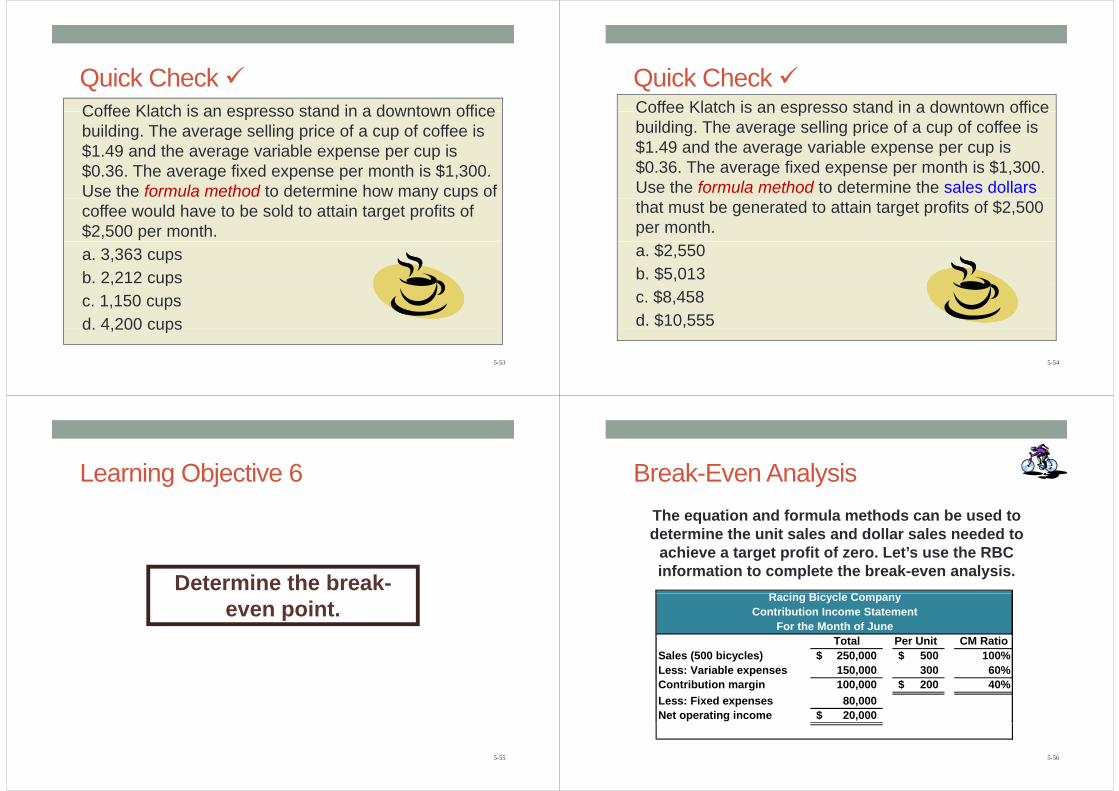
Q i k Ch kQuick Check Coffee Klatch is an espresso stand in a downtown officeCoffee Klatch is an espresso stand in a downtown office building. The average selling price of a cup of coffee is $1 49 and the average variable expense per cup is$1.49 and the average variable expense per cup is $0.36. The average fixed expense per month is $1,300. Use the formula method to determine how many cups of y pcoffee would have to be sold to attain target profits of $2,500 per month.a. 3,363 cupsb. 2,212 cups, pc. 1,150 cupsd. 4,200 cups
5-53
d. 4,200 cups
Q i k Ch kCoffee Klatch is an espresso stand in a downtown officeQuick Check Coffee Klatch is an espresso stand in a downtown office building. The average selling price of a cup of coffee is $1.49 and the average variable expense per cup is g p p p$0.36. The average fixed expense per month is $1,300. Use the formula method to determine the sales dollars that must be generated to attain target profits of $2,500 per month.a. $2,550b. $5,013c. $8,458d. $10,555
5-54
L i Obj i 6Learning Objective 6
Determine the break-even point.
5-55
B k E A l iBreak-Even AnalysisThe equation and formula methods can be used to determine the unit sales and dollar sales needed to
achieve a target profit of zero Let’s use the RBCachieve a target profit of zero. Let’s use the RBC information to complete the break-even analysis.
R i Bi l C
C
Racing Bicycle CompanyContribution Income Statement
For the Month of JuneTotal Per Unit CM Ratio
Sales (500 bicycles) 250,000$ 500$ 100%Less: Variable expenses 150,000 300 60%
$Contribution margin 100,000 200$ 40%Less: Fixed expenses 80,000 Net operating income 20,000$
5-56
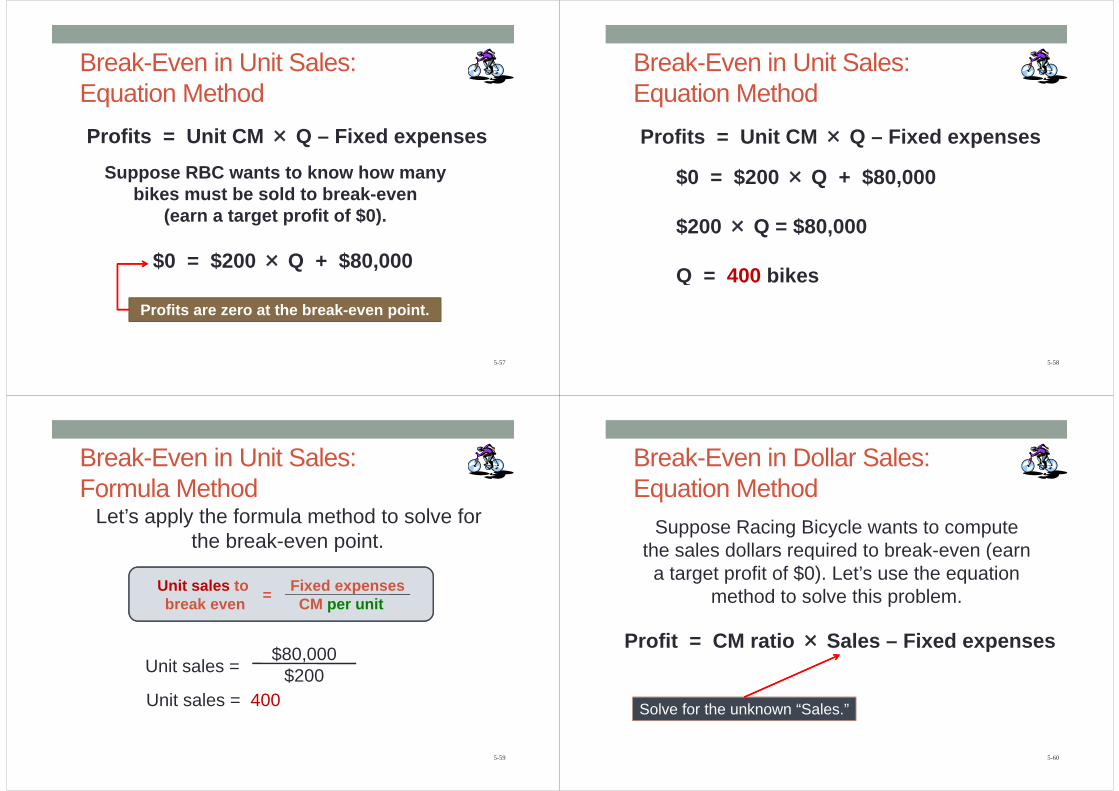
Break-Even in Unit Sales:Break Even in Unit Sales:Equation MethodProfits = Unit CM × Q – Fixed expenses
Suppose RBC wants to know how many bikes must be sold to break-evenbikes must be sold to break even
(earn a target profit of $0).
$0 = $200 × Q + $80,000
Profits are zero at the break-even point.
5-57
Break-Even in Unit Sales:Break Even in Unit Sales:Equation MethodProfits = Unit CM × Q – Fixed expenses
$0 = $200 × Q + $80,000
$200 × Q = $80,000
Q = 400 bikes
5-58
Break-Even in Unit Sales:Break Even in Unit Sales:Formula Method
Let’s apply the formula method to solve for the break-even point.p
Fixed expenses=Unit sales to pCM per unit =break even
$80,000$200Unit sales =
Unit sales = 400$200
5-59
Break-Even in Dollar Sales:Break Even in Dollar Sales:Equation Method
Suppose Racing Bicycle wants to compute the sales dollars required to break even (earnthe sales dollars required to break-even (earn
a target profit of $0). Let’s use the equation method to solve this problemmethod to solve this problem.
P fit CM ti × S l Fi dProfit = CM ratio × Sales – Fixed expenses
Solve for the unknown “Sales.”
5-60

Break-Even in Dollar Sales:Break Even in Dollar Sales:Equation Method
Profit = CM ratio × Sales – Fixed expenses
$ 0 = 40% × Sales – $80,000
40% × Sales = $80,000
Sales = $80,000 ÷ 40%
Sales = $200,000
5-61
Break-Even in Dollar Sales:Break Even in Dollar Sales:Formula MethodNow, let’s use the formula method to calculate the
dollar sales at the break even pointdollar sales at the break-even point.
D ll l t Fixed expensesCM ratio=Dollar sales to
break even
$80,000Dollar sales =
Dollar sales = $200,00040%Dollar sales =
5-62
$ ,
Q i k Ch kQuick Check Coffee Klatch is an espresso stand in a downtown office building. The average selling price of a cup of coffee is $1 49 and the average variable expense percoffee is $1.49 and the average variable expense per cup is $0.36. The average fixed expense per month is $1 300 An average of 2 100 cups are sold each$1,300. An average of 2,100 cups are sold each month. What is the break-even sales dollars?a. $1,300a. $1,300b. $1,715c $1 788c. $1,788d. $3,129
5-63
Q i k Ch kQuick Check Coffee Klatch is an espresso stand in a downtown office building. The average selling price of a cup of coffee is $1 49 and the average variable expense percoffee is $1.49 and the average variable expense per cup is $0.36. The average fixed expense per month is $1 300 An average of 2 100 cups are sold each$1,300. An average of 2,100 cups are sold each month. What is the break-even sales in units?a. 872 cupsa. 872 cupsb. 3,611 cupsc 1 200 cupsc. 1,200 cupsd. 1,150 cups
5-64

L i Obj iLearning Objective 7
Compute the margin of f t d l i itsafety and explain its
significance.
5-65
Th M i f S f i D llThe Margin of Safety in DollarsThe margin of safety in dollars is the excess
of budgeted (or actual) sales over the g ( )break-even volume of sales.
M i f f t i d ll T t l l B k lMargin of safety in dollars = Total sales - Break-even sales
Let’s look at Racing Bicycle Company and determine the margin of safety.g y
5-66
Th M i f S f i D llThe Margin of Safety in DollarsIf we assume that RBC has actual sales of
$250,000, given that we have already determined $the break-even sales to be $200,000, the margin
of safety is $50,000 as shown.
Break-even l A t l lsales
400 unitsActual sales
500 unitsSales 200,000$ 250,000$ Less: variable expenses 120,000 150,000 Contribution margin 80,000 100,000 Less: fixed expenses 80,000 80,000
5-67
Less: fixed expenses 80,000 80,000 Net operating income -$ 20,000$
Th M i f S f PThe Margin of Safety PercentageRBC’s margin of safety can be expressed as
20% of sales.($50,000 ÷ $250,000)
Break-even sales
400 unitsActual sales
500 units400 units 500 unitsSales 200,000$ 250,000$ Less: variable expenses 120,000 150,000 Contribution margin 80 000 100 000Contribution margin 80,000 100,000 Less: fixed expenses 80,000 80,000 Net operating income -$ 20,000$
5-68

Th M i f S fThe Margin of SafetyThe margin of safety can be expressed in terms of
the number of units sold. The margin of safety at $ $RBC is $50,000, and each bike sells for $500;
hence, RBC’s margin of safety is 100 bikes.
Margin of 100 bik$50,000gSafety in units = = 100 bikes$ ,
$500
5-69
Q i k Ch kQuick Check Coffee Klatch is an espresso stand in a downtown office building. The average selling price of a cup of coffee is $1.49 and the average variable expense per cup is $0.36. The average fixed expense per month is $1 300 A f 2 100 ld h$1,300. An average of 2,100 cups are sold each month. What is the margin of safety expressed in cups?cups?a. 3,250 cupsb 950b. 950 cupsc. 1,150 cups
5-70
d. 2,100 cups
C S d P fi S biliCost Structure and Profit Stability
Cost structure refers to the relative proportion f fi d d i bl t i i tiof fixed and variable costs in an organization.
Managers often have some latitude in determining their organization’s cost structure.
5-71
C S d P fi S biliCost Structure and Profit StabilityThere are advantages and disadvantages to high fixed cost (or low variable cost) and low fixed cost (or high variable
cost) structurescost) structures.
An advantage of a high fixedcost structure is that incomecost structure is that incomewill be higher in good years
compared to companies
A disadvantage of a high fixedcost structure is that income
will be lower in bad yearscompared to companieswith lower proportion of
fixed costs.
will be lower in bad yearscompared to companieswith lower proportion ofp p
fixed costs.
Companies with low fixed cost structures enjoy greater
5-72
Companies with low fixed cost structures enjoy greater stability in income across good and bad years.

L i Obj i 8Learning Objective 8
Compute the degree of p goperating leverage at a particular level of salesparticular level of sales and explain how it can
be used to predict changes in net operating g p g
income.
5-73
O i LOperating LeverageO ti l i f hOperating leverage is a measure of how
sensitive net operating income is to percentage changes in sales. It is a measure, at any givenchanges in sales. It is a measure, at any given level of sales, of how a percentage change in
sales volume will affect profits.
Contribution marginNet operating income
Degree ofoperating leverage = Net operating incomeoperating leverage
5-74
O i LOperating LeverageTo illustrate, let’s revisit the contribution
income statement for RBC. Actual sales
500 BikesSales 250,000$ ,$Less: variable expenses 150,000 Contribution margin 100,000 Less: fixed expenses 80,000Less: fixed expenses 80,000 Net income 20,000$
$100,000 $20 000 = 5
Degree ofOperating =
5-75
$20,000 5Leverage
O i LOperating LeverageWith an operating leverage of With an operating leverage of 55, if RBC , if RBC increases its sales by increases its sales by 1010%%, net operating , net operating yy , p g, p g
income would increase by income would increase by 5050%%..
Percent increase in sales 10%Degree of operating leverage × 5g p g g 5Percent increase in profits 50%
Here’s the verification!
5-76
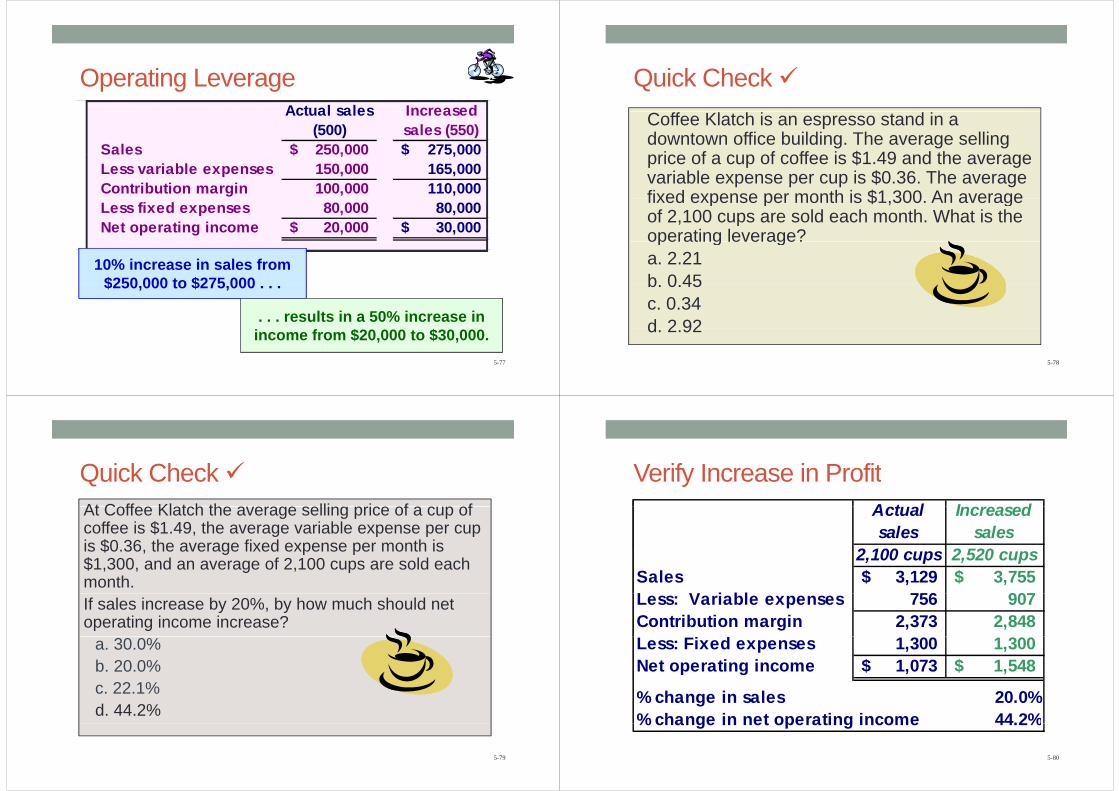
O i LOperating LeverageActual sales IncreasedActual sales
(500)Increased sales (550)
Sales 250,000$ 275,000$ ,$ ,$Less variable expenses 150,000 165,000 Contribution margin 100,000 110,000 Less fixed expenses 80,000 80,000 Net operating income 20,000$ 30,000$
10% increase in sales from$250 000 to $275 000$250,000 to $275,000 . . .
. . . results in a 50% increase in
5-77
income from $20,000 to $30,000.
Q i k Ch kQuick Check Coffee Klatch is an espresso stand in a downtown office building. The average selling price of a cup of coffee is $1 49 and the averageprice of a cup of coffee is $1.49 and the average variable expense per cup is $0.36. The average fixed expense per month is $1 300 An averagefixed expense per month is $1,300. An average of 2,100 cups are sold each month. What is the operating leverage?operating leverage?a. 2.21b 0 45b. 0.45c. 0.34d 2 92
5-78
d. 2.92
Q i k Ch kAt Coffee Klatch the a erage selling price of a c p of
Quick Check At Coffee Klatch the average selling price of a cup of coffee is $1.49, the average variable expense per cup is $0.36, the average fixed expense per month isis $0.36, the average fixed expense per month is $1,300, and an average of 2,100 cups are sold each month.If sales increase by 20%, by how much should net operating income increase?
a. 30.0%b. 20.0%c. 22.1%d. 44.2%
5-79
V if I i P fiVerify Increase in ProfitA t l I dActual sales
Increased sales
2 100 2 5202,100 cups 2,520 cupsSales 3,129$ 3,755$ L V i bl 756 907Less: Variable expenses 756 907 Contribution margin 2,373 2,848 Less: Fixed expenses 1,300 1,300 Net operating income 1,073$ 1,548$
% change in sales 20.0%% change in net operating income 44.2%
5-80
% change in net operating income 44.2%

S i S l C i iStructuring Sales Commissions
Companies generally compensate salespeople by paying them either a commission based on y p y g
sales or a salary plus a sales commission. Commissions based on sales dollars can lead toCommissions based on sales dollars can lead to
lower profits in a company.
Let’s look at an example.Let’s look at an example.
5-81
S i S l C i iStructuring Sales CommissionsPi li U li it d d t t fPipeline Unlimited produces two types of
surfboards, the XR7 and the Turbo. The XR7 sells f $100 d t t ib ti ifor $100 and generates a contribution margin per unit of $25. The Turbo sells for $150 and earns a
t ib ti i it f $18contribution margin per unit of $18.
The sales force at Pipeline Unlimited is compensated based on sales commissions
5-82
compensated based on sales commissions.
S i S l C i iStructuring Sales CommissionsIf th l f t Pi li ldIf you were on the sales force at Pipeline, you would
push hard to sell the Turbo even though the XR7 hi h t ib ti i itearns a higher contribution margin per unit.
T li i t thi t f fli t i iTo eliminate this type of conflict, commissions can be based on contribution margin rather than on
lli i lselling price alone.
5-83
L i Obj i 9Learning Objective 9
Compute the break-even point for a multiproductpoint for a multiproduct
company and explain the effects of shifts in
the sales mix onthe sales mix on contribution margin and
the break even pointthe break-even point.
5-84

Th C f S l MiThe Concept of Sales MixS l i i th l ti ti i hi h• Sales mix is the relative proportion in which a company’s products are sold.Diff t d t h diff t lli• Different products have different selling prices, cost structures, and contribution marginsmargins.
• When a company sells more than one product break even analysis becomes moreproduct, break-even analysis becomes more complex as the following example illustrates.
Let’s assume Racing Bicycle Company sells bikes and carts and that the sales mix between
5-85
bikes and carts and that the sales mix between the two products remains the same.
M l i d B k E A l iMultiproduct Break-Even AnalysisBikes comprise 45% of RBC’s total sales revenue and theBikes comprise 45% of RBC s total sales revenue and the
carts comprise the remaining 55%. RBC provides the following information:
Sales 250,000$ 100% 300,000$ 100% 550,000$ 100.0%Variable expenses 150 000 60% 135 000 45% 285 000 51 8%
Bicycle Carts Total
Variable expenses 150,000 60% 135,000 45% 285,000 51.8%Contribution margin 100,000 40.0% 165,000 55% 265,000 48.2%Fixed expenses 170,000 Net operating income 95 000$Net operating income 95,000$
Sales mix 250,000$ 45% 300,000$ 55% 550,000$ 100%
$265,000 $550 000
= 48.2% (rounded)
5-86
$550,000
M l i d B k E A l iMultiproduct Break-Even AnalysisFixed expenses
CM ratio=Dollar sales to break even
Dollar sales to $170,000= = $352,697break even 48.2%
$352,697
Bicycle Carts TotalSales 158,714$ 100% 193,983$ 100% 352,697$ 100.0%Variable expenses 95,228 60% 87,293 45% 182,521 51.8%Contribution margin 63,485 40% 106,691 55% 170,176 48.2%
Bicycle Carts Total
g , , ,Fixed expenses 170,000 Net operating income Rounding error 176$
5-87
Sales mix 158,714$ 45% 193,983$ 55% 352,697$ 100.0%
K A i f CVP A l iKey Assumptions of CVP Analysis Selling price is constant. Costs are linear and can be accuratelyy
divided into variable (constant per unit) and fixed (constant in total) elementsfixed (constant in total) elements.
In multiproduct companies, the sales mix is constantconstant.
In manufacturing companies, inventories do not change (units produced = units sold).
5-88
E d f Ch 0End of Chapter 05
5-89