costco wholesale corporation zichen wang 2013/ar final projects/ar final... · introduction costco...
TRANSCRIPT
http://phx.corporate-ir.net/phoenix.zhtml?c=83830&p=irol-reportsannual
Annul Report Project
Costco Wholesale
Corporation
Zichen Wang
Introduction Name of CEO: Craig Jelinek
Corporate Office
999 Lake Drive
Issaquah, WA 98027
Latest fiscal year ended: September 2nd 2012
Introduction Costco is mainly engaged in the operation of
membership warehouses in the United States and other
countries. It provides customers various and a wide
range of retail products.
Main locations: 622 warehouses in 41 states and Puerto
Rico
(448 locations), nine Canadian provinces (85 locations),
Mexico (32 locations), the United Kingdom (23
locations), Japan (13 locations), Korea (nine locations),
Taiwan (nine locations, through a 55%-owned
subsidiary) and Australia (three locations)
Audit Report
Auditor:
The auditor started by claiming that their audits
are following the standards of Public Company
Accounting Oversight Board (United States).
Then he stated that the company’s financial
statements referred to the standards. He also
verified that the internal control of the company
over its financial statements is well achieved.
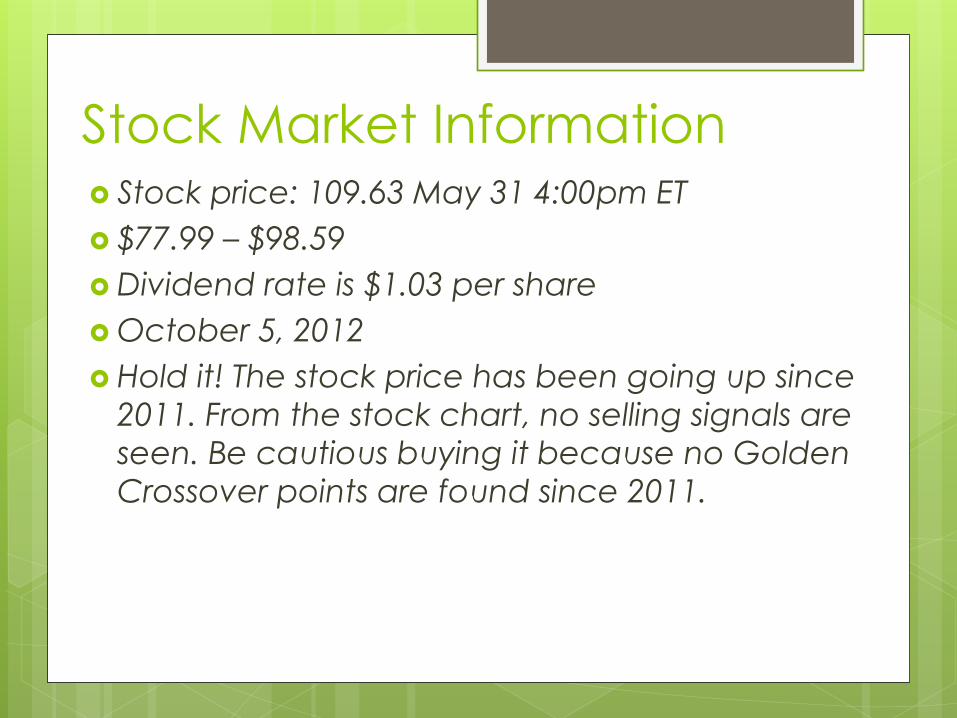
Stock Market Information Stock price: 109.63 May 31 4:00pm ET
$77.99 – $98.59
Dividend rate is $1.03 per share
October 5, 2012
Hold it! The stock price has been going up since
2011. From the stock chart, no selling signals are
seen. Be cautious buying it because no Golden
Crossover points are found since 2011.
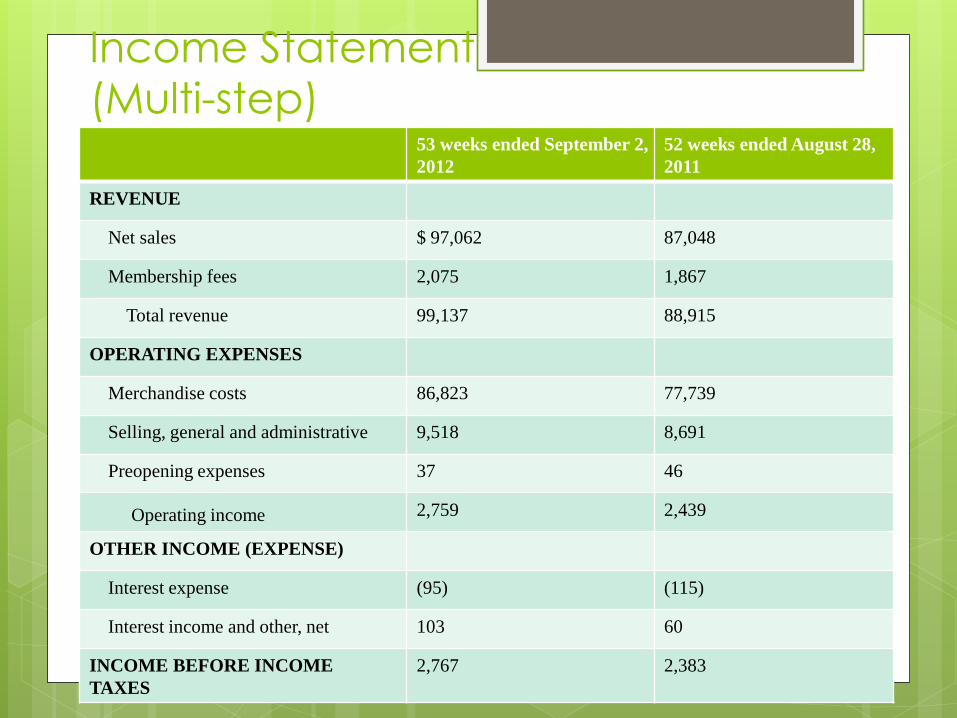
Income Statement
(Multi-step) 53 weeks ended September 2,
2012
52 weeks ended August 28,
2011
REVENUE
Net sales $ 97,062 87,048
Membership fees 2,075 1,867
Total revenue 99,137 88,915
OPERATING EXPENSES
Merchandise costs 86,823 77,739
Selling, general and administrative 9,518 8,691
Preopening expenses 37 46
Operating income 2,759 2,439
OTHER INCOME (EXPENSE)
Interest expense (95) (115)
Interest income and other, net 103 60
INCOME BEFORE INCOME
TAXES
2,767 2,383
Income Statement
Comparing the Income Statements of
2012 and 2011 fiscal year, we notice that
the revenue went up by a significant
amount. Although this increased account
of sales has resulted in several increased
expenses, the overall net income before
taxes is still higher than the previous fiscal
year.
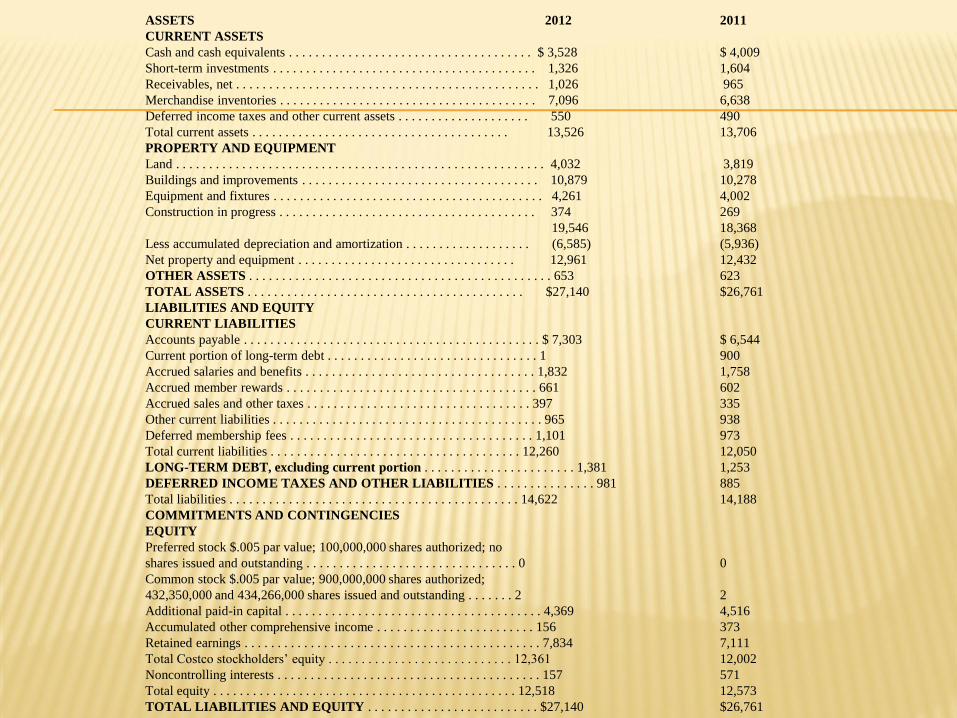
ASSETS 2012 2011
CURRENT ASSETS
Cash and cash equivalents . . . . . . . . . . . . . . . . . . . . . . . . . . . . . . . . . . . . . $ 3,528 $ 4,009
Short-term investments . . . . . . . . . . . . . . . . . . . . . . . . . . . . . . . . . . . . . . . . 1,326 1,604
Receivables, net . . . . . . . . . . . . . . . . . . . . . . . . . . . . . . . . . . . . . . . . . . . . . . 1,026 965
Merchandise inventories . . . . . . . . . . . . . . . . . . . . . . . . . . . . . . . . . . . . . . . 7,096 6,638
Deferred income taxes and other current assets . . . . . . . . . . . . . . . . . . . . 550 490
Total current assets . . . . . . . . . . . . . . . . . . . . . . . . . . . . . . . . . . . . . . . 13,526 13,706
PROPERTY AND EQUIPMENT
Land . . . . . . . . . . . . . . . . . . . . . . . . . . . . . . . . . . . . . . . . . . . . . . . . . . . . . . . . 4,032 3,819
Buildings and improvements . . . . . . . . . . . . . . . . . . . . . . . . . . . . . . . . . . . . 10,879 10,278
Equipment and fixtures . . . . . . . . . . . . . . . . . . . . . . . . . . . . . . . . . . . . . . . . . 4,261 4,002
Construction in progress . . . . . . . . . . . . . . . . . . . . . . . . . . . . . . . . . . . . . . . 374 269
19,546 18,368
Less accumulated depreciation and amortization . . . . . . . . . . . . . . . . . . . (6,585) (5,936)
Net property and equipment . . . . . . . . . . . . . . . . . . . . . . . . . . . . . . . . . 12,961 12,432
OTHER ASSETS . . . . . . . . . . . . . . . . . . . . . . . . . . . . . . . . . . . . . . . . . . . . . . 653 623
TOTAL ASSETS . . . . . . . . . . . . . . . . . . . . . . . . . . . . . . . . . . . . . . . . . . $27,140 $26,761
LIABILITIES AND EQUITY
CURRENT LIABILITIES
Accounts payable . . . . . . . . . . . . . . . . . . . . . . . . . . . . . . . . . . . . . . . . . . . . . $ 7,303 $ 6,544
Current portion of long-term debt . . . . . . . . . . . . . . . . . . . . . . . . . . . . . . . . 1 900
Accrued salaries and benefits . . . . . . . . . . . . . . . . . . . . . . . . . . . . . . . . . . . 1,832 1,758
Accrued member rewards . . . . . . . . . . . . . . . . . . . . . . . . . . . . . . . . . . . . . . 661 602
Accrued sales and other taxes . . . . . . . . . . . . . . . . . . . . . . . . . . . . . . . . . . 397 335
Other current liabilities . . . . . . . . . . . . . . . . . . . . . . . . . . . . . . . . . . . . . . . . . 965 938
Deferred membership fees . . . . . . . . . . . . . . . . . . . . . . . . . . . . . . . . . . . . . 1,101 973
Total current liabilities . . . . . . . . . . . . . . . . . . . . . . . . . . . . . . . . . . . . . . 12,260 12,050
LONG-TERM DEBT, excluding current portion . . . . . . . . . . . . . . . . . . . . . . . 1,381 1,253
DEFERRED INCOME TAXES AND OTHER LIABILITIES . . . . . . . . . . . . . . . 981 885
Total liabilities . . . . . . . . . . . . . . . . . . . . . . . . . . . . . . . . . . . . . . . . . . . . 14,622 14,188
COMMITMENTS AND CONTINGENCIES
EQUITY
Preferred stock $.005 par value; 100,000,000 shares authorized; no
shares issued and outstanding . . . . . . . . . . . . . . . . . . . . . . . . . . . . . . . . 0 0
Common stock $.005 par value; 900,000,000 shares authorized;
432,350,000 and 434,266,000 shares issued and outstanding . . . . . . . 2 2
Additional paid-in capital . . . . . . . . . . . . . . . . . . . . . . . . . . . . . . . . . . . . . . . 4,369 4,516
Accumulated other comprehensive income . . . . . . . . . . . . . . . . . . . . . . . . 156 373
Retained earnings . . . . . . . . . . . . . . . . . . . . . . . . . . . . . . . . . . . . . . . . . . . . . 7,834 7,111
Total Costco stockholders’ equity . . . . . . . . . . . . . . . . . . . . . . . . . . . . 12,361 12,002
Noncontrolling interests . . . . . . . . . . . . . . . . . . . . . . . . . . . . . . . . . . . . . . . . 157 571
Total equity . . . . . . . . . . . . . . . . . . . . . . . . . . . . . . . . . . . . . . . . . . . . . . 12,518 12,573
TOTAL LIABILITIES AND EQUITY . . . . . . . . . . . . . . . . . . . . . . . . . . $27,140 $26,761
Balance Sheet
In general, the total assets increased in
2012 fiscal year comparing to 2011 fiscal
year. The current portion of long-term
debt changed the most, from 900 to 1.
Plants and equipment accounts also
increased in 2012.
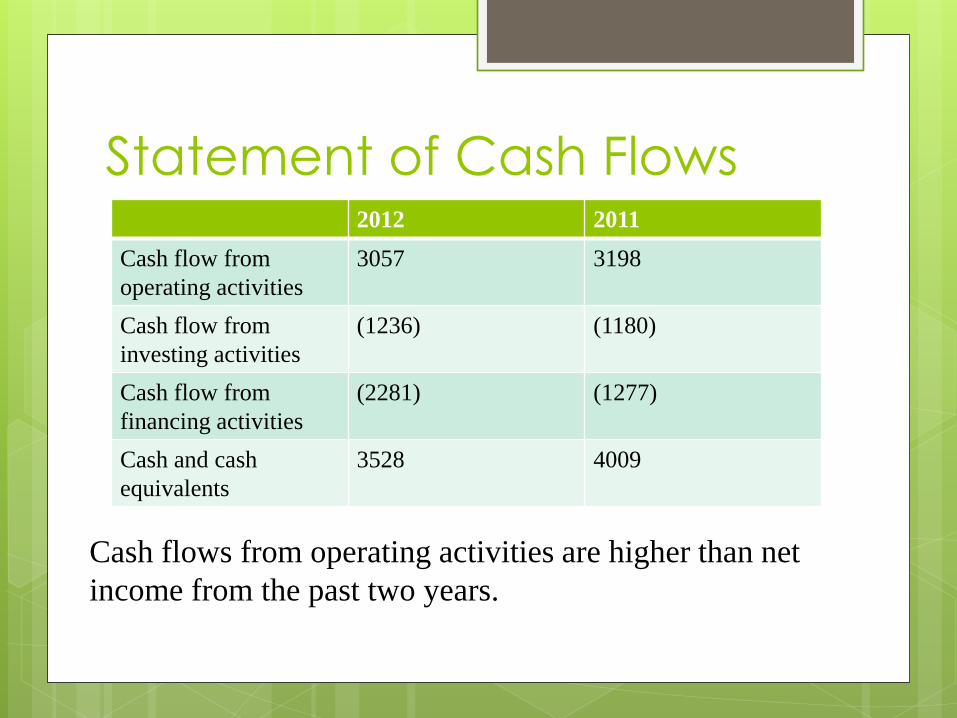
Statement of Cash Flows 2012 2011
Cash flow from
operating activities
3057 3198
Cash flow from
investing activities
(1236) (1180)
Cash flow from
financing activities
(2281) (1277)
Cash and cash
equivalents
3528 4009
Cash flows from operating activities are higher than net
income from the past two years.
Statement of Cash Flows The “Additions to property and equipment”
accounts for 2012 and 2011 are (1480) and (1290)
respectively, meaning that the company is
growing through investing activities
The primary source of financing is long-term debt
in 2012 and common stock in 2011
Overall, cash has decreased over the past two
years
Accounting Policies
Revenue Recognition:
The Company generally recognizes sales,
which include shipping fees where
applicable, net of estimated returns, at the
time the member takes possession of
merchandise or receives services.
Accounting Policies
Cash and Cash Equivalents:
The Company considers as cash and cash
equivalents all highly liquid investments
with a maturity of three months or less at
the date of purchase and proceeds due
from credit and debit card transactions
with settlement terms of up to one week.
Accounting Policies Accounts Receivable
Vendor receivables include payments from vendors in the
form of volume rebates or other purchase discounts that
are evidenced by signed agreements and are reflected in
the carrying value of the inventory when earned or as the
Company progresses towards earning the rebate or
discount and as a component of merchandise costs as
the merchandise is sold.
Reinsurance receivables are held by the Company’s wholly-
owned captive insurance subsidiary.
Receivables are recorded net of an allowance for doubtful
accounts.
Accounting Policies
Inventories:
Merchandise inventories are valued at the
lower of cost or market, as determined
primarily by the retail inventory method,
and are stated using the last-in, first-out
(LIFO) method for substantially all U.S.
merchandise inventories.
Accounting Policies
Investments:
In general, short-term investments have a maturity at the date of purchase of three months to five years.
Short-term investments classified as available-for-sale are recorded at fair value using the specific identification method with the unrealized gains and losses reflected in accumulated other comprehensive income until realized.
The Company periodically evaluates unrealized losses in its investment securities for other-thantemporary impairment, using both qualitative and quantitative criteria.
Accounting Policies
Property and Equipment
Property and equipment are stated at cost.
Repair and maintenance costs are
expensed when incurred.
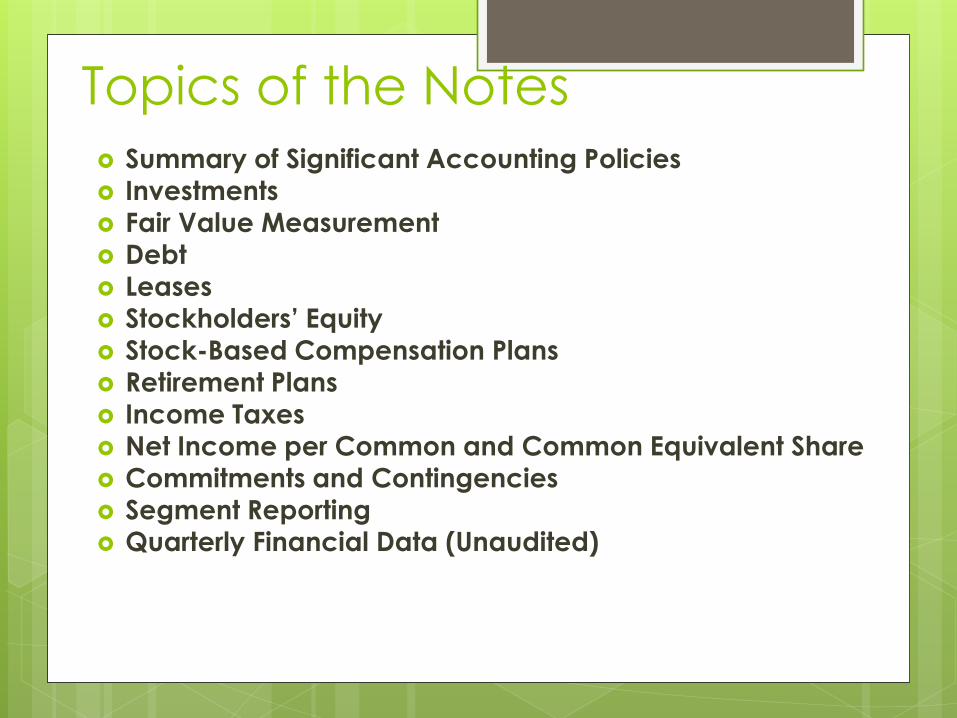
Topics of the Notes Summary of Significant Accounting Policies
Investments
Fair Value Measurement
Debt
Leases
Stockholders’ Equity
Stock-Based Compensation Plans
Retirement Plans Income Taxes
Net Income per Common and Common Equivalent Share
Commitments and Contingencies
Segment Reporting Quarterly Financial Data (Unaudited)
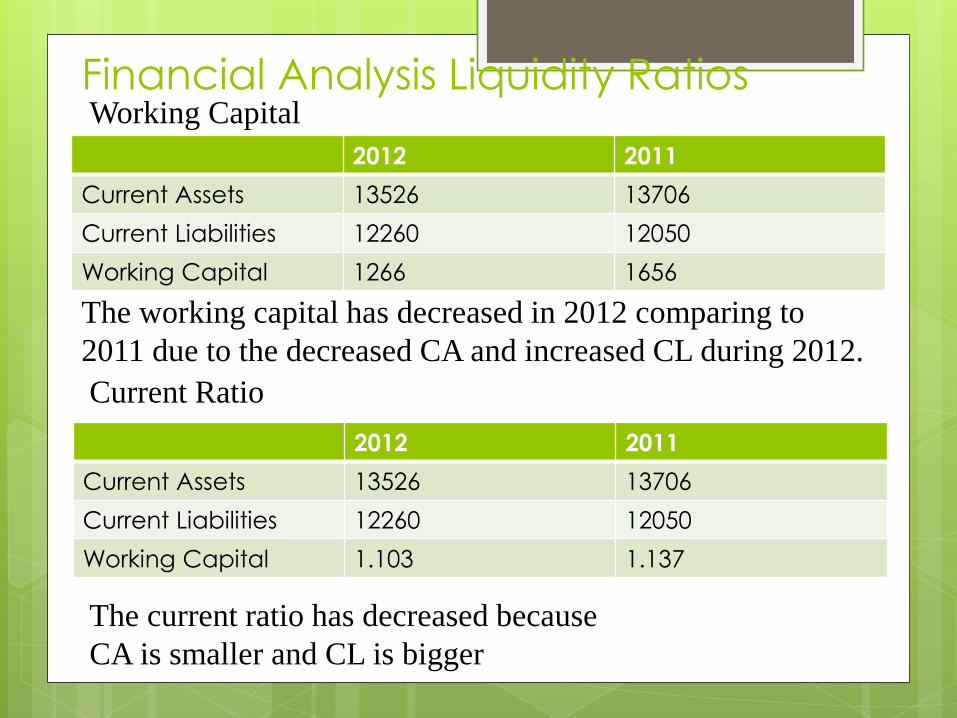
Financial Analysis Liquidity Ratios
2012 2011
Current Assets 13526 13706
Current Liabilities 12260 12050
Working Capital 1266 1656
The working capital has decreased in 2012 comparing to
2011 due to the decreased CA and increased CL during 2012.
Working Capital
Current Ratio
2012 2011
Current Assets 13526 13706
Current Liabilities 12260 12050
Working Capital 1.103 1.137
The current ratio has decreased because
CA is smaller and CL is bigger
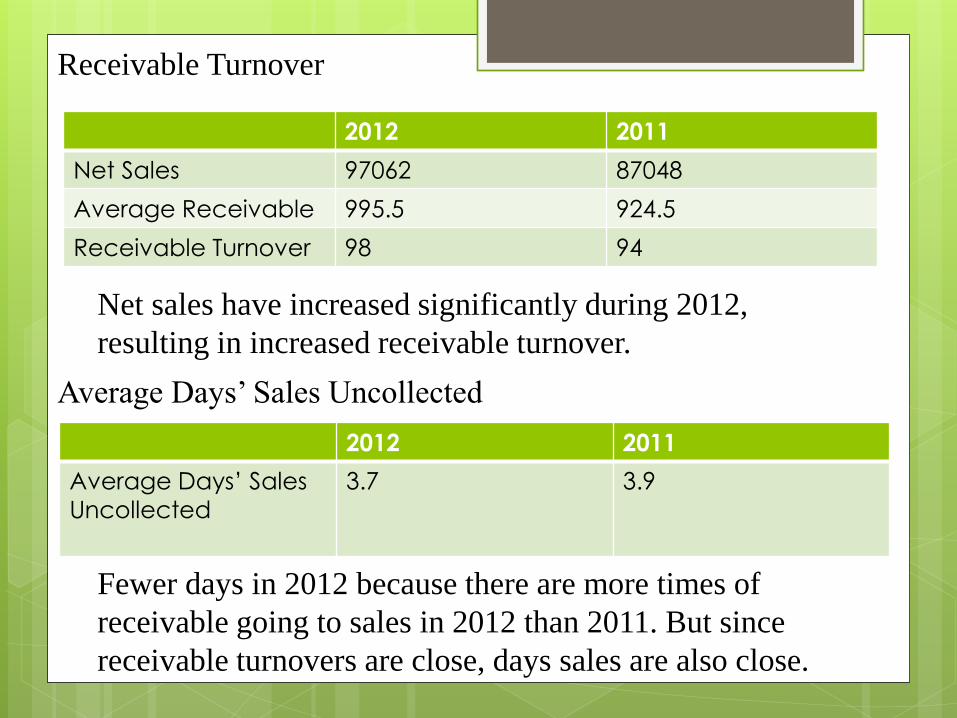
Receivable Turnover
2012 2011
Net Sales 97062 87048
Average Receivable 995.5 924.5
Receivable Turnover 98 94
Net sales have increased significantly during 2012,
resulting in increased receivable turnover.
Average Days’ Sales Uncollected
2012 2011
Average Days’ Sales
Uncollected
3.7 3.9
Fewer days in 2012 because there are more times of
receivable going to sales in 2012 than 2011. But since
receivable turnovers are close, days sales are also close.
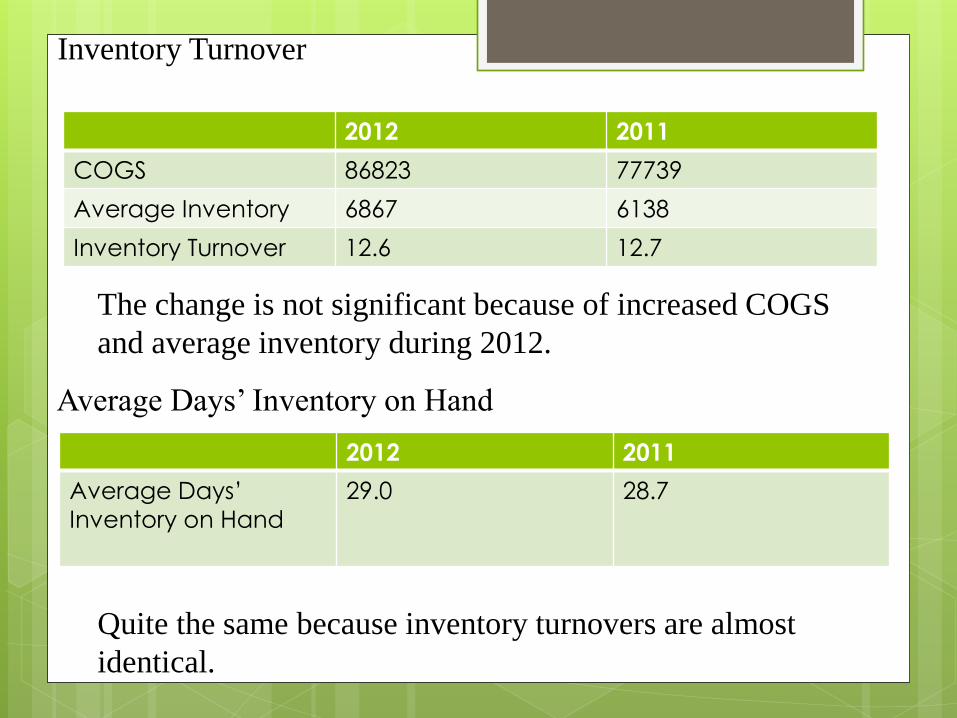
Inventory Turnover
2012 2011
COGS 86823 77739
Average Inventory 6867 6138
Inventory Turnover 12.6 12.7
The change is not significant because of increased COGS
and average inventory during 2012.
Average Days’ Inventory on Hand
2012 2011
Average Days’
Inventory on Hand
29.0 28.7
Quite the same because inventory turnovers are almost
identical.
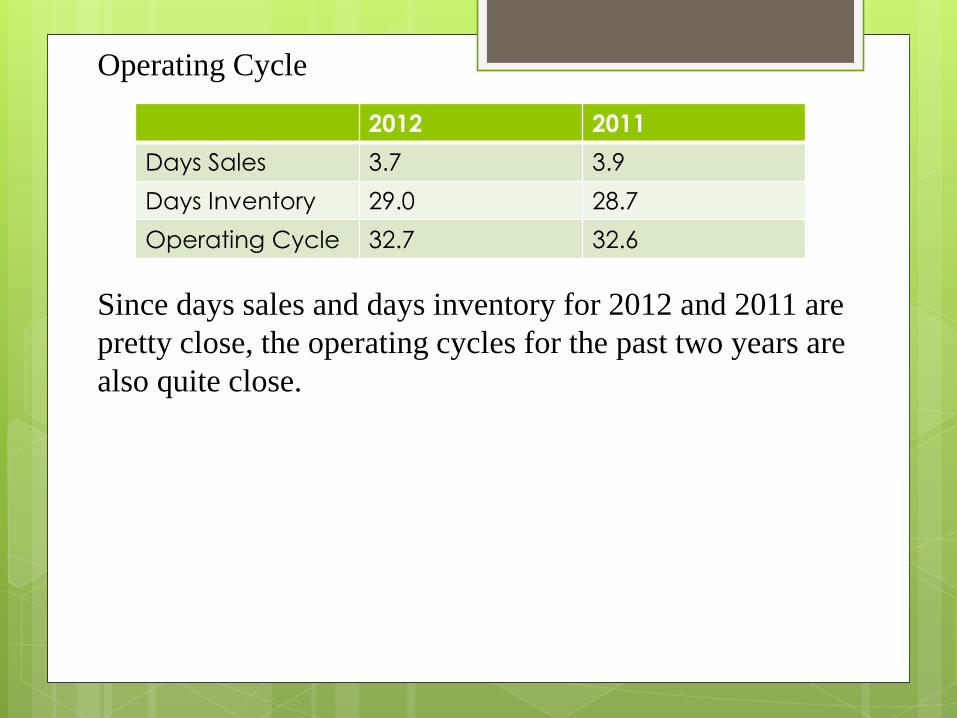
Operating Cycle
2012 2011
Days Sales 3.7 3.9
Days Inventory 29.0 28.7
Operating Cycle 32.7 32.6
Since days sales and days inventory for 2012 and 2011 are
pretty close, the operating cycles for the past two years are
also quite close.
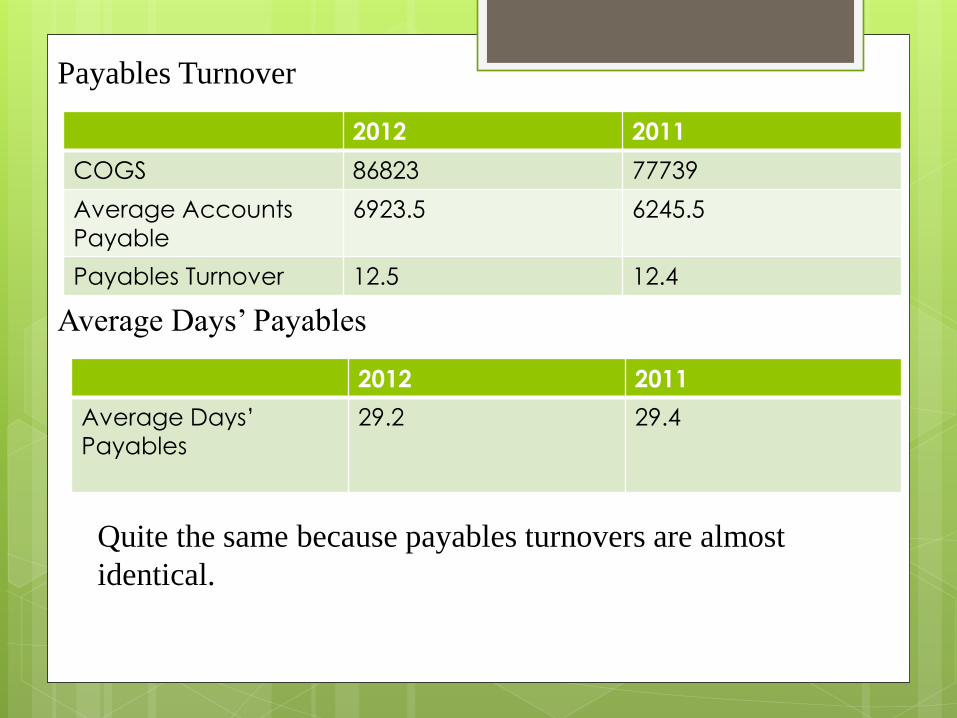
Payables Turnover
2012 2011
COGS 86823 77739
Average Accounts
Payable
6923.5 6245.5
Payables Turnover 12.5 12.4
Average Days’ Payables
2012 2011
Average Days’
Payables
29.2 29.4
Quite the same because payables turnovers are almost
identical.
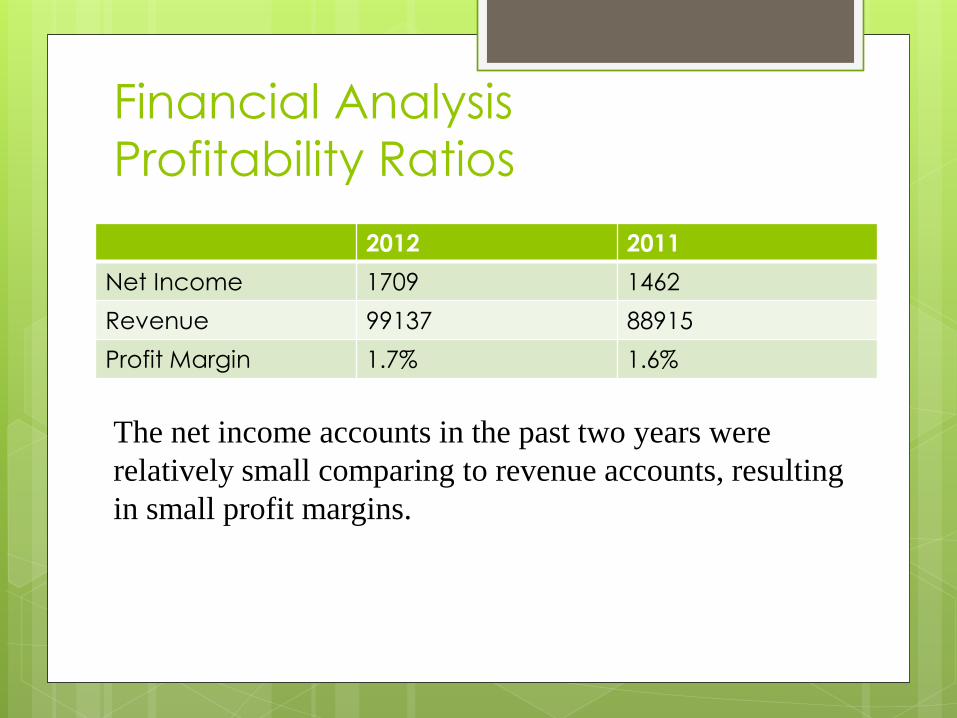
Financial Analysis
Profitability Ratios
2012 2011
Net Income 1709 1462
Revenue 99137 88915
Profit Margin 1.7% 1.6%
The net income accounts in the past two years were
relatively small comparing to revenue accounts, resulting
in small profit margins.
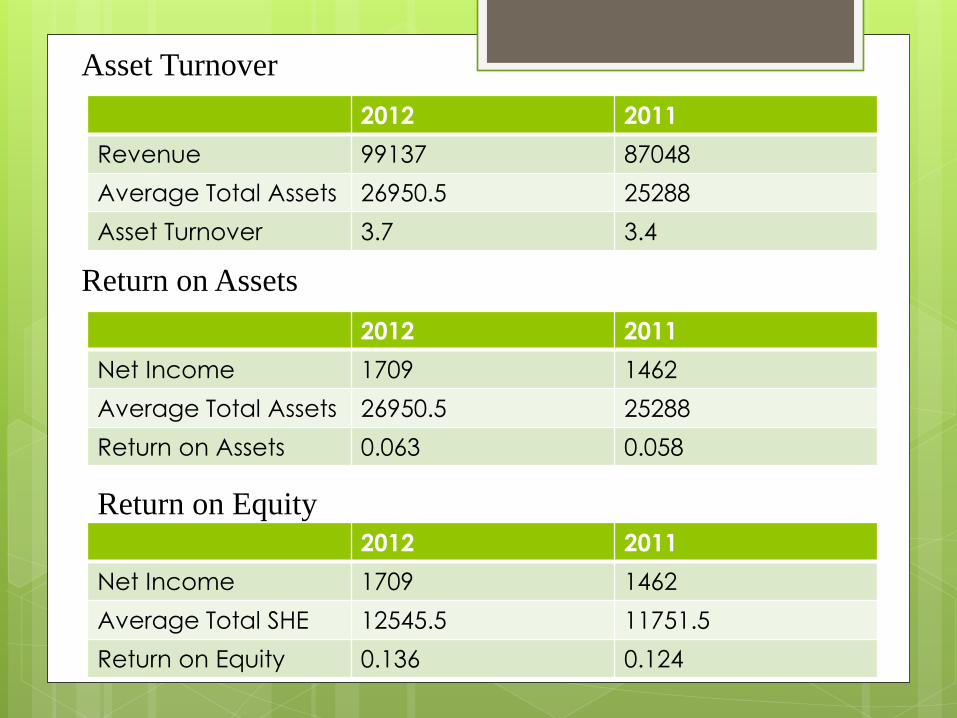
2012 2011
Revenue 99137 87048
Average Total Assets 26950.5 25288
Asset Turnover 3.7 3.4
Asset Turnover
Return on Assets
2012 2011
Net Income 1709 1462
Average Total Assets 26950.5 25288
Return on Assets 0.063 0.058
Return on Equity
2012 2011
Net Income 1709 1462
Average Total SHE 12545.5 11751.5
Return on Equity 0.136 0.124
The company is pretty efficient in using its
assets to generate profit.
The return on assets ratio tells how
profitable the company’s assets are in
generating income. With a pretty low
profit margin multiplied by a high asset
turnover, we get a relatively normal return
on assets as retailers.
With pretty high return on equity ratios for
the past two years, we can say that the
company is efficient in generating profit
using the money of the share holders.
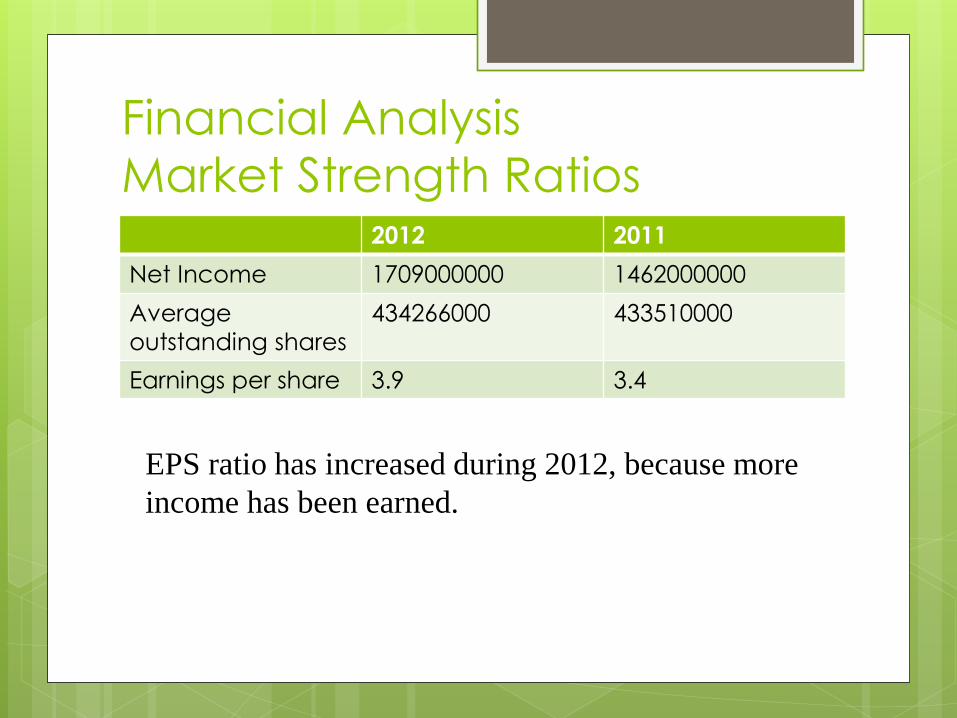
Financial Analysis
Market Strength Ratios 2012 2011
Net Income 1709000000 1462000000
Average
outstanding shares
434266000 433510000
Earnings per share 3.9 3.4
EPS ratio has increased during 2012, because more
income has been earned.
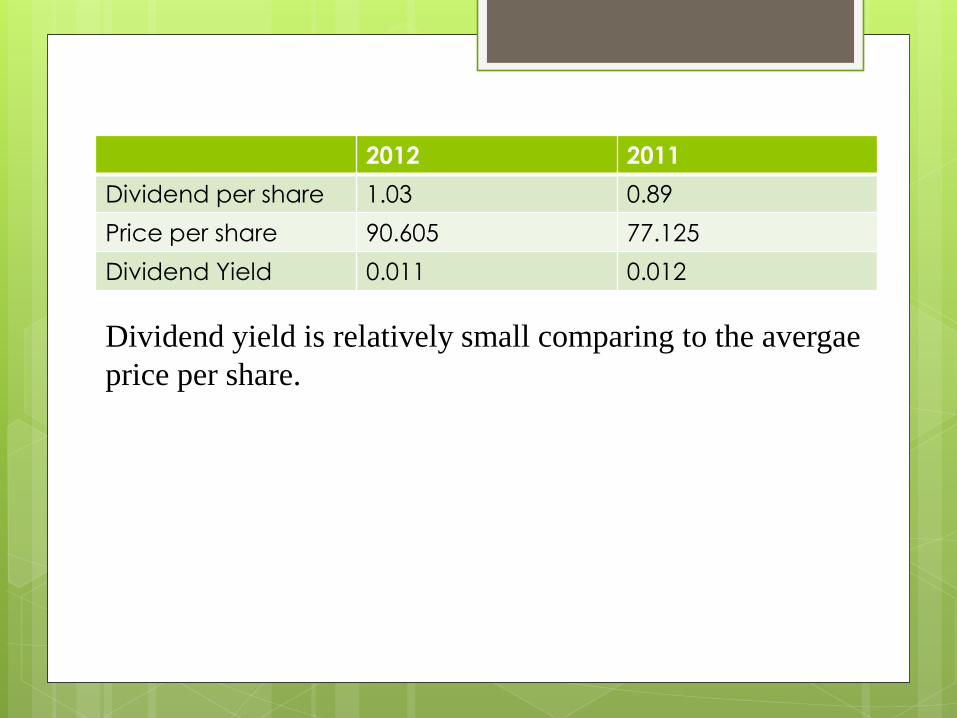
2012 2011
Dividend per share 1.03 0.89
Price per share 90.605 77.125
Dividend Yield 0.011 0.012
Dividend yield is relatively small comparing to the avergae
price per share.
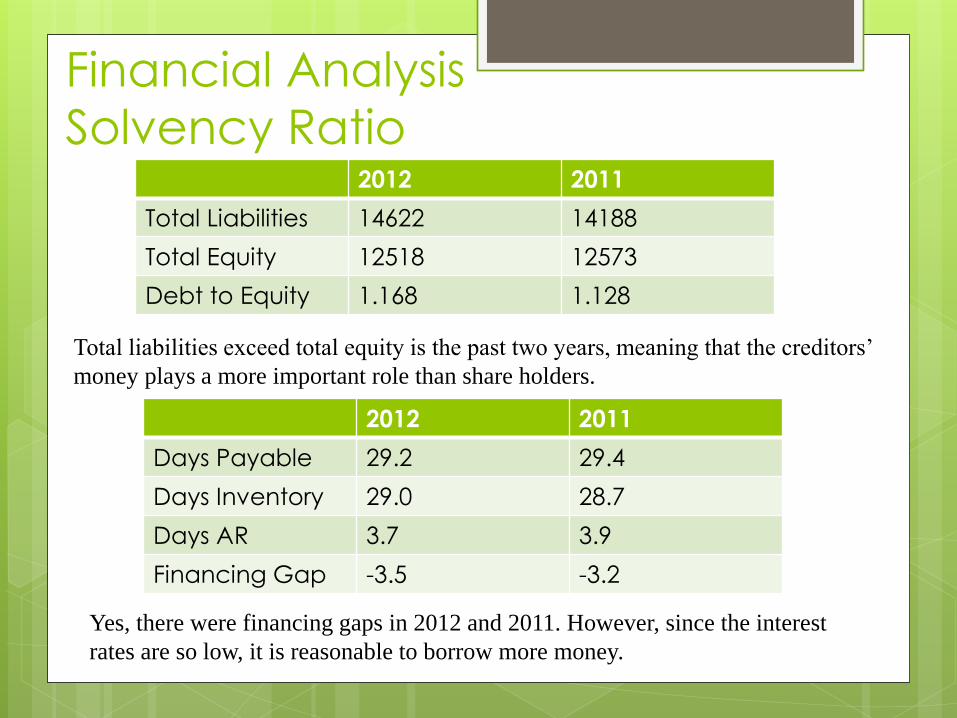
Financial Analysis
Solvency Ratio 2012 2011
Total Liabilities 14622 14188
Total Equity 12518 12573
Debt to Equity 1.168 1.128
Total liabilities exceed total equity is the past two years, meaning that the creditors’
money plays a more important role than share holders.
2012 2011
Days Payable 29.2 29.4
Days Inventory 29.0 28.7
Days AR 3.7 3.9
Financing Gap -3.5 -3.2
Yes, there were financing gaps in 2012 and 2011. However, since the interest
rates are so low, it is reasonable to borrow more money.
Industry Situation &
Company Plans Not only maintaining, but also booming its performance
during the financial crisis, Costco has been thriving, and
its price per share has also doubled since 2009. Now,
Costco is one of the largest retailers in the U.S, and the
7th biggest in the world, according to the 2012 Annual
Report. Costco is one of the fastest growing industries
during the period of the financial crisis. As we can see in
the data shown in its 2012 annual report, net income
has increased significantly. In fact, they had “the best
results in Costco’s 29-year history” (Brotman, Jelinek).
One of the goals in 2012 fiscal year was to decrease
expenses, which was also achieved “by 17 basis points”.
The stock price has been rising since 2009, and there is
no sign that it will come down recently. So what sets
Costco apart from its competitors in this especially
difficult economical situation?
Industry Situation &
Company Plans The unique business philosophy is one of the most important
factors that are driving Costco on a high way for the past 5
years. According to the article titled Costco CEO Craig Jelinek
Leads the Cheapest, Happiest Company in the World, Costco
sets the per hour salary for its employees way above the
standard of other retailers in the U.S. With an average of
$20.89 comparing to Walmart’s $12.67, Costco dedicates to
incentive its employees with higher salaries to encourage
them to work harder and hence make more profit.
Any other spot light for Costco is its “bulk sale”. Article named
How A Trip To Costco Can Work As An Investment Strategy
points out that customers can just save a lot of money by
coming to the warehouse once and get everything they need
and save all the transaction fees if they go to the store
regularly. Also with inflation, it is always good to get real stuff
as early as possible, even save some for the future.
Industry Situation &
Company Plans So, what’s the future plan for Costco? From the letter to
shareholders in its 2012 annual report, the CEO states that
customer loyalty and the locations for the warehouses has
increased in 2012. Since Costco is a membership based retailer,
the customer loyalty and very important in terms of its financial
performances. Therefore, it looks like Costco will continue working
on enhancing the customer loyalty around the globe.
Costco opened 17 new locations in 2012, says in the annual
report, and planed to “open approximately 30 new warehouses
in fiscal 2013”. It is certain that expanding the locations in
Costco’s one of the biggest financial plans in the coming years.
Since highly salary-encouraged employees have brought the
company huge success, it is clear that the company will
continue this policy. The CEO wrote a letter the president Obama
about raising the minimum salary around the country. Although
the congress declined his proposal, we can clearly see that this is
Costco way in the next few years.

Executive Summary Great company to invest! The financial crisis since late 2008
has been a disaster for most of the retail industries. People’s
willing to purchase has been at its lowest since a few
decades. However, if you look at Costco’s financial
performance in the past 5 years, you will find it certainly
stands out from its competitors. As the data in the previous
slides show the booming performance of the company, such
as increasing net income, average price per share, and
decreasing expenses, Costco is really on the right track. If we
take a look into its annual reports from the previous years, we
will find the same positive changes throughout a relatively
long period.
As my conclusion, this is a great company to invest. With its
increasingly better reputation build-up among customers
these years, investing in Costco is also more reliable and a
wise decision.
Sources Used
http://www.businessweek.com/articles/2013-06-
06/costco-ceo-craig-jelinek-leads-the-cheapest-
happiest-company-in-the-world#p1
http://www.npr.org/2013/05/30/186450423/how-a-trip-
to-costco-can-work-as-an-investment-strategy