costing analysis of school health and nutrition interventions documents/costing analysis of... ·...
TRANSCRIPT
COSTING ANALYSISOF SCHOOL HEALTHAND NUTRITIONINTERVENTIONS
The ESHI CaseStudy 2014
DECEMBER 2015
PCD Working Paper Series – No 4
2 COSTING ANALYSIS – WORKING PAPER 2015
BACKGROUNDChapter 1
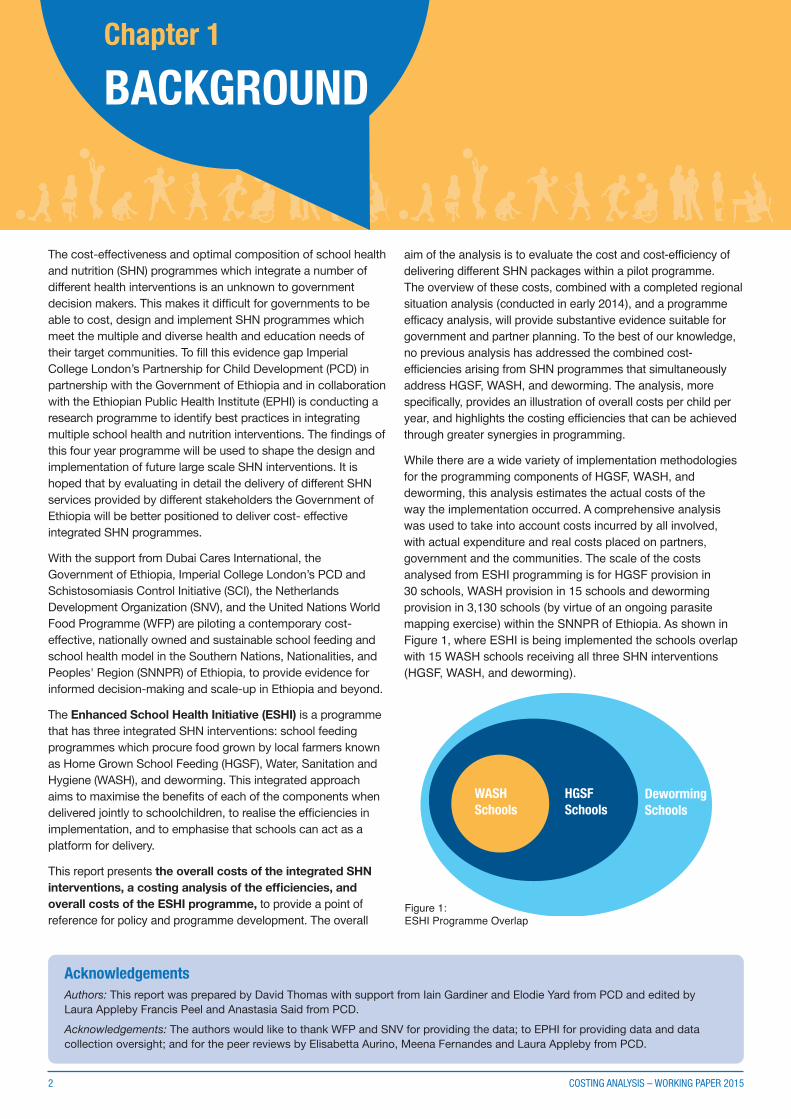
WASHSchools
HGSFSchools
DewormingSchools
Figure 1: ESHI Programme Overlap
AcknowledgementsAuthors: This report was prepared by David Thomas with support from Iain Gardiner and Elodie Yard from PCD and edited byLaura Appleby Francis Peel and Anastasia Said from PCD.
Acknowledgements: The authors would like to thank WFP and SNV for providing the data; to EPHI for providing data and datacollection oversight; and for the peer reviews by Elisabetta Aurino, Meena Fernandes and Laura Appleby from PCD.
The cost-effectiveness and optimal composition of school healthand nutrition (SHN) programmes which integrate a number ofdifferent health interventions is an unknown to governmentdecision makers. This makes it difficult for governments to beable to cost, design and implement SHN programmes whichmeet the multiple and diverse health and education needs oftheir target communities. To fill this evidence gap ImperialCollege London’s Partnership for Child Development (PCD) inpartnership with the Government of Ethiopia and in collaborationwith the Ethiopian Public Health Institute (EPHI) is conducting aresearch programme to identify best practices in integratingmultiple school health and nutrition interventions. The findings ofthis four year programme will be used to shape the design andimplementation of future large scale SHN interventions. It ishoped that by evaluating in detail the delivery of different SHNservices provided by different stakeholders the Government ofEthiopia will be better positioned to deliver cost- effectiveintegrated SHN programmes.
With the support from Dubai Cares International, theGovernment of Ethiopia, Imperial College London’s PCD andSchistosomiasis Control Initiative (SCI), the NetherlandsDevelopment Organization (SNV), and the United Nations WorldFood Programme (WFP) are piloting a contemporary cost-effective, nationally owned and sustainable school feeding andschool health model in the Southern Nations, Nationalities, andPeoples' Region (SNNPR) of Ethiopia, to provide evidence forinformed decision-making and scale-up in Ethiopia and beyond.
The Enhanced School Health Initiative (ESHI) is a programmethat has three integrated SHN interventions: school feedingprogrammes which procure food grown by local farmers knownas Home Grown School Feeding (HGSF), Water, Sanitation andHygiene (WASH), and deworming. This integrated approachaims to maximise the benefits of each of the components whendelivered jointly to schoolchildren, to realise the efficiencies inimplementation, and to emphasise that schools can act as aplatform for delivery.
This report presents the overall costs of the integrated SHNinterventions, a costing analysis of the efficiencies, andoverall costs of the ESHI programme, to provide a point ofreference for policy and programme development. The overall
aim of the analysis is to evaluate the cost and cost-efficiency ofdelivering different SHN packages within a pilot programme.The overview of these costs, combined with a completed regionalsituation analysis (conducted in early 2014), and a programmeefficacy analysis, will provide substantive evidence suitable forgovernment and partner planning. To the best of our knowledge,no previous analysis has addressed the combined cost-efficiencies arising from SHN programmes that simultaneouslyaddress HGSF, WASH, and deworming. The analysis, morespecifically, provides an illustration of overall costs per child peryear, and highlights the costing efficiencies that can be achievedthrough greater synergies in programming.
While there are a wide variety of implementation methodologiesfor the programming components of HGSF, WASH, anddeworming, this analysis estimates the actual costs of theway the implementation occurred. A comprehensive analysiswas used to take into account costs incurred by all involved,with actual expenditure and real costs placed on partners,government and the communities. The scale of the costsanalysed from ESHI programming is for HGSF provision in30 schools, WASH provision in 15 schools and dewormingprovision in 3,130 schools (by virtue of an ongoing parasitemapping exercise) within the SNNPR of Ethiopia. As shown inFigure 1, where ESHI is being implemented the schools overlapwith 15 WASH schools receiving all three SHN interventions(HGSF, WASH, and deworming).
The analytic approach focuses on incurred monetary costsand excludes other costs such as time, unless they representa real and substantial cash value. The findings are therefore,an underestimate of the true cost, but are appropriate forgovernment decision-makers and for setting budgets.
In the case of community contributions ‘gratis’, onlycontributions that were recognised by the communities andschools as having a financial value were considered for theanalysis. Therefore, some community labour costs andopportunity costs for time spent that were not equated to amonetary value were excluded. The analysis incorporatescommunity contributions with real monetary value as well asthe costs incurred by different administrative levels ofgovernment. These costs, in addition to real expenditureprogramme spending, provide an insight into SHN costing andcost-efficiencies in the SNNPR of Ethiopia.
Due to the focus on real expenditure the U.S. dollar was thecurrency for comparison with exchange rates accurate toAugust 2014. Discount rates were not used within thecalculation of fixed assets.
Data collectionA methodology was developed to estimate the actual costsof an integrated SHN intervention. Note, the findings do notrepresent a ‘best case’ or forecast of expenditure, but a pictureof actual implementation costs as observed by the three SHNinterventions. The estimates are based on detailed accounting,with data sourced from implementing partners and fieldsurveys (Table 1). Considering synergies between the partnerorganizations, budgeting and cost categorising, informationwas separated into cost categories (direct, indirect, transport,etc.) and programme area (Table 2). This provided a level ofcomparability between the HGSF, WASH and dewormingcomponents in totality and across cost areas.
Data was collected over three sources of information: first,through primary data on budget expenditure (budget data);
second, through surveying of costs at schools (survey data);and third, through structured interviews with programme staffand relevant government bureaus (interview data).
The use of different data sources ensures that any expenseincurred by the government, communities, implementers anddonors are captured conclusively and verified. Emphasis wasgiven to non-recorded implementation costs, such as those ofthe community, which may not otherwise be captured.
Government cost contributions were considered at regional-,zonal- and woreda-level within the SNNPR of Ethiopia. Federalexpenditure on programming was not considered in the analysisdue to the decentralised nature of Ethiopia’s ministries, it wastherefore, assumed that the majority of per child expenditureoccurs from within regional-level government budgets. The mostrecent expenditure data available for the three SHN interventionswas used in the analysis.
COSTING ANALYSIS – WORKING PAPER 2015 3
1. Budget data utilised data directly from institutional budgets. Prevailing data gaps were identified and addressed through survey questionnaires and interviews with partners, administered as part of the ongoing analysis of the ESHI programme.
2. Survey data comprised of data collected through surveys completed in 25 pilot schools implementing the ESHI programme through questionnaires and focus group discussions. Cash and non-cash contributions to schools from communities and their frequency of payment were also determined.
3. Interview data was collected from structured interviews at regional- and woreda-level, with interviews from programme staff and relevant government bureau representatives providing further secondary data.
METHODOLOGYChapter 2
4 COSTING ANALYSIS – WORKING PAPER 2015
HGSF
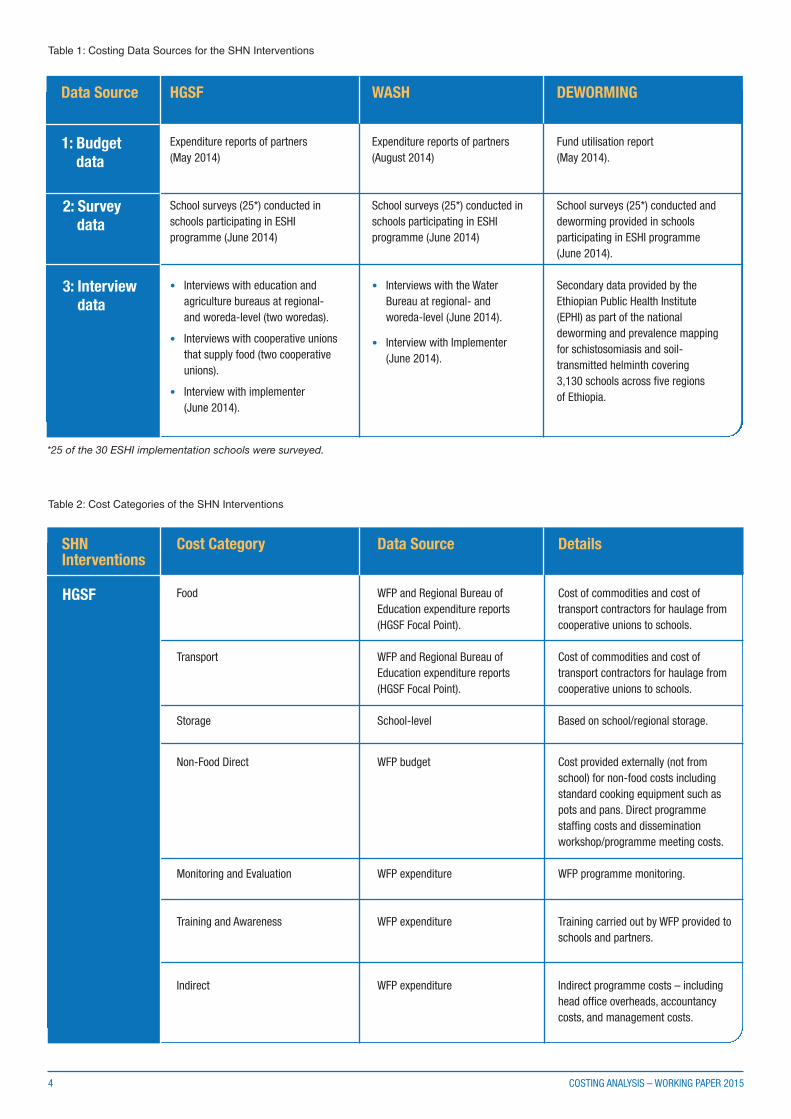
Expenditure reports of partners(May 2014)
School surveys (25*) conducted inschools participating in ESHIprogramme (June 2014)
• Interviews with education and agriculture bureaus at regional- and woreda-level (two woredas).
• Interviews with cooperative unions that supply food (two cooperative unions).
• Interview with implementer (June 2014).
Data Source WASH
Expenditure reports of partners(August 2014)
School surveys (25*) conducted inschools participating in ESHIprogramme (June 2014)
• Interviews with the Water Bureau at regional- and woreda-level (June 2014).
• Interview with Implementer (June 2014).
DEWORMING
Fund utilisation report(May 2014).
School surveys (25*) conducted anddeworming provided in schoolsparticipating in ESHI programme(June 2014).
Secondary data provided by the Ethiopian Public Health Institute (EPHI) as part of the national deworming and prevalence mapping for schistosomiasis and soil-transmitted helminth covering3,130 schools across five regionsof Ethiopia.
1: Budget data
2: Survey data
3: Interview data
Table 1: Costing Data Sources for the SHN Interventions
SHNInterventions
HGSF
Table 2: Cost Categories of the SHN Interventions
*25 of the 30 ESHI implementation schools were surveyed.
Cost Category
Food
Transport
Storage
Non-Food Direct
Monitoring and Evaluation
Training and Awareness
Indirect
Data Source
WFP and Regional Bureau ofEducation expenditure reports(HGSF Focal Point).
WFP and Regional Bureau ofEducation expenditure reports(HGSF Focal Point).
School-level
WFP budget
WFP expenditure
WFP expenditure
WFP expenditure
Details
Cost of commodities and cost oftransport contractors for haulage fromcooperative unions to schools.
Cost of commodities and cost oftransport contractors for haulage fromcooperative unions to schools.
Based on school/regional storage.
Cost provided externally (not fromschool) for non-food costs includingstandard cooking equipment such aspots and pans. Direct programmestaffing costs and disseminationworkshop/programme meeting costs.
WFP programme monitoring.
Training carried out by WFP provided toschools and partners.
Indirect programme costs – includinghead office overheads, accountancycosts, and management costs.
COSTING ANALYSIS – WORKING PAPER 2015 5
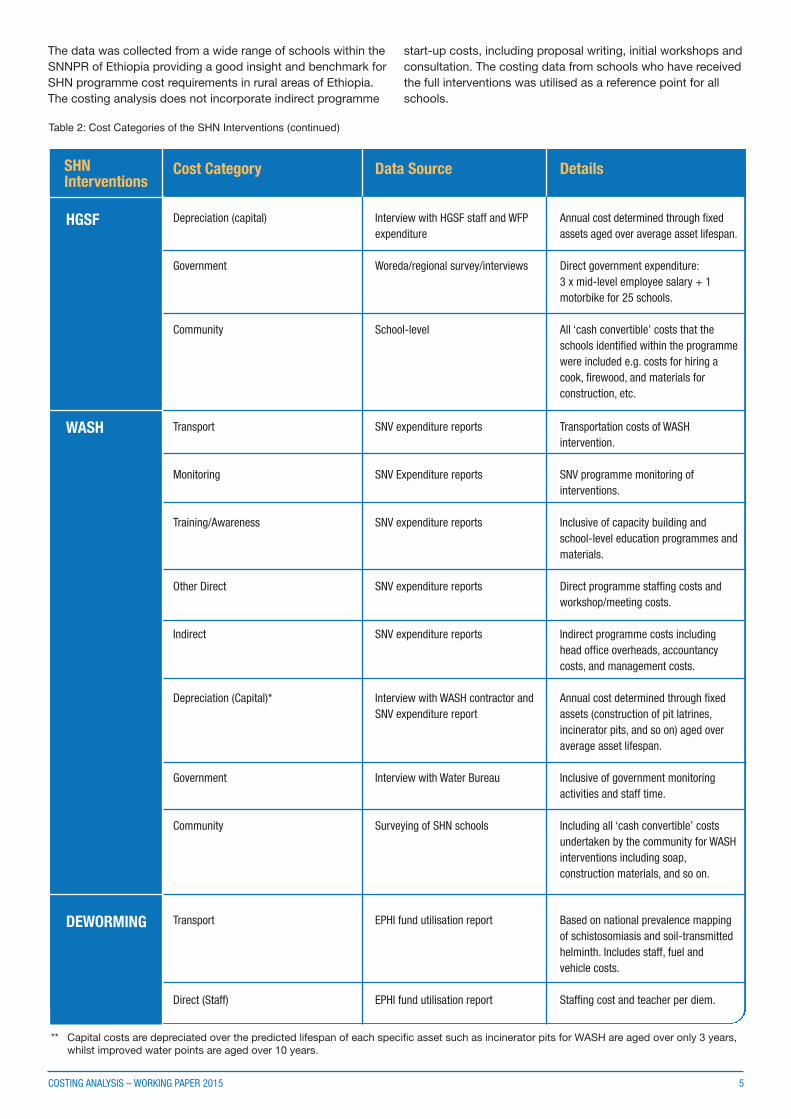
** Capital costs are depreciated over the predicted lifespan of each specific asset such as incinerator pits for WASH are aged over only 3 years, whilst improved water points are aged over 10 years.
The data was collected from a wide range of schools within theSNNPR of Ethiopia providing a good insight and benchmark forSHN programme cost requirements in rural areas of Ethiopia.The costing analysis does not incorporate indirect programme
start-up costs, including proposal writing, initial workshops andconsultation. The costing data from schools who have receivedthe full interventions was utilised as a reference point for allschools.
Cost Category
Depreciation (capital)
Government
Community
Transport
Monitoring
Training/Awareness
Other Direct
Indirect
Depreciation (Capital)*
Government
Community
Transport
Direct (Staff)
SHNInterventions
Data Source
Interview with HGSF staff and WFPexpenditure
Woreda/regional survey/interviews
School-level
SNV expenditure reports
SNV Expenditure reports
SNV expenditure reports
SNV expenditure reports
SNV expenditure reports
Interview with WASH contractor andSNV expenditure report
Interview with Water Bureau
Surveying of SHN schools
EPHI fund utilisation report
EPHI fund utilisation report
Details
Annual cost determined through fixedassets aged over average asset lifespan.
Direct government expenditure:3 x mid-level employee salary + 1motorbike for 25 schools.
All ‘cash convertible’ costs that theschools identified within the programmewere included e.g. costs for hiring acook, firewood, and materials forconstruction, etc.
Transportation costs of WASHintervention.
SNV programme monitoring ofinterventions.
Inclusive of capacity building andschool-level education programmes andmaterials.
Direct programme staffing costs andworkshop/meeting costs.
Indirect programme costs includinghead office overheads, accountancycosts, and management costs.
Annual cost determined through fixedassets (construction of pit latrines,incinerator pits, and so on) aged overaverage asset lifespan.
Inclusive of government monitoringactivities and staff time.
Including all ‘cash convertible’ costsundertaken by the community for WASHinterventions including soap,construction materials, and so on.
Based on national prevalence mappingof schistosomiasis and soil-transmittedhelminth. Includes staff, fuel andvehicle costs.
Staffing cost and teacher per diem.
HGSF
WASH
DEWORMING
Table 2: Cost Categories of the SHN Interventions (continued)
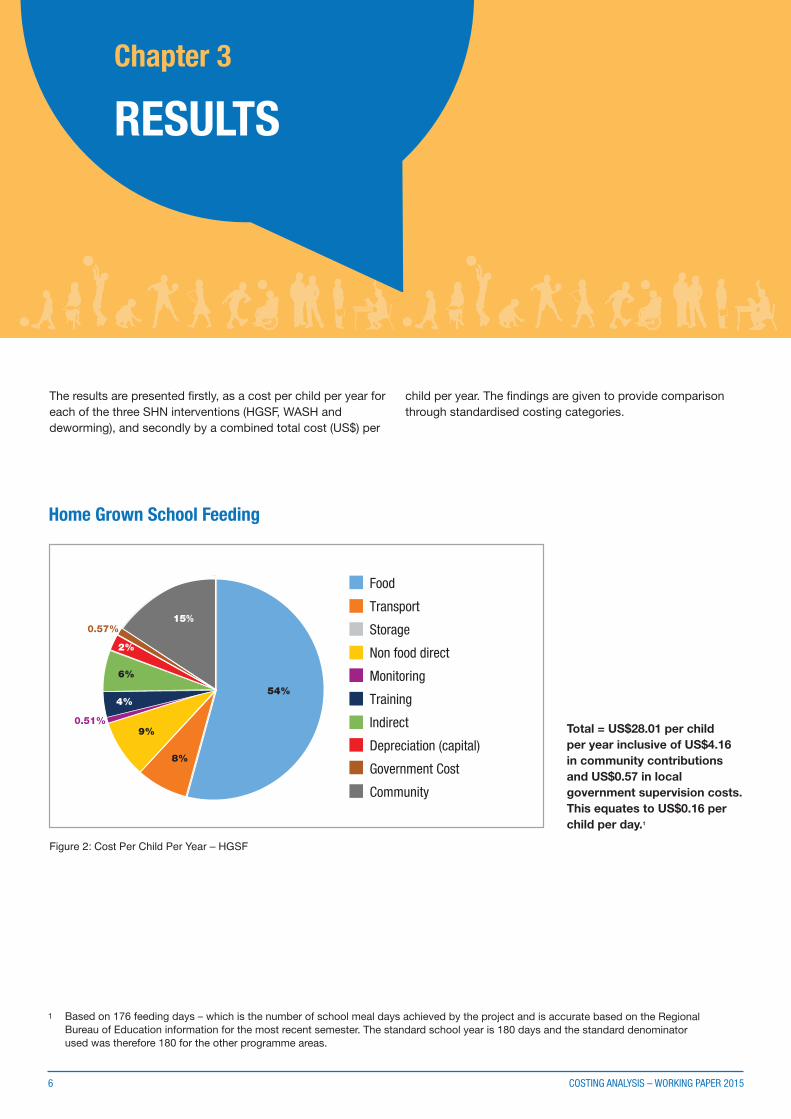
The results are presented firstly, as a cost per child per year foreach of the three SHN interventions (HGSF, WASH anddeworming), and secondly by a combined total cost (US$) per
child per year. The findings are given to provide comparisonthrough standardised costing categories.
6 COSTING ANALYSIS – WORKING PAPER 2015
Total = US$28.01 per childper year inclusive of US$4.16in community contributionsand US$0.57 in localgovernment supervision costs.This equates to US$0.16 perchild per day.1
Food
Transport
Storage
Non food direct
Monitoring
Training
Indirect
Depreciation (capital)
Government Cost
Community
54%
15%
9%
8%
4%
6%
2%
0.51%
0.57%
1 Based on 176 feeding days – which is the number of school meal days achieved by the project and is accurate based on the Regional Bureau of Education information for the most recent semester. The standard school year is 180 days and the standard denominator used was therefore 180 for the other programme areas.
RESULTSChapter 3
Figure 2: Cost Per Child Per Year – HGSF
Home Grown School Feeding
COSTING ANALYSIS – WORKING PAPER 2015 7
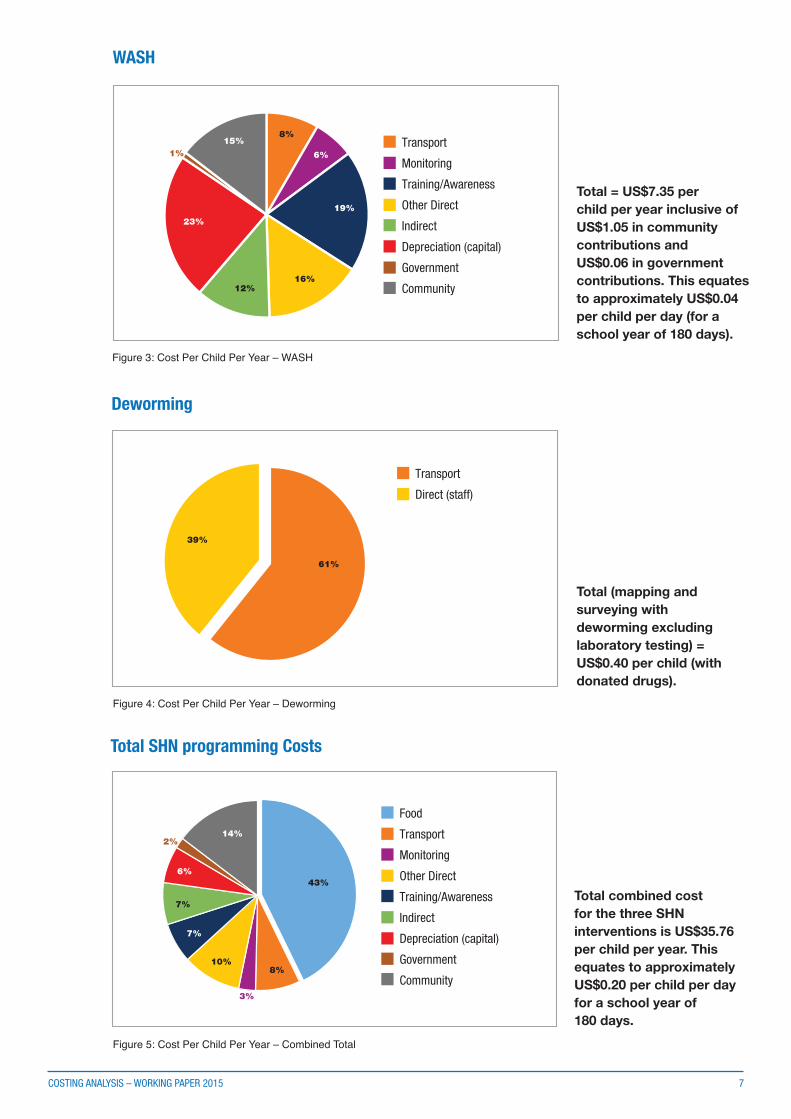
WASH
Transport
Monitoring
Training/Awareness
Other Direct
Indirect
Depreciation (capital)
Government
Community
19%
6%
8%15%
23%
12%16%
1%
Transport
Direct (staff)
61%
39%
Food
Transport
Monitoring
Other Direct
Training/Awareness
Indirect
Depreciation (capital)
Government
Community
14%
43%
8%
3%
10%
7%
7%
6%
2%
Total (mapping andsurveying withdeworming excludinglaboratory testing) =US$0.40 per child (withdonated drugs).
Total = US$7.35 perchild per year inclusive ofUS$1.05 in communitycontributions andUS$0.06 in governmentcontributions. This equatesto approximately US$0.04per child per day (for aschool year of 180 days).
Total combined costfor the three SHNinterventions is US$35.76per child per year. Thisequates to approximatelyUS$0.20 per child per dayfor a school year of180 days.
Figure 3: Cost Per Child Per Year – WASH
Figure 4: Cost Per Child Per Year – Deworming
Figure 5: Cost Per Child Per Year – Combined Total
Total SHN programming Costs
Deworming
8 COSTING ANALYSIS – WORKING PAPER 2015
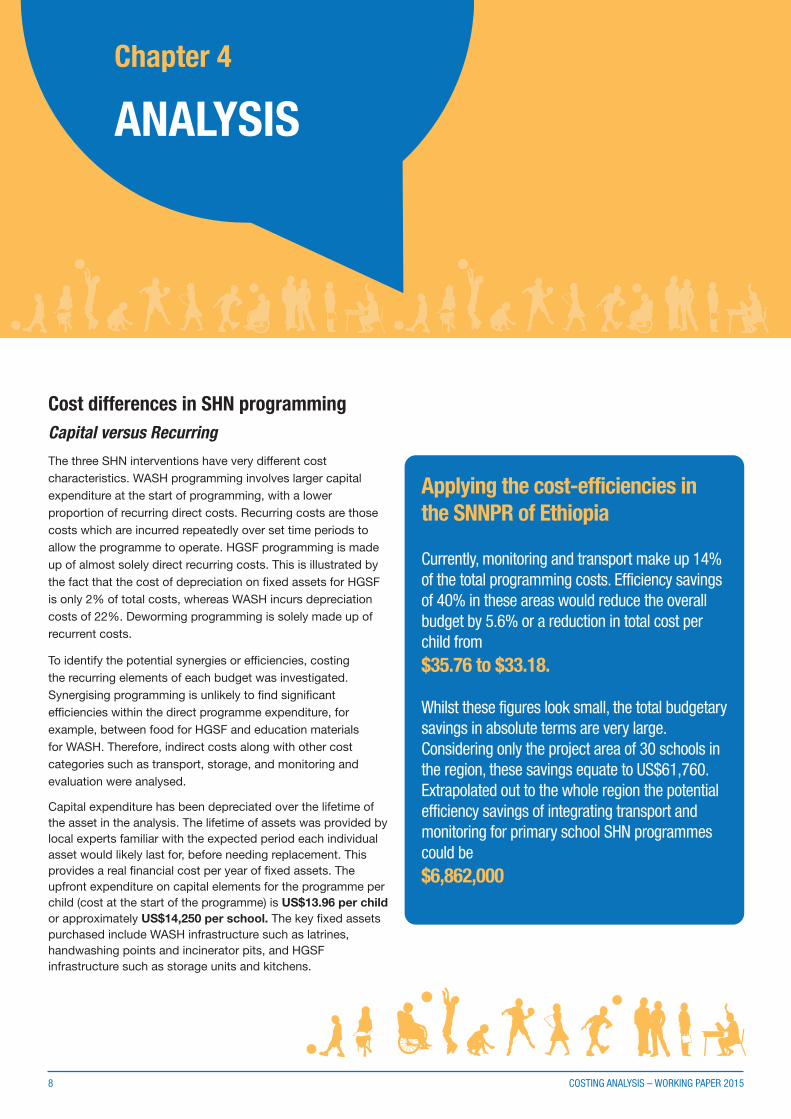
Cost differences in SHN programmingCapital versus Recurring
The three SHN interventions have very different costcharacteristics. WASH programming involves larger capitalexpenditure at the start of programming, with a lowerproportion of recurring direct costs. Recurring costs are thosecosts which are incurred repeatedly over set time periods toallow the programme to operate. HGSF programming is madeup of almost solely direct recurring costs. This is illustrated bythe fact that the cost of depreciation on fixed assets for HGSFis only 2% of total costs, whereas WASH incurs depreciationcosts of 22%. Deworming programming is solely made up ofrecurrent costs.
To identify the potential synergies or efficiencies, costingthe recurring elements of each budget was investigated.Synergising programming is unlikely to find significantefficiencies within the direct programme expenditure, forexample, between food for HGSF and education materialsfor WASH. Therefore, indirect costs along with other costcategories such as transport, storage, and monitoring andevaluation were analysed.
Capital expenditure has been depreciated over the lifetime ofthe asset in the analysis. The lifetime of assets was provided bylocal experts familiar with the expected period each individualasset would likely last for, before needing replacement. Thisprovides a real financial cost per year of fixed assets. Theupfront expenditure on capital elements for the programme perchild (cost at the start of the programme) is US$13.96 per childor approximately US$14,250 per school. The key fixed assetspurchased include WASH infrastructure such as latrines,handwashing points and incinerator pits, and HGSFinfrastructure such as storage units and kitchens.
Applying the cost-efficiencies inthe SNNPR of Ethiopia
Currently, monitoring and transport make up 14%of the total programming costs. Efficiency savingsof 40% in these areas would reduce the overallbudget by 5.6% or a reduction in total cost perchild from $35.76 to $33.18.
Whilst these figures look small, the total budgetarysavings in absolute terms are very large.Considering only the project area of 30 schools inthe region, these savings equate to US$61,760.Extrapolated out to the whole region the potentialefficiency savings of integrating transport andmonitoring for primary school SHN programmescould be $6,862,000
ANALYSISChapter 4
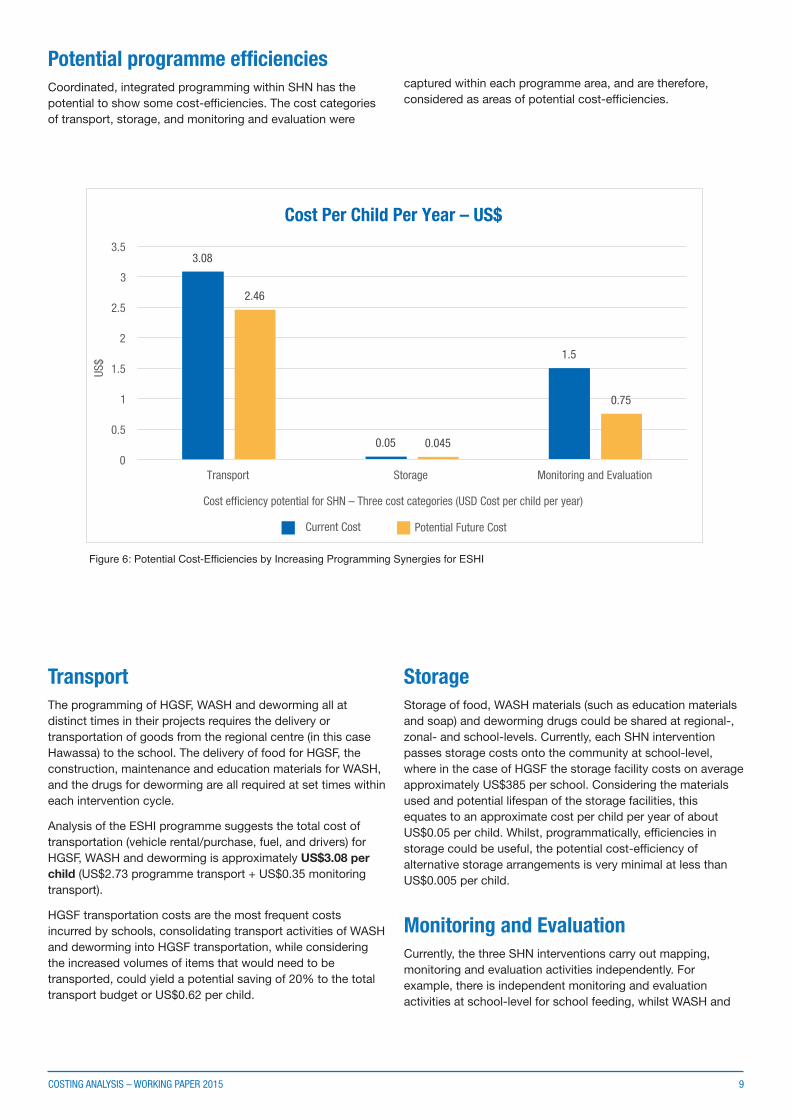
Potential programme efficienciesCoordinated, integrated programming within SHN has thepotential to show some cost-efficiencies. The cost categories of transport, storage, and monitoring and evaluation were
captured within each programme area, and are therefore,considered as areas of potential cost-efficiencies.
TransportThe programming of HGSF, WASH and deworming all atdistinct times in their projects requires the delivery ortransportation of goods from the regional centre (in this caseHawassa) to the school. The delivery of food for HGSF, theconstruction, maintenance and education materials for WASH,and the drugs for deworming are all required at set times withineach intervention cycle.
Analysis of the ESHI programme suggests the total cost oftransportation (vehicle rental/purchase, fuel, and drivers) forHGSF, WASH and deworming is approximately US$3.08 perchild (US$2.73 programme transport + US$0.35 monitoringtransport).
HGSF transportation costs are the most frequent costsincurred by schools, consolidating transport activities of WASHand deworming into HGSF transportation, while consideringthe increased volumes of items that would need to betransported, could yield a potential saving of 20% to the totaltransport budget or US$0.62 per child.
StorageStorage of food, WASH materials (such as education materialsand soap) and deworming drugs could be shared at regional-,zonal- and school-levels. Currently, each SHN interventionpasses storage costs onto the community at school-level,where in the case of HGSF the storage facility costs on averageapproximately US$385 per school. Considering the materialsused and potential lifespan of the storage facilities, thisequates to an approximate cost per child per year of aboutUS$0.05 per child. Whilst, programmatically, efficiencies instorage could be useful, the potential cost-efficiency ofalternative storage arrangements is very minimal at less thanUS$0.005 per child.
Monitoring and EvaluationCurrently, the three SHN interventions carry out mapping,monitoring and evaluation activities independently. Forexample, there is independent monitoring and evaluationactivities at school-level for school feeding, whilst WASH and
COSTING ANALYSIS – WORKING PAPER 2015 9
3.08
0.05
1.5
2.46
0.045
0.75
0
0.5
1
1.5
2
2.5
3
3.5
Transport Storage Monitoring and Evaluation
US$
Potential Future Cost
Cost efficiency potential for SHN – Three cost categories (USD Cost per child per year)
Current Cost
Cost Per Child Per Year – US$
Figure 6: Potential Cost-Efficiencies by Increasing Programming Synergies for ESHI
deworming monitoring and evaluation activities take place fromdifferent government departments and ministries as well asfrom the different implementers.
The separate monitoring and evaluation activities and mapping,costs a total of US$1.50 per child (inclusive of capital costs).
By unifying monitoring and evaluation activities within a singleframework, without duplication of staff, transport andcommunication costs, the maximum cost saving potentialstands at 50% or US$0.75 per child. This is based on themaximum single monitoring and evaluation cost for a singleprogramme component plus a 25% premium for the increasedvolume of indicators.
CommunitiesThe community contribution to the entire ESHI programme isestimated to be about 14% of total programming cost (seefigure 5). These costs include direct costs of either cash ornon-cash commitments that are easily exchanged for cash.The level of community contributions is comparable betweenthe HGSF and WASH interventions. The per child communitycontribution equates to approximately US$5.20 per childper year.
Efficiencies in scaleThe analysis estimates the cost of an integrated SHNprogramme using the existing implementation methodologiesthat have been fully carried out in 15 schools. The findingswithin this report do not investigate potential efficiency savingsin programme scale-up of interventions. Local sourcing of foodfor the HGSF intervention limits the potential efficiencies ofscale If not accompanied by other development interventionssuch as improved access to agricultural inputs and markets.There are other potential efficiency savings in monitoring,government costs and indirect programme costs, whichcurrently make up 15% of the total combined budget.
10 COSTING ANALYSIS – WORKING PAPER 2015
ReferencesSave the Children. (2013) School Health and Nutrition: Program Update. Save the Children: Connecticut. WFP. (2013) In-Depth Cost Analysis: Guidance on How to Run Analysis. (Draft). WFP: Rome.WFP. (2013a) Cambodia School Feeding Scholarship Programme: Cost Efficiency Analysis. WFP: Rome.
COSTING ANALYSIS – WORKING PAPER 2015 11
The three SHN interventions (HGSF, WASH and deworming)offer quite different costs when considering capital andrecurrent costs. When projected over time, whether asan assets lifespan or programme cycle, the costs presentedhere give a clearer indication of budgetary requirements in theshort- and medium-term.
Significantly, the context in which SHN interventions areimplemented requires serious consideration, and as statedpreviously these findings only provide an insight into theassortment of costs incurred across the SHN sphere andcommunity of implementers. For instance, WFP costinganalysis of school feeding programmes in Ghana, found thatefficiencies can be made by improving staffing and officeexpenditure (WFP, 2013), while in Cambodia, WFP expenditureon direct food costs was between 38% and 39% depending onprogramme methodology (WFP, 2013a). This reflects favourablywith the findings of 54% of the HGSF model implementedwithin the ESHI programme, possibly owing to the localisedprocurement modality. Consistencies with these findings isprovided by Save the Children (2013), who when analysingSHN programmes – not inclusive of HGSF – identified directgovernment expenditure as 2%, the same as the ESHIprogramme.
Community contribution as understood through this exerciseprevails at 14% of the total intervention cost. Throughout the
process, communities presented a willingness to burden thiscost in light of the value of such programmes. Whenconsidering the pro-poor origins of such social interventionsand the current socioeconomic status of target groups, excesscommunity costs could be easily incurred and counter-beneficial if left unmonitored.
There are significant differences in the types of cost associatedwith running the different components of a comprehensive SHNprogramme. WASH costs are often predominately fixed capitalcosts, whilst school feeding and deworming costs involvemainly recurring costs. Cost categories such as transport,storage, and monitoring and evaluation show the potential ofcost savings for integrated programming. Making smallprogramme changes to integrate these processes could savebetween 5-6% of total expenditure. When considering SHNprogramming on regional and national scales, these savingscould be as significant as US$6.5 million for the SNNPR ofEthiopia alone.
Therefore, completed analysis does indicate that integratingeven just three interventions into SHN programming has costbenefits and can be carried out efficiently. The addition ofWASH and deworming programme components to schoolfeeding only requires an additional budget increment of 25%.Such an additional cost stands to optimise the health andnutritional benefits of targeted school-age children.
CONCLUSIONSChapter 5
The Partnership for Child Development
School of Public Health, Imperial College LondonFaculty of Medicine, Norfolk PlaceLondon, W2 1PG, UK
Tel: +44 (0)20 7594 2536
www.imperial.ac.uk/pcdwww.schoolsandhealth.orgwww.hgsf-global.org
PCD Working Paper Series
This paper is part of the PCD Working Paper Series. This series seeks to collate and disseminate the latest analysis,
research and thinking from the field of School Health and Nutrition. To access the other papers in the series please visit
www.schoolsandhealth.org. If you have any queries please email Francis Peel @ [email protected]
@schoolshealth
@HGSFglobal