costing summaries for selected water treatment processes
TRANSCRIPT
Costing Summaries for Selected Water Treatment
Processes
Alix MontelEcole Centrale de Nantes
M. Robin CollinsDepartment of Civil Engineering
University of New Hampshire
Acknowledgment
Project funded from USEPA to the
University of New Hampshire Water Treatment Technology
Assistance Center

Develop Costing Curves for :
• Construction
• Operation and Maintenance

Small Systems
• Limited financial means
• Economy of scale
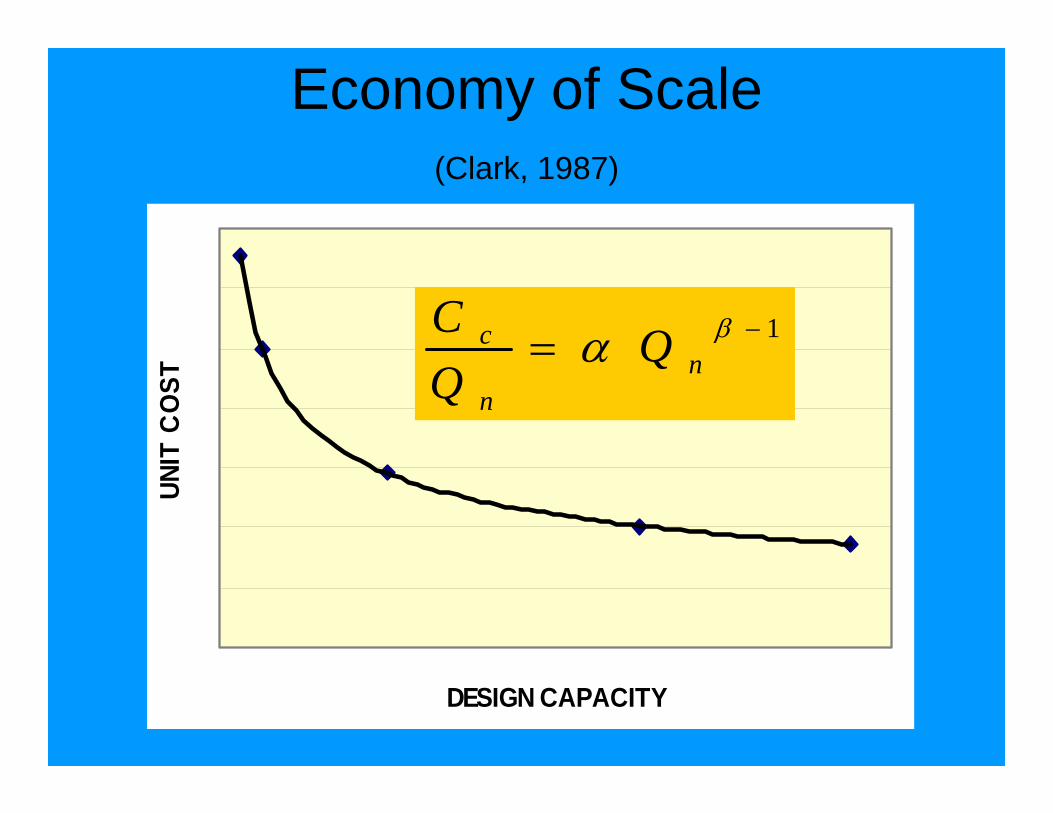
Economy of Scale(Clark, 1987)
DESIGN CAPACITY
UNIT
CO
ST
1−= βα nn
c QQC
A Reference For :• Small Water Utility Decision-
Makers
• Engineering Consultants
• Facility Operators
Treatments Considered :
• Slow Sand Filtration
• Ceramic Media Pressure Filtration

Slow Sand Filtration
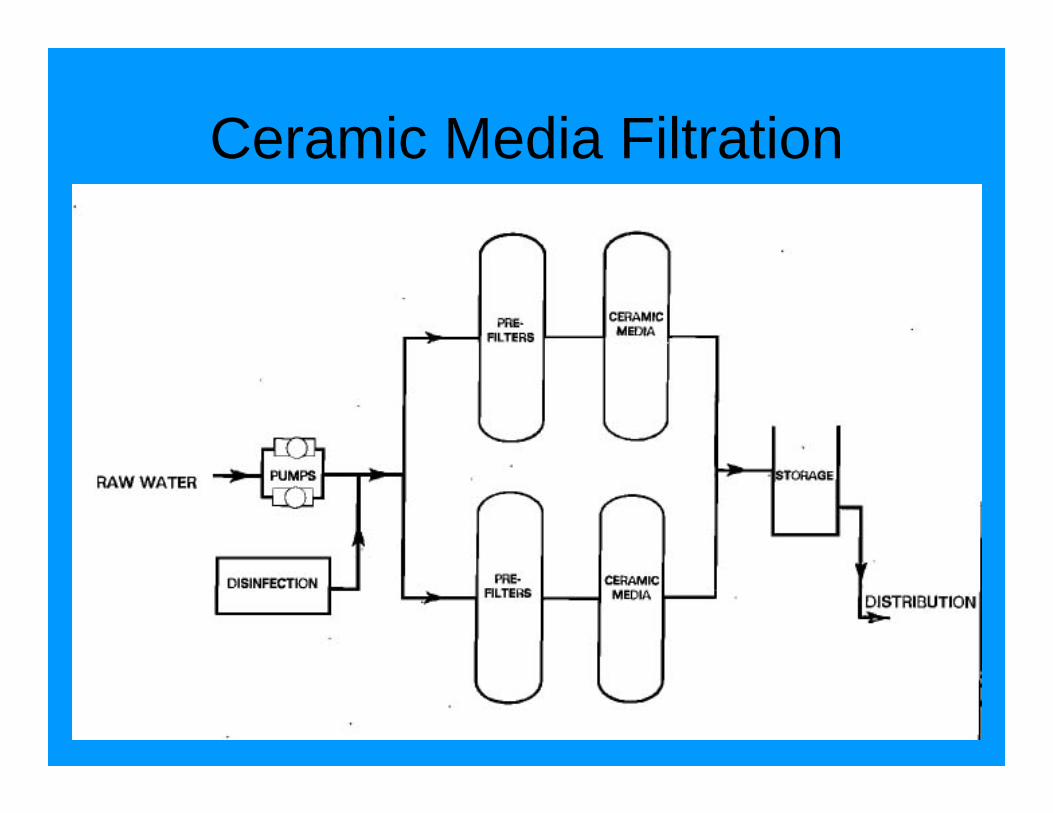
Ceramic Media Filtration
Methodology
Collect Data From:
• Engineering Consulting Companies
• Facility Operators
• Facility Public Works Departments

Questionnaires
• Construction Costs
• O&M Costs
• General Design and Operational Information
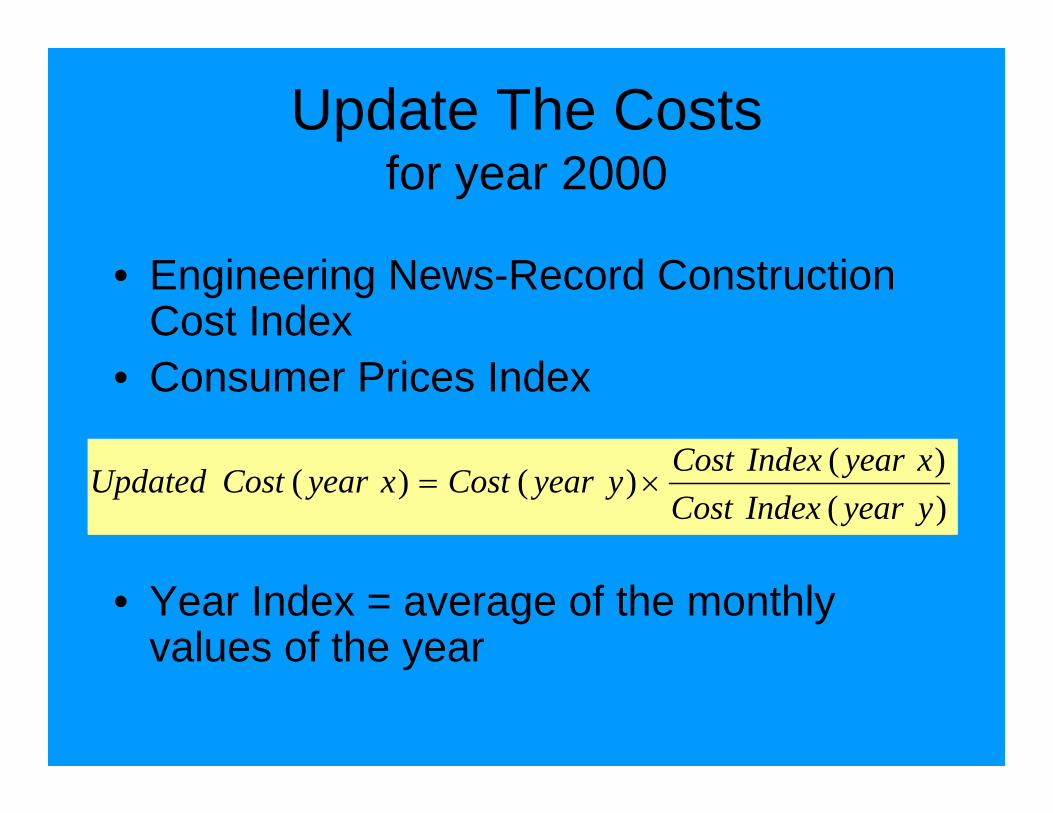
Update The Costsfor year 2000
• Engineering News-Record Construction Cost Index
• Consumer Prices Index
• Year Index = average of the monthly values of the year
)()()()(
yyearIndexCostxyearIndexCostyyearCostxyearCostUpdated ×=
Slow Sand Filtration

1920,19601924,1952,1966
193519551997199619941975199319931993
1992-94199319951994
1997-981992199519961990
50442.421
0.354.8
0.0361
0.30.60.31.2
0.450.61
0.3750.71
0.341
46452
18582787929754
468282
765335962279
1605576564491976
3071374
West Hartford CT.Springfield MA.Greenfield MA.W.Springfield MA.Hatfield MA.Derby VT.Rutland VT.McIndoe Falls VT.Livermore Falls ME.Eagle Lake ME.Winthrop ME.Mars Hill ME.Madison ME.Milo ME.Newport ME.Sunapee NH.Newport NH.Hillsborough NH.Barlett NH.Gorham NH.
Year of Construction
Design Capacity (mgd)
Filter Area (sq.m.)
Facility

20 Slow Sand Filters Surveyed
• 19 of the 20 covered
• design capacity from 0.036 to 50 mgd
• total filter area from 82 to 46,452 m2
• 15 of them built in the 1990s

CONSTRUCTION COSTS
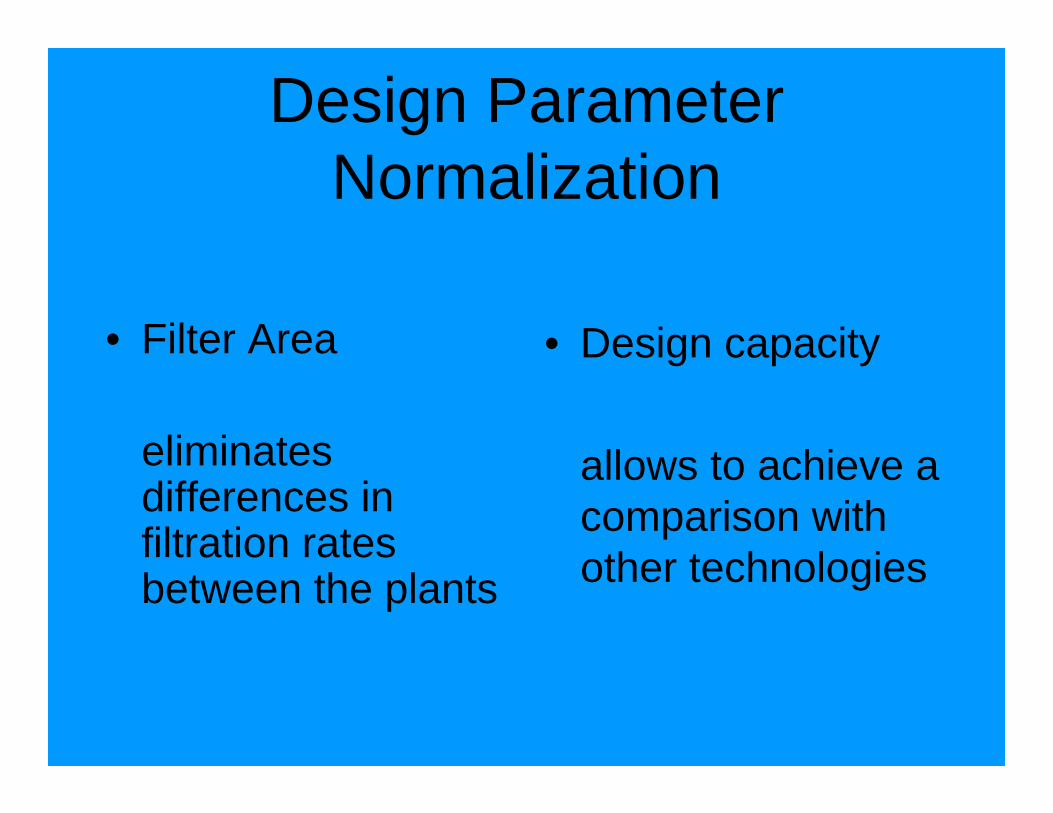
Design ParameterNormalization
• Filter Area
eliminatesdifferences in filtration rates between the plants
• Design capacity
allows to achieve a comparison with other technologies

*1000 m3/hr = 6.34 mgd *Typical Design Value : 0.12m/hr=0.05gpm/sq.ft
Design Capacity versus Filter Area (design filtration rate)
Q = 0 . 1 7 *A
Q =d e s i g n c a p a c i t y ( m 3 / h r )
A =f i l t e r a r e a ( m 2 )
R 2 = 0 . 9 9
0
1 0 0 0
2 0 0 0
3 0 0 0
4 0 0 0
5 0 0 0
6 0 0 0
7 0 0 0
8 0 0 0
9 0 0 0
0 1 0 0 0 0 2 0 0 0 0 3 0 0 0 0 4 0 0 0 0 5 0 0 0 0
FILTER AREA, m 2
DES
IGN
CA
PA
CIT
Y,
m3/
hr
a v e ra g e f i l t ra t i o n ra t e Q / A =0 . 1 7 m/ ho ur

Total Cost(updated for year 2000)
0 .E+0 0
1 .E+0 6
2 .E+0 6
3 .E+0 6
4 .E+0 6
5 .E+0 6
6 .E+0 6
7 .E+0 6
8 .E+0 6
0 1 0 0 0 2 0 0 0 3 0 0 0 4 0 0 0 5 0 0 0
FILTER AREA, m2
C O
N S
T R
U C
T I
O N
C O
S T
, $
Cc=1267.2A +1000000Cc=construction cost($)
A =f ilter area (m2)R2 = 0.90
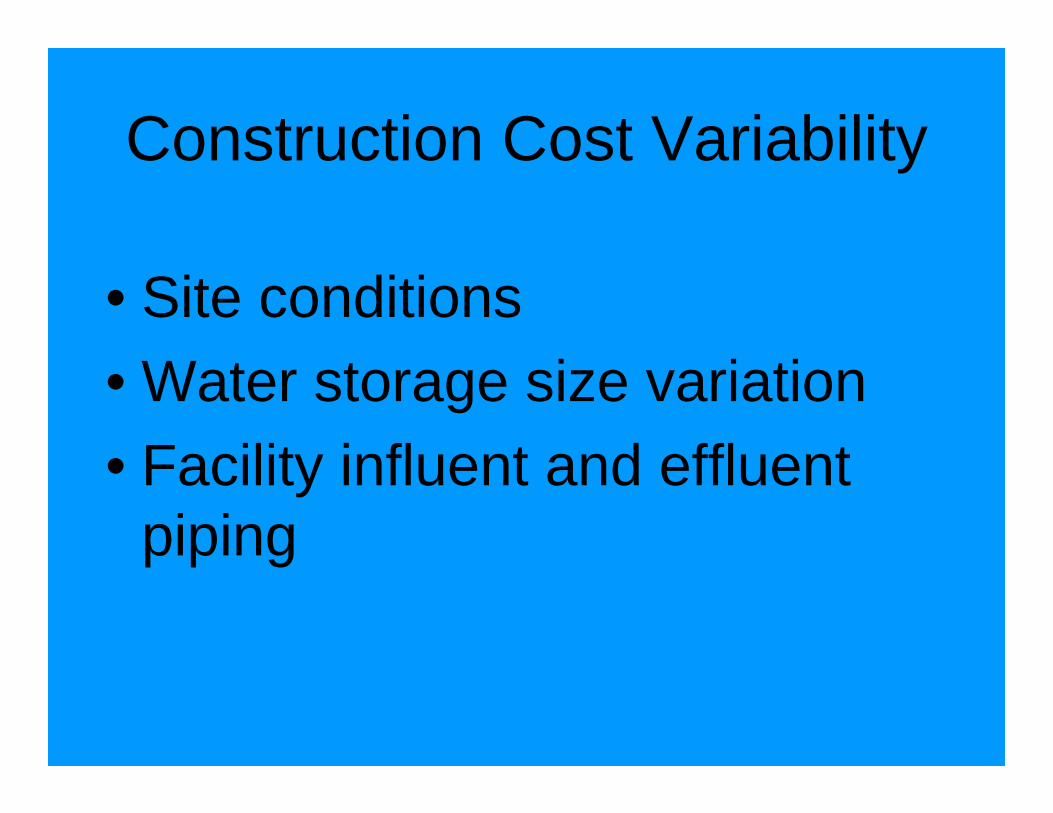
Construction Cost Variability
• Site conditions• Water storage size variation• Facility influent and effluent
piping

Comparison with a Previous Studyby Berg, Tanner and Shied, Slow Sand Filtration, ASCE, 1991
all costs updated for year 2000
0.0E+00
1.0E+06
2.0E+06
3.0E+06
4.0E+06
5.0E+06
6.0E+06
7.0E+06
8.0E+06
0 1000 2000 3000 4000 5000
F I L T E R A R E A, m 2
C O
N S
T .
C O
S T
,$
.
our data
previous survey
0
2,000
4,000
6,000
8,000
10,000
12,000
14,000
16,000
18,000
0 1000 2000 3000 4000 5000
F I L T E R A R E A, m 2
UN
IT C
O S
T, $
/m2
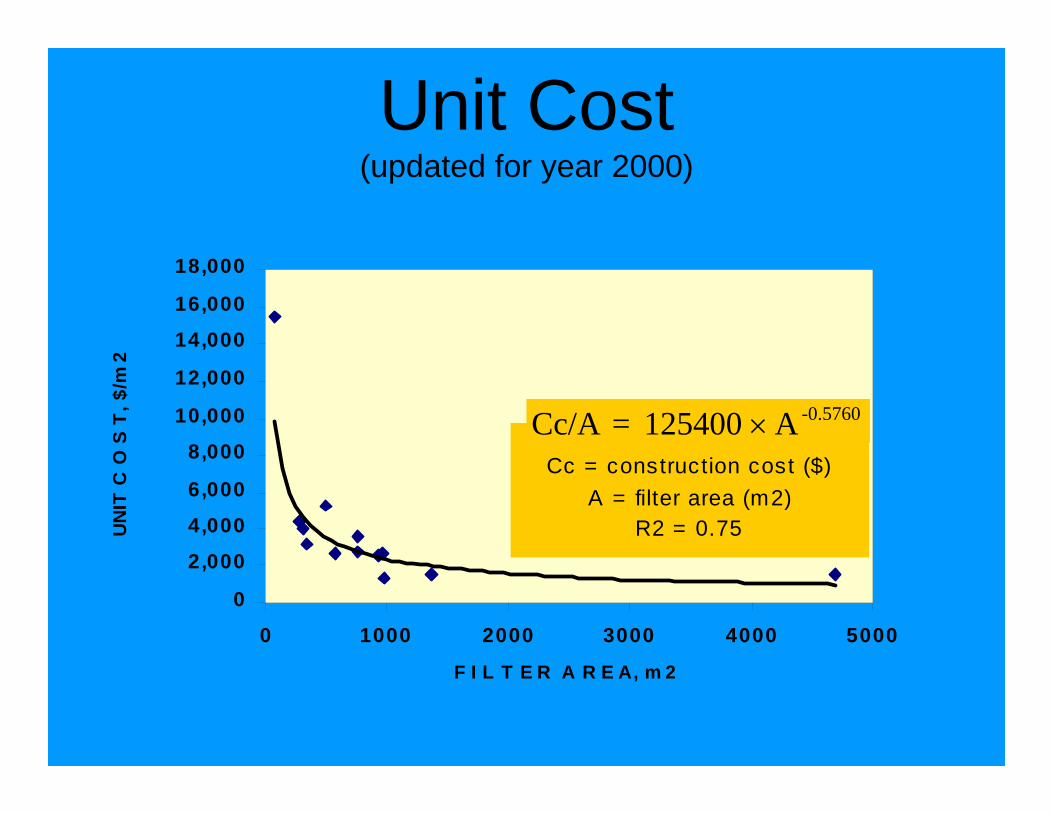
Cc = construction cost ($)A = filter area (m2)
R2 = 0.75
Unit Cost(updated for year 2000)
-0.5760A125400 =Cc/A ×
O&M COSTS
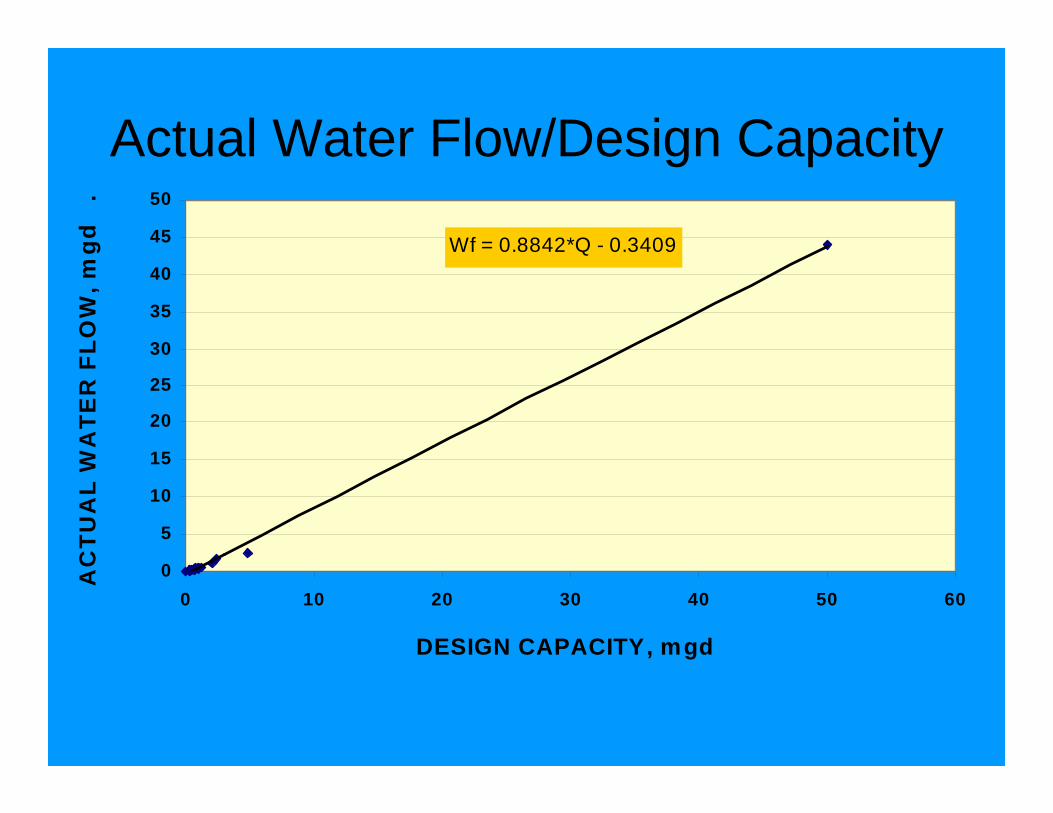
Actual Water Flow/Design Capacity
Wf = 0.8842*Q - 0.3409
0
5
10
15
20
25
30
35
40
45
50
0 10 20 30 40 50 60
DESIGN CAPACITY, mgd
AC
TUA
L W
ATE
R F
LOW
, mgd
.
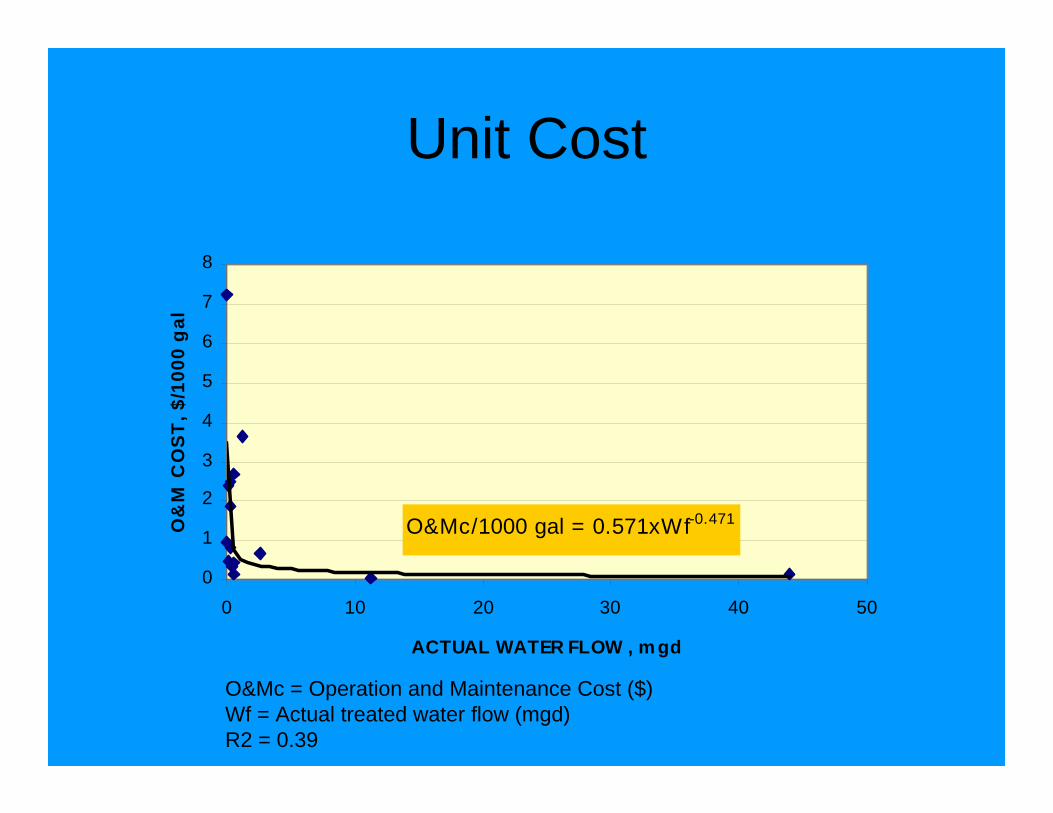
Unit Cost
O&Mc = Operation and Maintenance Cost ($)Wf = Actual treated water flow (mgd)R2 = 0.39
O&Mc/1000 gal = 0.571xWf-0.471
0
1
2
3
4
5
6
7
8
0 10 20 30 40 50
ACTUAL WATER FLOW , m gd
O&
M C
OS
T, $
/100
0 g
al
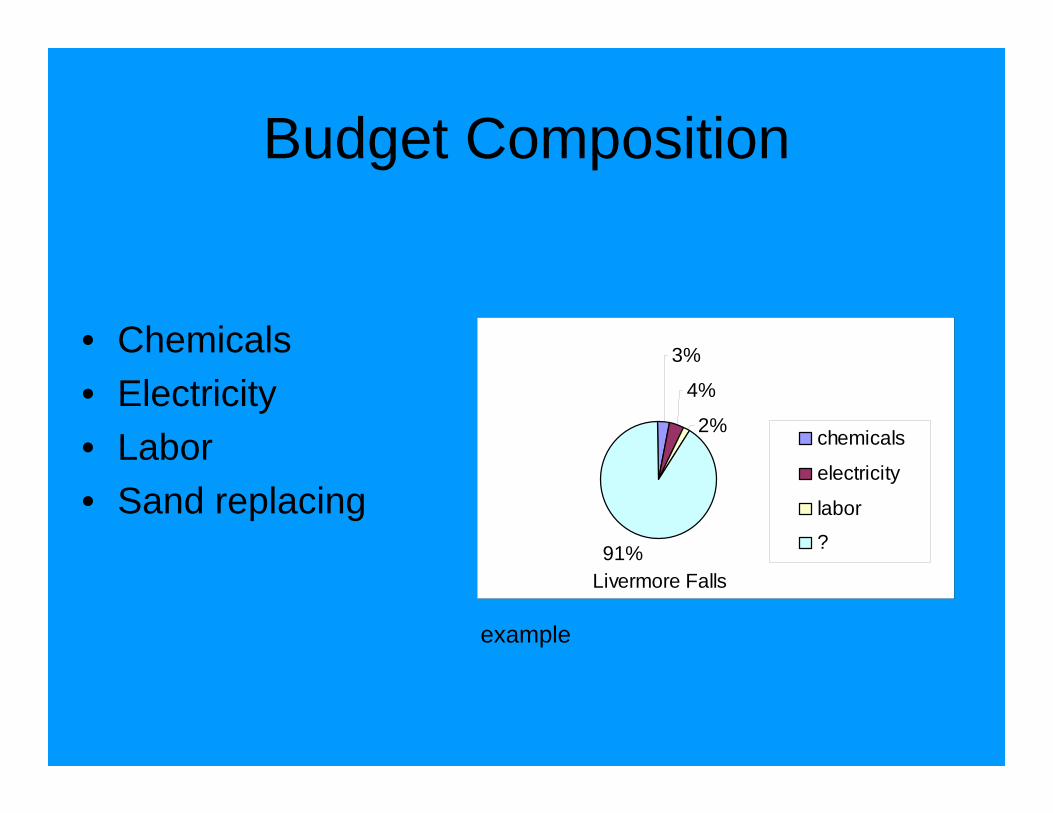
Budget Composition
• Chemicals• Electricity• Labor• Sand replacing
Livermore Falls
3%
4%
2%
91%
chemicals
electricity
labor
?
example

Chem icals, Electricity and Labor Cost
Cos t = 42109.W f + 15037R2 = 0.99
0.00E+00
2.00E+05
4.00E+05
6.00E+05
8.00E+05
1.00E+06
1.20E+06
1.40E+06
1.60E+06
1.80E+06
2.00E+06
0 5 10 15 20 25 30 35 40 45 50
A C T U A L W A T E R F L O W , m gd
Ch
em
., E
lec.
an
d L
abo
r C
ost
, $
.

Chem icals, E lectricity and Labor Cost (zoom )
Cos t = 53620.W f + 11541R2 = 0.95
0
20,000
40,000
60,000
80,000
100,000
120,000
140,000
160,000
180,000
200,000
0 0.5 1 1.5 2 2.5 3
A C T U A L W A T E R F L O W , m g d
Che
m.,
Elec
. and
Lab
or C
ost,
$
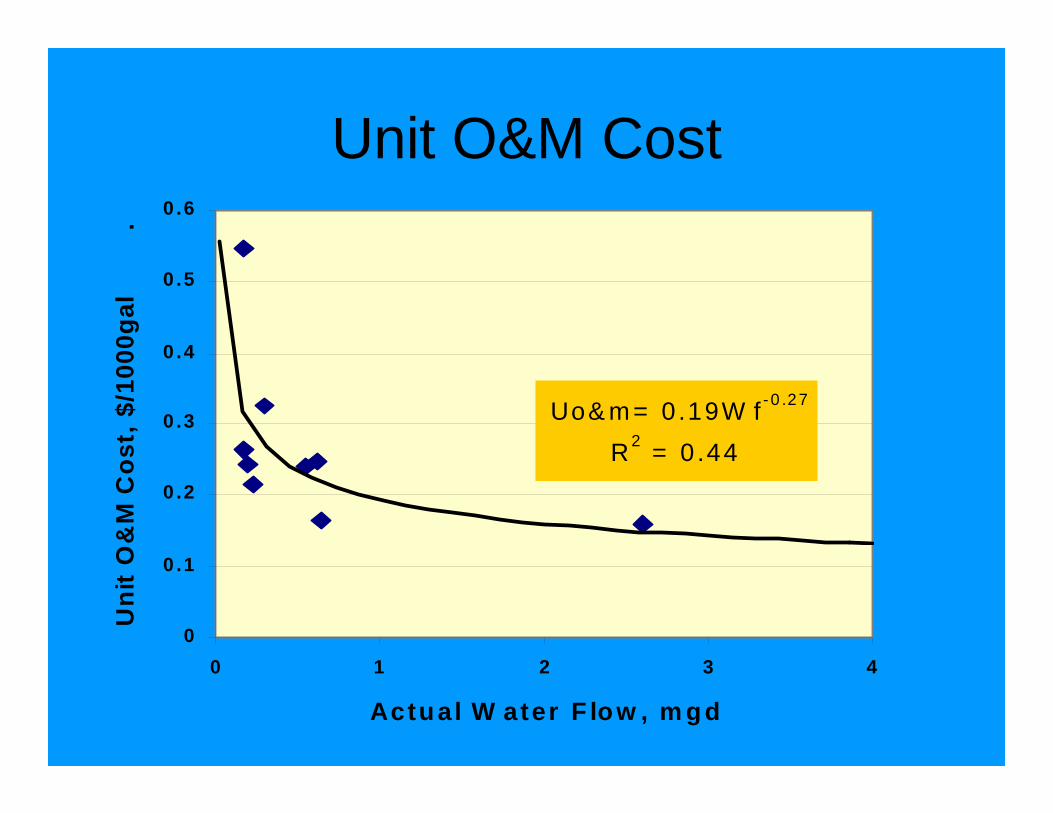
Unit O&M Cost
Uo& m = 0.19W f-0 .27
R2 = 0 .44
0
0 .1
0 .2
0 .3
0 .4
0 .5
0 .6
0 1 2 3 4
Actu al W ater F low , m g d
Uni
t O
&M
Cos
t, $
/100
0gal
.
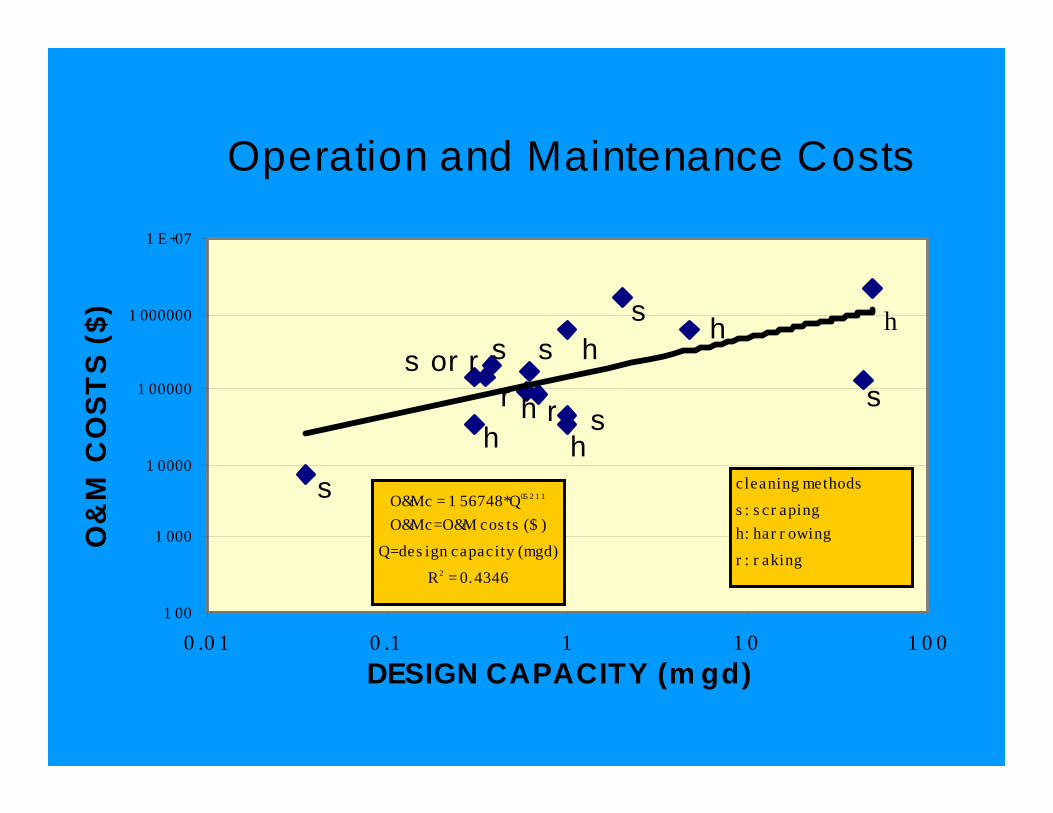
Operation and Maintenance Costs
O&Mc = 1 56748*Q0.5 2 1 1
O&Mc=O&M cos ts ($ )
Q=des ign capacity (mgd)
R2 = 0.4346
1 00
1 000
1 0000
1 00000
1 000000
1 E+07
0 .0 1 0 .1 1 1 0 1 0 0DESIGN CAPACITY (m gd)
O&
M C
OS
TS
($) h
s
hsh
hh
s
rhs or r
rs s
cleaning methods
s : s cr apingh: har r owing
r : r aking
s
O&M Costs Variability
• Raw water quality
• Wages
• Gravity versus pumping
Ceramic Media Filtration
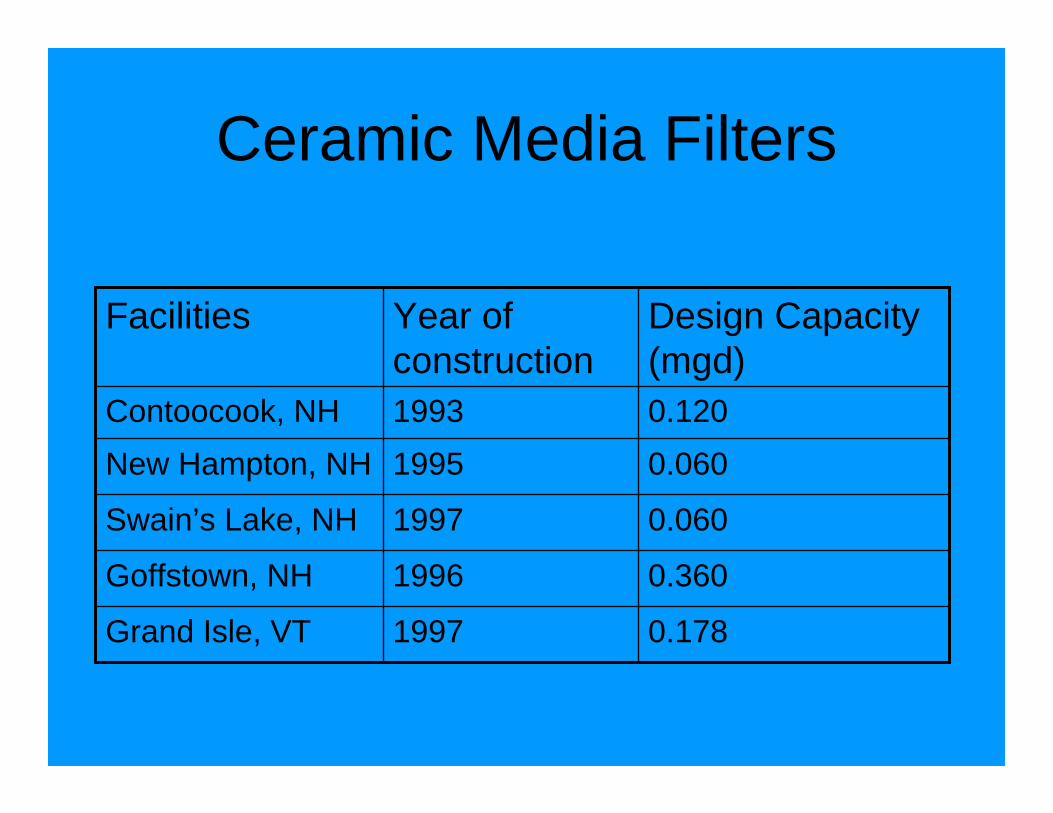
0.1781997Grand Isle, VT
0.3601996Goffstown, NH
0.0601997Swain’s Lake, NH
0.0601995New Hampton, NH0.1201993Contoocook, NH
Design Capacity (mgd)
Year of construction
Facilities
Ceramic Media Filters
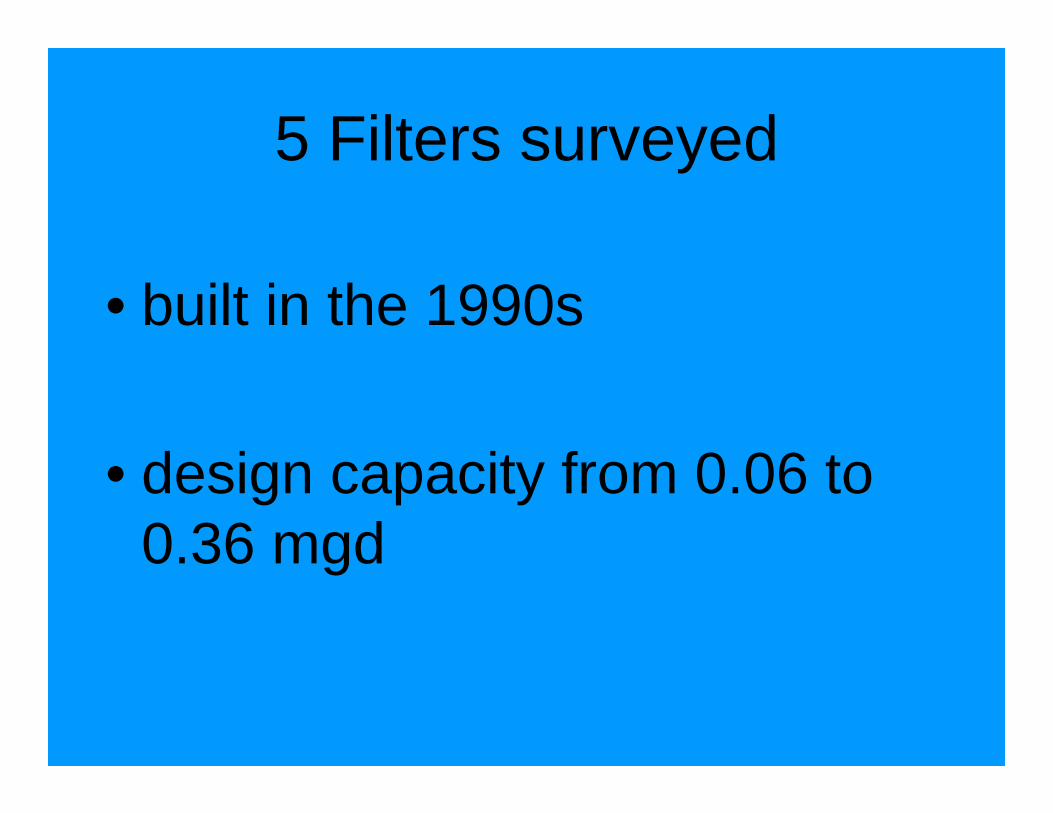
5 Filters surveyed
• built in the 1990s
• design capacity from 0.06 to 0.36 mgd

Construction Cost
• building cost– updated with ENRCCI
• equipment cost– updated with CPI
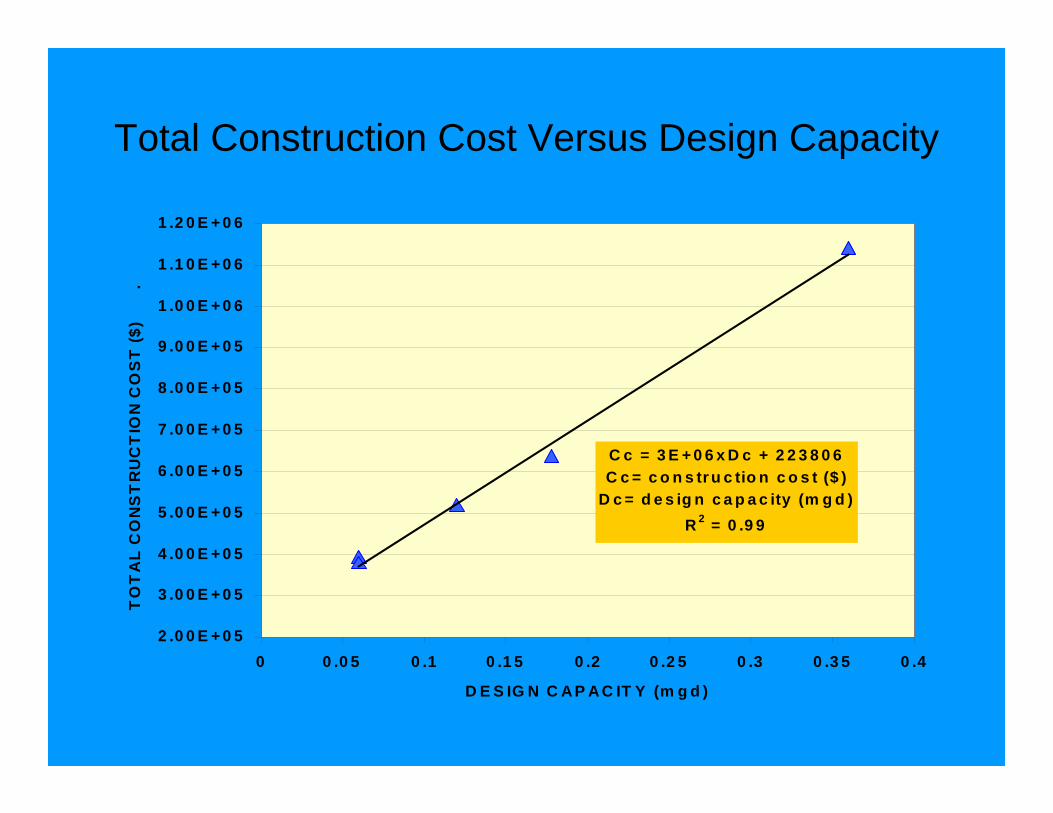
Total Construction Cost Versus Design Capacity
C c = 3 E + 0 6 x D c + 2 2 3 8 0 6C c = c o n s tr u c tio n c o s t ($ )
D c = d e s ig n c a p a c ity (m g d )R 2 = 0 .9 9
2 .0 0 E + 0 5
3 .0 0 E + 0 5
4 .0 0 E + 0 5
5 .0 0 E + 0 5
6 .0 0 E + 0 5
7 .0 0 E + 0 5
8 .0 0 E + 0 5
9 .0 0 E + 0 5
1 .0 0 E + 0 6
1 .1 0 E + 0 6
1 .2 0 E + 0 6
0 0 .0 5 0 .1 0 .1 5 0 .2 0 .2 5 0 .3 0 .3 5 0 .4
D E S IG N C A P A C IT Y (m g d )
TO
TA
L C
ON
ST
RU
CT
ION
CO
ST
($)
.
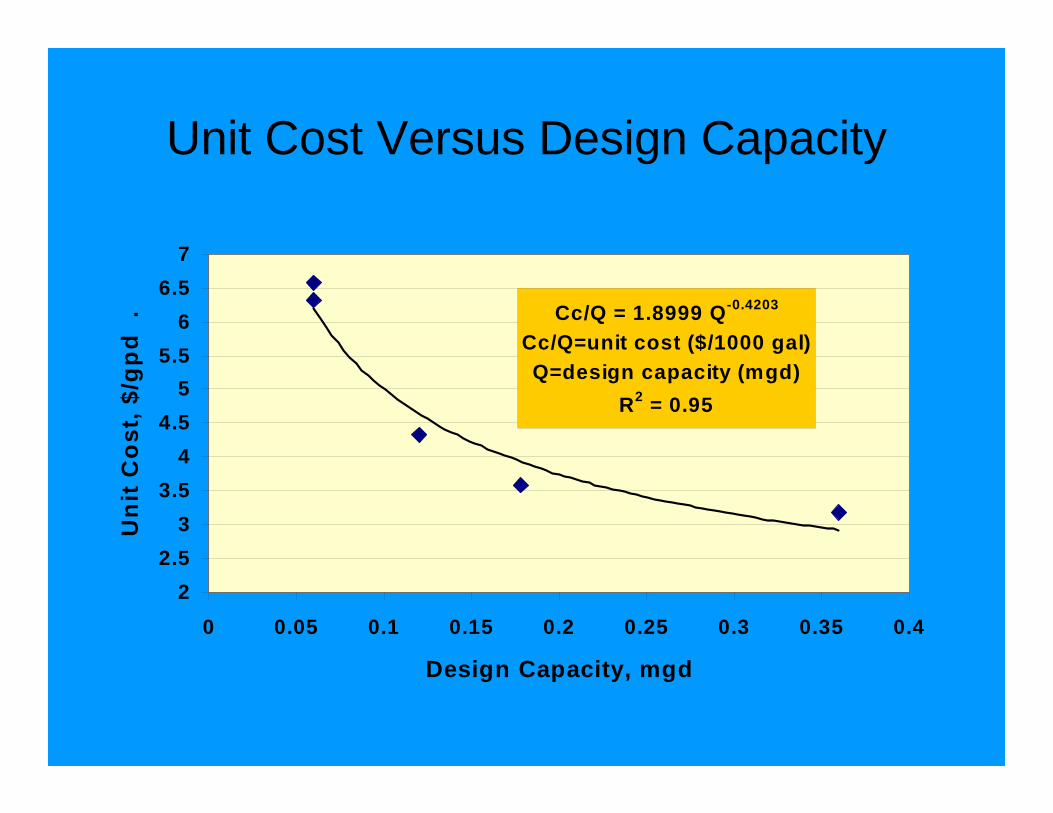
Unit Cost Versus Design Capacity
Cc/Q = 1.8999 Q-0.4203
Cc/Q=unit cost ($/1000 gal)Q=design capacity (mgd)
R2 = 0.95
22.5
33.5
44.5
55.5
66.5
7
0 0.05 0.1 0.15 0.2 0.25 0.3 0.35 0.4
Design Capacity, mgd
Un
it C
ost
, $/g
pd
.

O&M COSTS
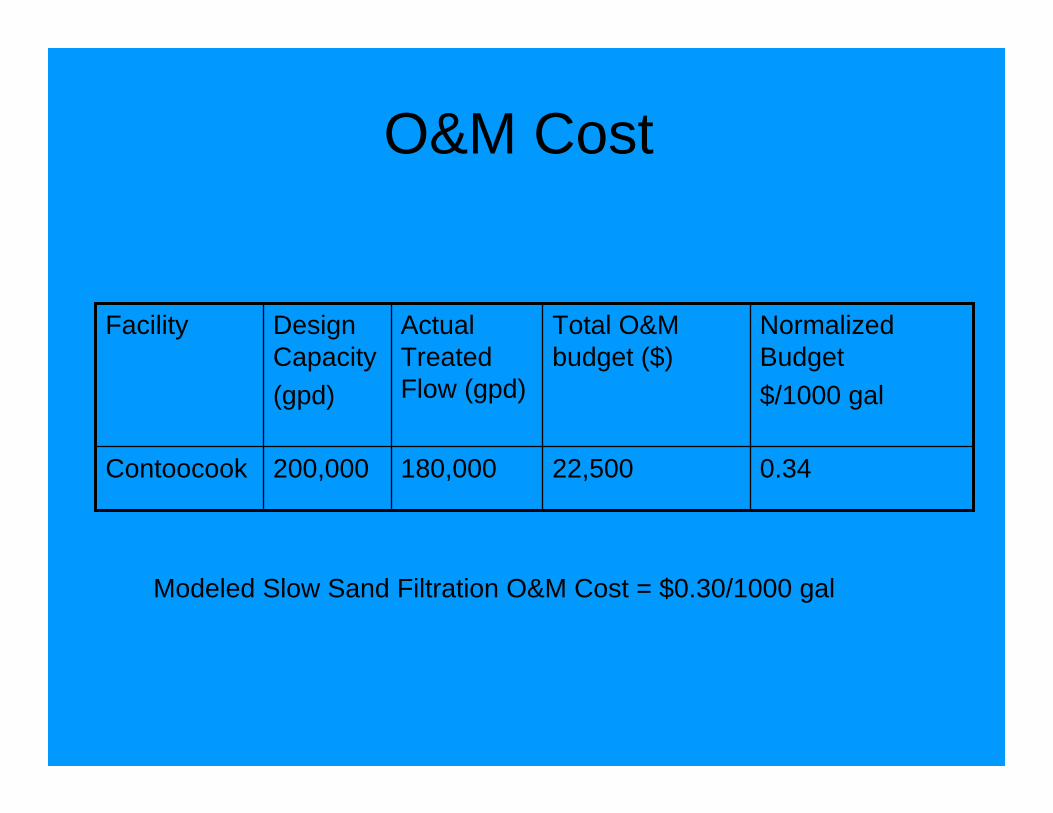
O&M Cost
0.3422,500180,000200,000Contoocook
Normalized Budget$/1000 gal
Total O&M budget ($)
Actual Treated Flow (gpd)
Design Capacity(gpd)
Facility
Modeled Slow Sand Filtration O&M Cost = $0.30/1000 gal
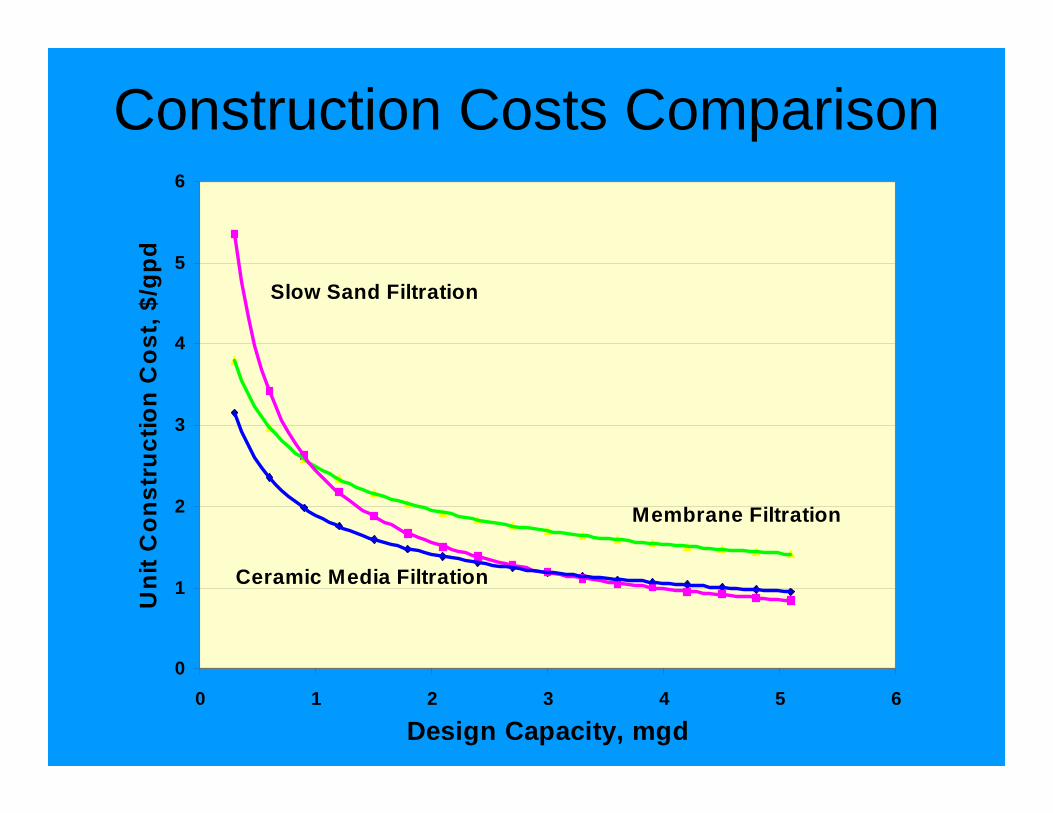
Construction Costs Comparison
Membrane Filtration
Slow Sand Filtration
Ceramic Media Filtration
0
1
2
3
4
5
6
0 1 2 3 4 5 6
Design Capacity, mgd
Uni
t Con
stru
ctio
n C
ost,
$/gp
d

0
0.1
0.2
0.3
0.4
0.5
0.6
0 1 2 3 4
Actual W ate r Flow , m gd
Uni
t O
&M
Cos
t, $
/100
0gal
.O&M Costs Comparison
Slow Sand Filtration
Ceramic Media Filtration
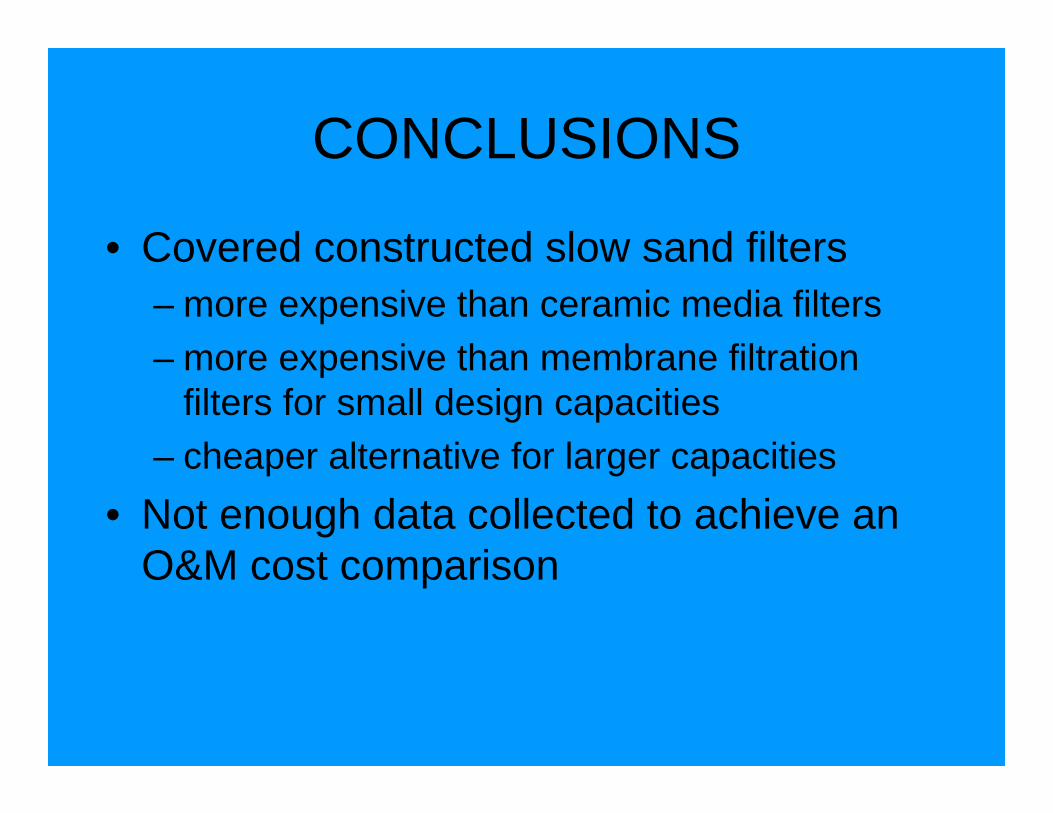
CONCLUSIONS
• Covered constructed slow sand filters – more expensive than ceramic media filters– more expensive than membrane filtration
filters for small design capacities– cheaper alternative for larger capacities
• Not enough data collected to achieve an O&M cost comparison