costs and outcomes of differentiated art service …
TRANSCRIPT

FBIM, facility-based individual management; FBG, facility-based groups; FDR, fast-track drug refills; CCLAD, community client-led ART delivery; CDDP, community drug distribution points
COSTS AND OUTCOMES OF DIFFERENTIATED ART SERVICE DELIVERY IN UGANDA: SUMMARY OF FINDINGS, AUGUST 2020
1. INTRODUCTION In 2016, the Ugandan Ministry of Health (MOH) and implementing partners (IPs) began piloting and scaling-up differentiated ART service delivery models (DSDMs) to provide HIV treatment in ways that are tailored to the needs and preferences of people living with HIV (PLHIV), with the aim of maintaining good clinical outcomes and improving efficiency in service delivery [1]. As of 2019, there were five officially approved DSDMs, including the conventional (standard of care) facility-based individual management model of care. These five models are: • Facility-based individual management (FBIM):
this model is meant for clients needing extra attention, such as unstable/complex clients, those who have recently been initiated in care, and those who chose to continue to receive their services at the facility. FBIM is the conventional standard-of-care model of ART delivery.
• Facility-based groups (FBG): are intended for stable or complex clients needing peer support, such as adolescents, pregnant and lactating women (PLW), and discordant couples. The frequency of their ARV refills depends on clients’ stability.
• Fast-track drug refills (FDR): for stable clients who pick-up their ARVs directly from clinics, (and these can include clients on second-line regimens).
• Community client-led ART delivery (CCLAD): stable clients form groups within their communities. One person is selected (on rotational basis) to collect the ARV refills for the whole group from the facility.
• Community drug distribution points (CDDP): stable clients pick up their ARVs from a community outreach point.
• Longer appointment spacing and multi-month scripting can be offered to stable clients in all models [1].
All PLHIV are eligible for differentiated care and treatment, but their model options depend on various factors, including their clinical stability. In Uganda, a “stable” client is defined as one who: • Has been on their current first or second line ART regimen for longer than 12 months (except for
those transitioning to Dolutegravir-based regimen who are still considered stable if all other criteria are met); and
• Is virally suppressed according to their most recent viral load results within the last 12 months; and • Is in WHO stage 1 or 2; and • Has demonstrated good adherence (> 95%) in the last 6 consecutive months. • TB patients who meet these criteria, have completed their intensive phase treatment (2 months), and
are sputum negative are also considered stable [1]. By October 2019, national reporting indicated that roughly 60% of all ART patients had been enrolled in one of the four non-FBIM models, and that 68% of all ART-eligible facilities were offering at least one of these models. Together, the FDR (38%) and FBIM (40%) models accounted for three quarters of total ART clients as of June 2019, with smaller proportions in each of the other models [2]. Despite this rapid expansion, there are limited recent, primary data on the costs and treatment outcomes of DSDMs in Uganda. Understanding their clients’ outcomes and the costs of setting up and running these models is essential for their continued scale up and sustainability. On the request of the MOH, USAID’s EQUIP Project conducted a cost-outcome analysis of the five DSDM types from January 2017 to December 2018 to inform implementation options and budgeting.
Unstable/complex clients served by the FBIM model include new initiates who have been on their current ART regimen <12 months and ART clients who are not virally suppressed, have co-morbidities or had opportunistic infections within the past year (current or history of WHO stages 3 or 4), are on 3rd line treatment, have poor adherence (less than 95%), have tuberculosis (TB) and are in intensive phase of treatment (< 2 months) or are still sputum positive after intensive phase treatment, or are multidrug-resistant TB (MDR-TB)/HIV co-infected clients [1].
FBIM, facility-based individual management; FBG, facility-based groups; FDR, fast-track drug refills; CCLAD, community client-led ART delivery; CDDP, community drug distribution points
2
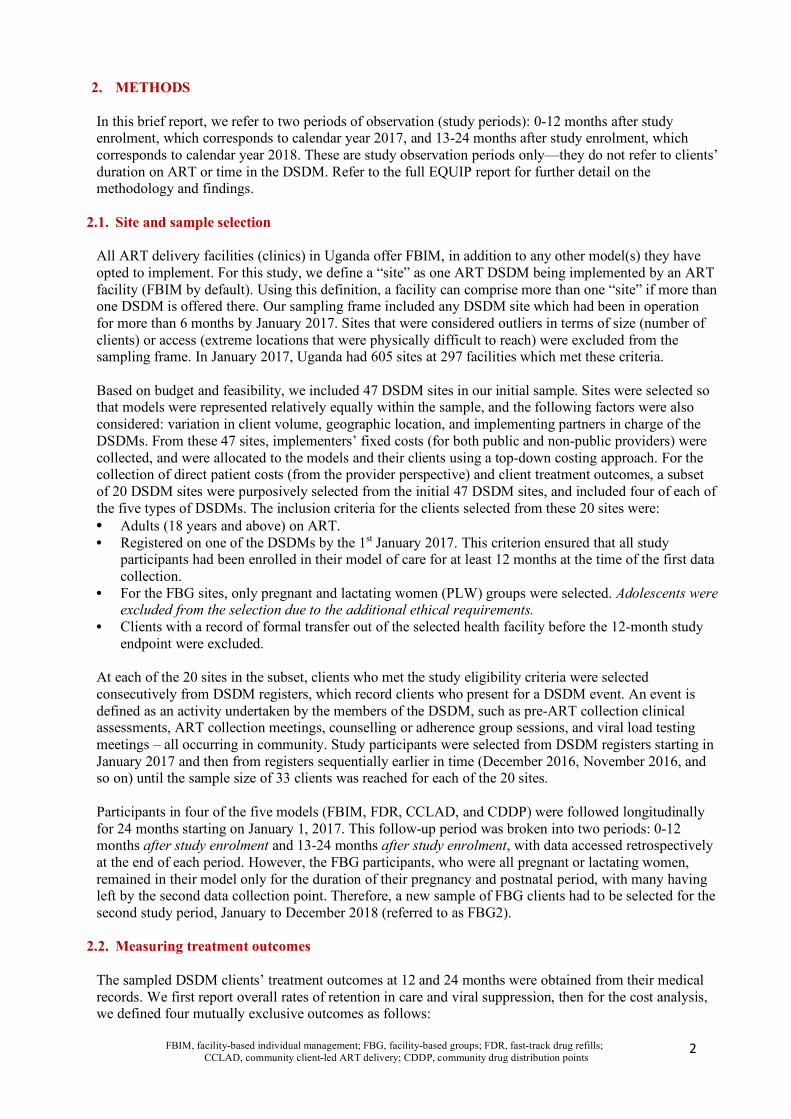
2. METHODS In this brief report, we refer to two periods of observation (study periods): 0-12 months after study enrolment, which corresponds to calendar year 2017, and 13-24 months after study enrolment, which corresponds to calendar year 2018. These are study observation periods only—they do not refer to clients’ duration on ART or time in the DSDM. Refer to the full EQUIP report for further detail on the methodology and findings.
2.1. Site and sample selection All ART delivery facilities (clinics) in Uganda offer FBIM, in addition to any other model(s) they have opted to implement. For this study, we define a “site” as one ART DSDM being implemented by an ART facility (FBIM by default). Using this definition, a facility can comprise more than one “site” if more than one DSDM is offered there. Our sampling frame included any DSDM site which had been in operation for more than 6 months by January 2017. Sites that were considered outliers in terms of size (number of clients) or access (extreme locations that were physically difficult to reach) were excluded from the sampling frame. In January 2017, Uganda had 605 sites at 297 facilities which met these criteria. Based on budget and feasibility, we included 47 DSDM sites in our initial sample. Sites were selected so that models were represented relatively equally within the sample, and the following factors were also considered: variation in client volume, geographic location, and implementing partners in charge of the DSDMs. From these 47 sites, implementers’ fixed costs (for both public and non-public providers) were collected, and were allocated to the models and their clients using a top-down costing approach. For the collection of direct patient costs (from the provider perspective) and client treatment outcomes, a subset of 20 DSDM sites were purposively selected from the initial 47 DSDM sites, and included four of each of the five types of DSDMs. The inclusion criteria for the clients selected from these 20 sites were: • Adults (18 years and above) on ART. • Registered on one of the DSDMs by the 1st January 2017. This criterion ensured that all study
participants had been enrolled in their model of care for at least 12 months at the time of the first data collection.
• For the FBG sites, only pregnant and lactating women (PLW) groups were selected. Adolescents were excluded from the selection due to the additional ethical requirements.
• Clients with a record of formal transfer out of the selected health facility before the 12-month study endpoint were excluded.
At each of the 20 sites in the subset, clients who met the study eligibility criteria were selected consecutively from DSDM registers, which record clients who present for a DSDM event. An event is defined as an activity undertaken by the members of the DSDM, such as pre-ART collection clinical assessments, ART collection meetings, counselling or adherence group sessions, and viral load testing meetings – all occurring in community. Study participants were selected from DSDM registers starting in January 2017 and then from registers sequentially earlier in time (December 2016, November 2016, and so on) until the sample size of 33 clients was reached for each of the 20 sites. Participants in four of the five models (FBIM, FDR, CCLAD, and CDDP) were followed longitudinally for 24 months starting on January 1, 2017. This follow-up period was broken into two periods: 0-12 months after study enrolment and 13-24 months after study enrolment, with data accessed retrospectively at the end of each period. However, the FBG participants, who were all pregnant or lactating women, remained in their model only for the duration of their pregnancy and postnatal period, with many having left by the second data collection point. Therefore, a new sample of FBG clients had to be selected for the second study period, January to December 2018 (referred to as FBG2).
2.2. Measuring treatment outcomes The sampled DSDM clients’ treatment outcomes at 12 and 24 months were obtained from their medical records. We first report overall rates of retention in care and viral suppression, then for the cost analysis, we defined four mutually exclusive outcomes as follows:
FBIM, facility-based individual management; FBG, facility-based groups; FDR, fast-track drug refills; CCLAD, community client-led ART delivery; CDDP, community drug distribution points
3
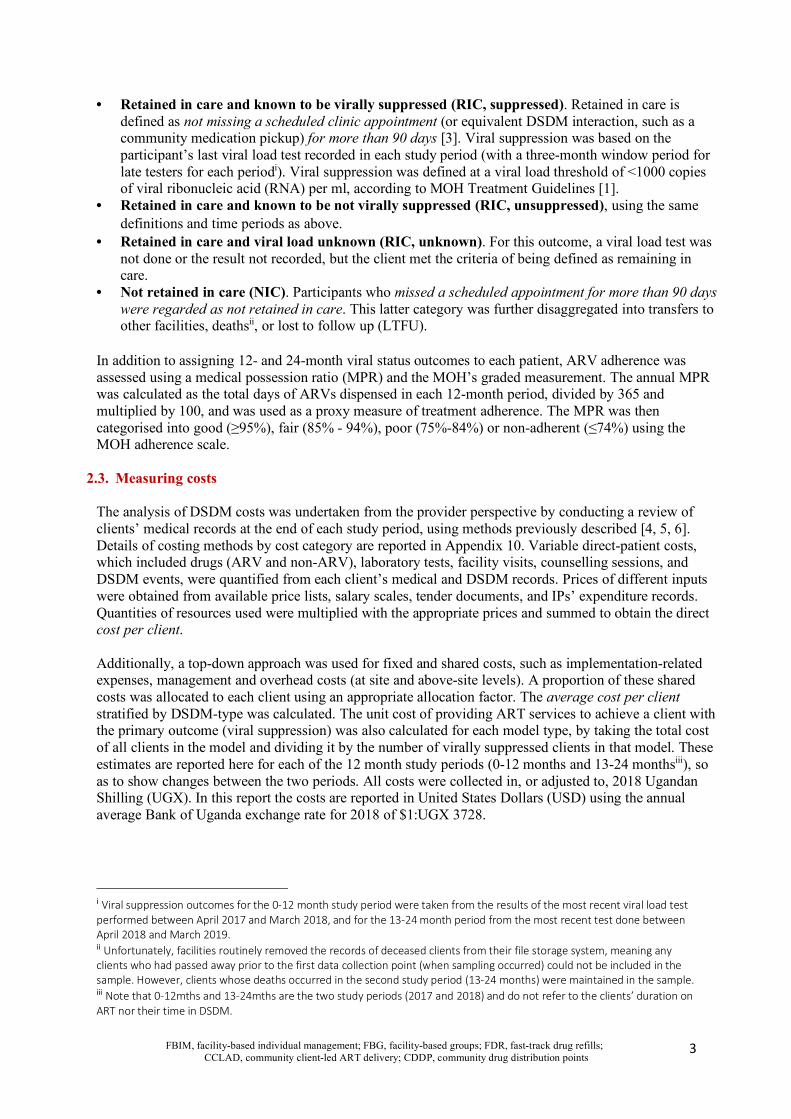
• Retained in care and known to be virally suppressed (RIC, suppressed). Retained in care is
defined as not missing a scheduled clinic appointment (or equivalent DSDM interaction, such as a community medication pickup) for more than 90 days [3]. Viral suppression was based on the participant’s last viral load test recorded in each study period (with a three-month window period for late testers for each periodi). Viral suppression was defined at a viral load threshold of <1000 copies of viral ribonucleic acid (RNA) per ml, according to MOH Treatment Guidelines [1].
• Retained in care and known to be not virally suppressed (RIC, unsuppressed), using the same definitions and time periods as above.
• Retained in care and viral load unknown (RIC, unknown). For this outcome, a viral load test was not done or the result not recorded, but the client met the criteria of being defined as remaining in care.
• Not retained in care (NIC). Participants who missed a scheduled appointment for more than 90 days were regarded as not retained in care. This latter category was further disaggregated into transfers to other facilities, deathsii, or lost to follow up (LTFU).
In addition to assigning 12- and 24-month viral status outcomes to each patient, ARV adherence was assessed using a medical possession ratio (MPR) and the MOH’s graded measurement. The annual MPR was calculated as the total days of ARVs dispensed in each 12-month period, divided by 365 and multiplied by 100, and was used as a proxy measure of treatment adherence. The MPR was then categorised into good (≥95%), fair (85% - 94%), poor (75%-84%) or non-adherent (≤74%) using the MOH adherence scale.
2.3. Measuring costs The analysis of DSDM costs was undertaken from the provider perspective by conducting a review of clients’ medical records at the end of each study period, using methods previously described [4, 5, 6]. Details of costing methods by cost category are reported in Appendix 10. Variable direct-patient costs, which included drugs (ARV and non-ARV), laboratory tests, facility visits, counselling sessions, and DSDM events, were quantified from each client’s medical and DSDM records. Prices of different inputs were obtained from available price lists, salary scales, tender documents, and IPs’ expenditure records. Quantities of resources used were multiplied with the appropriate prices and summed to obtain the direct cost per client. Additionally, a top-down approach was used for fixed and shared costs, such as implementation-related expenses, management and overhead costs (at site and above-site levels). A proportion of these shared costs was allocated to each client using an appropriate allocation factor. The average cost per client stratified by DSDM-type was calculated. The unit cost of providing ART services to achieve a client with the primary outcome (viral suppression) was also calculated for each model type, by taking the total cost of all clients in the model and dividing it by the number of virally suppressed clients in that model. These estimates are reported here for each of the 12 month study periods (0-12 months and 13-24 monthsiii), so as to show changes between the two periods. All costs were collected in, or adjusted to, 2018 Ugandan Shilling (UGX). In this report the costs are reported in United States Dollars (USD) using the annual average Bank of Uganda exchange rate for 2018 of $1:UGX 3728.
i Viral suppression outcomes for the 0-12 month study period were taken from the results of the most recent viral load test performed between April 2017 and March 2018, and for the 13-24 month period from the most recent test done between April 2018 and March 2019. ii Unfortunately, facilities routinely removed the records of deceased clients from their file storage system, meaning any clients who had passed away prior to the first data collection point (when sampling occurred) could not be included in the sample. However, clients whose deaths occurred in the second study period (13-24 months) were maintained in the sample. iii Note that 0-12mths and 13-24mths are the two study periods (2017 and 2018) and do not refer to the clients’ duration on ART nor their time in DSDM.
FBIM, facility-based individual management; FBG, facility-based groups; FDR, fast-track drug refills; CCLAD, community client-led ART delivery; CDDP, community drug distribution points
4
3. RESULTS
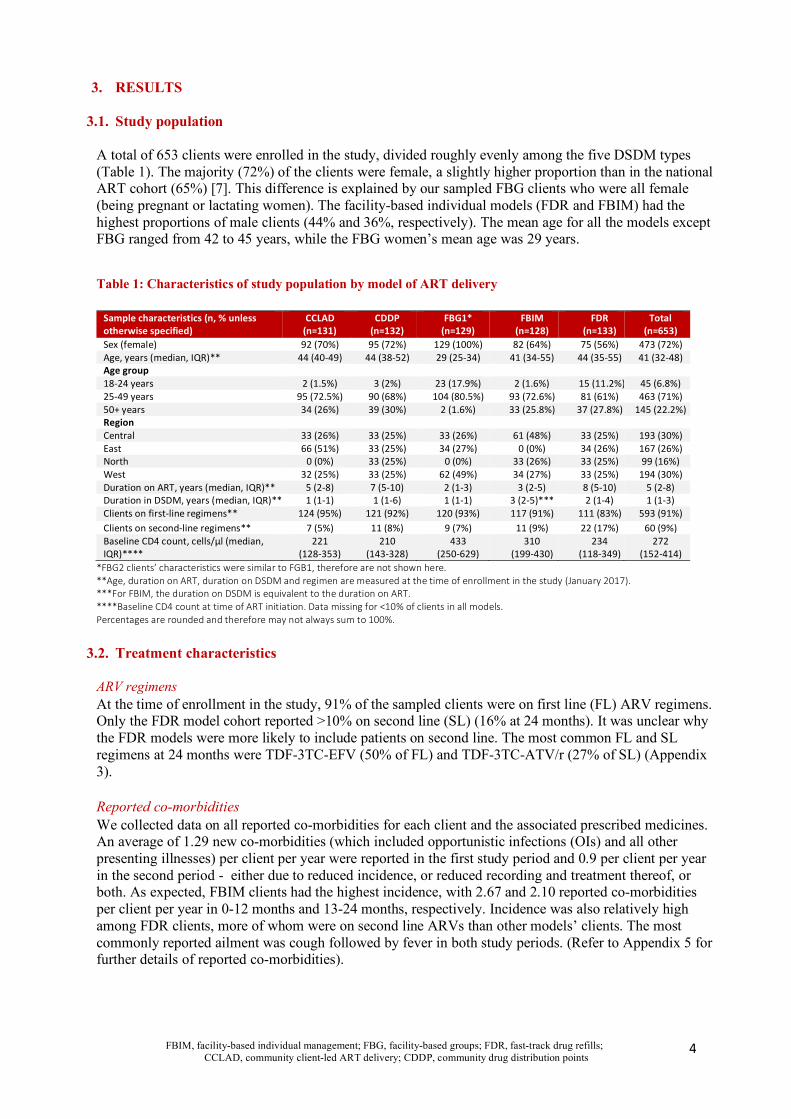
3.1. Study population A total of 653 clients were enrolled in the study, divided roughly evenly among the five DSDM types (Table 1). The majority (72%) of the clients were female, a slightly higher proportion than in the national ART cohort (65%) [7]. This difference is explained by our sampled FBG clients who were all female (being pregnant or lactating women). The facility-based individual models (FDR and FBIM) had the highest proportions of male clients (44% and 36%, respectively). The mean age for all the models except FBG ranged from 42 to 45 years, while the FBG women’s mean age was 29 years.
Table 1: Characteristics of study population by model of ART delivery
Sample characteristics (n, % unless otherwise specified)
CCLAD (n=131)
CDDP (n=132)
FBG1* (n=129)
FBIM (n=128)
FDR (n=133)
Total (n=653)
Sex (female) 92 (70%) 95 (72%) 129 (100%) 82 (64%) 75 (56%) 473 (72%) Age, years (median, IQR)** 44 (40-49) 44 (38-52) 29 (25-34) 41 (34-55) 44 (35-55) 41 (32-48) Age group 18-24 years 2 (1.5%) 3 (2%) 23 (17.9%) 2 (1.6%) 15 (11.2%) 45 (6.8%) 25-49 years 95 (72.5%) 90 (68%) 104 (80.5%) 93 (72.6%) 81 (61%) 463 (71%) 50+ years 34 (26%) 39 (30%) 2 (1.6%) 33 (25.8%) 37 (27.8%) 145 (22.2%) Region
Central 33 (26%) 33 (25%) 33 (26%) 61 (48%) 33 (25%) 193 (30%) East 66 (51%) 33 (25%) 34 (27%) 0 (0%) 34 (26%) 167 (26%) North 0 (0%) 33 (25%) 0 (0%) 33 (26%) 33 (25%) 99 (16%) West 32 (25%) 33 (25%) 62 (49%) 34 (27%) 33 (25%) 194 (30%) Duration on ART, years (median, IQR)** 5 (2-8) 7 (5-10) 2 (1-3) 3 (2-5) 8 (5-10) 5 (2-8) Duration in DSDM, years (median, IQR)** 1 (1-1) 1 (1-6) 1 (1-1) 3 (2-5)*** 2 (1-4) 1 (1-3) Clients on first-line regimens** 124 (95%) 121 (92%) 120 (93%) 117 (91%) 111 (83%) 593 (91%) Clients on second-line regimens** 7 (5%) 11 (8%) 9 (7%) 11 (9%) 22 (17%) 60 (9%) Baseline CD4 count, cells/µl (median, IQR)****
221 (128-353)
210 (143-328)
433 (250-629)
310 (199-430)
234 (118-349)
272 (152-414)
*FBG2 clients’ characteristics were similar to FGB1, therefore are not shown here. **Age, duration on ART, duration on DSDM and regimen are measured at the time of enrollment in the study (January 2017). ***For FBIM, the duration on DSDM is equivalent to the duration on ART. ****Baseline CD4 count at time of ART initiation. Data missing for <10% of clients in all models. Percentages are rounded and therefore may not always sum to 100%.
3.2. Treatment characteristics
ARV regimens At the time of enrollment in the study, 91% of the sampled clients were on first line (FL) ARV regimens. Only the FDR model cohort reported >10% on second line (SL) (16% at 24 months). It was unclear why the FDR models were more likely to include patients on second line. The most common FL and SL regimens at 24 months were TDF-3TC-EFV (50% of FL) and TDF-3TC-ATV/r (27% of SL) (Appendix 3). Reported co-morbidities We collected data on all reported co-morbidities for each client and the associated prescribed medicines. An average of 1.29 new co-morbidities (which included opportunistic infections (OIs) and all other presenting illnesses) per client per year were reported in the first study period and 0.9 per client per year in the second period - either due to reduced incidence, or reduced recording and treatment thereof, or both. As expected, FBIM clients had the highest incidence, with 2.67 and 2.10 reported co-morbidities per client per year in 0-12 months and 13-24 months, respectively. Incidence was also relatively high among FDR clients, more of whom were on second line ARVs than other models’ clients. The most commonly reported ailment was cough followed by fever in both study periods. (Refer to Appendix 5 for further details of reported co-morbidities).

FBIM, facility-based individual management; FBG, facility-based groups; FDR, fast-track drug refills; CCLAD, community client-led ART delivery; CDDP, community drug distribution points
5
Tuberculosis screening Although TB screening was supposed to be conducted at every ARV refill visit, we found that clients’ TB symptom status was poorly recorded on their ART care cards. It was not reported at all for 46% of all refill visits in 0-12 months study period and 59% of all refill visits in 13-24 months, with more missing in the community-based models than in the facility-based models. Where the status was reported, there was an average of one TB assessment performed per client from which there was only one positive TB diagnosis (an FBIM client) in the first 0-12 months, but which dropped to 0.12 TB assessments per client and no positive diagnoses in the 13-24 month period (Appendix 6).
3.3. Treatment outcomes Overall retention in care and viral suppression rates were high for all the models (Figure 1, Appendix 2). For the sample as a whole, retention in care was 97% and 98% at 0-12 and 13-24 months, respectively; and viral suppression was 91% of all clients for both periods, with a high rate of viral load testing being performed. Out of all the models, the FBIM sample had the lowest proportion of virally suppressed clients (86% 0-12 months; 88% 13-24 months). Known non-suppressed results accounted for 9.4% and 7.8% of FBIM clients, respectively, in the two study periods. FBIM was the only model to report a death in the second study period. Overall, the reported LTFU was low (3% and 2% in each period), while higher “LTFU” in the FBG may have been due to PLW not returning to the group at the end of their lactation period. Figure 1: Viral suppression rates among DSDM clients, by model and study period
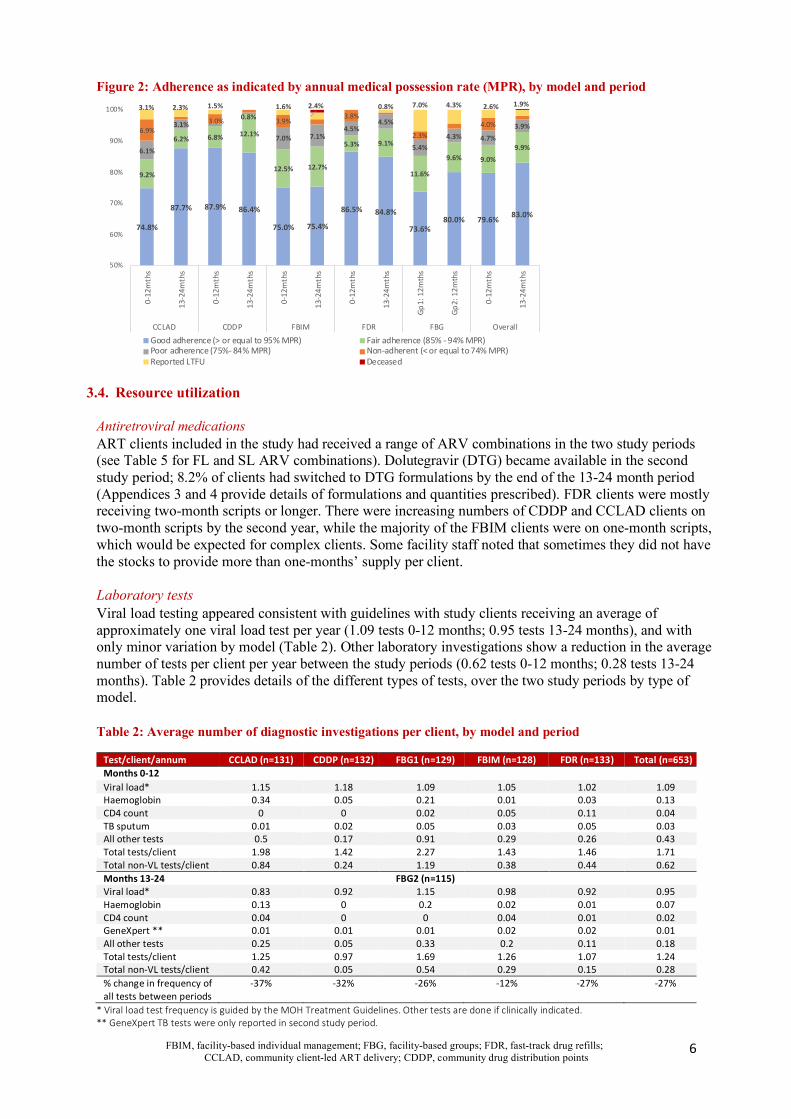
Note that the y-axis does not start at zero. RIC: retained in care. NIC: not retained in care. As illustrated in Figure 2, the majority of clients in both study periods (80% and 83%, respectively) were classified as having “good” adherence, using their medical possession ratio and the MOH grading. The FBIM model had the lowest proportion of clients with “good” adherence (75% in both study periods), reflecting again that complex or unstable clients remain in, or are returned to, facility-based individual management.
92%90% 92% 92%
84%87% 89% 89%
85%
91%89% 90%
3%
2%2% 2%
9%7% 3% 2%
5%
3%4% 3%
2%6%
5%5%
5% 2% 8% 8%
2%
1% 4% 5%
3% 2% 2% 2%2%
1%
8%4% 3% 2%
1% 0.2%
75%
80%
85%
90%
95%
100%
0-12
mth
s
13-2
4mth
s
0-12
mth
s
13-2
4mth
s
0-12
mth
s
13-2
4mth
s
0-12
mth
s
13-2
4mth
s
Gp1:
12m
ths
Gp2:
12m
ths
0-12
mth
s
13-2
4mth
s
CCLAD CDDP FBIM FDR FBG Overall
RIC suppressed RIC not suppressed RIC VL not recorded NIC LTFU NIC deceased
FBIM, facility-based individual management; FBG, facility-based groups; FDR, fast-track drug refills; CCLAD, community client-led ART delivery; CDDP, community drug distribution points
6
Figure 2: Adherence as indicated by annual medical possession rate (MPR), by model and period
3.4. Resource utilization Antiretroviral medications ART clients included in the study had received a range of ARV combinations in the two study periods (see Table 5 for FL and SL ARV combinations). Dolutegravir (DTG) became available in the second study period; 8.2% of clients had switched to DTG formulations by the end of the 13-24 month period (Appendices 3 and 4 provide details of formulations and quantities prescribed). FDR clients were mostly receiving two-month scripts or longer. There were increasing numbers of CDDP and CCLAD clients on two-month scripts by the second year, while the majority of the FBIM clients were on one-month scripts, which would be expected for complex clients. Some facility staff noted that sometimes they did not have the stocks to provide more than one-months’ supply per client. Laboratory tests Viral load testing appeared consistent with guidelines with study clients receiving an average of approximately one viral load test per year (1.09 tests 0-12 months; 0.95 tests 13-24 months), and with only minor variation by model (Table 2). Other laboratory investigations show a reduction in the average number of tests per client per year between the study periods (0.62 tests 0-12 months; 0.28 tests 13-24 months). Table 2 provides details of the different types of tests, over the two study periods by type of model. Table 2: Average number of diagnostic investigations per client, by model and period
Test/client/annum CCLAD (n=131) CDDP (n=132) FBG1 (n=129) FBIM (n=128) FDR (n=133) Total (n=653) Months 0-12 Viral load* 1.15 1.18 1.09 1.05 1.02 1.09 Haemoglobin 0.34 0.05 0.21 0.01 0.03 0.13 CD4 count 0 0 0.02 0.05 0.11 0.04 TB sputum 0.01 0.02 0.05 0.03 0.05 0.03 All other tests 0.5 0.17 0.91 0.29 0.26 0.43 Total tests/client 1.98 1.42 2.27 1.43 1.46 1.71 Total non-VL tests/client 0.84 0.24 1.19 0.38 0.44 0.62 Months 13-24
FBG2 (n=115)
Viral load* 0.83 0.92 1.15 0.98 0.92 0.95 Haemoglobin 0.13 0 0.2 0.02 0.01 0.07 CD4 count 0.04 0 0 0.04 0.01 0.02 GeneXpert ** 0.01 0.01 0.01 0.02 0.02 0.01 All other tests 0.25 0.05 0.33 0.2 0.11 0.18 Total tests/client 1.25 0.97 1.69 1.26 1.07 1.24 Total non-VL tests/client 0.42 0.05 0.54 0.29 0.15 0.28 % change in frequency of all tests between periods
-37% -32% -26% -12% -27% -27%
* Viral load test frequency is guided by the MOH Treatment Guidelines. Other tests are done if clinically indicated. ** GeneXpert TB tests were only reported in second study period.
74.8%
87.7% 87.9% 86.4%
75.0% 75.4%
86.5% 84.8%
73.6%80.0% 79.6% 83.0%
9.2%
6.2% 6.8% 12.1%
12.5% 12.7%
5.3% 9.1%
11.6%
9.6% 9.0%9.9%6.1%
3.1%0.8%
7.0% 7.1%4.5%
4.5%
5.4%4.3% 4.7%
3.9%6.9%3.0% 3.9%
3.8%
2.3%
4.0%
3.1% 2.3% 1.5% 1.6% 2.4% 0.8% 7.0% 4.3% 2.6% 1.9%
50%
60%
70%
80%
90%
100%
0-12
mth
s
13-2
4mth
s
0-12
mth
s
13-2
4mth
s
0-12
mth
s
13-2
4mth
s
0-12
mth
s
13-2
4mth
s
Gp
1: 1
2mth
s
Gp
2: 1
2mth
s
0-12
mth
s
13-2
4mth
s
CCLAD CDDP FBIM FDR FBG Overall
Good adherence (> or equal to 95% MPR) Fair adherence (85% - 94% MPR)Poor adherence (75%- 84% MPR) Non-adherent (< or equal to 74% MPR)Reported LTFU Deceased

FBIM, facility-based individual management; FBG, facility-based groups; FDR, fast-track drug refills; CCLAD, community client-led ART delivery; CDDP, community drug distribution points
7
Facility visits and DSDM events Clients visited healthcare facilities during the study period either for a scheduled (routine) appointment to collect their ARVs (individual collection, group collection, or fast-track drug refill) or for unscheduled visits for HIV-related illnesses, OIs, or other comorbidities. During their visits, the services they could have received were: ARV dispensing, comprehensive clinical assessments, TB assessments, laboratory investigations, and different types of counselling sessions, which lasted for different lengths of time (Appendix 7). In addition to facility visits, we collected data on specific DSDM events for the three models that offered them (CCLAD, CDDP, FBG). These interactions included community-based clinical/TB assessments, group viral load sessions, community-based ARV collections with their pre-meeting clinical assessments, and adherence support meetings (Appendix 8). DSDM event registers were poorly maintained, making it difficult to accurately capture the frequency of the clients’ participation in them. The available data indicated a reduction of almost half (48%) in the total recorded DSDM events between the two study periods, which was not evenly spread across the models. Observed reductions in the frequency of DSDM events may reflect actual changes in the frequency of, or participation, in these events, or deterioration in record keeping, or both. The frequency of all facility visits and DSDM events per client remaining in care (RIC) are shown in Table 3, and details of services received at facility and the DSDM events are in Appendices 7 and 8. Table 3: Average number of facility visits and DSDM events per client retained in care (RIC)
Facility visit and non-facility events CCLAD CDDP FBG1 FBIM FDR Overall Months 0-12 (RIC=127) (RIC=130) (RIC=120) (RIC=126) (RIC=133) (RIC=636) Facility visits (per RIC client)* 6.64 7.02 8.14 7.87 6.12 7.13 DSDM events (per RIC client)** 3.72 4.22 6.58*** 0.00 0.00 2.85 Total interactions (per RIC client) 10.36 11.24 14.72 7.87 6.12 9.98 Months 13-24 (RIC=127) (RIC=132) (RIC=110) (RIC=122) (RIC=131) (RIC=622) Facility visits (per RIC client)* 6.06 6.07 9.46 7.89 5.86 6.98 DSDM events (per RIC client)** 2.05 1.92 6.95*** 0.00 0.00 2.05 Total interactions (per RIC client) 8.11 7.99 16.41 7.89 5.86 9.03
* Facility visits could be either scheduled ARV collections or unscheduled visits for other needs. Included ARV collections for all DSDM clients, even if collected by a community/group member on behalf of the client. **DSDM events count excluded the ARV pickups from facilities which were counted as facility visits. ***FBG support groups could occur in community or at facilities, but are all labelled here as DSDM events.
Actual implementation of the DSDM models differed slightly from MOH guidelines [1] in numbers of facility ART visits, DSDM interactions, and frequency of viral load tests (Table 4). These differences diminished over the two-year study period, as greater standardisation occurred in DSDM service provision. However, there did not appear to be a substantial reduction in the number of ARV refill visits due to multi-month scripting. Table 4: Ugandan DSDM guideline compared to observed amongst clients retained in care (as at end of second study period)
Total Visits / Events (13-24 mths) CCLAD (n=130) CDDP (n=132) FBG (n=115) FBIM (n=126) FDR (n=132) Retained in care (RIC), n (%) 127 (97.7%) 132 (100%) 110 (95.7%) 122 (96.8%) 131 (99.2%) Mean, n (per RIC client/annum) GDLN OBS GDLN OBS GDLN OBS GDLN OBS GDLN OBS Number of ART facility visits 2 6 2 6 2-6 9 12 8 2 6 Number of non-facility DSDM events 2 2 4 1.9 4-12* 7 0 0 2 0 Viral load tests 1 0.8 1 0.9 1 1.2 1-2** 1 1 0.9
* FBG frequency depends on client’s complexity / adherence. ** Number of VL tests for FBIM clients’ depend on their complexity, adverse effects and adherence.
3.5. Unit costs
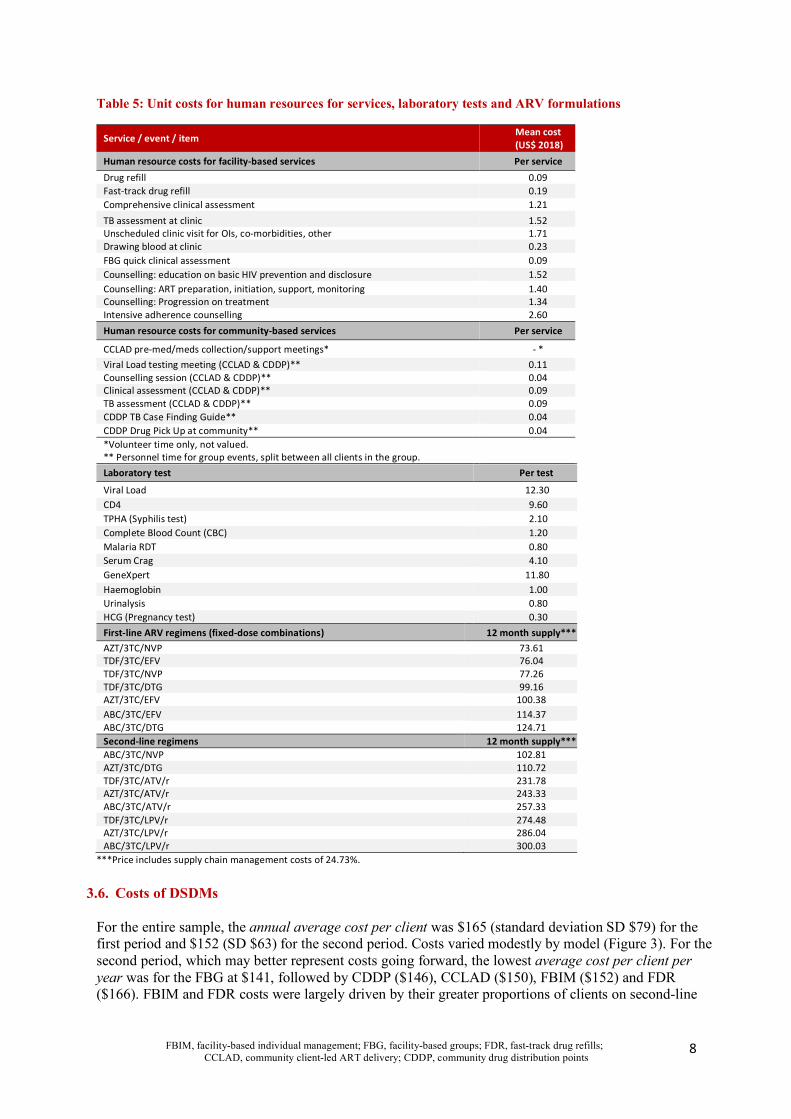
The unit costs of the resources utilized by the DSDM clients are presented in Table 5 below, indicating the human resource costs for the different types of services provided at facility visits and at community-based DSDM events, the unit price for laboratory tests, and the annual cost of ARV formulations per client. All costs are presented in USD 2018 prices.
FBIM, facility-based individual management; FBG, facility-based groups; FDR, fast-track drug refills; CCLAD, community client-led ART delivery; CDDP, community drug distribution points
8
Table 5: Unit costs for human resources for services, laboratory tests and ARV formulations
Service / event / item Mean cost (US$ 2018)
Human resource costs for facility-based services Per service Drug refill 0.09 Fast-track drug refill 0.19 Comprehensive clinical assessment 1.21 TB assessment at clinic 1.52 Unscheduled clinic visit for OIs, co-morbidities, other 1.71 Drawing blood at clinic 0.23 FBG quick clinical assessment 0.09 Counselling: education on basic HIV prevention and disclosure 1.52 Counselling: ART preparation, initiation, support, monitoring 1.40 Counselling: Progression on treatment 1.34 Intensive adherence counselling 2.60 Human resource costs for community-based services Per service
CCLAD pre-med/meds collection/support meetings* - * Viral Load testing meeting (CCLAD & CDDP)** 0.11 Counselling session (CCLAD & CDDP)** 0.04 Clinical assessment (CCLAD & CDDP)** 0.09 TB assessment (CCLAD & CDDP)** 0.09 CDDP TB Case Finding Guide** 0.04 CDDP Drug Pick Up at community** 0.04 *Volunteer time only, not valued. ** Personnel time for group events, split between all clients in the group.
Laboratory test Per test
Viral Load 12.30 CD4 9.60 TPHA (Syphilis test) 2.10 Complete Blood Count (CBC) 1.20 Malaria RDT 0.80 Serum Crag 4.10 GeneXpert 11.80 Haemoglobin 1.00 Urinalysis 0.80 HCG (Pregnancy test) 0.30 First-line ARV regimens (fixed-dose combinations) 12 month supply*** AZT/3TC/NVP 73.61 TDF/3TC/EFV 76.04 TDF/3TC/NVP 77.26 TDF/3TC/DTG 99.16 AZT/3TC/EFV 100.38 ABC/3TC/EFV 114.37 ABC/3TC/DTG 124.71 Second-line regimens 12 month supply*** ABC/3TC/NVP 102.81 AZT/3TC/DTG 110.72 TDF/3TC/ATV/r 231.78 AZT/3TC/ATV/r 243.33 ABC/3TC/ATV/r 257.33 TDF/3TC/LPV/r 274.48 AZT/3TC/LPV/r 286.04 ABC/3TC/LPV/r 300.03
***Price includes supply chain management costs of 24.73%.
3.6. Costs of DSDMs For the entire sample, the annual average cost per client was $165 (standard deviation SD $79) for the first period and $152 (SD $63) for the second period. Costs varied modestly by model (Figure 3). For the second period, which may better represent costs going forward, the lowest average cost per client per year was for the FBG at $141, followed by CDDP ($146), CCLAD ($150), FBIM ($152) and FDR ($166). FBIM and FDR costs were largely driven by their greater proportions of clients on second-line
FBIM, facility-based individual management; FBG, facility-based groups; FDR, fast-track drug refills; CCLAD, community client-led ART delivery; CDDP, community drug distribution points
9
regimens (9% and 17% respectively). These findings imply minimal cost differences, if any, between the community-based DSDMs and the standard of care, the FBIM model. Table 6: Annual average cost per client by model (13-24 months, US$ 2018)
Cost* per client (US$) (13-24 mths)
CCLAD (n=130) CDDP (n=132) FBG (n=115) FBIM (n=126) FDR (n=132) Overall (n=635)
Mean cost per client 150.07 146.42 141.29 152.49 166.48 151.61 Median cost per client 131.90 130.43 138.12 133.03 133.68 133.32 Minimum cost per client 41.46 81.19 45.09 27.98 93.55 27.98 Maximum cost per client 420.55 384.54 412.22 414.39 422.74 422.74 IQR (123-152) (122-139) (126-149) (123-150) (120-159) (123-149) Std. Deviation 54.94 59.52 33.70 72.04 82.51 63.65
* The results show total costs for all resources per client per year (incl. ARVs, lab, and others).
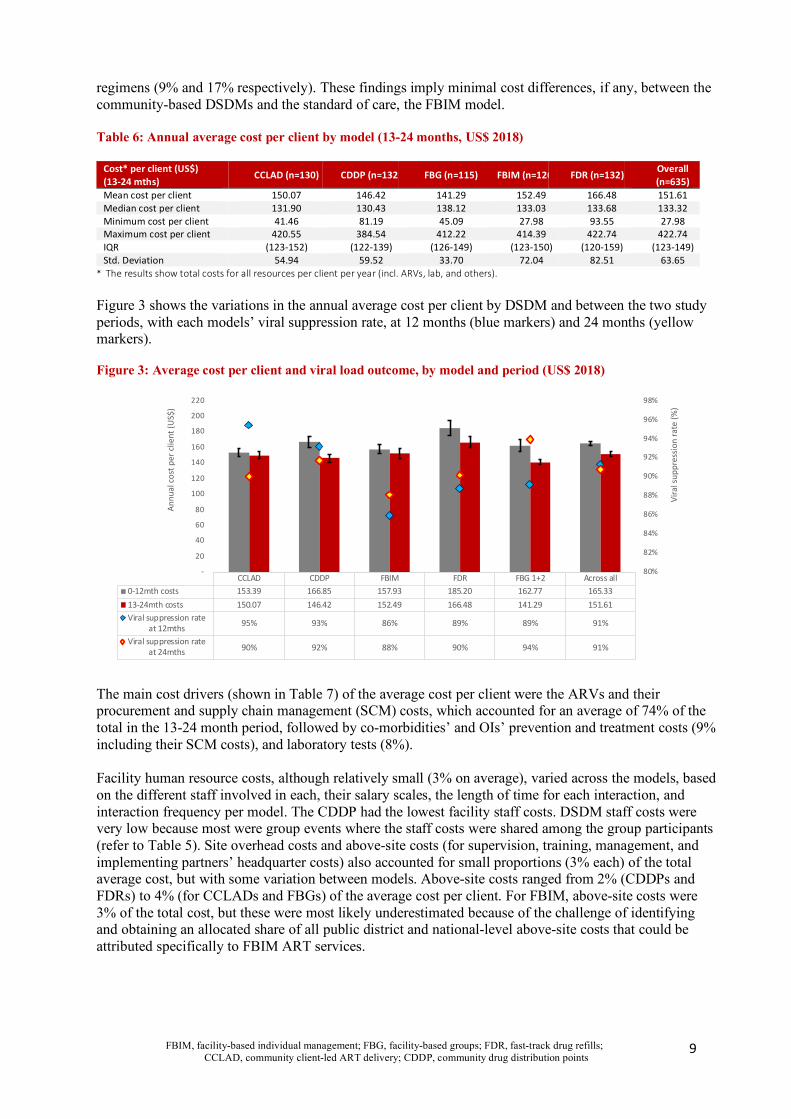
Figure 3 shows the variations in the annual average cost per client by DSDM and between the two study periods, with each models’ viral suppression rate, at 12 months (blue markers) and 24 months (yellow markers). Figure 3: Average cost per client and viral load outcome, by model and period (US$ 2018)
The main cost drivers (shown in Table 7) of the average cost per client were the ARVs and their procurement and supply chain management (SCM) costs, which accounted for an average of 74% of the total in the 13-24 month period, followed by co-morbidities’ and OIs’ prevention and treatment costs (9% including their SCM costs), and laboratory tests (8%). Facility human resource costs, although relatively small (3% on average), varied across the models, based on the different staff involved in each, their salary scales, the length of time for each interaction, and interaction frequency per model. The CDDP had the lowest facility staff costs. DSDM staff costs were very low because most were group events where the staff costs were shared among the group participants (refer to Table 5). Site overhead costs and above-site costs (for supervision, training, management, and implementing partners’ headquarter costs) also accounted for small proportions (3% each) of the total average cost, but with some variation between models. Above-site costs ranged from 2% (CDDPs and FDRs) to 4% (for CCLADs and FBGs) of the average cost per client. For FBIM, above-site costs were 3% of the total cost, but these were most likely underestimated because of the challenge of identifying and obtaining an allocated share of all public district and national-level above-site costs that could be attributed specifically to FBIM ART services.
CCLAD CDDP FBIM FDR FBG 1+2 Across all
0-12mth costs 153.39 166.85 157.93 185.20 162.77 165.33
13-24mth costs 150.07 146.42 152.49 166.48 141.29 151.61
Viral suppression rateat 12mths
95% 93% 86% 89% 89% 91%
Viral suppression rateat 24mths 90% 92% 88% 90% 94% 91%
80%
82%
84%
86%
88%
90%
92%
94%
96%
98%
-
20
40
60
80
100
120
140
160
180
200
220
Vir
al s
uppr
essi
on r
ate
(%)
Ann
ual c
ost
per
clie
nt (U
S$)
FBIM, facility-based individual management; FBG, facility-based groups; FDR, fast-track drug refills; CCLAD, community client-led ART delivery; CDDP, community drug distribution points
10
Table 7: Annual average cost per client by cost component, by model and period (US$ 2018)
Mean cost per client per annum (US$)
CCLAD CDDP FBG FBIM FDR Overall 0-12m 13-24m 0-12m 13-24m Gp1 Gp2 0-12m 13-24m 0-12m 13-24m 0-12m 13-24m
(n=131) (n=130) (n=132) (n=132) (n=129) (n=115) (n=128) (n=126) (n=133) (n=132) (n=653) (n=635) Cost items, mean $/client/ annum ARVs (incl. SCM* costs) 104.48 103.20 116.89 112.76 104.75 96.88 108.31 115.33 136.83 133.96 114.38 112.84 Non-ARV meds (inc.SCM costs) 16.71 20.10 22.17 10.12 22.07 13.13 20.17 9.99 23.44 11.10 20.92 12.89 Laboratory tests 14.99 11.21 14.96 11.40 14.75 14.85 14.10 13.04 13.84 11.75 14.52 12.38 Facility visits (HR costs**) 4.09 2.55 2.02 1.47 11.26 6.90 6.27 5.00 6.22 4.77 5.95 4.06 DSDM events (HR costs) 0.29 0.17 0.31 0.17 0.16 0.06 - - - - 0.15 0.08 Site-level costs: transport, overheads
7.40 7.40 7.86 7.86 4.51 4.22 4.50 4.50 2.10 2.10 5.27 5.24
Above-site costs: supervision, training, materials, mgmt
5.44 5.44 2.65 2.65 5.28 5.24 4.58 4.62 2.77 2.79 4.13 4.11
DSDM mean cost ($) per client per annum, (SD)
153.39 150.07 166.85 146.42 162.77 141.29 157.93 152.49 185.20 166.48 165.33 151.61 (57.78) (54.94) (82.34) (59.52) (79.53) (33.7) (62.51) (72.04) (104.47) (82.51) (79.76) (63.65)
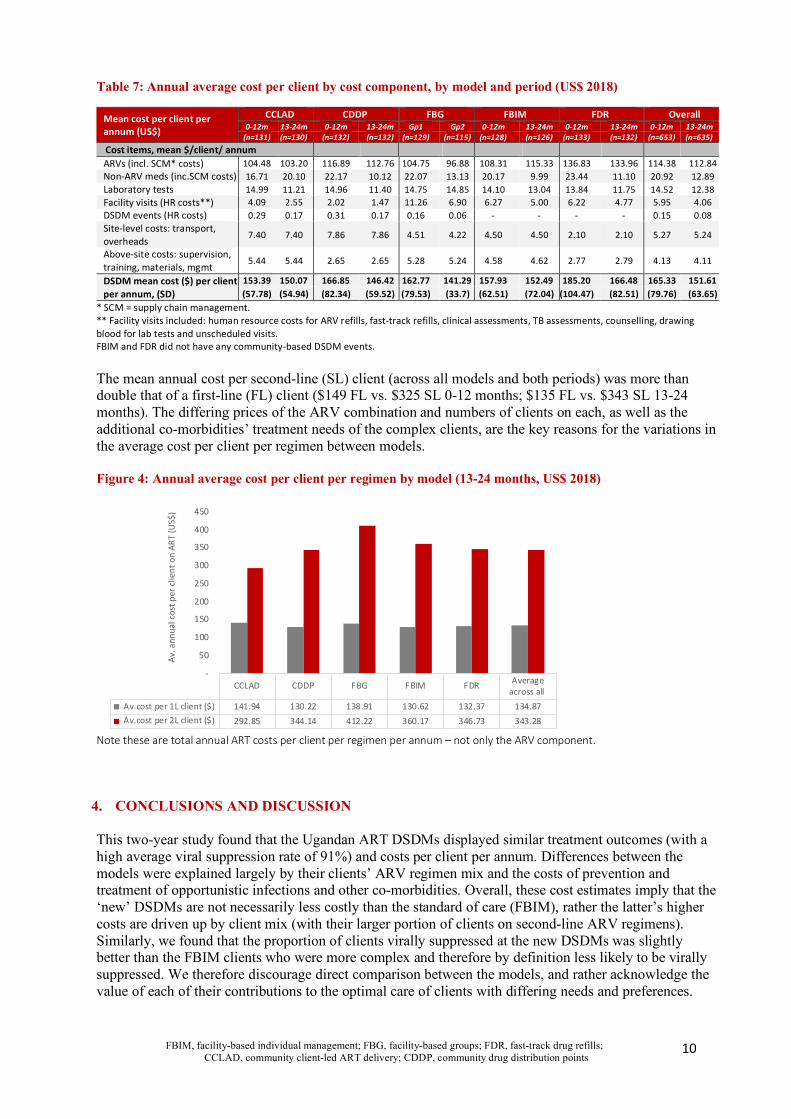
* SCM = supply chain management. ** Facility visits included: human resource costs for ARV refills, fast-track refills, clinical assessments, TB assessments, counselling, drawing blood for lab tests and unscheduled visits. FBIM and FDR did not have any community-based DSDM events. The mean annual cost per second-line (SL) client (across all models and both periods) was more than double that of a first-line (FL) client ($149 FL vs. $325 SL 0-12 months; $135 FL vs. $343 SL 13-24 months). The differing prices of the ARV combination and numbers of clients on each, as well as the additional co-morbidities’ treatment needs of the complex clients, are the key reasons for the variations in the average cost per client per regimen between models. Figure 4: Annual average cost per client per regimen by model (13-24 months, US$ 2018)
Note these are total annual ART costs per client per regimen per annum – not only the ARV component.
4. CONCLUSIONS AND DISCUSSION This two-year study found that the Ugandan ART DSDMs displayed similar treatment outcomes (with a high average viral suppression rate of 91%) and costs per client per annum. Differences between the models were explained largely by their clients’ ARV regimen mix and the costs of prevention and treatment of opportunistic infections and other co-morbidities. Overall, these cost estimates imply that the ‘new’ DSDMs are not necessarily less costly than the standard of care (FBIM), rather the latter’s higher costs are driven up by client mix (with their larger portion of clients on second-line ARV regimens). Similarly, we found that the proportion of clients virally suppressed at the new DSDMs was slightly better than the FBIM clients who were more complex and therefore by definition less likely to be virally suppressed. We therefore discourage direct comparison between the models, and rather acknowledge the value of each of their contributions to the optimal care of clients with differing needs and preferences.
CCLAD CDDP FBG FBIM FDR Average
across all
Av.cost per 1L client ($) 141.94 130.22 138.91 130.62 132.37 134.87
Av.cost per 2L client ($) 292.85 344.14 412.22 360.17 346.73 343.28
-
50
100
150
200
250
300
350
400
450
Av.
an
nu
al c
ost
pe
r cl
ien
t o
n A
RT
(U
S$
)
FBIM, facility-based individual management; FBG, facility-based groups; FDR, fast-track drug refills; CCLAD, community client-led ART delivery; CDDP, community drug distribution points
11
Although alignment with the MOH Guidelines in the implementation of DSDMs improved in the second study period, the number of facility visits (for ARV collections) remainder higher than expected. Relatedly, facilitating both multi-month scripts and dispensing per visit would reduce interactions with the healthcare system and their related human resource costs, while also reducing clients’ costs (in both transport and opportunity costs of lost time). Although the potential cost savings to clients were not quantified in this study, they could be important benefits of DSDMs for clients which might lead to improved treatment adherence and outcomes. Importantly, as shown, the reducing frequency of the DSDM community-based events, and their generally poor record-keeping, highlighted the need for improved DSDM registers, maintaining community DSDM events such as support/ adherence meetings and counselling sessions, and ensuring that all clients receive their annual viral load test and recorded results. These will all be essential to monitor and ensure treatment success. DSDMs for ART delivery in Uganda can therefore be an effective strategy for managing clients and appear to achieve good treatment outcomes, retention and adherence, but large reductions in their costs should not be expected, and cuts in their programme budgets might affect their longer-term performance outcomes. FUNDING This work was supported by the United States Agency for International Development (USAID) under Cooperative Agreement AID-OAA-A-15-00070 for the EQUIP Project. The funders had no role in the study design, data collection and analysis, decision to publish or preparation of the manuscript. The authors’ views expressed in this publication do not necessarily reflect the views of the United States Agency for International Development, the United States Government.
CITATION AND ACKNOWLEDGEMENTS: Guthrie T, Muheki C, Greener R, Kanoowe S, Lagony S, Miot J, Long L and Rosen S for the Uganda EQUIP Test and Treat Modelling Group. Costs and Outcomes of Differentiated ART Service Delivery in Uganda: Summary Brief. Johannesburg: USAID EQUIP, 2020. Participants in the project included the Ministry of Health, National AIDS Commission, USAID, CDC, HealthNet Consult, Quantifications, Planning & Procurement Unit (QPPU), Boston University, HE2RO, and Right to Care. For further information or to request the full report, contact Teresa Guthrie: [email protected] This brief is made possible by the generous support of the American people through the United States Agency for International Development (USAID). The contents are the sole responsibility of EQUIP and do not necessarily reflect the views of USAID or the United States Government.
FBIM, facility-based individual management; FBG, facility-based groups; FDR, fast-track drug refills; CCLAD, community client-led ART delivery; CDDP, community drug distribution points
12
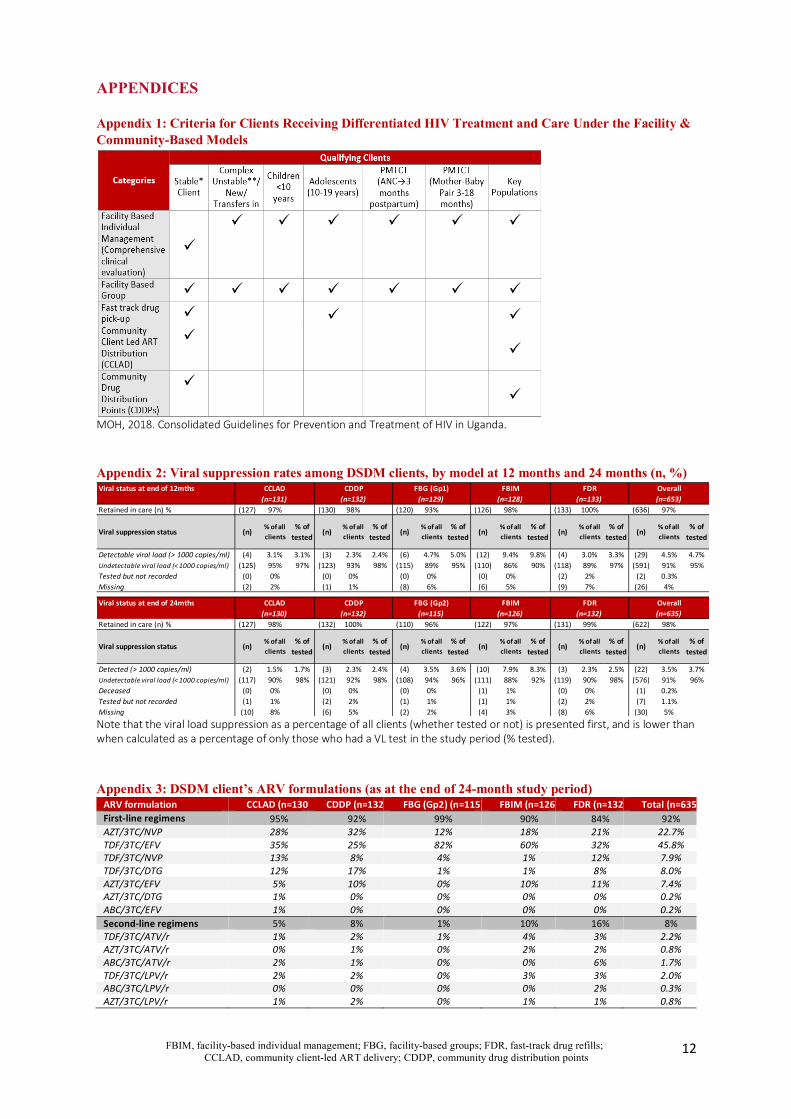
APPENDICES Appendix 1: Criteria for Clients Receiving Differentiated HIV Treatment and Care Under the Facility & Community-Based Models
MOH, 2018. Consolidated Guidelines for Prevention and Treatment of HIV in Uganda. Appendix 2: Viral suppression rates among DSDM clients, by model at 12 months and 24 months (n, %)
Note that the viral load suppression as a percentage of all clients (whether tested or not) is presented first, and is lower than when calculated as a percentage of only those who had a VL test in the study period (% tested). Appendix 3: DSDM client’s ARV formulations (as at the end of 24-month study period)
ARV formulation CCLAD (n=130) CDDP (n=132) FBG (Gp2) (n=115) FBIM (n=126) FDR (n=132) Total (n=635) First-line regimens 95% 92% 99% 90% 84% 92% AZT/3TC/NVP 28% 32% 12% 18% 21% 22.7% TDF/3TC/EFV 35% 25% 82% 60% 32% 45.8% TDF/3TC/NVP 13% 8% 4% 1% 12% 7.9% TDF/3TC/DTG 12% 17% 1% 1% 8% 8.0% AZT/3TC/EFV 5% 10% 0% 10% 11% 7.4% AZT/3TC/DTG 1% 0% 0% 0% 0% 0.2% ABC/3TC/EFV 1% 0% 0% 0% 0% 0.2% Second-line regimens 5% 8% 1% 10% 16% 8% TDF/3TC/ATV/r 1% 2% 1% 4% 3% 2.2% AZT/3TC/ATV/r 0% 1% 0% 2% 2% 0.8% ABC/3TC/ATV/r 2% 1% 0% 0% 6% 1.7% TDF/3TC/LPV/r 2% 2% 0% 3% 3% 2.0% ABC/3TC/LPV/r 0% 0% 0% 0% 2% 0.3% AZT/3TC/LPV/r 1% 2% 0% 1% 1% 0.8%
Viral status at end of 12mths
Retained in care (n) % (127) 97% (130) 98% (120) 93% (126) 98% (133) 100% (636) 97%
Viral suppression status (n) % of all clients
% of tested (n) % of all
clients% of
tested (n) % of all clients
% of tested (n) % of all
clients% of
tested (n) % of all clients
% of tested (n) % of all
clients% of
tested
Detectable viral load (> 1000 copies/ml) (4) 3.1% 3.1% (3) 2.3% 2.4% (6) 4.7% 5.0% (12) 9.4% 9.8% (4) 3.0% 3.3% (29) 4.5% 4.7%Undetectable viral load (< 1000 copies/ml) (125) 95% 97% (123) 93% 98% (115) 89% 95% (110) 86% 90% (118) 89% 97% (591) 91% 95%Tested but not recorded (0) 0% (0) 0% (0) 0% (0) 0% (2) 2% (2) 0.3%Missing (2) 2% (1) 1% (8) 6% (6) 5% (9) 7% (26) 4%
Viral status at end of 24mths
Retained in care (n) % (127) 98% (132) 100% (110) 96% (122) 97% (131) 99% (622) 98%
Viral suppression status (n) % of all clients
% of tested (n) % of all
clients% of
tested (n) % of all clients
% of tested (n) % of all
clients% of
tested (n) % of all clients
% of tested (n) % of all
clients% of
tested
Detected (> 1000 copies/ml) (2) 1.5% 1.7% (3) 2.3% 2.4% (4) 3.5% 3.6% (10) 7.9% 8.3% (3) 2.3% 2.5% (22) 3.5% 3.7%Undetectable viral load (< 1000 copies/ml) (117) 90% 98% (121) 92% 98% (108) 94% 96% (111) 88% 92% (119) 90% 98% (576) 91% 96%Deceased (0) 0% (0) 0% (0) 0% (1) 1% (0) 0% (1) 0.2%Tested but not recorded (1) 1% (2) 2% (1) 1% (1) 1% (2) 2% (7) 1.1%Missing (10) 8% (6) 5% (2) 2% (4) 3% (8) 6% (30) 5%
Overall(n=131) (n=132) (n=129) (n=128) (n=133) (n=653)CCLAD CDDP FBG (Gp1) FBIM FDR
(n=635)CCLAD CDDP FBG (Gp2) FBIM FDR Overall(n=130) (n=132) (n=115) (n=126) (n=132)
FBIM, facility-based individual management; FBG, facility-based groups; FDR, fast-track drug refills; CCLAD, community client-led ART delivery; CDDP, community drug distribution points
13
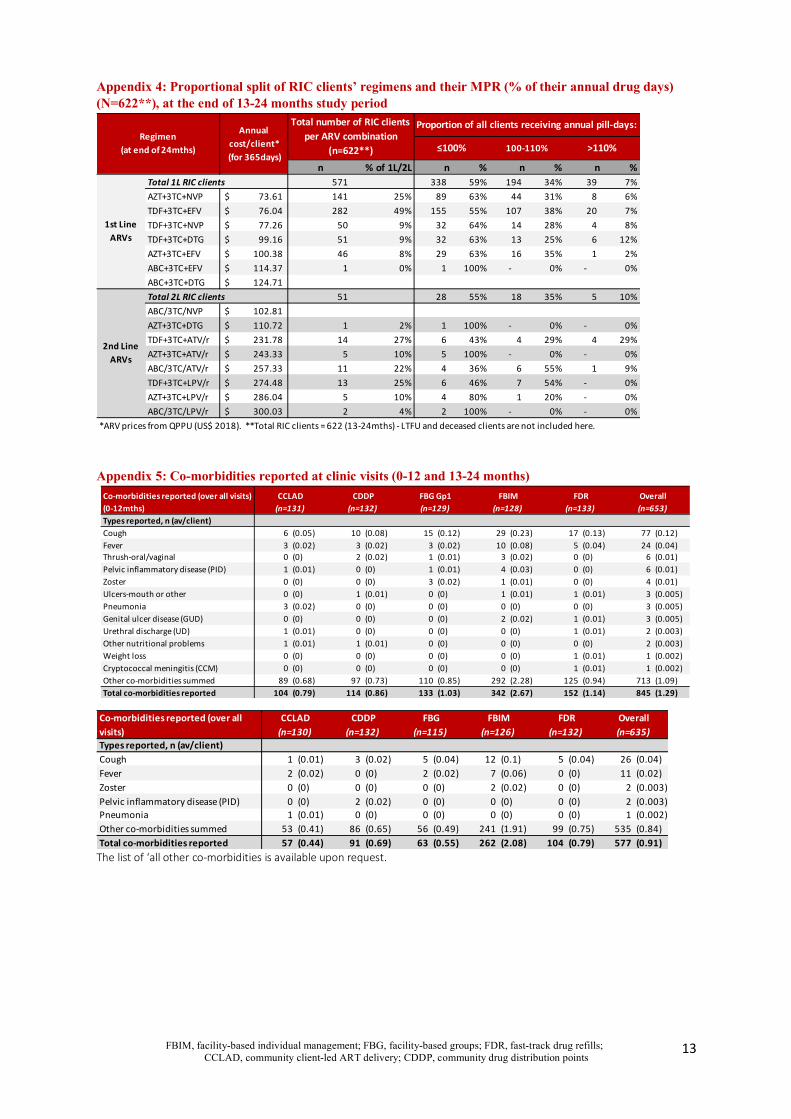
Appendix 4: Proportional split of RIC clients’ regimens and their MPR (% of their annual drug days) (N=622**), at the end of 13-24 months study period
Appendix 5: Co-morbidities reported at clinic visits (0-12 and 13-24 months)
The list of ‘all other co-morbidities is available upon request.
n % of 1L/2L n % n % n %Total 1L RIC clients 571 338 59% 194 34% 39 7%
AZT+3TC+NVP 73.61$ 141 25% 89 63% 44 31% 8 6%
TDF+3TC+EFV 76.04$ 282 49% 155 55% 107 38% 20 7%
TDF+3TC+NVP 77.26$ 50 9% 32 64% 14 28% 4 8%
TDF+3TC+DTG 99.16$ 51 9% 32 63% 13 25% 6 12%
AZT+3TC+EFV 100.38$ 46 8% 29 63% 16 35% 1 2%
ABC+3TC+EFV 114.37$ 1 0% 1 100% - 0% - 0%
ABC+3TC+DTG 124.71$
Total 2L RIC clients 51 28 55% 18 35% 5 10%
ABC/3TC/NVP 102.81$
AZT+3TC+DTG 110.72$ 1 2% 1 100% - 0% - 0%
TDF+3TC+ATV/r 231.78$ 14 27% 6 43% 4 29% 4 29%
AZT+3TC+ATV/r 243.33$ 5 10% 5 100% - 0% - 0%
ABC/3TC/ATV/r 257.33$ 11 22% 4 36% 6 55% 1 9%
TDF+3TC+LPV/r 274.48$ 13 25% 6 46% 7 54% - 0%
AZT+3TC+LPV/r 286.04$ 5 10% 4 80% 1 20% - 0%
ABC/3TC/LPV/r 300.03$ 2 4% 2 100% - 0% - 0%
*ARV prices from QPPU (US$ 2018). **Total RIC clients = 622 (13-24mths) - LTFU and deceased clients are not included here.
2nd Line ARVs
Annual cost/client*
(for 365days)
Total number of RIC clients per ARV combination
(n=622**) ≤100% 100-110%
1st Line ARVs
>110%
Proportion of all clients receiving annual pill-days:Regimen
(at end of 24mths)
Types reported, n (av/client)Cough 6 (0.05) 10 (0.08) 15 (0.12) 29 (0.23) 17 (0.13) 77 (0.12)Fever 3 (0.02) 3 (0.02) 3 (0.02) 10 (0.08) 5 (0.04) 24 (0.04)Thrush-oral/vaginal 0 (0) 2 (0.02) 1 (0.01) 3 (0.02) 0 (0) 6 (0.01)Pelvic inflammatory disease (PID) 1 (0.01) 0 (0) 1 (0.01) 4 (0.03) 0 (0) 6 (0.01)Zoster 0 (0) 0 (0) 3 (0.02) 1 (0.01) 0 (0) 4 (0.01)Ulcers-mouth or other 0 (0) 1 (0.01) 0 (0) 1 (0.01) 1 (0.01) 3 (0.005)Pneumonia 3 (0.02) 0 (0) 0 (0) 0 (0) 0 (0) 3 (0.005)Genital ulcer disease (GUD) 0 (0) 0 (0) 0 (0) 2 (0.02) 1 (0.01) 3 (0.005)Urethral discharge (UD) 1 (0.01) 0 (0) 0 (0) 0 (0) 1 (0.01) 2 (0.003)Other nutritional problems 1 (0.01) 1 (0.01) 0 (0) 0 (0) 0 (0) 2 (0.003)Weight loss 0 (0) 0 (0) 0 (0) 0 (0) 1 (0.01) 1 (0.002)Cryptococcal meningitis (CCM) 0 (0) 0 (0) 0 (0) 0 (0) 1 (0.01) 1 (0.002)Other co-morbidities summed 89 (0.68) 97 (0.73) 110 (0.85) 292 (2.28) 125 (0.94) 713 (1.09)Total co-morbidities reported 104 (0.79) 114 (0.86) 133 (1.03) 342 (2.67) 152 (1.14) 845 (1.29)
CCLAD CDDPCo-morbidities reported (over all visits) (0-12mths)
FBG Gp1 FBIM FDR Overall(n=131) (n=132) (n=129) (n=128) (n=133) (n=653)
Types reported, n (av/client)Cough 1 (0.01) 3 (0.02) 5 (0.04) 12 (0.1) 5 (0.04) 26 (0.04)Fever 2 (0.02) 0 (0) 2 (0.02) 7 (0.06) 0 (0) 11 (0.02)Zoster 0 (0) 0 (0) 0 (0) 2 (0.02) 0 (0) 2 (0.003)Pelvic inflammatory disease (PID) 0 (0) 2 (0.02) 0 (0) 0 (0) 0 (0) 2 (0.003)Pneumonia 1 (0.01) 0 (0) 0 (0) 0 (0) 0 (0) 1 (0.002)Other co-morbidities summed 53 (0.41) 86 (0.65) 56 (0.49) 241 (1.91) 99 (0.75) 535 (0.84)Total co-morbidities reported 57 (0.44) 91 (0.69) 63 (0.55) 262 (2.08) 104 (0.79) 577 (0.91)
Co-morbidities reported (over all visits)
CCLAD CDDP FBG FBIM FDR Overall(n=130) (n=132) (n=115) (n=126) (n=132) (n=635)
FBIM, facility-based individual management; FBG, facility-based groups; FDR, fast-track drug refills; CCLAD, community client-led ART delivery; CDDP, community drug distribution points
14
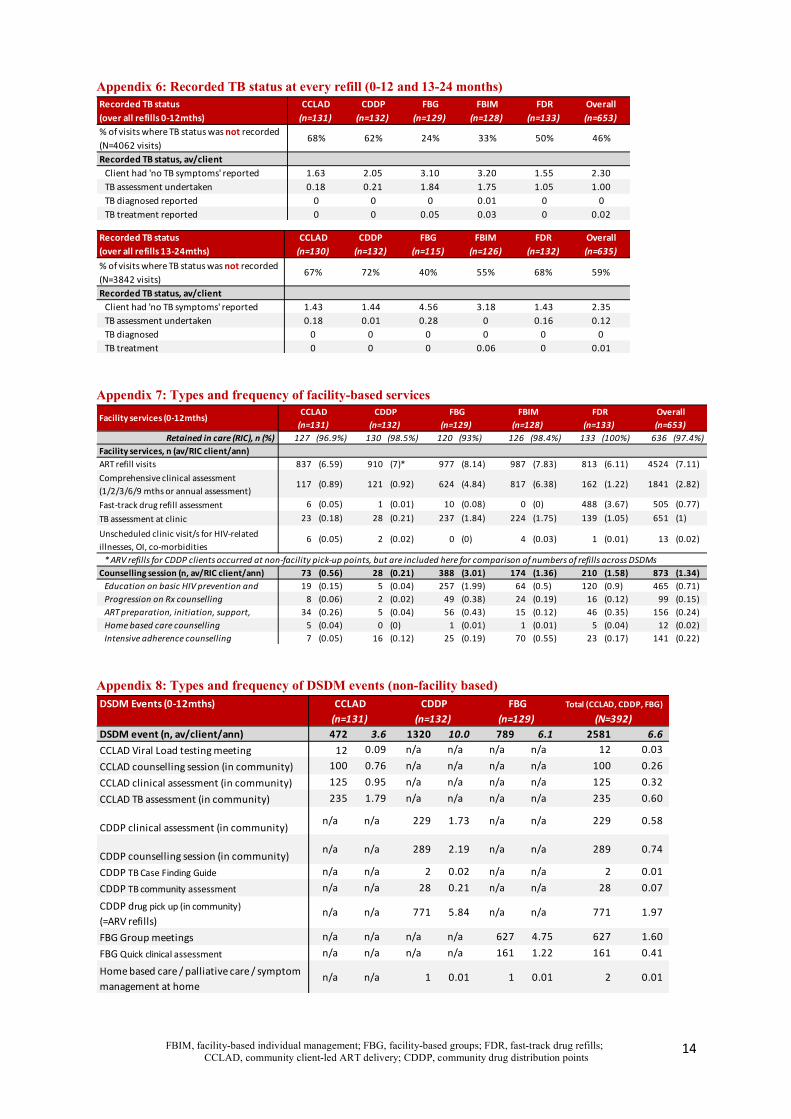
Appendix 6: Recorded TB status at every refill (0-12 and 13-24 months)
Appendix 7: Types and frequency of facility-based services
Appendix 8: Types and frequency of DSDM events (non-facility based)
CCLAD CDDP FBG FBIM FDR Overall(n=131) (n=132) (n=129) (n=128) (n=133) (n=653)
% of visits where TB status was not recorded (N=4062 visits)
68% 62% 24% 33% 50% 46%
Recorded TB status, av/clientClient had 'no TB symptoms' reported 1.63 2.05 3.10 3.20 1.55 2.30TB assessment undertaken 0.18 0.21 1.84 1.75 1.05 1.00TB diagnosed reported 0 0 0 0.01 0 0TB treatment reported 0 0 0.05 0.03 0 0.02
Recorded TB status (over all refills 0-12mths)
CCLAD CDDP FBG FBIM FDR Overall(n=130) (n=132) (n=115) (n=126) (n=132) (n=635)
% of visits where TB status was not recorded
(N=3842 visits)67% 72% 40% 55% 68% 59%
Recorded TB status, av/clientClient had 'no TB symptoms' reported 1.43 1.44 4.56 3.18 1.43 2.35
TB assessment undertaken 0.18 0.01 0.28 0 0.16 0.12
TB diagnosed 0 0 0 0 0 0
TB treatment 0 0 0 0.06 0 0.01
Recorded TB status (over all refills 13-24mths)
Retained in care (RIC), n (%) 127 (96.9%) 130 (98.5%) 120 (93%) 126 (98.4%) 133 (100%) 636 (97.4%)
Facility services, n (av/RIC client/ann)ART refill visits 837 (6.59) 910 (7)* 977 (8.14) 987 (7.83) 813 (6.11) 4524 (7.11)
Comprehensive clinical assessment
(1/2/3/6/9 mths or annual assessment)117 (0.89) 121 (0.92) 624 (4.84) 817 (6.38) 162 (1.22) 1841 (2.82)
Fast-track drug refill assessment 6 (0.05) 1 (0.01) 10 (0.08) 0 (0) 488 (3.67) 505 (0.77)
TB assessment at clinic 23 (0.18) 28 (0.21) 237 (1.84) 224 (1.75) 139 (1.05) 651 (1)
Unscheduled clinic visit/s for HIV-related
illnesses, OI, co-morbidities6 (0.05) 2 (0.02) 0 (0) 4 (0.03) 1 (0.01) 13 (0.02)
* ARV refills for CDDP clients occurred at non-facility pick-up points, but are included here for comparison of numbers of refills across DSDMs
Counselling session (n, av/RIC client/ann) 73 (0.56) 28 (0.21) 388 (3.01) 174 (1.36) 210 (1.58) 873 (1.34)Education on basic HIV prevention and 19 (0.15) 5 (0.04) 257 (1.99) 64 (0.5) 120 (0.9) 465 (0.71)
Progression on Rx counselling 8 (0.06) 2 (0.02) 49 (0.38) 24 (0.19) 16 (0.12) 99 (0.15)
ART preparation, initiation, support, 34 (0.26) 5 (0.04) 56 (0.43) 15 (0.12) 46 (0.35) 156 (0.24)
Home based care counselling 5 (0.04) 0 (0) 1 (0.01) 1 (0.01) 5 (0.04) 12 (0.02)
Intensive adherence counselling 7 (0.05) 16 (0.12) 25 (0.19) 70 (0.55) 23 (0.17) 141 (0.22)
Facility services (0-12mths)(n=653)Overall
(n=131) (n=132) (n=129) (n=128) (n=133)CCLAD CDDP FBG FBIM FDR
DSDM Events (0-12mths)
DSDM event (n, av/client/ann) 472 3.6 1320 10.0 789 6.1 2581 6.6 CCLAD Viral Load testing meeting 12 0.09 n/a n/a n/a n/a 12 0.03 CCLAD counselling session (in community) 100 0.76 n/a n/a n/a n/a 100 0.26 CCLAD clinical assessment (in community) 125 0.95 n/a n/a n/a n/a 125 0.32 CCLAD TB assessment (in community) 235 1.79 n/a n/a n/a n/a 235 0.60
CDDP clinical assessment (in community) n/a n/a 229 1.73 n/a n/a 229 0.58
CDDP counselling session (in community) n/a n/a 289 2.19 n/a n/a 289 0.74
CDDP TB Case Finding Guide n/a n/a 2 0.02 n/a n/a 2 0.01 CDDP TB community assessment n/a n/a 28 0.21 n/a n/a 28 0.07
CDDP drug pick up (in community) (=ARV refills)
n/a n/a 771 5.84 n/a n/a 771 1.97
FBG Group meetings n/a n/a n/a n/a 627 4.75 627 1.60 FBG Quick clinical assessment n/a n/a n/a n/a 161 1.22 161 0.41
Home based care / palliative care / symptom management at home
n/a n/a 1 0.01 1 0.01 2 0.01
Total (CCLAD, CDDP, FBG)(N=392)(n=131) (n=132) (n=129)
CCLAD CDDP FBG
FBIM, facility-based individual management; FBG, facility-based groups; FDR, fast-track drug refills; CCLAD, community client-led ART delivery; CDDP, community drug distribution points
15
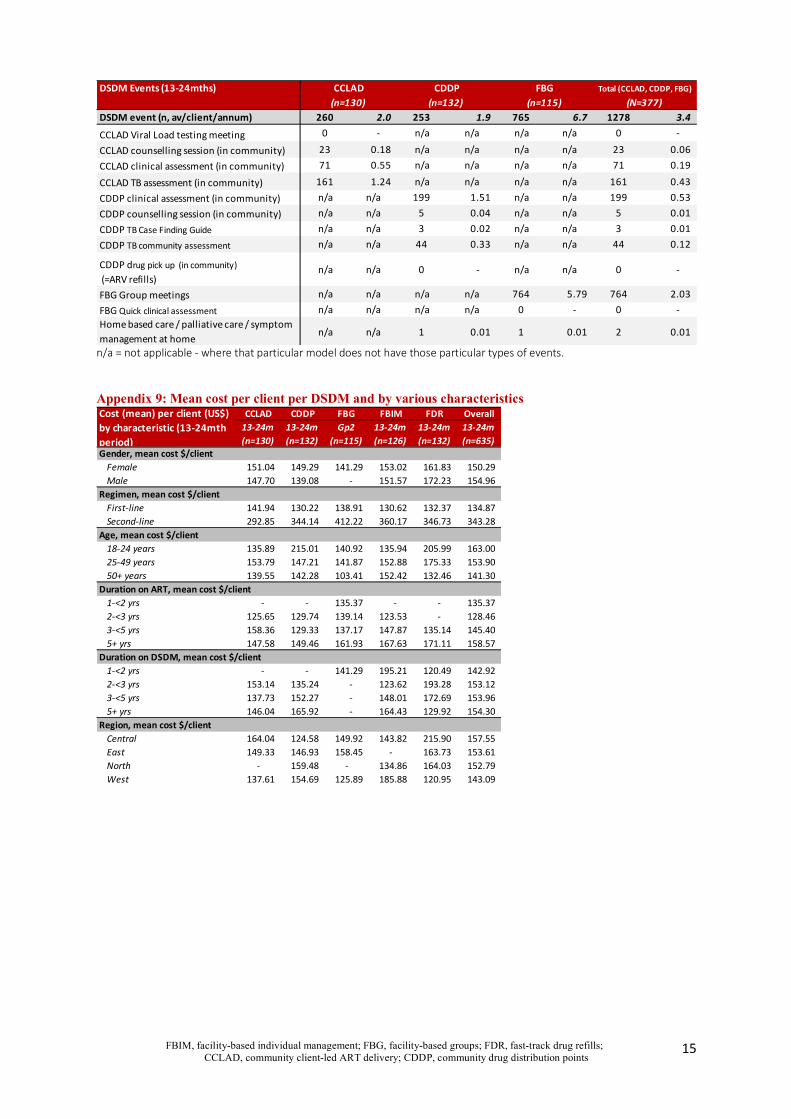
n/a = not applicable - where that particular model does not have those particular types of events. Appendix 9: Mean cost per client per DSDM and by various characteristics
DSDM Events (13-24mths)
DSDM event (n, av/client/annum) 260 2.0 253 1.9 765 6.7 1278 3.4 CCLAD Viral Load testing meeting 0 - n/a n/a n/a n/a 0 -
CCLAD counselling session (in community) 23 0.18 n/a n/a n/a n/a 23 0.06 CCLAD clinical assessment (in community) 71 0.55 n/a n/a n/a n/a 71 0.19
CCLAD TB assessment (in community) 161 1.24 n/a n/a n/a n/a 161 0.43 CDDP clinical assessment (in community) n/a n/a 199 1.51 n/a n/a 199 0.53 CDDP counselling session (in community) n/a n/a 5 0.04 n/a n/a 5 0.01 CDDP TB Case Finding Guide n/a n/a 3 0.02 n/a n/a 3 0.01 CDDP TB community assessment n/a n/a 44 0.33 n/a n/a 44 0.12
CDDP drug pick up (in community) (=ARV refills)
n/a n/a 0 - n/a n/a 0 -
FBG Group meetings n/a n/a n/a n/a 764 5.79 764 2.03 FBG Quick clinical assessment n/a n/a n/a n/a 0 - 0 - Home based care / palliative care / symptom management at home
n/a n/a 1 0.01 1 0.01 2 0.01
Total (CCLAD, CDDP, FBG)
(N=377)(n=130) (n=132) (n=115)CCLAD CDDP FBG
CCLAD CDDP FBG FBIM FDR Overall13-24m 13-24m Gp2 13-24m 13-24m 13-24m(n=130) (n=132) (n=115) (n=126) (n=132) (n=635)
Gender, mean cost $/clientFemale 151.04 149.29 141.29 153.02 161.83 150.29 Male 147.70 139.08 - 151.57 172.23 154.96
Regimen, mean cost $/clientFirst-line 141.94 130.22 138.91 130.62 132.37 134.87 Second-line 292.85 344.14 412.22 360.17 346.73 343.28
Age, mean cost $/client18-24 years 135.89 215.01 140.92 135.94 205.99 163.00 25-49 years 153.79 147.21 141.87 152.88 175.33 153.90 50+ years 139.55 142.28 103.41 152.42 132.46 141.30
Duration on ART, mean cost $/client1-<2 yrs - - 135.37 - - 135.37 2-<3 yrs 125.65 129.74 139.14 123.53 - 128.46 3-<5 yrs 158.36 129.33 137.17 147.87 135.14 145.40 5+ yrs 147.58 149.46 161.93 167.63 171.11 158.57
Duration on DSDM, mean cost $/client1-<2 yrs - - 141.29 195.21 120.49 142.92 2-<3 yrs 153.14 135.24 - 123.62 193.28 153.12 3-<5 yrs 137.73 152.27 - 148.01 172.69 153.96 5+ yrs 146.04 165.92 - 164.43 129.92 154.30
Region, mean cost $/clientCentral 164.04 124.58 149.92 143.82 215.90 157.55 East 149.33 146.93 158.45 - 163.73 153.61 North - 159.48 - 134.86 164.03 152.79 West 137.61 154.69 125.89 185.88 120.95 143.09
Cost (mean) per client (US$) by characteristic (13-24mth period)
FBIM, facility-based individual management; FBG, facility-based groups; FDR, fast-track drug refills; CCLAD, community client-led ART delivery; CDDP, community drug distribution points
16
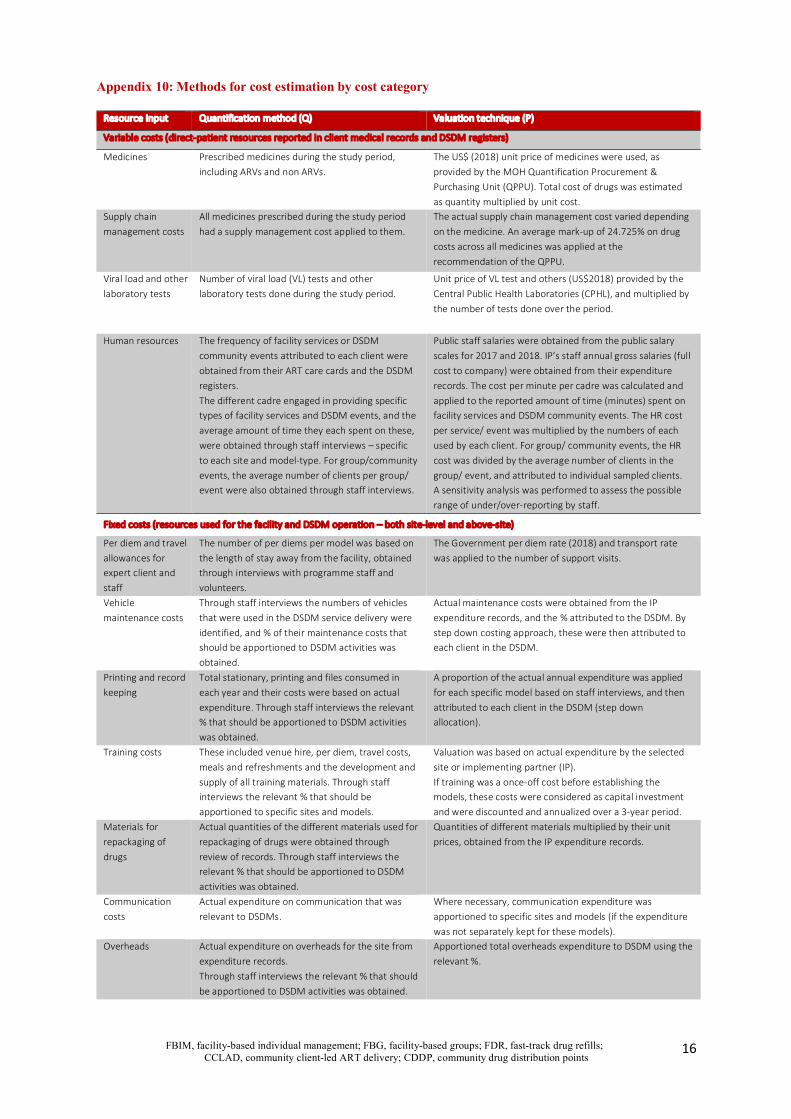
Appendix 10: Methods for cost estimation by cost category
Resource Input Quantification method (Q) Valuation technique (P)
Variable costs (direct-patient resources reported in client medical records and DSDM registers)
Medicines Prescribed medicines during the study period, including ARVs and non ARVs.
The US$ (2018) unit price of medicines were used, as provided by the MOH Quantification Procurement & Purchasing Unit (QPPU). Total cost of drugs was estimated as quantity multiplied by unit cost.
Supply chain management costs
All medicines prescribed during the study period had a supply management cost applied to them.
The actual supply chain management cost varied depending on the medicine. An average mark-up of 24.725% on drug costs across all medicines was applied at the recommendation of the QPPU.
Viral load and other laboratory tests
Number of viral load (VL) tests and other laboratory tests done during the study period.
Unit price of VL test and others (US$2018) provided by the Central Public Health Laboratories (CPHL), and multiplied by the number of tests done over the period.
Human resources The frequency of facility services or DSDM community events attributed to each client were obtained from their ART care cards and the DSDM registers. The different cadre engaged in providing specific types of facility services and DSDM events, and the average amount of time they each spent on these, were obtained through staff interviews – specific to each site and model-type. For group/community events, the average number of clients per group/ event were also obtained through staff interviews.
Public staff salaries were obtained from the public salary scales for 2017 and 2018. IP’s staff annual gross salaries (full cost to company) were obtained from their expenditure records. The cost per minute per cadre was calculated and applied to the reported amount of time (minutes) spent on facility services and DSDM community events. The HR cost per service/ event was multiplied by the numbers of each used by each client. For group/ community events, the HR cost was divided by the average number of clients in the group/ event, and attributed to individual sampled clients. A sensitivity analysis was performed to assess the possible range of under/over-reporting by staff.
Fixed costs (resources used for the facility and DSDM operation – both site-level and above-site)
Per diem and travel allowances for expert client and staff
The number of per diems per model was based on the length of stay away from the facility, obtained through interviews with programme staff and volunteers.
The Government per diem rate (2018) and transport rate was applied to the number of support visits.
Vehicle maintenance costs
Through staff interviews the numbers of vehicles that were used in the DSDM service delivery were identified, and % of their maintenance costs that should be apportioned to DSDM activities was obtained.
Actual maintenance costs were obtained from the IP expenditure records, and the % attributed to the DSDM. By step down costing approach, these were then attributed to each client in the DSDM.
Printing and record keeping
Total stationary, printing and files consumed in each year and their costs were based on actual expenditure. Through staff interviews the relevant % that should be apportioned to DSDM activities was obtained.
A proportion of the actual annual expenditure was applied for each specific model based on staff interviews, and then attributed to each client in the DSDM (step down allocation).
Training costs These included venue hire, per diem, travel costs, meals and refreshments and the development and supply of all training materials. Through staff interviews the relevant % that should be apportioned to specific sites and models.
Valuation was based on actual expenditure by the selected site or implementing partner (IP). If training was a once-off cost before establishing the models, these costs were considered as capital investment and were discounted and annualized over a 3-year period.
Materials for repackaging of drugs
Actual quantities of the different materials used for repackaging of drugs were obtained through review of records. Through staff interviews the relevant % that should be apportioned to DSDM activities was obtained.
Quantities of different materials multiplied by their unit prices, obtained from the IP expenditure records.
Communication costs
Actual expenditure on communication that was relevant to DSDMs.
Where necessary, communication expenditure was apportioned to specific sites and models (if the expenditure was not separately kept for these models).
Overheads Actual expenditure on overheads for the site from expenditure records. Through staff interviews the relevant % that should be apportioned to DSDM activities was obtained.
Apportioned total overheads expenditure to DSDM using the relevant %.
FBIM, facility-based individual management; FBG, facility-based groups; FDR, fast-track drug refills; CCLAD, community client-led ART delivery; CDDP, community drug distribution points
17
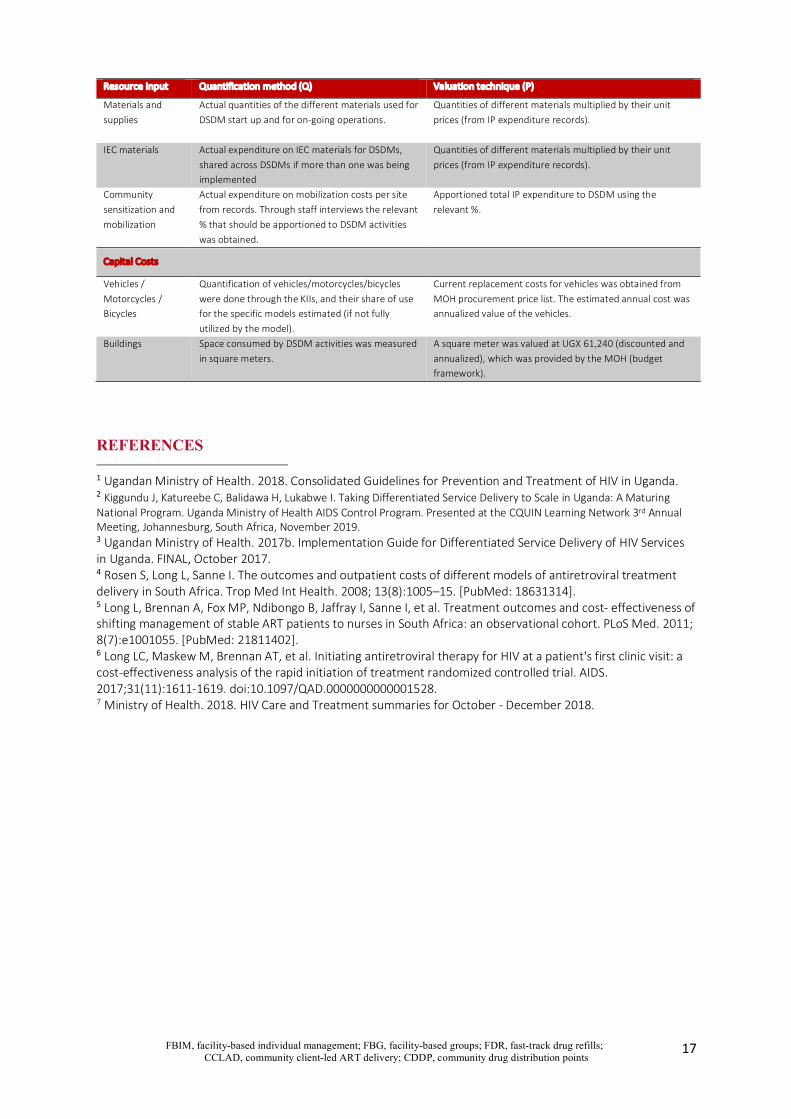
Resource Input Quantification method (Q) Valuation technique (P)
Materials and supplies
Actual quantities of the different materials used for DSDM start up and for on-going operations.
Quantities of different materials multiplied by their unit prices (from IP expenditure records).
IEC materials Actual expenditure on IEC materials for DSDMs, shared across DSDMs if more than one was being implemented
Quantities of different materials multiplied by their unit prices (from IP expenditure records).
Community sensitization and mobilization
Actual expenditure on mobilization costs per site from records. Through staff interviews the relevant % that should be apportioned to DSDM activities was obtained.
Apportioned total IP expenditure to DSDM using the relevant %.
Capital Costs
Vehicles / Motorcycles / Bicycles
Quantification of vehicles/motorcycles/bicycles were done through the KIIs, and their share of use for the specific models estimated (if not fully utilized by the model).
Current replacement costs for vehicles was obtained from MOH procurement price list. The estimated annual cost was annualized value of the vehicles.
Buildings Space consumed by DSDM activities was measured in square meters.
A square meter was valued at UGX 61,240 (discounted and annualized), which was provided by the MOH (budget framework).
REFERENCES
1 Ugandan Ministry of Health. 2018. Consolidated Guidelines for Prevention and Treatment of HIV in Uganda. 2 Kiggundu J, Katureebe C, Balidawa H, Lukabwe I. Taking Differentiated Service Delivery to Scale in Uganda: A Maturing National Program. Uganda Ministry of Health AIDS Control Program. Presented at the CQUIN Learning Network 3rd Annual Meeting, Johannesburg, South Africa, November 2019. 3 Ugandan Ministry of Health. 2017b. Implementation Guide for Differentiated Service Delivery of HIV Services in Uganda. FINAL, October 2017. 4 Rosen S, Long L, Sanne I. The outcomes and outpatient costs of different models of antiretroviral treatment delivery in South Africa. Trop Med Int Health. 2008; 13(8):1005–15. [PubMed: 18631314]. 5 Long L, Brennan A, Fox MP, Ndibongo B, Jaffray I, Sanne I, et al. Treatment outcomes and cost- effectiveness of shifting management of stable ART patients to nurses in South Africa: an observational cohort. PLoS Med. 2011; 8(7):e1001055. [PubMed: 21811402]. 6 Long LC, Maskew M, Brennan AT, et al. Initiating antiretroviral therapy for HIV at a patient's first clinic visit: a cost-effectiveness analysis of the rapid initiation of treatment randomized controlled trial. AIDS. 2017;31(11):1611-1619. doi:10.1097/QAD.0000000000001528. 7 Ministry of Health. 2018. HIV Care and Treatment summaries for October - December 2018.