costs and returns of subdivision development
TRANSCRIPT

Costs and Returns of
Subdivision Development
BULLETIN 427 JANUARY 1972
Agricultural Experiment Station
A UB U RN U NIV ER SIT YE V. Smith: Directo Au~burn, Alabama

CONTENTS
Page
IN TR O D U C TIO N - - - - - - - - - - --- - - - - - - - - - - - - -- - -- - - - - - --
Research Objectives-- - - - - - - -- - - --- - --- - - 4
P ro c e d u re - - - - - - -- - - -- - - - - - - - - - - - - - - - - - - - - - - - - - - - - 4
Description of the Case Study Area.5
Results of Similar Studies -- -- - - - - - - - -- -6
Description of the Cases Studied-8
RESULTS 10---------------------------------------10
Development Costs --------------------- -10
Returns to Capital, Management, and
O pportunity C ost --------------------------- ------ 18
Costs and Returns of Subdivision Developmentto th e C ity -- - - - - - - - - - - - - - - - - - - - - - - - - - - - - - - - - - - - - -2 0
S U M M A R Y -- - - - - - - - - - -- - - - - - - - - - - - - - - - - - - - - - - - - - - - - - - - 2 6
LITERATURE C ITED --------------------------------------- 29
A P P E N D IX - - - - - - - - - - - - - - - - - - - - - - - - - - - - - - - - - - - - - - - - - - - 3 0
FIRST PRINTING 3M, JANUARY 1972

Costs and Returns of
Subdivision Development
WILLIAM H. MOSS and HOWARD A. CLONTS, JR.1
INTRODUCTION
THE UNITED STATES is rapidly becoming an urban nation. In1970 more than 70 per cent of the nation's population lived inurban places. One aspect of this urbanization trend has beenintensive development of single-family-residence subdivisions.Large numbers of urban residents, while choosing to work in acentral city, have elected to live in suburban housing develop-ments. Rapid advances in transportation and communicationhave accelerated this trend in recent years. The result has beena significant increase in demand for suburban housing.
Associated with the increase in demand for housing has beena rapid rise in house construction costs. The average single-family home cost $9,780 in 1949. By 1969, the average cost hadrisen to $20,534 (6). Lot prices have reflected similar pricechanges. In recent years home ownership expenses were affectedby the sharp increases in mortgage costs as well as constructioncosts. These higher costs probably caused many people to post-pone building.
Many solutions to the housing problem have been offered, butthe general situation, intensified by a rapidly growing population,is far from solved. One of the solutions is a continuation of sub-division development. The accelerated rate of subdivision de-
Former Graduate Research Assistant and Assistant Professor, respectively.Department of Agricultural Economics and Rural Sociology, School of Agricultureand Agricultural Experiment Station, Auburn University.

4 ALABAMA AGRICULTURAL EXPERIMENT STATION
velopment throughout much of the nation is an indication thatthis approach is acceptable, at least in the short run.
If additional subdivision housing is to be sufficient to meetthe increased demands, the return from investments by de-velopers must compete with or exceed returns from other sources.Also, finished lot prices must be sufficiently low to allow homebuilding by people within a wide income range. Hence, theneed for an analysis of costs and returns of subdivision develop-ment and other forms of investment was realized. This reportis a summary of the results of such a study.
Research Objectives
The overall objective of this study was to examine the costsand returns of subdivision developments from the viewpoint ofboth the private and public sectors. Specific objectives were to:(1) develop procedures for estimating costs and returns of addi-tional subdivisions to municipalities and to private developers;(2) estimate costs and returns of actual development to munici-palities and private developers; and (3) determine relative ratesof return from investments in residential subdivisions for com-parison with other forms of investment.
Procedure
This study was limited to analyses of selected cases to providemeaningful estimates of costs and returns. Cost and return fac-tors of both private developers and local government were ex-amined.
The initial step in the.study was selection of the geographicallocation of the community to be studied and the specific sub-divisions within that community. Factors used in selecting thecommunity included population, location, income, and educa-tional level.
Specific subdivisions were selected on basis of data available,time of development, location with respect to other residentialareas, and proximity to work and shopping facilities. Detaileddata on all aspects of private land development costs for theselected cases were obtained. These costs were obtained on aper lot basis and compared with returns generated by sale ofthe lots.
All developmental costs except land were adjusted to 1969 pricelevels using the wholesale price index. Land values have risen

SUBDIVISION DEVELOPMENT 5
somewhat faster than the wholesale price index during the lastdecade; therefore, another procedure of adjustment was neededfor land. The value of land nationwide increased an estimated5 per cent annually for the past several years, so land prices wereadjusted using this rate of change.
Similar data were obtained from personnel of the local mu-nicipal government on initial and maintenance costs of new sub-divisions and estimated revenue generated by these develop-ments in the form of property, sales, and other taxes and variousservice fees. Although important, intangible social values wereexcluded from analysis.
Installation and maintenance costs of "public" utilities pro-vided by private enterprise also were omitted from the presentanalysis. Corporations providing telephone, gas, electricity, andother special services operate on a self-sustaining basis. Chargesmade for a given utility installation and its maintenance may notbe sufficient to cover costs. Because of this procedure of aggre-gating costs in a local area, some utility companies were notable to provide estimates of the costs and returns per house otherthan as simple averages. Hence, they were omitted from con-sideration. This omission was not considered serious since ser-vices were not provided by means of tax and fee revenues,whereas costs to municipalities must be covered by such revenues.
Description of the Case Study Area
The study area was an Alabama city that included a total areaof 20 square miles with a density of 1,150 persons per squaremile. Changes in population of the case city and the State arecompared in Appendix Table 1.
Educational and income levels of residents in the study citywere above the State average. The 1960 census indicated thatmales over 25 completed an average of 14.6 years of school andfemales over 25, 12.4 years (7). The 1960 median income for allfamilies was $4,269. Statewide data showed the average maleover 25 completed 8.9 years of school while the average femalecompleted 9.3 years (1). The 1960 median income for all familiesin the State was $3,937. It was estimated that the number ofyears of school completed for the case city did not change greatlybetween 1960 and 1970. However, it was estimated that themedian income rose from $4,269 in 1960 to approximately $6,500by 1970. As indicated by these comparisons, the study area ex-

6 ALABAMA AGRICULTURAL EXPERIMENT STATION
hibited a potential for rapid growth compared with the State.The potential was translated into a relatively high level of de-mand for subdivision and other new housing.
Results of Similar Studies
A case study in 1961 involving 159 lots in Lisle, Illinois re-vealed that the cost per acre of land to private developers was$2,000 (5). A time lag of 2 years between land purchase anddevelopment resulted in additional costs of $240 in interest (2years at 6 per cent) and $40 in property taxes. Thus, total landcosts at time of development were $2,280 per acre. Throughsubdivision, each acre of land yielded 2.63 lots. Hence, initialland costs totaled $867 per lot at time of development. Thistotal represented 24 per cent of the total development cost ofeach lot in the subdivision.
A survey by the National Association of Home Builders(NAHB) of its member builders provided information on theaverage value of land before and after development (5). Averageprices paid for raw usable land in the East-South-Central regionof the United States in 1960 and 1964 were $1,533 and $2,420per acre, respectively. Raw or undeveloped land prices in bothyears were significantly below the national average of $2,447 in1960 and $3,878 in 1964. However, the percentage change inland prices from 1960 to 1964 in both the East-South-Centralregion and the Nation was approximately 63 per cent.
The NAHB survey also showed average prices for developedlots in the U.S. were $2,808 per lot in 1960 and $4,567 in 1964.Comparable prices in the East-South-Central region were $2,250and $3,564 in the same periods. Regional and U.S. price changeswere approximately the same between 1960 and 1964.
The large difference in raw and developed land prices indi-cated the importance of lot improvements on investment de-cisions. Improvements such as sewers, water mains, sidewalks,streets, and drains represented approximately 64 per cent oftotal lot cost in the Lisle, Illinois study. A somewhat lowerproportion of total costs was attributed to improvements in a1965 study in California. There, 45 per cent of the costs wereincurred because of improvements (4). However, the lower per-centage reported in this study was largely the result of relativelyhigh value of undeveloped land in California. Other studies have

SUBDIVISION DEVELOPMENT 7
indicated that attributing approximately 60 per cent of totalcosts to improvements appeared more normal throughout theUnited States (2).
Other information of the National Association of Home-builders as reported by Schmid indicated the average sellingprice per lot, including developmental improvements, in severallarge cities in each state. Although the average price for lotswas not available for the study city, the report provided esti-mates for several Alabama cities, Table 1. The cities listed arelarger than the case study city. Nevertheless, prices listed andthe average price for seven major cities provide some indicationof the 1964 cost per lot in Alabama.
TABLE 1. AVERAGE SELLING PRICE OF DEVELOPED LOTS IN RESIDENTIALSUBDIVISIONS, SELECTED ALABAMA CITIES, 19641
Price per lot, 1964City (includes developmental
improvements)
DollarsB irm ingham ------- ----------------------------------------------- -3,939D ecatur-- - -- - --- -- - -- - -- - -- - -- - -- -- 3,400D othan ---------------------------------- -2,083H untsVille - -- - - -- - - -- - - -- - -- - - -- - - -3,650M obile -------------------- - -- --- 3,750M ontgom ery-- - -- - -- - -- - -- - -- - -- - -- -- 3,708Tuscaloosa-- - -- - - -- - - -- - - -- - -- - - --- 3,750A ll cities ---------- ------- - -- ---------- ---- -3,469
1Source: Schmid, A. Allen, Converting Land from Rural to Urban Uses. Balti-more, Johns Hopkins Press, 1968, p. 20.
Municipalities, like private developers, incur certain costs andrealize returns when new development occurs. Unfortunately,little is recorded in the literature on such costs and returns. Fora new subdivision to pay its own way so far as the city is con-cerned, the revenue paid by the subdivision to the city mustequal the cost of services offered by the city. This situation doesnot always exist.
Bahi (3) reported the extra cost associated with a "leapfrog"development near Lexington, Kentucky2. He noted manyareas in which city costs were incurred. These included main-tenance of sanitary sewers, water lines, and streets, garbage dis-
'Lepgdevelopment is the term given to the procedure of developing areasaround cities in a patchwork manner. Large undeveloped areas are left betweendevelopments and the central city. Relative land prices generally determine thedevelopment pattern.

8 ALABAMA AGRICULTURAL EXPERIMENT STATION
posal, police and fire protection, public transportation, andschools. The incidence of these costs was only partially on resi-dents of the new subdivision since 42 per cent of the costs of the"leapfrog" development were borne by the total population inthe service area. Thus, only 58 per cent of the added costs ofthe "leapfrog" were collected from subdivision residents throughproperty taxes, excise (gasoline) taxes, and service fees.
Description of the Cases Studied
Five separate developments were analyzed for this study. Twoof the developments were subdivisions of larger platted areas.However, they were developed as separate projects which al-lowed them to be classified independently. The cases studiedwere designated as Subdivision "A", "B", and "C", with "A" and"C" having two plats each. Cost and return figures were adjustedto 1970 levels according to the procedure outlined earlier, Ap-pendix Tables 2-6. Adjusted data were used in the analysis.
Case Study A. Case A contained two plats with Plat One hav-ing 35 lots and Plat Two, 42 lots. The two plats were analyzedseparately to determine differences within a large subdivision aswell as between subdivisions.
The site for Case A was purchased in November 1962. De-velopment for both plats began 3 years later. Plat One contained15.38 acres and was subdivided into lots of approximately .35acre each. Plat Two, with 20 acres, was subdivided into lots of.39 acre each. At the time of this study, 32 lots in Plat One and21 lots in Plat Two had been sold.
The 77 lots in Case A were located approximately 2.2 milesfrom the prevailing "100 per cent" spot in the City3. However,rapid development of satellite shopping centers reduced the im-portance of this location somewhat. The closest shopping cen-ter was located 2.0 miles from Case A. With good roads leadingto both the "100 per cent" spot and shopping centers, a distanceof 2 to 3 miles was not considered significant. The more sig-nificant aspects of location were found in the close proximity ofCase A to schools, churches, and employment centers.
The entire land area of Case A was underlain with sand at its
The "100 per cent" spot in a city is considered the prime spot for commercialactivity. Here one might expect the greatest flow of trade and employmentopportunities.

lower points and heavy clay on hills and ridges. Drainage wasgood throughout the development. Vegetative cover was mod-erate with a limited number of large trees. Thus, the area wasnot considered physically difficult to develop.
Case Study B. Case study B was located on the opposite sideof town from cases "A" and "C". This development, although0.3 mile closer to the "100 per cent" spot, was not located nearany other shopping facilities. Only one road was available forcommuting to the central work and shopping areas, and trafficon this road was sometimes quite congested. In addition, CaseB lay beyond an older portion of the city where some deteriora-tion of existing homes was evident.
Land for this Subdivision was purchased in December 1966,and development began early in 1967. At the time of the study22 of the 49 lots had been sold.
This subdivision contained a total of 25.3 acres of land. Theoriginal subdivision design contained 50 lots, but after comple-tion of development, it was discovered that 1 lot was not suitablefor building purposes because of drainage problems. Had thisproblem been realized earlier surrounding lots could have beenenlarged. Higher selling prices associated with larger lots mayhave been sufficient to recover a portion of the loss caused bythis situation. Because of the loss of this lot, average costs andreturns for the subdivision were computed on the basis of 49 totallots.
The land on which Case B was located was partially underlainby thick rock formations. This situation was not realized at thetime the tract was purchased. Some difficulties were encounteredin laying sewer and water lines because of the rock. The extracosts required to install utility services were not sufficient tooffset all profits from the development although some reductionwas evident.
Case Study C. Case C was located approximately 0.5 milefrom Subdivision A. This location placed the development 2.5miles from the "100 per cent" location defined earlier. This sub-division was located favorably with respect to the shoppingfacilities, schools, and churches near Subdivision A.
Land for this subdivision was purchased in late 1969. Actualdevelopment had not begun at the time of the study. However,a sufficient number of bids and contracts were completed to usethe area for study. There were two plats in the development.
SUBDIVISION DEVELOPMENT 9

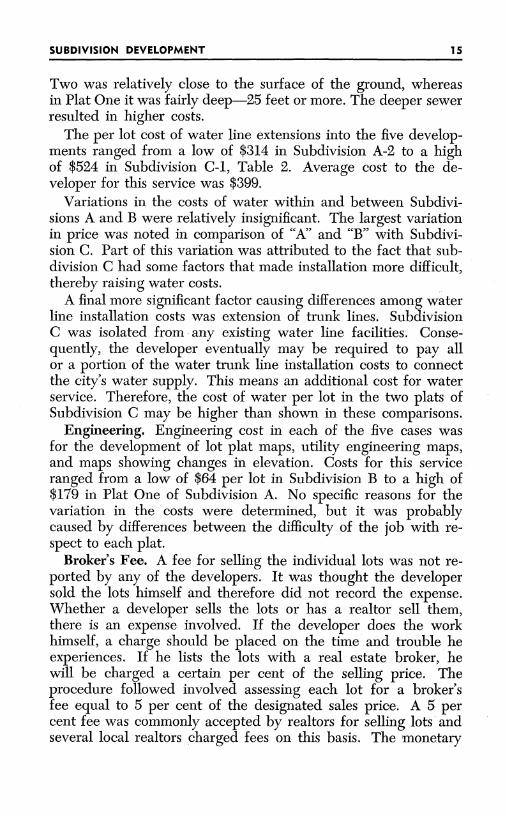
Plat One contained 31 lots arranged on 16 acres of land. PlatTwo had 33 lots on a total of 18.5 acres, see figure.
Although Case C was located within 0.5 mile of "A" and waslocated close to the same facilities as "A", there were a numberof physical differences that justified comparison of the two areas.Subdivision A was located on rolling sandy land covered withonly small brush. Case C was in an area covered with large treesand was situated on relatively rough, hilly land rather thanrolling plains as was the case in "A". Another difference wasthe heavy rock content in the soil in Case C as compared withsandy soil in Case A.
Each development had a number of physical advantages aswell as disadvantages. These pros and cons affected the amountof return to the respective developers.
RESULTSDevelopment Costs
The best perspective concerning variations in costs amongdevelopments was obtained by examining each cost item sep-arately. Cost factors were broken down into the followingclasses: land, improvements (sewer, water, and street extension),taxes, engineering, recording, broker's fee, interest, and mis-cellaneous. The analysis of these factors provided a partial ex-planation of the difference among and within the separatedevelopments.
Land. The average cost of land to developers for all lots inthe study was $965 per lot, Tables 2 and 3.4 The lowest landcosts were found in Plat One of Subdivision A and the highestcosts in Subdivision C, Plat Two. Costs in both plats were con-sidered sufficiently different from the mean and other platsto merit separate consideration. Differences in size of the lotsin the two plats appeared to account for differences in the costs.However, the cost per acre of the two cases differed also. Theaverage land cost in Plat One, Case A was $1,223 per acre andPlat Two, Case C was $2,000 per acre, Appendix Tables 2 and 6,respectively. The higher cost per acre of the latter developmentwas reflected in the higher lot cost.
Changes in the value of land over time offered one explanationfor differences in the land costs for the developments. The value
'Averages used in text that refer to all cases collectively are simple averages.Weighted averages are shown in Appendix Table 13.
10 ALABAMA AGRICULTURAL EXPERIMENT STATION

SUBDIVISION DEVELOPMET1
I in. = 135 ft.
General plat map of Plat Two, Case C shows typical subdivision layout.
I I I I ~Y.. ,,_..
11SUBDIVISION DEVELOPMENT

12 ALABAMA AGRICULTURA XEIEN TTO
TABLE 2. COST OF SUBDIVISION DEVELOPMENT PER LOT BY SELECTEDFACTORS, ALABAMA CASE STUDY, 1970
Subdivision
A-t A-2 B C-i C-2
Dol. Dol. Dol. Dol. Dol. Dol.
Land 1 ______________________________ 7 56 8 2 0 9 9 2 1,084 1,177 9 66
Taxes2 ----------- ------------------ 29 12 20 22 17Sewer_____________________________ __ 582 858 557 510 446 491Street extension________________ 1,163 1,067 1,097 1,306 1,144 1,155W ater -------------------------------- 358 814 340 524 461 399
Engineering_______________________ 179 149 64 100 100 118Recording __________________ __ ____3 ___ 3 5 1 1 2Interest___i_________________ 1,036 933 744 1,432 1,389 1,107Broker fee ------------------------ 250 250 250 350 350 290
Miscellaneous_______________ _ _ 48 32 24 21Total4 ____------------------------_-__ 4,354 8,903 4,097 5,359 5,114 4,566
1Land prices were adjusted to 1969 by computing a 5 per cent increase invalue annually. All other costs were adjusted by means of the wholesale priceindex.
2 Estimate of aggregate real property taxes during development period.3 Less than $1.00.4Excludes management fee. Totals do not necessarily agree with totals in
Appendix Tables 7 through 11 because of rounding.
TABLE 3. PERCENTAGE DISTRIBUTION OF TOTAL SUBDIVISION COST PER LOT
BY COST FACTORS, ALABAMA CASE STUDY, 19701
Cost factorSubdivisionA-i A-2 B C-i C-2
Pet. Pet. Pct. Pct. Pct.
Land _______________________________ 17.37 21.00 24.21 20.23 23.02Taxes ---------------------------------- .67 .30 .01 .37 .43
'Improvements___________________ 48.31 44.56 48.67 43.66 40.11Engineering_ _ _ 4.11 3.82 1.56 1.87 1.96Recording_____________ .01 .01 .12 .02 .02Interest --------------- 23.80 23.90 18.16 26.72 27.16
Broker fee_____________ 5.74 6.41 6.10 6.53 6.84 2Mseln o s_________211 6 4
1 Excludes management fee.2 None reported.
of land rose significantly during the last decade. A portion ofthe increase in value was attributed to changes in the price levelbrought about by inflation in the general economy. However,after adjusting all costs to 1970 price levels, differences still ap-peared significant. This situation led to the conclusion that thedemand for land in 1970 was greater than the demand in 1962.This change probably resulted from growth in population andincome- levels in the community.
Perhaps another reason the prices paid for land were not moreuniform was the assumption of a price adjustment rate of 5 per
12 ALABAMA AGRICULTURAL EXPERIMENT STATION

cent per year. The 5 per cent rate is accurate for the annualrise in land prices generally, but for land located close to agrowing, young, and relatively wealthy community 5 per centmay be somewhat low. If the land for development "A" had beencompounded at 7 or 8 per cent per year, the adjusted costs forland in the five developments would be more nearly the sametotal amount.
Generally, the single most important factor in the value of aparcel of land is its location. This is especially true of sub-division lots. However, in this study too few cases were analyzedto represent any significant difference. All developments werelocated near some or all of the following: transportation facili-ties, shopping centers, places of business, schools, churches, ornucleus of the city. If more cases had been available for study,it was felt that net returns for developments located some dis-tance from a number of the above amenities might have been sig-nificantly lower.
Improvements. Three areas constituted improvements-sewer,street extension, and water.5 An observation concerning im-provement cost in general was that A-2 had the lowest cost forall three types of improvements. Several factors contributed tothis situation. Subdivision A-2 contained 11 lots located on apreviously existing street for which sewer and water lines werealready installed when the plat was subdivided. If the total costof street extension in Plat Two of Subdivision A were dividedamong the 31 lots serviced, the average cost per lot wouldactually exceed the street cost in the other subdivisions. Thelatter procedure was used in a final cost comparison, Table 4. Asecond reason for the lower improvement costs was the sandysoil and uniform topography. Also, the limited number of treesexisting on the tract allowed clearing to be accomplished withrelative ease. These combined factors resulted in Plat A-2 havingthe lowest cost in each class of improvement among all sub-divisions studied. Individual variation within the three items ofimprovement is discussed in following sections.
Clearing, grading, and paving are the major items included inthe extension of streets. Street extension in each of the cases
SIt should be noted that the construction costs for Subdivision C were esti-mated in 1968 and land purchased in 1969. The advance estimate date waspossible because the land was owned by a separate corporation in which thedeveloper had an interest. Historically, the preliminary estimate for subdivisiondevelopment by this developer closely approximated the final construction costs.
SUBDIVISION DEVELOPMENT 13

ALABAMA AGRICULTURAL EXPERIMENT STATION
TABLE 4. COMPARISON OF SEWER, STREET, AND WATER COSTS PER LOT IN ALLSUBDIVISIONS BASED ON A TOTAL OF 42 AND 31 LOTS IN A-2,
ALABAMA CASE STUDY, 19701 (ADJUSTED COSTS)
Subdivision
Cost item A-1 A-2 A-2 B C-1 C-2 Average35 42 31 49 31 33 190lots lots lots lots lots lots lotsDol. Dol. Dol. Dol. Dol. Dol. Dol.
Sewer_________________ 582 358 485 557 510 446 491Streetextension -.......... 1,163 1,067 1,446 1,097 1,306 1,144 1,155Water -............... 358 314 425 340 524 461 399Total_________________ 2,103 1,739 2,356 1,994 2,240 2,051 2,045Total cost perlot of eachdevelopment------ 4,354 3,903 5,288 4,097 5,359 5,114 4,566
1 Excludes management fees.
represented the largest physical development expense, Table 2.Adjusted costs ranged from a low of $1,067 per lot for Case A,Plat Two, to a high of $1,306 per lot for Case C, Plat One. Streetextension costs for the three remaining subdivisions were withina $65 range. The $240 difference between the high and lowcosts of street extension per lot was attributed largely to theamount of clearing and excavation necessary in the constructionof the streets.
Sewer extension consists of laying and connecting sewer pipein each development. The average cost of this improvement forall lots was $491, Table 2.
As seen in Table 2, the sewerage cost for Plats One and Twoof Subdivision A differed substantially. The difference betweenthe totals for sewer extension was attributed to two main factors.Case A, Plat Two had a comparatively low cost per lot forsewerage because 11 of the 42 lots in the development wereserved by an existing sewer. Exclusion of these 11 lots for com-putational purposes resulted in a per lot cost of $485 for sewerextensions to the remaining 31 lots, Table 4. The latter costmore accurately reflects the true cost of this development inA-2 relative to the other subdivisions.
The higher sewer costs per lot in Subdivision A-1 were partiallyattributable to physical factors. Direction of the sewage flowwas from Plat One to Plat Two; however, there was a substantialvariation in the elevation of the ground in the two plats. Thischange in elevation was such that much of the sewer for Plat
14
15
Two was relatively close to the surface of the ground, whereasin Plat One it was fairly deep-25 feet or more. The deeper sewerresulted in higher costs.
The per lot cost of water line extensions into the five develop-ments ranged from a low of $314 in Subdivision A-2 to a highof $524 in Subdivision C-1, Table 2. Average cost to the de-veloper for this service was $399.
Variations in the costs of water within and between Subdivi-sions A and B were relatively insignificant. The largest variationin price was noted in comparison of "A" and "B" with Subdivi-sion C. Part of this variation was attributed to the fact that sub-division C had some factors that made installation more difficult,thereby raising water costs.
A final more significant factor causing differences among waterline installation costs was extension of trunk lines. SubdivisionC was isolated from any existing water line facilities. Conse-quently, the developer eventually may be required to pay allor a portion of the water trunk line installation costs to connectthe city's water supply. This means an additional cost for waterservice. Therefore, the cost of water per lot in the two plats ofSubdivision C may be higher than shown in these comparisons.
Engineering. Engineering cost in each of the five cases wasfor the development of lot plat maps, utility engineering maps,and maps showing changes in elevation. Costs for this serviceranged from a low of $64 per lot in Subdivision B to a high of$179 in Plat One of Subdivision A. No specific reasons for thevariation in the costs were determined, but it was probablycaused by differences between the difficulty of the job with re-spect to each plat.
Broker's Fee. A fee for selling the individual lots was not re-ported by any of the developers. It was thought the developersold the lots himself and therefore did not record the expense.Whether a developer sells the lots or has a realtor sell them,there is an expense involved. If the developer does the workhimself, a charge should be placed on the time and trouble heexperiences. If he lists the lots with a real estate broker, hewill be charged a certain per cent of the selling price. Theprocedure followed involved assessing each lot for a broker'sfee equal to 5 per cent of the designated sales price. A 5 percent fee was commonly accepted by realtors for selling lots andseveral local realtors charged fees on this basis. The monetary
SUBDIVISION DEVELOPMENT

amount of this service is shown in Table 2. Variations in thisfee were the result of the differences between selling prices towhich the 5 per cent broker's fee was applied.
Taxes. Property taxes as a whole did not affect developmentcosts significantly. Revenue from property taxes was compara-tively low for the case study area. Low taxes meant that thecost to the developer for holding undeveloped land was a rela-tively insignificant portion of total development cost. Of thecases studied, the per lot taxes from time of purchase throughthe holding period to time of sale ranged from a low of $.34 toa high of $29.25 per lot, Appendix Tables 2-6. The weightedaverage cost for taxes over the entire study period was $15 perlot, Appendix Table 12.
Other Costs. Total costs to the developer included two rela-tively insignificant costs recording and miscellaneous. Record-ing, the listing of plats with the County Clerk, varied from $.32per lot in Case A, Plat One to $4.84 per lot in Case B. Althoughthere was a significant difference among the subdivisions withrespect to these costs they were relatively unimportant whencompared to total costs per lot.
Miscellaneous costs were not itemized by developers in CaseA. In Case B the portion of costs attributed to miscellaneousitems was approximately $48 per lot. The developer of Sub-division B explained that these costs consisted mainly of extralabor used for final cleaning of lots and keeping streets and lotsclean for early sales and other incidentals.
Subdivision C had a miscellaneous cost of $32 per lot for PlatOne and $24 per lot for Plat Two. The developers of these sub-divisions explained this was a hedge factor to help offset anycosts that possibly were overlooked in computing total costs.
Interest Cost and Return to Developer. Opportunity costs andholding costs were not included in any of the raw data furnishedby the developers. One developer indicated that money for con-struction was borrowed from a separate, personally owned cor-poration. This developer was, in effect, paying the interest tohimself. This is possible for any developer who possesses suf-ficient capital to develop a subdivision without outside financialassistance. However, an interest charge and opportunity costmust be considered to account for the possibility of alternativeuses for the money invested.
The interest charge for each of the five plats in this study was
16 ALABAMA AGRICULTURAL EXPERIMENT STATION

estimated to be 6 per cent. The actual market rate of interestwas slightly higher during the latter years of the study, but thedifference was offset by lower rates in earlier years. Interestcharges in each case were stopped in the year when it was esti-mated that a sufficient number of lots had been sold to repaythe principal amount and all accumulated interest.
Case A, Plat One. Land for Plat One was purchased in Novem-ber 1962 for $537 per lot. Over the 8-year development period,approximately $28 in real property taxes were paid on each lot.Since annual taxes were relatively small it was assumed thatfunds to pay them were borrowed at the time initial purchase ofthe land was financed, rather than on a yearly basis. In otherwords, $565 per lot was assumed borrowed January 1, 1963 topay for the land and taxes that accrued while the tract wasbeing held for development, Table 5.
After a ripening period of 3 years, development was begun.In 1965, $2,071 per lot was needed to make developmentalimprovements. The totals of the two investments along withinterest charged on the selling price of the lots is shown below.
Cost item (A-1) Amount
Estim ated sales price ........................... . $5,000Less unadjusted cost of land and improvements 2,636Net before interest 2,364Less interest charge ---- 1,086Net profit excluding broker -------------- 1,328Less broker expense ... ... .. ... .. ... ... .. ... .. 250Net returns above cash cost for development $1,078
Interest charges were a very important expense. The sig-nificance of interest was reflected in the fact that it represented26.4 per cent of the estimated total cost. Of equal significancewas the net return (above interest charges) as a per cent ofthe selling price. In this case the return was 21.6 per cent ofsales price after a 5 per cent broker fee was paid.
Lot sales in this subdivision averaged approximately $5,000each. This figure was derived from the desired gross return ex-pressed by the developer. Gross receipts for the 15.38 acres inPlat One including improvements totaled $173,273, AppendixTable 2. The average price of the 77 lots originally was esti-mated to be $4,950 per lot. However, the demand for the lotsin Subdivision A combined with the general rise in the priceof land enabled the developer to increase the sales price of thelots an average of about $50 each. Thus, the estimated sales
SUBDIVISION DEVELOPMENT 17

TABLE 5. CAPITAL BORROWED FOR LAND AND IMPROVEMENTS AND INTEREST ONCAPITAL, BY COST ITEM, FOR EACH SUBDIVISION LOT,
ALABAMA CASE STUDY, 1970 (UNADJUSTED COSTS)
SubdivisionItem
A-1 A-2 B C-1 C-2
Dol. Dol. Dol. Dol. Dol.
Cost of land and all taxes--------------- 565 594 857 1,052 1,143Improvement cost 2,071 1,714 1,985 2,3871 2,098Interest on land, taxes, andimprovements @ 6% 1,036 933 746 1,432 1,388Total 3,672 3,241 3,588 4,871 4,629Year money borrowedfor land purchase 1962 1962 1967 1970 1970Number years in loan period... 8 8 4 8 8Year money borrowedfor improvements 1965 1965 1967 1973 1973Number years in loan period.... 5 5 4 5 5
1 Improvement price was for 1969; however, work was not expected to beginuntil 1973. Full development period was based on time required to develop andamortize subdivisions A-1 and A-2.
price, Appendix Table 1, may be somewhat low when all lotsare finally sold if present trends in inflation and demand levelscontinue.
Data from Case A, Plat One were used to determine how highinterest rates could rise before the return above developmentcosts would be zero. The following illustration shows variousinterest rates and corresponding returns.
Interest rate Net return abovePer cent development costs
6 - - - - - - - - - - - -- - - - - - - - - - - - - - - - - - - - - - --- - - - - -- - $ 1,0 7 87 - - - - - - - -- - - - - - - - - - - - - - - - - - - - - - - - - - - - -- - - - - - - - -8 7 48 .- - - - - - - - --- - - -- - - - --- --- ---- --- ------------- 6 6 1
9 --- -- ------- ------- 4381 0 ----- - --- ----------------------------- -------. 2 0 41i i ....................... .....................- 4 2
Comparable charges for interest on land and improvementsfor the remaining cases are shown in Table 5.
Returns to Capital, Management, and Opportunity Cost
Return to management is a cost that a manager, or in thiscase the developer, pays to himself for work he does in develop-ing a subdivision. Return to management does not represent apayment for risk and speculation, which are high in this par-ticular endeavor. Rather, it is simply a salary for services per-formed. However, since a large amount of capital is invested
18 ALABAMA AGRICULTURAL EXPERIMENT STATION

when land is subdivided and the speculative risks of the invest-ment are high, competent management is essential. Therefore,a compensation of 10 per cent of gross income was considerednecessary to retain competent management.
Developmental costs of each subdivision and a correspondingmanagement fee of 10, per cent of gross income are shown inTable 6. The residual return after deduction of a managementfee is return to capital invested. This return represents a pay-ment for the risk involved in subdivision development.
TABLE 6. RESIDUAL RETURN TO CAPITAL ASSUMING A MANAGEMENTFEE OF 10 PER CENT, ALABAMA CASE STUDY, 1970
Cost and returnsA-1 A-2 B C-1 C-2
Dol. Dol. Dol. Dol. Dol.
Return above development cost ..... 1,078 1,509 1,164 1,779 2,021Estimated cost of management___-_ 500 500 500 700 700Return to capital 578 1,009 664 1,079 1,321
Net return to capital is often expressed as a percentage. Thisis simply the return to capital divided by the amount of capitalinvested as shown below:
Subdivision
A-1 A-2 B C-1 C-2
Return to capitalper lot, Table 6- $ 578 $1,009 $ 664 $1,079 $1,321
Capital investment ......................... 2,636 2,308 2,842 8,439 3,241Per cent return to capital 21.9 48.7 23.4 31.4 40.8
The reason A-2 had a relatively higher return is the fact that 11of its 42 lots were on existing streets that had sewer and waterfacilities. This meant a smaller capital investment and a largerreturn to capital.
Evaluating returns in Case A-2 on 31 rather than 42 lots yieldeda 26 per cent return.
Subdivision A-2
Return above development cost - _$1,097Estimated cost of management -500Return to capital --- ---- ------- --------------- -------- $ 597Per cent return to capital _-25.9
Unpublished data in the case study city revealed that at leastone owner of a large apartment complex was earning a 30 percent return to capital and management after debt service andoperating expenses were paid. When 10 per cent of gross rental
SUBDIVISION DEVELOPMENT 19

income was deducted as a cost of management, approximately15 per cent remained as a return to capital. These return levelsindicate that subdivision development may yield a higher returnto capital than apartment rental. Comparison of the returns fromone apartment complex are in no way conclusive, but in the situa-tion studied, they do indicate that subdivisions are highly com-petitive. The stability of this situation is uncertain, and severalfactors indicate a change in the future.
Opportunity cost of developing land into subdivision lots isthe difference between profit earned on lots and profits from in-vestment in another land use, for example an apartment com-plex. As shown, returns in this case study indicated the oppor-tunity cost to developer was less than the potential returns fromsubdivision development in the immediate time period.
Cost and Returns of SubdivisionDevelopment to the City
Each new household in a city brings with it a certain amountof expense as well as an additional revenue source. Hence, meas-urement of the total effect of the newly developed subdivisionrequired that problems confronting cities as well as benefits beconsidered.
The average cost for each budgeted expenditure by the citystudied was derived by allocating aggregate costs of the cityamong the total number of households. Revenue from the severalsources was handled in a similar manner.6
Preliminary census figures for 1970 showed population in thecase study city to be approximately 23,000. However, residentsfor whom services were provided totaled only 18,030. Nearly5,000 people were classified as having services provided by aState institution located in the city. The 18,030 people wereapportioned among households that approximated 3.2 personseach (8). Consequently, there were 5,634 households in the city.An estimated 2,250 households resided in multi-unit dwellingssuch as apartment houses or duplexes, many of which had cityutilities included in the house rent. Average costs and revenues
6 Costs to the city of school related items were handled through a special fundsupported by a 18 mill ad valorem tax. An additional 5 mill property tax wasassessed for special debt service. Expenditures for these items were omitted fromthis discussion. Costs and returns to city were based on the city budget for 1year only.
20 ALABAMA AGRICULTURAL EXPERIMENT STATION

for the city were derived on the basis of 5,634 households forall items except water and sewer services. City personnel in-dicated that 3,991 housing units were metered at the time ofthis study. Therefore, sewer and water costs and income perhousehold were derived using this figure.
Services provided by municipalities are quite important andservice costs are a critical part of the city budget. Distributionof the various items supported by municipal funds are shown inTable 7. If these necessary services are to be provided withoutdeficit financing, the revenue earned by the city must equal orexceed the total cost incurred. Revenue items in the city budgetwere divided into two parts. Part one included all revenue thatwas related to the addition of a new household, Table 8. Thesecond part of the revenue section was compiled from incomereceived primarily from business related interests, Table 9. Itshould be noted that although these funds are collected fromthe business sector, they are for the most part ultimately derivedfrom households. The full incidence of the various businesstaxes and licenses depends on the relative elasticities of supplyand demand for products which are taxed or licensed.
TABLE 7. DISTRIBUTION OF TOTAL AND HOUSEHOLD ANNUAL COST TO CITYBY COST ITEM, ALABAMA CASE STUDY, 1970'
Cost item Total Per household
Dol. Dol.
Fixed charges---------------------. 149,720 26.57Sanitation ( garbage collection) 202,472 35.94Police------------------------------ -- 185,357 32.90F ire .------------------------------- - 178,726 81.72Streets 118,657 21.06Parks and recreation ............. ----- 89,803 15.85Administration (mayor, recorder, attorney,
city council, and general administration) -. 87,605 15.55Planning, engineering, and inspection ------ 67,080 11.91Other (library, mosquito and
fly protection, and garage) 39,032 6.98Water - -- 176,424 44.16Sewer- - -- 143,197 35.88Total - - 1,437,391 278.47
1 Source: 1969 Annual Budget and departmental reports of the case study city.SThis total was based on the estimated percentage of cost attributed to house-
holds. The total was then divided by 3,991, the estimated number of householdsusing this service, to derive cost per household.
The item in business revenues "contribution in lieu of taxes"was an amount paid by a local State institution which normallywould not pay taxes. The institution draws heavily on the city's
SUBDIVISION DEVELOPMENT 21

22 ALABAMA AGRICULTURAL EXPERIMENT STATION
services, therefore a contribution is made to the city's generalfund. This contribution is shown in Table 9 for informationalpurposes only. The assumption was made that the contributionrepresented the exact expense of the city since specific chargescould not be separated from aggregate data. Therefore, totalrevenue generated by the business sector in 1970 was consideredin this study to be $289,000.
TABLE 8. DISTRIBUTION OF TOTAL REVENUE AND REVENUE PER HOUSEHOLD OFCASE STUDY CITY, BY SOURCE, ALABAMA CASE STUDY, 19701
Source Total Per household
Dal. Dol.Occupation tax.---------------------- 262,500 46.59Sales tax ------------------------------- 245,000 48.49G arbage ------------------------------------------------------------- 175,000 31.06Five mill ad valorem --------------------- - 93,000 16.51
Fines and forfeitures---------------------------- - 80,000 14.20Gasoline tax--------------------------- 75,000 13.31Cigarette tax--------_------------------ - 26,000 4.61
M otor vehicle ----------------------------- - 25,000 4.44Parking meter collections------------------- - 15,000 2.66
City parking facilities---------------------------- - 10,000 1.77
Other (Alabama Gas franchise, doglicenses, engineering fees, HealthDepartment, swimming pool andrecreation, cemetery, and miscellaneous)----- 28,700 5.09
w ater------------------------ 227,487 57.00Sewer
2 ----------------- - .. . 83,384 20.89
Total ------------------------ ----------- ----- 1,846,071 261.621 Source: 1970 Annual Budget of the case study city.2 Totals were based on the estimated percentage of revenue collected from
households. Total was then divided by 3,991, which was the estimated number ofhouseholds using this service.
An average revenue of $313 per household was obtained byadding income associated directly with households and incomeof a business oriented nature. Comparison of these total revenuefigures with the $278 per household expenses reflected an excessof income over expenses of $35. However, when only house-hold revenue and expense data were compared, expenses ex-ceeded revenue by $17. This deficit indicated that additionalhouseholds may not support themselves as far as the city is con-cerned. 7 However, new households should contribute to in-'This point assumes the city's fixed cost for each new residence remains con-
stant. If the number of residences is increased without additional services, sayfiremen or policemen and equipment, fixed costs of these services will be spreadover more units thereby reducing the average cost to each. Data in the casestudy were insufficient to measure the magnitude of each increment in the steppedmarginal and fixed cost schedules.
22

23
TABLE 9. DISTRIBUTION OF REVENUE FROM BUSINESS RELATED SOURCES,BY TOTAL AND HOUSEHOLDS, ALABAMA CASE STUDY, 19701
Source Total Per household
Dol. Dol.
Business licenses -245,000 43.49Contribution "in lieu of taxes"2 (68,000) (12.07)Construction permits 20,000 3.55Alabama Beverage Control tax 16,000 2.84Financial institution tax -_-------- 8,000 1.42Total 289,000 51.30
1 Source: 1969 Annual Budget of the case study city. Excludes revenue andcost of water and sewerage from business.
2 Contribution by State institution shown for information purposes only and isnot reflected in total revenue. Contribution was assumed to be an exact paymentfor services rendered.
creases in business volumes thus adding more revenue from thatsource.
Of the services listed in Table 7, it was observed that approxi-mately 45.1 per cent was provided with funds directly attributedto the households. This proportion was derived by comparinggarbage, water, and sewer fees, and property taxes, totaling $125,with the average total cost to the city for each household, $278.A further ratio of average household revenue to average house-hold cost showed that 94 per cent of the cost of each householdwas paid either directly or indirectly by the households.
Finally, revenue from households and business combined was112.4 per cent of the cost of these services provided by the city.This illustrates that in the case city additional subdivisions mustgenerate revenue from businesses in addition to household rev-enue in order to support themselves with respect to desired cityservices.
Subdivision A-1 was used to illustrate this idea as it concernsan entire subdivision. The households in this subdivision pro-vided an estimated $9,157 to the city's government in 1970. Thisestimate was derived by multiplying the number of lots in thesubdivision, 35, by the average revenue generated per house-hold, $262. On the other hand, the subdivision required $9,730from the city's resources in 1970 (average city cost per house-hold in 1970, Table 7, times the 35 lots in the subdivision). Thedeficit was made up by the revenue generated in the city's busi-ness oriented sources. Since average per household cost andrevenue to the city were used, a pattern of costs exceeding rev-enue would prevail in all five subdivisions.
SUBDIVISION DEVELOPMENT

ALABAMA AGRICULTURAL EXPERIMENT STATION
Incidence of Costs. One of the primary concerns in the de-velopment of any resource is the incidence of costs and returns;or simply stated, "who pays for the development?" As indicatedby this report there are several situations where costs are shiftedamong developers, residents of new developments, and otherresidents of established municipalities.
First are costs that are forced on a new development by thelocal municipal government (other residents of the city). In thecases studied these costs included installation of streets, sewers,and water lines. Also, developers were required to maintainthese facilities for a period of 1 year.
These costs lead into the second area of incidence. Most ofthe developmental and selling costs are in turn passed on to theultimate residents of new subdivisions by the developers. Mu-nicipalities may require developers to install and maintain facili-ties, but final selling prices of lots reflect these costs to theextent allowed by the effective demand.
Perhaps most significant are the costs forced on the local citygovernment (other city residents) by a new subdivision develop-ment. The direct revenue from subdivisions in this case studyprovided funds for approximately 45.1 per cent of the costcreated by the development. Variations in costs and revenueper household in this study were resolved by revenue generatedindirectly by households such as excise taxes and revenue fromtaxes on businesses supported by the total community.
Many public services are provided specifically for the businesssector of a community. However, the business sector is directlydependent on the residential sector for its support. Also, no dis-tinction was made by the city government regarding explicitcosts for businesses. Thus, they could not be separated fromother budgeted expenditures. All costs such as fire and policeprotection, traffic control, health inspection, etc., were allocatedto the private sector on a per household basis.
Property taxes in the State of Alabama are known to be lowrelative to other states. In this respect, it is important to showhow much better a new development could support itself if theproperty tax were administered more equitably and accordingto the legal codes. In the case study city 5 mills of each assess-ment dollar were allocated to the general fund for operation of
24

city government.8 An additional 5 mills were assessed for specialdebt retirement. The latter revenue was not considered availablefor general expenditures.
In the subdivisions of this study a lot selling for $5,000 wasassumed to have built on it a house valued at $27,500. Thisadditional improvement brought the assumed value of lot andhouse to $32,500. Application of the 20 per cent assessmentrate resulted in an assessed value for tax purposes of $6,500. With5 mills for each assessed dollar going to the general fund of thecase city, the city would receive $32.50 in property taxes annually.
Taxes assessed on this basis, plus the revenue earned fromestablished service fees, would bring the total income earneddirectly from each household to $141. The distribution of theserevenue items is shown below.
Garbage _..... ..... ..... ..... .. . $31.06W ater ------------------ --- -- . 57.00Sewer - -20.89Property tax 82.50Total _$141.45
Cost to the city for services such as fire and police protection,street lighting, and general maintenance averaged $278 perhousehold. Therefore, if residences in the new subdivisionaveraged $32,500 in value and were assessed at a 20 per centrate for property taxes, each homeowner would pay 50.8 percent of the direct cost to the city as opposed to 45.1 per centthat is paid by the average existing lot-house combination. Sup-plementary data revealed that newer houses were more fre-quently assessed at the maximum community rate than olderhomes. Hence, a new subdivision pays directly more of the costit places on the city than do average existing households. Inboth cases total cost and revenue per household differences weremade up by indirect revenue from households and businesses.
The future of city service costs and revenue sources is uncer-tain. Costs of services undoubtedly will continue to rise gen-erally with other costs. To meet these expenses without deficitfinancing, the city will have to either raise present revenues fromwater and sewer services and various income and property taxesor go to new sources. These new sources possibly include such
8 The established assessment rate in the study area was 20 per cent of the ap-praised value for tax purposes.
SUBDIVISION DEVELOPMENT 25

ALABAMA AGRICULTURAL EXPERIMENT STATION
areas as higher income taxes, property taxes, and larger auto-mobile registration fees. The public normally resents changes,especially where their money is involved. But if people continueto expect new streets, fire and police protection, garbage col-lection, and sewer and water services, they will have to providethe revenue for these services. Also, city administrators mustbecome aware of the additional expense placed on establishedresidents by new developments and take the necessary steps torelieve their problems.
SUMMARY
This study analyzed (1) the costs and returns realized by de-velopers who subdivided land for single-family residences, and(2) the impact of a new residential development on the parentcity. Five individual subdivisions were analyzed in case studies.The analysis was divided into examinations of both the privatesector and public sector to determine the incidence of costs andreturns to each.
The Private Sector. The various cost factors recognized byprivate developers were categorized and each category analyzedseparately. The average total cash cost of developing a residentiallot for all cases was $4,566, and the average sales price was$5,800.
Variations among the subdivisions with respect to specific costfactors led to a number of important observations. Land costsplayed an important part in determining final returns as well aslot selling prices. Locational differences were not of sufficientmagnitude to reflect price differences. Topographical differencescaused variation in water and sewer installation and street ex-tension. The largest single cost factor was street construction.However, interest on the developer's investment accounted for24 per cent of all costs. The latter was not considered a majorfactor by the majority of developers, yet the study indicated itssignificance.
The sum of all costs in each development was subtracted fromthe respective sale prices to determine returns to managementand capital per lot. Returns to management for services wereestablished at 10 per cent of the estimated sales price per lot.Returns on capital invested after all costs were deducted rangedfrom 22 per cent to 44 per cent. The highest return occurred in
26

Subdivision A-2 and was largely attributed to a portion of thenecessary improvements being developed previously. Exclusionof those lots already partially developed resulted in a return tocapital of 26 per cent in Subdivision A-2.
Compared with unpublished data on returns to capital in-vested in apartments, these subdivisions provided the higherreturn. However, these data were inconclusive because of thelimited number of observations.
Public Sectors. Each new household of a city brings with ita certain amount of expense as well as an additional revenuesource. The average cost for each budgeted expenditure by thecity studied was derived by allocating aggregate costs of thecity among the total number of households. Total annual costto the city for each new household averaged $278.
Revenue contributed to the city was divided into two parts-that amount directly related to the new household and thatearned indirectly through business related interests. Total rev-enue per household averaged $313, but direct payments fromhouseholds contributed only $262.
There was a definite shifting of cost incidence among de-velopers, new households, and other city residents (local gov-ernment). If residences in new subdivisions were assessed fortaxes at the prevailing rate for the entire city, total direct incometo the city accounted for 45.1 per cent of the cost per household.However, most new homes were assessed at higher levels, whichresulted in 50.8 per cent of the cost being paid by direct revenuesources.
CONCLUSIONS
The range of returns to investment in land reported in thisstudy was quite high. Future investments of a similar nature alsoappear good, particularly because of land fixity and increasingpopulations. Several observations on these types of develop-ment are important. A large amount of capital is required topurchase and improve land for home construction. Experiencewas shown to be a significant factor in the success of a developer,especially since several years normally are required to sell asufficient number of lots to repay the debts incurred in develop-ment.
As land becomes more scarce for subdivision use and the popu-lation increases, the primary housing unit possibly will shift from
SUBDIVISION DEVELOPMENT 27

28 ALABAMA AGRICULTURAL EXPERIMENT STATION
the single family residence to a multifamily unit. Apartments,condominiums, and modular housing units require considerablyless land than single-family units. They are also conducive tothe mobile society of today since residents are not tied to a fixedlocation as they are with single family home ownership. This isnot to say that apartments, condominiums, and modular housingunits do not have their disadvantages. However, they are moreadaptable to the large housing demand now being experiencedand that will probably continue for some time to come. Thus,while returns to private residential subdivisions are quite at-tractive at present, several important factors indicate a gradualbut significant shift in future housing patterns. These shifts un-doubtedly will occur much slower in the smaller communitiessuch as the one discussed here because of less congestion anddemands for land. Yet, the change does appear inevitable.

S29
LITERATURE CITED
(1) ANONYMOUS. 1963. Economic Abstract of Alabama. Bureau of Re-search, School of Commerce and Business Administration. Univ. ofAla., Tuscaloosa.
(2) ANONYMOUS. 1963. Land for Living. Lower Mainland Regional Plan-ning Board of British Columbia. New Westminister, B.C.
(3) BAHL, ROY W., JR. 1963. A Bluegrass Leapfrog. Bureau of BusinessResearch, College of Commerce. Univ. of Ky., Lexington.
(4) MAISEL, SHERMAN J. 1963. Land Costs for Single-Family Housing,California Housing Studies. Center for Planning and DevelopmentResearch. Univ. of Calif., Berkeley.
(5) SCHMID, A. ALLEN. 1968. Converting Land From Rural to UrbanUses. Johns Hopkins Press. Baltimore, Md.
(6) SUMECHRART, MICHAEL, DONALD J. SPEAR, AND SARA FRANKEL. 1969.Cost of Financing Doubled in 20 Years; Profits Fell. J. Home Building.
(7) U.S. DEPARTMENT OF COMMERCE, BUREAU OF THE CENSUS. UnitedStates Census of Population: 1960. Alabama Urban Places. Vol. II.p. 42.
(8) U.S. DEPARTMENT OF COMMERCE, BUREAU OF THE CENSUS. United
States Census of Population: 1960 and 1970. Alabama Urban Places- General Population Characteristics. Vol. II. p. 50.
SUBDIVISION DEVELOPMENT

APPENDIXAPPENDIX TABLE 1. CHANGE IN POPULATION FOR ALABAMA AND
CASE STUDY CITY, SELECTED YEARS'
Alabama Change from Change fromYear population previous Case cityYear population prcensious population previous
No. Pct. No. Pct.
1940 2,832,961 7.1 4,652 66.11950 3,061,743 8.1 12,939 178.11960 3,266,740 6.7 16,261 25.71970 3,444,165 5.4 22,767 40.0
1U.S. Department of Commerce, Bureau of the Census, United States Censusof Populations: 1960 and 1970. Number of Inhabitants, Alabama.
APPENDIX TABLE 2. DISTRIBUTION OF DEVELOPER'S UNADJUSTED CASH COSTPER ACRE, AND PER LOT, SUBDIVISION A, PLAT 1, ALABAMA CASE STUDY, 1970
Cost item2 Total Per acre Per lot
Dol. Dol. Dol.
Land 18,812.35 1,223.17 537.50Taxes 964.643 62.72 27.56Sewer _18,498.91 1,202.79 528.54Street extension....... 36,930.33 2,401.19 1,055.15W ater_..........__... 11,361.49 738.72 324.61Engineering 5,700.34 370.63 162.87Recording 11.20 .73 .32Total _ 92,279.26 5,999.95 2,636.55Sales price4 173,272.70 11,266.11 4,950.65Profit before interest,broker fee, andmanagement fee ...... 80,993.44 5,266.16 2,314.10
'This table excludes management, interest, and broker charges, which arediscussed in a separate subsection in the text.
2 Land cost was incurred in 1962, improvement cost in 1965.'Tax figure is total cash tax cost for years 1963-1970, years developer hadpossession of land.
SEstimated.
30 ALABAMA AGRICULTURAL EXPERIMENT STATION

SUBDIVISION DEVELOPMET3
APPENDIX TABLE 3. DISTRIBUTION OF DEVELOPERS UNADJUSTED CASH COST BYTOTAL PER ACRE AND PER LOT, SUBDIVISION A, PLAT 2,
ALABAMA CASE STUDY, 19701
Cost item Total Per acre Per lot
Dol. Dol. Dol.Land________________________________ 24,463.40 1,223.17 582.46Taxes ---------------------- _-------- 467.203 23.36 11.12
Sewer_________________________________ 13,641.74 682.08 324.80Street extension_______________ 40,677.00 2,033.85 968.50Water__________________________ 11,966.55 598.33 284.92Engineering ___________________ 5,689.97 284.50 135.47Recording_________________________ 12.00 .60 .29Total____ _________________- -______ 96,917.86 4,845.89 2,307.56Sales price4________________________ 207,927.30 10,396.36 4,950.65Profit before interest,broker fee, andmanagement fee____________ 111,009.44 5,550.47 2,643.09
1 This table excludes management, interest, and broker charges, which are dis-cussed in a separate subsection in the text.
2 Land cost was incurred in 1962, improvement cost in 1965.3Tax figure is total cash tax cost for years 1963-1970, years developer had
possession of land.Estimated.
APPENDIX TABLE 4. DISTRIBUTION OF DEVELOPERS UNADJUSTED CASH COST BYTOTAL PER ACRE AND PER LOT, SUBDIVISION B, ALABAMA CASE STUDY, 19701
Cost item Total Per acre Per lot
Dol. Dol. Dol.
Land2 ------ ------- _-------- 42,000.00 1,660.08 857.14
Taxes ------------------------- -13.34 .53 .27Sewer_________________ 25,514.02 1,008.46 520.69Street extension 50,645.53 2,001.80 1,033.58Water 15,670.84 619.40 319.81Engineering___________ 2,968.53 117.33 60.58Recording_________________ _ 223.35 8.83 4.56Miscellaneous__________ 2,232.79 88.25 45.57Total ----------------- 139,268.40 5,504.68 2,842.20
Sales price4------------- 171,500.00 6,778.66 3,500.00
Profit before interest,broker fee, andmanagement fee________ 32,231.60 1,273.98 657.80
' This table excludes management, interest, and broker charges which are dis-cussed in a separate subsection in the text.
2 All cost incurred in 1967.
Tax figure is total cash tax cost for years 1967-1970, years developer had pos-session of land.
-Estimated.
SUBDIVISION DEVELOPMENT 31
c

32 A LABAMA AGRICULTURLEPIMN ST IO
APPENDIX TABLE 5. DISTRIBUTON OF DEVELOPERS UNADJUSTED CASH COST BYTOTAL PEuI ACRE AND PER LoT, SUBDIVISION C, PLAT 1,
ALABAMA CASE STUDY, 19701
Cost item Total Per acre Per lotDol. Dol. Dol.
Land2_________________________________ 32,000.00 2,000.00 1,082.26Taxes ----------- _------------------- 616.003 38.50 19.87Sewer____________________________ 15,260.00 953.75 492.26Street extension_______________ 39,060.00 2,441.25 1,260.00Water_________________________________ 15,680.00 980.00 505.81Engineering____------------------ 2,991.50 186.97 96.50Recording -------------------------- 38.00 2.38 1.23Miscellaneous____________________ 970.50 60.60 31.81Total__________________________________ 106,616.00 6,663.51 3,439.24Sales price4 ------ -------------- 155,000.00 9,687.51 5,000.00Profit before interest,broker fee, andmanagement fee_________ 48,384.00 ,024.00 1,560.76
1 This table excludes management, interest, and broker cbarges which are dis-cussed in a separate subsection in the text.
2 Land cost was incurred in 1969; improvements estimated for 1973.' Tax figure is total cash tax cost for years 1970-77, approximate length of time
needed to develop and sell lots.Estimated.
APPENDIX TABLE 6. DISTRIBUTION OF DEVELOPERS UNADJUSTED CASH COST BYTOTAL PER ACRE AND PER LOT, SUBDIVISION C, PLAT 2,
ALABAMA CASE STUDY, 19701
Cost item Total Per acre Per lotDol. Dol. Dol.
Land2--------- ,-------- 37,000.00 2,000.00 1,121.21Taxes_________________ 718.363 38.56 21.62Sewer_________________ 14,199.50 767.54 430.29Street extension 8-------- 6,423.45 1,968.84 1,103.74W ater__________;______ 14,619.00 790.22 443.00Engineering------------ 3,184.50 172.14 96.50Recording_____________ 39.75 2.15 1.20Miscellaneous__________ 775.75 41.93 23.51Total----------------- 106,955.31 5,781.38 3,241.07
Sales price4------------- 165,000.00 8,918.92 5,000.00
Profit before interest,broker fee, andmanagement fee -------- 49,044.69 3,137.54 1,758.93
1This table excludes management, interest, and broker charges which are dis-cussed in a separate subsection in the text.
2 Land cost was incurred in 1969; improvements estimated for 1973.3Tax figure is total cash tax cost, for years 1970J-1977, approximate length of
time needed to develop and sell lots.4Estimated.
32 ALABAMA AGRICULTURAL EXPERIMENT STATION

SUBDIVISION DEVELOPM(ENT 3
APPENDIX TABLE 7. COST OF DEVELOPMENT PER LOT AND TOTAL BY SELECTEDCOST FACTORS, CASE STUDY A, PLAT 1, ALABAMA, 1970
Cost factor Actual Cost adjusted Total 1970cost 1965 to 1970 level cost all lots
Dol. Dol. Dol.
Land __________________________________ 537.501 756.83 26,471.55Taxes ------- --------------------------- 27.562 29.253 1,023.76
Sewer_______________________________ 528.54 582.47 20,386.45Street extension___________ 1,055.15 1,162.81 40,698.35Water_________________________________ 324.61 357.73 12,520.55Engineering______________________ 162.87 179.49 6,282.15Recording __________________________ .32 .35 12.25Interest----------------__ 1,036.00 36,260.00Broker fee---_____________ 250.00 8,750.00Total4 ______________________________ 2,636.55 4,354.43 152,405.06
'Land was purchased in 1962 and adjusted to 1970 at 5 per cent annually.2 Average yearly tax from 1963 through 1970.'Taxes compounded to 1970 based on wholesale price index for year each tax
was incurred.'Excludes management fee.
APPENDIX TABLE 8. COST OF DEVELOPMENT PER LOT AND TOTAL BY SELECTEDCOST FACTORS, CASE STUDY A, PLAT 2, ALABAMA, 1970
Cost factor Actualcost 1965
Cost adjustedto 1970 level
Total 1970cost all lots
Dot. Dot. Dot.Land_____________________________ __ 582.461 819.58 34,422.86Taxes-------------- 11.122 11.803 495.60Sewer_________________ 324.80 357.95 15,033.90Street extension________ 968.50 1,067.32. 44,827.44W ater----------------- 284.92 318.99 18,187.58Engineering 135.47 149.29 6,270.18Recording_____________ .29 .82 13.44Interest 933.00 39,186.00Broker fee--------------__ 250.00 10,500.00Total 4 ________________ 2,307.56 3,903.25 163,936.50
1 Land was purchased in 1962 and adjusted to 1970 at 5 per cent annually.2 Average yearly tax from 1963 to 1970.'Taxes compounded to 1970 based on wholesale price index for year each tax
was1 incurred.'Excludes management fee.
SUBDIVISION DEVELOPMENT 33

34 ALABAA AGRICULTURLEPIMN STIO
APPENDIX TABLE 9. COST OF DEVELOPMENT PER LOT AND TOTAL BY SELECTEDCOST FACTORS, CASE STUDY B, ALABAMA, 1970
Cost factor Actual Cost adjusted Total 1970Cost 1967 to 1970 level cost all lots
Dol. Dol. Dol.Land ---------------------------------- 857.141 1,032.01 50,568.49Taxes ------------------- ----- - .272.34316.66Sewer ------------------------------- 520.69 556.62 27,274.38Street extension --------------- 1,003.58 1,097.46 53,775.54W ater ----------- ------------------- 319.81 339.58 16,639.42Engineering ---------------------- 60.58 64.32 3,151.68Recording ------------------------- 4.56 4.84 237.16Miscellaneous ----------------- 45.57 48.39 2,371.11Interest -----------_------- 744.00 36,456.00Broker fee------------_- 250.00 12,250.00Total4 ----------- --- _-------------- 2,842.20 4,137.56 202,740.44
1 Land was purchased in 1966 and adjusted to 1970 at 5 per cent annually.'Average yearly taxes from 1967 through 1970.'Taxes compounded to 1970 based on wholesale price index for each year taxwas incurred.'Excludes management fee.
APPENDIX TABLE 10. COST OF DEVELOPMENT PER LOT AND TOTAL BY SELECTEDCOST FACTORS, CASE STUDY C, PLAT 1, ALABAMA, 1970
Cost factor Actual Cost adjusted Total 1970cost 1969 to 1970 level cost all lots
Dol. Dol. Dol.Land'-------- --------- 1,032.26 1,083.87 33,600.00Taxes'-----------------. 19.87 19.87 616.00Sewer ---- -_--------- 492.26 510.25 15,817.75Street extension________ 1,260.00 1,306.07 40,448.17W ater------------- --- 505.81 524.30 16,253.30Engineering ------------ 96.50 100.03 3,100.93Recording------------- 1.23 1.27 39.37Miscellaneous----------- 31.31 32.46 1,006.26Interest-----------------_ 1,431.96 44,390.76Broker fee----_--------__ 350.00 10, 850.00Total'----------------- 3,439.24 5,360.08 166,162.54
1 Land adjusted on basis of 5 per cent increase in value annually.2'Tax figure represents the sum of the next 8 years taxes at present rate; 8 years
was approximate length of time of development and sale of lots.' Excludes management fee.
34 ALABAMA AGRICULTURAL EXPERIMENT STATION

SUBDIVISION DEVELPENT 3
APPENDIX TABLE 11. COST OF DEVELOPMENT PER LOT AND TOTAL BY SELECTEDCOST FACTORS, CASE STUDY C, PLAT 2, ALABAMA, 1970
Actual Cost adjusted Total 1970cost 1969 to 1970 level cost all lots
Dol. Dol. Dol.
Land1------------------------------- 1,121.21 1,177.27 38,849.91Taxes2
---------------- 21.62 21.62 713.46Sew er--------------------------------- 430.29 446.02 14,718.66Street--------------------------------- 1,103.74 1,144.09 37,754.97W ater----------------------- 443.00 461.09 15,215.97Engineering .-------------------- 96.50 100.03 3,300.99Recording .------------------------ 1.20 1.25 41.25Miscellaneous ----------------- 23.51 24.37 804.21Interest --------------------------- -- 1,388.00 45,804.00Broker fee------------------------- ---- 350.00 11,550.00
Total3 --------------------------------- 3,241.07 5,113.74 168,753.42
Land adjusted on basis of 5 per cent increase in value annually.Tax figure represents the sum of the next 8 years taxes at present rate; 8 years
was approximate length of time of development and sale of lots.: Excludes management fee.
APPENDIX TABLE 12. AVERAGE TOTAL COST OF DEVELOPMENT FOR ALL CASESSTUDIED, BY DEVELOPMENT, ALABAMA CASE STUDY, 1970'
CaeNumber Total cost forCaeof lots each case
Dol.
Subdivision A, Plat 1------------------- 35 152,405.06Subdivision A, Plat 2 _-------------_--- 42 163,936.50Subdivision B -------------------------- 49 202,740.44Subdivision C, Plat 1------------------- 31 166,162.54Subdivision C, Plat 2------------------- 33 168,753.42T otal.------------------------------- -- 190 853,997.96Av. total cost per lot'------------------. 4,494.73
tAll figures adjusted to 1970 with the exception of taxes in Plat 1 and 2 ofSubdivision C in which estimated total taxes during the development period wereused.2Ex~cludes management fee.
SUBDIVISION DEVELOPMENT 35

APPENDIX TABLE 13. T6cTAL AND AVERAGE COST PER LOT BY EACH COST ITEMIN CASE STUDY, ALABAMA CASE STUDY, 19701
Cost item' Total Average________________ cost per lot
Dol. Dol.Land---------------------- 183,912.31 967.96Sew er--------------------------------------------- 93,231.14 490.69Street extension _______________________________ 177W ater-------------------- 73,816.82 388.51Engineering ------------------------- 22,105.93 116.35Recording .---------------------------- 343.47 1.81T axes --------------------------------- 2,865.48 15.08M iscellaneous -------------------------- 4,181.58 22.01Interest----------------------------- --- 202,096.76 1,063.67Broker fee----------------------------- 53,900.00 283.68Total ---- --------------------------- -- 853,997.96 4,494.73
1 All figures adjusted to 1970 with the exception of taxes in Plats 1 and 2 ofSuhdivision C, which used total annual cost.2 Excludes management fee.