costs of air transport delay in europe final … · cost of air transport delay in europe 1...
TRANSCRIPT
Cost of air transport delay in Europe
Institut du Transport Aérien1
COSTS OF AIR TRANSPORT DELAYIN EUROPE
Final report
November 2000

Cost of air transport delay in Europe
Institut du Transport Aérien2
TABLE OF CONTENTS
INTRODUCTION......................................................................................................................3Main results ............................................................................................................................3
PART I: Method .........................................................................................................................5I.1. Theoretical background....................................................................................................5I.2. ITA’s approach.................................................................................................................6
I.2.1 Involved economic activities and individuals ............................................................7I.2.2. Nature of delays ........................................................................................................9q Delay concepts........................................................................................................9q Delay types .............................................................................................................9
PART II: Evaluation of economic consequences .....................................................................13II.1. Operated flights versus schedule costs .........................................................................13
II.1.1. Costs for airlines ....................................................................................................13q Previous studies ....................................................................................................13q ITA’s study...........................................................................................................15
II.1.2. Costs for users........................................................................................................18q Previous studies ....................................................................................................19q ITA’s study...........................................................................................................19
II.2.3. Costs for the community........................................................................................20II.2. Schedule versus optimum costs ....................................................................................22
II.2.1. Costs for airlines ....................................................................................................22q Previous studies ....................................................................................................22q ITA’s study...........................................................................................................22
II.2.2. Costs for users........................................................................................................23q Previous studies ....................................................................................................23q ITA’s study...........................................................................................................24
II.2.3. Costs for the community........................................................................................24CONCLUSION ........................................................................................................................25
General results ......................................................................................................................25Sensitivity analysis ...............................................................................................................27Further investigation.............................................................................................................30
ANNEXES
1. Definitions and acronyms2. Detailed costs “optimum versus schedule” and “operated flights versus schedule”3. Definitions of IATA & ICAO cost items4. Value of time for passengers5. Environmental costs
Cost of air transport delay in Europe
Institut du Transport Aérien3
INTRODUCTION
Air transport delays in Europe are a major concern for the industry and a relentless source ofcomplaints from the passengers, as often verified in the media.
Not only is it a painful inconvenience for the actors, but delays also induce large costs, for theairlines, their customers and the community as a whole.
Air transport delay is a very complex phenomenon and needs investigations for a betterappraisal of the various costs involved, as well as the information needed to analyse andevaluate them.
The aim of this study, which is sponsored by the EUROCONTROL Performance Review Unit(PRU), is to improve the understanding of the various aspects of air transport delay costs andto assess unit costs of the various types of delays that occur airborne or on ground.
Main results
The study shows that annual overall costs for airlines and passengers could be estimatedbetween EUR6.6 and EUR11.5 billion for1 1999 with a corresponding average unit cost perminute of delay ranging from EUR39.4 - EUR48.6 for the airlines, and EUR 46.6 - EUR60incurred by passengers, respectively2. In this evaluation, the costs burden for airlines (fromEUR3.0 to EUR5.1 billion) as a whole, seem to be somewhat lower than the cost burden forthe passengers (from EUR3.6 to EUR6.4 billion).
Primary and reactionary delays do not have the same impact on costs, as illustrated in thefollowing table.
Scheduled Flights DistributionAirline unit
costsPassengersunit costs
Total
ATFM primary delays 60% 40-66 47-60 87-126
Reactionary delay 40% 28 47-60 75-88
NB. Those figures correspond to the actually observed delays encountered by airlines in the course of theiroperations
The results of the study suggest that the costs impact of a primary delay is higher than the costimpact of an induced (reactionary) delay, all else equal. Assuming that each minute ofprimary delay generates 2/3 minutes of reactionary delay, the total airline unit cost per minuteof ATFM delay ranges from around EUR 59 to EUR85 for each minute of primary delay.
1 Arguably an atypical year due to the Kosovo crisis.2 Those figures refer to scheduled traffic only (around 65% of total European traffic).

Cost of air transport delay in Europe
Institut du Transport Aérien4
As far as the costs for airlines are concerned, passenger related costs constitute by far the mostimportant costs (between 50 and 70% of total airline costs), as airline costs are highly linkedto their commercial concern for passengers.
This study presents two aspects: the identification of the different types of delays from aconceptual viewpoint (part I), followed by an evaluation of their economic consequences onvarious cost items (part II).

Cost of air transport delay in Europe
Institut du Transport Aérien5
PART I: METHOD
I.1. Theoretical background
Delay cost calculations usually involve the application of a cost factor based on reportedvalues for the average direct aircraft operating costs per time unit to quantities of delay. Theapproach to delay cost estimation is based on strong assumptions that are rarely scrutinised oreven acknowledged:• The cost of delay is an additive function of the cost of individual delay events;• The cost of each delay event is a linear function of the duration of the delay.
Such an assumption ignores the possibility that delay cost is non-linearly related to duration,as illustrated by the figure 1. A sixty minutes delay is likely to be more costly than 60 timesone minute of delay. The sixty minutes delay is more likely to disrupt ground operations, gateassignments, crew schedules, and passenger itineraries. It is also possible that the unit cost ofdelay decreases beyond a certain duration (as depicted in the figure 1) because airlines takedifferent measures in order to minimise the overall impact of delay (e.g. cancel the flight).Additionally, such assumptions ignore the possibility that the cost of 30 minutes of primarydelay due to a lack of ATC capacity might be very different than the cost of 30 minutes ofreactionary (secondary) delay due to late arrival of the aircraft. .
Figure 1: Cost of delay per minute distribution
0 10 20 30 40 50 60 70 80 90
Cost per minute of delay
Delay duration in minutes
Cu = f(D)
Delay costs are also subject to combinatorial effects3. The severity of the impacts is likely todepend not only on the duration of delay to a specific flight but also on the interaction ofdelays for many flights. This is particularly relevant in the era of extensive hubbing. Finally,the cost of delay also depends on the nature of the airline (short-haul vs long-haul, schedule vscharter, etc) and on its adaptation behaviour. Carriers may take a variety of measures to maketheir operations less sensitive to delay. For example, they include a buffer into their schedule,they plan for extra aircraft, flight crew and ground personnel. While these measures decreasethe cost of delays when they occur, they also increase costs of day-to-day operations.
3 This section heavily draws on Hansen, Gillen and Djafarian-Tehrani paper in Transportation Research Part E(2000).

Cost of air transport delay in Europe
Institut du Transport Aérien6
Figure 1b: Cost of delay for airlines
Cost of a delayC = f(D) x D
Delay duration
D
Figure 2: Marginal cost and marginal benefit
Marginal costMarginal benefit
Marginal cost
Marginal benefit
Duration of delay
From a theoretical point of view, society should put resources (and direct investments) up to apoint where the marginal cost to reduce delay equals the marginal benefit from a reduction ofdelay. The economic optimum does not necessarily require that delays should be reduced tozero (as it is shown in the figure above).
I.2. ITA’s approach
Our approach is based on a cross-analysis according to:• the concerned economic activities and individuals, and• the nature of delay.
Cost of air transport delay in Europe
Institut du Transport Aérien7
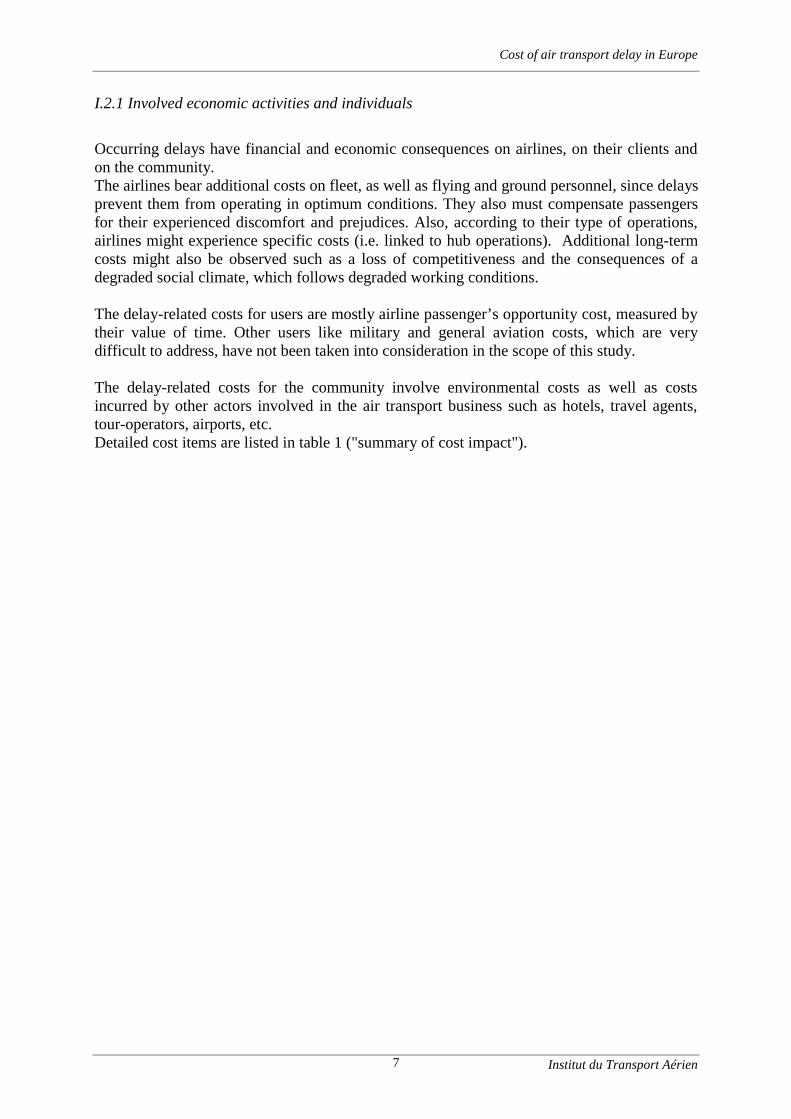
I.2.1 Involved economic activities and individuals
Occurring delays have financial and economic consequences on airlines, on their clients andon the community.The airlines bear additional costs on fleet, as well as flying and ground personnel, since delaysprevent them from operating in optimum conditions. They also must compensate passengersfor their experienced discomfort and prejudices. Also, according to their type of operations,airlines might experience specific costs (i.e. linked to hub operations). Additional long-termcosts might also be observed such as a loss of competitiveness and the consequences of adegraded social climate, which follows degraded working conditions.
The delay-related costs for users are mostly airline passenger’s opportunity cost, measured bytheir value of time. Other users like military and general aviation costs, which are verydifficult to address, have not been taken into consideration in the scope of this study.
The delay-related costs for the community involve environmental costs as well as costsincurred by other actors involved in the air transport business such as hotels, travel agents,tour-operators, airports, etc.Detailed cost items are listed in table 1 ("summary of cost impact").
Cost of air transport delay in Europe
Institut du Transport Aérien8
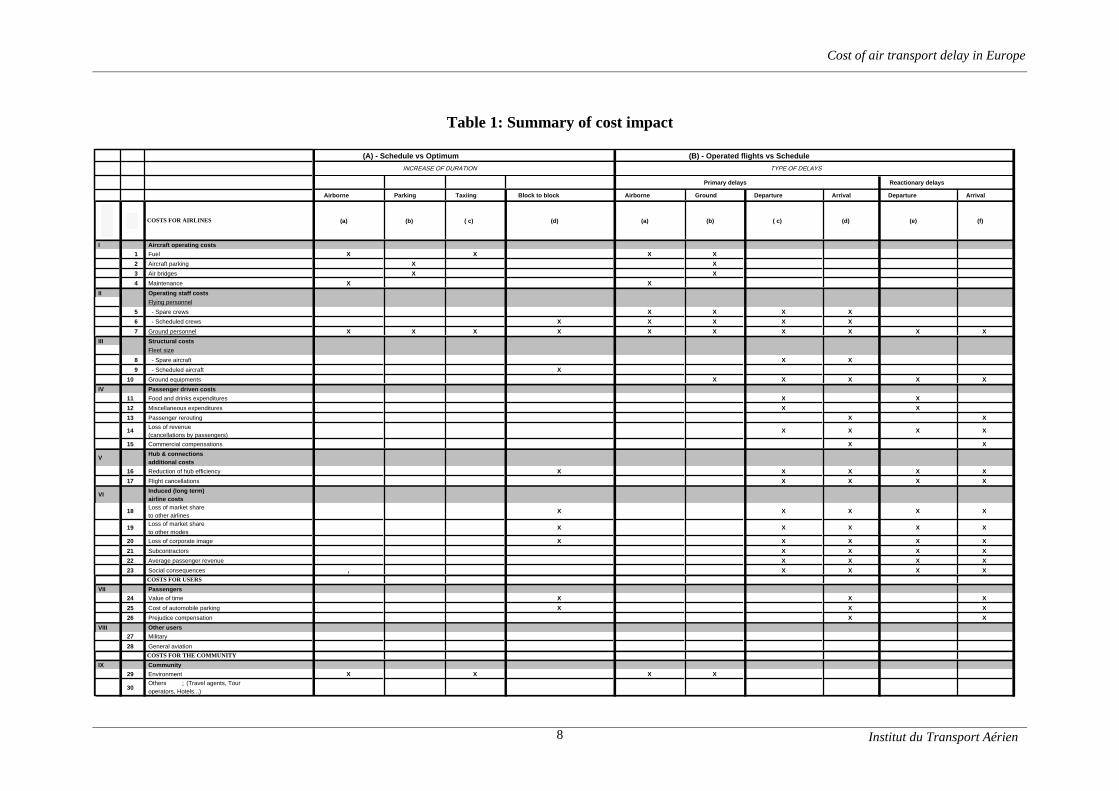
Table 1: Summary of cost impact
Airborne Parking Taxiing Block to block Airborne Ground Departure Arrival Departure Arrival
Cat
ego
ry
COSTS FOR AIRLINES (a) (b) ( c) (d) (a) (b) ( c) (d) (e) (f)
I Aircraft operating costs
1 Fuel X X X X
2 Aircraft parking X X
3 Air bridges X X
4 Maintenance X X
II Operating staff costsFlying personnel
5 - Spare crews X X X X
6 - Scheduled crews X X X X X
7 Ground personnel X X X X X X X X X X
III Structural costsFleet size
8 - Spare aircraft X X
9 - Scheduled aircraft X
10 Ground equipments X X X X X
IV Passenger driven costs
11 Food and drinks expenditures X X
12 Miscellaneous expenditures X X
13 Passenger rerouting X X
14Loss of revenue (cancellations by passengers)
X X X X
15 Commercial compensations X X
VHub & connections additional costs
16 Reduction of hub efficiency X X X X X
17 Flight cancellations X X X X
VIInduced (long term) airline costs
18Loss of market shareto other airlines
X X X X X
19Loss of market shareto other modes
X X X X X
20 Loss of corporate image X X X X X
21 Subcontractors X X X X
22 Average passenger revenue X X X X
23 Social consequences , X X X X
COSTS FOR USERS
VII Passengers24 Value of time X X X
25 Cost of automobile parking X X X
26 Prejudice compensation X X
VIII Other users27 Military
28 General aviation
COSTS FOR THE COMMUNITY
IX Community
29 Environment X X X X
30Others : (Travel agents, Tour operators, Hotels...)
TYPE OF DELAYSINCREASE OF DURATION
(B) - Operated flights vs Schedule
Primary delays
(A) - Schedule vs Optimum
Reactionary delays

Cost of air transport delay in Europe
9
This table is organised along the following lines, for each identified cost items (horizontal),the vertical axis identifies the nature of delays (see below) -“schedule versus optimum” and“operated flight versus schedule”, primary, reactionary, airborne and ground delays. Where,there is an identified impact, this is indicated with an X in the corresponding box. Forexample, commercial compensations costs occur only for arrival delays under the “operatedflight versus schedule” concept.
I.2.2. Nature of delays
In this section we would like to introduce some important concepts or definitions4 that will beused throughout this study.
q Delay concepts
In general, the estimation of the cost impact of air transport delay is based on the comparisonbetween overall costs due to delayed operations (referred to here as “operated flights”) andon-time operations as a reference (referred to here as “schedule”) and will be referred to“operated flights versus schedule” costs.
But one might also consider costs derived from sub-optimal operations. In fact, theeverlasting air congestion in Europe is a phenomenon, which has to be taken into account byairlines in the planning process
Indeed, air transport delays encountered in Europe are to some degree taken into account byairlines when they establish schedules for the next (e.g. IATA season) operating period.Published schedules generally incorporate a buffer, which is added to the planned flight timein order to accommodate statistically foreseeable delays. This leads airlines to increase thenumber of aircraft and crews they need and, consequently, the costs of operations. Therefore,corresponding costs should be identified, by comparing the actual schedules against “ideal”ones.
Within the scope of the study, this concept will be referred to as “schedule versus optimum”costs.
q Delay types
Within those two concepts, different types of delays have to be identified and measured, dueto the specific impact they might have on the above-mentioned cost items (see table 1:summary of cost impact).
Delays can occur during the different phases of a flight: when the aircraft is airborne, taxingor parked on the apron. Block to block delays might also be taken into consideration.Specifically for operated flights versus schedule, one also has to consider another delay typebreakdown, whether delays are primary delays (airborne/ground, departure/arrival) orreactionary delays (departure/arrival).Primary delays correspond to initial delay caused to a given flight. They are classifiedaccording to delay causes: passenger and baggage, cargo and mail, aircraft and ramp
4 See also definitions and acronyms in annex 1

Cost of air transport delay in Europe
10
handling, technical and aircraft equipment, damage to aircraft, flight operations and crewing,weather, airport and governmental authorities (including ATC). Late arrivals of connectingflight, connecting passengers, baggage, load or crewmembers are not to be included inprimary delay causes. Later on, only ATFM delays will be considered for the purpose of thestudy.
Reactionary delays correspond to delays due to the late arrival of aircraft delayed during itsprevious leg operation, late arrival of a connecting flight, passengers or load, and late arrivalof crew members, expected from another flight.
One could note here that reactionary delays occur following primary delays and if the latterwould be reduced, the former would also diminish consequently. Initial (primary) delaycould indeed cause disturbances along the day, due to rather tight normal operating schedules,established to achieve economic efficiency, resulting in reactionary delays.
The relative shares of primary delays and reactionary delays are illustrated in figure 3 using1999 data.
Figure 3 - Departure delay causes in 1999
50%Non-ATM
Delay
50%ATMDelay
21%Non-ATM
21%ATM
Reactionary Delay
Primary Delay
11%Airline
6% O
ther
Airp
ort
(non
AT
M it
ems)
12%
4% A
TM
gro
und
25%ATFM
29%Non ATM
related
29%ATM
related
Source: CODA & PRR 3
Because the costs impacts are different, there is a strong rationale for having this dichotomybetween primary and induced (reactionary) delays. It is interesting to note that airlines are insome cases willing to take extreme operational measures in order to avoid, or minimise theimpact of reactionary delays (like cancelling one or more waves in case of severe huboperation disturbance).

Cost of air transport delay in Europe
11
For a thorough cost assessment on a flight-by-flight basis, measuring delays is a difficultmatter, since they have to be broken down according to the above-mentioned classificationand would require very detailed delay statistics identifying for each flight:• origin and destination,• original schedule,• actual time for each phase of flight (parking, taxiing towards take-off, airborne, and
taxiing after touch down),• name of operating airline, and• type of aircraft.
The different elements, which constitute the various types of delays, are shown in figure 4.
Figure 4: Air transport delay and punctuality
Flight schedule
Actual
Arrival delay
Buffer
Taxi Out Airborne Taxi In
Take off Landing
Departuredelay
DelaySchedule
Unconstrained flight
Out Off InOn
“The figure compares the flight schedule and actual flight, and shows how a delay in thedifferent phases (departure, taxi-out, en-route, taxi-in) affect arrival punctuality. Publishedairline schedules generally incorporate a buffer, which is added to the planned flight time, inorder to accommodate statistically foreseeable delays. When accumulated delays exceed thebuffer, arrival delays occur. Delays and buffer are linked by the following formula5:Arrival delay = Departure delay + taxi-out delay + airborne delay + taxi-in delay – buffer.”
Information on schedule and actual flight times are needed to measure all types of delay. Mostwill be available through ACARS (Aircraft Communication Addressing and ReportingSystem) source. Nevertheless, some will still be missing. They are identified in the followingtable.
5 Source: EUROCONTROL PRC – PRR3- May 2000 p.9.

Cost of air transport delay in Europe
Institut du Transport Aérien12
Table 2: Needed information to estimate airborne and ground delays breakdown
)/,*+7�7,0( %/2&.�7,0(
7LPH 'XUDWLRQ 7LPH 7LPH 7LPH 'XUDWLRQ 7LPH 'XUDWLRQ 'XUDWLRQ
%/2&. 7$;,�2)) 7$.(�2)) (67��$55��7,0( 728&+�'2:1 7$;,�,1 %/2&. 9$/8( 9$/8(
6&+('8/(' 67' 62))���67' 62)) 621 67$���621 67$ 621���62)) 67$���67'�
$&78$/ 287 72))� �2))�287 2)) (7$ 21 7,1� �,1�21 ,1 )7,0�� �21�2)) %7,0� �,1�287
'(/$<6 287���67' 72))�����62))���67'� 2))���62)) 21����621 7,1����67$��621� ,1���67$ )7,0����621���62))�� %7,0����67$�67'�
RX�21���(7$�
67' VFKHGXOHG�WLPH�RI�GHSDUWXUH67$ VFKHGXOHG�WLPH�RI�DUULYDO62)) VFKHGXOHG�WLPH�RI�WDNH�RII621 VFKHGXOHG�WLPH�RI�WRXFK�GRZQ287 DFWXDO�WLPH�RI�GHSDUWXUH2)) DFWXDO�WLPH�RI�WDNH�RII(7$ HVWLPDWHG�WLPH�RI�DUULYDO21 DFWXDO�WLPH�RI�WRXFK�GRZQ,1 DFWXDO�WLPH�RI�DUULYDO72)) WD[L�RII�GXUDWLRQ7,1 WD[L�LQ�GXUDWLRQ)7,0 DFWXDO�IOLJKW�WLPH�%7,0 DFWXDO�EORFN�WLPH
0LVVLQJ�HOHPHQWV
'(3$5785( $55,9$/

Cost of air transport delay in Europe
13
As noted earlier, delays can have different causes (ATFM, airport operations, aircrafttechnical problems, weather, etc.). For the purpose of this study, though, we will focus ourattention on the economic evaluation of the ATFM related delays.
Overall comprehensive delay cost evaluation would require knowledge of each marked boxcontent (duration of ATFM delays and unit costs).
Analysis of delay costs will, in particular, require gathering information from airlines in orderto know how:• they take into account delays in setting up flight schedules,• they react to delays in modifying operation patterns, or in putting spare aircraft and crews
into service,• they determine the size of their fleet (including spare aircraft) and flying personnel (also
including spare crews),• they evaluate the cost related to passengers treatment (including additional spending and
commercial compensations), and• they value the impact of delays on various commercial issues like market share, modal
split, average revenue, and increased costs for subcontractors, etc.
PART II: EVALUATION OF ECONOMIC CONSEQUENCES
II.1. Operated flights versus schedule costs
II.1.1. Costs for airlines
q Previous studies
Although there is some literature on assessing delay costs (especially in the US FAA), theassessment of delay costs has not been conducted in a fully comprehensive and systematicway.
To the best of our knowledge, there are no comprehensive studies available on this subject.The only partial information we could gather was found in an IATA document based on theresults of the Airline Economic Task Force data collection, carried out along the lines definedin March 1999 (Data Collection 1999 – Definitions and instructions).
Nine IATA members participate in this exercise which is aimed at providing a continuous andconsistent source of statistical and market data about financial matters, with specific attentionto costs and revenues. Attention should be drawn on the fact that its general objective do notprovide for specific delay cost evaluation.
From the gathered data, they produced a very rough evaluation of the direct operating costs ofcarriers operating in Europe in 1997, both for on ground and airborne delays, which, bydefinition, does not allow for an overall evaluation of delay costs.

Cost of air transport delay in Europe
14
Table 3: IATA Airline Economics task forceDirect operating costs of carriers operating in Europe – 1997
������86�GROODUV�&RVW�SHU�KRXU�
*URXQG�FRVW�SHU�KRXU�RI�$7)0�GHOD\
&RVW�SHU�DGGLWLRQDO�KRXU�RI�
IOLJKW�WLPH
)OLJKW�GHVN�FUHZ ��� ��� ���)XHO��RLO ��� ���)OLJKW�HTXLSPHQW�LQVXUDQFH �� �� ��0DLQWHQDQFH��RYHUKDXO ��� ���)OLJKW�HTXLSPHQW�GHSUHFLDWLRQ ��� ���5HQWDOV ��� ��� ���/DQGLQJ�FKDUJHV ���(Q�URXWH�FKDUJHV ���7RWDO ���� ���� ����
�(85�PLQ ���� ����
Cost items in the IATA database are not detailed enough for an in-depth analysis. Moreover,some cost items that we have identified in this ITA’s study, (i.e. cabin attendants, commercialcompensations) are not included in the evaluation. IATA also considered that average unit(not marginal) costs could be used. On the contrary, the cost evaluations gathered by ITAfrom airlines are differentiated according to each specific item between average and marginalcosts. A more detailed description of those differences is described in annex 3.
The only other evaluation we have identified is from a US Airline Transport Association(ATA) source, and is reported below.
Table 4: ATA calculated delay costs – 1999
������86�GROODUV�
$LUFUDIW�2SHUDWLQJ�FRVW�SHU�PLQXWH���
'HOD\�PLQXWHV��PLOOLRQV�
'HOD\V�FRVWV����PLOOLRQV�
*DWH ����� ���� �����7D[L�RXW ����� ����� ������$LUERUQH ����� ����� �����7D[L�LQ ����� ���� �����7RWDO�DLUFUDIW�RSHUDWLQJ ����� ����� ������$GGHG�JURXQG�FRVWV����JXHVV� �����9DOXH�RI�SDVVHQJHU�WLPH ������7RWDO�FRVWV ������
6RXUFH��$LUOLQH�)LQDQFLDO�1HZV�0DUFK��������

Cost of air transport delay in Europe
15
According to this evaluation, the aircraft operating delay costs amounts to USD34.1 perminute. Unfortunately, we were not able to get further details on how this evaluation wasmade.
The results of table 3 and table 4 suggest that large differences might exist in the evaluation ofthe costs of delay. Although the breakdown provided in tables 3 and 4 is not detailed enough,those figures provide useful benchmark for this study.
q ITA’s study
Given the limitations in the IATA approach, we feel the need to get information directly fromindividual airlines in order to better cover the list of items we had identified, as well as to geta better view of their practices and knowledge of the delays experienced along with theircorresponding costs.Each airline has specific in-house rules and procedures regarding its operations, such as• Fleet management,• Air crew management,• Ground personnel management,• Passenger treatment,• Passenger compensation, and eventually,• Specifics of hub operation,• Accounting methods (delay costs attribution),which impact differently each cost item, and their understanding was needed for this analysis.
This information was then gathered, altogether with delay data, and used for establishingglobal and unit costs for each item.
Those specific airline data were then combined with global EUROCONTROL dataconcerning delay statistics, as well as AEA or IATA information regarding airline activity inthe European zone. In this process, various elements were taken into account such as:• Delay length distribution, since this impacts passenger treatment when those passengers
are faced with missed connections or cancelled flights and passenger compensation,• Type of operation (short versus long haul), since it affects the number of passengers
experiencing delays6,• Connecting traffic, with an emphasis on hub operations, since connecting passengers
receive specific treatment from airlines in case of delays.
Computations were made using the following data and hypothesis concerning only scheduledflights:
6 The estimate of number of passengers involved will be explained later on

Cost of air transport delay in Europe
16
Table 5: Data and assumptions for primary and reactionary delays
'HOD\�GDWD 6RXUFH <HDU 8QLW 9DOXH
$7)0�SULPDU\�GHOD\V &)08 ���� PLOOLRQ�PLQ� ������$7)0�SULPDU\�DQG�UHDFWLRQDU\�GHOD\V� FDOFXODWHG ���� PLOOLRQ�PLQ� ������
6KDUH�RI�VFKHGXOHG�IOLJKWV�LQ�WRWDO�,)5�IOLJKWV ,$7$��&)08 ���� � ��
$7)0�SULPDU\�GHOD\V��VFKHGXOHG�IOLJKWV� FDOFXODWHG ���� PLOOLRQ�PLQ� ������$7)0�SULPDU\�DQG�UHDFWLRQDU\�GHOD\V��VFKHGXOHG�IOLJKWV� FDOFXODWHG ���� PLOOLRQ�PLQ� ������
VSOLW�EHWZHHQ�GHOD\V���SULPDU\������UHDFWLRQDU\����
The number of passengers affected by ATFM delays was calculated using an estimatednumber of delayed flights, an average aircraft capacity and load factor. Passenger driven costswere affected only by the number of passengers delayed by more than one hour while hub andconnections additional costs were affected by passengers delayed by more than 15 minutes.
Different computations were also made in assessing primary delay and reactionary delay costsseparately, as each type of delays may have a different impact on some of the identified costitems. For example, regarding aircraft operating costs, no additional cost is to be borne byairlines due to reactionary delays, as they result only in changing flight schedules during thecourse of the day, but not affecting flight times. Some other items like ground personnel(EUR4.52/mins for the primary delays versus EUR1.92/mins for the reactionary delays) andground equipment (EUR5.49/mins versus EUR4.73/mins) cover expenses more sensitive toprimary delay than to reactionary delay, since extra working hours for the personnel andequipment is required to make up for primary delay consequences, the rest of activity beingshifted along the day (see detailed cost table in annex 2).
The data gathered from airlines consider marginal crew costs, since airline crew remunerationgenerally includes a significant fixed portion and a compensation for additional workinghours due to delays is paid on the top of regular allowances (illustrating the non linearity ofthis cost item). But, as considered in the IATA evaluation, this cost item has been based ontotal unit crew costs. This corresponds to the way some other airlines may set up their crewremuneration rules. At Virgin Atlantic, for example, crew remuneration is entirelyproportional to actual flown hours.This had led us to consider two alternatives with regard to crew costs: marginal versus totalunit crew costs.
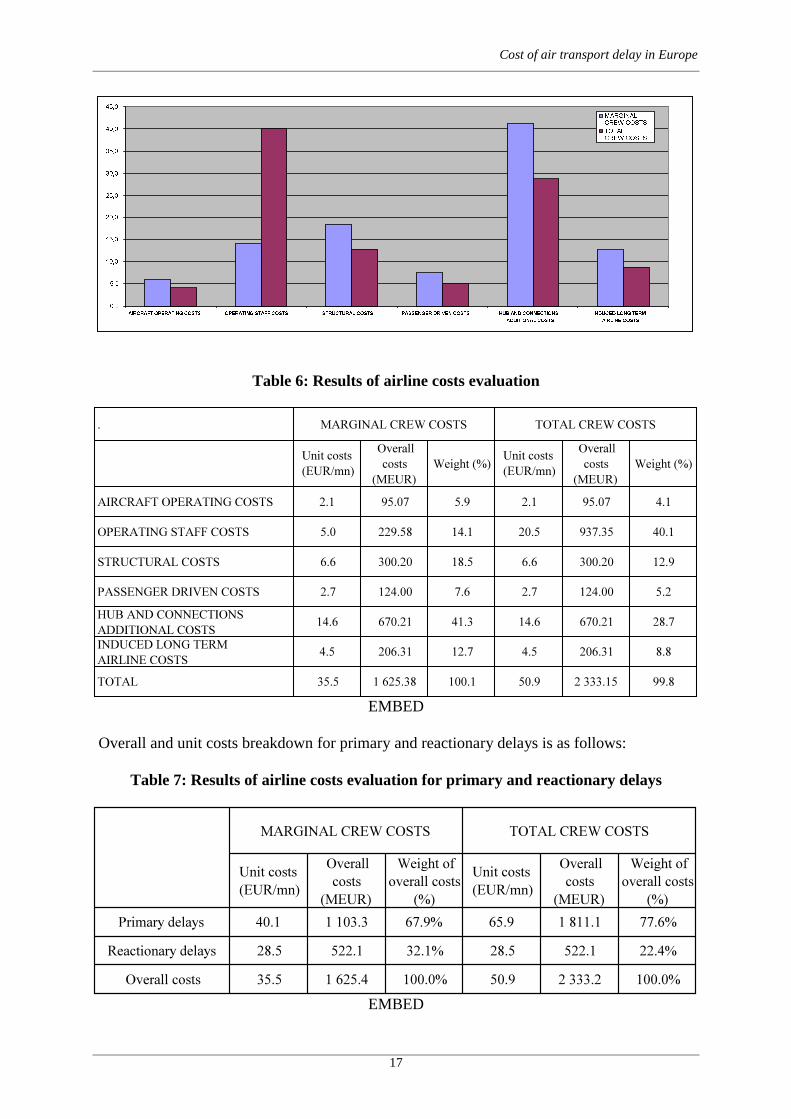
Our cost evaluation shows that the most significant cost items are, for the marginal unit crewcosts evaluation: the hub and connections additional costs (41.3 % of total airline costs),followed by operating staff costs (14.1% of total airline costs) for an overall yearly airlinedelay cost of EUR 1625 million. On the other hand, when one takes into account total unitcrew costs, the most significant item is operating staff costs (40.1% of total airline costs),followed by hub and connections additional costs (28.7% of total airline costs) for an overallyearly airline delay cost of EUR 2333 million.
Figure 3: Weight of airline costs
Cost of air transport delay in Europe
17
���
���
����
����
����
����
����
����
����
����
$,5&5$)7�23(5$7,1*�&2676 23(5$7,1*�67$))�&2676 6758&785$/�&2676 3$66(1*(5�'5,9(1�&2676 +8%�$1'�&211(&7,216$'',7,21$/�&2676
,1'8&('�/21*�7(50$,5/,1(�&2676
0$5*,1$/�&5(:�&2676727$/&5(:�&2676
Table 6: Results of airline costs evaluation
�
8QLW�FRVWV��(85�PQ�
2YHUDOO�FRVWV�
�0(85�:HLJKW����
8QLW�FRVWV��(85�PQ�
2YHUDOO�FRVWV�
�0(85�:HLJKW����
$,5&5$)7�23(5$7,1*�&2676 ��� ����� ��� ��� ����� ���
23(5$7,1*�67$))�&2676 ��� ������ ���� ���� ������ ����
6758&785$/�&2676 ��� ������ ���� ��� ������ ����
3$66(1*(5�'5,9(1�&2676 ��� ������ ��� ��� ������ ���
+8%�$1'�&211(&7,216$'',7,21$/�&2676
���� ������ ���� ���� ������ ����
,1'8&('�/21*�7(50$,5/,1(�&2676
��� ������ ���� ��� ������ ���
727$/ ���� �������� ����� ���� �������� ����
0$5*,1$/�&5(:�&2676 727$/�&5(:�&2676
EMBED
Overall and unit costs breakdown for primary and reactionary delays is as follows:
Table 7: Results of airline costs evaluation for primary and reactionary delays
8QLW�FRVWV��(85�PQ�
2YHUDOO�FRVWV�
�0(85�
:HLJKW�RI�RYHUDOO�FRVWV�
���
8QLW�FRVWV��(85�PQ�
2YHUDOO�FRVWV�
�0(85�
:HLJKW�RI�RYHUDOO�FRVWV�
���
3ULPDU\�GHOD\V ���� ������� ����� ���� ������� �����
5HDFWLRQDU\�GHOD\V ���� ����� ����� ���� ����� �����
2YHUDOO�FRVWV ���� ������� ������ ���� ������� ������
0$5*,1$/�&5(:�&2676 727$/�&5(:�&2676
EMBED

Cost of air transport delay in Europe
18
Primary delays unit costs are higher than reactionary delays unit costs, since the latter do notaffect aircraft either operating costs or spare and scheduled crews and aircraft cost items.Furthermore, overall costs are higher for primary than for reactionary delays, due, also, to thecorresponding recorded delays.
It is important to note that overall costs are likely to be underestimated, since they do notinclude, due to the lack of detailed information, neither charter operations nor some cost itemssuch as:• Item 18 - Loss of market share to other airlines (but the loss for one airline constitutes a
gain for another one, therefore resulting in a transfer of activity with no impact on theindustry as a whole),
• Item 19 - Loss of market share to other modes,• Item 20 - Loss of corporate image,• Item 22 - Average passenger revenue,• Item 23 - Social consequences.
Comparison with the IATA evaluation would prove extremely difficult, if not impossible,since IATA evaluation does not include the cabin crew, ground personnel, ground equipment,passenger driven and hub and connection additional cost items.
Comparison with the ATA evaluation is illustrated below.
Table 8: ATA and ITA 1999 costs evaluation
8QLW�FRVW�SHU�PLQXWH�
�(85�
'HOD\�PLQXWHV��PLOOLRQ�
'HOD\V�FRVWV��(85�PLOOLRQ�
8QLW�FRVW�SHU�PLQXWH�
�(85�
'HOD\�PLQXWHV��PLOOLRQ�
'HOD\V�FRVWV��(85�PLOOLRQ�
7RWDO�DLUFUDIW�RSHUDWLQJ�FRVWV ���� ���� ������� ���� ���� �����
*URXQG�FRVWV ����� ���� ���� �������
7RWDO�FRVWV ���� ���� ������� ���� ���� �������
$7$ ,7$
Overall estimations are rather close (EUR 2333.2 million versus EUR 2895.6 million). But,unit costs diverge as well as the minutes of delays considered. Moreover, drawing conclusionswould probably be a delicate matter because ATA figures come from 2000 airline routes inthe US, which could differ significantly from what could be observed in the Europeanenvironment.
II.1.2. Costs for users7
After studying costs for operators, most economic studies also take into account cost for usersin order to assess global social costs and will therefore include the opportunity cost for thepassengers. Indeed depending on who should pay for improved ATC, one would or would notinclude those costs. In fact, some of the inconveniences encountered by passengers have been
7 At this stage, only passenger costs have been taken into account.

Cost of air transport delay in Europe
19
directly compensated by airlines (cf. item 15) but those compensations certainly do not cover,by far, the full cost incurred by passengers.
Time lost by passengers has an opportunity cost. During the time lost, they could work andreceive compensation or they could have had some leisure time and derived utility. Theappraising of passengers delay costs is based on estimates and empirical analysis of the valueof time for delayed passengers.
This value of time consists in a monetary evaluation, equivalent to the additional moneypassengers would agree to pay in order to save (or not loose) time. From an economic point ofview, passengers make arbitration between the ticket price and the travel time, and by theirchoice (of transportation mode, of route, or of itinerary) reveal their value of time.This time value depends on travel motive, time of departure, fare class, length of travel andsojourn, as well as, on passenger characteristics (revenue, socio-economic group, etc.).
q Previous studies
The ATA evaluation with regard to the value of time in the US environment amounts to aglobal cost of EUR 1970 million, with no more details.EUROCONTROL PRC evaluation is based on 60 EUR/minute/flight and amounts to EUR4200 million for 1999.
q ITA’s study
European passenger traffic distribution according to travel motives was estimated (table 9),based on several surveys carried by ITA, among the population of the major Europeancountries.
Multi-modal surveys, carried out in European countries, have been used to estimate value oftime for air travellers, according to their travel motive (business, personal convenience andtourism), based on various modal split econometric models. The results of these estimationsare outlined in annex 4.
The number of passengers encountering ATFM delays was calculated using an estimatednumber of delayed flights, an average aircraft capacity and load factor. The estimateddistribution of passengers according to travel motives was applied to the delayed passengers.
The delay duration distribution per delayed flight was considered identical regardless of themotive.
Cost per passenger was calculated by multiplying the number of passengers delayed in eachcategory, by the average length of delay for delayed flight and the value of time per motive oftravel.
Given the range of available value of time estimates, a conservative range from EUR 34 toEUR 44 per hour, used in-house by ITA, was retained.
Table 9: Assumptions for passengers time value

Cost of air transport delay in Europe
20
7LPH�YDOXH�SHU�KRXU�� 0RWLYH�VSOLW 9DOXH��(85�
6FHQDULR��/RZEXVLQHVV ��� ��SHUVRQDO�FRQYHQLHQFH ��� ��WRXULVP ��� ��DYHUDJH ��
6FHQDULR��+LJKEXVLQHVV ��� ��SHUVRQDO�FRQYHQLHQFH ��� ��WRXULVP ��� ��DYHUDJH ��
When applying those unit values to the number of delayed passengers, global estimation ofvalue of time costs for passengers ranges from EUR2130.1 to EUR2747.3 million for 1999(scheduled flights only).
Due to the lack of useful detailed information, the other listed users cost items have not beenincluded:• costs of automobile parking and prejudice compensation for passengers• costs for military and general aviation users.
II.2.3. Costs for the community
Environment could be affected by delays in two ways: aircraft emissions and noise.Air transport burns fuel into the atmosphere, which produces emissions of pollutantsubstances. Through lengthening flight and taxiing times, delays have an effect on the volumeof emissions into the atmosphere.
q Results of previous studies have been considered with regard to assessment of pollutioncosts and noise costs. Some research has been conducted on individual aircraft emissionsalong with cost evaluation on damage caused by pollution in the neighbouring of airports.(annex 5) Those results could be used, provided that statistics on delayed traffic (aircraftand engine type, phase of flight, location of occurrence) are available. Since they are not,evaluation is impossible at this stage.
q Noise is another source of annoyance, mainly to the population living under the approachand departure paths of airports. Nevertheless, new generation aircraft have becomequieter. Improved take-off performance of today engines means that aircraft climb muchmore quickly after take-off. Therefore significantly fewer people under the departureflight path are being disturbed, all else equal. On approach, the disturbance created byaircraft is mainly due to airframe noise, rather than to engines.
Studies have been carried out to estimate noise social costs at airports. Some elements canbe found in annex 5.
Cost of air transport delay in Europe
21
With regard to monetary consequences of delays, it seems that the only significant noiseimpact of delays would occur during stacks before landing. But, since aircraft are stillflying at a high altitude, and since EPNdB during this flight stage have not been measured,the evaluation of this item would not be worthy of a detailed study. Moreover, informationon stacks is not readily available.
q Costs for other economic agents in the community (i.e. travel agents, tour-operators,airports, hotels…) have not been surveyed. This could possibly be done at a later stage,but would prove difficult and costly.

Cost of air transport delay in Europe
22
II.2. Schedule versus optimum costs
Given past experience of encountered delays, airborne as well as on the ground, airlines areled to take them into account, when establishing their flight programs (schedules), thereforelengthening flight times, or turnaround times at given airports and according to the time ofday.
II.2.1. Costs for airlines
q Previous studies
We have not been able to identify any study on this subject.
q ITA’s study
Schedule versus optimum costs correspond to costs incurred by an increase in programmedflight duration. Therefore, corresponding additional costs are to be assessed for the followingcost items:• Aircraft operating costs,• Operating staff costs with the exception of spare crews,• Structural costs; excluding spare aircraft and ground equipment,• Reduction of hub efficiency.
Passenger driven costs are not concerned, since for passengers, there is no change comparedto what they are expecting in term of travel time and duration, although the real increase ofthe schedule has a cost as indicated in Section II.2.2.
Impact on induced (long-term) airline costs has not been assessed by the airlines we havesurveyed.
The same unit costs, as assessed for the “operated flight versus schedule” concept, have beenused to value all relevant items, except for scheduled crews and aircraft. For those items beingpart of the flight programme, it has been considered that total costs (average unit) should beapplied, for which costs from the IATA study have been used.
The approach consisted in examining the results that would be obtained if one assumes anincreased flight time of either 5 or 10% (see detailed cost table in annex 2). These figureswere retained, considering the block to block flight time increase observed on the London-Paris route, where scheduled times have increased by ten to fifteen minutes over the lastdecade. Although this flight duration increase might occur only at specifically congestedairports or routes and mostly at peak hours, this is significant, given that an average internalEuropean flight lasts 83 minutes for a distance of 760 kilometres. The flight time increase was25% on London-Paris route, but we have limited ourselves to a maximum increase of 10%,nevertheless considering an intermediate value of 5% in order to get a first idea of thesensitivity of this cost concept.
For airlines, the delay unit cost due to the difference between scheduled and optimum time isestimated at EUR 45 per minute of delay.

Cost of air transport delay in Europe
23
The cost evaluation we have carried out, shows that the most significant cost items are bothaircraft operating costs (32%) and structural costs (32%), followed by the hub andconnections additional costs (30.6 % of total airline costs), other items being non significant.
Figure 4: Weight of airline costs (hyp: 5% lengthening of flight time)
0.0%
5.0%
10.0%
15.0%
20.0%
25.0%
30.0%
35.0%
$,5&5$)7�23(5$7,1*�&2676 23(5$7,1*�67$))�&2676 6758&785$/�&2676 3$66(1*(5�'5,9(1�&2676 +8%�$1'�&211(&7,216
$'',7,21$/�&2676
,1'8&('�/21*�7(50
$,5/,1(�&2676
If the difference between schedule and optimum flight time is 5%, the 1999 global evaluatedcosts of non-optimum scheduling for airlines are estimated at EUR 1.4 billion, and estimatedat EUR 2.8 billion for 10%.
Table 10: Results of airline costs evaluation for lengthening of flight time
8QLW�FRVWV��(85�PQ�
2YHUDOO�FRVWV�
�0(85�:HLJKW����
8QLW�FRVWV��(85�PQ�
2YHUDOO�FRVWV�
�0(85�:HLJKW����
$,5&5$)7�23(5$7,1*�&2676
��� ���� ���� ��� ����� ����
23(5$7,1*�67$))�&2676 ���� ����� ����� ���� ����� �����
6758&785$/�&2676 ���� ����� ����� ���� ����� �����
3$66(1*(5�'5,9(1�&2676 ��� ��� ���� ��� ��� ����
+8%�$1'�&211(&7,216$'',7,21$/�&2676
���� ����� ����� ���� ����� �����
,1'8&('�/21*�7(50$,5/,1(�&2676
��� ��� ���� ��� ��� ����
727$/ ���� ������ ������ ���� ������ ������
+\S������RI�WRWDO�IOLJKW�WLPH +\S�������RI�WRWDO�IOLJKW�WLPH
II.2.2. Costs for users
q Previous studies

Cost of air transport delay in Europe
24
As we have already mentioned for airline costs, we have not been able to identify any studyon this subject.
q ITA’s study
The same method we used for the operated versus schedule concept applies here also (cf.definition of value of time for passengers). EUR 34 or EUR 44 per hour are the value used.The OAG source provided the total flight time, which, divided by the number of flightsallowed to compute an average flight time. A 5% or 10% increase on that value was applied,which multiplied by the number of passengers (IATA source) and their value of time,produced an estimate of EUR1.42 and EUR2.85 billion, respectively. This has to beconsidered as a very rough estimate given the uncertainty attached to the intermediateevaluations used and will required further refinements.
II.2.3. Costs for the community
The same difficulties as outlined in the “operated flights versus schedule” concept analysishave been encountered, and therefore, at this stage, no meaningful evaluation could be carriedout.

Cost of air transport delay in Europe
25
CONCLUSION
General results
These results should be considered as a first evaluation stage. More economical and statisticalinformation in the future should allow us to complete and refine those results and reduceuncertainties. At this stage, only scheduled airline costs and the costs corresponding to thevalue of time for passengers have been taken into account.
One should note that, regarding airline costs, loss of revenue to other airlines which could notbe isolated should be ignored, since we could consider that it would, at least partly, benefitanother one and therefore be neutral for the industry considered as a whole. Other specificindividual cost items could not be appraised among the induced airline costs.
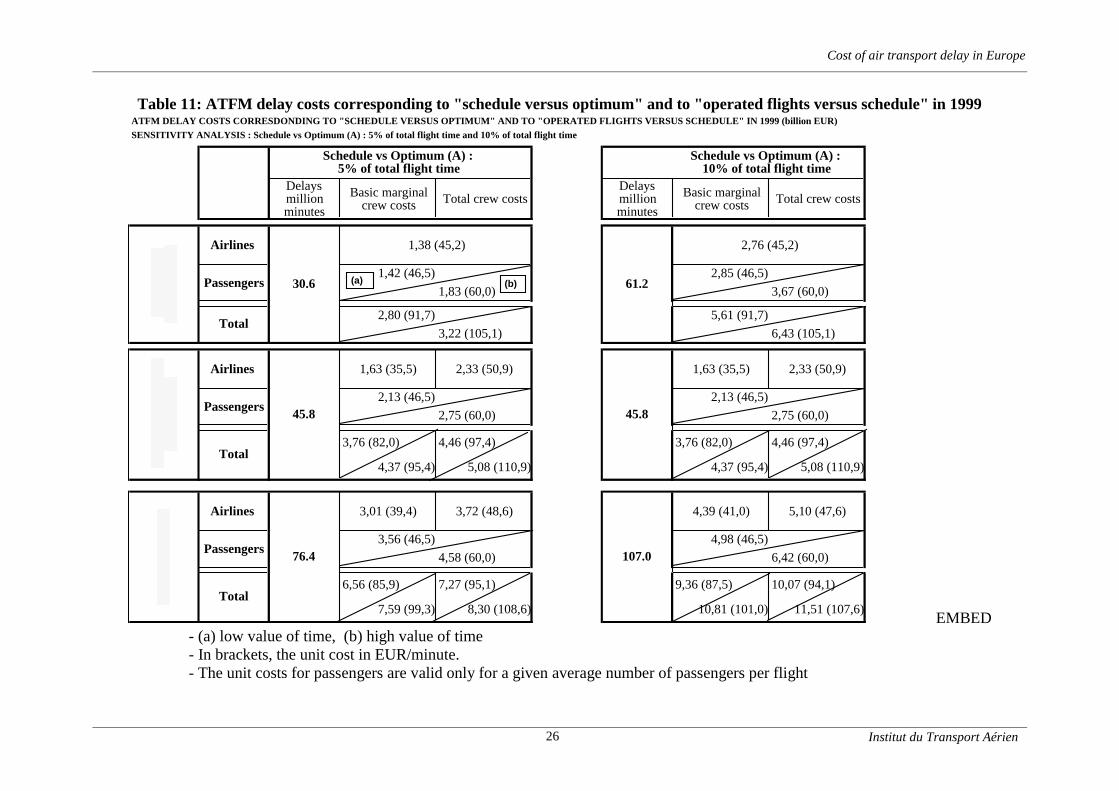
Table 11 summarises and consolidates the results for both concepts “operated flights versusschedule” and “optimum versus schedule”, according to the previous assumptions of a block-to-block time increase of 5 or 10%.
Total scheduled airlines costs for “operated flights versus schedule” delays could beestimated between EUR1.6 and EUR2.3 billion in 1999. Costs for passengers8 forscheduled flights appear to be at least of the same order of magnitude that, or higherthan, the airline costs we have identified so far.
If we add the costs of non-optimal scheduling, airline costs would rise significantly, withestimation ranging between EUR 3 and EUR5.1 billion.
In other words, taking into account inefficient scheduling could lead to a global cost, whichcould be as high as 160% up to 250% of the “operated flights versus schedule” delay costs,depending on the different assumptions made.
Overall 1999 delay costs, including passenger costs, could then be comprised between EUR6.6 and EUR 11.5 billion.
8 Not including prejudice compensation or cost of automobile parking.
Cost of air transport delay in Europe
Institut du Transport Aérien26
Table 11: ATFM delay costs corresponding to "schedule versus optimum" and to "operated flights versus schedule" in 1999ATFM DELAY COSTS CORRESDONDING TO "SCHEDULE VERSUS OPTIMUM" AND TO "OPERATED FLIGHTS VERSUS SCHEDULE" IN 1999 (billion EUR)
SENSITIVITY ANALYSIS : Schedule vs Optimum (A) : 5% of total flight time and 10% of total flight time
Delays million minutes
Basic marginal crew costs Total crew costs
Delays million minutes
Basic marginal crew costs Total crew costs
Airlines
1,42 (46,5) 2,85 (46,5)
1,83 (60,0) 3,67 (60,0)
2,80 (91,7) 5,61 (91,7)
3,22 (105,1) 6,43 (105,1)
Airlines 1,63 (35,5) 2,33 (50,9) 1,63 (35,5) 2,33 (50,9)
2,13 (46,5) 2,13 (46,5)
2,75 (60,0) 2,75 (60,0)
3,76 (82,0) 4,46 (97,4) 3,76 (82,0) 4,46 (97,4)
4,37 (95,4) 5,08 (110,9) 4,37 (95,4) 5,08 (110,9)
Airlines 3,01 (39,4) 3,72 (48,6) 4,39 (41,0) 5,10 (47,6)
3,56 (46,5) 4,98 (46,5)
4,58 (60,0) 6,42 (60,0)
6,56 (85,9) 7,27 (95,1) 9,36 (87,5) 10,07 (94,1)
7,59 (99,3) 8,30 (108,6) 10,81 (101,0) 11,51 (107,6)
Schedule vs Optimum (A) : 5% of total flight time
Schedule vs Optimum (A) : 10% of total flight time
Opt
imum
(A
)
30.6
1,38 (45,2)
61.2
2,76 (45,2)
Passengers
Total
Sche
dule
(B
)
45.8 45.8Passengers
Total
76.4 107.0Passengers
Total
(a) (b)
EMBED- (a) low value of time, (b) high value of time- In brackets, the unit cost in EUR/minute.- The unit costs for passengers are valid only for a given average number of passengers per flight

Cost of air transport delay in Europe
27
Airline costs are highly linked to the commercial concern of airlines for their passengers.While aircraft operating costs amount to 4 to 6% of the total costs, and crew costs representaround 4% for our basic evaluations (but if total crew costs are considered, the share of crewcosts would raise to 33%), passenger related costs9 amount between 50 and 70% of totalairline costs (see Table 6 and Annex 2).
Therefore, our analysis suggests that, rather than on basic internal operating costs, delays havethe most important impact on all passenger-related activities, which reflects the stronglycommercial and competitive character of air transport.
Sensitivity analysis
A sensitivity analysis of the various airline cost items was also carried out using a 10% unitcost increase applied to each assessed item on both “operated flights versus schedule” andglobal (“operated flight versus schedule” plus “schedule versus optimum”) delay costs.
The main observations that can be drawn from the sensitivity analysis are as follows.
When we consider basic marginal crew costs (see figure 5), the most significant items are thereduction of hub efficiency with an elasticity of 0.39 (i.e. a 3.9% increase of total airline costsis induced by a 10% increase of the “reduction of hub efficiency” cost item) for “operatedflights versus schedule” costs and 0.35 when we add “schedule versus optimum” costs (asreferred to as total costs).This is followed by the “ground equipment” cost item with elasticities of 0.15 and 0.08,“subcontractors” (0.13 and 0.07) and “ground personnel” costs (0.1 and 0.09), respectively.Note that the elasticity of the remaining items is always inferior to 0.1 for “operated flightsversus schedule” concept.
When considering total crew costs (see figure 6), the most significant item remains the“reduction of hub efficiency” with an elasticity close to 0.3 in both cases, followed by“scheduled crews” (0.2 and 0.25), “ground equipment” (0.1 and 0.05), and “spare crews” (0.1and 0.05), respectively.
In both cases, the scheduled aircraft items, which appear only in total costs, have elasticitiesof at least 0.15.
9 Passenger related costs include item 7, item 10, items 11 to 16, 18 and 19.

Cost of air transport delay in Europe
Institut du Transport Aérien28
Figure 5: Sensitivity analysis for “marginal crew costs"

Cost of air transport delay in Europe
Institut du Transport Aérien29
Figure 6: Sensitivity analysis for "total crew costs"

Cost of air transport delay in Europe
Institut du Transport Aérien30
Items with the highest elasticities are the most sensitive, since they would contribute the mostto cost reduction if delays would be reduced with an unchanged unit cost.
The overall correlation between unit costs and delays is non-linear, with the exception offlights that have been delayed between 15 to 50 minutes, compared to their schedule time.This highlights the necessity of available relevant delay statistical distribution.
Further investigation
Further investigations on the type of delays and their statistical distribution, on the kind oftraffic to be taken into consideration, and on specific airlines policies and costs, appearessential for a more thorough and comprehensive assessment of costs of air transport delay.
Built-in costs, due to delay-sensitive airline schedules planning, will also require furtherinvestigation.
At a later stage, a larger panel of European and other airlines operating in Europe shouldtherefore be constituted and possibly organised as a task force devoted to the detailedcollection and analysis of missing or incomplete information. This would also help us assessthe possible diversity of airline procedures and their impact on unit and global costs. Charterairlines should probably be also included in the panel.

Cost of air transport delay in Europe
Institut du Transport Aérien31
ANNEX 1
Definitions andacronyms

Cost of air transport delay in Europe
Institut du Transport Aérien32
AIR TRANSPORT DELAYS
Delays occurred when the published or planned departure and arrival times for commercialoperators are not observed. There are primary delays, reactionary delays, departure or arrivaldelays, on ground or airborne delays.
AIRCRAFT OPERATING COSTS
Relate to flight and ground costs that are linked to the operation of an aircraft, such as fuel,aircraft parking, air bridges and maintenance costs.
ATFM (EUROCONTROL)
Air Traffic Flow Management measures consist of re-routing aircraft over non congestedareas and controlling access to congested areas by the organisation of traffic flows and by thestaggering of arrival times into these areas. The access control is performed by imposingappropriate ground delays (take-off slots).
ATFM DELAY (EUROCONTROL)
Duration between the last take-off time requested by the aircraft operator and the take-off slotgiven by the central flow management unit (CFMU)
ATFM delays do not take into account possible differences between the slot take-off time andthe actual departure time caused by airport operations or aircraft operator operations.
ATFM delays do not correspond to the total daily attributable to ATC operations, whichinclude the reactionary delays caused indirectly by ATFM measures.
BLOCK TO BLOCK TIME
Elapsed period from time aircraft starts to move (leaves parking) at beginning of mission totime it comes to rest at conclusion (stops at gate).
CFMU
The Central Flow Management Unit is located at EUROCONTROL Headquarters and isresponsible for balancing demand and available airspace capacity, thus helping reducecongestion in European airspace.
COSTS FOR USERS
Include the costs of delays to passengers, to other users (military aviation, general aviation)and to the community as a whole (environment costs occurred by noise and pollutantemissions, additional costs or loss of revenue imposed to airports, travel agents, hotels…).
FPP (FREQUENT FLYER PROGRAM)
Program offering a variety of bonuses to their customers according to their fidelity.
GDS
GDS means Global Distribution System. These are computerised systems available to travelagents containing information about schedules, availability, fares and related services and
Cost of air transport delay in Europe
Institut du Transport Aérien33
through which reservations can be made and tickets issued. These systems provideinformation and booking facilities for all types of travel services (hotels, train, car rental,) ona worldwide basis.
HUB AND CONNECTION ADDITIONAL COSTS
Relate to costs occurred through the loss of hub efficiency, e.g. lengthening of connectingtimes, missed connections, flight cancellations
INDUCED (LONGER TERM) AIRLINE COSTS
All delay costs not immediately born by airlines but which incur though the disturbances andcould lead to a less competitive situation. They include loss of market share to other modes oftransport (e.g. high speed train), loss of corporate image, drop of average passenger revenuedue to bad on-time performances, development of inefficiency among airline staff orsubcontractors…
MCO (MISCELLANEOUS CHARGE ORDER)
A sort of check for future payment of the issuing airline services
OPERATED FLIGHTS VERSUS SCHEDULE
The estimation of the cost impact of air transport delay is based on the comparison betweencosts due to delayed operations (referred to here as “operated flights”) and costs due to ontime operations (referred to here as “schedule”).
OPERATING STAFF COSTS
Correspond to flying personnel costs and to the part of ground personnel costs linked to thepassenger and aircraft handling.
PRIMARY DELAYS
Correspond to initial delay caused to a given flight. Several causes have to be considered withthe exception of the late arrival of connecting flight, connecting passengers, baggage, load orcrewmembers. Primary delays are classified under following causes: passenger and baggage,cargo and mail, aircraft and ramp handling, technical and aircraft equipment, damage toaircraft, flight operations and crewing, weather, airport and governmental authorities.
Reactionary delaysCorrespond to delays due to the late arrival of a connecting flight, late arrival of connectingpassengers or load, and late arrival of crewmembers, awaited from another flight.
SCHEDULE VERSUS OPTIMUM
Air transport delays encountered in Europe are taken into account by airlines when theyestablish schedules for the next (e.g. IATA season) operating period. Therefore publishedschedules generally incorporate a buffer, which is added to the planned flight time in order toaccommodate statistically foreseeable delays. This could lead airlines to increase the numberof aircraft and crews they need and, consequently, the costs of operations.
Cost of air transport delay in Europe
Institut du Transport Aérien34
These additional costs have been estimated separately from the direct impact of observed airtransport delays, as they are not linked with the day-to-day computed delays, but with delaysencountered in the past.
The optimum used here is referring neither to the optimum for airlines, nor to the optimum forthe community as a whole, but to the ideal operational conditions that airline would havewithout experiencing delays.
STRUCTURAL COSTS
Include all equipment costs that have to be tailored to the size of operations (fleet, groundequipment)

Cost of air transport delay in Europe
Institut du Transport Aérien35
List of acronyms
ACARS Aircraft Communication Addressing and Reporting SystemAEA Association of European AirlinesANCAT Abatement of Nuisance Caused by Air Transport, a technical committee of
the ECACAPU Auxiliary Power UnitATC Air Traffic ControlATFM Air Traffic Flow ManagementCAA Civil Aviation AuthorityCFMU EUROCONTROL Central Flow Management UnitECAC European Civil Aviation ConferenceEEA European Environment AgencyFFP Frequent Flyer ProgramGDS Global Distribution SystemIATA International Air Transport AssociationICAO International Civil Aviation OrganizationIFR Instrument Flight RulesIPCC International Panel on Climate ChangeITA Institute of Air TransportLTO Landing and Take-off cycleMCO Miscellaneous Charge OrderMTOW Maximum Take-Off WeightVFR Visual Flight RulesVOC Volatile Organic Compounds
Cost of air transport delay in Europe
Institut du Transport Aérien36
ANNEX 2
Detailed costs“Optimum versus schedule”
“Operated flights versus schedule”

Cost of air transport delay in Europe
Institut du Transport Aérien37
SYNTHESIS OF RESULTS (OPERATED FLIGHTS VERSUS SCHEDULE)
BASIC MARGINAL CREW COSTS EVALUATION
PRIMARY DELAYS
REACTIONARY DELAYS
PRIMARY DELAYSREACTIONARY
DELAYSTOTAL WEIGHT
Items COSTS FOR AIRLINES EUR/minute EUR/minute EUR EUR EUR
I Aircraft operating costs 3.46 95 072 847 95 072 847 5.8%
1 Fuel 1.75 48 137 921 48 137 921 3.0%
2 Aircraft parking
3 Air bridges
4 Maintenance 1.64 45 204 181 45 204 181 2.8%
II Operating staff costs 7.07 1.92 194 385 572 35 190 522 229 576 095 14.1%
Flying personnel
5 - Spare crews 0.85 23 228 540 23 228 540 1.4%
6 - Scheduled crews 1.71 46 942 953 46 942 953 2.9%
7 Ground personnel 4.52 1.92 124 214 080 35 190 522 159 404 603 9.8%
III Structural costs 7.77 4.73 213 545 174 86 658 309 300 203 483 18.5%
Fleet size
8 - Spare aircraft 2.28 62 636 771 62 636 771 3.9%
9 - Scheduled aircraft
10 Ground equipments 5.49 4.73 150 908 403 86 658 309 237 566 712 14.6%
IV Passenger driven costs 2.71 2.71 74 399 966 49 596 300 123 996 266 7.6%
11 Food and drinks expenditures
12 Miscellaneous expenditures
13 Passenger rerouting 0.07 0.07 1 980 681 1 320 323 3 301 003 0.2%
14Loss of revenue (cancellations by passengers)
15 Commercial compensations 0.68 0.68 18 817 114 12 544 743 31 361 857 1.9%
V Hub & connection additional costs 14.63 14.63 402 128 731 268 085 821 670 214 551 41.2%
16 Reduction of hub efficiency 13.82 13.82 379 879 712 253 253 142 633 132 854 39.0%
17 Flight cancellations 0.81 0.81 22 249 019 14 832 679 37 081 698 2.3%
VI Induced long term airline costs 4.50 4.50 123 792 542 82 520 172 206 312 714 12.7%
18 Loss of market share to other modes 0.00 0.00 0 0 0 0.0%
19 Loss of corporate image
20 Subcontractors 4.50 4.50 123 792 542 82 520 172 206 312 714 12.7%
21 Average passenger revenue
22 Social consequences
TOTAL 40.14 28.49 1 103 324 831 522 051 125 1 625 375 956 100.0%
COSTS FOR USERS EUR/h EUR/h EUR EUR EUR
VII Passengers
Value of time : - low 34 34 1 278 085 293 852 056 862 2 130 142 155
- high 44 44 1 648 358 308 1 098 905 539 2 747 263 846
ITEMSUNIT COSTS TOTAL ATFM COSTS
0.06 1 730 745 1 730 745 0.1%
89 333 405 5.5%
23
1.95 1.95 53 602 171 35 731 235
Cost of air transport delay in Europe
Institut du Transport Aérien38
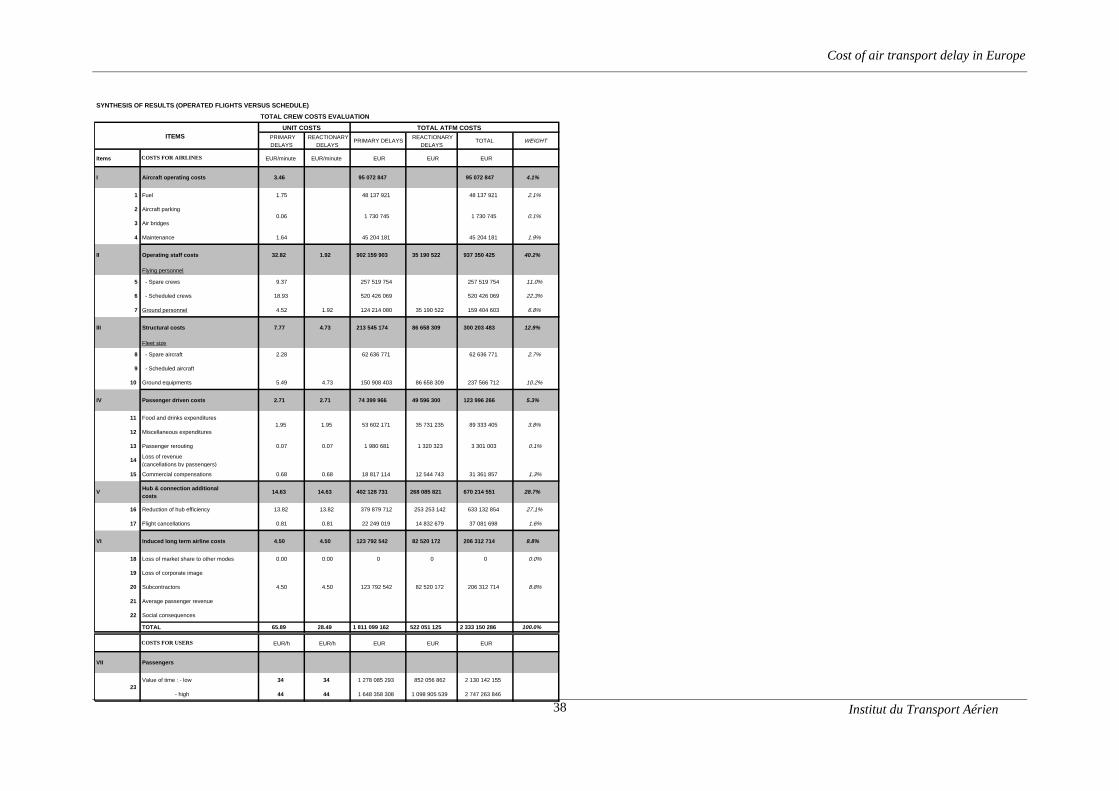
SYNTHESIS OF RESULTS (OPERATED FLIGHTS VERSUS SCHEDULE)
TOTAL CREW COSTS EVALUATION
PRIMARY DELAYS
REACTIONARY DELAYS
PRIMARY DELAYSREACTIONARY
DELAYSTOTAL WEIGHT
Items COSTS FOR AIRLINES EUR/minute EUR/minute EUR EUR EUR
I Aircraft operating costs 3.46 95 072 847 95 072 847 4.1%
1 Fuel 1.75 48 137 921 48 137 921 2.1%
2 Aircraft parking
3 Air bridges
4 Maintenance 1.64 45 204 181 45 204 181 1.9%
II Operating staff costs 32.82 1.92 902 159 903 35 190 522 937 350 425 40.2%
Flying personnel
5 - Spare crews 9.37 257 519 754 257 519 754 11.0%
6 - Scheduled crews 18.93 520 426 069 520 426 069 22.3%
7 Ground personnel 4.52 1.92 124 214 080 35 190 522 159 404 603 6.8%
III Structural costs 7.77 4.73 213 545 174 86 658 309 300 203 483 12.9%
Fleet size
8 - Spare aircraft 2.28 62 636 771 62 636 771 2.7%
9 - Scheduled aircraft
10 Ground equipments 5.49 4.73 150 908 403 86 658 309 237 566 712 10.2%
IV Passenger driven costs 2.71 2.71 74 399 966 49 596 300 123 996 266 5.3%
11 Food and drinks expenditures
12 Miscellaneous expenditures
13 Passenger rerouting 0.07 0.07 1 980 681 1 320 323 3 301 003 0.1%
14Loss of revenue (cancellations by passengers)
15 Commercial compensations 0.68 0.68 18 817 114 12 544 743 31 361 857 1.3%
VHub & connection additional costs
14.63 14.63 402 128 731 268 085 821 670 214 551 28.7%
16 Reduction of hub efficiency 13.82 13.82 379 879 712 253 253 142 633 132 854 27.1%
17 Flight cancellations 0.81 0.81 22 249 019 14 832 679 37 081 698 1.6%
VI Induced long term airline costs 4.50 4.50 123 792 542 82 520 172 206 312 714 8.8%
18 Loss of market share to other modes 0.00 0.00 0 0 0 0.0%
19 Loss of corporate image
20 Subcontractors 4.50 4.50 123 792 542 82 520 172 206 312 714 8.8%
21 Average passenger revenue
22 Social consequences
TOTAL 65.89 28.49 1 811 099 162 522 051 125 2 333 150 286 100.0%
COSTS FOR USERS EUR/h EUR/h EUR EUR EUR
VII Passengers
Value of time : - low 34 34 1 278 085 293 852 056 862 2 130 142 155
- high 44 44 1 648 358 308 1 098 905 539 2 747 263 846
ITEMSUNIT COSTS TOTAL ATFM COSTS
0.06 1 730 745 1 730 745 0.1%
23
89 333 405 3.8%1.95 1.95 53 602 171 35 731 235
Cost of air transport delay in Europe
39
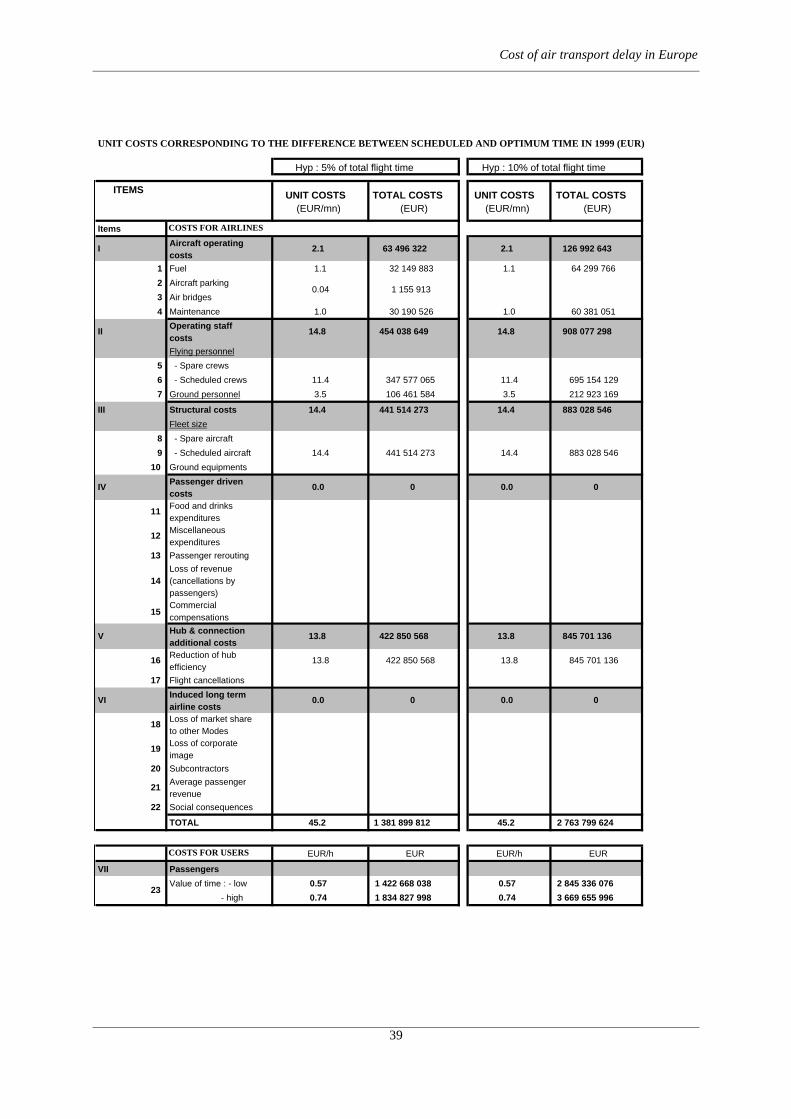
UNIT COSTS CORRESPONDING TO THE DIFFERENCE BETWEEN SCHEDULED AND OPTIMUM TIME IN 1999 (EUR)
ITEMS
Items COSTS FOR AIRLINES
IAircraft operating costs
2.1 63 496 322 2.1 126 992 643
1 Fuel 1.1 32 149 883 1.1 64 299 766
2 Aircraft parking
3 Air bridges
4 Maintenance 1.0 30 190 526 1.0 60 381 051
IIOperating staff costs
14.8 454 038 649 14.8 908 077 298
Flying personnel
5 - Spare crews
6 - Scheduled crews 11.4 347 577 065 11.4 695 154 129
7 Ground personnel 3.5 106 461 584 3.5 212 923 169
III Structural costs 14.4 441 514 273 14.4 883 028 546
Fleet size
8 - Spare aircraft
9 - Scheduled aircraft 14.4 441 514 273 14.4 883 028 546
10 Ground equipments
IVPassenger driven costs
0.0 0 0.0 0
11Food and drinks expenditures
12Miscellaneous expenditures
13 Passenger rerouting
14Loss of revenue (cancellations by passengers)
15Commercial compensations
VHub & connection additional costs
13.8 422 850 568 13.8 845 701 136
16Reduction of hub efficiency
13.8 422 850 568 13.8 845 701 136
17 Flight cancellations
VIInduced long term airline costs
0.0 0 0.0 0
18Loss of market shareto other Modes
19Loss of corporate image
20 Subcontractors
21Average passenger revenue
22 Social consequences
TOTAL 45.2 1 381 899 812 45.2 2 763 799 624
COSTS FOR USERS EUR/h EUR EUR/h EUR
VII Passengers
Value of time : - low 0.57 1 422 668 038 0.57 2 845 336 076
- high 0.74 1 834 827 998 0.74 3 669 655 99623
0.04 1 155 913
Hyp : 5% of total flight time Hyp : 10% of total flight time
UNIT COSTS (EUR/mn)
TOTAL COSTS (EUR)
UNIT COSTS (EUR/mn)
TOTAL COSTS (EUR)

Cost of air transport delay in Europe
40
ANNEX 3
Definitions ofIATA & ICAO cost items

Cost of air transport delay in Europe
41
AVAILABLE ECONOMIC INFORMATION
In this stage, we have focused on airlines and passenger delays. These delays generate coststhat have been identified and classified in different categories. The costs for airlines includeaircraft operating costs, operating staff costs, structural costs, passenger driven costs andinduced airline costs.
IATA
Airlines suffering from ATM-related delays are European as well as non-European airlines.The unit operating costs computed within IATA is relevant to the study, as they include datafrom non-European airlines and from European airlines on European routes. However, onemust note that IATA data are not public, so it makes their use less practical. The way thisinformation will have to be computed must be agreed beforehand with IATA representatives.
The reporting requirements of IATA database aim at collecting information, based oncommon definitions of revenues and charges.In fact, direct operating costs include the following main cost items:• flight deck crew (but not cabin crew),• fuel and oil,• flight equipment insurance,• maintenance and overhaul,• flight equipment depreciation and rental expenses,• aircraft related charges.
Other items like air navigation charges are not relevant to the present study, as they are notdirectly linked to the length of flight time or turnaround time. In Europe, they are neverthelessdistance-related, but more information will be needed regarding route lengthening.
The typology used is not as detailed as needed. It does not correspond to all individual costsincurring through ATM-related delays, as they have been identified in the analysis of thedelay impact.
Flight deck crew information could be used, but does not provide information on theadditional costs incurred through the lengthening of the working period of flight crews fordelay reasons. Those marginal costs should be higher than the average, as allowances givenfor overtime hours are usually costly for airlines. The cost for spare crews cannot be identifiedwithin IATA data bases, having been added to the costs for crews in the course of theirnormal activity.
The same problem arises when considering flight equipment depreciation expenses.
The aircraft related charges include the charges paid for the parking of aircraft, but alsoinclude the fees paid for the use of runways, taxiways and ramp areas, lighting, etc. Parking ofaircraft charges are therefore not known.
Fuel and oil average expenses per flying hour do not inform about corresponding expensesspecific to cruise and taxi phases.
Cost of air transport delay in Europe
42
Most problems arise for the evaluation of indirect operating expenses, like passenger servicecharges. Contrary to ICAO (see §2.1.2 below), IATA typology allows for the independentidentification of station and ground expenses, cabin attendants expenses and passenger servicecharges.
As far as cabin attendants are concerned, the problem of evaluating the cost for spare crewsand additional hours is identical to the one identified with regards to flight deck crewexpenses.
Station and ground expenses include different items like remuneration of all station staff, andthe maintenance of airport facilities. From this item, one will not be able to identify the cost ofadditional equipment needed to transfer delayed passengers and luggage.Passenger service expenses include cost of personnel and supplies, extra costs for passengersincurred because of cancelled and delayed flights, the costs of other services provided forpassengers, the cost of flight kitchens, and overheads directly related to passenger service.
From this item, it would be therefore difficult to evaluate the cost of increasing the number ofground personnel staff needed to cope with problems caused by the late arrival of the aircraftto the connecting passengers and connecting luggage. The costs for re-routing passengers andfor commercial compensations given to the delayed passengers are also included in this item.But all these specific costs cannot be known individually.
ICAO
Data collected through ICAO could also be useful, as they include information for scheduledand non-scheduled airlines. Out of the available information, a group of airlines could beselected to estimate the average operating unit costs of airlines operating in Europe, but thismight be difficult, as time series concerning one or several main airlines could be incomplete.
The definitions used by ICAO differ from the ones used by IATA and some discrepanciesbetween the two sources exist.
The definitions adopted for the direct operating expenses seem to be quite similar to the onesused by IATA. On the other hand, passenger service costs are more widely defined in theICAO version than in the IATA one. Passenger service costs include cabin attendants andpassenger service personnel remuneration. They also include:• premiums for passenger liability insurance,• passenger accident insurance,• meals and accommodation,• expenses of handling passengers incurred because of interrupted flights…
This item is therefore not relevant to the estimation of neither the cabin attendants costs, northe passenger driven costs.
This analysis leads to the conclusion that IATA and ICAO cost data bases would not betotally appropriate for estimating the delay costs for airlines, when considering aircraftoperating costs (fuel, aircraft parking, maintenance), operating staff costs (flying and groundpersonnel), structural costs (fleet and ground equipment costs) and passenger driven costs

Cost of air transport delay in Europe
43
(meals and accommodation, re-routing, commercial compensations, loss of revenue).Furthermore, they would not be sufficient for assessing the induced airline costs that includethe loss of market share and loss of corporate image due to delays.
Individual airline expertise and data will therefore be necessary. It is known that the mainEuropean airlines are very conscious of the needed quality of services. They frequentlyconduct internal audit to appraise the impact of delays on the operating costs as well as on thepassenger level of satisfaction. Information would therefore be available directly from them.
Such data being often considered as confidential or sensitive, one would aggregate the data inorder to cope with confidentiality constraints. Furthermore, a sample of participating airlinesshould be built in order to take into account the various strategies adopted by either Europeanor non-European carriers. Scheduled carriers are more punctuality focused than non-scheduled carriers, hubbing airlines more than other airlines. Policy towards passenger re-routing, and passenger compensations for example, vary from one airline to another. As aconsequence, the amount of expenses incurred to solve problems due to delay will varyaccordingly. Those data will be used to estimate unit costs per minute of delay or per delayedpassenger, depending on the delay duration.

Cost of air transport delay in Europe
44
ANNEX 4
Value of time for passengers

Cost of air transport delay in Europe
45
Value of time estimated in different studies
Source Value of Time (1999) * Source Value of Time
(1999) *
Orlyval (1) 57 EUR/h (business) 37 EUR/h (tourism) Manchester (5)
78 EUR/h (long haul business passengers) 30 EUR/h (short haul optional passengers)
F.Heinitz (2) 22 EUR/h (business) 13 EUR/h (leisure) ITA (6) 54 EUR/h
Montpellier (3)model 1: 66 EUR/h model 2: between 49 EUR/h and 16 EUR/h
US study (7) between 38 EUR/h and 260 EUR/h
Chicago/Dallas (4) 38 EUR/h (business) 10 EUR/h (leisure) Chile (8) 40 EUR/h
* These values of time are extrapolated to 1999 taking into account the evolution of labour cost.(1) Orlyval : INRETS study for Orlyval in 1986/1987.(2) F. Heinitz : "Methodological Developments within the Quasi-Direct Format Demand Structure: the Multicountry Application for Passengers" F. Heinitz BETA n°9815 september1998.(3) Montpellier : « Valeur du temps de transport : l'apport de la modélisation micro-économétrique du choix modal » (1997) Thierry Blayac et Anne Causse, Université deMontpellier/SES/DEE/METL - Actes du colloque déplacements à longue distance. Février 1998
(4) Chicago/Dallas : "The choice of air carrier, flight, and fare class" - K. Proussaloglou, F.S.Koppelman - Journal of Air Transport Management (October 1999).(5) Manchester : Air traffic predictions for Manchester International Airport Authority - "Statedpreference methods" by E.P. Kroes and R.J. Sheldon - Journal of Transport economics and policy(January 1988).(6) ITA : Econometric model built by ITA to estimate the modal split between HST and airtransport (1993).(7) Chile : "Modelling route and multi-modal choices with revealed and stated preference data" -Juan de Dios Ortuzar - Transportation planning methods (september1996).(8) U.S. Study: "Impact of Air Traffic Management on Airspace User Economic Performance"J.H Sinncott and W.K. Mac Reynolds, in 2nd USA/Europe Air Traffic Management R&DSeminar, Orlando, December 1998.
Cost of air transport delay in Europe
46
ANNEX 5
Environmental costs

Cost of air transport delay in Europe
47
Environment could be affected by delays in two ways: aircraft emissions and noise.
WHICH TYPE OF DELAY?
Air transport needs fuel, which, burning into the atmosphere, produces emissions of pollutantsubstances. Through lengthening flight and taxiing times, delays have an effect on the volumeof emissions into the atmosphere.
METHODOLOGY
International requirements for emission inventories have been set up through severalinternational agreements adopted during the last 20 years. Parties to the conventions arerequired to submit annual emissions of CO2, NOx, CO, SOx, and VOC (Volatile OrganicCompounds). Several institutions are involved in the development of the methodology of sucha collection of information as far as air transport is concerned: the European Commission, theEEA (European Environment Agency), the ECAC (through the ANCAT working group).Research institutes are also associated to this work.
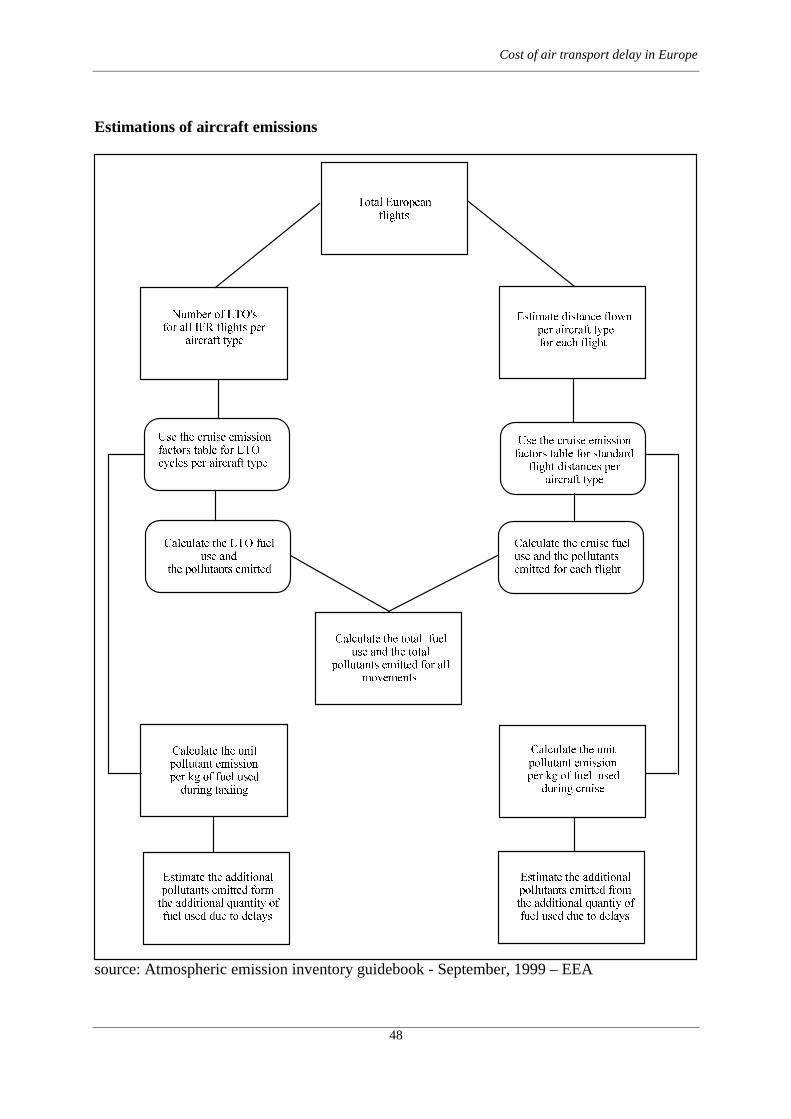
One of the existing methodologies proposed by the EEA10, in order to assess the overallemissions by the air transport industry is based on individual emission standards for eachengine or aircraft type involved in domestic or international air traffic. Three differentapproaches have been set up, as they may be significant differences in available data withindifferent countries. In a very simple approach, estimations will be made without considerationof the various types of aircraft involved.
A more detailed approach would be possible, as information could be gathered on the aircrafttypes used for both domestic and international aviation, and on the number of LTOs11 carriedout with the various aircraft types. Information regarding commercial flights and non-commercial flights could be found in CFMU data base. The Official Airline Guide (OAG)data base would offer only a limited scope, because non-scheduled flights and non-commercial flights are not included in such data bases.
The process for assessing emission costs is outlined in the following figure.
10 Source: Atmosphere emission inventory guidebook – September 199911 LTO is a landing and take-off cycle which includes all activities near the airport that take place under thealtitude of 1000 m and therefore includes taxi-in and out, climbing and descending. Cruise is defined as allactivities that take place at altitudes above 1000m.
Cost of air transport delay in Europe
48
Estimations of aircraft emissions
7RWDO�(XURSHDQIOLJKWV
1XPEHU�RI�/72VIRU�DOO�,)5�IOLJKWV�SHU
DLUFUDIW�W\SH
(VWLPDWH�GLVWDQFH�IORZQ�SHU�DLUFUDIW�W\SHIRU�HDFK�IOLJKW
8VH�WKH�FUXLVH�HPLVVLRQIDFWRUV�WDEOH�IRU�VWDQGDUG
IOLJKW�GLVWDQFHV�SHUDLUFUDIW�W\SH
&DOFXODWH�WKH�/72�IXHOXVH�DQG
WKH�SROOXWDQWV�HPLWWHG
&DOFXODWH�WKH�FUXLVH�IXHOXVH�DQG�WKH�SROOXWDQWVHPLWWHG�IRU�HDFK�IOLJKW
&DOFXODWH�WKH�WRWDO��IXHOXVH�DQG�WKH�WRWDO
SROOXWDQWV�HPLWWHG�IRU�DOOPRYHPHQWV
&DOFXODWH�WKH�XQLWSROOXWDQW�HPLVVLRQSHU�NJ�RI�IXHO�XVHGGXULQJ�WD[LLQJ
&DOFXODWH�WKH�XQLWSROOXWDQW�HPLVVLRQSHU�NJ�RI�IXHO��XVHG
GXULQJ�FUXLVH
(VWLPDWH�WKH�DGGLWLRQDOSROOXWDQWV�HPLWWHG�IRUPWKH�DGGLWLRQDO�TXDQWLW\�RIIXHO�XVHG�GXH�WR�GHOD\V
(VWLPDWH�WKH�DGGLWLRQDOSROOXWDQWV�HPLWWHG�IURPWKH�DGGLWLRQDO�TXDQWL\�RIIXHO�XVHG�GXH�WR�GHOD\V
8VH�WKH�FUXLVH�HPLVVLRQIDFWRUV�WDEOH�IRU�/72F\FOHV�SHU�DLUFUDIW�W\SH
source: Atmospheric emission inventory guidebook - September, 1999 – EEA

Cost of air transport delay in Europe
49
Individual aircraft emissions could be estimated from the tables derived from ICAO Exhaustemission databank and presented in the EEA methodology. Average cruise distances may bederived from airline schedules, but would not reflect the actual distances flown. Estimates ofadditional emissions due to delayed flights within the ECAC area would be possible, based oninduced additional fuel consumption. This would require the availability of informationconcerning taxiing and airborne delay duration.
Many environmental cost estimates have been carried out. Their main results, with regard tothe method of evaluation and the cost assessed in Euro per ton of pollutant are featured in“Pricing aircraft emissions at Lyon-Satolas airport”, a 1997 study by A. Perl, J.Patterson andM. Perez.
Several methods are identified: the first one seeks to calculate the direct evaluation ofdamage, the second one aims at revealing public preference through opinion research (the“willingness to pay” method) and the last is based on a calculation of the prices that would beneeded to avoid specific thresholds of air pollution. In addition, a proposal is made to identifyurban and rural pollution costs separately.
The authors of Lyon-Satolas’ study suggest mixing two approaches and assessing two rangeof prices for urban and rural zones: one based on minimal damage costs and the other onpotential avoidance costs, thus offering a spectrum of estimates to the policymakers who willhave to base their decisions upon.
The following table present the pollution prices in four different scenarios. These prices mightbe used to estimate the upper and lower bounds of the costs induced by air transport delays,i.e. in multiplying them by the additional amount of pollutant emissions, due to delays, ascalculated from the EEA emission table.
Cost (Euro/tonne) Rural/minimal Urban/minimal Rural/potential Urban/potential
NOx 1300 2782 2814 6018
HC 837 3251 1206 4682
SO2 516 3672 1450 10326
CO 159 159 180 180
CO2 32 32 38 38
Generally speaking, the present contribution of air transport to total global anthropogenic CO2
emission is considered to be about 2% by the International Panel on Climate Change (IPCC –1999). This relatively small contribution is due to the fact that most aircraft emissions areinjected almost directly into the upper free troposphere and lower stratosphere. IPCC hasestimated that the contribution to radiative forcing12 is about 3.5%.
12 radiative forcing is an index of the magnitude of a mechanism that can impact on climate. Positive valuesreflect a warming up of the climate, negative values reflect a cooling of the climate.

Cost of air transport delay in Europe
50
Noise is another source of emission that causes annoyance, mainly to the population livingunder the approach and departure paths of airports. New generation aircraft have becomequieter. Improved take-off performance of today engines means that aircraft climb much morequickly after take-off. Therefore significantly fewer people under the departure flight path arebeing disturbed. On approach, the disturbance created by aircraft is mainly due to the airframenoise, rather than to engines.
However, studies have been carried out to estimate noise social costs at airports and to checkwhether the existing noise charges cover social costs totally or only partially. According to theC. Lu and P.Morrell study13, at Amsterdam airport, the average noise social cost per landingis Euro 623, which is 3.6 times more than the current average noise charge at AmsterdamAirport Schiphol. This estimate is based on several variables, namely the Effective PerceivedNoise level (EPNdB) for take-off, sideline and approach for different types of aircraft (as thedynamic noise related data for a specific flight is impossible to obtain) and the average socialcost pricing method. This evaluation is based on the noise nuisance imposed on the residents,measured in monetary terms. The noise nuisance cost is itself derived from the annual averagehouse rent in the vicinity of airports, the noise depreciation index (NDI- percentage reductionof house price per dB(A) and the number of residences within the zone considered.
With regard to monetary consequences of delays, it seems that the only significant noiseimpact of delays would occur during stacks before landing. But, since aircraft are still flyingat a high altitude, since EPNdB measures during this flight stage have not been taken, theevaluation of this item would not be worthy of detailed study. Moreover, information onstacks is not readily available.
13 The evaluation and implication of environmental charges on commercial flights” C. Lu and P. Morrell- AirTransport Group – Cranfield University