cost/schedule/process modeling via system dynamicscsse.usc.edu/csse/event/1999/cocomo/3_madachy...
TRANSCRIPT
Cost/Schedule/Process Modeling via System Dynamics
Ray Madachy
Litton Guidance and Control Systems
USC Center for Software Engineering
14th International Forum on COCOMO and Software Cost Modeling
Octo'ber 26, 1999
Outline
Introduction to Process Modeling and System Dynamics Brooks's Law Demo,nstration
Model Structures and System Behaviors
Overview of Past Applications
Earned Value Dem~~vlstration
Rapid Application Development (RAD) Modeling and Process Concurrence Rayleigh Curve and Dynamic COCOMO Demonstration
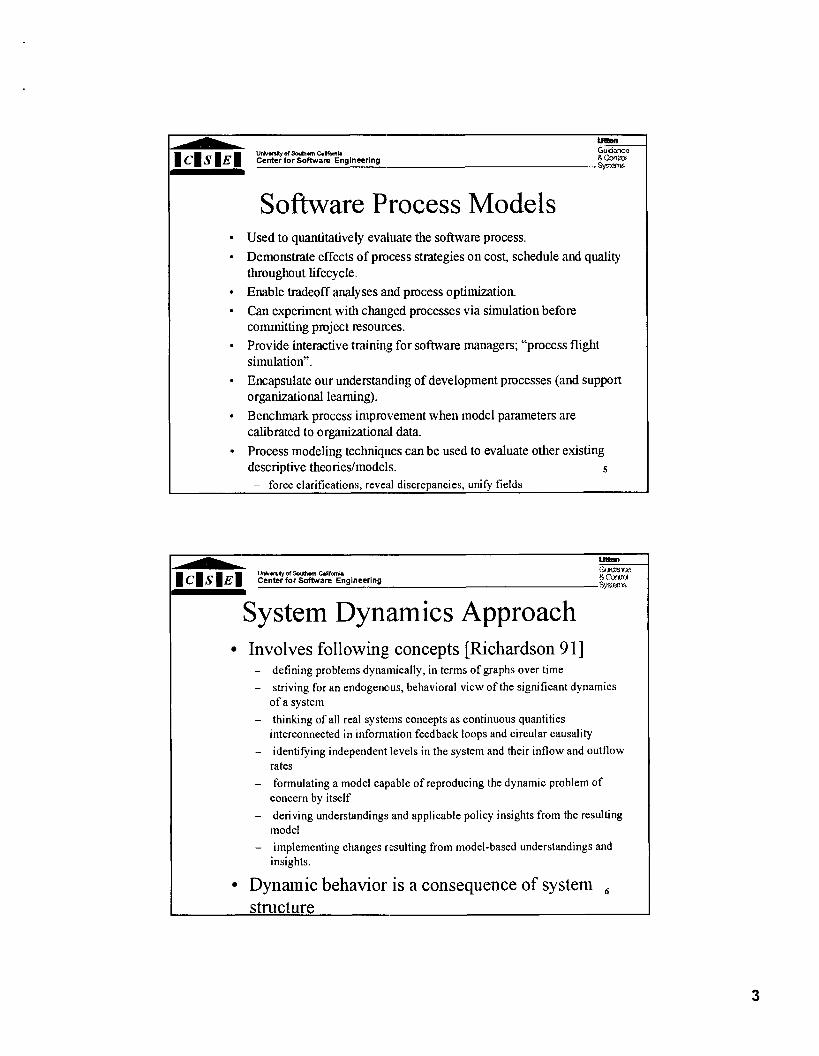
Terminology Svstem: a grouping of' parts that operate together for a common purpose; a subset of reality that is a focus of analysis
open, closed Software Process: a set of activities, methods, practices and transformations used by people to develop software.
Model: an abstract representation of reality.
static, dynamic; co~ntinuous, discrete
Simulation: the numerical evaluation of a mathematical model.
Svstem dvnami cs: a si mulation methodology for modeling continuous systems. Quantities are expressed as levels,, rates and information links representing feedback loops.
-!!e!!
U w r r * l o f S o h m C.lihmia ~ 3 l ~ m *
1 ~1 s I E 1 Center for Software Engineering R Ccxuol - qf'f 'W14
A Software Process Time
LC0 LCA IOC
Stagem
ictivities & tepresentative h o u n t s
A Process Activities
Requlrern ents Capture
Analysis 6. Desian --,,
Irn plementalion Te *-. . -. . . - - - ..-. .... . .. . .- ..
Supporting Activities Management Environment . . . . . - . Dep'oymenl .-..-..--.-...-..
v Iterations 4
-EE!
Uliv.ohy or m m C . G f r n i . Guffi~nc.3 I CI s I E I Center tor Software Engineering R CYlfrol Sy,.cm -
Software Process Models Used to quantitatively evaluate the software process. Demonstrate effects of prccess strategies on cost, schedule and quality throughout lifecycle. Enable tradeoff analyses and process optimization. Can experiment with changed processes via simulation before committing project resources. Provide interactive training for software managers; "process flight simulation". Encapsulate our understanding of development processes (and support organizational learning). Benchmark process improvement when model parameters are calibrated to organizationa~l data. Process modeling techniques can be used to evaluate other existing descriptive theories/models. 5
- force clarifications, reveal discrepancies, unify fields
System Dynamics Approach Involves following concepts [Richardson 9 11 - defining problems dynamically, in terms of graphs over time
- striving for an endogeno~us, behavioral view of the significant dynamics of a system
- thinking of all real systems concepts as continuous quantities interconnected in information feedback loops and circular causality
- identifying independent levels in the system and their inflow and outflow rates
- formulating a model capable of reproducing the dynamic problem of concern by itself
- deriving understandings and applicable policy insights from the resulting model
- implementing changes r~esulting from model-based understandings and insights.
Dynamic behavior is a consequence of system ,

Systems Thinking A way to realize the structure of a system that leads to it's behavior
Systems thinking involves: - thinking in circles and considering interdependencies
closed-loop causality vs. straight-line thinking - seeing the system as a cause rather than effect
internal vs. external orientation - thinking dynamically rather &.an statically
- operational vs. correlational orientation
Improvement through orgamzational learning takes place via shared mental models The power of models increase as they become more explicit and commonly understood by people - a context for interpreting and acting on data
System dynamics is a metho~dology to implement systems thinking and leverage learning efforts
7
Applicability to Software Processes Since software development is a dynamic and complex process with many factors, systsem dynamics is well-suited to analysis of software process improvement strategies - global system perspective - accounts for process feedback effects - can model inherent tradeoffs between schedule, cost and quality - accounts for critical path flows to analyze schedule as opposed to
traditional cost reduction analyses - enables low cost process experimentation
-!B!!?!!
G u l G m R Cmtrd sy;:m$.
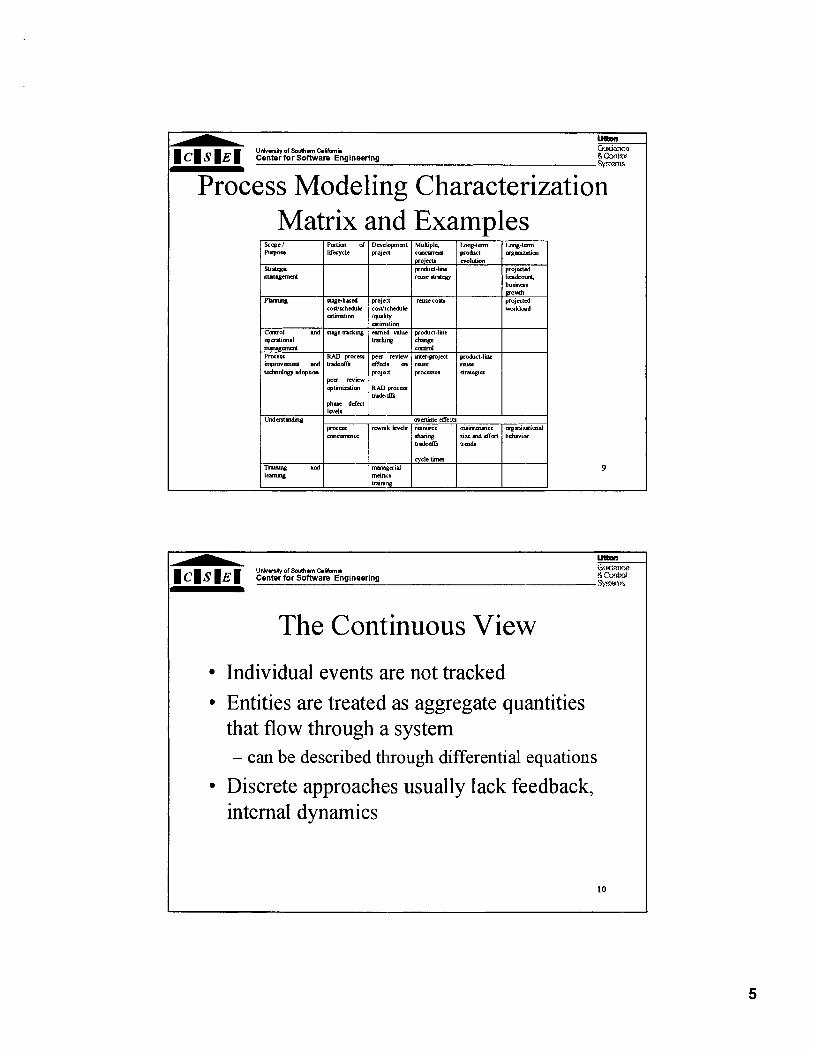
Characterization Matrix and Examples
Long-ism Long-Lcrm pr0bCl qsuE*im ~dlllon
p r o j d h d c w l bumm
p r o j d I__
The Continuous View
Individual events are not tracked Entities are treated as aggregate quantities that flow through a system
-. can be described through differential equations
Discrete approaches usually lack feedback, internal dynamics

System Dynamics Notation System represented by x '(t) = f(x, p) .
x: vector of levels (state variables), p: set of parameters
sink rate\ ) information link
auxiliary variable level 1 level 2
Example system: - & auxiliary
-!E!E
U n i v r r r d S o r h m C.lifmia GIJC?JK*. I C I s I E I Center for Software Engineering 6 CMKA s)s~l~, -
Modeling Process Overview
Iterative, cyclic policy implementation
u\
system understandings
\ policy analysis
Y
problem definition
/ simulation
\ model conceptualization
model f~rmul~ation 12

-- U r i v w of S o l h m Glifmi.
cuc.inca
1 C( s ( E ( Center for Sortware Engineering 8 Cmrd S p : m c -
Modeling Stages and Concerns problem definition context; symptoms
' reference behavior modes
model conceptualization -\ model purpose
y l system boundary \
model formulation FJ feedback structure
model representation
simulation
------- model behavior
evaluation --- reference behavior modes
13
Modeling Tools DYNAMO - Fortran-like programming language - modeler writes difference equations
IT= and Stella - visual programming, levels of ahrtraction
- some utilities for discrete components
Powersim - graphical interface - web-enabled simulations
Vensim - comprehensive package with graphical interface
- statistical estimation and model calibration facilities
Extend - iconic environment supports continuous, discrete-event and mixed mode simulation
- extensible with source code accer:s 14
Others

Outline
Introduction to Process Modeling and System Dynamics
Brooks's Law Demonstration
Model Structures and System Behaviors
Overview of Past Applications
Earned Value Demonstration Rapid Application Development (RAD) Modeling and Process Concurrence
Rayleigh Curve and Lvnamic COCOMO Demonstration
Brooks's Law Modeling Example "Adding manpower to a late software project makes it later" [Brooks 751. We will test the law using a simple model based on the fol lowing assumptions: - new personnel require training by experienced
personnel to come: up to speed
- more people on a .project entail more communication overhead
- experienced personnel are more productive then new personnel, on average.

Model Output for Varying Additions 1:l lWam d u d ~ p m a n t flC 2: r d h m dwdopnenl r.t. I.: sdkvr 4ole:~yr.rd ,fie
..................................I ........... .. .............- -...--.
'unction pointslday .... ....... ............
..................................................................................... 1
OD* 0 DO 76.W
Days 215 DO
Sensitivity of Software Development Rate to Varying Personnel Allocation Pulses
(1: no extra hiring, 2: add 5 people on 100th day, 3: add 10 people on 100th day) 18

Outline
Introduction to Process Modeling and System Dynamics
Brooks 's Law Demonstration
-b Model Structures and System Behaviors Overview of Past Applications Earned Value Demonstration Rapid Application Development (RAD) Modeling and Process Concurrence Rayleigh Curve and Lpnamic COCOMO Demonstration
Model Structure and Behavior Description of levels, flows, feedback loops Model building blocks Basic flow processes and infrastructures Summary of general system behaviors
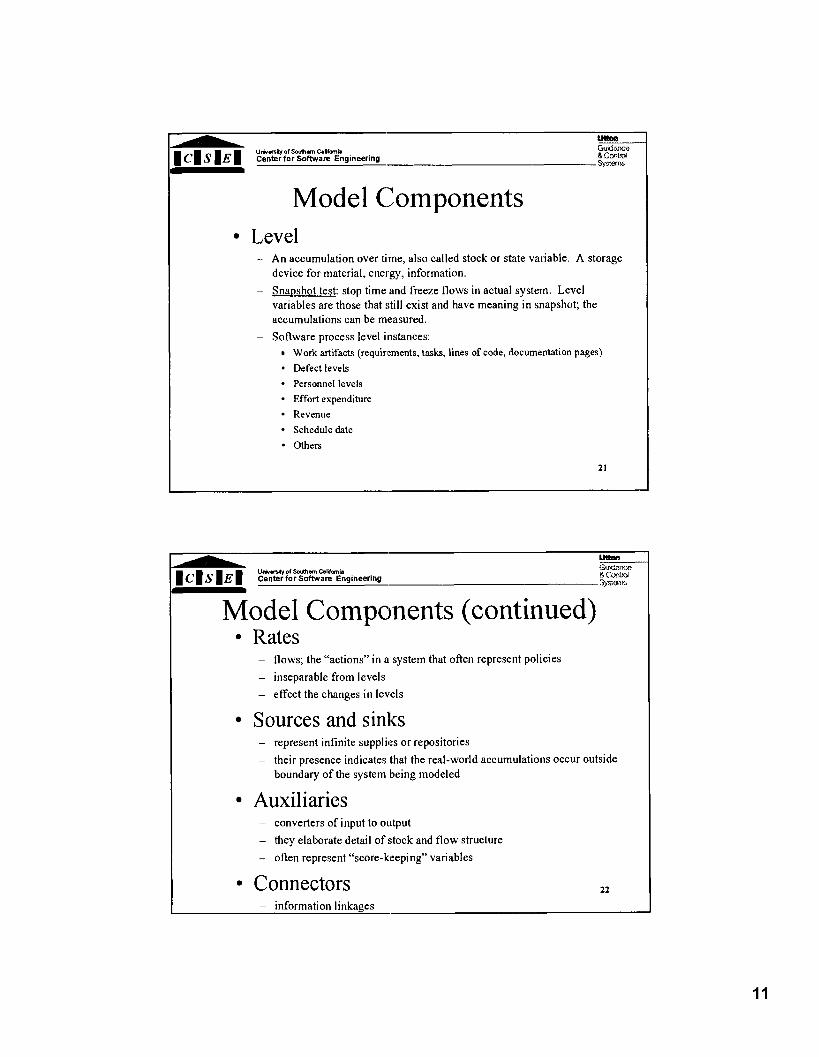
Model Components Level - An accumulation over time, also called stock or state variable. A storage
device for material, energy, information. - Snavshot test: stop time and freeze flows in actual system. Level
variables are those that still exist and have meaning in snapshot; the accumulations can be measured.
- Software process level instances: Work artifacts (requirements, tasks, lines of code, documentation pages)
Defect levels Personnel levels Effort expenditure Revenue Schedule date Others
Model Components (continued) Rates - flows; the "actions" in a system that often represent policies
- inseparable from levels - effect the changes in levels
Sources and sinks - represent infinite supplies or repositories
- their presence indicates that the real-world accumulations occur outside boundary of the system being modeled
Auxiliaries - converters of input to output
- they elaborate detail of r;tock and flow structure
- often represent "score-keeping" variables
Connectors 22
- information linkages
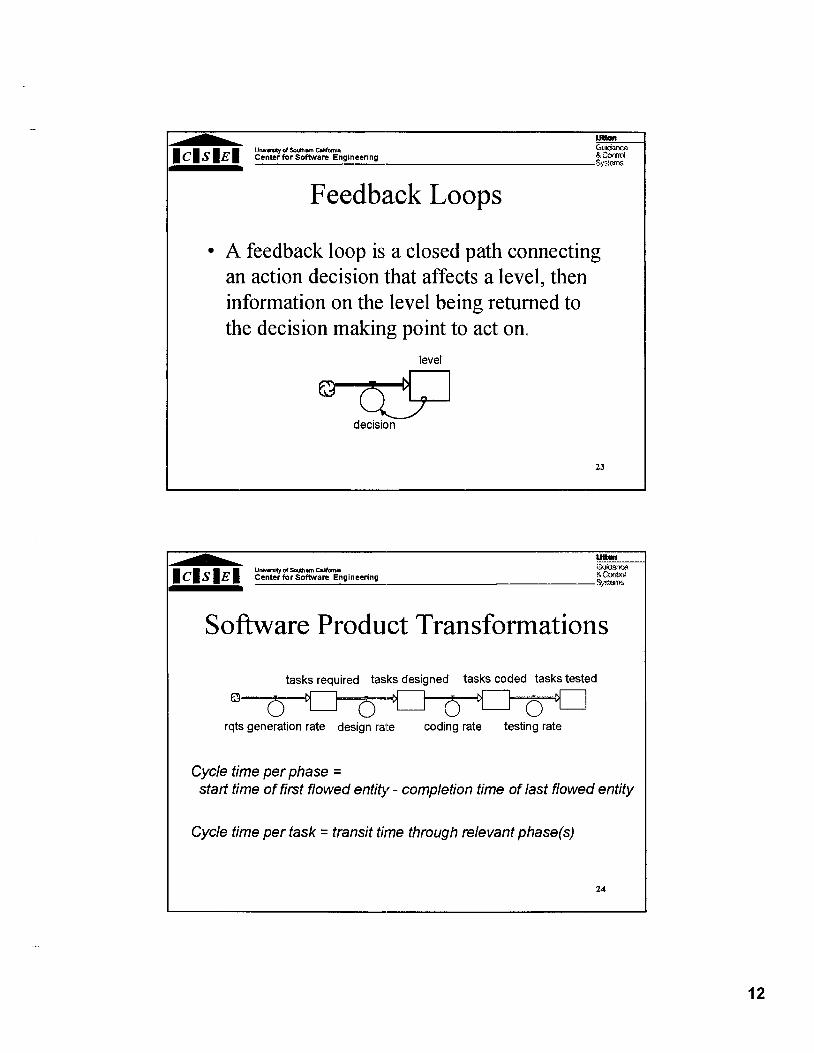
Feedback Loops
A feedback loop is a closed path connecting an action decision that affects a level, then information on the level being returned to the decision making point to act on.
level
w decision
Software Product Transformations
tasks required tasks designed tasks coded tasks tested
Q
rqts generation rate design rate coding rate testing rate
Cycle time per phase = start time of first flowed entity - completion time of last flowed entity
Cycle time per task = transit time through relevant phase(s)

Error Co-flows tasks designed
I design errors
design error 3 ge eration rate \
design error density
Error Detection and Rework error:; undetected errors
error generation rate I error escape rate
error d tection rate A detected errors
re , k ork rate
reworked errors
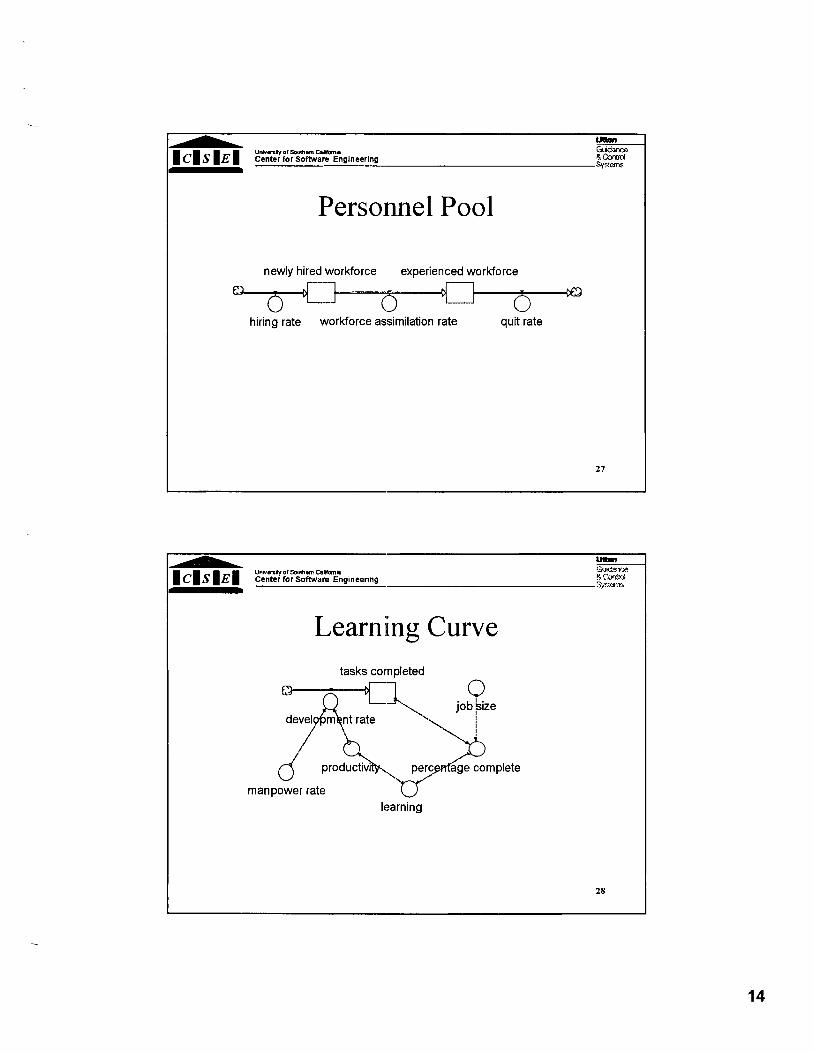
Personnel Pool
newly hired workforce experienced workforce
hiring rate workforce assimilation rate quit rate
Learnmg Curve tasks cornpleted
devel m nt rate
productiv~
manpower rate learning
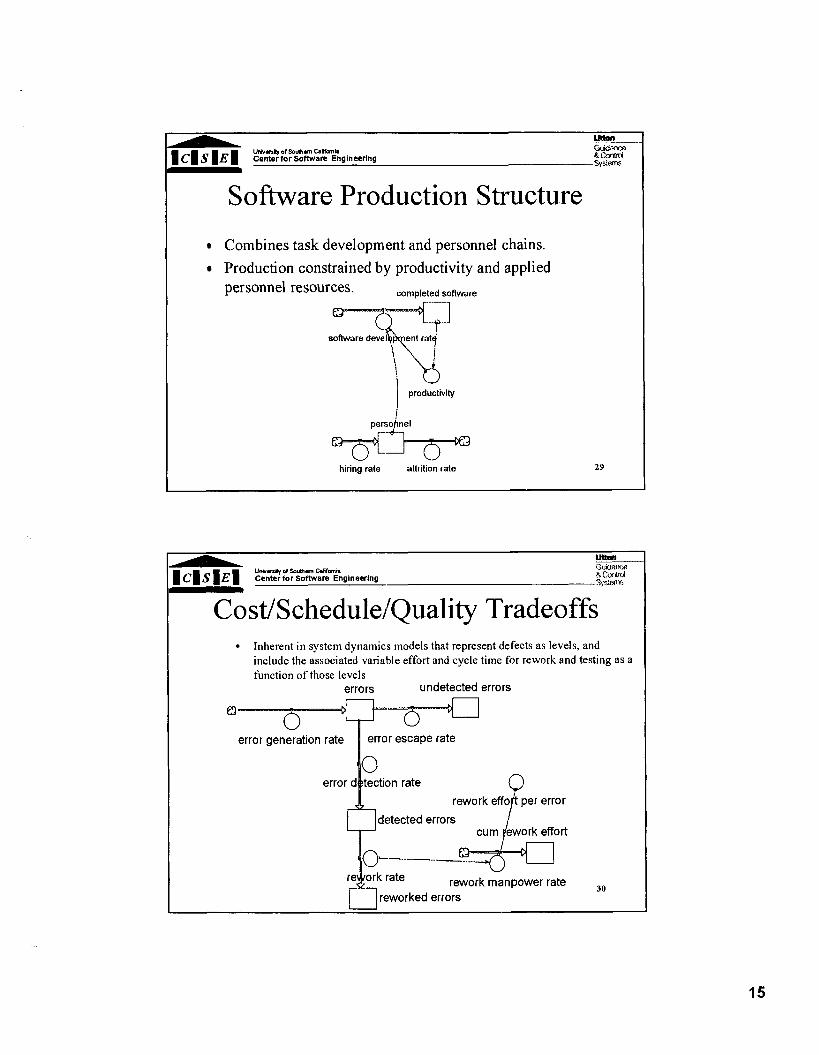
Software Production Structure
Combines task development and personnel chains. Production constrained by productivity and applied personnel resources. completed software
1 productivity
- hiring rate attrition rate
Cost/Schedule/Quality Tradeoffs Inherent in system dynamics models that represent defects as levels, and include the associated varialble effort and cycle time for rework and testing as a function of those levels
errors undetected errors
error generation rate error escape rate I error detection rate
rework effo per error
detected errors P
cum bwork effort
&--..-.. _e*a rework manpower rate ,,
reworked errors

-k!!!!m
uw*ri(y of w m ~ . l i f m i m G u i G m C( S I E ( Center for Software Engineering R anfd
S p : m
General System Behaviors
Behaviors are representative of many known types of systems. Knowing how systems respond to given inputs is valuable intuition for the modeler Can be used during model assessment - use test inputs to stimulate the system
behavioral modes
Svstem Order
I The order of a system refers to the number
I of levels contained.
I A single level system cannot oscillate, but a
I system with at least two levels can oscillate because one part of the system can be in disequilibrium.

Example System Behaviors
Delays Goal-seeking Negative Feedback - First-order Negative Feedback
- Second-order Negative Feedback
Positive Feedback Growth or Decline S-curves
Delays
Time delays are ubiquitous in processes They are important structural components of feedback systems. Example: hiring delays in s80ftware development. - the average hiring delay represents the time that a personnel
requisition remains open before a new hire comes on board

-- u*-otsol*lm Cam* Gilb5inoo I CI S I E I Center for Software Engineering R Crnrrol - sys:m<
Third Order Delay A series of 1st order delays
-A Graphs show water levels over time in each tank
Delay Summary
Delay order
Infinite (pipeline)
Pulse input - input
Step input - oaput
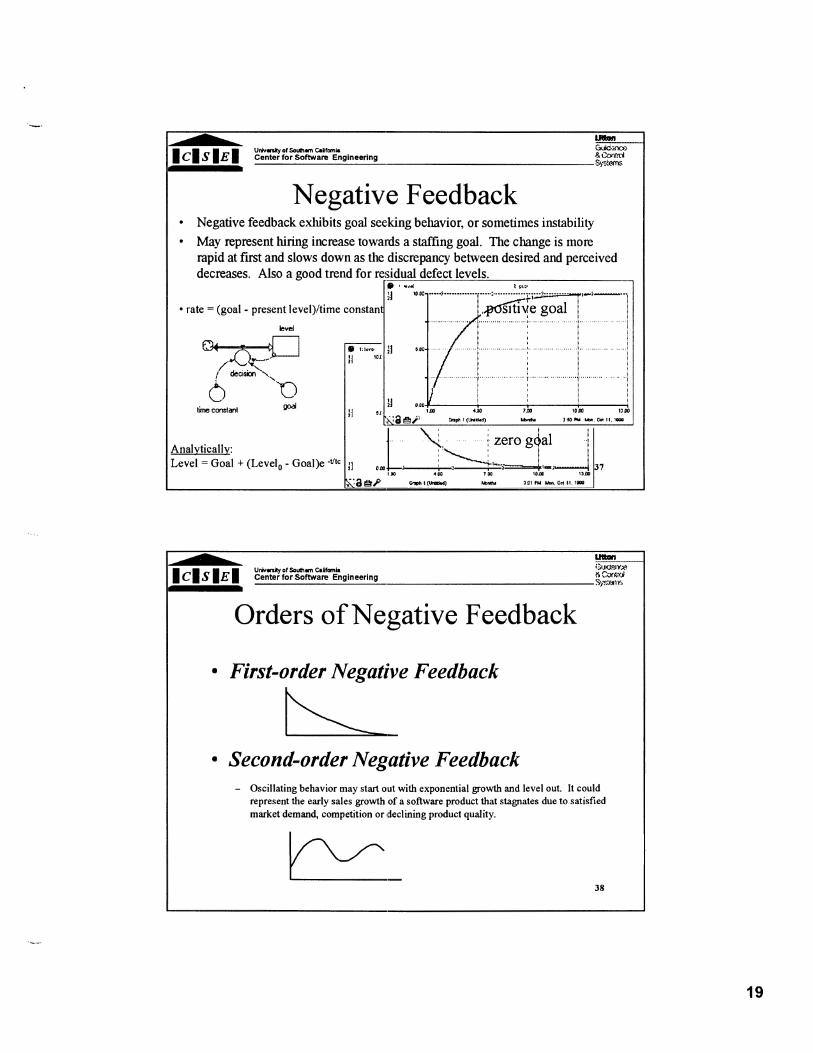
Negative Feedback Negative feedback exhibits goal seeking behavior, or sometimes instability May represent hiring increase towards a staffing goal. The change is more rapid at first and slows down as the discrepancy between desired and perceived decreases. Also a good trend for n
rate = (goal - present leve1)ltime constan
9nalvtically: ,eve1 = Goal + (Level,, - Goal)e -VtC ;I ,,
idual defect levels. D s r d t "a I
................... ............
.., ...................... ............. .............. i
.... ,"". . " . .
! I
lrn 4m 7.m lorn lam
gasp qnl(mrw - 1 4 rn -. OI It, I-
I I ' I
Orders of Negative Feedback
First-order Negative Feedback
Second-order Negative Feedback - Oscillating behavior may start out with exponential growth and level out. It could
represent the early sales growth of a software product that stagnates due to satisfied market demand, competition or declining product quality.
-!!!!E!
uwws~y of ~ollhm ~ . h l a m Gulb.inco I c ~ S IE ) Center for Software Englneerlng R CmM - sys:om<
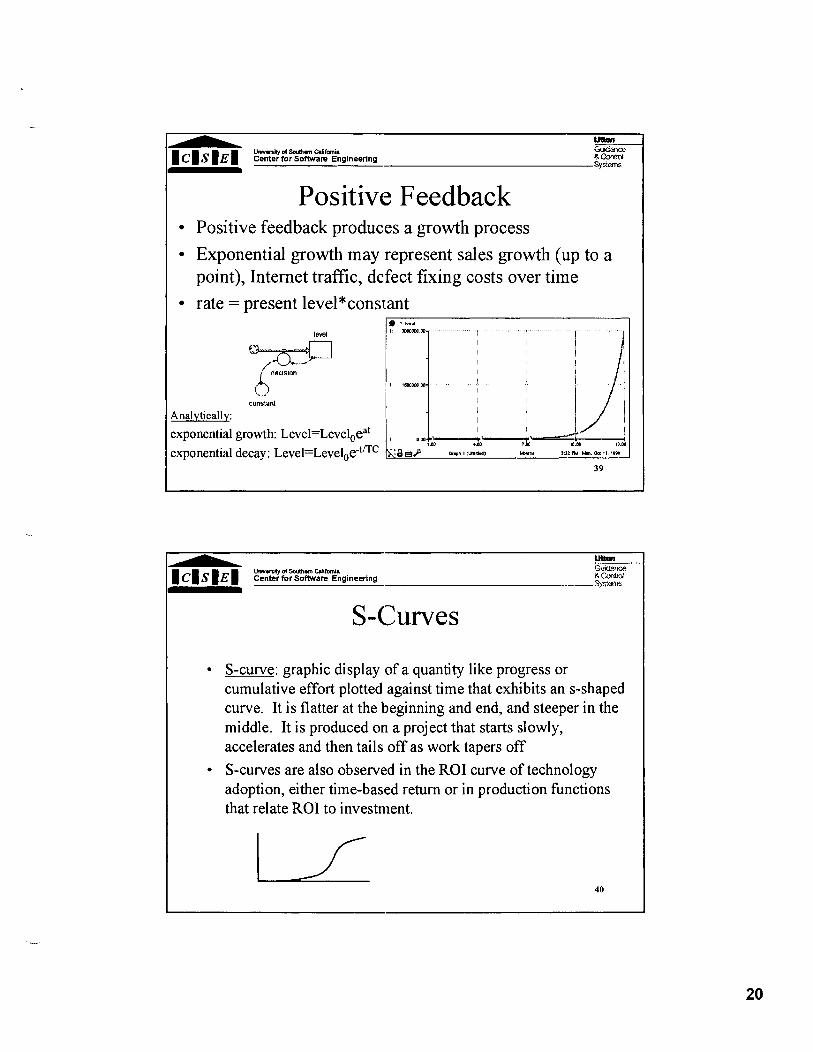
Positive Feedback Positive feedback produces a growth process Exponential growth may represent sales growth (up to a point), Internet traffic, defect fixing costs over time rate = present level*constant
halvticallv: I
:xponential growth: Level=Levebeat , I 7 m 10 m
:xponential decay: ~ e v e l = ~ e v e b e " ~ ~ ~ sa BE .wn I (-1 bnn, 112 111 Yln om , , We
39
-!!%I!!
U*rrw of a m C. l fa ia Gui~i(i~wx?
I C) S IE 1 Center for Software Engineering 3 Camd 3,%ma -
S-curve: graphic display of a quantity like progress or cumulative effort plotted against time that exhibits an s-shaped curve. It is flatter at the beginning and end, and steeper in the middle. It is produced on a project that starts slowly, accelerates and then tails off as work tapers off
S-curves are also observed in the ROI curve of technology adoption, either time-based return or in production functions that relate ROI to investment.
-- UrkrrRyof Sahm C . T f m i . G u i d m ~ I c ( S I E ( Center for Software Engineering R CYUKI - sydm<
Outline
Introduction to Proces's Modeling and System Dynamics Brooks 's Law Demonstration
Model Structures and System Behaviors Overview of Past Applications Earned Value Demonstration
Rapid Application Development (RAD) Modeling and Process Concurrence Rayleigh Curve and Dynamic COCOMO Demonstration
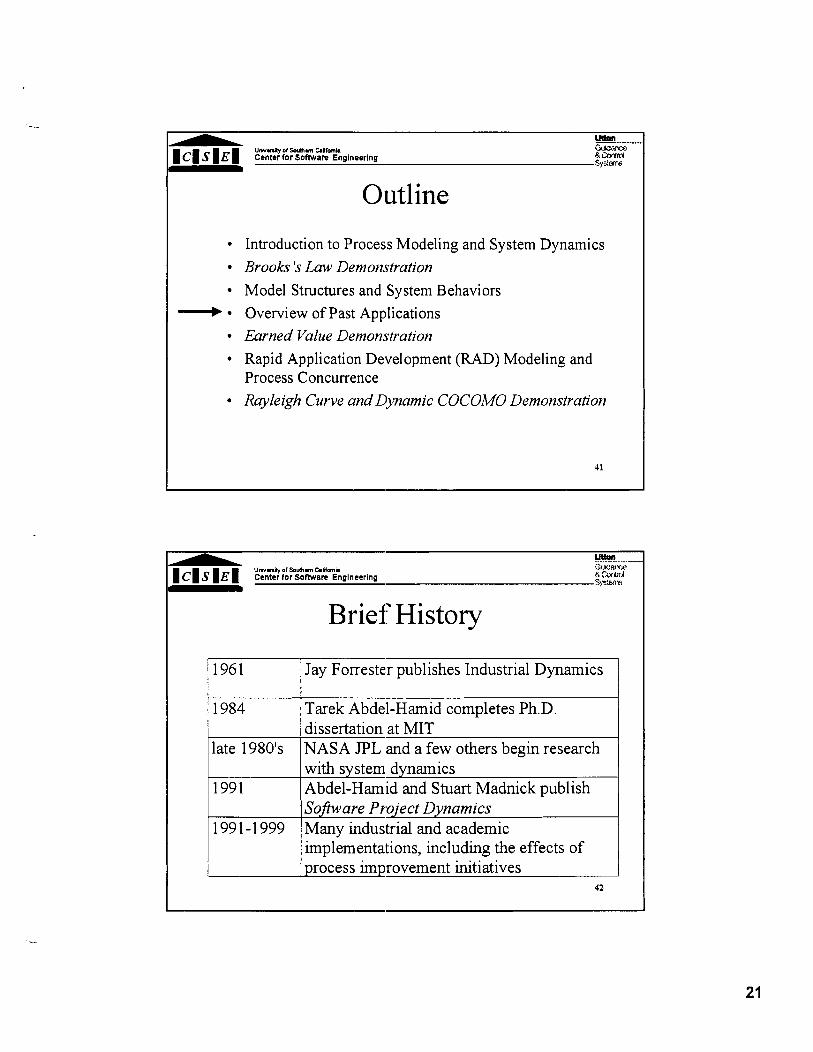
Brief History
Jay Forrestelr publishes Industrial Dynamics
1984 I Tarek Abdel-Hamid completes Ph.D. 1 dissertation at MIT
late -- 1980's NASA JPL and a few others begin research
implementations, including the effects of Drocess im~rovement initiatives

-!!!!!z
urivrri(y of somm cal i fmm Guld&no, 1 C ) s ( E ) Center for Software Engineering R Cmtrol S~B?-F -
Model Implementations Industry/govemment: AT&T, Bellcore, Draper Labs, Fedex, Hughes, Litton, Mitre, NASA, Siemens, others
Academic: ASU, Imp'erial College, Stanford, MIT, Naval Postgraduate School, USC, others
Tool vendors/worksh(~: Bartz Associates, Dynarnica, Rubin Systems
Many other companies are evaluating system dynamics for process improvement
Several academic rese:arch projects in proposal stage or dissertations being written
Process Evaluation Investigating the dynamic effects of inspections [Madachy 941, [Tvedt 951 Incremental development [Tvedt 951 Unit testing phase [Collafello et al. 961
Requirements phase (several) Investigating software reuse from a macro- inventory perspective [Abdel-Hamid 93 a]
Software outsourcing [Collafello et al. 991 Process model tradeoffs 44

Process Evaluation (continued) Organizational CMM-based process improvement (Burke 96) Other process improvement investments
staffing policies work environment investments computer aided tool investments
staff training investments metrics, reuse, risk management and others
Global software process feedback, stability and product evolution [Lehman 981 45
Flight Simulators Personnel training
graduate software project management (ASU)
vendor tools (Rubin et al.)
Navigating new skies process maturity initiatives
Stimulate dialogues for shared mental models Virtual reality for court cases
-!mr
U n k m k y a f S r n m C a r h i . G u c : ~ I C I s I E I Center for Software Engineering L Cmtrol - Syoiem
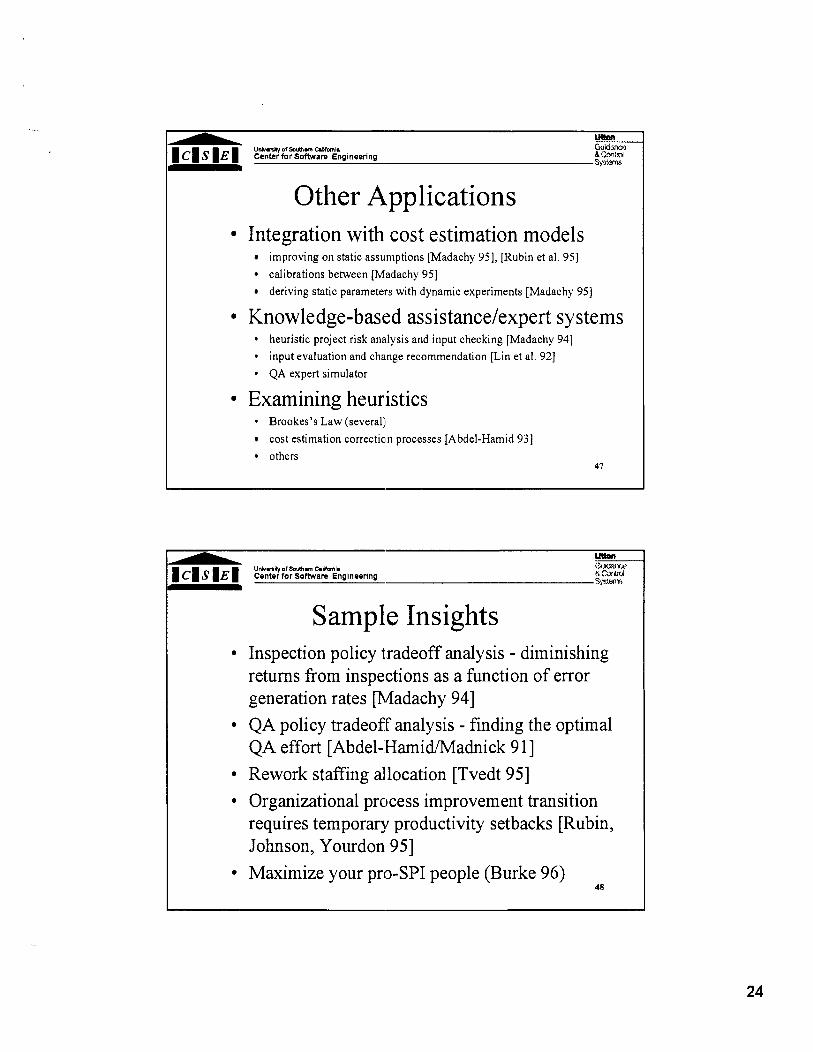
Other A.pplications Integration with cost estimation models
improving on static assumptions [Madachy 951, p u b i n et al. 951
calibrations between madachy 951 deriving static paramete:rs with dynamic experiments [Madachy 95)
Knowledge-based assistance/expert systems * heuristic project risk anailysis and input checking [Madachy 941 * input evaluation and change recommendation [Lin et al. 921
* QA expert simulator
Examining heuristics * Brookes's Law several:^
cost estimation correcticm processes [Abdel-Hamid 931
others 47
-- Unkrrty of S r l h m Calfomla ib~K%l~*. I C I S ) E I Center for Software Engineering 3 C x d d - 3,w41W
Sample Insights Inspection policy tradeoff analysis - diminishing returns from inspections as a function of error generation rates [Madachy 941 QA policy tradeoff analysis - finding the optimal QA effort [Abdel-:Hamid/Madnick 9 11 Rework staffing allocation [Tvedt 951 Organizational process improvement transition requires temporary productivity setbacks [Rubin, Johnson, Yourdon 951 Maximize your pro-SPI people (Burke 96)
48

Umhnty of M r n Ulfrmh Guc:X!OY I CI S I E I Center for software Engineering & Cmrrol ge:m< -
Sample Insights (continued) Leverage of experienced staff (several) Internal workings of Brookes's Law - training and communication losses Schedule compression not a static decision [Abdel-Hamid 901 Anchor-dragging in project control [Abdel-Hamid 931 Competing feedback loops in software reuse factory [Abdel-Hmid 93b]
Many others 49
Example Product Chains
I' Tvedt 95

Example :Defect Chains
a=-- * r o r m m m --& m m .
Abdel-Hamidmadnick 9 1
Example Personnel Chains
personnel pool - Madachy 94
hiring and penonnel allocatbn attrttbn rate

~ n k ~ o f ~ m ~ s ( i m h Guffi.inco I C [ S I E [ Center for Software Engineering C C Y W sy::m< -
Abdel-Hamid Model Subsystems
Management T-Ff available
A -Ee!
Ve&a$ of5otdIm Q&i :&.~Nz I C I S I E [ Center for software Engineering S CMxd - >,=:ma
Abdel-Hamid Model Behavior
Underestimation factor = .67
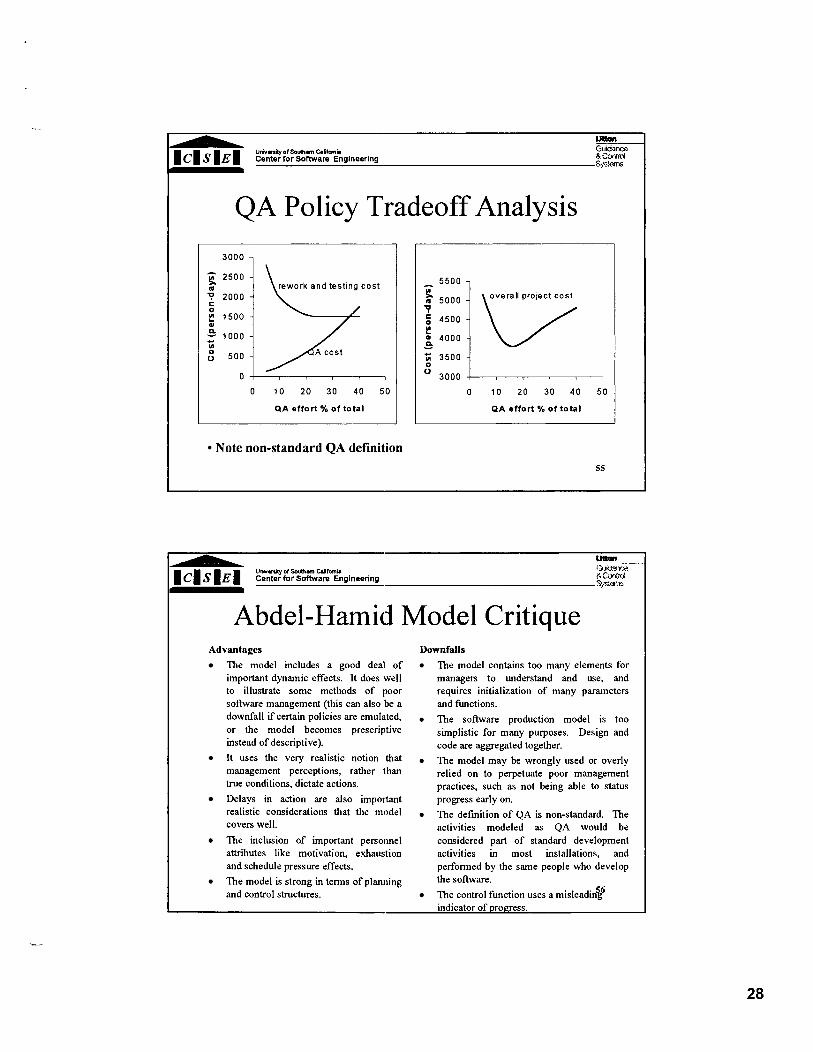
QA Policy Tradeoff Analysis
0 10 20 3 0 40 50
Q A effort % o f total Q A effort % o f total
Note non-standard QA definition
-L!!e!
U w m d Samm Cdfani Euaww
I CI s I E I Center for Software Engineering R CxW - 3p:mln
Abdel-Hamid Model Critique Advantages
The model includes a good deal of important dynamic effects. It does well to illustrate some methods of poor sofhvare management (this can also 'be a downfall if certain policies are emuladed, or the model becomes prescriptive instead of descriptive).
It uses the very realistic notion that management perceptions, rather lhan true conditions, dictate actions.
Delays in action are also important realistic considerations that the model covers well.
The inclusion of important personnel attributes like motivation, exhaustion and schedule pressure effects.
The model is strong in terms of planning and control structures.
Downfalls The model contains too many elements for managers to understand and use, and requires initialization of many parameters and functions.
The software production model is too simplistic for many purposes. Design and code are aggregated together.
The model may be wrongly used or overly relied on to perpetuate poor management practices, such as not being able to status progress early on. The definition of QA is non-standard. The activities modeled as QA would be considered p a ~ I of standard development activities in most installations, and performed by the same people who develop the software.
The control function uses a misleadin16
-- Uwms?fofSoJlm C.Nrmb &icjm
I CI S I E I Center for Sortware Enginewing 8. C m s,?::m% -
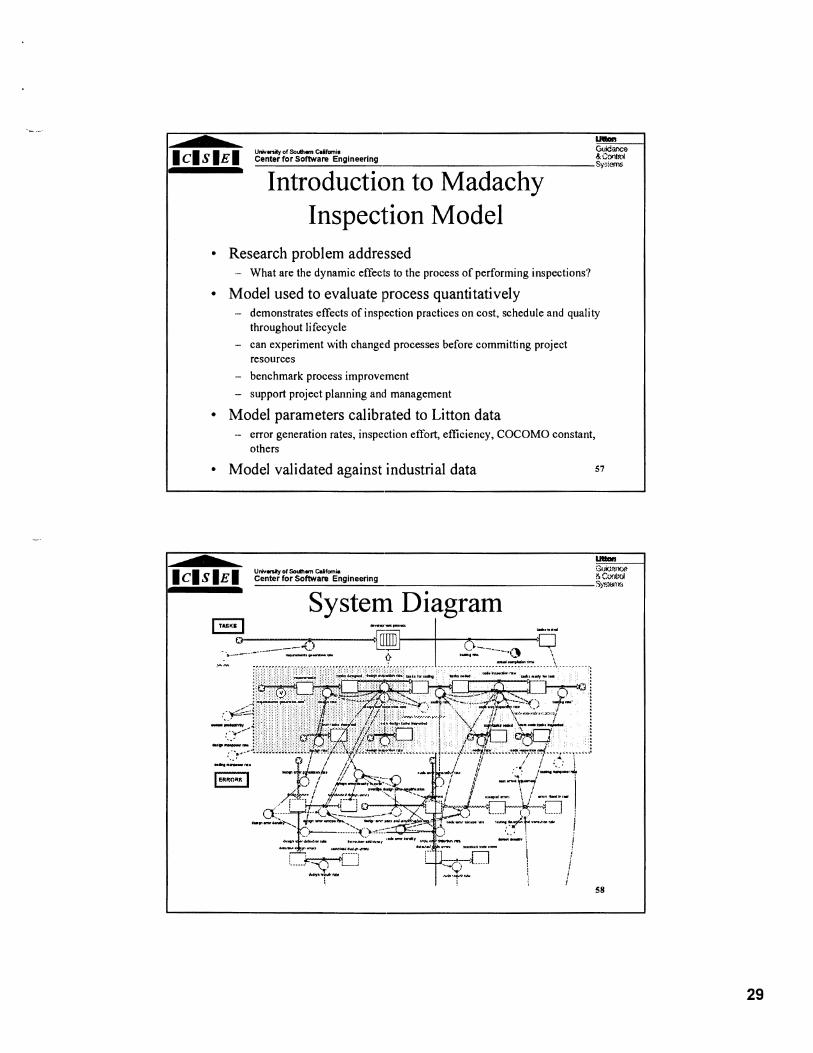
Introduction to Madachy Inspection Model
Research problem addressed - What are the dynamic effects to the process of performing inspections?
Model used to evaluate process quantitatively - demonstrates effects of inspection practices on cost, schedule and quality
throughout lifecycle - can experiment with changed processes before committing project
resources - benchmark process improvement - support project planning and management
Model parameters calibrated to Litton data - error generation rates, inspection effort, efficiency, COCOMO constant,
others
Model validated against industrial data 57
- System Diagram
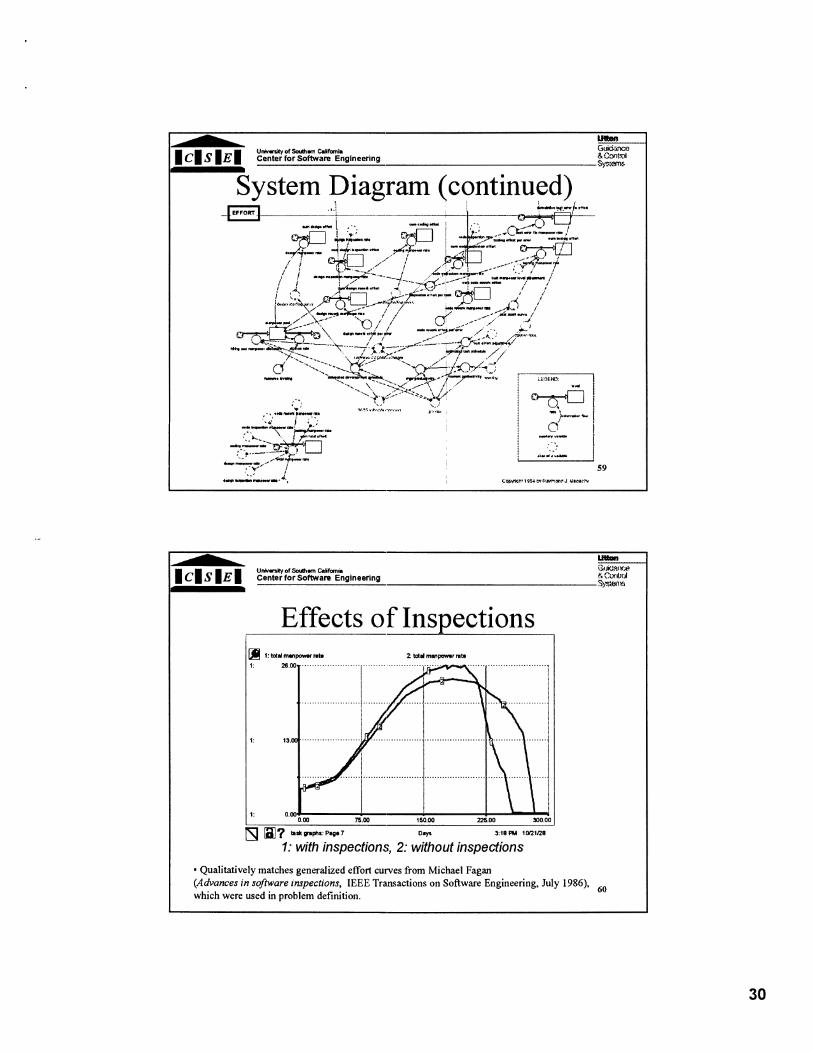
System Diagram (continued)
Effects of Ins~ections
- 1: with inspections, 2: without inspections
Qualitatively matches generalized effort curves from Michael Fagan (Advances in sofware inspections. IEEE Transactions on Software Engineering, July 1986), 60
which were used in problem definition.

Sample Project Progress Trends From wadachy 941
Inspection Policy Tradeoff Analysis Varying error generation rates shows diminishing returns from inspections [Madachy 941:

Error Multiplication Effects
Design Error Multiplication
Derivation of Phase Specific Cost Driver - -.-..-.---...-.-. .............. -. ............. ...............................................................................
~ C O M O Rating for Simulation Parameters ................................................................................................... i design ins~ection ~ract ice I code ins~ection ~ract ice I Use of lns~ections
0 I 0 l Nominal
.5 .5 High .--------.- .. ..............-- . 7 1 Very High j
R q l l and Delalled Code and IniepnUon Produd Dedpn UnH T e a and Ted Dedpn
Phase

Risk Analysis A deterministic point estimate from a simulation run is only one of many actual possibilities Simulation models are ideal for exploring
risk test the impact of input parameters
test the impact of different policies
Monte-Carlo analysis takes random samples from an input probability distribution
65
Monte-Carlo Example Results of varying inspection efficiency:
Effort Bin (Persondays)
66
-!!BE!
urivrdyo1SammC.Unnia G u i ' i m ( C( S ( E ( Center for Soflware Engineering R CY-W
sys:rm< - Contributions of Madachy
Inspection Model Demonstrated dynamic effects of performing inspections.
New knowledge regarding interrelated factors of inspection effectiveness.
Demonstrated complementary features of static and dynamic mode1,s.
Techniques being adopted in industry.
CS599 Software Process Modeling Student Term Projects
Dynamics of architecture development process in MBASE inception and elaboration phases Application of RAD techniques to pre-IPO internet companies COTS glue-code development and integration dynamics Reuse and language-level effects in software development CMM-based process improvement strategies
68

Outline
Introduction to Process Modeling and System Dynamics Brooks 's Law Demonstration
Model Structures and System Behaviors
Overview of Past Applications
Earned Value Demon,stration Rapid Application Development (RAD) Modeling and Process Concurrence
Rayleigh Curve and Dynamic COCOMO Demonstration
U ~ + C L ~ of SMmm Cdhh G$JII~SXZ
1 CI S 1 E Center for Software Engineering 5 cz6;ol r;,r:uwi -
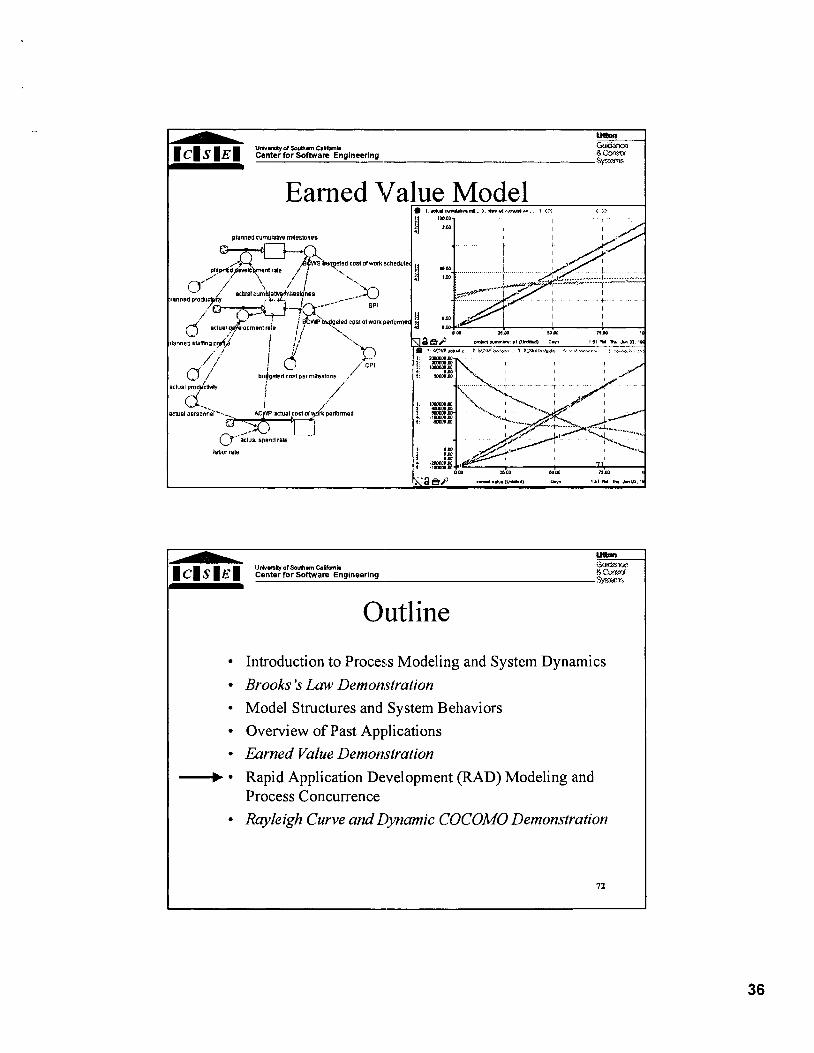
Earned Value
Earned value is a method for measuring project performance. It compares the amount of work that was planned with what was actually accomplished to determine if cost and schedule performance is as planned. Cost performance index (CPI) is the ratio of budgeted costs to actual costs (BCWPIACWP) Schedule performance index (SPI) is the ratio of work performed to work scheduled (BCWPA3CWS) 70
me??!! uwmty of samm ~ d r o m i i G f f i x m 1 CIS I E I Center for Software Engineering R cmrd Sy::m~ -
Earned Value Model
-!E!!!.!
Urivmty of amhm C.Iromim :~~JKZIK.X?
1 CI s I E I Center for Software Engineering 5 Cx$d S,%fAlv, -
Outline
Introduction to Process Modeling and System Dynamics
Brooks 's Law Demonstration
Model Structures and System Behaviors
Overview of Past Applications
Earned Value Demonstration
Rapid Application Development (RAD) Modeling and Process Concurrence
Rayleigh Curve and Lvnamic COCOMO Demonstration

A -&!!eE
U*rr$otsDlmm Cdfmia Guffimx I C I s I E I Center for software Engineering L C m d sy::ah< - Context for RAD Parameter Hypothesis Testing
Develop a model that isolates the effects of the factor of interest (e.g. RVI-IL, BPRS)
Eliminate other confounding effects besides chosen parameter Model the underlying mechanics for the chosen parameter Instrument cost and schedule in the model
Run planned experiments that vary the parameter of interest over the desired range Independently derive effort and schedule multipliers fi-om the trials 73
Umon Urn-dy 01 % l m m C.hhu .>CJO?IKP
I C I s I E I Center for Software Engineering 5 CTW S.,swra
TD Modeling Examde: Process Reengineering and Streamlining
Run this model at different settings for number of approvals per task and time taken per approval
Derive schedule mu1t:ipliers from experiments 74

Process Concurrence
Process concurrence refers to interdependency constraints between tasks, both within and between phases.
Describes how much work becomes available for completion based on previous work accomplished. Bottlenecks on the availability of work Concurrence relations can be sequential, parallel, partially concurrent, or other
75 dependent relationships.
Trying to Accelerate Software Production software tasks
u4d personnel
restricted channel flow
(partially adapted from Putnam 80)

- -- Umm&ydSa#tm Cahh ~ l l c o I C( s 1 E ( Center for Software Englnccrlng R Cmm - 9,-:m<
Limited Parallelism of Software Activities
There are always sequential constraints independent of phase: - analysis and specification
- figure out what you're supposed to do - development o f something (architecture, design, code, test plan, etc.) - assessment
- verify/validate/review/debug - possible rework recycle of previous activities
These can't be done totally in parallel with more applied people - Different people can perform the different activities with limited
parallelism, but downstream activities will always have to follow some OF
I I software tasks , / software tasks
Funnel View of Limited Parallellism

Mythical Man-Month Sequential constraints imply tasks cannot be partitioned. -- Applying more people has no effect on
schedule
Men and months are interchangeable o when tasks can be partitioned with no communication among them.
Internal Process Concurrence
Internal process concurrence relationship shows how much work can be done based on the percent of work already done. The relationships represent the degree of sequentiality or concurrence of the tasks aggregated within a phase.

me.!! UluL- of Slhm CaLifani. Guid.jm ( C( s ( E ( Center for Software Englneering CmW rj,::m<
L i n e a r and Non-linear Internal Process Concurrence
less parallel integrat~on
region of parallel work
initial work on important segment: other segments ha\ to Walt unt~l these are done
Percent o f Tasks Completed and Released P.re.nI o r Tasks CompI.t.d and Rd.as.4
A lockstep relationship. The overarching segments of software 81 .
must be completed before other parts can beg~n
Internal Concl rence Examples
Percent of Tasks Completed and Released Percent of Tasks Conpleted and Released
Complex system development where Simple conversion task where tasks tasks are dependent due to required can be partitioned with no communication inter-task communication. 82

External Process Concurrence
External process concurrence relationships describe constraints on amount of work that can be done in a downstream phase based on the percent of work released by an upstream phase. See examples on following slides - More concurrent processes have curves near the
upper left axes, and less concurrent processes have curves near the lower and right axes.
83
-!EF
univcrq of m m ~ a ~ f r m i G~m;su;r I CI s ( E I Center for Software Engineering 5 CxR;ol - ~,%WIY,
External Process Concurrence
I
Typical non-linear external process concurrence relationship

No Inter-phase Relationship
0 25 50 75 100
Percent of Upst ream T a s k s Released
N o dependencies between the phases.
The downstream phase can progress independently of the upstream phase.
The entire downstream work is available to be completed with none of the upstream work re1 eased.
85
Relationship
0 25 50 75 1W
Percent of Upstream Tasks Released
None of the downstream phase can occur until the upstream phase is totally complete. Like a theoretical waterfall development process where no phase can start until the previous phase is completed and verified. Same as a finish-stop relationship in a critical path network.

me!!!! U&ni(y of S o h m C.lifania G u c : ~ I CI S I E I Center for Software Engineering R Cmt6
S y s i m - Parallel Inter-phase Relationship
0 25 50 7 5 100
Percent o f Upstream Tasks Rckased
The two phases can be implemented completely in parallel.
The downstream phase can be completed as soon as the upstream phase is started.
-!E!E!
U k n V o f S o h m Califania Ol~aolxx? I CIS I E I Center for Software Engineering R Cad:d - s>5:w1n
Delayed St:art Inter-phase Relationship
The downstream phase must wait until a major portion of the upstream phase is completed, then it can be completed in its entirety.
Like a start-start relationship in a critical path network.
Percent o f Upstream Tasks Released

-B!E
utivwsityof s o l h m ~.li(omi Guc.mm ( c ( S ( E ( Center for Sortware Engineerlng R Cnnrd - sy;,.r:om<
Lockstev Inter-~hase Relationship
The downstream phase can progress at the same speed as the upstream phase; thus they are in lockstep with each other.
Like stovepipe components stacked on top of each other, similar to building the stories of a skyscraper. This relationship is not available in PERTICPM methods.
0 25 50 75 100
Persent o f Upstream Tasks Released
-LC, -Be!
urw.n* of s o l h m Cdfmi. Gim;%x.x? I C( s ( E ( Center for Sortware Ensheering ?j Cad~d
U e l a v with Partiallv ~ o n c u r r e n r Inter-phase Relationship
The downstream phase has to wait until a certain percentage of upstream tasks have been released, and then can proceed at varying degrees of concurrence per the graph.
Representative of much s o h a r e development work.
This relationship is not available in PERTICPM.
0 25 50 75 100
Percent of Upstream Tasks Released

Roles Have Different Mental Models
Percenl of
Design Tasks
Avadable to
Initially Complete
0.00 10 Percent of Product Definilion Tasks
Released
Differing perceptions upstream and downstream (Ford-Sterrnan 97)
Four Estimates of Extcrunl Process Concurrence Krlstiunship between the PrtHLuct nefinition and De5,ign Phases
-E!!!!!
UW- of S ~ W " c r r h m CIII(:?~& 1 C( S ( E ( Center for Software Engineering 5 Cx$d - 3,?Wlr3
RAD Awareness Hypothesis: to optimize ~~chedule on a complex project with partial inter-phase concurrency, the optimal systems engineering staffing is front-loaded vs. constant level-of-effort - downstream development is constrained by the specifications available
Case 1: not RAD aware Case 2: RAD aware
SE staff t--
A Ulllon VrrLmm* of Sorlhm C.lfrm,. &I&m 1 C I S I E 1 Center for Software Engineering C Cmrd
sy'j'm
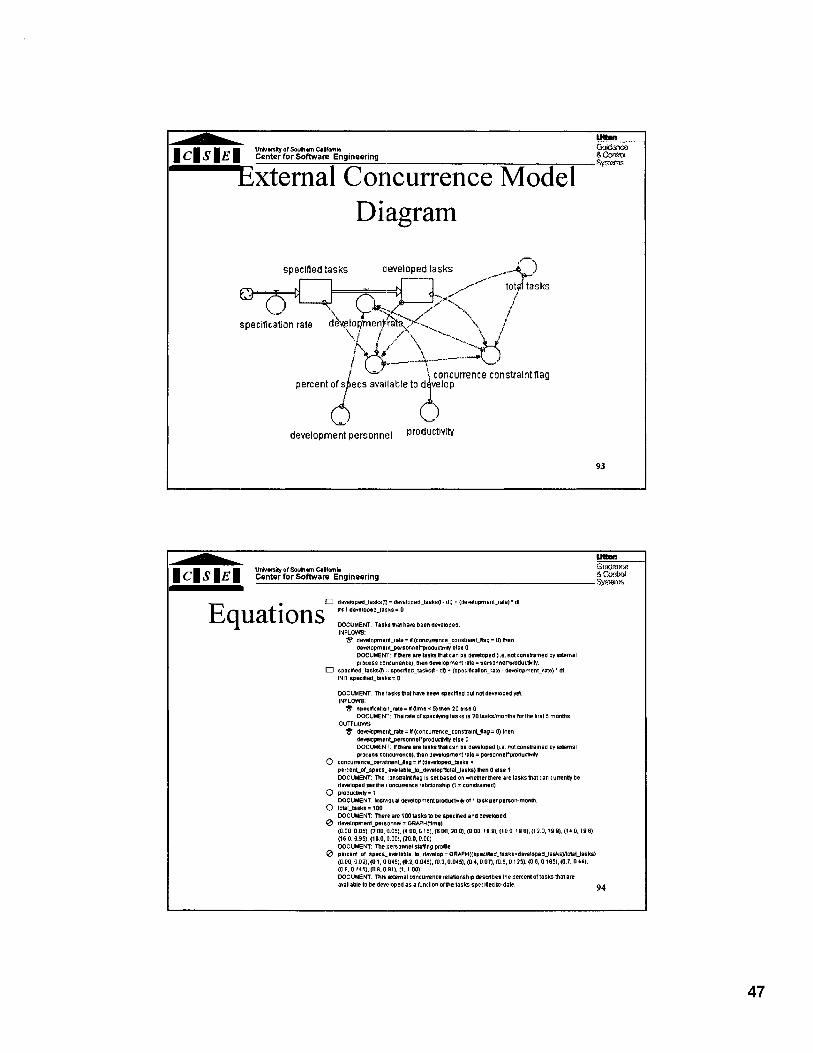
' E x t e r n a l Concurrence Model Diagram
specified tasks Oleveloped tasks /--
- - --
I \ concurrence constraint nag percent of s jecs available to d4velop
development personnel productivity
n Os*eloPsdlaskS~ = ds*BIODSddlaPk60 9 + (OB*BIOpmBnIIr~lB~~ 01 INIT devel0PeO.lssk8= 0 Eq uat on DOCUMENT W n a l ha% beendWlOOea. INFLOWS: b aevslopmsnl~rste = ~f(conrvmnce.consbs~nt~IIag = O) lhan
asvelopmemgersonnerpmaumw el61 0 DOCUMENI: n m e n are lasemat tan be amloped (I.e.nm conswared ayexlernal process to~w~rence) , mendMlopmentrale=penonnePpmducMhr.
0 spscmsd.bsem :: sps~rnna~bshso - aq - (spsriMcnlan_na - dBIBIDpmBII(.rale) -dl INIT tpsrmed-tasks= 0
m a , o rra1,coa,ooi1 (1.1 oo, WCUMENT m l s m m a l conturrence Rlalionshlp destrlber the pertedortasksU?al are nalhble lo be devrbped ar a runcllon ofmetasks specllealo dale 94

Out 1 ine
Introduction to Process Modeling and System Dynamics
Brooks 's Law Demonstration
Model Structures and System Behaviors
Overview of Past Applications
Earned Value Demonstration Rapid Application Development (RAD) Modeling and Process Concurrence
Rayleigh Curve and Dynamic COCOMO Demonstration
Rayleigh Manpower Distribution
Rayleigh curve is a popular model of personnel loading
Assumptions: - Only a small number of people are needed at the beginning of a project to
carry out planning and specification. As the project progresses and more detailed work is required, the number of staff builds up to a peak. After implementation and unit testing is complete, the number of staff required starts to fall until the product is delivered.
- The number of people working on a project is approximately proportional to the number of problems ready for solution at that time

Rayleigh Formula
A Rayleigh curve describes the rate of change of manpower effort per the following first order differential equation:
-- dC(t) - p(t)[K - C( t ) ] dt
where C(r) is the cumulative effort at time t, K is the total effort, and p(r) is a learning function. The learning function is linear and can be represented by
p( t ) = 2at
where a is a positive number.. The manpower rate of change represents the number of people involved in development at any time (staffing profile). The a parameter is an important determinant of the peak personnel loading called the manpower buildup parameter.
97
Rayleigh Model cumulative effort P 1
1
leaming fun
estimated total manpower buildup parameter
b w 2 a L i i o

Interactive Rayleigh Model Demo
Vary manpower buildup parameter
References Abdel-Hamid T, Investigating the cost/schedule tradeoff in software development, IEEE Software, January 1990 Abdel-Hamid T, Madnick S, Sofhuare Project Dynamics, Englewood Cliffs, NJ, Rentice-Hall, 1991 Abdel-Hamid T. Adapting, correcting. and perfecting software estimates: a maintenance metaphor, IEEE Computer, March 1993 Abdel-Hamid T, Modeling the dynamics of software reuse: an integrating system dynamics perspective, Resented at the Sixth Annual Workshop on Software Reuse, Owego, NY, November i 9 9 j Burke S, Radical Improvements Require Radical Actions: Simulating a High-Maturity Organuation, Sofhvare Engineering Institute, CMUISEI-96-TR-024, June 1997 Brooks F, The MythicalMan-Month, Readin& MA, Addison-Wesley, 197 Ford D. S t m a n J, Dynamic Modeling of Product Development Rocesses. MIT Sloan School of Management, D-4672, January 1997 Collofello J, Roehling S, System Dynamics Modeling Applied to Software Outsourcing Decision Support, Roceedings of RoSim Workshop '99, Portland, OR, June 1999 Forrester MI. Industrial Dynamics. Cambridge. MA: MIT Press, 1961 Kin C, Abdel-Hamid T, Sherif J, Software-engineering process simulation model. TDA Progress Report 42-108, Jet Propulsion Laboratories, February 1992 Madachy R, A software project dynamics model for process cost, schedule and risk assessA%t, PhB. dkrtat i&, ~ c ~ ; r & e n t of industrial andsystems Engineering, USC, December 1994

References (cont .) Madachy R, System Dynamics and COCOMO; Complementary Modeling Paradigms, Proceedings of the Tenth International Forum on COCOMO and Software Cost Modeling, SEl, Pitfsburgh, PA, 1995
Madachy R, System Dynamics Modeling of an Inspection-Based Process, Proceedings of the Eighteenth International Conference on Software Engineering, IEEE Computer Society Press, Berlii Germany, March 1996 Putnam L, Tutorial: Sofhvare Cost Estrmating and Life-Cycle Control: Getting the Software Numbers, IEEE Computer Society Press, New York, NY, 1980
Richardson GP, Pugh A, Introduction to System Dynamics Modeling wrth DYNAMO, MIT Press, Cambridge, MA, 1981
Rubin H, Johnson M, Yourdon E, Software process flight simulation: dynamic modeling tools and metrics, Information Systems Management, Summer 1995 Tvedt J, Collofello J, Evaluating the efectiveness of process improvements on software development cycle timevia system dynamics modeling, University of Arizona, 1995
USC-CSE Web Sites http://sunset.usc.edu/research-group/ray/spd - portions of forthcoming book: Madachy R, Boehm B, Sofhvare Prwess Dynamics, IEEE
Computer Society Press, Washington, D.C., 2000
http://sunset.usc.edu/classes/cs599-99 101
- USC-CSE Software Process Modeling Course (include other system dynamics links)