couloir gouter rapport - petzl usa
TRANSCRIPT
June 2020
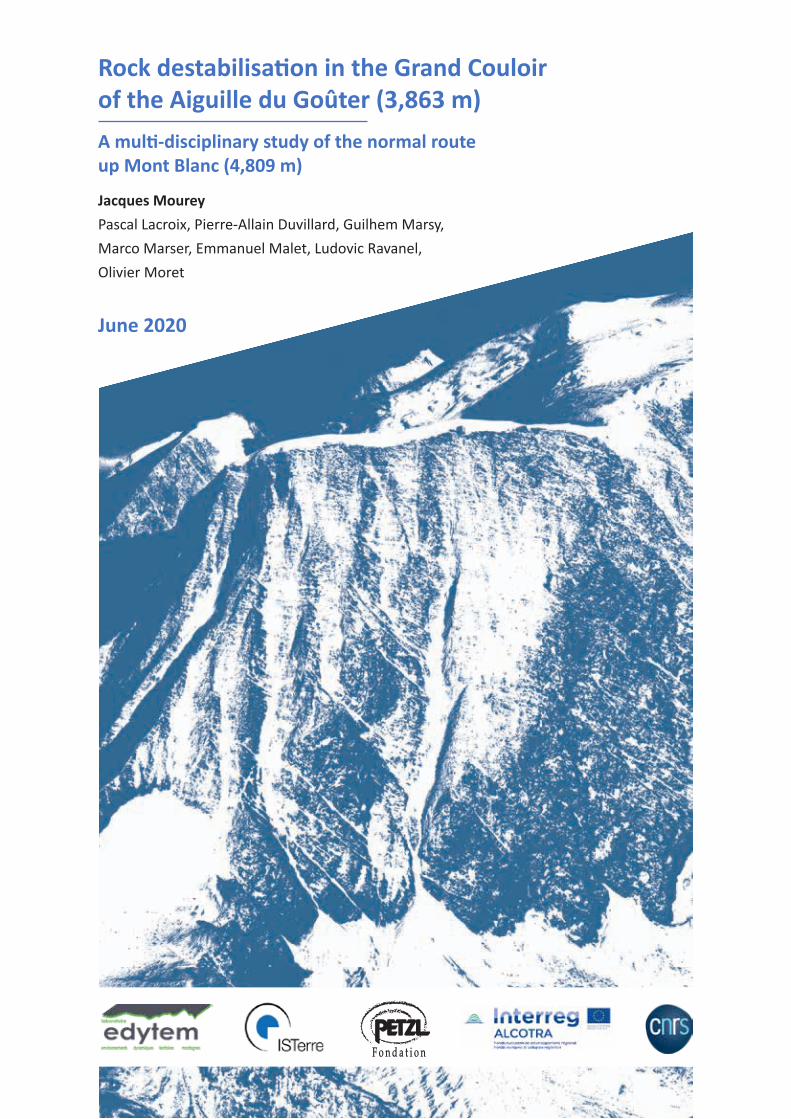
Rock destabilisation in the Grand Couloir of the Aiguille du Goûter (3,863 m)A multi-disciplinary study of the normal routeup Mont Blanc (4,809 m)
Jacques MoureyPascal Lacroix, Pierre-Allain Duvillard, Guilhem Marsy, Marco Marser, Emmanuel Malet, Ludovic Ravanel, Olivier Moret
1 Université Grenoble Alpes, université Savoie Mont-Blanc, CNRS, EDYTEM, 73000 Chambéry, France, [email protected] ISTerre, IRD-CNRS-OSUG, université Grenoble Alpes, 38400 Saint-Martin-d’Hères, France.3 Université Grenoble Alpes, université Savoie Mont-Blanc, LISTIC Polytech Annecy-Chambéry, France.4 TENEVIA, 38240 Meylan, France.5 Université Grenoble Alpes, Institut de Géographie Alpine, CNRS, PACTE, 38041 Grenoble, France.6 Fondation Petzl, ZI Crolles, 38920 Crolles.
Jacques Mourey1,Pascal Lacroix2, Pierre-Allain Duvillard1, Guilhem Marsy1, 3, 4 , Marco Marser5 , Emmanuel Malet1, Ludovic Ravanel1, Olivier Moret6
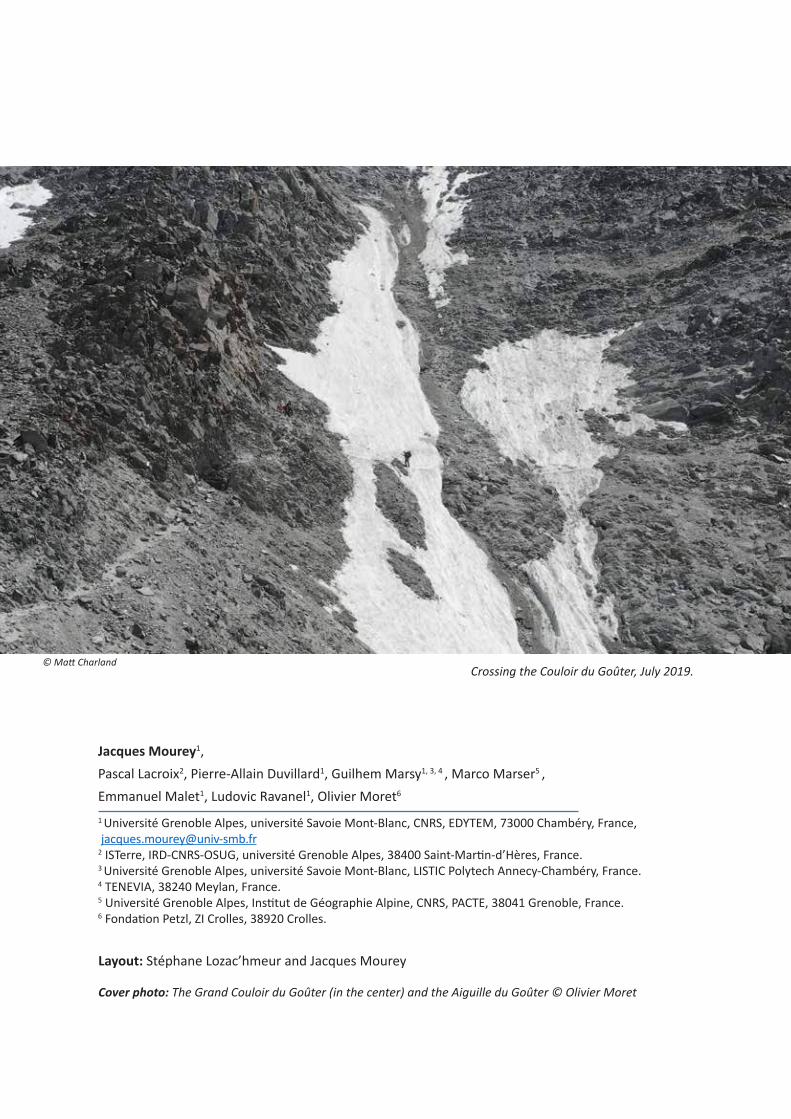
Crossing the Couloir du Goûter, July 2019.© Matt Charland
Layout: Stéphane Lozac’hmeur and Jacques Mourey
Cover photo: The Grand Couloir du Goûter (in the center) and the Aiguille du Goûter © Olivier Moret
3
Déstabilisations rocheuses - Grand Couloir du Goûter
Table of contents
Introduction................................................................................................. 4
1. Multi-parameter monitoring..................................................................... 5 1.1. Continuous monitoring of rock destabilisation using seismic sensors............................... 6
1.2. Photographic monitoring of snow cover in the Grand Couloir.......................................... 8
1.3. Characterisation and modelling of the thermal state of permafrost.................................. 9
1.4. Continuous monitoring of visitor traffic............................................................................ 9
2. Characteristics of rock destabilisation events in the Grand Couloir du Goûter......... 10 2.1. Seasonal scale................................................................................................................. 10 • Number of events....................................................................................................10 • Magnitude of the events..........................................................................................11 2.2. Daily scale.........................................................................................................................12 • Number of events.....................................................................................................12 • Magnitude of the events............................................................................................13
3. Factors conditioning the occurrence of rock destabilisation......................14 3.1. Rock destabilisation conditioned by the quantity of groundwater...................................14 The effects of freeze-thaw cycles........................................................................................... 15 3.2. The role of snow in triggering rock destabilisation.......................................................... 17 3.3. The role of freeze-thaw cycles in triggering rock destabilisation………………………............ 17 • Seasonal scale........................................................................................................ 17 • Daily scale.............................................................................................................. 18 3.4. Variations in the daily pattern between Periods 1, 2 and 3............................................. 19 Key points.............................................................................................................................. 20 3.5. A topographical and geological context conducive to rock destabilisation..................... 20 3.6. Permafrost deterioration: the cause of major events late in the season......................... 21
4. Visitor traffic, rock destabilisation and accidentology............................... 24 • Seasonal scale..........................................................................................................24 • Daily scale.................................................................................................................27 Feedback from the 2017 season............................................................................................ 28
Conclusion.................................................................................................. 29
Key insights................................................................................................. 30
Acknowledgements.................................................................................... 31
4
Déstabilisations rocheuses - Grand Couloir du Goûter
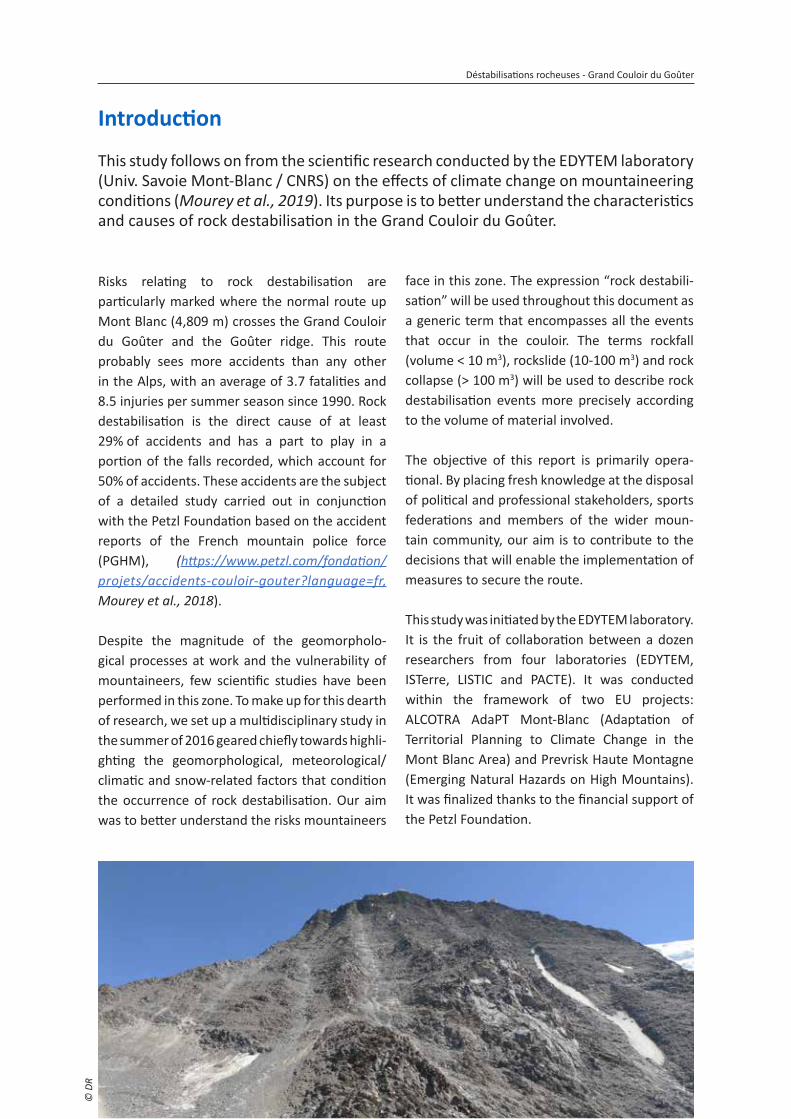
Risks relating to rock destabilisation are particularly marked where the normal route up Mont Blanc (4,809 m) crosses the Grand Couloir du Goûter and the Goûter ridge. This route probably sees more accidents than any other in the Alps, with an average of 3.7 fatalities and 8.5 injuries per summer season since 1990. Rock destabilisation is the direct cause of at least 29% of accidents and has a part to play in a portion of the falls recorded, which account for 50% of accidents. These accidents are the subject of a detailed study carried out in conjunction with the Petzl Foundation based on the accident reports of the French mountain police force (PGHM), (https://www.petzl.com/fondation/projets/accidents-couloir-gouter?language=fr, Mourey et al., 2018).
Despite the magnitude of the geomorpholo-gical processes at work and the vulnerability of mountaineers, few scientific studies have been performed in this zone. To make up for this dearth of research, we set up a multidisciplinary study in the summer of 2016 geared chiefly towards highli-ghting the geomorphological, meteorological/climatic and snow-related factors that condition the occurrence of rock destabilisation. Our aim was to better understand the risks mountaineers
face in this zone. The expression “rock destabili-sation” will be used throughout this document as a generic term that encompasses all the events that occur in the couloir. The terms rockfall (volume < 10 m3), rockslide (10-100 m3) and rock collapse (> 100 m3) will be used to describe rock destabilisation events more precisely according to the volume of material involved.
The objective of this report is primarily opera-tional. By placing fresh knowledge at the disposal of political and professional stakeholders, sports federations and members of the wider moun-tain community, our aim is to contribute to the decisions that will enable the implementation of measures to secure the route.
This study was initiated by the EDYTEM laboratory. It is the fruit of collaboration between a dozen researchers from four laboratories (EDYTEM, ISTerre, LISTIC and PACTE). It was conducted within the framework of two EU projects: ALCOTRA AdaPT Mont-Blanc (Adaptation of Territorial Planning to Climate Change in the Mont Blanc Area) and Prevrisk Haute Montagne (Emerging Natural Hazards on High Mountains). It was finalized thanks to the financial support of the Petzl Foundation.
This study follows on from the scientific research conducted by the EDYTEM laboratory (Univ. Savoie Mont-Blanc / CNRS) on the effects of climate change on mountaineering conditions (Mourey et al., 2019). Its purpose is to better understand the characteristics and causes of rock destabilisation in the Grand Couloir du Goûter.
Introduction ©
DR
5
Déstabilisations rocheuses - Grand Couloir du Goûter
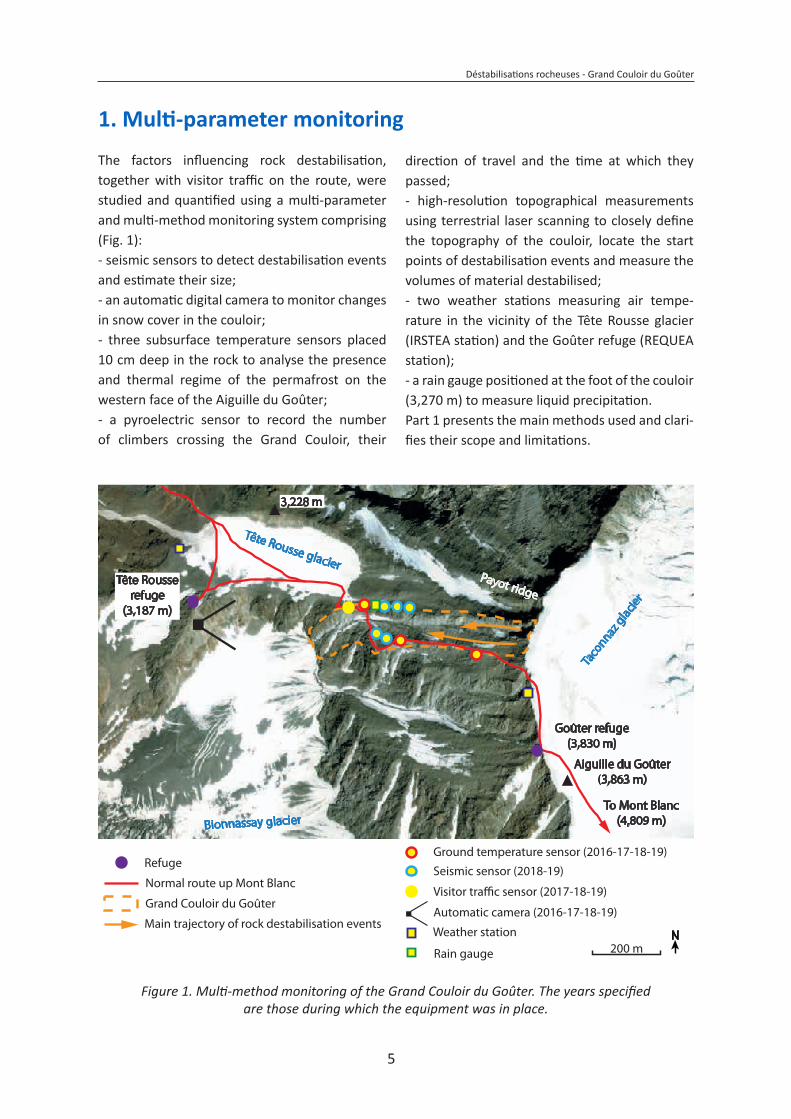
The factors influencing rock destabilisation, together with visitor traffic on the route, were studied and quantified using a multi-parameter and multi-method monitoring system comprising (Fig. 1): - seismic sensors to detect destabilisation events and estimate their size;- an automatic digital camera to monitor changes in snow cover in the couloir; - three subsurface temperature sensors placed 10 cm deep in the rock to analyse the presence and thermal regime of the permafrost on the western face of the Aiguille du Goûter; - a pyroelectric sensor to record the number of climbers crossing the Grand Couloir, their
Goûter refuge (3,830 m)
Tête Rousserefuge
(3,187 m)
Aiguille du Goûter(3,863 m)
3,228 m
To Mont Blanc(4,809 m)
200 mN
Seismic sensor (2018-19)
Bionnassay glacier
Payot ridge
Tête Rousse glacierTa
connaz
glacier
Normal route up Mont BlancVisitor tra�c sensor (2017-18-19)
Ground temperature sensor (2016-17-18-19)
Main trajectory of rock destabilisation events
Grand Couloir du Goûter
Refuge
Automatic camera (2016-17-18-19)
Weather station
Rain gauge
Figure 1. Multi-method monitoring of the Grand Couloir du Goûter. The years specified are those during which the equipment was in place.
direction of travel and the time at which they passed;- high-resolution topographical measurements using terrestrial laser scanning to closely define the topography of the couloir, locate the start points of destabilisation events and measure the volumes of material destabilised;- two weather stations measuring air tempe-rature in the vicinity of the Tête Rousse glacier (IRSTEA station) and the Goûter refuge (REQUEA station); - a rain gauge positioned at the foot of the couloir (3,270 m) to measure liquid precipitation.Part 1 presents the main methods used and clari-fies their scope and limitations.
1. Multi-parameter monitoring
6
Déstabilisations rocheuses - Grand Couloir du Goûter
This particular research project, which was carried out over the summers of 2018 and 2019, allowed more precise data to be collected over a longer period of time. Occurrences of destabilisation were recorded on a continuous basis by seismic sensors. These measure the seismic waves produced by rocks and boulders hitting the ground, which are transferred to the equipment by the latter. This method made it possible to detect the seismic signals of destabi-lisation events and, therefore, to measure their frequency and duration. The data collected also allowed us to estimate the volumes of material dislodged. In terrain configurations where the sensors are very close to the impact zones (< 200 m), the volumes detected can be as small as 0.05 m3 (i.e., 50 litres or 135 kg of gneiss, the type of rock found on the western face of the Aiguille du Goûter; Dietze et al., 2017). With the confi-guration set up in the Couloir du Goûter, the seismometers were located even closer to the impact zones (< 100 m) and were therefore able to detect volumes smaller than 0.05 m3, but not necessarily in an exhaustive manner. Rock desta-bilisation events where the impacts were too
1.1. Continuous monitoring of rock destabilisation using seismic sensors
weak – due to the rocks being too small, boul-ders sliding down the couloir and failing to strike the ground, or rocks/boulders being cushioned by snow – were not recorded. For example, according to additional observations performed at the site, a shower of around 100 fist-sized rocks, which would potentially be deadly to a mountaineer, was recorded if the couloir was free of snow. However, a single fist-sized rock falling in the couloir would most likely not be detected, especially if it slid down the couloir or was repea-tedly cushioned by the snow as it fell.
Given that assessing the volumes of rock desta-bilised is particularly difficult, at this point in the study it is not yet possible to quantify the volume of material involved in each destabilisation event. This report will therefore not provide volume figures. Instead, the intensity of rock destabili-sation events will be assessed according to the maximum energy (in joules) released, calculated based on the seismic signals generated by each event. This energy is linked primarily to the speed of the boulders, the volume of moving rock, but also other parameters such as the presence of snow in the couloir and the distance between the sensors and the rock strikes detected. The only impacts considered were those that took place within the couloir, so it should be noted that the energy recorded only provides an estimate of the magnitude of each event.
In the summer of 2011, the Petzl Foundation conducted an initial study on rock destabilisation in the Grand Couloir du Goûter (https://www.petzl.com/fondation/projets/accidents-couloir-gouter?language=fr, Alpes-Ingé, 2012). Observations were performed from 8 am to 6 pm by a researcher who was on site for a total of 41 days between mid-June and mid-September. The study highlighted certain trends, which are largely confirmed by this report.
Therefore, it is impossible to know exactly how many of the events that actually occurred were detected. The results pres-ented in the following sections of the report therefore underestimate the quantity of rock destabilisation.
Watch on Youtube: Grand Couloir (Mont Blanc) Rock falling 11/08/2015 https://www.youtube.com/watch?v=_LHwYupe_WE © DR
7
Déstabilisations rocheuses - Grand Couloir du Goûter
The major advantage of this data acquisition method is its ability to continuously detect rock destabilisation at any time of day (including at night) and in all weather conditions. The periods during which these events are the most frequent and/or involve the greatest volume of material can therefore be determined. Once these periods have been identified, combining the seismic data from the various sensors installed allows the location of the impacts to be pinpointed and enables us to only consider events that take place within the couloir. In this study, the detection and location of rock destabilisation events on a daily and seasonal scale were used to determine the periods during which they were the most frequent, the ultimate goal being to investigate their causes. Cross-referencing rock destabilisa-tion records with other parameters such as snow cover and rock temperature allowed us to gain a better understanding of triggering factors during the 2018 and 2019 summer seasons.
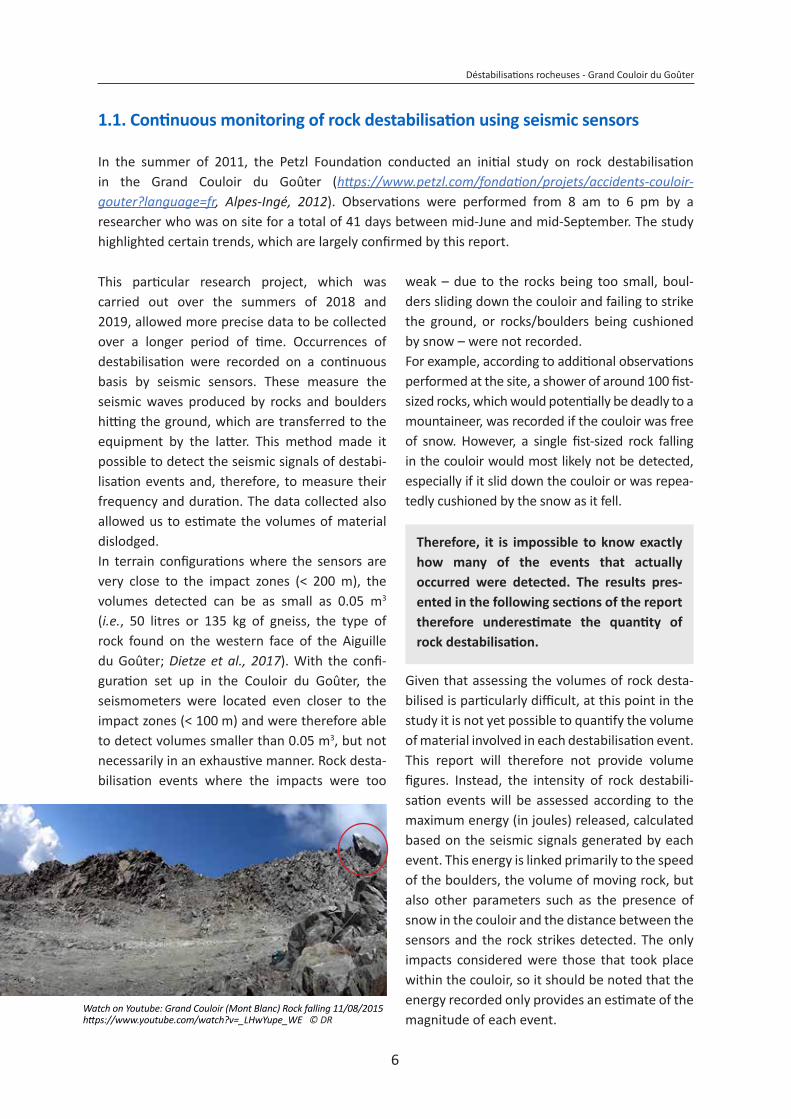
Figure 2. Equipment used for seismic monitoring. A: Seismic station used in 2018.
B. Autonomous sensors installed in 2019.
The seismic signals from the sensors were processed using a method previously deve-loped at a landslide corridor in Séchilienne, in the Isère département of France (Lacroix and Helmstetter, 2011). Processing these signals ulti-
A B
In 2018, when the system was being trialled for the first time, only three seismometers had been installed on the right flank of the couloir (Fig. 2.A). They were in operation between 2 July and 8 September. However, due to problems with the equipment, truly usable data could only be acquired between 16 July and 10 August. Furthermore, because all the sensors were located on the same side of the couloir, it was not possible to locate the exact origin of destabi-lisation events.We estimate that approximately 10% of the events recorded did not occur in the couloir, but elsewhere on the western face of the Aiguille du Goûter. In 2019, the three sensors on the right flank were reinstalled and joined by two sensors on the left flank (Fig. 2.B). The system was in continuous operation between 28 June and 16 September. The presence of sensors on both sides of the couloir enabled the events that took place in the area to be accurately pinpointed.
mately allowed us to obtain a full record of rock destabilisation events in the couloir, including their precise time and location, as well as their duration and energy values (which provide an indication of their volume).
Phot
os ©
Jacq
ues M
oure
y
8
Déstabilisations rocheuses - Grand Couloir du Goûter
The variation in snow cover at the Grand Couloir is an important factor when it comes to unders-tanding the occurrence of rock destabilisation. Indeed, the presence of a snowpack tends to fix surface boulders to the slope, while also slowing down or even stopping moving rocks within the couloir. Conversely, when the snowpack melts, not only does it mechanically release unstable boulders, it also causes a potentially large quantity of water to seep into the ground, thus favouring rock destabilisation through increased hydraulic pressures (D’Amato et al., 2016) and the effects of the freeze-thaw cycle. Moreover, in a context where the rock is perma-nently frozen – i.e., permafrost – the snowpack can considerably slow down heat exchanges with the subsurface (Magnin et al., 2017b).
Stage 1 : Photo selection Stage 2 : Snow detection Stage 3 : Conversion of pixels into surfaces
Automatic camera
3D model acquired using
TLS
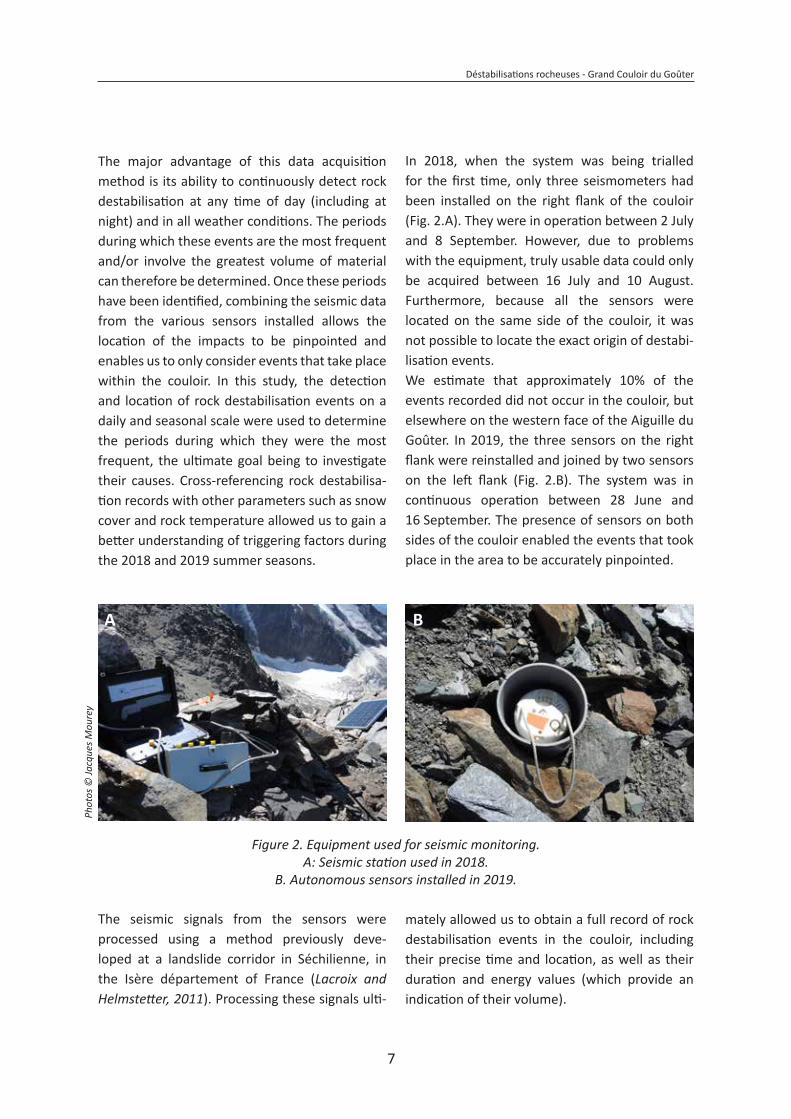
Figure 3. Processing of data from the automatic camera to retrace the way in which snow cover changes in the couloir.
This method allows us to retrace the way in which snow cover changes over the course of the summer and to accurately identify thaw periods. However, it provides no indication of the quality and quantity of snow (and therefore of the liquid water that will become available). Indeed, even after a light snowfall, the surface area of the
Meanwhile, water can damage ice joints, leading to rock destabilisation. (Krautblatter et al., 2013).To study changes in the snowpack, an automatic camera aimed at the couloir was set up in June 2016 (Fig. 3). It took four photographs per day throughout the summer. With this technique, the photographs are processed in three steps: 1) images allowing the snow to be studied are selected (no clouds, mist or shadows),2) in each photo, the pixels corresponding to snow are detected and isolated (Fedorov et al., 2016; Fig. 3), 3) these same pixels are converted into a surface area in m² using a monoplotting technique whereby a 2D photo is overlaid onto a 3D Digital Terrain Model (DTM) acquired in 2016 by terrestrial laser scanning.
couloir that is covered in snow may appear to grow very quickly, even though there is only a “sprinkling”. A visual assessment of the characteristics of the snowpack (estimated depth, type of snow, etc.) is often necessary, in addition to an analysis of the surface area.
1.2. Photographic monitoring of snow cover in the Grand Couloir
9
Déstabilisations rocheuses - Grand Couloir du Goûter
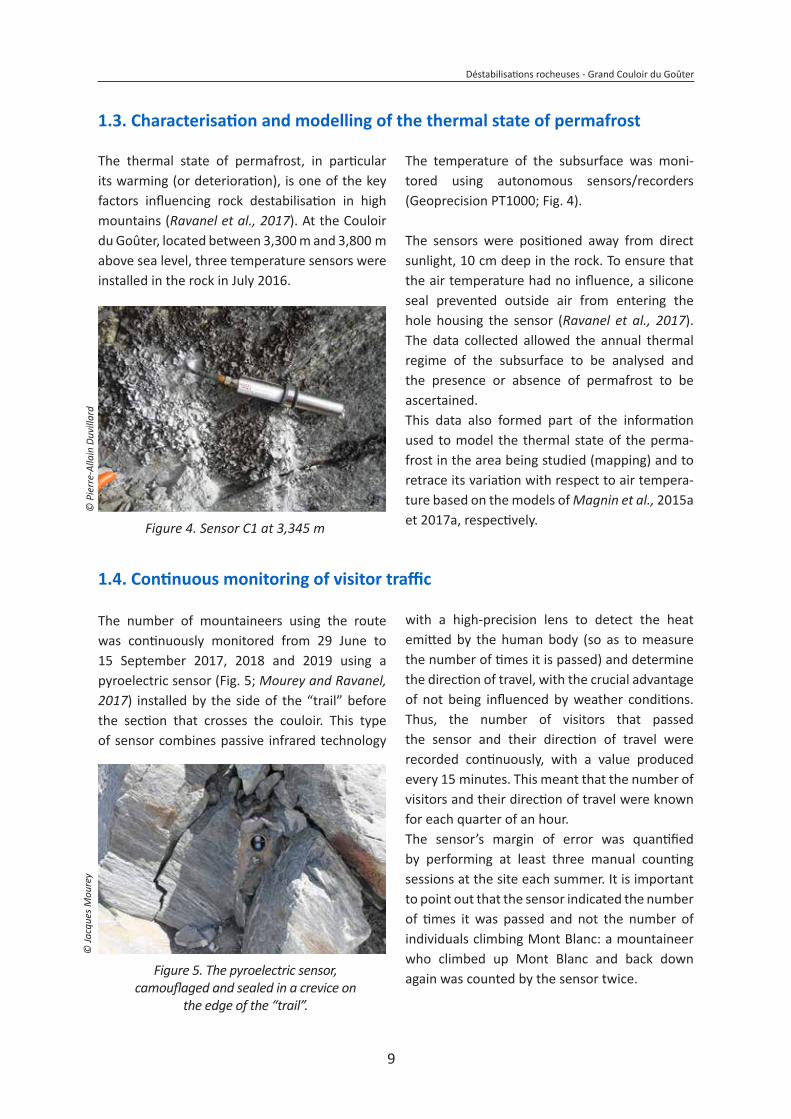
The thermal state of permafrost, in particular its warming (or deterioration), is one of the key factors influencing rock destabilisation in high mountains (Ravanel et al., 2017). At the Couloir du Goûter, located between 3,300 m and 3,800 m above sea level, three temperature sensors were installed in the rock in July 2016.
Figure 4. Sensor C1 at 3,345 m
The temperature of the subsurface was moni-tored using autonomous sensors/recorders (Geoprecision PT1000; Fig. 4).
The sensors were positioned away from direct sunlight, 10 cm deep in the rock. To ensure that the air temperature had no influence, a silicone seal prevented outside air from entering the hole housing the sensor (Ravanel et al., 2017). The data collected allowed the annual thermal regime of the subsurface to be analysed and the presence or absence of permafrost to be ascertained. This data also formed part of the information used to model the thermal state of the perma-frost in the area being studied (mapping) and to retrace its variation with respect to air tempera-ture based on the models of Magnin et al., 2015a et 2017a, respectively.
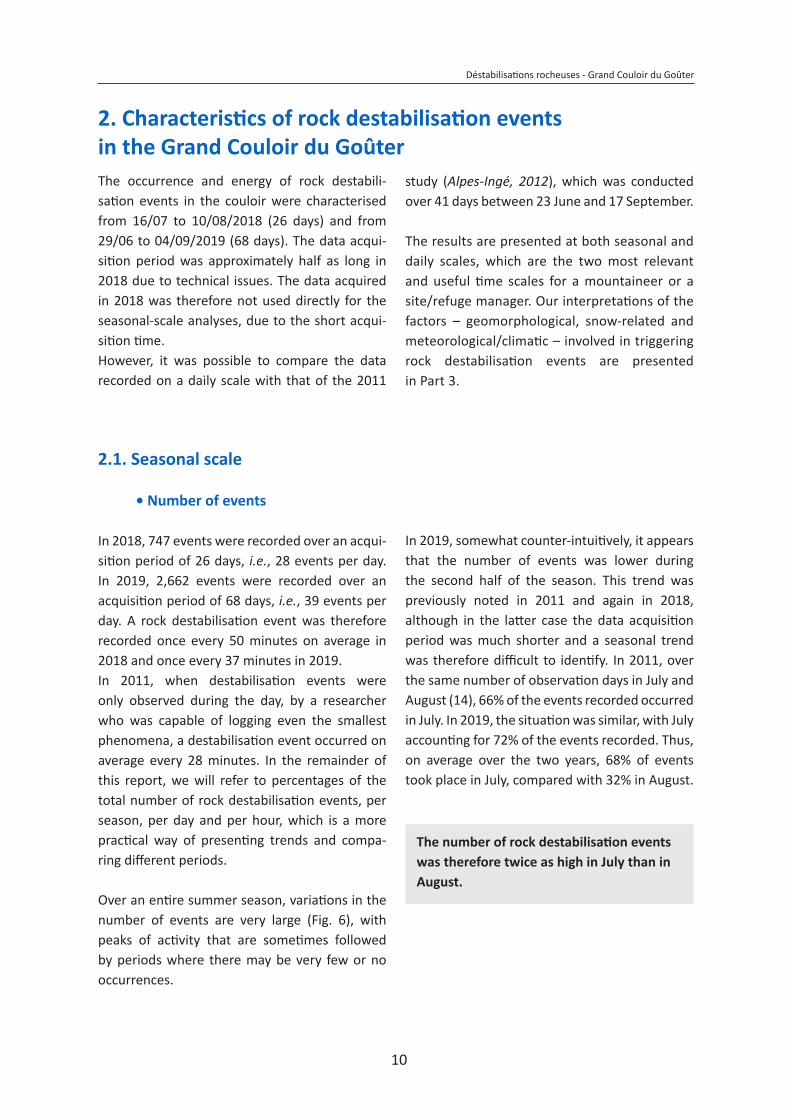
The number of mountaineers using the route was continuously monitored from 29 June to 15 September 2017, 2018 and 2019 using a pyroelectric sensor (Fig. 5; Mourey and Ravanel, 2017) installed by the side of the “trail” before the section that crosses the couloir. This type of sensor combines passive infrared technology
Figure 5. The pyroelectric sensor, camouflaged and sealed in a crevice on
the edge of the “trail”.
with a high-precision lens to detect the heat emitted by the human body (so as to measure the number of times it is passed) and determine the direction of travel, with the crucial advantage of not being influenced by weather conditions. Thus, the number of visitors that passed the sensor and their direction of travel were recorded continuously, with a value produced every 15 minutes. This meant that the number of visitors and their direction of travel were known for each quarter of an hour.The sensor’s margin of error was quantified by performing at least three manual counting sessions at the site each summer. It is important to point out that the sensor indicated the number of times it was passed and not the number of individuals climbing Mont Blanc: a mountaineer who climbed up Mont Blanc and back down again was counted by the sensor twice.
1.3. Characterisation and modelling of the thermal state of permafrost
1.4. Continuous monitoring of visitor traffic
© Ja
cque
s Mou
rey
© P
ierr
e-Al
lain
Duv
illar
d
10
Déstabilisations rocheuses - Grand Couloir du Goûter
The occurrence and energy of rock destabili-sation events in the couloir were characterised from 16/07 to 10/08/2018 (26 days) and from 29/06 to 04/09/2019 (68 days). The data acqui-sition period was approximately half as long in 2018 due to technical issues. The data acquired in 2018 was therefore not used directly for the seasonal-scale analyses, due to the short acqui-sition time. However, it was possible to compare the data recorded on a daily scale with that of the 2011
2. Characteristics of rock destabilisation events in the Grand Couloir du Goûter
study (Alpes-Ingé, 2012), which was conducted over 41 days between 23 June and 17 September.
The results are presented at both seasonal and daily scales, which are the two most relevant and useful time scales for a mountaineer or a site/refuge manager. Our interpretations of the factors – geomorphological, snow-related and meteorological/climatic – involved in triggering rock destabilisation events are presented in Part 3.
2.1. Seasonal scale
• Number of events
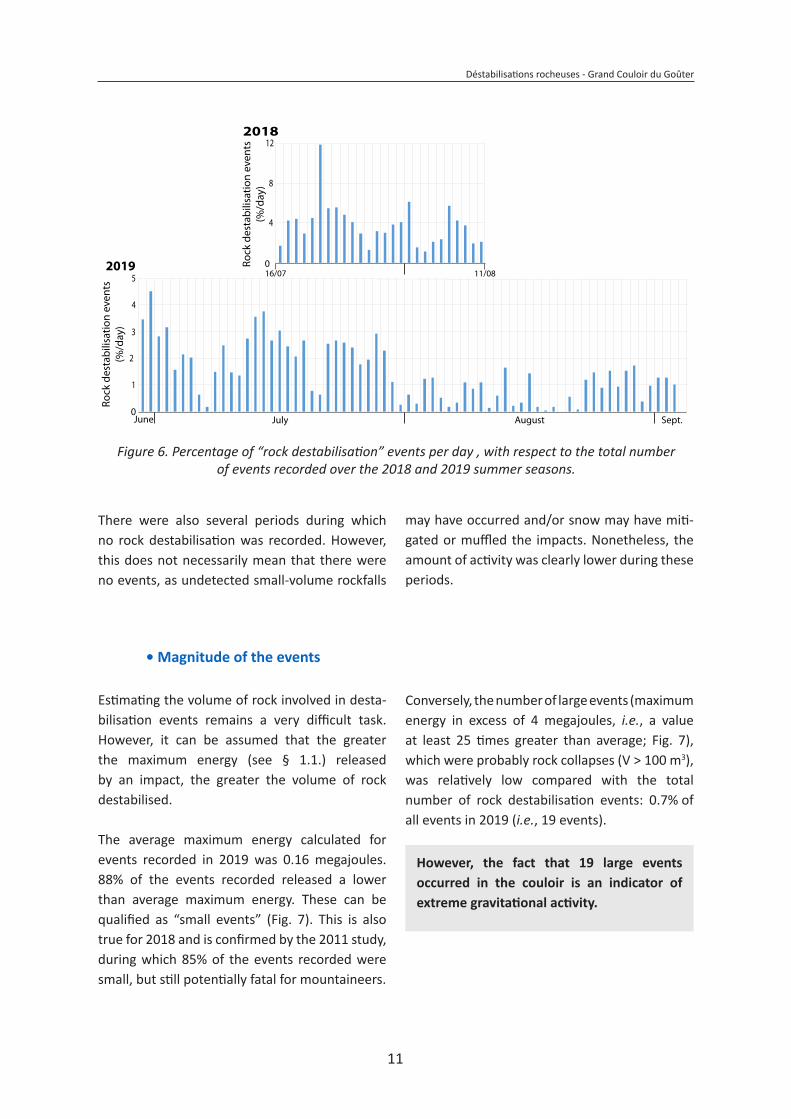
In 2018, 747 events were recorded over an acqui-sition period of 26 days, i.e., 28 events per day. In 2019, 2,662 events were recorded over an acquisition period of 68 days, i.e., 39 events per day. A rock destabilisation event was therefore recorded once every 50 minutes on average in 2018 and once every 37 minutes in 2019. In 2011, when destabilisation events were only observed during the day, by a researcher who was capable of logging even the smallest phenomena, a destabilisation event occurred on average every 28 minutes. In the remainder of this report, we will refer to percentages of the total number of rock destabilisation events, per season, per day and per hour, which is a more practical way of presenting trends and compa-ring different periods.
Over an entire summer season, variations in the number of events are very large (Fig. 6), with peaks of activity that are sometimes followed by periods where there may be very few or no occurrences.
In 2019, somewhat counter-intuitively, it appears that the number of events was lower during the second half of the season. This trend was previously noted in 2011 and again in 2018, although in the latter case the data acquisition period was much shorter and a seasonal trend was therefore difficult to identify. In 2011, over the same number of observation days in July and August (14), 66% of the events recorded occurred in July. In 2019, the situation was similar, with July accounting for 72% of the events recorded. Thus, on average over the two years, 68% of events took place in July, compared with 32% in August.
The number of rock destabilisation events was therefore twice as high in July than in August.
11
Déstabilisations rocheuses - Grand Couloir du Goûter
June July August Sept.
3
1
5
0
2019
2
4
2018
8
4
12
016/07 11/08
Rock
des
tabi
lisat
ion
even
ts(%
/day
)
Rock
des
tabi
lisat
ion
even
ts(%
/day
)
Figure 6. Percentage of “rock destabilisation” events per day , with respect to the total number of events recorded over the 2018 and 2019 summer seasons.
There were also several periods during which no rock destabilisation was recorded. However, this does not necessarily mean that there were no events, as undetected small-volume rockfalls
may have occurred and/or snow may have miti-gated or muffled the impacts. Nonetheless, the amount of activity was clearly lower during these periods.
• Magnitude of the events
Estimating the volume of rock involved in desta-bilisation events remains a very difficult task. However, it can be assumed that the greater the maximum energy (see § 1.1.) released by an impact, the greater the volume of rock destabilised.
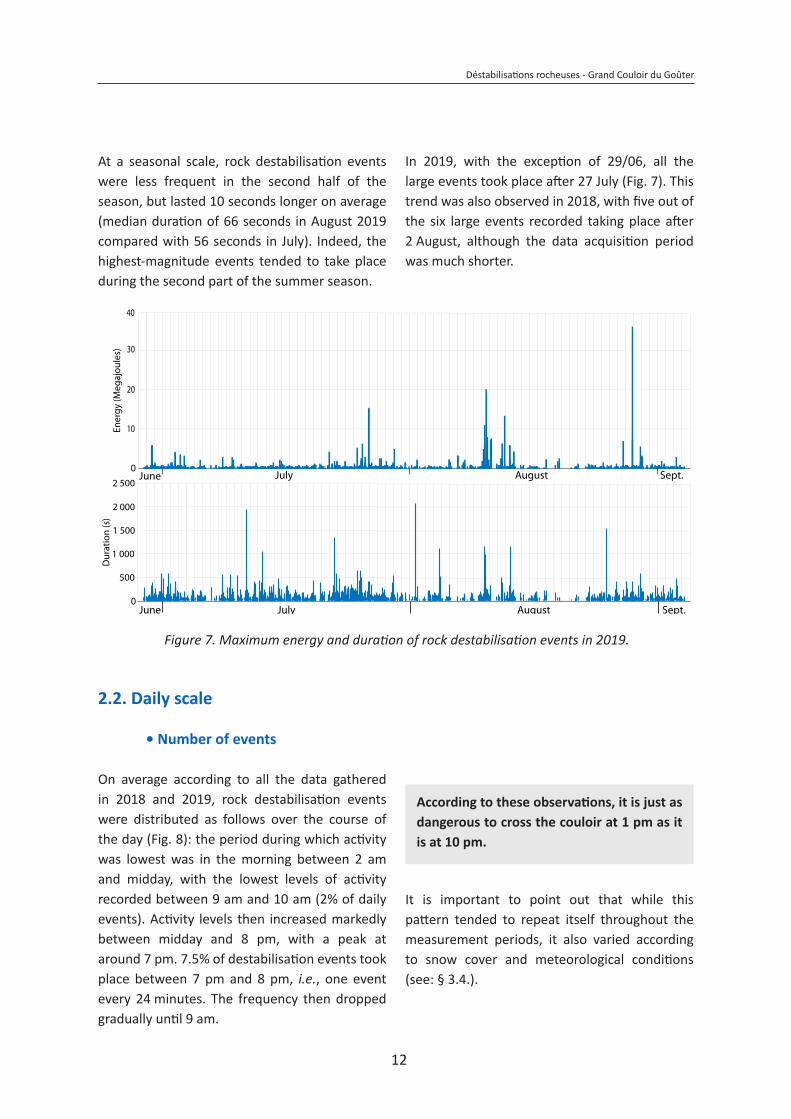
The average maximum energy calculated for events recorded in 2019 was 0.16 megajoules. 88% of the events recorded released a lower than average maximum energy. These can be qualified as “small events” (Fig. 7). This is also true for 2018 and is confirmed by the 2011 study, during which 85% of the events recorded were small, but still potentially fatal for mountaineers.
Conversely, the number of large events (maximum energy in excess of 4 megajoules, i.e., a value at least 25 times greater than average; Fig. 7), which were probably rock collapses (V > 100 m3), was relatively low compared with the total number of rock destabilisation events: 0.7% of all events in 2019 (i.e., 19 events).
However, the fact that 19 large events occurred in the couloir is an indicator of extreme gravitational activity.
12
Déstabilisations rocheuses - Grand Couloir du Goûter
At a seasonal scale, rock destabilisation events were less frequent in the second half of the season, but lasted 10 seconds longer on average (median duration of 66 seconds in August 2019 compared with 56 seconds in July). Indeed, the highest-magnitude events tended to take place during the second part of the summer season.
2 000
2 500
20
10
30
Ener
gy (M
egaj
oule
s)
0
40
0June July August Sept.
500
Dur
atio
n (s
)
1 000
1 500
June July August Sept.
Figure 7. Maximum energy and duration of rock destabilisation events in 2019.
2.2. Daily scale
• Number of events
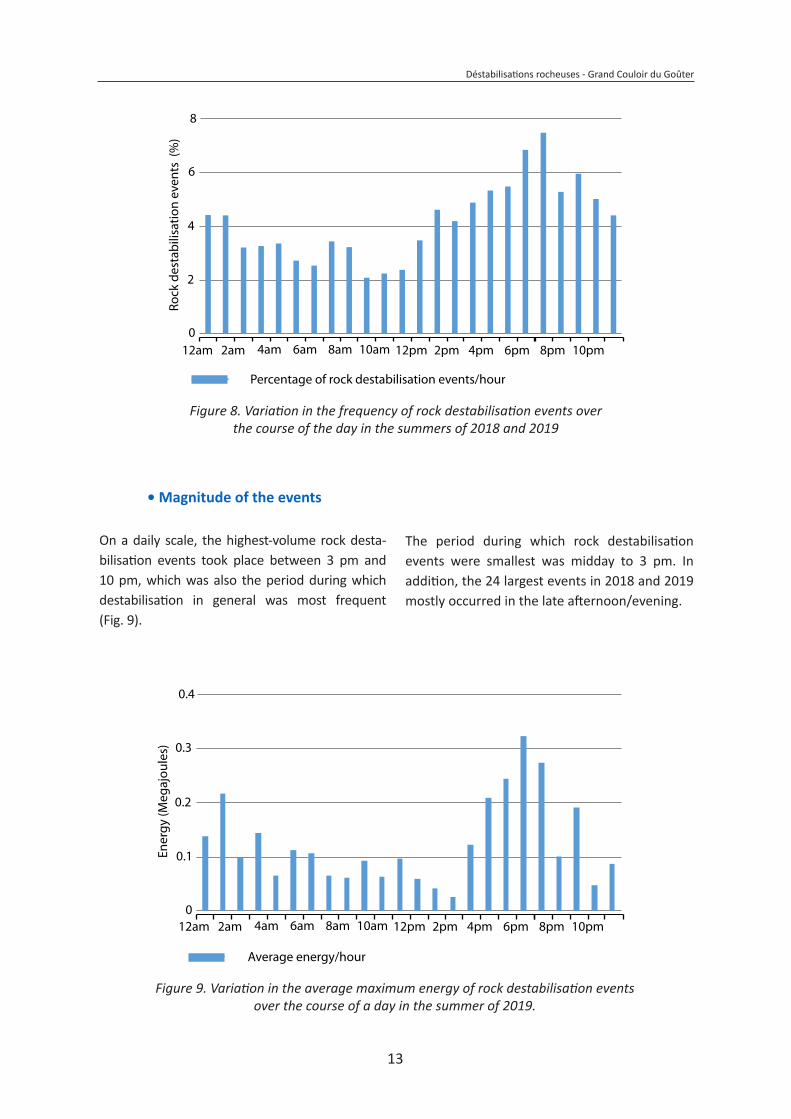
On average according to all the data gathered in 2018 and 2019, rock destabilisation events were distributed as follows over the course of the day (Fig. 8): the period during which activity was lowest was in the morning between 2 am and midday, with the lowest levels of activity recorded between 9 am and 10 am (2% of daily events). Activity levels then increased markedly between midday and 8 pm, with a peak at around 7 pm. 7.5% of destabilisation events took place between 7 pm and 8 pm, i.e., one event every 24 minutes. The frequency then dropped gradually until 9 am.
It is important to point out that while this pattern tended to repeat itself throughout the measurement periods, it also varied according to snow cover and meteorological conditions (see: § 3.4.).
In 2019, with the exception of 29/06, all the large events took place after 27 July (Fig. 7). This trend was also observed in 2018, with five out of the six large events recorded taking place after 2 August, although the data acquisition period was much shorter.
According to these observations, it is just as dangerous to cross the couloir at 1 pm as it is at 10 pm.
13
Déstabilisations rocheuses - Grand Couloir du Goûter
0
2
4
6
12am 2am 4am 6am 8am 10am 12pm 2pm 4pm 6pm 8pm 10pm
Rock
des
tabi
lisat
ion
even
ts (
%)
8
Percentage of rock destabilisation events/hour
Figure 8. Variation in the frequency of rock destabilisation events over the course of the day in the summers of 2018 and 2019
• Magnitude of the events
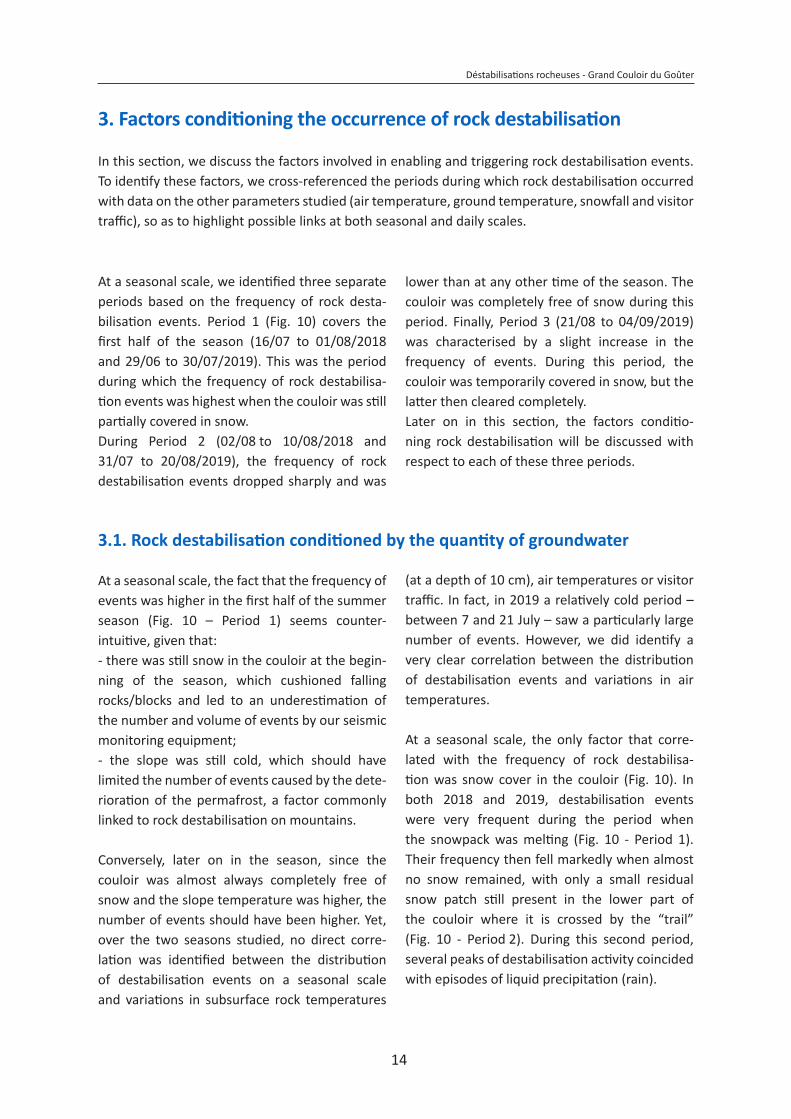
On a daily scale, the highest-volume rock desta-bilisation events took place between 3 pm and 10 pm, which was also the period during which destabilisation in general was most frequent (Fig. 9).
0
0.1
0.2
0.3
Ener
gy (M
egaj
oule
s)
0.4
Average energy/hour
12am 2am 4am 6am 8am 10am 12pm 2pm 4pm 6pm 8pm 10pm
Figure 9. Variation in the average maximum energy of rock destabilisation events over the course of a day in the summer of 2019.
The period during which rock destabilisation events were smallest was midday to 3 pm. In addition, the 24 largest events in 2018 and 2019 mostly occurred in the late afternoon/evening.
14
Déstabilisations rocheuses - Grand Couloir du Goûter
In this section, we discuss the factors involved in enabling and triggering rock destabilisation events. To identify these factors, we cross-referenced the periods during which rock destabilisation occurred with data on the other parameters studied (air temperature, ground temperature, snowfall and visitor traffic), so as to highlight possible links at both seasonal and daily scales.
3. Factors conditioning the occurrence of rock destabilisation
At a seasonal scale, the fact that the frequency of events was higher in the first half of the summer season (Fig. 10 – Period 1) seems counter-intuitive, given that: - there was still snow in the couloir at the begin-ning of the season, which cushioned falling rocks/blocks and led to an underestimation of the number and volume of events by our seismic monitoring equipment; - the slope was still cold, which should have limited the number of events caused by the dete-rioration of the permafrost, a factor commonly linked to rock destabilisation on mountains.
Conversely, later on in the season, since the couloir was almost always completely free of snow and the slope temperature was higher, the number of events should have been higher. Yet, over the two seasons studied, no direct corre-lation was identified between the distribution of destabilisation events on a seasonal scale and variations in subsurface rock temperatures
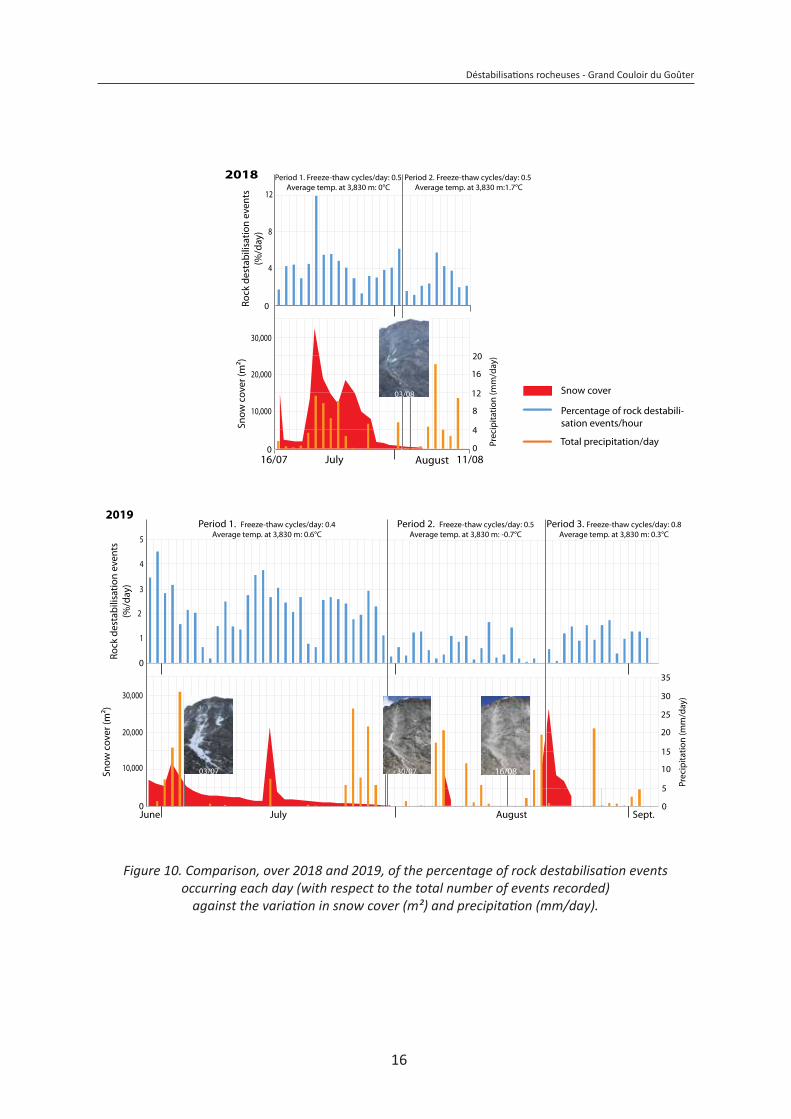
At a seasonal scale, we identified three separate periods based on the frequency of rock desta-bilisation events. Period 1 (Fig. 10) covers the first half of the season (16/07 to 01/08/2018 and 29/06 to 30/07/2019). This was the period during which the frequency of rock destabilisa-tion events was highest when the couloir was still partially covered in snow.During Period 2 (02/08 to 10/08/2018 and 31/07 to 20/08/2019), the frequency of rock destabilisation events dropped sharply and was
lower than at any other time of the season. The couloir was completely free of snow during this period. Finally, Period 3 (21/08 to 04/09/2019) was characterised by a slight increase in the frequency of events. During this period, the couloir was temporarily covered in snow, but the latter then cleared completely. Later on in this section, the factors conditio-ning rock destabilisation will be discussed with respect to each of these three periods.
3.1. Rock destabilisation conditioned by the quantity of groundwater
(at a depth of 10 cm), air temperatures or visitor traffic. In fact, in 2019 a relatively cold period – between 7 and 21 July – saw a particularly large number of events. However, we did identify a very clear correlation between the distribution of destabilisation events and variations in air temperatures.
At a seasonal scale, the only factor that corre-lated with the frequency of rock destabilisa-tion was snow cover in the couloir (Fig. 10). In both 2018 and 2019, destabilisation events were very frequent during the period when the snowpack was melting (Fig. 10 - Period 1). Their frequency then fell markedly when almost no snow remained, with only a small residual snow patch still present in the lower part of the couloir where it is crossed by the “trail” (Fig. 10 - Period 2). During this second period, several peaks of destabilisation activity coincided with episodes of liquid precipitation (rain).
15
Déstabilisations rocheuses - Grand Couloir du Goûter
In 2019, there was a resurgence of destabilisa-tion events as of 21 August, after the couloir was covered in fresh snow and several episodes of rain (Fig. 10 - Period 3), confirming the link between rock destabilisation, snowmelt and liquid preci-pitation. It appears, therefore, that the periods when rock destabilisation was most prevalent were those during which the amount of liquid water in the couloir, resulting mainly from snow melt and occasionally from liquid precipitation, was greatest.
The effects of freeze-thaw cycles
Alternating freeze-thaw cycles are a significant factor in the triggering of rock destabilisation on mountains. During the freeze phase, water undergoes volumetric expansion (+9%). If the water is confined to a limited space, this increase in volume leads to an increase in pore pressure of approximately 15 kg/cm², which is enough to open up cracks and fracture the rock. This is known as frost wedging (or cryoclasty). Thus, numerous repeated freeze-thaw cycles will lead to the fracturing of the rock, the widening of cracks and the formation of very angular rock debris known as gelifracts. The ability of freeze-thaw cycles to trigger destabilisation is chiefly related to the amount of water in the ground, the fracturing density and the frequency of the cycles.
During the freeze phase, all frozen material usually cements together, which tends not to favour the initiation of rock destabilisation. Conversely, during the thaw phase the ice melts, leading to a reduction in volume and causing the thawed material to pack down. This also results in decementation and the seepage of liquid water into the rock. These processes are conducive to the destabilisation of rock fragments, which are generally small in size (centimetres to tens of centimetres), as has been observed in the couloir. That is why, on a daily scale, rock destabilisation is more frequent during thaw phases. On a seasonal scale, freeze-thaw cycles are naturally more numerous in the off-seasons, when the temperature is gradually increasing/decreasing (April-May and October-November) and when more freeze and thaw phases take place. However, the seasonal influence of freeze-thaw cycles on rock destabilisation in the Grand Couloir was not studied, since there is very little visitor traffic at these times of the year and the seismic sensors were installed too late in the season. Nevertheless, while this seasonal impact was not investigated, we will see that the number of freeze-thaw cycles plays a role in triggering rock destabilisation, in combination with the melting of the snowpack.
Different trigger processes relating to the pres-ence of liquid water in the rock can occur: alterna-tion between freeze-thaw cycles (see box below) and an increase in pore pressure (the water present in the cracks in the rock applies pressure that favours the movement of boulders, espe-cially on a steep and fractured slope; Krautblatter et al., 2013). We will see subsequently that these two processes are at work in the Grand Couloir du Goûter and that they interact over different time scales.
16
Déstabilisations rocheuses - Grand Couloir du Goûter
3
1
5
0
2019
2
4
Rock
des
tabi
lisat
ion
even
ts(%
/day
)
30,000
20,000
10,000
0June July August Sept.
Snow
cov
er (m
²)
Period 1. Freeze-thaw cycles/day: 0.5Average temp. at 3,830 m: 0°C
2018
8
4
12
0
5
10
15
20
25
30
Prec
ipita
tion
(mm
/day
)
0
August16/07 11/08July0
30,000
20,000
10,000
Snow
cov
er (m
²)
4
8
12
16
20
Prec
ipita
tion
(mm
/day
)
0
16/0803/07
Rock
des
tabi
lisat
ion
even
ts(%
/day
)
Period 1. Freeze-thaw cycles/day: 0.4Average temp. at 3,830 m: 0.6°C
Period 2. Freeze-thaw cycles/day: 0.5Average temp. at 3,830 m: -0.7°C
Period 3. Freeze-thaw cycles/day: 0.8Average temp. at 3,830 m: 0.3°C
Period 2. Freeze-thaw cycles/day: 0.5 Average temp. at 3,830 m:1.7°C
Snow cover
Percentage of rock destabili-sation events/hour
Total precipitation/day
35
03/08
30/07
Figure 10. Comparison, over 2018 and 2019, of the percentage of rock destabilisation events occurring each day (with respect to the total number of events recorded)
against the variation in snow cover (m²) and precipitation (mm/day).
17
Déstabilisations rocheuses - Grand Couloir du Goûter
The gradual melting of the snow during Period 1 (Fig. 10) would have led to a non-negligible quantity of liquid water seeping into the cracks in the rock. Snowmelt causes an increase in hydraulic pore pressures while also exacerbating the effects of freeze-thaw cycles. This therefore appears to be another important factor in the triggering of rock destabilisation events in the Grand Couloir.
In addition, the gradual melting of the snow-pack exposes areas of terrain frozen during the previous autumn and which have therefore been subjected to high mechanical stress (cryoclasty in particular) under the effects of seasonal frost. As soon as this terrain ceases to be covered in snow it quickly thaws, leading to rock destabilisation. A seasonal purge takes place within the couloir as the snow melts.
3.2. The role of snow in triggering rock destabilisation
In 2019, during the periods when the snow-pack was melting, the number of destabilisation events was twice as high as during the periods when there was no snow in the couloir (one and a half times as high in 2018). However, the hourly distribution of destabilisation events remained broadly the same, with a peak of activity between 6 pm and 7 pm (see: § 3.2.).Moreover, the presence/absence of snow in the couloir influences the duration of events. In the absence of snow, it is easier for a rock or boulder to destabilise others as it falls, which can lead to a boulder “shower”, a phenomenon that is particu-larly dangerous for climbers who are crossing the couloir. Thus, during the periods when there was no snow (Periods 2 and 3, Fig. 10), events lasted an average of 17 seconds longer (i.e., 13% longer than the average duration of events) than during periods when the couloir was covered in snow (Period 1).
3.3. The role of freeze-thaw cycles in triggering rock destabilisation
As detailed in in the previous box (The effects of freeze-thaw cycles), the ability of freeze-thaw cycles to trigger destabilisation is chiefly related to the amount of water in the ground and the frequency with which the cycles occur. This
• Sesonal scale
The role of freeze-thaw cycles in triggering rock destabilisation is much more difficult to assess than the influence of the melting snowpack. Over the three periods, there was not always a link between the average number of freeze-thaw cycles per day and the number of rock destabilisation events. During Periods 1 and 2, the number of freeze-thaw cycles (determined based on the air
frequency is determined based on the average number of freeze-thaw cycles per day over a given period. For instance, in Period 1 (see: § 3.) we recorded 15 freeze-thaw cycles in 32 days, an average of 0.4 cycles per day.
temperature at the top of the couloir) was very similar: 0.4 cycles per day in Period 1 compared with 0.5 cycles per day in Period 2. Yet, there were four times more rock destabilisation events per day during Period 1. It appears, therefore, that the presence of snow played a crucial role in the difference between the numbers of rock destabilisation events triggered during these two periods.
18
Déstabilisations rocheuses - Grand Couloir du Goûter
In addition, Period 2 was also the coldest (average temperature of -0.7°C at the top of the couloir) with relatively little thawing taking place (the average temperature amplitude of the cycles was -1.7°C to 0.7°C) and only over a short period of time (8 hours per day, compared with 13 hours in Period 1 and 11 hours in Period 3) which further limited the impact of the freeze-thaw cycles.As for the difference between Period 2 and Period 3, during which the couloir was completely free of snow, it is likely that the greater number of
• Daily scale
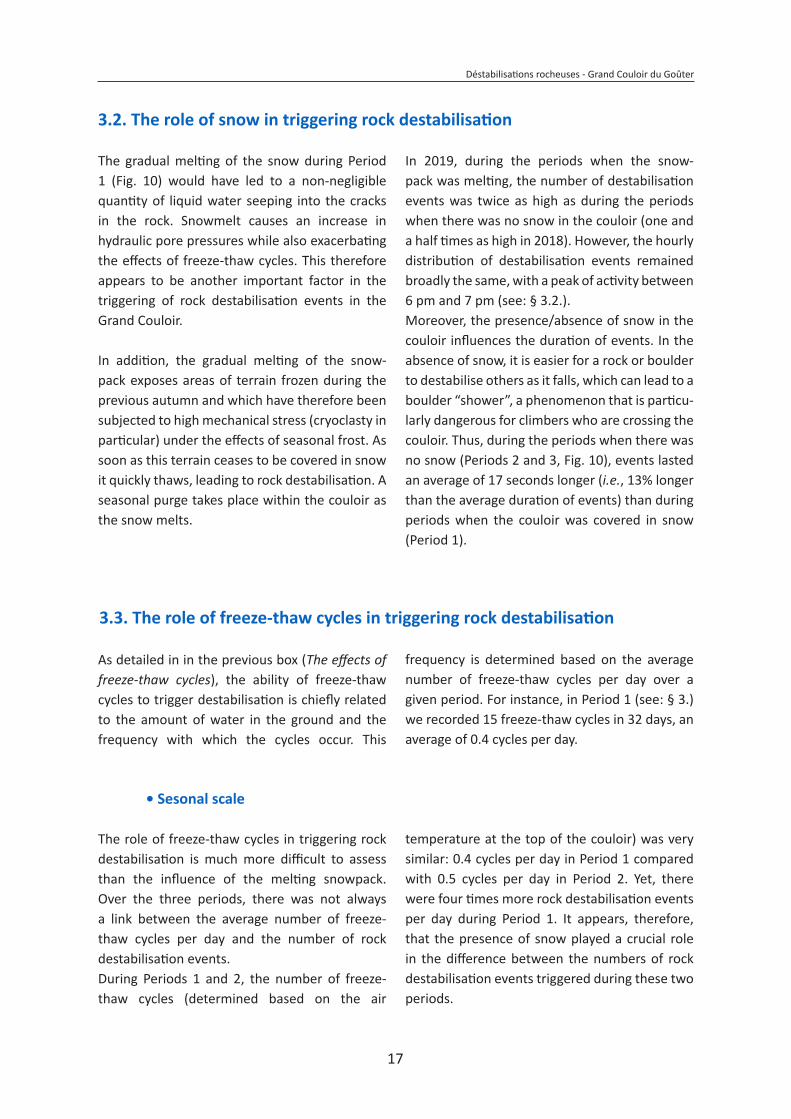
Although the number of freeze-thaw cycles on a seasonal scale was not a major factor in the initiation of rock destabilisation events, night frost and, more importantly, the thawing of the ground surface and snowmelt during the day played a significant role on a daily scale. Indeed, over the course of each day, the number of events increased and decreased according to the air temperature (Fig. 11). The frequency of rock destabilisation events was highest between 1 pm and 10 pm, with a peak between 6 pm and 8 pm. This peak occurred an average of 6 hours after the warmest time of day (in terms of air temperature) at the top of the couloir and three hours after the warmest time of day at Tête Rousse (Fig. 11). The number of events began to increase three hours on average after the air temperature returned to a positive value at the top of the couloir. Conversely, the time of day at which the fewest events occurred was between 9 am and 11 am, following the coldest period, which lasted from 11 pm to 7 am. There was therefore a time lag of a few hours between the peak air tempera-ture and the peak number of rock destabilisation events, probably due to the thermal inertia of snow and the rocky surface terrain.
freeze-thaw cycles occurring during Period 3 (0.8 cycles per day) was responsible for the increase in the number of rock destabilisation events. Moreover, during that period, the impact of freeze-thaw cycles was even greater due to the melting of the snow that fell on 20-21 August, which caused liquid water to seep into the cracks in the rock (Fig. 10). The amplitude of the cycles was also greater (-1.5°C to 2.6°C), with a longer thaw period (11 hours/day).
The number of destabilisation events did not start to fall until after 8 pm, the average time at which the air temperature at the top of the couloir dropped below 0°C. It is also important to reiterate that the highest-volume events generally occurred at the warmest time of day (see: § 2.2.). The fact that the rock at a depth of 10 cm did not freeze underlines the low intensity of the freeze-thaw cycles and explains their limited role in trig-gering events. Night frost is likely to have had an impact only on the first few centimetres below the rock surface, causing only the finest particles to cement, which would not suffice for cryoclasty to occur. However, this re-freezing, even though slight, would have been enough to prevent any snow from melting and to enable re-freezing at the surface. Only data from 2019 has been detailed in this section, but similar observations were made in 2018.
19
Déstabilisations rocheuses - Grand Couloir du Goûter
Percentage of rock destabilisation events/hour
0
2
4
6
-2
Tem
pera
ture
(°C)
6
4
2
0
8 8
Air temperature, Goûter weather station (3,817 m)
Air temperature, Tête Rousse weather station (3,150 m)
Temperature of the rock at the top of the couloir (3,665 m)
Rock
des
tabi
lisat
ion
even
ts (
%)
12am 2am 4am 6am 8am 10am 12pm 2pm 4pm 6pm 8pm 10pm
Figure 11. Hourly variation in the average frequency of rock destabilisation events, the average air temperature at Tête Rousse and the Goûter, and the average rock
temperature 10 cm deep at the top of the couloir (C3) over the 2018 and 2019 seasons.
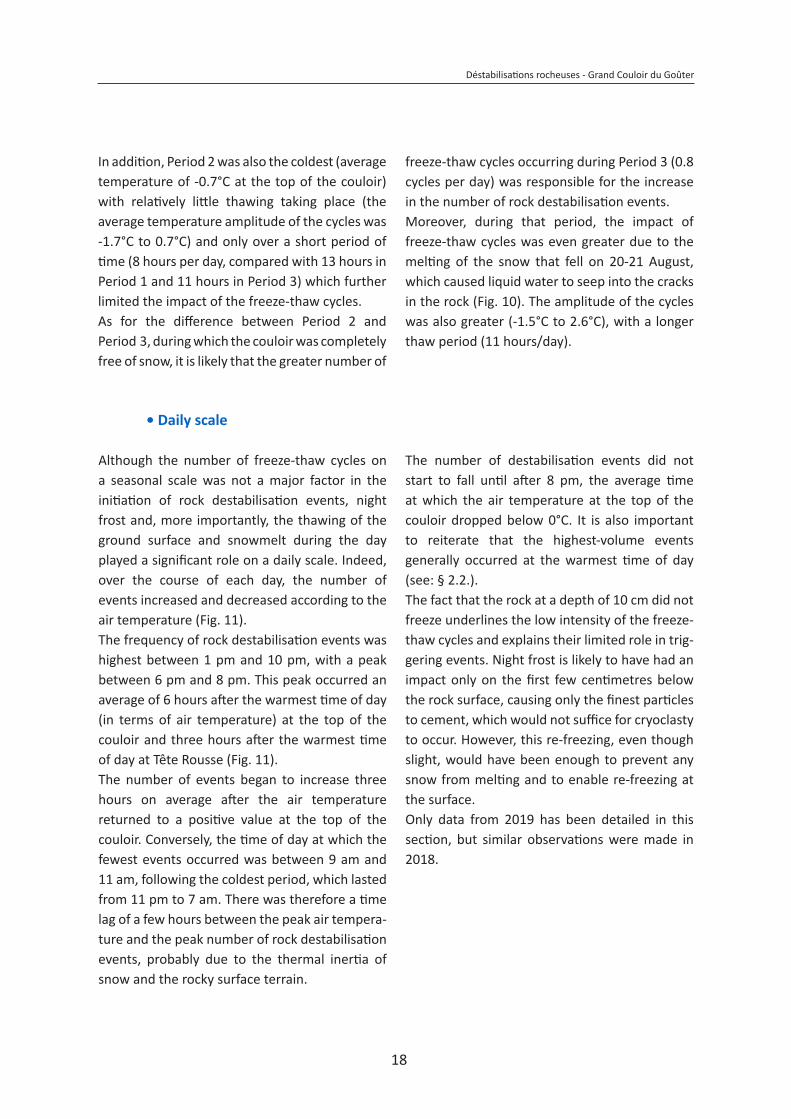
Overall, the average distribution of rock desta-bilisation events presented in Figure 11 always displayed the same profile, with a peak of activity in the late afternoon, but was subject to varia-tions in intensity from one period to the next.
For example, comparing Period 1 (which covers the whole of July) against Periods 2 and 3 (which cover August) allows us to observe that, in July, there was a significant increase in the level of activity as of midday (Fig. 12.A.), when the couloir was completely exposed to the sun and when air temperatures exceeded 2°C at the top of the couloir and 6°C at the bottom. This increase in activity occurred three hours on average after the return of positive air temperatures at the top of the couloir.
The number of events peaked between 6 pm and 7 pm, two hours after the peak tempera-ture, which occurred between 4 pm and 5 pm. In August (Fig. 12.B.), the hourly profile shifted one hour back, with a marked increase in the number of events occurring between 1 pm and 2 pm. Again, this corresponds to the time at which the couloir was gradually exposed to the sun, with air temperatures turning positive at the top of the couloir and reaching 6°C at the bottom.However, in August the number of events over the entire day was lower than in July and this number fell more quickly as the night began, as a result of drier conditions in the couloir and a faster drop in temperatures.
3.4. Variations in the daily pattern between Periods 1, 2 and 3
20
Déstabilisations rocheuses - Grand Couloir du Goûter
0
2
4
6
8
Percentage of rock destabilisation events/hour Air temperature, Goûter weather station (3,817 m)Air temperature, Tête Rousse weather station (3,150 m)
A : Period 1 (July 2019)
Temperature of the rock at the top of the couloir (3,665 m)
Rock
des
tabi
lisat
ion
even
ts (%
)
12am 2am 4am 6am 8am 10am 12pm 2pm 4pm 6pm 8pm 10pm 12am 2am 4am 6am 8am 10am 12pm 2pm 4pm 6pm 8pm 10pm
-2
Tem
pera
ture
(°C)6
4
2
0
8
B : Periods 2 and 3 (August 2019)
Figure 12. Comparison of the average hourly profiles of rock destabilisation events (as a percentage of the total number of events recorded), air temperatures
at Tête Rousse and the Goûter, and the rock temperature 10 cm deep at the top of the couloir (C3) in July and August 2019.
Key Points
All of the observations presented confirm that rock destabilisation is governed primarily by the gradual melting of the snowpack. The latter produces liquid water, which causes an increase in hydraulic pore pressures within the rock and exacerbates the effects of freeze-thaw cycles. Both of these mechanisms are conducive to the triggering of destabilisation events. In addition, melting snow mechanically triggers the destabilisation of rocks/boulders previously located beneath the snowpack, causing a seasonal purging of the couloir. As a result, during the study the number of rock destabilisation events was three times greater when the snowpack was melting (Period 1) than when the couloir was free of snow (Periods 2 and 3).
Later in the season, when the couloir was completely free of snow (Periods 2 and 3), the frequency of rock destabilisation events was much lower and appeared to be related mainly to the number and amplitude of freeze-thaw cycles and occasional liquid precipitation.
Only data from 2019 has been detailed in this section, but similar observations were made in 2018.
21
Déstabilisations rocheuses - Grand Couloir du Goûter
The interpretations presented above are reinforced by the topographical and geological characteristics of the Grand Couloir du Goûter, which are particularly conducive to the triggering of rock destabilisation events. Indeed, this area is comprised of gneiss and mica schist rock several metres thick that is very fractured and decompressed at its surface, with an average
The highest-volume events that occur late in the season are most likely related to permafrost deterioration. Previous studies of rock collapses in the Mont Blanc massif (e.g., Ravanel and Deline, 2010; Ravanel et al., 2017) have shown that the loss of permafrost leads to an increase in destabilisation events, usually involving large volumes of rock, primarily due to a reduction in the strength of ice joints. Throughout the Mont Blanc massif, rock collapses (V > 100 m3), which are promoted by significant fracturing of the rock, mainly occur at the end of the summer season, when the heat wave has already penetrated a significant distance into the rock (causing the deepening of the “active” layer of permafrost, i.e., the layer that thaws seaso-nally). They occur predominantly on slopes with an incline of between 40° and 60°, at altitudes of between 3,400 m and 3,500 m, an altitude range in which the warming of the permafrost often leads to temperatures of between -2°C and 0°C, which are known to be the most conducive to rock destabilisation.
The Grand Couloir du Goûter is located at alti-tudes of between 3,200 m and 3,800 m, with an average incline of between 45° and 50°. It is comprised of highly fractured gneiss and displays a number of characteristics that promote rock
3.5. A topographical and geological context conducive to rock destabilisation
3.6. Permafrost deterioration: the cause of major events late in the season
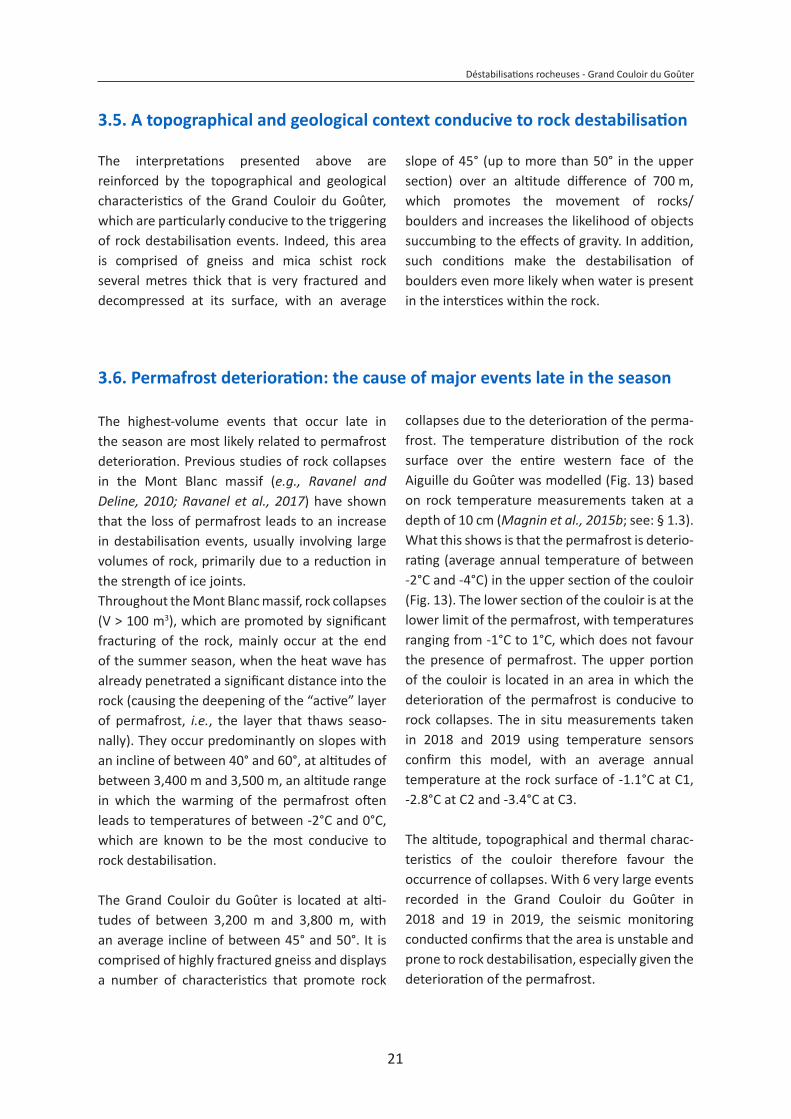
collapses due to the deterioration of the perma-frost. The temperature distribution of the rock surface over the entire western face of the Aiguille du Goûter was modelled (Fig. 13) based on rock temperature measurements taken at a depth of 10 cm (Magnin et al., 2015b; see: § 1.3). What this shows is that the permafrost is deterio-rating (average annual temperature of between -2°C and -4°C) in the upper section of the couloir (Fig. 13). The lower section of the couloir is at the lower limit of the permafrost, with temperatures ranging from -1°C to 1°C, which does not favour the presence of permafrost. The upper portion of the couloir is located in an area in which the deterioration of the permafrost is conducive to rock collapses. The in situ measurements taken in 2018 and 2019 using temperature sensors confirm this model, with an average annual temperature at the rock surface of -1.1°C at C1, -2.8°C at C2 and -3.4°C at C3.
The altitude, topographical and thermal charac-teristics of the couloir therefore favour the occurrence of collapses. With 6 very large events recorded in the Grand Couloir du Goûter in 2018 and 19 in 2019, the seismic monitoring conducted confirms that the area is unstable and prone to rock destabilisation, especially given the deterioration of the permafrost.
slope of 45° (up to more than 50° in the upper section) over an altitude difference of 700 m, which promotes the movement of rocks/boulders and increases the likelihood of objects succumbing to the effects of gravity. In addition, such conditions make the destabilisation of boulders even more likely when water is present in the interstices within the rock.
22
Déstabilisations rocheuses - Grand Couloir du Goûter
Average annual ground temperature at a depth of
10 cm (°C)
C2
Tête Rousse refuge(3,187 m)
Goûter refuge(3,830 m)
C1
C3 -5
-4
-3
-2
-1
0
1
2
Cold permafrost
Deteriorating permafrost
Permafrostunlikely
Figure 13. Distribution of average annual rock surface temperatures on the western face of the Aiguille du Goûter. C1, C2 and C3 are the points at which temperature
sensors were installed in the rock.
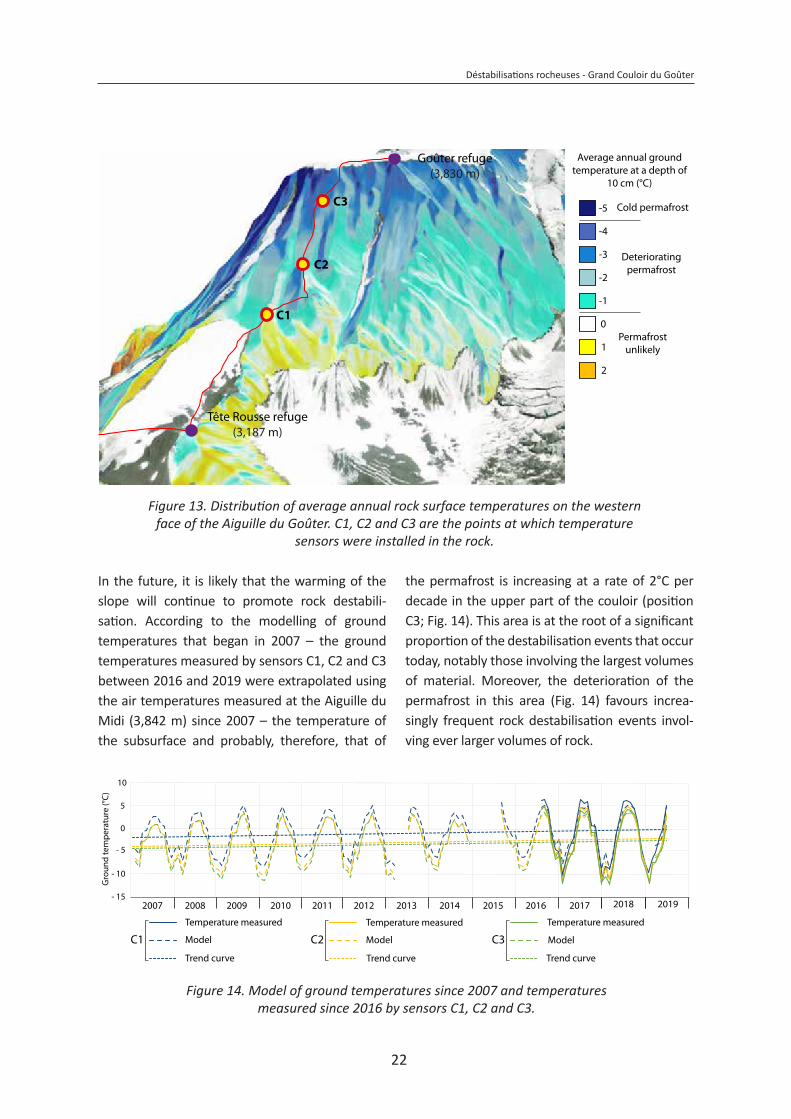
In the future, it is likely that the warming of the slope will continue to promote rock destabili-sation. According to the modelling of ground temperatures that began in 2007 – the ground temperatures measured by sensors C1, C2 and C3 between 2016 and 2019 were extrapolated using the air temperatures measured at the Aiguille du Midi (3,842 m) since 2007 – the temperature of the subsurface and probably, therefore, that of
2007
- 10
- 5
0
5
2008 2009 201520142013201220112010 2016 2017 2018
10
- 15
Gro
und
tem
pera
ture
(°C)
Model Model Model
2019
Temperature measured Temperature measured Temperature measured
Trend curve Trend curve Trend curve
C1 C2 C3
Figure 14. Model of ground temperatures since 2007 and temperatures measured since 2016 by sensors C1, C2 and C3.
the permafrost is increasing at a rate of 2°C per decade in the upper part of the couloir (position C3; Fig. 14). This area is at the root of a significant proportion of the destabilisation events that occur today, notably those involving the largest volumes of material. Moreover, the deterioration of the permafrost in this area (Fig. 14) favours increa-singly frequent rock destabilisation events invol-ving ever larger volumes of rock.
23
Déstabilisations rocheuses - Grand Couloir du Goûter
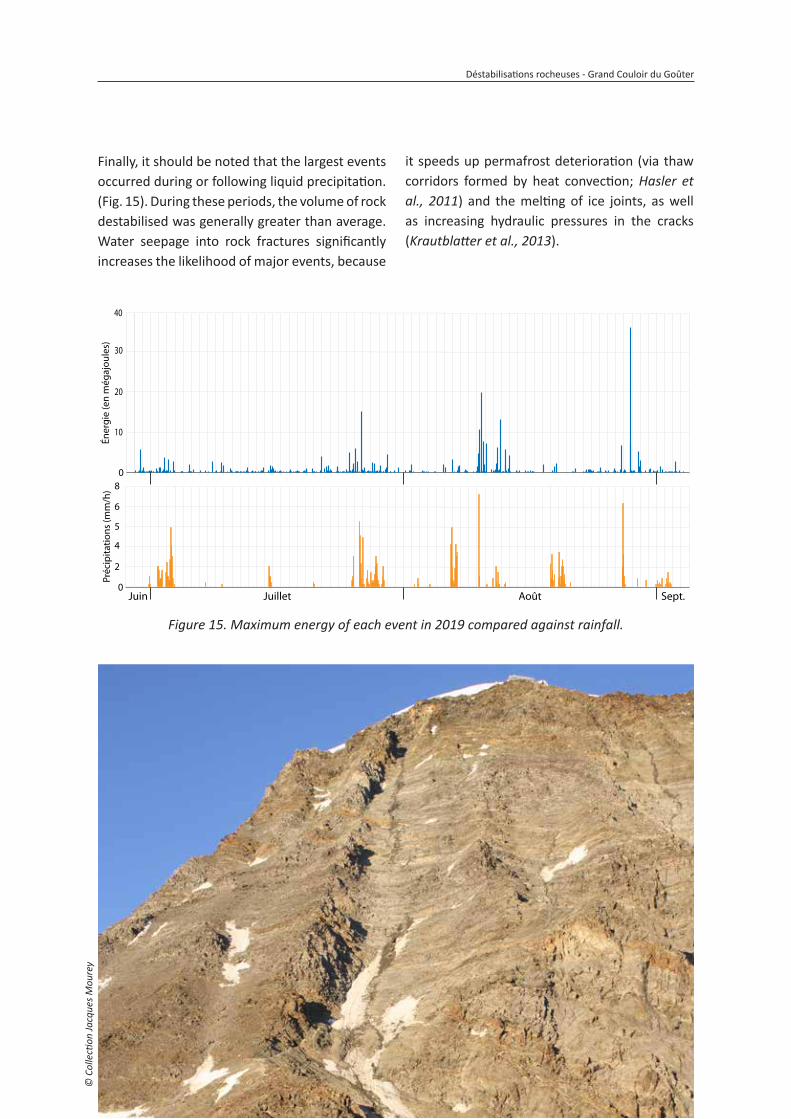
Finally, it should be noted that the largest events occurred during or following liquid precipitation. (Fig. 15). During these periods, the volume of rock destabilised was generally greater than average. Water seepage into rock fractures significantly increases the likelihood of major events, because
20
10
30
Éner
gie
(en
még
ajou
les)
0
40
0Juin Juillet Août Sept.
2
4
5
6
8
Préc
ipita
tions
(mm
/h)
Figure 15. Maximum energy of each event in 2019 compared against rainfall.
it speeds up permafrost deterioration (via thaw corridors formed by heat convection; Hasler et al., 2011) and the melting of ice joints, as well as increasing hydraulic pressures in the cracks (Krautblatter et al., 2013).
© C
olle
ction
Jacq
ues M
oure
y
24
Déstabilisations rocheuses - Grand Couloir du Goûter
The data on visitor traffic (the number of climbers passing through the area) presented below was generated by the pyroelectric sensor set up a few dozen metres downslope from the “trail” across the couloir. The sensor counted visitor numbers
4. Visitor traffic, rock destabilisation and accidentology
during the 2017, 2018 and 2019 summer seasons, between 29 June and 15 September. Overall, the data confirms the observations and estimates made in 2011 (Alpes-Ingé, 2012).
• Seasonal scale
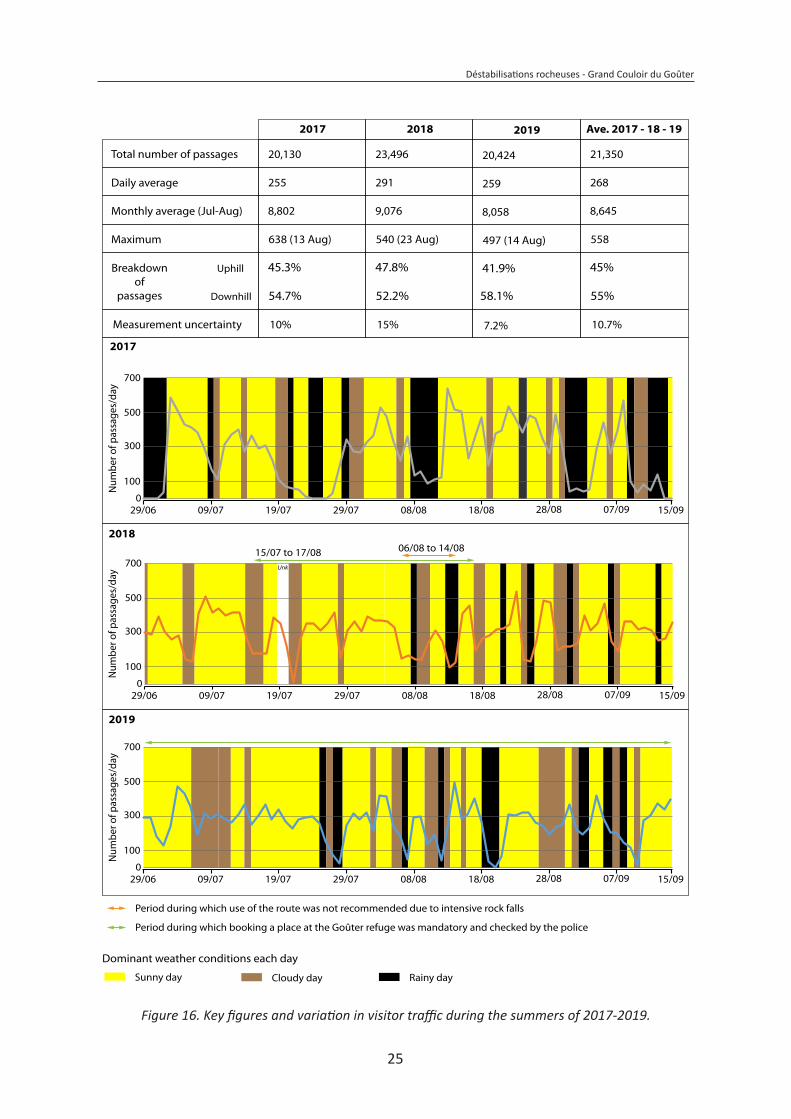
On average over the three summers, this point was passed 21,000 times, 45% in the uphill direc-tion and 55% in the downhill direction. A propor-tion of the climbers passing through came from other routes, including the Trois Mont Blanc (via the Aiguille du Midi cable car and the Cosmiques refuge), the Italian side of Mont Blanc and the Aiguille de Bionnassay, taking the Goûter ridge only to descend. Visitor traffic on the route was highly dependent on weather conditions. When the weather worsened, visitor numbers fell. Conversely, one or two days of good weather were enough for traffic to increase again (Fig. 16).
In 2017, although visitor traffic was lower than in 2018 and 2019, it was less homogeneous and there were significant peaks (7 days with more than 500 passages). By comparison, this bench-mark was reached only once in 2018 and not once in 2019. This observation can almost certainly be explained by the weather, which was sunnier and more stable in 2018/2019 than in 2017, when five periods of bad weather over several days led to a greater concentration of visitors during the more clement periods.Conversely, in 2018 and 2019, episodes of bad weather were much shorter, leading visitor traffic to be more evenly distributed. In addition, measures applied to regulate visitor numbers from 15 July to 17 August 2018 and over the entire 2019 season allowed peak traffic to be brought below 500 passages per day. They also led visitor numbers to be distributed more evenly over the season.
When a decree was passed to dissuade moun-taineers from using the route during the 2018 season (Fig. 16), due to a heat wave that significantly increased the frequency of destabili-sation events, the sensor recorded a 50% drop in traffic during the two days following the decree’s publication (6 and 7 August). Weather conditions were then poor for three days (8-10 August) and visitor numbers were relatively low (~150 passages/day). However, the decree did not prevent traffic from peaking at 311 passages on 11 August, when the sunny weather returned.
At a seasonal scale, there was no link between the frequency of rock destabilisation events and the number of visitors. Visitor numbers were also unaffected by frequent rock destabilisation and/or large or even very small events. For example, in 2019, there was the same number of passages in July and August over the same number of days of good weather, despite the fact that rockfalls were 2.6 times more frequent in July.
To better understand the distribution of visitor traffic over the season, other socio-economic and route management factors, such as the socio-professional profile of climbers and the booking arrangements made, would need to be taken into account and studied specifically.
25
Déstabilisations rocheuses - Grand Couloir du Goûter
2019
Measurement uncertainty
Total number of passages
Daily average
Monthly average (Jul-Aug)
Maximum
Breakdownof
passages
41.9%
58.1%
7.2%
20,424
259
8,058
497 (14 Aug)
2018
47.8%
52.2%
15%
23,496
9,076
540 (23 Aug)
291
2017
45.3%
54.7%
10%
20,130
8,802
638 (13 Aug)
255
Ave. 2017 - 18 - 19
45%
55%
10.7%
21,350
8,645
558
268
Uphill
Downhill
0
300
500
700
100
29/06 09/07 19/07 29/07 08/08 18/08 28/08 07/09 15/09
2019
0
300
500
700
100
Num
ber o
f pas
sage
s/da
y
29/06 09/07 19/07 29/07 08/08 18/08 28/08 07/09 15/09
2017
Num
ber o
f pas
sage
s/da
yN
umbe
r of p
assa
ges/
day
29/06 09/07 19/07 29/07 08/08 18/08 28/08 07/09 15/09
2018
0
300
500
700
100
Period during which use of the route was not recommended due to intensive rock falls
Period during which booking a place at the Goûter refuge was mandatory and checked by the police
06/08 to 14/08 15/07 to 17/08
Sunny day Cloudy day Rainy day
Dominant weather conditions each day
Unk
Figure 16. Key figures and variation in visitor traffic during the summers of 2017-2019.
26
Déstabilisations rocheuses - Grand Couloir du Goûter
• Daily scale
Over a 24-hour period, visitor traffic is distributed as shown in Figure 17. These trends are more or less the same over the three years in question. In the uphill direction, there are two initial peaks of visitor traffic, one at 2-3 am and the other at 5-6 am. These are the two start times from the Tête Rousse refuge. A main peak then forms between 10 am and 3 pm. This reflects the arrival of all the mountaineers who come via the Mont Blanc tramway. The first train arrives at Nid d’Aigle at 8.30 am at the
In total between 1990 and 2017, rescue services were called out 347 times to deal with traumatic accidents between the Tête Rousse and Goûter refuges (Mourey et al., 2018). The number of accidents and the dates on which they occurred varied greatly from one year to the next, with a minimum of 5 rescue operations in 2002 and a maximum of 21 in 2015. However, between 1990 and 2017, as many rescues were performed in July as in August (114 and 113, respectively) and there were as many in June as in September (54).This supports the idea that the number of
accidents is chiefly linked to the number of climbers (very similar in July-August and June-September). Moreover, while the characteristics of rock destabilisation events and the factors that condition them vary greatly between July and August, the total number of accidents over this 27-year period was the same in both months: 114 in July and 113 in August. It is therefore impossible to state that the couloir is more or less dangerous at the beginning or end of the season and to recommend that the couloir be crossed during any particular period.
earliest. The first climbers reach the couloir at around 10 am. In the downhill direction, there is an increase in visitor traffic between 8 am and 3 pm with a peak at 11.30 am, when a signi-ficant number of climbers are descending from the summit. As a result, the vast majority of mountaineers cross the Grand Couloir du Goûter between 9 am and 3 pm, with peak traffic occurring between 11 am and midday. In just one hour, 11% of the daily total number of visitors cross the couloir.
© M
att C
harla
nd
27
Déstabilisations rocheuses - Grand Couloir du Goûter
Rock
des
tabi
lisat
ion
even
ts (%
)
Percentage of rock destabilisation events/hour
Rock destabilisation peaks potentially caused by mountaineers
2
4
0
6
8
10
12
Pass
ages
(%)
UphillTotal Downhill
2
4
6
8
Visitor numbers
12am 2am 4am 6am 8am 10am 12pm 2pm 4pm 6pm 8pm 10pm
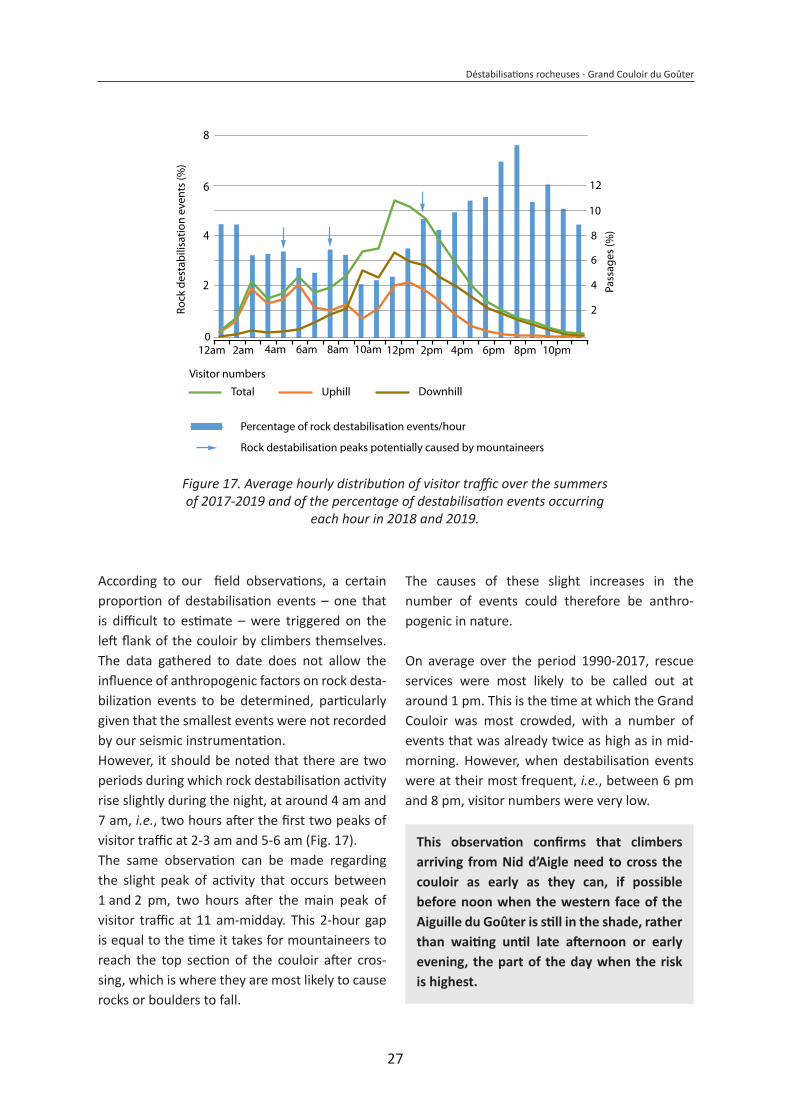
Figure 17. Average hourly distribution of visitor traffic over the summers of 2017-2019 and of the percentage of destabilisation events occurring
each hour in 2018 and 2019.
According to our field observations, a certain proportion of destabilisation events – one that is difficult to estimate – were triggered on the left flank of the couloir by climbers themselves. The data gathered to date does not allow the influence of anthropogenic factors on rock desta-bilization events to be determined, particularly given that the smallest events were not recorded by our seismic instrumentation.However, it should be noted that there are two periods during which rock destabilisation activity rise slightly during the night, at around 4 am and 7 am, i.e., two hours after the first two peaks of visitor traffic at 2-3 am and 5-6 am (Fig. 17). The same observation can be made regarding the slight peak of activity that occurs between 1 and 2 pm, two hours after the main peak of visitor traffic at 11 am-midday. This 2-hour gap is equal to the time it takes for mountaineers to reach the top section of the couloir after cros-sing, which is where they are most likely to cause rocks or boulders to fall.
The causes of these slight increases in the number of events could therefore be anthro-pogenic in nature.
On average over the period 1990-2017, rescue services were most likely to be called out at around 1 pm. This is the time at which the Grand Couloir was most crowded, with a number of events that was already twice as high as in mid-morning. However, when destabilisation events were at their most frequent, i.e., between 6 pm and 8 pm, visitor numbers were very low.
This observation confirms that climbers arriving from Nid d’Aigle need to cross the couloir as early as they can, if possible before noon when the western face of the Aiguille du Goûter is still in the shade, rather than waiting until late afternoon or early evening, the part of the day when the risk is highest.
28
Déstabilisations rocheuses - Grand Couloir du Goûter
Feedback from the 2017 season
The 2017 season saw a particularly high number of accidents, with 8 people injured and, tragically, 11 killed between the Tête Rousse and Goûter refuges. The beginning of the season was marked by a heat wave during which people were advised to avoid the route, because of the very frequent rock destabilisation events observed between 21 and 27 June. According to numerous mountaineers and high-altitude mountain guides, there were many rock destabilisation events over the course of the 2017 season. Their frequency was heterogeneous and concentrated around pronounced peaks of traffic (more than 600 passages/day).
Based on the knowledge acquired through seismic measurements in 2018 and 2019, the destabilisation pattern observed in 2017 can be explained by the fact that significant quantities of snow covered the couloir on five occasions (compared to one occasion in 2019 and zero in 2018), as well as by more frequent liquid precipitation. However, the high frequency of rock destabilisation events in June was linked to an early heat wave that accelerated the melting of the snowpack and the deterioration of the permafrost. This phenomenon was studied over the entire Mont Blanc massif during the heat waves of 2003 and 2015 (Ravanel et al., 2017).
Overall, the 2017 season displayed a number of characteristics that created suboptimal conditions for mountaineering:- an early-summer heat wave;- regular precipitation and snowfall, leading to frequent destabilisation events, - visitor traffic concentrated around several distinct peaks.
29
Déstabilisations rocheuses - Grand Couloir du Goûter
Conclusion
The results presented in this report improve our understanding of the frequency and magnitude of rock destabilisation events in the Grand Cou-loir du Goûter, as well as their geomorphological, meteorological and climatic triggers. The trigge-ring of rock destabilisation events in the Grand Couloir du Goûter is linked to three phenomena that occur on different time scales:- snowmelt, which causes mechanical destabili-sation and allows water to seep into the cracks in the rock, prompting an increase in pore pres-sure and exacerbating the effects of freeze-thaw cycles;- daily freeze-thaw cycles, which play a role when the couloir is free of snow and are occasionally amplified by liquid precipitation; - the deterioration of the permafrost, which is also intensified by liquid precipitation and
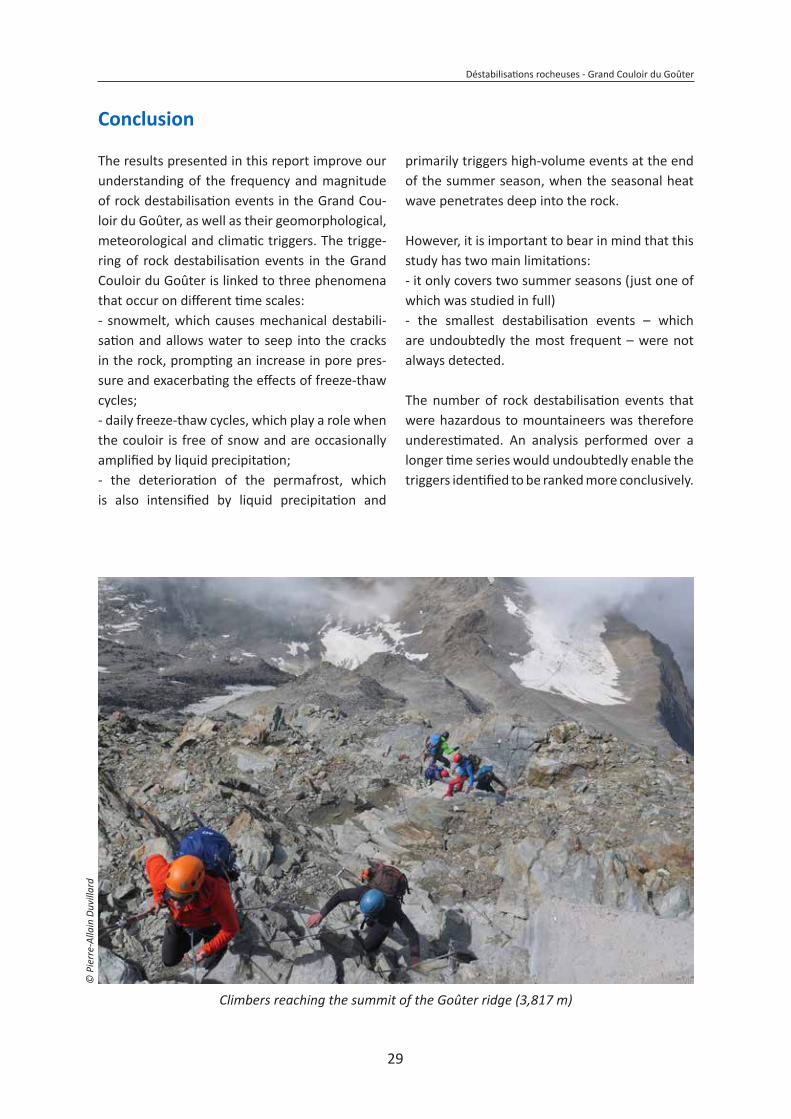
Climbers reaching the summit of the Goûter ridge (3,817 m)
primarily triggers high-volume events at the end of the summer season, when the seasonal heat wave penetrates deep into the rock.
However, it is important to bear in mind that this study has two main limitations: - it only covers two summer seasons (just one of which was studied in full)- the smallest destabilisation events – which are undoubtedly the most frequent – were not always detected.
The number of rock destabilisation events that were hazardous to mountaineers was therefore underestimated. An analysis performed over a longer time series would undoubtedly enable the triggers identified to be ranked more conclusively.
© P
ierr
e-Al
lain
Duv
illar
d
30
Déstabilisations rocheuses - Grand Couloir du Goûter
Key insights
Despite its limitations (see Conclusion), this study provides valuable information for those planning to ascend Mont Blanc:
- The number of rock destabilisation events recorded over the course of the study is an indicator of extreme gravitational activity.
- In 2019, a rock destabilisation event was recorded every 37 minutes on average and every 24 minutes on average during a peak of activity between 7 pm and 8 pm.
- The highest frequency of rock destabilisation events was recorded between 6 pm and 8 pm. It increased an average of three hours after temperatures became positive at the top of the couloir.
- Rock destabilisation events grew more frequent and larger in size when the couloir became exposed to the sun.
- The time of day when rock destabilisation was least frequent was between 9 am and 10 am.
- The couloir was as dangerous at 3 pm as it was at 10 pm.
- Rock destabilisation was more frequent at the beginning of the season, partly as a result of snowmelt. However, these events were relatively small in size, but still hazardous for mountaineers.
- The frequency of rock destabilisation events was lower in the second half of the summer season, but the longest events (“boulder showers”) and those involving the highest volumes of material also occurred during this period.
- The liquid water present in rock fractures seems to be the primary factor governing the risk of rock destabilisation. The more liquid water is present in the cracks in the rock (melt water/precipitation), the greater the frequency of rock destabilisation events. Mountaineers need to be particularly cautious during periods of snowmelt or after rain/storms.
- The presence of snow in the couloir is not necessarily a guarantee of safety, since snowmelt promotes rock destabilisation.
- A cold period marked by frequent freeze-thaw cycles is conducive to the occurrence of rock destabilisation. Only a cold period without thawing (which is rare in the summer) can reduce the frequency of destabilisation events.
31
Déstabilisations rocheuses - Grand Couloir du Goûter
Acknowledgements
The authors would like to sincerely thank Didier Hantz and Florence Magnin for their help in analysing the data, Pierre Dubois from REQUEA for allowing us to access this data, Antoine Rabatel (IGE) for providing us with a long-range lidar sensor and Emmanuel Thibert (INRAE) for granting us access to data from the Tête Rousse weather station. We would also like to thank Marc Whatelet, Axel Jung, Sandrine Roussel and Laurent Metral of the ISTerre laboratory for their help out in the field and in setting up the seismometers, as well as Bertrand Guillet for lending us his seismic measuring equipment. A warm thanks also to the municipality of Saint Gervais for supporting this project, to the Compagnie du Mont-Blanc for allowing us to access the site free of charge via the Mont Blanc tramway, and to all those who helped us carry and set up the equipment at the site. This study was funded by the EU ALOCTRA project AdaPT Mont Blanc and the Petzl Foundation.
References
Alpes Ingé. (2012). Couloir du Goûter, Suivi et analyse des chutes de blocs et de la fréquentation pendant l’été 2011. Rapport final. Fondation Petzl, 37.
D’Amato J., Hantz D., Guerin A., Jaboyedoff M., Baillet L., Mariscal A. (2016). Influence of Meteorological Factors on Rockfall Occurrence in a Middle Mountain Limestone Cliff. Natural Hazards and Earth System Sciences, 16: 719-735. doi: 10.5194/nhess-16-719-2016.
Dietze M., Mohadjer S., Turowski J., Ehlers T., Hovius N. (2017). Seismic Monitoring of Small Alpine Rockfalls - Validity, Precision and Limitations. Earth Surface Dynamics, 5, 653-668. doi: 10.5194/esurf-5-653-2017.
Fedorov R., Camerada A., Fraternali P., Tagliasacchi M. (2016). Estimating Snow Cover from Publicly Available Images. IEEE Transactions on Multimedia, 18(6): 1187-1200.
Hasler A., Gruber S., Font M., Dubois A. (2011). Advective Heat Transport in Frozen Rock Clefts: Conceptual Model, Laboratory Experiments and Numerical Simulation. Permafrost and periglacial processes, 22(4): 378-389. doi: 10.1002/ppp.737.
Krautblatter M., Funk M., Günzel F. (2013). Why Permafrost Rocks Become Unstable: a Rock – Ice-Mechanical Model in Time and Space. Earth Surface Processes and Landforms, 38(8): 876–887. doi: 10.1002/esp.3374.
Lacroix P., Helmstetter A. (2011). Location of Seismic Signals Associated with Microearthquakes and Rockfalls on the Séchilienne Landslide, French Alps. Bulletin of the Seismological Society of America, 101(1): 341-353. doi : 10.1785/0120100110.
Magnin F., Brenning A., Bodin X., Deline P., Ravanel L. (2015a). Statistical Modelling of Rock Wall Permafrost Distribution: Application to the Mont Blanc Massif. Geomorphologie, 21:145–162. doi:10.4000/geomorphologie.10965.
Magnin F., Deline P., Ravanel L., Noetzli J., Pogliotti P. (2015b). Thermal Characteristics of Permafrost in the Steep Alpine Rock Wallsof the Aiguille du Midi (Mont Blanc Massif. 3842 m a.s.l). The Cryosphere, 9. 109– 121. doi:10.5194/tc-9-109-2015
Magnin F., Josnin J-Y., Ravanel L., Pergaud J., Pohl B., Deline P. (2017a). Modelling Rock Wall Permafrost Degradation in the Mont Blanc Massif from the LIA to the End of the 21th Century. The Cryosphere, 11: 1813-1834. doi: 10.5194/tc-11-1813-2017
Magnin F., Westermann S., Pogliotti P., Ravanel L., Deline P. et Malet E. (2017b). SSnow Control on Active Layer Thickness in Steep Alpine Rock-walls (Aiguille du Midi, 3842m a.s.l., Mont Blanc Massif), Catena, 149(2), 648–662, doi : 10.1016/j.catena.2016.06.006
Mourey J., Moret O., Descamps P., Bozon S. (2018). Accidentologie sur la voie classique d’ascension du mont Blanc de 1990 à 2017. Fondation Petzl, 20 p. https://www.petzl.com/fondation/projets/accidents-couloir-gouter?language=fr.
Mourey J., Marcuzzi M., Ravanel L., Pallandre F. (2019). Effects of Climate Change on High Alpine Environments: Evolution of Mountaineering routes in the Mont Blanc Massif (Western Alps) over Half a Century. Arctic, Antarctic and Alpine Research, 51(1): 176-189. Doi : 10.1080/15230430.2019.1612216.
Mourey J., Ravanel L. (2017). Mesure de la fréquentation d’itinéraires d’accès à la haute montagne dans le massif du Mont-Blanc à l’aide de capteurs pyroélectriques. Collection EDYTEM SI Monitoring en milieux naturels, retours d’expériences en terrains difficiles, 263 – 270.
Ravanel L., Deline P. (2010). Climate Influence on Rockfalls in High-Alpine Steep Rockwalls : The North Side of the Aiguilles de Chamonix (Mont Blanc Massif ) Since the End of the ‘Little Ice Age’. The Holocene, 21(2): 357–365. doi: 10.1177/0959683610374887.
Ravanel L., Magnin F., Deline P. (2017). Impacts of the 2003 and 2015 Summer Heatwaves on Permafrost-Affected Rock-walls in the Mont-Blanc Massif. Science of the Total Environment. 609:132–143. doi: 10.1016/j.scitotenv.2017.07.055.
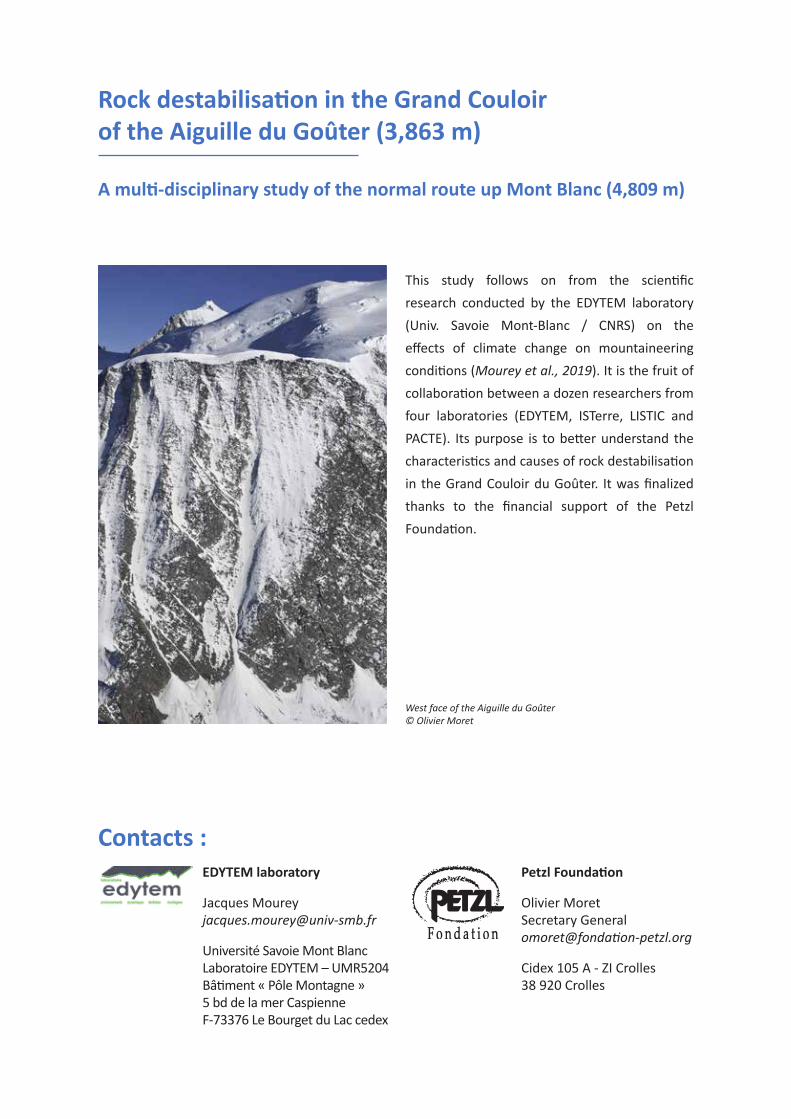
This study follows on from the scientific research conducted by the EDYTEM laboratory (Univ. Savoie Mont-Blanc / CNRS) on the effects of climate change on mountaineering conditions (Mourey et al., 2019). It is the fruit of collaboration between a dozen researchers from four laboratories (EDYTEM, ISTerre, LISTIC and PACTE). Its purpose is to better understand the characteristics and causes of rock destabilisation in the Grand Couloir du Goûter. It was finalized thanks to the financial support of the Petzl Foundation.
Contacts :EDYTEM laboratory
Jacques [email protected]
Université Savoie Mont BlancLaboratoire EDYTEM – UMR5204Bâtiment « Pôle Montagne »5 bd de la mer CaspienneF-73376 Le Bourget du Lac cedex
Petzl Foundation
Olivier MoretSecretary [email protected]
Cidex 105 A - ZI Crolles38 920 Crolles
West face of the Aiguille du Goûter© Olivier Moret
Rock destabilisation in the Grand Couloirof the Aiguille du Goûter (3,863 m)
A multi-disciplinary study of the normal route up Mont Blanc (4,809 m)