council formedical schemes reports/2004-2005 cms annu… · by colin richards) and comes from the...
TRANSCRIPT

COUNCIL FOR MEDICAL SCHEMES
1267 Pretorius Street, Hadefields Block E, Hatfield, Pretoria
Private Bag X34, Hatfield 0028
Telephone: 012 431 0500 Telefax: 012 430 7644
www.medicalschemes.com

C o u n c i l f o r M e d i c a l S c h e m e sA N N U A L R E P O R T 2 0 0 4 - 5

1267 Pretorius Street, Hadefields Block E, Hatfield, Pretoria
Private Bag X34, Hatfield 0028
Telephone: 012 431 0500 Telefax: 012 430 7644
www.medicalschemes.comNumber: RP146/2005
ISBN: 0-061-36049-X
COUNCIL FOR MEDICAL SCHEMES
S t r a t e g i c O b j e c t i v e s
Secure an appropriate level of protection forbeneficiaries of medical schemes and thepublic by authorising the conduct of medicalschemes business and monitoring the financialperformance and soundness of schemes.
Provide support and guidance to trustees andpromote understanding of the medicalschemes environment by trustees,beneficiaries and the public.
Foster compliance with the Act by medicalschemes, administrators, managed care entitiesand brokers and initiate enforcement actionwhere required.
Investigate and resolve complaints raised bybeneficiaries and the public.
Monitor the impact of the Act, researchdevelopments, and recommend policy optionsto improve the regulatory environment.
Foster the continued development of theCMS as an employer of choice.
Develop strategic alliances nationally,regionally and internationally.

Council for Medical SchemesA N N U A L R E P O R T 2 0 0 4 - 5

The imagesThe selection of images was made with theassistance of the Wits Art Gallery, to reflectnotions of health and the exchange of money inmany cultures in South Africa and the continentas a whole, many of which live side-by side in asetting which supports medical schemes. Thesetwo items (health and the exchange of money),very roughly mirror the business of medicalschemes.
The artwork reflected in the Annual Report2004/05 belongs to Wits University andStandard Bank Collections of Art. The Councilfor Medical Schemes expresses its gratitude forthe use of these images and in particular forthe assistance given by Julia Charlton, seniorcurator of the Wits Art Gallery.
PREVIOUS PAGE
● A DIVINER’S BASKET with the objectsnecessary for divining and therapy to deal withillness or “re-establish order in the vitalrelationships between people, and betweenpeople and the spiritis” (Boris Westliau quotedby Colin Richards) and comes from the Chokwepeople of Angola and the Democratic Republicof Congo.

● AIDS CLOTH byNoria Maswanganyi& Florence Nobelaof the ChivurikaEmbroidery Project.
c o n t e n t sChairperson’s foreword 5
Registrar’s overview 9
Report of the Auditor-General 37
Balance sheet 39Income statement 40Statement of Changes in Equity 41Cash flow statement 41Notes to the Financial Statements 42
Review of the operations of medical schemes during 2004 53
Annexures 87
2
1
3
4
5

4 COUNCIL FOR MEDICAL SCHEMES Annual Report 2004-5

Chairperson’s foreword
IT IS with considerable pride, but some nostalgia, that I present this foreword to
the Annual Report of the Council for Medical Schemes for 2004/05, as my tenure
chairing the Council draws to a close. During 2005, the terms of office of several
other Council members also come to an end. They are Ms Gando Matyumza
who has been an able deputy chairperson, Professor Heather McLeod,
Dr Jakes Jekwa and Dr Reno Morar.
I would like to thank them for the tremendous effort they put into
the work of the Council over the past five years. I am sure too that I
speak for all of us when I say that we are most grateful for the opportu-
nity afforded us to participate in the Council, and that we will miss
the dynamic and rewarding interactions we have enjoyed here.
We wish our successors as much fulfillment in their positions as
we experienced.
Over these past five years both the regulator and the industry
have experienced fundamental transformation – which contin-
ues. There is little comparison between the level of regulatory
oversight exercised in the medical schemes industry prior to
the creation of the new Council for Medical Schemes and
Office of the Registrar in 2000, and what is now in place.
In 2000, when the current Medical Schemes Act became
operational, the industry was regulated by a sub-direc-
torate in the Department of Health. This was inadequate
to regulate the then R30bn which was spent annually by
some 7-million beneficiaries in the industry while, at the
same time, ensuring that members and their dependants
were treated fairly in terms of the law, and ensuring an envi-
ronment which would function well into the future. A regulatory
structure was therefore created which would have the capacity and flexibility to
redirect further development of the private health funding sector in a manner con-
sistent with national health policy being rolled out by the first democratically-
elected government.
Inequities and unfair practices which had developed for members over the pre-
vious years, were now to be outlawed by the Medical Schemes Act, but this
required a strong and adequate regulator to translate the law into a useful reality
for members while protecting the financial security of schemes then and into the
future. This, in turn, called for the overseeing of specific moves: the promotion of
1
COUNCIL FOR MEDICAL SCHEMES Annual Report 2004-5 5
● Medicine containersThese calabashes are used byritual specialists as containersin which to store medicines.
Pare,Tanzania
Gourd, wood, fabric, fibre, beads
Standard Bank FoundationCollection of African Art - Housedat the University of theWitwatersrand Art Galleries
Acquired 2004

non-discriminatory access to private health care funding; the placing of schemes
on a sound financial footing; the improvement of scheme governance; and the
protection of consumers.
One of our first tasks as the Council was ensuring that the new regulator itself
had impeccable system of corporate governance. We therefore defined our role as
Council to include:
• leading and controlling the affairs of the organization and making strategic
decisions affecting the operations of the organization;
• exercising those legislative functions set aside by the Act to be exercised only
by Council and taking specific decisions that are judged by the Registrar and
Council to be of such significance as to require being taken by Council;
• setting appropriate policies to manage risks to the operations and achievement
of Council’s regulatory objectives, taking into account the nature and extent of
risks facing the Council, their likelihood of crystallising, and the Council’s
ability to reduce the incidence and impact of risks that do materialize;
• maintaining a sound system of financial controls, taking into account the costs
of particular controls relative to the benefits obtained in managing related
risks; and
• maintaining high-level relations with stakeholders and other agencies, includ-
ing government.
This corporate governance framework has served
us well over the years, and we hope that our
successors will build on it.
We also adopted a Code of Good
Conduct, which is underpinned by
the requirement that all Council
members bring independent judg-
ment to bear on issues of strategy,
performance, resources and stan-
dards of conduct. Other important
components of the Code include
access to suitable training, advice and
information, supplied in a timely manner, and in
a format and quality appropriate to enable Council to
discharge its duties. Again we recommend this code of conduct to
the new Council and hope that the code can be improved upon as new circum-
stances emerge.
We have seen, over the past five years, initial resistance by some stakeholders
giving way to a generally enthusiastic participation in a newly-invigorated indus-
try which is on a much sounder footing financially and ensuring greater assistance
towards its members. There is always room for improvement in any situation, but
we believe that our increased regulatory capacity has translated into a more-pro-
fessional and useful service matched by growing levels of cooperation and mutu-
al respect between ourselves and industry stakeholders.
In 2000, close to 50% of members of schemes belonged to schemes with sol-
6 COUNCIL FOR MEDICAL SCHEMES Annual Report 2004-5
C H A I R P E R S O N ’ S F O R E W O R D
1
● Diviner’s necklacePart of the regalia wornby a sangoma ortraditional healer whenconsulting with andtreating clients.
Wood, thread, glass beads,leather
Standard Bank FoundationCollection of African Art -Housed at the University ofthe Witwatersrand ArtGalleries

vency levels of less than 10%. In 2000, the regular annual deficit schemes made
had amounted to R1bn. I leave office with the vast majority of members in
schemes which meet the statutory minimum solvency levels of 25% or more, and
with the industry now regularly making large surpluses. We have achieved suc-
cesses in the areas of minimum reserve requirements, more stringent financial
controls within medical schemes, and closer scrutiny of the financial affairs of
medical schemes. A stronger awareness of the need for good governance also
exists, with participation of trustees and consumer groups in educational pro-
grammes that the Registrar has set up.
As the Council goes forward, it looks to the creation of a Risk Equalisation
Fund for the industry as well as continued participation in the creation of a Social
Health Insurance system.
As a Council, we were very fortunate that the Minister of Health, Dr Manto
Tshabalala-Msimang took a very active interest in our work over the years. The
Minister’s support on key regulatory measures -- such as curbing the abuse of rein-
surance, setting out appropriate requirements for prescribed minimum benefits
and medical schemes governance -- has been very important to many of the sem-
inal successes of the Council. I take this opportunity to thank the Minister for her
considerable assistance and counsel to us as Council.
In closing, I would like to pay particular tribute to the Registrar, Patrick
Masobe, for his leadership of the executive arm of the Council. Under his direc-
tion, a regulatory body has emerged that has demonstrated vision, the ability to
be flexible under appropriate circumstances, and the tenacity to remain resolute
when key issues of policy and principle are at stake. I have every confidence that
the Registrar and his team will continue to build on their successes, learn from
their mistakes, and boldly confront the challenges that lie ahead. I wish them well.
Prof Nicky Padayachee
Chairperson – Council for Medical Schemes
C H A I R P E R S O N ’ S F O R E W O R D
1
COUNCIL FOR MEDICAL SCHEMES Annual Report 2004-5 7
8 COUNCIL FOR MEDICAL SCHEMES Annual Report 2004-5
● Isijolandi (medicine necklace)Zulu, South Africa
Glass beads, horns, plastic spoons
Standard Bank FoundationCollection of African Art - Housedat the University of theWitwatersrand Art Galleries
Also see necklace on page 13.

COUNCIL FOR MEDICAL SCHEMES Annual Report 2004-5 9
2
Registrar’s review
External developments affecting our workThe past year has seen a number of important policy developments that, though
not part of our regular agenda, have nonetheless impacted on our work. These
external factors have affected the experience that beneficiaries had of their medical
schemes and we have had to expend much effort on addressing these issues.
Central to these has been the promulgation of the new regulations on the pricing
of medicines and the Competition Tribunal hearings on the proposed sale of the
Afrox hospital group to a consortium made of Mediclinic and its black econom-
ic empowerment partners.
Regulation of medicine prices
Medical schemes and their beneficiaries expressed a great deal of
uncertainty over the implications of the new medicines pricing
regulations in the light of legal challenges mounted against
these regulations by a number of parties in the private sector.
Those needing medicines for the compulsory cover of the 25
prescribed chronic conditions were faced, too, with added
costs when pharmacists decided to charge “administrative” fees
that were not reimbursed by medical schemes. We were, as a con-
sequence, inundated with queries both from medical schemes and
from beneficiaries expressing their anxiety over the implications of
the medicine-pricing regulations. A considerable amount of our time
was spent jointly with the health department responding to beneficiaries’ com-
plaints and to schemes’ enquiries. While a judgement from the Constitutional
Court on the legality of these regulations is still awaited, it would appear that the
promise of lower medicine costs is in sight, with manufacturer prices estimated to
have decreased by 21% since May 2004.
Competition Tribunal hearings and the Afrox Healthcare transaction
We were called upon to assist the Competition Tribunal in its deliberations on the
likely impact of the proposed transaction on hospital costs. This was done with a
submission on behalf of the Minister of Health and of the Council and then by
providing expert help at the hearings. Hospital costs are the largest portion of
● A medicine gourd, ornhunguvana. “Such objectsare more and less thanstethoscopes or antibiotics,”says Rayda Becker describingthe object and its relationshipto its users – and the distancefrom its Western oberservers.It rests in a beaded basketknown as a xitebana and theNhlontwa, the head on the topof the stopper (with a stirringdevice) has been separatelycreated Tsonga-Shangaan, South Africa.
medical scheme input costs, and our work at the Tribunal gave us an opportunity
to look critically at competition in the hospital industry with an eye on the effect
this has on costs to the public in general and medical schemes in particular. The
outcome of the Tribunal hearings resulted in a complete restructuring in the
financing of the deal in which the BEE consortium bought the interests of Afrox
Healthcare from the parent group and the complete disappearance of Mediclinic.
New developments in the regulatory regime
We advanced the improvement of the medical schemes regulatory framework on
a number of fronts during the year under review. In this section we report on
some of the more important changes to the regulatory regime.
Mitigating against unfair discrimination in benefit design
We have found it necessary to scrutinise more thoroughly the construction of ben-
efits and certain practices that have grown over the years in benefit design in order
10 COUNCIL FOR MEDICAL SCHEMES Annual Report 2004-5
REGULATING IN THE PUBLIC INTEREST: Taking stock and looking to
A Five-Year Review of the Council for Medical Schemes
AS THE Council for Medical Schemes
approached the end of its fifth year
of operations in 2005, the Registrar
published a review and analysis of
the first five years of the Council.
The review will provide a basis for
critical reflection on progress and lay
the platform for future actions. It will
be provided to the Minister of Health
for her consideration in relation to
the requirement to assess Council’s
performance every five years.
The Council was established
to protect the interests of
beneficiaries of medical schemes, to
ensure that medical schemes func-
tioned in a way which comple-
mented national health policy and
to make recommendations to the
Minister of Health.
The review outlined the setting up
of the Council and of the Office of
the Registrar and set out the strategic
objectives of the organization while
assessing its accomplishments and
shortcomings over the period.
Financial soundness of medical
schemes formed a major focus of the
early years of the regulatory effort. By
2000 an increasing annual deficit in
the industry had reached R1bn. To
address this, it became apparent that
the growing phenomenon of the
inappropriate use of reinsurance in
the industry, needed to be addressed.
Other areas highlighted in the
review include progress on managing
rules of schemes, simplifying benefits
● Umdwana (Child figure ordoll). Different uses for thedolls are recorded; somerelated to fertility, others toornamental or decorativepurposes, and still others toidentity statements.Ndebele, South Africa
Gourd, beads, fibre
Standard Bank FoundationCollection of African Art - Housedat the University of theWitwatersrand Art Galleries
R E G I S T R A R ’ SR E V I E W
2

to allay continuing concerns of unfair discrimination against some members of
schemes. This work represents, in part, our attempt to implement the recommen-
dations made in our Fair Treatment of Members project, where members
expressed their displeasure at unnecessary complexity of benefit design.
Part of the problem is manifest in the increasing trend to moving, as far as pos-
sible, benefits out of the risk pool and of forcing members to pay for increasing
amounts of healthcare from medical savings accounts and the so-called annual
routine benefits. Another problem relates to the differentiation of total contribu-
tions within a single-benefit option based upon variable contributions to a med-
ical savings account.
These various configurations of medical savings accounts, annual routine ben-
efits, thresholds and deductibles have largely had the effect of creating a de facto
risk-rated contribution for out-of-hospital expenses, based on age and health sta-
tus. In other words, for out-of-hospital expenses, over a period of time the actual
contribution payable by a member begins to approximate the rate payable by that
member based on expected claims of that member and her or his dependants, as
opposed to a community-rated contribution based upon an expected average cost
for the medical scheme.
Towards the end of 2004, we informed schemes that these benefit designs were
COUNCIL FOR MEDICAL SCHEMES Annual Report 2004-5 11
2
the future
provided by schemes and constructing a
compliance-based regime for the setor.
The review notes that in the past
five years progress was made in pro-
moting non-discriminatory access to
private health funding. Practices of
overt and direct discrimination on the
basis of age and health status were
largely contained – but structural
problems emerged which have result-
ed in older and sickly members facing
greater financial obstacles in gaining
access to health care.
Scheme governance falls among
four broad thematic concerns which
the report regarded as critical factors
going forward. Price-setting behaviour
by schemes and providers formed a
second concern; rationing in a setting
of scarce resources produces decisions
which have to be made on limitations
to health care; and a final concern,
the report noted, is the appropriate
regulation of the use of expensive
technology.
R E G I S T R A R ’ SR E V I E W
neither acceptable nor legal and that they had to be ended. They result in unfair
discrimination directly or indirectly against persons on grounds of state of health,
contrary to section 24(2) (e) of the Medical Schemes Act, and they constitute a cir-
cumvention of the provisions of the Act.
Implementation of ICD 10 codes
The purpose of the new coding system is to standardise data collection and billing
practices in order to improve efficiency. An ICD 10 implementation task team --
including department of health, medical schemes and administrators, providers
and switching companies -- was formed to develop an implementation strategy
for ICD 10 for medical schemes. The task team has evaluated the readiness for
implementation by schemes, providers, switching companies and other relevant
stakeholders. It was decided that the ICD-10 codes should be implemented
on1July 2005.
The process of further consultation with stakeholders is continuing, with
many aspects that will need to be dealt with in the course of the actual imple-
mentation after July 2005.
The 15 PMB chapters have also been coded for ICD10, and they now
form the basis of our interpretation of members’ entitlement to PMBs. This
process, while appearing to be removed from the immediate sphere of
member interest, will directly affect the way in which members are reim-
bursed. It will require significant effort in educating stakeholders as well
as members so that the system can deliver its objective of efficiently reim-
bursing for conditions that are being treated and for which schemes are
obliged to pay in full.
The National Health Reference Price List (NHRPL)
For the second consecutive year we have undertaken the task of compil-
ing a reference price list of services supplied into the medical scheme
environment. Although not initially a core function of the CMS, the
move in the year 2003/04 to provide the list was necessitated by action
taken by the Competition Commission in curtailing the annual negoti-
ations between the medical schemes industry through the Board of
Healthcare Funders and hospital and doctor groups. This move had created
an impasse in the medical schemes environment and the Council stepped in to
compile a reference price list that schemes could use to define their benefits
should they wish.
During 2004, state hospital prices and services were included in the list at the
request of the department of health. The intense level of work required on this list
and the persistent nature of inquiries from stakeholders necessitated the employ-
ment of one extra staff member during the year. Some changes to the compilation
of the list were reflected in the outcome of the pricing exercise. The previous
approach of keeping price increases “cost neutral” was changed where necessary,
12 COUNCIL FOR MEDICAL SCHEMES Annual Report 2004-5
R E G I S T R A R ’ SR E V I E W
2
● Katatora (divinationinstrument) Divinationinstruments such as these areused by ritual specialists inthe consultation of spirits.Luba, Democratic Republic ofCongo
Wood, beads
Standard Bank FoundationCollection of African Art - Housed at the University of theWitwatersrand Art Galleries

particularly when there
was solid evidence of higher real
input costs. However in the absence of adequate justification, the year’s CPIX infla-
tion figure of 5,2% was adhered to.
Risk Equalisation
We continued to assist the department of health with the technical work on the
development of policy on the Risk Equalisation Fund (REF). The Council has now
been requested by the department to proceed with the testing of the REF scheme
to assist government in coming to a final decision on its implementation.
A number of technical documents were completed in this regard during this
year. They include:
• Methodology for the determination of REF contribution tables;
• Accounting and financial implications of the REF for medical schemes – done
together with SAICA; and
• Solvency implications of the REF for medical schemes.
A reporting framework for medical schemes, including the necessary return that
will allow for submission by schemes of the data required for the shadow REF run,
has been finalised. We are also in the process of completing a review of the feasi-
bility of implementation and the technological and institutional infrastructure
required to operate the REF. As this report was going to press, Cabinet announced
its approval of the implementation of the REF
Prescribed minimum benefits
The Minister of Health introduced amendments to the HIV/AIDS PMBs on 1
January 2005 to make provision for the payment by medical schemes of anti-
retroviral therapy treatment.
Consultations on the setting up of a REF have also provided the impetus to
research defining a basic benefit package that will facilitate the implementation of
risk equalisation among schemes. A preliminary set of principles that will guide
the process of the development of a basic benefit package has been developed.
During September 2004, three members of staff who are directly involved in the
project visited the Netherlands, Ireland, and the state of Oregon in the USA to
learn more about developing a basic benefit package. We expect this work to gath-
er momentum during 2005/06.
COUNCIL FOR MEDICAL SCHEMES Annual Report 2004-5 13
● Necklaces such as this wereworn by ritual specialists,medical practitioners and theirclients to store medicines andother powerful substances.Zulu, South Africa
Umgexo (medicine necklace)
Glass beads, test tubes
Standard Bank FoundationCollection of African Art - Housed at the University of theWitwatersrand Art Galleries
These preliminary results also show that that
use of formularies and protocols chronic medi-
cines has increased to 85% of open schemes from
33.6% prior to the regulations coming into force.
The use of protocols also increased to 64,5% from
34,2% in restricted schemes.
Access to medical schemes by people with low incomes
Also as a result of the REF consultation process, and with an eye on how best to
deliver less-expensive benefit options which would cover those with some income
but who are presently not covered by the medical scheme industry, focus has been
given to the possibility of developing a low-cost medical scheme environment.
This project, again undertaken with the industry, is reviewing issues both on
the demand and on the supply side that constrain the development of low-cost
options within medical schemes. We expect recommendations to be made during
January 2006, and these will then be assessed for their policy implications.
Assessing the impact of chronic disease list and designated serviceproviders.
The introduction of compulsory cover for 25 chronic conditions with arrange-
ments made for provision of services through designated service providers has
now been in effect for more than a year. We have undertaken a substantial drive
to make the public aware of these arrangements. While the basic objective of
ensuring that schemes provide cover for these diseases has been achieved, it
became clear during the year that some schemes used this opportunity to cease
covering other chronic conditions that were not included within the legislated 25.
In addition, we have had to intervene in the reluctance of certain schemes to sup-
ply cover for treatments that may, for medically sound reasons, have varied from
the treatment algorithm attached to the chronic conditions.
A project to monitor the impact of the legislation on designated service
providers and on the chronic disease list is underway. The primary purpose is to
gain an improved understanding of the impact of these new policies on a range of
issues including delivery of PMBs, changes in benefit design and contributions,
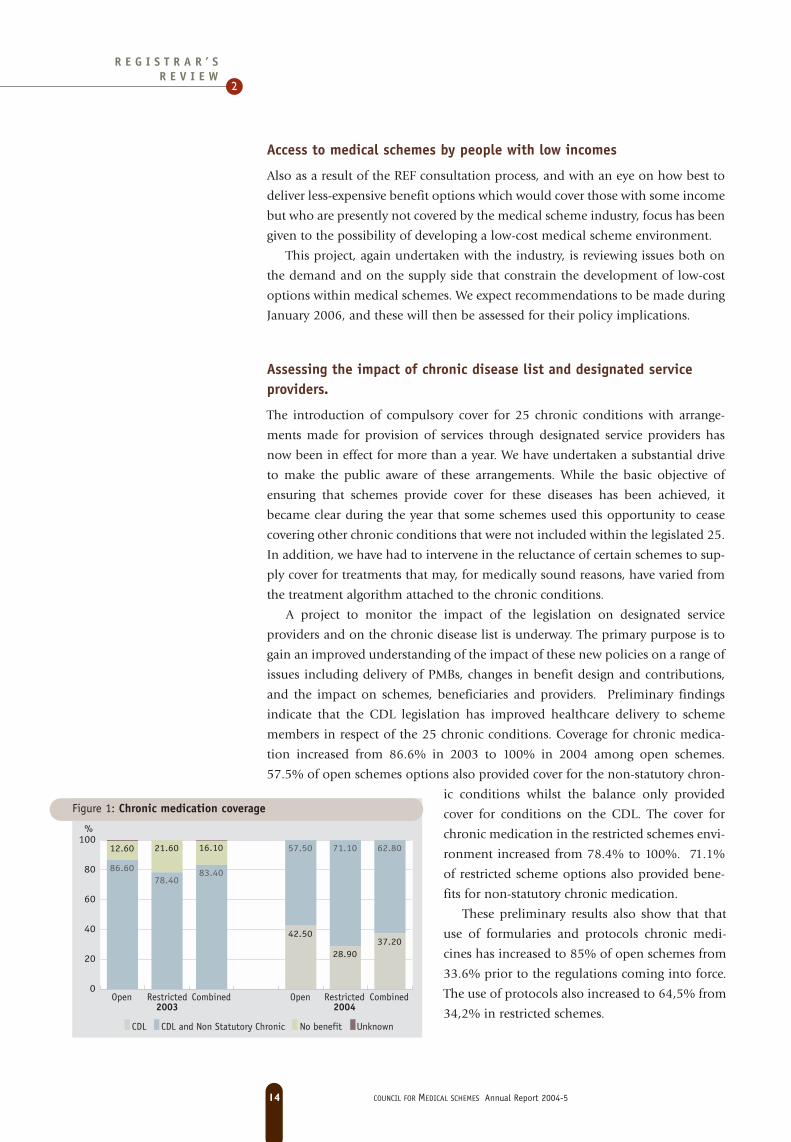
and the impact on schemes, beneficiaries and providers. Preliminary findings
indicate that the CDL legislation has improved healthcare delivery to scheme
members in respect of the 25 chronic conditions. Coverage for chronic medica-
tion increased from 86.6% in 2003 to 100% in 2004 among open schemes.
57.5% of open schemes options also provided cover for the non-statutory chron-
ic conditions whilst the balance only provided
cover for conditions on the CDL. The cover for
chronic medication in the restricted schemes envi-
ronment increased from 78.4% to 100%. 71.1%
of restricted scheme options also provided bene-
fits for non-statutory chronic medication.
14 COUNCIL FOR MEDICAL SCHEMES Annual Report 2004-5
R E G I S T R A R ’ SR E V I E W
2
CDL CDL and Non Statutory Chronic No benefit Unknown
Open Restricted Combined Open Restricted Combined2003 2004
12.60 21.60 16.10 57.50 71.10 62.80
86.6078.40
83.40
42.50
28.9037.20
0
20
40
60
80
100%
Figure 1: Chronic medication coverageFigure 1: Chronic medication coverage

Finally, our research found that a total of 78.2% of all options used DSPs in
2004, against only 45.3% in 2003. The use of DSPs in 2004 included those for the
CDL and non-statutory chronic conditions. It
would appear that DSP arrangements have been
identified as a useful strategy for managing risk.
While this increase is encouraging, neither the
registered rules of the schemes nor the member
communication are consistent in the identifica-
tion of the DSP. The communication often just
states that a DSP has to be used without stipu-
lating who the DSP is. It was not clear whether
this had been communicated to members in
other ways.
The second phase of the research will be
completed by October 2005, and will focus par-
ticularly on the impact on costs, beneficiaries
and providers.
Medical schemes expenditure on privatehospitals
Our participation in the Competition Tribunal
hearings has also provided some impetus to an
aspect of our investigation into the cost drivers
in medical schemes. Figure 4 below shows real
expenditure on private hospitals by medical
schemes on a beneficiary per month, over an
eight-year period. After adjusting for inflation
and membership, the overall expenditure on
hospitals rose by 17,3% to R186,6 per benefici-
R E G I S T R A R ’ SR E V I E W
2
COUNCIL FOR MEDICAL SCHEMES Annual Report 2004-5 15
CDL CDL and Non Statutory Chronic No Formulary
Open Restricted Combined Open Restricted Combined2003 2004
20.80 35.50 26.5066.40 64.90 65.80
38.30
19.7031.10
33.60 35.10 34.2040.80
44.70 42.30
0
20
40
60
80
100%
CDL CDL and Non Statutory Chronic No DSP
Open Restricted Combined Open Restricted Combined2003 2004
19.00 26.30 21.8060.20 44.80 54.70
28.1028.90
28.40
39.80
55.20
45.3052.90
44.7049.70
0
20
40
60
80
100%
Figure 3: Use of designated service providers in schemes
97 98 99 2000 01 02 03 040
40
80
120
160
200
Ward fees Theatre fees Global and Per Diem Consumables Medicines
month in 2003 Rand terms)
Figure 2: Changes in the use of formularies and protocols for chronic medications
Figure 3: Use of designated service providers in schemes
Figure 4. Real expenditure on private hospitals (per beneficiary per month in 2004 prices)

ary per month in 2004 from R159 in 2003. Ward fees increased by 20,4% to R74,8
from R62,1 in 2003. The highest increase was for theatre fees, which rose by
35,6% to R42,3 from R31,2 in 2003. Medicines increased by 16,4% to R31,6 from
R27,2 in 2003.
Total private hospitals expenditure has increased by an inflation-adjusted
103,1%, since 1997. Ward fees increased by 85,8%; consumables by 63,1%
and medicines by 122%. Theatre fees have risen by 172%!
Of particular concern is the fact that private hospitals are oper-
ating in a largely unregulated environment and that medical schemes
provide little effective countervailing market power to that of the major
hospital groups. We have therefore initiated an intensive research project
on medical schemes’ expenditure on private hospitals, with the following
three objectives:
• To assess the impact and extent of escalating private hospital
costs in relation to medical schemes expenditure;
• To identify and evaluate the causes of current and his-
torical rates of escalation of private hospital costs in South
Africa; and
• To identify and recommend possible remedies to reduce
the rate of private hospital cost escalation, to the extent that it
may be found to be inappropriate, and to mitigate the effects
thereof.
This project is expected to generate a consolidated final report by March 2006.
Our work with regulated entities - medical schemes,administrators, managed care organisations and brokers
Risk-based regulatory framework
The Council takes a risk-based approach to regulation, and the intensity of our
work with specific schemes depends on whether or not they are among those clas-
sified as high impact. During the year, we developed risk assessment frameworks
and risk mitigation plans for a number of schemes, including Fedhealth, Bonitas,
Oxygen, Discovery Health, Spectramed and Bankmed. The trustees have been
briefed on our view of the risks within their schemes and measures to mitigate
them. We will now monitor the implementation of specific mitigation plans while
we continue to roll out the development of risk assessment and mitigation plans
to other high impact schemes.
Promoting financial health of schemes – and treating their ills
Several schemes are on our monthly monitoring programmes to assist in restor-
16 COUNCIL FOR MEDICAL SCHEMES Annual Report 2004-5
R E G I S T R A R ’ SR E V I E W
2
● Katanga copper crosses,
See page 35.

ing them to good financial health. Our work in this regard has
focused on:
• POLPRISMED – we appointed a compliance officer to this
scheme who was instrumental in turning its deficit position
into an operating surplus by year’s end. The scheme is
now in the process of finalising an amalgamation
with HOSMED.
• LIBERTY medical scheme remains on the monthly monitoring
schedule. Monitoring of performance against a business plan
agreed between the Registrar and the trustees of the scheme forms
the basis for the monthly meetings. The solvency position of the
scheme has improved from 10,05% in 2003 to 20,78% by
December 2004.
• PROTECTOR HEALTH medical scheme’s financial position has not
improved much over the last financial year, and the scheme remains
under constant watch.
• X-PRESS’s (Renaissance Health) solvency declined to 11,52% for the year ended
December 2004. The scheme has been placed on our monitoring schedule.
• MUNIMED incurred losses on two of its options, resulting in declining solvency.
The scheme has been placed on watch and will be monitored carefully in line
with the agreed business plan.
• PHAROS medical scheme has seen a slight improvement to 15,34% from
13,49% during 2002 in its solvency and will remain on monitoring.
• OXYGEN medical scheme’s solvency declined to 16,25%% from 25,64% during
the period under review, with a number of options making operating losses.
The scheme has been instructed to redesign these options and is now on our
monthly watch list.
• GLOBAL HEALTH’s solvency declined to 20,61% in 2004 from 26,98% in 2003.
The scheme has been instructed to provide monthly management accounts.
• PROFMED has improved solvency to 22,04% in 2004 from 8,83% the previous
year after considerable restructuring of benefits and administration. The
scheme remains on our monitoring programme.
• SEDMED, NBC and NIMAS have been placed under monitoring as they are still
below the required 25% solvency margin.
• DISCOVERY HEALTH medical scheme remains on our monitoring system,
though it has increased its solvency to 23,62 % from 2,58% in 2002.
• MEDSHIELD has reached the required 25% solvency level but remains on mon-
itoring until concerns on high levels of non-healthcare expenditure are
resolved.
• RESOLUTION HEALTH’s solvency has also increased to almost 25% but the
scheme remains on the monitoring programme until concerns over gover-
nance and high non-health expenditure have been fully dealt with.
• FEDHEALTH, SPECTRAMED, BESTMED, SIZWE, BONITAS, MEDCOR and CSIR have all
reached the prescribed 25% solvency level in line with agreed business plans
and are no longer on our monthly monitoring programme.
R E G I S T R A R ’ SR E V I E W
2
COUNCIL FOR MEDICAL SCHEMES Annual Report 2004-5 17
● An Asen, of the Fonpeople of Benin, this
piece of “theatre” marksthe grave of, and is
offered to a dead personand is used in rituals tohonour that person. WilliamKentridge writes: “There isan initial understandingbetween the donor and thecraftsman; a briefing ofwhat is needed on the asen,or a list of requests fromthe donor to the maker…”

Reinsurance
The financial results of schemes show that the dramatic decline in reinsurance
losses has continued along with increases in solvency levels. Reinsurance
losses have decreased from R297 million in 2002 when the Act was
amended to require greater oversight of reinsurance, to R123
million in 2003 and now R7,8 million in the period under review.
Medical schemes auditor approvals
The process of auditor approval has been continued. We have again
refined the approval process, and have now been able to ensure that
a greater number of auditor approval applications are received and con-
sidered before the commencement of the statutory audit. This suggests
that Council’s auditor approval process is gaining in effectiveness and that
medical schemes and their auditors are paying increasing attention to legisla-
tive requirements in this regard.
Medical schemes’ financial performance during 2004
Part four of this annual report contains a comprehensive analysis of the financial
performance of medical schemes during 2004. A brief review of these financial
results shows the following points:
• During 2004, the number of principal members of medical schemes increased
by 1,1% to 2.8 million members. However the ratio of dependants to mem-
bers has continued a slight downward trend leaving overall beneficiaries figure
unchanged at 6,9 million for the year. The dependants ratio declined to 1,45
from 1,48 the previous period.
• The proportion of pensioner members (those 65 and over) within schemes has
grown to 6,7% from 6,4% in 2003.
• We have collected data for the first time on the provincial distribution of med-
ical scheme members. These data shows that 37,3% of members are-in
Gauteng, while 17,3% and 14,9% are in the Western Cape and KwaZulu-Natal,
respectively. The Northern Cape accounted for the least number of members
of medical schemes at 2,2%.
• Gross contribution income increased by 7,4% to R52,2bn. Risk contributions
were R46,7bn while medical savings accounts contributions were R5,5bn.
• Once again the industry’s financial picture is in good health. Net assets rose
35,4% to R20,4bn from R15,1bn the year before. Total surplus from opera-
tions has increased steadily since 2001, and rose 17,2% to R2,8 billion from
R2,4bn in 2003.
• The inclusion of investment and other income increases the overall surplus to
R5,0bn, an increase of 14,1% compared to 2003. Accumulated funds grew by
34,1% to R18,9bn from R14,1bn last year.
• The solvency ratio of the industry as a whole rose to 36,6% at December 2004
from 29,3% the previous year. Open schemes grew solvency by 33,5% to
18 COUNCIL FOR MEDICAL SCHEMES Annual Report 2004-5
R E G I S T R A R ’ SR E V I E W
2
● Divination items. These formpart of the set of items keptby a sangoma or traditionalhealer and used for diagnosingailments and prescribingremedies. Southern African
Wood, cowrie shells, ivory
Standard Bank FoundationCollection of African Art - Housedat the University of theWitwatersrand Art Galleries

27,9%. Restricted schemes, on the other hand, achieved a solvency position of
58% compared to 49,3% in 2003.
• The ability of medical schemes to pay claims has increased considerably over
the past three years. The number of months’ claims that schemes can cover
from their existing cash and cash equivalents have increased to 5,7 months
from 4,2 months in 2003.
• Total expenditure on benefits increased by 7,2% to R41.5bn. The increase per
beneficiary per month was 6,5%. Private hospital expenditure increased by
18,8% to R15,7bn. Spending on public hospitals increased by 5,3% to R261,9
million. Medical specialists accounted for R8,2bn, and increase of 8,4% on the
previous year, while expenditure on general practitioners declined by 1,7% to
R2,9bn. Expenditure on medicines, in a year that saw a great deal of activity
R E G I S T R A R ’ SR E V I E W
2
COUNCIL FOR MEDICAL SCHEMES Annual Report 2004-5 19
2000 01 02 03 04
Prescribed Solvency Level Industry Average Open
% Solvency ratio
10.00
13.50
17.50
22.00 25.00
13.30
13.5015.10
20.90
27.90
0
5
10
15
20
30
Figure 5: Solvency of open schemes
25
Figure 5: Solvency of open schemes
2000 01 02 03 04
10.0013.50
17.5022.00
25.00
34.2036.30
41.30
49.60
58.00
0
10
20
30
40
50
60
70
Prescribed Solvency Level Industry Average Restricted
% Solvency ratio
Figure 6: Solvency of restricted schemes

around pricing in the judicial arena, decreased to R8bn from R8,6bn in 2003.
• Administration expenses increased by 10,3% to R5bn and managed care
expenses rose by 12,6% to R1,3bn. These two components of non-healthcare
expenditure effectively accounted for 12% of gross contribution income
(11,7% in 2003).
• The increase in broker fees of 21,1% to R704 million continues to underscore
the problem of churning and inefficient utilisation of members’ contributions.
We intend to place firm new recommendations before the Minister in order to
deal with this matter.
• Bad debts, or “impaired receivables” amounted to R215 million in 2004, a
decrease of 33,2% on 2003.
• Total non-health expenditure rose by 7,6% to R7,1bn and accounted for
13,9% of gross contributions. Non-health expenditure per beneficiary has
increased in real terms by 6,5% to R893.
Accreditation of administrators and managed healthcare entities
A lengthy process on accreditation of administrators and managed healthcare
entities came close to finality in the course of 2004/05.
The Council has been working on proposals for an appropriate policy direc-
tion for the use of managed care by medical schemes. The initial phases of accred-
iting managed health care entities began during this period and coincided with
the development of these policy proposals.
Some 47 managed care entities were accredited during the period under review.
Many of these are subject to various conditions that must be complied with in
order to remain accredited. These included Clinical Partners (Pty) Ltd, a company
associated with the Netcare hospital group. During the year 2004/05, we asked the
Competition Commission for a view on whether or not this particular arrangement
of doctors associated with the hospital group, posed potential competition prob-
lems. The Commission responded that the issue could only be determined in the
light of the conduct and contractual arrangements by the proposed entity. Council
then decided to accredit the company as a managed healthcare organisation, sub-
ject once again to various conditions.
The need for accreditation means that the provision of managed healthcare
services will be illegal if organisations offering the service are not accredited as
providers. This process is intended to ensure that the provision of these services
enhances the quality and efficiency of services to beneficiaries of medical schemes.
The same would apply to the accreditation of administrators – existing admin-
istrators are deemed to be accredited until the process of evaluation has been com-
pleted. During 2004/05, some 11 applications for accreditation were scrutinised
and approved, subject to a number of conditions. This information has been
placed on our website.
This process will have implications for those providing administration servic-
es and charging for them but who have not applied for accreditation or whose
accreditation has been denied. Once again, these moves, required by statute, are
20 COUNCIL FOR MEDICAL SCHEMES Annual Report 2004-5
R E G I S T R A R ’ SR E V I E W
2

implemented to ensure that medical schemes and
their beneficiaries receive adequate service in the
administration of the funds intended for their
health care.
Accreditation of brokers
There were 6 684 individuals accredited as
health brokers during the year. We have also
accredited 152 new organizations and 211
had their accreditation renewed. There were 596
accredited broker organizations on our database.
Registration of rules, new schemes andassessment of amalgamations
An important development during this period was the registration in
November 2004 of the new Government Employees Medical Scheme (GEMS).
The registration was subject to several conditions and much of 2005 was to be
spent setting the scheme up with the involvement of the unions and other staff
representatives. Some 1,5 million members could be covered by GEMS by 2009.
Its appearance on the scene will have profound implications for several schemes
that currently have large numbers of civil service members.
The registration of scheme rules has proceeded apace. The process was slower
in the year under review partly because of difficulty by schemes in interpreting
properly the requirements for designated service providers, and partly because of
added scrutiny of benefit design by our team. One issue that has emerged as high-
ly complex has been the attempt to ascertain the quantum of co-payments for pre-
scribed minimum benefits in a setting that is not a designated service provider.
Some schemes have required co-payments in excess of 80% of the cost – which we
have had difficulty in approving. Nonetheless, attempts to quantify the exact
amounts in order to come to a reasonable co-payment quantum have been more
complex than originally contemplated.
Among the amalgamations considered during the year were those of Oxygen
and Meds; PULZ and NMP (to form Momentum Health); Discovery and
AngloGold and SAB and ABI. The request by IBM to amalgamate with DHMS was
turned down as we believed that this will not be in the best interests of many
members of IBM. The amalgamation of NMP and PULZ caused a great deal of
member confusion seemingly caused by inappropriate communication. This was
eventually sorted out with the help of our office.
Bargaining council medical schemes
Bargaining council medical schemes remain largely outside of the regulatory
ambit of the Medical Schemes Act. The regulatory concern here is that members
R E G I S T R A R ’ SR E V I E W
● Diviner’s necklace. Part ofthe regalia worn by a sangomaor traditional healer whenconsulting with and treatingclients.Swazi/Tsonga-Shangaan, SouthAfrica
Glass beads, thread, ndoro (conusshell)
Standard Bank FoundationCollection of African Art - Housed at the University of theWitwatersrand Art Galleries
2
COUNCIL FOR MEDICAL SCHEMES Annual Report 2004-5 21
covered by these schemes are not afforded the protections offered by the Act.
Nonetheless, there is recognition that several of these entities have devel-
oped an effective mechanism for the delivery of basic health care.
We undertook a project to evaluate options for the resolu-
tion of uncertainties over the migration of bargaining coun-
cil schemes to the Medical Schemes Act, as required by
legislation. A situational analysis of these schemes has
been undertaken, together with the Department of
Labour, to gain a broader understanding of these
schemes and the environment in which they operate.
The findings have been discussed in workshops with
bargaining councils around the country, and will lay
the basis for policy on these schemes.
Governance of medical schemes
Several events during the course of 2004/05 prompted the Council to devote con-
siderable resources to examining governance of medical schemes. One of our
“theme” projects focussed on governance, in particular on identifying the causes
of governance failure within schemes and recommending additional strategies to
improve governance and to mitigate the risk of governance failure. Several scheme
representatives, administrators and others gave their time and expertise to partic-
ipate in the investigation.
Some of the preliminary findings have been interesting and pointed to some
of the areas where attention could be devoted. For instance, although trustees of
many of the boards of trustees showed a great range and variability in skills and
experience, most schemes did not have a formal induction programme for new
trustees. Induction was usually informal. Although schemes saw it as their respon-
sibility to ensure that trustees were fit and proper to carry out their duties, few had
any screening processes to ensure that trustees were, indeed, fit and proper. This is
an area where the Act provides insufficient clarity. On remuneration of trustees,
widely-varying practices exist on boards of trustees. This can range from large
amounts for some trustees to small honoraria and some cases only certain trustees
might be paid while others receive no payment at all. Problems however, arise if
this information is not made properly available to scheme members for their
approval at annual general meetings. While schemes reported that members had
easy access to trustees, this survey did not approach members who frequently
report through the media that they do not have access to trustees. Despite the
obvious need for member participation and the creation of a system of gover-
nance demanding this, very few members participate through the annual general
meetings. Participation rate in the schemes surveyed ranged from 5% to 17% in
some closed schemes. In the examples outlined above, conflict of interest is often
a problem. In the survey, it became clear that some respondents had little or no
understanding of the concept. Most trustees and principal officers interviewed,
however, had a reasonable understanding of what would constitute conflict of
22 COUNCIL FOR MEDICAL SCHEMES Annual Report 2004-5
R E G I S T R A R ’ SR E V I E W
2
● Orikogbofo – a beaded crownof the Yoruba of Nigeria.
Constructed like an Engishbarrister’s wig, it would beworn by a potentate or kingwielding authority andintended, it would seem to beassociated with the Britishlegal system.. Yoruba wigs orcrowns frequently drew onBritish colonial images.

interest in the medical scheme setting. This report is still to be elaborated upon
before recommendations can be made and acted on.
Poor behaviour in governance of schemes inevitably has the result of forcing
costs up for medical scheme members while reducing the overall effectiveness of
the scheme. Problems have arisen in schemes that might be characterised, in
extreme cases, as corruption. In other cases, questionable judgement of trustees in
some of their actions has had to be dealt with at Council. In still other cases,
squabbles between trustee members of boards have rendered schemes literally
ungovernable, and have meant that members cannot be adequately serviced.
Some boards are constituted in such a way that the member is unable to have the
appropriate say in the scheme’s governance as set out in the Medical Schemes Act.
Council is able to take a certain amount of action when failures of governance
occur in schemes.
PROSANO
For much of the year under review, Council has been in talks with Prosano’s
trustees on the manner in which the Board of Trustees has been constituted.
Council believes the constitution of the scheme’s governance structures is incon-
sistent with the requirements of Section 57 of the Medical Schemes Act which pro-
vides for members to be able to elect a board of trustees. Prosano members are
able only to vote for regional structures but not for the main Board of Trustees.
These regional representatives then vote for the national board from their own
ranks. Two directives were issued by the Registrar to Prosano instructing the
scheme to change its rules so as to comply with the Act, and also to cease pay-
ments of honorariums and fees to people who are not members of the Board of
Trustees. Both directives were appealed by the scheme to Council, which eventu-
ally, in December, dismissed the appeal. The issue, however, has not been settled
and is now before the Appeal Board. It the meanwhile, disputes between various
scheme trustees continue as do differences between the board of trustees and the
Office of the Registrar.
HOSMED
Trustees of the scheme were “removed” from their position as trustees by members
at the scheme’s annual general meeting. Interim trustees were appointed to take
over the management of the scheme. Part of this dispute was manifest in legal
action before the High Court intended to resolve a dispute over which adminis-
tration company would administer the scheme.
The “interim trustees” then asked to meet with the Registrar, ostensibly to
“present their credentials” as lawful trustees of the scheme. Acting in accordance
with advice from senior counsel, the Registrar declined the meeting on the basis
that the application before the High Court would resolve the dispute regarding the
legitimacy of the two boards, and that the Registrar only had those powers fore-
shadowed in the Act and did not have the power to mediate the dispute between
R E G I S T R A R ’ SR E V I E W
2
COUNCIL FOR MEDICAL SCHEMES Annual Report 2004-5 23

the rival trustees.
The Registrar took the view that the lawful trustees of the scheme would be
decided by the High court, and that once that has been done the Registrar would
be in a position to act in terms of the Medical Schemes Act. Predictably perhaps,
the lawyers of the so-called “interim trustees” chose to view this response as evi-
dence of “bias” and “dereliction of duty” by the Registrar, for which they threat-
ened to take the issue to higher levels of decision-making to act on their behalf.
The Registrar joined the court action as a “friend of the court” to help the court
understand the issues involved. The judge found that the removal of the trustees
by the AGM was illegal and invalid, and that the appointment of the so-called
interim trustees was illegal and had no legal force. The judge further ordered that
all costs borne by the Registrar’s office in submitting affidavits “as a friend of the
court” should be repaid by the scheme.
COMMED
A similar disagreement occurred in Commed medical scheme between members
of the Board of Trustees following a vote of no confidence at a Special General
Meeting. A court order was eventually handed down, with three members from
each “faction” taking places on the Board of Trustees and a seventh trustee being
appointed by the Registrar. Despite this, the trustees were unable or unwilling to
come to some arrangement to keep the scheme running and decided to take their
issue to the High Court to seek a resolution to the impasse largely created by the
non-appearance of one faction at meetings causing the meetings to be without a
quorum. The High Court ordered all the trustees to attend the meetings, failing
which any meeting held by those who attended would be deemed to be quorate.
In the meanwhile, the Registrar has ordered a forensic audit of the scheme to look
into possible irregular payments.
PROTECTOR HEALTH
Protector Health medical scheme approached the Registrar to seek advice on the
possibility of declaring a breach of contract by its former administrator of the
same name. The scheme was advised that the Registrar’s office, having looked at
the situation, did not believe that there was a material breach of contract. The
trustees were also warned that they might, in all likelihood, expose the scheme to
a damages claim should they proceed to terminate the contract on the basis of the
alleged breaches. The scheme chose to ignore this advice, terminated the contract
and appointed another administrator. The scheme has subsequently lost an arbi-
tration case and has been told by the arbitrator that the termination was illegal
and that the old administrator would be entitled to damages for breach of the
contract. At the same time, we were concerned about the financial position of the
scheme and had difficulties relying on the accounts placed before us. An inspec-
tion was ordered into the scheme in order to understand better its financial posi-
tion. A plan to sort out the scheme’s position has followed.
24 COUNCIL FOR MEDICAL SCHEMES Annual Report 2004-5
R E G I S T R A R ’ SR E V I E W
2

RESOLUTION HEALTH
The trustees of this scheme purported to outsource the day-to-day
running of the scheme to a ‘management company’, whose directors
consisted of some of the trustees. The Board claimed that this
was not a conflict of interest but, rather, another model of gov-
ernance. This was not our view and we held a number of meet-
ings with the trustees to persuade them to change. Allied to
this new model was a substantial sum of money flowing to the
management company as management fees. The trustees have
now agreed to wind down this ‘management company’ to
ensure that the scheme is run by the Board of Trustees. We con-
tinue to keep a close watch on this matter.
SELFMED
We have questioned several issues concerning governance at
Selfmed, including the manner in which the scheme’s chairperson
ostensibly appointed himself the principal officer and CEO. Also
under scrutiny was the approximately R1 million level of remuneration awarded
to this part-time post and other dubious appointments of family members to the
scheme’s executive management. This matter has not yet been resolved.
MEDSHIELD
In the previous year, we reported that MAPP, a company supplying broking serv-
ices to the Medshield medical scheme, had challenged the Registrar’s capacity to
carry out an inspection of its premises in terms of the Medical Schemes Act and
the Inspection of Financial Institutions Act, alleging that sections of both Acts were
unconstitutional. The dispute had arisen from allegations of improper use of
members’ contributions. An interdict granted against the Registrar was due to
come to a full hearing in the period under review. Late last year, however, Mapp
decided to withdraw the legal challenges. It decided, too, to abandon the interdict
it had received against the office and agreed to pay R200 000 towards the
Registrar’s legal costs in this matter. Many of the issues that had concerned the
office have also been dealt with, and approximately R20 million has been paid
back into the scheme.
POLPRISMED
Action was taken to beef up governance at POLPRISMED by appointing a compli-
ance officer to assist with the governance of the scheme. A useful turnaround has
since occurred and the scheme ended the year in the black. The office has nonethe-
less pushed hard for the trustees to take some sensible long-term decisions on the
future of the scheme.
R E G I S T R A R ’ SR E V I E W
2
COUNCIL FOR MEDICAL SCHEMES Annual Report 2004-5 25
● Hakata (Divining dice). Theseform part of the set of itemskept by a ritual specialist andare used for divinationpurposes.Shona, Zimbabwe
Wood, bone
Standard Bank FoundationCollection of African Art - Housed at the University of theWitwatersrand Art Galleries

Continuing the enforcement of the demarcation line
The enforcements actions of the Council have included the cancellation of a
number of reinsurance contracts that were inconsistent with the Act.
Our focus on the demarcation between those products which do the business
of a medical scheme and which, therefore, have to register with the Council for
Medical Schemes and to comply with the Act, and those products which are insur-
ance products has fallen on the short-term insurance products. We are working
with the Financial Services Board to take the issue of compliance up with the
Short Term Insurance Association. At the same time, we are also preparing pros-
ecutions of some of these products.
Broker conduct – and misconduct
The absence of a code of conduct governing the behaviour of intermediaries sell-
ing medical schemes has provided for delays in disciplining brokers where com-
plaints against them have been laid and substantiated. However, during the year
two events have ensured that this can now proceed apace. The appointment in
terms of the Financial Advisors and Intermediary Services Act of an Ombud with
the power to resolve many of these problems and impose penalties on offenders
has taken place. With the Ombud’s appointment, a code of conduct is again in
use. We are in the process of organising a way of working with the Ombud to
ensure maximum effectiveness in sorting out problems the public faces when
dealing with complex products and potential mis-selling of them.
Inspections
Six inspections were undertaken during the year to assess the level of
compliance with the provisions of the law governing the payment of
commission to intermediaries. A trend appears to have emerged in
which a separate company or channel is set up as a “distribution channel”
which is paid separately from the intermediary service itself. This is an area
which deserves greater clarity to ensure that members of schemes are not
being made to pay for services which should, ordinarily, be provided by brokers
and paid for in the normal course of broker payments. In some cases it appears as
if the mechanism has been set up purely to enable larger payments to brokers and,
so, to avoid the provisions of the regulations in this regard.
Undesirable business practices
The undesirable business practice declaration in respect of the sale of the admin-
istration capacity of a scheme without fair valuation, a proper and transparent
process and to officers and employees of the scheme was finalised and gazetted.
This was generally very well received. In this regard, discussions with Munimed
with regard to the inappropriate alienation of its administration capacity were sat-
isfactorily completed. The medical scheme, the trust that was set up to hold the
26 COUNCIL FOR MEDICAL SCHEMES Annual Report 2004-5
R E G I S T R A R ’ SR E V I E W
2
● Goldweights Geometric andfigurative brass weights wereused in West Africa to weighgold dust and nuggets in theproduction and use of gold aspart of the gold tradingeconomy Ashante, Ghana
Goldweights
Brass
Standard Bank FoundationCollection of African Art - Housed at the University of theWitwatersrand Art Galleries

administrator “on behalf of the members” and the office of the Registrar agreed
that the administrator should be sold and the proceeds repatriated to the scheme.
A potential purchaser was being sought for the purpose.
The going has been less smooth between Medihelp and the Office of the
Registrar. Medihelp has been informed that we do not approve of its proposed sale
of its administration capacity to a consortium including the CEO of the scheme
and other officers of the scheme. The parties have been advised that such a sale
would contravene the undesirable business practice declaration. Medihelp subse-
quently appealed against the Registrar’s decision to the Council.
Trustee training
Trustee training remains an important component of Council’s compliance strat-
egy. Trustees rely heavily on the provision of training by the Council. A good deal
of time and effort was expended on training on governance, financial manage-
ment and clinical governance. During the course of the year, trustee training was
provided in several centres around the country each month. The training pro-
gramme has been developed, with the suggestions of participants, so that training
appropriate for those new to the medical schemes environment can be provided
at some sessions, and those with a more sophisticated understanding of the terri-
tory can develop their knowledge and understanding further. We have also includ-
ed in the training specific areas that trustee may find interesting and that can be
usefully delivered by experts in the field outside of the Council. This included the
help of the department of health’s pharmaceutical policy people when the medi-
cines pricing began to influence the workings of schemes and benefits design.
Our work with scheme beneficiaries and the public
Consumer education
The flipside of training trustees on suitable governance practices is the need to have
an informed and involved member body that can make its trustees accountable.
Our training has extended to trade union groups around the country whose
members participate in medical schemes. In addition, groups of consumers have
asked from time to time for the assistance of Council on specific areas in which
they need training and this, too, is given. A new area that has been developed has
been in the growing need for the human relations departments of various govern-
ment and local authority departments to acquaint themselves with the workings
of schemes, the Council and the law as it pertains to medical schemes, so that they
can better assist their staff members.
Flowing from this has been the development and co-operation within the
Regulators’ Forum of the consumer-training divisions of various regulators and
other statutory groups such as the provincial consumer departments dealing with
R E G I S T R A R ’ SR E V I E W
2
COUNCIL FOR MEDICAL SCHEMES Annual Report 2004-5 27

the Medical Schemes Act.
These aspects of our training schedule have been important and useful devel-
opments that hold out the promise that the reach of the Council can be extended
to assist members well beyond our current staffing constraints.
Resolving complaints raised by members against their schemes
A major function of the office of the Registrar is the resolution of complaints that
schemes have not resolved between themselves and their members or doctors.
Our complaints section received 2 456 complaints for the financial year 2004/5
of which 1 848 (76,16%) were found to have been valid.
Table 1 shows the classification of complaints received for the financial year
2004/5.
28 COUNCIL FOR MEDICAL SCHEMES Annual Report 2004-5
R E G I S T R A R ’ SR E V I E W
2
Type of complaint Number % of total 2003/04comparatives
UNPAID ACCOUNTS 660 35.71% 795
EXCLUSION OF BENEFITS 325 17.58% 236
NON PAYMENT OF REFUND 199 10.76% 199
MISUNDERSTANDING WITH SCHEME 131 7.08% 157
UNAUTHORIZED DEDUCTIONS 110 5.95% 104
TERMINATION OF MEMBERSHIP 101 5.46% 76
EXORBITANT PREMIUMS 63 3.40% 42
LOSS DUE TO BUREAUCRATIC INEFFICIENCIES 44 2.38% 73
REVERSAL OF PAYMENT 40 2.16% 33
REFUSAL BY SCHEME TO GIVE AUTHORIZATION 32 1.73% 43
PROBLEMS WITH GOVERNANCE STRUCTURE 20 1.08% 66
MEMBER FRAUDULENTLY ASSIGNED 19 1.028% 7
SUSPENSION OF MEMBERSHIP 17 0.91% 18
WITHHOLDING OF BENEFIT INFORMATION 15 0.81% 15
UNREASONABLE WAITING PERIODS 13 0.70% 8
LATE JOINER PENALTY 12 0.64% 12
CONCERN REGARDING MANAGEMENT OF SCHEME 12 0.64% 33
EXCLUSION OF PRE-EXISTING CONDITION 6 0.32% 4
PREMIUM INCREASE WITHOUT PROPER NOTICE 6 0.32% 6
REJECTION OF APPLICATION 6 0.32% 8
UNETHICAL MARKETING PRACTICES 6 0.32% 9
REFUSAL TO PROVIDE MEMBERSHIP CERTIFICATE 6 0.32% 2
RESTRICTION OF CHANGE OF OPTION 3 0.16% 2
RESTRICTION ON CHOICE OF PROVIDER 2 0.10% 2
TOTAL 1 848 100% 1 957
Table 1: Complaints received during 2004/05

We have resolved 1 682 of the 1 848 complaints found to have been valid. This
is 91% of the total number of valid complaints that have been received. Many of
the complaints that were not resolved related to lack of proper details and infor-
mation provided by complainants. We continue to deal with these in order to
ensure that they are finalised.
“Unpaid accounts” was the largest component, as it always is, of complaints,
comprising more than 36% of the total. The causes of the disputes in this area are
not simply the scheme as Goliath, pitted against the individual and powerless mem-
ber. Much of it appears to be due to a lack of understanding of complex products
and rules and the systems that have developed in individual schemes resulting, at
times, in a scheme refusing to pay an account in terms of its rules.
Some of these problems might relate to inappropriate marketing material – a
problem we hope to tackle in the coming year.
A few schemes have, it seems deliberately, chosen to ignore the legal requirement
for the provision of alternative medication to that in formularies or algorithms when
clinically necessary. But in some cases it appears, as well, that providers have not
acquainted themselves adequately with the provisions in the regulations so that they
may more properly assist their patients. This, too, has given rise to complaints.
Adjudication of appeals
The Council has a board sub-committee whose function is to hear appeals by
those aggrieved either by a decision made by their scheme’s disputes committee or
by the Registrar. Twenty appeals were heard during the year under review,.
An important case before the appeals sub-committee concerned the refusal by
Prosano to implement the Registrar’s directive on necessary amendments to the
rules of the scheme setting out its governance structure. Section 57(2) of the Act
requires that at least half of the members of a scheme’s board of trustees shall be
elected from amongst the members of the scheme. Prosano had contended that
the scheme’s rule in this regard were not inconsistent with this section.
In its decision, the appeals subcommittee found that the rules were, indeed, at
odds with the Act insofar as a majority of persons can feasibly be trustees in terms
of these rules without ever having been subject to an election by members of the
scheme. A further appeal has been heard by the Appeal Board which has upheld
the Registrar’s directive in its entirety.
During the course of last year, the Registrar declared certain practices to be undesirable
business practices. This effectively outlawed the practice of medical schemes which were self-
administered, hiving off their administration sections into a separate company, in which
employees/trustees of the scheme might have a financial interest and then selling the service
back to the scheme without a process of evaluating whether or not the disposal of the admin-
istration was done at fair value.
This declaration occurred at a point at which Medihelp Medical Scheme was
seeking to separate its administration from the rest of the scheme and to form an
administration company consisting of existing employees of the scheme. On 23
June 2004, we advised Medihelp that the proposed transfer of its administration
R E G I S T R A R ’ SR E V I E W
2
COUNCIL FOR MEDICAL SCHEMES Annual Report 2004-5 29

assets to a company called Strata would constitute an offence in that it would
result in a harmful business practice declaration, in that employees of Medihelp
would have a direct or indirect financial interest in Strata.
The issue came before the appeals sub-committee of the Council where
Medihelp argued that Strata would be formed and assets and liabilities of the
scheme would be transferred to the new company. Staff would then be transferred
to the new company, and only then would the scheme enter into an administra-
tion contract with the new company. On this basis, Medihelp argued that at the
time the administration contract was entered into, the persons who had an inter-
est in the new administration company would no longer be employees of the
scheme, and that the transaction would not be inconsistent with the undesirable
business practice declaration. In its decision, the appeals sub-committee rejected
this argument and upheld the Registrar’s decision that the proposed transaction
would constitute an undesirable business practice as envisaged in the declaration.
It was clearly demonstrated at the hearing that the transfer of employees could
not take place until an administration agreement had been entered into. Until
such time as the administration agreement was finalised, the employees would be
employees of Medihelp. This would ensure that they fell foul of the Registrar’s dec-
laration.
Another case before the appeals subcommittee concerned the refusal by
Discovery Health Medical Scheme to meet the costs of orthodontic treatment, the
removal of wisdom teeth and maxillo-facial surgery. The appellant, KK had joined
Discovery in the beginning of February 2003. He claimed that, during 2003, he
was covered for hospitalisation for the removal of wisdom teeth and for maxillo-
facial surgery, but that in 2004 he was informed that he was not covered for such
hospitalisation. He claimed that cover for such procedures was reinstated for
2005. In his documentation when he signed up there was an exclusion for a year
for maxillo-facial procedures among other conditions. This clause ensured that
Discovery would not have to pay for the procedure. Dismissing the appeal,
Council noted that, “In any event, even had his membership not been subject to
these exclusions, Discovery Health Medical Scheme would not have been obliged
to compensate the appellant. Upon joining Discovery Health, the appellant had
elected to join the coastal core plan. Provision is made in this plan for a medical
savings account and the member is required to choose whether or not he or she
wishes to have such an account. The appellant chose not to have a medical sav-
ings account.”
Mr YY at Munimed had a similar experience. He joined Munimed on 1 July
2003. At that point the benefit schedule applicable to his membership provided
for unlimited orthodontic treatment. But in January 2004 the scheme restructured
its benefits and imposed an annual limit of R2 000 on specialised dentistry
including orthodontics.
YY’s employer had directed that he could not move schemes till the following
year unless he changed his job. But the member had ongoing expenses for his
son’s orthodontics and found himself saddled with the expenses and an inade-
quate benefit.
30 COUNCIL FOR MEDICAL SCHEMES Annual Report 2004-5
R E G I S T R A R ’ SR E V I E W
2

He was not granted relief by the Appeal Board
as it found the scheme was entitled to change its
benefits. His problem of not being able to get out
of the scheme until the following year was
one between his employer and himself and
could not be addressed by the Council and
its appeal processes.
ZZ’s case however at the Appeal Board
proved more successful for the appellant.
ZZ had been severely assaulted in an attack
and, after a stay in hospital, knew that fur-
ther surgery and treatment would be
required. This would involve the recon-
struction of the jaw and the replacement of
missing teeth with prostheses.
The Classic Priority Plan of Discovery appeared
to hold out the prospect of this treatment being cov-
ered and this was contained, according to the appellant, in
a section of the option’s launch document dealing with major
surgery – with a specific reference to trauma-related surgery.
Discovery’s view was that there were several phases to the type of reconstruc-
tion surgery needed, and believed that only the first phase could be classified as
trauma-related. The rest would fall under specialised dentistry.
This meant that Discovery was not prepared to go beyond the bone augmen-
tation required in the first surgery,.
The complainant took issue with the decision and it was referred to the
scheme’s ex-gratia committee, which decided to approve most of the rest of sur-
gery – but not the cost of the dental implants and abutments. No reasons for this
were given.
The member then took the issue to the scheme’s disputes committee which
decided that the information in the document was misleading and that a reasonable
person would have believed all the surgery and follow-up treatment to be included.
The disputes committee also described Discovery’s documents as containing a grey
area and suggested that Discovery review its policy definition and exclusions to
make this clearer. It confirmed the ex-gratia decision – but this was still insufficient
for ZZ who appealed to the Council in terms of Section 48 of the Act.
The Council agreed that the scheme’s interpretation of the rules was correct –
that it should only apply to the trauma-related surgery – but since both the ex-gra-
tia committee and the disputes committee had agreed that an extra amount should
be paid – the question that faced the Council, was “how much”. The Council held
that no logical basis existed for the distinction made by the ex-gratia committee on
where it decided to cut off the funding, and ordered that the scheme should pay the
costs of the further surgery because of the misunderstanding the literature had cre-
ated and that the costs of the implants and abutments be included.
During this period, the High Court was asked to rule on a dispute between a
R E G I S T R A R ’ SR E V I E W
2
COUNCIL FOR MEDICAL SCHEMES Annual Report 2004-5 31
● Izindondo – a necklace of 12brass beads – symbolisedwealth and Zulu royal controlover many aspects of life suchas lobolo, agricultural labourof women and conferred socialstatus.

medical scheme and the Council’s Appeal Board. The dispute arose from the
desire of the Appeal Board to hear evidence from a witness in a dispute between
Profmed medical scheme and the estate of a deceased person whose membership
had previously been suspended by the scheme. Much of the legal argument
revolved around the differences between an appeal before the High Court and an
appeal to the Appeal Board in terms of the Medical Schemes Act. In the end, the
court upheld the Appeal Board’s right to hear evidence, unlike the procedure
when a court ruling is appealed. The scheme was ordered to pay costs as well.
Communication and other stakeholder relationships
Much of the media work was in response to public concern early in the year about
increases to scheme premiums. Further into the year a robust media debate was
conducted around the problems in medicine pricing particularly in respect of the
medical schemes environment.
We continue to respond to the media on a number of issues and to appear fre-
quently on the electronic media, including on issues such as the impact of the new
medicines pricing structure on medical schemes and their members.
One edition of CMS News was published during the year. Our internal
newsletter, Masihambisane, has continued to appear regularly and has served as a
useful tool for communicating with staff on internal issues relevant to us.
The people of the council and management of other resources
The work of CMS Active – realigning people processes with ourorganisational strategy
Performance management
The staff coalition, called CMS Active has continued our work on realigning our
business with a strategy for management of our human resources. A new perform-
ance-management system has been agreed and will come into effect during the
2005/06 financial year. The coalition has also begun discussions on a remunera-
tion strategy with the aim of proposing policy in this regard during the new year.
Improving skills and developing career paths
We have engaged in a number of training initiatives during this period. All sixty
members of staff were taken through a course on improving customer service. This
culminated in a charter on customer service adopted by Council. The key challenge
now is to ensure meticulous implementation of the charter. Other training initia-
tives have included performance evaluation, attendance at a number of conferences
and seminars and development of technical skills such as conducting skills audits,
effective business writing, advanced computing and managing public relations.
32 COUNCIL FOR MEDICAL SCHEMES Annual Report 2004-5
R E G I S T R A R ’ SR E V I E W
2

Employment equity
Our employment equity profile is shown in figures 7 and 8. The Council has set
up an Equity Forum in terms of the law and developed a plan to ensure that staff
development takes place in terms of the Equity Act and to the benefit of the
Council and its work.
We have conducted qualitative analyses of policies, procedures and practices
through internal surveys and staff focus group discussions, as well as quantitative
analyses of workforce profiles to identify specific areas that require our attention.
We have debated employment equity barriers caused either by the lack of a policy
or by a policy that may permit unfair discrimination.
Financial management and information technology
The management of Council’s financial resources continues to be an important
part of our work. We have ensured that we have complied fully with the require-
ments of the Public Finance Management Act during the year under review. Our
internal auditors, GOBODO, have continued to provide good service, and internal
audits were conducted in four divisions, including financial supervision, research
and monitoring, compliance and the legal units. Our risk management team has
continued to function, and has focused on the implementation of a fraud preven-
tion plan at Council. The Council’s audit committee met four times during the
year. Two new external members also joined the audit committee during this time.
Table 2 below summarises the Council’s income and expenditure for 2004/05.
Staff costs have, predictably perhaps, been our main item of expenditure, account-
ing for 60% of total spend.
R E G I S T R A R ’ SR E V I E W
2
COUNCIL FOR MEDICAL SCHEMES Annual Report 2004-5 33
0 5 10 15 20 25 30 35
African
SeniorWhite
MxColoured
Asian
African
MiddleWhite
MxColoured
Asian
African
NonWhite
ManagerialColoured
Asian
Managerial level by racial groupingFigure 7: Managerial level by racial grouping
0 5 10 15 20 25
Male
African
Female
Male
White
Female
Male
Asian
Female
Male
Coloured
Female
Racial representation by genderFigure 8: Racial and gender representation
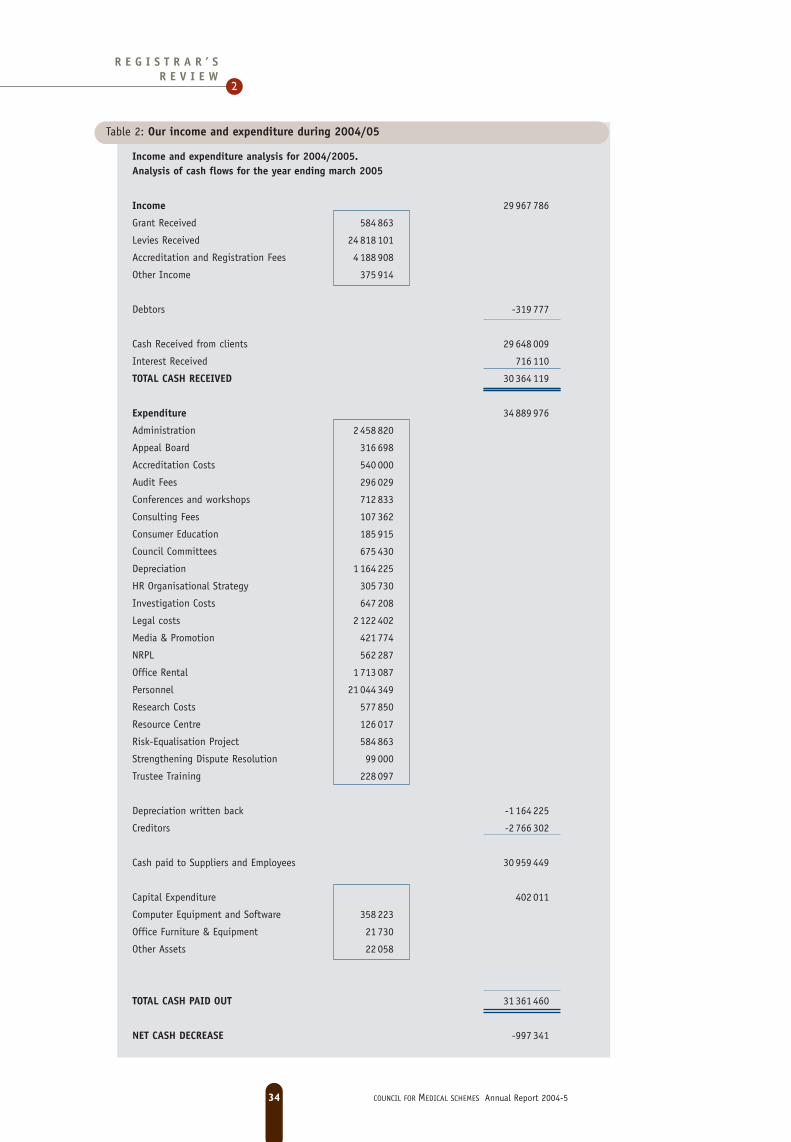
34 COUNCIL FOR MEDICAL SCHEMES Annual Report 2004-5
R E G I S T R A R ’ SR E V I E W
2
Table 2: Our income and expenditure during 2004/05
Income and expenditure analysis for 2004/2005.Analysis of cash flows for the year ending march 2005
Income 29 967 786
Grant Received 584 863
Levies Received 24 818 101
Accreditation and Registration Fees 4 188 908
Other Income 375 914
Debtors -319 777
Cash Received from clients 29 648 009
Interest Received 716 110
TOTAL CASH RECEIVED 30 364 119
Expenditure 34 889 976
Administration 2 458 820
Appeal Board 316 698
Accreditation Costs 540 000
Audit Fees 296 029
Conferences and workshops 712 833
Consulting Fees 107 362
Consumer Education 185 915
Council Committees 675 430
Depreciation 1 164 225
HR Organisational Strategy 305 730
Investigation Costs 647 208
Legal costs 2 122 402
Media & Promotion 421 774
NRPL 562 287
Office Rental 1 713 087
Personnel 21 044 349
Research Costs 577 850
Resource Centre 126 017
Risk-Equalisation Project 584 863
Strengthening Dispute Resolution 99 000
Trustee Training 228 097
Depreciation written back -1 164 225
Creditors -2 766 302
Cash paid to Suppliers and Employees 30 959 449
Capital Expenditure 402 011
Computer Equipment and Software 358 223
Office Furniture & Equipment 21 730
Other Assets 22 058
TOTAL CASH PAID OUT 31 361 460
NET CASH DECREASE -997 341
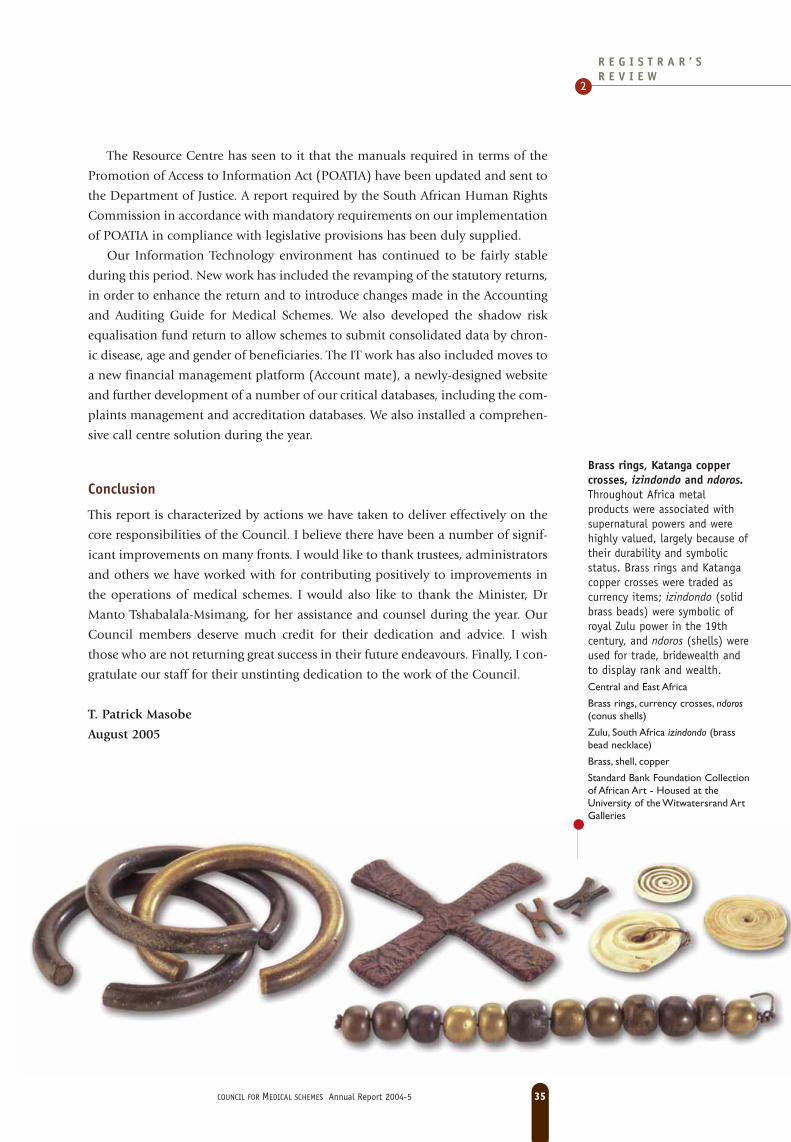
The Resource Centre has seen to it that the manuals required in terms of the
Promotion of Access to Information Act (POATIA) have been updated and sent to
the Department of Justice. A report required by the South African Human Rights
Commission in accordance with mandatory requirements on our implementation
of POATIA in compliance with legislative provisions has been duly supplied.
Our Information Technology environment has continued to be fairly stable
during this period. New work has included the revamping of the statutory returns,
in order to enhance the return and to introduce changes made in the Accounting
and Auditing Guide for Medical Schemes. We also developed the shadow risk
equalisation fund return to allow schemes to submit consolidated data by chron-
ic disease, age and gender of beneficiaries. The IT work has also included moves to
a new financial management platform (Account mate), a newly-designed website
and further development of a number of our critical databases, including the com-
plaints management and accreditation databases. We also installed a comprehen-
sive call centre solution during the year.
Conclusion
This report is characterized by actions we have taken to deliver effectively on the
core responsibilities of the Council. I believe there have been a number of signif-
icant improvements on many fronts. I would like to thank trustees, administrators
and others we have worked with for contributing positively to improvements in
the operations of medical schemes. I would also like to thank the Minister, Dr
Manto Tshabalala-Msimang, for her assistance and counsel during the year. Our
Council members deserve much credit for their dedication and advice. I wish
those who are not returning great success in their future endeavours. Finally, I con-
gratulate our staff for their unstinting dedication to the work of the Council.
T. Patrick Masobe
August 2005
R E G I S T R A R ’ SR E V I E W
2
COUNCIL FOR MEDICAL SCHEMES Annual Report 2004-5 35
Brass rings, Katanga coppercrosses, izindondo and ndoros.Throughout Africa metalproducts were associated withsupernatural powers and werehighly valued, largely because oftheir durability and symbolicstatus. Brass rings and Katangacopper crosses were traded ascurrency items; izindondo (solidbrass beads) were symbolic ofroyal Zulu power in the 19thcentury, and ndoros (shells) wereused for trade, bridewealth andto display rank and wealth.Central and East Africa
Brass rings, currency crosses, ndoros(conus shells)
Zulu, South Africa izindondo (brassbead necklace)
Brass, shell, copper
Standard Bank Foundation Collectionof African Art - Housed at theUniversity of the Witwatersrand ArtGalleries
●

36 COUNCIL FOR MEDICAL SCHEMES Annual Report 2004-5
R E G I S T R A R ’ SR E V I E W
2

COUNCIL FOR MEDICAL SCHEMES Annual Report 2004-5 37
R E P O R T O F T H EA U D I T O R - G E N E R A L
3
REPORT OF THE AUDITOR-GENERAL TO PARLIAMENT ONTHE FINANCIAL STATEMENTS OF THE COUNCIL FORMEDICAL SCHEMES FOR THE YEAR ENDED 31 MARCH 2005
1. AUDIT ASSIGNMENT
The financial statements as set out on pages 39 to 49, for the period ended 31 March 2005, have been audited in
terms of section 188 of the Constitution of the Republic of South Africa, 1996 (Act No. 108 of 1996), read with sec-
tion 4 and 20 of the Public Audit Act, 2004 (Act No. 25 of 2004) and section 13(4) of the Medical Schemes Act, 1998
(Act No. 131 of 1998). These financial statements, the maintenance of effective control measures and compliance
with relevant laws and regulations are the responsibility of the Registrar. My responsibility is to express an opinion
on these financial statements, based on the audit.
2. NATURE AND SCOPE
The audit was conducted in accordance with Statements of South African Auditing Standards. Those standards
require that I plan and perform the audit to obtain reasonable assurance that the financial statements are free of
material misstatement.
An audit includes:
• examining, on a test basis, evidence supporting the amounts and disclosures in the financial statement,
• assessing the accounting principles used and significant estimates made by management, and
• evaluating the overall financial statement presentation.
Furthermore, an audit includes an examination, on a test basis, of evidence supporting compliance in all material
respects with the relevant laws and regulations which came to my attention and are applicable to financial matters.
I believe that the audit provides a reasonable basis for my opinion
3. AUDIT OPINION
In my opinion, the financial statements fairly present, in all material respects, the financial position of the Council

for Medical Schemes at 31 March 2005 and the results of its operations and cash
flows for the year ended, in accordance with the Statements of Generally Accepted
Accounting Practice and in the manner required by the Public Finance
Management Act, 1999 (Act No. 1 of 1999).
4. APPRECIATION
The assistance rendered by the staff of the Council for Medical Schemes during the
audit is sincerely appreciated.
A H Mullerfor Auditor-General
Pretoria31 July 2005
38 COUNCIL FOR MEDICAL SCHEMES Annual Report 2004-5
R E P O R T O F T H EA U D I T O R - G E N E R A L
3

COUNCIL FOR MEDICAL SCHEMES Annual Report 2004-5 39
R E P O R T O F T H EA U D I T O R - G E N E R A L
3
Balance sheetOF THE COUNCIL FOR MEDICAL SCHEMESAS AT 31 MARCH 2005
31/03/05 31/03/04Note R R
ASSETSNon-current assets 1 992 939 2 755 152
Property, plant & equipment 3 1 992 939 2 755 152
Current assets 9 841 291 10 518 855
Trade debtors and other receivables 5 725 120 405 343
Cash and cash equivalents 4 9 116 171 10 113 512
Total assets 11 834 230 13 274 007
FUNDS AND LIABILITIES
Administration funds 4 702 111 8 908 190
Accumulated funds 4 702 111 8 908 190
Current liabilities 7 132 119 4 365 817
Trade creditors and other payables 6 5 868 189 2 770 440
Provisions 6 1 263 930 1 595 377
Total funds and liabilities 11 834 230 13 274 007
Mr T Patrick Masobe
Registrar of Medical Schemes
Date: 31/5/2004

40 COUNCIL FOR MEDICAL SCHEMES Annual Report 2004-5
R E P O R T O F T H EA U D I T O R - G E N E R A L
3
INCOME STATEMENTOF COUNCIL FOR MEDICAL SCHEMESFOR THE YEAR ENDED 31 MARCH 2005
31/03/05 31/03/04Note R R
Revenue 7 29 967 786 29 644 910
Expenditure 34 889 976 34 299 922
Administration 2 458 820 3 222 115
Appeal Board expenses 316 698 391 354
Accreditation costs 540 000 1 200 000
Audit fees: 10 296 029 469 997
Conference, workshops & seminars 712 833 635 215
Consulting fees 107 362 170 495
Consumer education 185 915 193 912
Council Committees 675 430 651 694
Depreciation 1 164 225 1 263 695
HR/Organisational Strategy 305 730 -
Investigation costs 647 208 620 135
Irregular expenditure - 506 195
Legal fees 2 122 402 1 713 462
Media & promotion 421 774 512 458
NRPL 562 287 -
Office rental 1 713 087 1 554 643
Personnel expenditure 21 044 349 18 895 662
Research costs 577 850 734 072
Resource centre 126 017 174 328
Risk Equalisation Project 9 584 863 1 125 386
Strengthening Dispute Resolution 99 000 -
Trustee training 228 097 265 104
Operating deficit for the year (4 922 190) (4 655 012)
Interest received 716 110 1 477 582
Net deficit (4 206 080) (3 177 430)

Statement of changes in equityFOR THE YEAR ENDED 31 MARCH 2005
31/03/05 31/03/04R R
Balance at 31/3/2004 8 908 191 12 085 620
Net deficit for the year (4 206 080) (3 177 430)
Balance at 31/03/ 2005 4 702 111 8 908 190
Cash flow statementOF COUNCIL FOR MEDICAL SCHEMES FOR THE YEAR ENDED 31 MARCH 2005
31/03/05 31/03/04Note R R
Cash flow from operating activities
Cash receipts from debtors 29 033 988 29 966 077
Cash receipts from Department of Health 584 863 1 125 386
Cash paid to suppliers and employees (30 930 290) (30 336 254)
Cash utilised in operations 8 (1 311 439) 755 209
Interest received 716 110 1 477 582
Net cash flows from operating activities (595 329) 2 232 791
Cash flows from investing activities
Purchase of fixed assets (402 012) (682 008)
Net increase(decrease) in cash and cash equivalents (997 341) 1 550 782
Cash and cash equivalents at the beginning of the year 10 113 512 8 562 730
Cash and cash equivalents at the end of the year 4 9 116 171 10 113 512
COUNCIL FOR MEDICAL SCHEMES Annual Report 2004-5 41
R E P O R T O F T H EA U D I T O R - G E N E R A L
3

Notes to the financial statementsFOR THE YEAR ENDED 31 MARCH 2005
1. Legislation
1.1. The Council was established under the Medical Schemes Act, 1998 (Act No. 131 of 1998)
1.2. The Council is a listed entity under schedule 3 of the Public Finance Management Act, (Act No 1 of 1999).
1.3. The Council collects levies from schemes in terms of the Levies Act 2000 (Act No.58 of 2000)
2. Accounting Policies
The principal accounting policies adopted in the preparation of these financial statements are as set out below and
are consistent with those of the previous year:
2.1 Basis of preparation
The financial statements are prepared under the historical cost basis and are in accordance with and comply with the
South African Statements of Generally Accepted Accounting Practice.
2.2 Non current assets
All items of property plant and equipment are recognised at cost less accumulated depreciation. Depreciation is cal-
culated on the straight line method to write off each asset over their estimated useful lives as follows:
Computer equipment 25%
Computer software 33%
Office furniture and equipment 10%
Motor vehicle 20%
Other assets 10%
Repairs and maintenance are charged to the income statement during the financial period in which they are incurred.
Expenditure that increases the original value and useful lives of property plant and equipment items are classified as
assets and amortised over their useful lives on a straight line method.
Where the carrying amount of an asset is greater than its estimated recoverable amount, it is written down immedi-
ately to its recoverable amount.
Gains and losses on disposal are determined by comparing proceeds with the carrying amount and are included in
the operating profit during the period in which they accrue.
42 COUNCIL FOR MEDICAL SCHEMES Annual Report 2004-5
R E P O R T O F T H EA U D I T O R - G E N E R A L
3

2.3 Trade debtors and other receivablesAccounts receivables are carried at original invoice less provision made for impairment in value of these receivables.Where
circumstances reveal doubtful recovery of amounts outstanding, a provision for impaired receivables is made and charged to
the income statement.
2.4 Trade creditors and other payablesTrade and other payables are recognised at cost, comprising original debt less principal payments and amortisations.
2.5 ProvisionsProvisions are recognised when there is a present legal or constructive obligation as a result of past events, it is probable that
an outflow of resources will be required to settle the obligation and a reliable estimate of the amount can be made.
2.6 RevenueThe main sources of revenue of the Council are listed below.
2.6.1 LeviesLevies are the amounts paid by medical schemes based on the number of members in a scheme during the financial period.
Levies are recognised on an accrual basis in accordance with the number of members in the medical scheme in the period
they fall due.
2.6.2 Accreditation feesAccreditation fees are fixed tariffs paid by brokers over two years.Accreditation fees are recognised in the financial period in
which services are rendered.
2.6.3 GrantsThe Council receives grants from government for specific projects. Grants are recognised in the financial period at their fair
value where there is reasonable assurance that the grant will be received and the Council will comply with the attached con-
ditions. Grants relating to future costs are deferred and recognised in the income statement over the period necessary to
match them with the costs for which they are intended to compensate.
2.6.4 Registration feesRegistration fees relate to the amounts paid by schemes to register or amend their rules. Registration fees are recognised in
the financial period that they fall due.
2.6.5 InterestInterest income comprises interest received on cash and cash equivalents, and that earned on overdue levies. Interest income
is recognised in the income statement for all interest bearing investments on an accrual basis using the effective yield based on
the actual amount. Interest on overdue levies is calculated at the rate determined by the South African Revenue Services.
COUNCIL FOR MEDICAL SCHEMES Annual Report 2004-5 43
R E P O R T O F T H EA U D I T O R - G E N E R A L
3

2.7 Cash and cash equivalents
Cash and cash equivalents are carried on the balance sheet at cost for the purpose of the cash flow statement. Cash
and cash equivalents comprise cash on hand and deposits held in current and call accounts at the bank.
2.8 Financial instruments
(a) Accounting for financial instruments
Financial instruments carried on the balance sheet include cash and bank balances, investments, receivables and
trade creditors. The particular recognised methods adopted are disclosed in the individual policy statements associ-
ated with each item.
(b) Financial risk management
Financial risk factors:
The Council’s activities expose it to a limited degree of financial risks including interest rates and credit defaults.
Interest rate risk:
The Council’s income and operating cash flows are to a large extent independent of charges in the market interest
rates. The Council invests surplus cash on call accounts and its exposure to interest rate risk is limited by virtue of the
limited term that surplus cash is held on call.
Credit risk:
The Council is exposed to credit risk, which is the risk that a counterpart will be unable to pay accounts in full when
due. There is no significant concentration of credit risk due to a wide spread of debtors that owe amounts to the
Council.
Liquidity risk:
The Council is exposed to liquidity risk by virtue of having trade creditors at year end. Liquidity risk is managed by
maintaining sufficient balances on cash and cash equivalents.
2.9 Research costs
Research costs relate to work performed by the research unit. The objective of the unit is to monitor the impact of
the Medical Schemes Act,1998 (Act No. 131 of 1998), research developments and recommend policy options to
improve regulatory environment. Research expenditure is recognised as an expense in the financial period in which
it was incurred.
44 COUNCIL FOR MEDICAL SCHEMES Annual Report 2004-5
R E P O R T O F T H EA U D I T O R - G E N E R A L
3
Notes to the financial statements continued

3. Property, plant and equipment
Computer Computer Furniture Motor Other TOTAL
Equipment Software & Fitting Vehicle Assets fittings
Period ended 31 March 2004
Opening gross carrying amount 1 142 326 976 509 1 077 193 33 295 107 516 3 336 839
Additions 204 122 388 125 81 761 - 8 000 682 008
Depreciation charge (675 374) (415 468) (140 968) (14 269) (17 616) (1 263 695)
Closing net carrying amount 671 074 949 166 1 017 986 19 026 97 900 2 755 152
At 31 March 2004
Gross carrying amount 1 346 607 1 364 634 1 158 954 33 295 115 357 4 018 847
Accumulated depreciation 675 374 415 468 140 968 14 269 17 616 1 263 695
671 233 949 166 1 017 986 19 026 97 741 2 755 152
Year ended March 2005
Opening gross carrying amount 671 233 949 166 1 017 986 19 026 97 741 2 755 152
Additions 273 764 84 459 21 730 - 22 058 402 011
Depreciation charge (371 571) (615 019) (145 489) (14 268) (17 877) (1 164 224)
Closing net carrying amount 573 426 418 606 894 227 4 758 101 922 1 992 939
At 31 March 2005
Gross carrying amount 944 997 1 033 625 1 039 716 19 026 119 799 3 157 163
Accumulated depreciation 371 571 615 019 145 489 14 268 17 877 1 164 224
Net carrying amount 573 426 418 606 894 227 4 758 101 922 1 992 939
4. Cash and cash equivalents
31/03/05 31/03/04Note R R
Cash and bank 4 066 171 5 113 512
Call account 5 050 000 5 000 000
9 116 171 10 113 512
The effective interest rate on call account deposit was 7.35% (March 05: 7%) and these deposits have an average
maturity of 30 days.
COUNCIL FOR MEDICAL SCHEMES Annual Report 2004-5 45
R E P O R T O F T H EA U D I T O R - G E N E R A L
3

5. Trade debtors and other receivables
31/03/05 31/03/04Note R R
Accounts receivable 173 673 126 705
Provisions for Impaired Receivables (29 158) -
Sundry debtors 580 605 125 758
Prepaid expenses - 152 880
725 120 405 343
6. Trade creditors, other payables and provisions
Accounts payable 1 835 552 1 168 535
Income Received In advance 4 032 637 1 601 905
Grant received in advance 3 762 751
Broker fees received in advance 269 886
Accruals 557 741 -
Provisions
Leave days 438 238 428 901
Accreditation Costs 267 951 1 166 476
7 132 119 4 365 817
7. Revenue
Accreditation fees 3 731 281 4 656 641
Appeal fees 9 091 10 526
Grant 584 863 1 125 386
Interest on levies 1 031 15 515
Levies 24 818 101 23 125 516
Other income 365 792 526 575
Registration fees 457 627 184 751
29 967 786 29 644 910
46 COUNCIL FOR MEDICAL SCHEMES Annual Report 2004-5
R E P O R T O F T H EA U D I T O R - G E N E R A L
3
Notes to the financial statements continued

COUNCIL FOR MEDICAL SCHEMES Annual Report 2004-5 47
R E P O R T O F T H EA U D I T O R - G E N E R A L
3
8. Reconciliation between net surplus and cash applied to activities
31/03/05 31/03/04Note R R
31/03/05 31/03/04
R R
Operating surplus/(deficit) (4 206 080) (3 177 430)
Adjusted for:
Depreciation 1 164 225 1 263 695
Interest received (716 110) (1 477 582)
Operating surplus before working capital (3 757 965) (3 391 317)
Decrease(Increase) in accounts receivable (319 777) 1 446 551
(Decrease)/Increase in accounts payable 3 097 749 1 983 905
(Decrease)/Increase in provisions (331 447) 716 070
(1 311 440) 755 209
9. Risk Equalisation Fund
During the year the National Department of Health (NDoH) granted Council an amount of R2 800,000 in respect
of the Risk Equalisation Fund Project. An amount of R584,863 was utilised during the year. The unutilised balance
at 31 March 2005 has been deferred and included as income received in advance.
Deferred grant income at the beginning of the year 1 547 614 -
Grant received during the year 2 800 000 2 673 000
Utilised in project activities (584 863) (1 125 386)
Utilised to defer depreciation charge relating to assets acquired - -
Deferred grant income at the end of the year 3 762 751 1 547 614
10. Audit fees
External audit 181 029 189 052
Internal audit 115 000 280 945
296 029 469 997
The external audit work is conducted by the Office of the Auditor-General

11. Going concern
The financial position of the Council is such that the Accounting Authority is of the view that its operations will con-
tinue for as long as its mandate remains.
12. Taxation
No provision for taxation is made because the Council is exempt from income tax in terms of section 10(1) (cA). of
the Income Tax Act, 1962 (Act No: 58 of 1962)
13. Related party transactions
Council members appointed by the Minister of Health, control the financial and operating activities of the Council.
Council members appoint the executive management which is responsible for executing Council member decisions.
The emolument paid to Council members and executive management is shown below:
31 March 2005Council members Fees for Basic Bonuses Expense Consulting Total
services salary allowances Fees
GN Padayachee 18 882 _ _ _ _ 18 882
NNA Matyumza 17 782 _ _ _ _ 17 782
R.L Morar 39 045 _ _ _ _ 39 045
N Mgumane 14 870 _ _ _ _ 14 870
JW Jekwa 46 812 _ _ _ _ 46 812
HD Mcleod 27 536 _ _ _ 380 331 407 867
S. Kariem 13 139 _ _ _ _ 13 139
J. Murphy 6 215 _ _ _ _ 6 215
BB Crookes 21 747 _ _ _ _ 21 747
206 027 _ _ _ 380 331 586 358
Prof.Heather Mcleod who is a Council member was appointed to assist the Risk Equalisation Project task team by
the Director-General of the National Department of Health. An amount of R2, 800, 000 was transfered by NDOH
for the project and her consulting fees are paid from this grant.(refer Note 10)
48 COUNCIL FOR MEDICAL SCHEMES Annual Report 2004-5
R E P O R T O F T H EA U D I T O R - G E N E R A L
3
Notes to the financial statements continued

Executive management Fees for Basic Bonuses Expense Consulting Totalservices salary allowances Fees
_
TP. Masobe _ 675 805 143 816 12 000 _ 831 621
FFT Mothobi _ 552 167 109 099 18 000 _ 679 266
CJ Burton-Durham _ 497 411 82 216 18 000 _ 597 627
DG Kolver _ 473 243 78 479 18 000 _ 569 722
PR Sidley _ 446 694 74 100 18 000 _ 538 794
EE Theys _ 497 411 82 216 18 000 _ 597 627
KP. Matshidze _ 451 836 78 480 18 000 _ 548 316
_ 3 594 567 648 406 120 000 _ 4 362 973
31 March 2004
Council members 235 975 _ _ _ 481 679 717 654
Executive management _ 3 424 926 666 491 120 000 _ 4 211 417 4 997 908
235 975 3 424 926 666 491 120 000 481 679 4 929 071
The executive management are eligible for an annual performance-related bonus payment linked to the operational plans and
and strategic objectives of Council.The structure of the individual bonus plan and awards is decided by the Remunerations
Committee
of Council.
14. Contingent liabilities
At 31 March 2005 Council had a contingent liability of R408,584 arising from a legal claim by a former employee
for unfair dismissal.
Based on legal opinion, Council does not expect this liability to crystallise.
15. Operating lease commitments
Council has an operating lease for rental of the office up to 31 May 2010
The rental escalates by 7% compounded every year
Not later than one year 2 703 759 1 554 643
Later than one year and not later than 5 years 14 030 037 326 143
TOTAL 16 733 796 1 880 786
COUNCIL FOR MEDICAL SCHEMES Annual Report 2004-5 49
R E P O R T O F T H EA U D I T O R - G E N E R A L
3

Report of the audit committee
We are pleased to present our report to the Council’s Accounting Authority for the financial year ended 31 March 2005.
Audit committee members and attendance
Please note that the term of audit committee members ended in August 2004. The committee consisted of the fol-
lowing members:
Meetings
Meetings and attendance for the year under review:
Name of Member Role Number of Meetings Attended
Mr. C. Mannya (Chairperson) 2
Mr. S. Patterson Member 2
Mr. O Thenga Member 1
Dr. R. Morar Member 2
Ms. G. Matyumza Member 2
The new audit committee, which commenced its new role from September 2004, consists of the members listed here-
under and meets 4 times per annum as per its approved terms of reference.
The committee held four (4) scheduled meetings and no special meeting was called during the year under review.
During these meetings the committee considered a number of issues including those discussed in the paragraphs below.
Meetings and attendance for the year under review:
Name of Member Role Number of Meetings Attended
Mr. Ronald Moyo (Chairperson) 4
Mr. Alex Hill Member 4
Dr. Reno Morar Member 4
Ms. Gando Matyumza Member 4
Other invitees.
Representatives of the Auditor-General, internal auditors and senior management attend these meetings as and when
requested to do so.
Audit committee responsibilities
Mandate
The mandate of the audit committee is derived from Section 38 (1) (a) of the Public Finance Management Act
(PFMA), and paragraph 3.1 of the Treasury Regulations.
The audit committee reports that it has complied with its responsibilities arising from section 38(1) (a) of the
PFMA and Treasury Regulation 3.1.13.
50 COUNCIL FOR MEDICAL SCHEMES Annual Report 2004-5
R E P O R T O F T H EA U D I T O R - G E N E R A L
3

The audit committee also reports that it has adopted appropriate formal terms of reference as its audit commit-
tee charter, has regulated its affairs in compliance with this charter and has discharged all its responsibilities as con-
tained therein.
The effectiveness of internal control
The performance of an effective internal audit function is central to the proper operation of the audit committee. As
part of the Council’s governance structures, the audit committee has amongst others, an oversight function of ensur-
ing that the Council’s internal control policies, practices and procedures are in place, effective and adequate to safe-
guard the Council’s resources and achieve its mission. Establishing effective internal controls involves an assessment
of the risks the Council faces both from internal and external sources.
The system of internal control is effective, as the various reports of the internal and external auditors have shown.
The fraud and risk prevention plans have been developed by our internal auditors.
Review of legal cases pending at financial year-end
The committee reviewed legal cases against the Council that were pending at the financial year-end so as to assess the
adequate disclosure required in terms of GAAP and Treasury Regulations.
Evaluation of financial statements
The audit committee has reviewed and discussed the annual financial statements to be included in the annual report
with the Auditor General and the Accounting Officer. The committee concurs with the conclusions of the Auditor
General and hereby recommend the financial statements for adoption by the Council in terms of the PFMA.
Our commitment
The audit committee remains committed to working together with the Council and all stakeholders to promote
sound corporate governance and to strengthen internal control procedures in the Council.
Ronald Moyo
Chairperson of the audit committee
Date 22/7/2005
COUNCIL FOR MEDICAL SCHEMES Annual Report 2004-5 51
R E P O R T O F T H EA U D I T O R - G E N E R A L
3

52 COUNCIL FOR MEDICAL SCHEMES Annual Report 2004-5
R E P O R T O F T H EA U D I T O R - G E N E R A L
3

Review of operationsof medical schemes
Coverage by medical schemes
Number of medical schemes
Table 3 shows that there were 133 registered medical schemes operating during
2004. Forty eight (48) were open while 85 were restricted medical schemes. There
were also 12 bargaining council schemes in operation during the same period.
The number of medical scheme declined to 145 from 147 in 2004. The num-
ber of open schemes remained unchanged while that of restricted schemes
declined to 85 from 87. This reduction is attributable to liquidations, amalgama-
tions and mergers between schemes.
COUNCIL FOR MEDICAL SCHEMES Annual Report 2004-5 53
R E V I E W O FO P E R A T I O N S
4
TYPE OF SCHEME*
Size of medical scheme Open Restricted Bargaining Council Consolidated
Small (<6,000 members) 14 (16) 57 (58) 7 (7) 78 (81)
Medium (>6,000 members but <30,000 beneficiaries) 8 (5) 15 (16) 2 (2) 25 (23)
Large (30,000 or more beneficiaries) 26 (27) 13 (13) 3 (3) 42 (43)
Total 48 (48) 85 (87) 12 (12) 145 (147)
Table 3: Distribution of medical scheme by size and type of scheme
* Figures in brackets represent restated number of schemes in 2003
Membership of medical schemes
Table 4 shows that the total number of principal members of medical schemes
increased by 1,1% to 2 833 322 during 2004. Membership of open schemes
increased by 2,2%, while that of restricted schemes declined by 1,5%.
Membership of bargaining council schemes increased by 2,0% to 117 058 mem-
bers.
The number of dependants decreased by 1,0%. As a result the number of ben-

54 COUNCIL FOR MEDICAL SCHEMES Annual Report 2004-5
R E V I E W O FO P E R A T I O N S
4
Table 4: Distribution of beneficiaries in medical schemes
Scheme type 2004 2003 % change
Registered Members 2 716 264 2 688 055 1,05
Beneficiaries 6 662 563 6 671 801 -0,14
Open Members 1 924 343 1 883 728 2,16
Beneficiaries 4 755 303 4 718 797 0,77
Restricted Members 791 921 804 327 -1,54
Beneficiaries 1 907 260 1 953 004 -2,34
Bargaining council Members 117 058 114 760 2,00
Consolidated Members 2 833 322 2 802 815 1,09
Beneficiaries 6 915 666 6 924 686 -0,13
Age distribution of beneficiaries
Figure 9 shows the age distribution of the medical scheme
beneficiaries during 2003 and 2004. There were more benefi-
ciaries aged between the intervals 5 and 15 years, 34 and 40
years and also those over 70 years during 2004. This reflects
a slight aging of membership of schemes with the average age
of medical scheme beneficiaries increasing to 32,0 years in
2004 from 31,9 years in 2003. The average age of members of
restricted medical schemes was 32,6 years, while that of open
schemes was 32,1 years.
Female members were generally older than males in all
medical schemes. The average age of male members was 31,4
years compared to that of female members at 32,6 years. The
average age of males in open schemes was 31,4 years while
that of restricted schemes was 32,0 years. Among females, the
average age in open schemes was 32,8 years while that of
restricted schemes was 33,2 years.
eficiaries declined by 0,1% to 6 915 666 from 6 924 686 in 2003. The number of
dependants in restricted schemes declined by 2,9% while in open schemes there
was a small decline in the number of dependants. Restricted schemes experienced
a drop of 2,3% in the number of beneficiaries while a marginal increase (0,8%)
was experienced in open medical schemes.
1<
1-4
5-9
10-14
15-19
20-24
25-29
30-34
35-39
40-44
45-49
50-54
55-59
60-64
65-69
70-74
75+
2003 2004
No. of beneficiaries Thousands
0 100 200 300 400 500 600 700 800
Figure 9: Age distribution of medical scheme beneficiaries

COUNCIL FOR MEDICAL SCHEMES Annual Report 2004-5 55
R E V I E W O FO P E R A T I O N S
4
Trends in membership
Figure 10 shows the trends in the number of ben-
eficiaries of all medical schemes over the last ten
years. The trend analysis shows that the number of
beneficiaries has remained fairly steady at around
7 million since 1996. It is noticeable that while
the number of members seem to have increased
steadily overtime, the number of dependants has
however been declining since 1999.
Pensioner ratio
The percentage of pensioners (beneficiaries who were 65 years or older as at 31
December 2004), increased to 6,7% from 6,4% in 2004. The percentage was high-
er in restricted schemes (7,8%) than in open schemes (6,3%), continuing a trend
that was observed in previous years.
There were proportionately more female than male pensioners in registered
schemes. Bargaining Council medical schemes were different in that they had a
higher proportion of male pensioners than females.
0
1
2
3
4
5
6
7
8Millions
95 96 97 98 99 2000 01 02 03 04
Members Dependants
Figure 10: Trend analysis of coverage of beneficiaries
Table 5: Pensioner ratio (>65 years) of registered schemes
Type of scheme Gender 2004 2003
Open male 6,00 6,40
female 6,62 5,40
consolidated 6,31 5,90
Restricted male 6,94 8,80
female 8,69 6,60
consolidated 7,82 7,70
Registered schemes male 6,28 7,60
female 7,20 6,00
consolidated 6,74 6,80
Bargaining Council* male 7,72 3,20
female 0,96 0,50
consolidated 4,34 1,85
Consolidated male 6,33 7,00
female 6,98 5,80
consolidated 6,66 6,40
* The 2004 results could be an indication of better reporting by bargaining council schemes.

Membership by province
Table 7 shows the provincial breakdown of membership
of medical schemes. These data were collected primarily
on the basis of the location of principal members. More than one third (37,3%) of
the beneficiaries of schemes are based in Gauteng, 17,3% are in the Western Cape
and 14,9% are in Kwazulu-Natal. The Northern Cape has the least proportion of
medical scheme members at 2,2%.
Dependants ratio
The dependant ratio, which measures the average number of dependants per prin-
cipal member of a medical scheme, declined by 2,0% to 1,44 from 1,47 in 2003.
The decline in the dependants ratio was highest in bar-
gaining council schemes followed by open schemes.
Restricted schemes on the other hand experienced the
least decline in the dependants’ ratio.
56 COUNCIL FOR MEDICAL SCHEMES Annual Report 2004-5
R E V I E W O FO P E R A T I O N S
4
Province Members Dependants Beneficiaries % of total beneficiaries
Gauteng 1 092 200 1 487 204 2 579 404 37,30
Limpopo 98 047 181 611 279 658 4,04
Mpumalanga 166 418 287 790 454 208 6,57
North West 124 799 188 131 312 930 4,52
Free State 130 568 188 254 318 822 4,61
KwaZulu Natal 417 706 610 894 1 028 600 14,87
Western Cape 508 585 685 300 1 193 885 17,26
Eastern Cape 234 735 361 091 595 826 8,62
Northern Cape 60 264 92 069 152 333 2,20
Consolidated 2 833 322 4 082 344 6 915 666 100
Benefits
Total benefits paid by medical schemes
Expenditure by medical schemes on health care benefits increased to R41,5bn in
2004, an increase of 7,2% on 2003. This represents an increase per beneficiary per
month of 6,5% during 2004.
Figure 11 shows the proportions of benefits paid to hospitals, general practi-
tioners, specialists and others. Hospital expenditure, which includes theatre fees,
ward fees, consumables, medicines dispensed and global and per diem arrange-
Table 6: Dependant ratio in medical schemes
Type of scheme 2004 2003 % change
Registered scheme 1,45 1,48 -2,03
open 1,47 1,51 -2,65
restricted 1,41 1,43 -1,40
Bargaining Council 1,16 1,20 -3,33
Consolidated 1,44 1,47 -2,04
Table 7: Medical scheme membership by province

ments, accounted for 38,0% (R15,7bn) of the R41,5bn paid to providers. This is
an 18,5% increase on 2003. The increase in expenditure on private hospitals was
19,5% while that of provincial hospitals was 5,3%. Provincial hospitals account-
ed for 1,7% of the overall benefits paid to
hospitals.
In the private hospitals, ward fees account-
ed for 43,8% of the total private hospital
expenditure (includes global and/or per diem
arrangements), theatre fees made up 24,8%,
consumables were at 12,9% and medicines
dispensed within hospitals accounted for
18,5%.
Expenditure in the provincial hospitals was
dominated by ward fees which accounted for
75,3% of the total expenditure, consumables
made up 12,9%, while theatre fees and medi-
cines dispensed made up 6,7% and 5,1% respectively.
Medical specialists accounted for 19,9% of the total expenditure in 2004.
Expenditure on general practitioners declined by 1,7% to R2,9bn in 2004 from
R3,0bn in 2003.
Medicines dispensed by pharmacists and providers other than hospitals,
accounted for 19,2% (R7,96bn) of the total benefits paid by medical schemes.
Expenditure on pharmacists accounted for 82,9% of the total medicine expendi-
ture while dispensing practitioners accounted for 16,8%.
Allied health professionals accounted for only 0,3% of the total expenditure on
medicines. Expenditure on allied health professionals of increased by 2,4% to
R2,74bn in 2004 from R2,67bn in 2003.
COUNCIL FOR MEDICAL SCHEMES Annual Report 2004-5 57
R E V I E W O FO P E R A T I O N S
4
Total Hospitals 38,0%
Medicines 19,2%
Allied and SupportHealth Professionals 6,6%Ex-Gratia Payments 0,1%Other benefits 2,4%Capitated Primary Care 2,1%
General Practitioners 7,0%
Medical Specialists 19,9%
Dentists 4,1%Dental Specialists 0,7%
Figure 11: Total benefits paid during 2004
Benefits paid out of risk pool
Benefits paid out of the risk pool amounted to
R36,8bn (88,9%) of total benefits in 2004; an
increase of 6,8% from R34,5bn in 2003.
Hospitals (private and provincial) accounted
for 42,6% of the total risk benefits paid in
2004 compared with 38,3% in 2003.
Medicines expenditure accounted for 17,3%
while specialists accounted for 19,9%.
General practitioners accounted for 5,9% of
the total risk benefits; a drop of 7,8% to
R2,2bn in 2004 from R2,4bn in 2003.
Total Hospitals 42,6%
Medicines 17,3%
Allied and SupportHealth Professionals 5,3%Ex-Gratia Payments 0,1%Other benefits 2,6%Capitated Primary Care 2,4%
General Practitioners 5,9%
Medical Specialists 19,9%
Dentists 3,3%Dental Specialists 0,6%
Figure 12: Benefits paid from risk pool during 2004

Trends in total benefits paid
Figure 14 shows the distribution of benefits to different types of providers since 1995.
The largest increase in expenditure was on hospitals, which rose by an adjusted
16,9% to R15,7bn from R13,5bn in 2003. Expenditure in private hospitals
increased by 17,2% to R15,5bn from R13,2bn in 2003. Provincial hospitals
increased their share by 3,8% to R248,8m from R252,3m in 2003.
In private hospitals, theatre fees increased by 35,9%, ward fees by 20,3% and
medicines dispensed in hospitals by 16,3%. Consumables declined by 8,8%. In
provincial hospitals, ward fees increased by 18,8%, and consumables by 2%.
Benefits paid from medical savings accounts
Personal medical savings accounts, which are accounts set aside by a medical
scheme for individual use by members and their dependants, accounted for
11,2% (R4,6bn) of the overall expenditure on
benefits. This reflected an increase of 10,7% on
2003. Medicines accounted for 34,0% of bene-
fits paid while medical specialists and general
practitioners accounted for 19,3% and 15,6%
respectively.
A small percentage (1,5%) of medical savings
accounts money was spent on hospital services
(1,5%); this reflects a 12,3% decline from
R80,7m in 2003 to R70,8m in 2004.
58 COUNCIL FOR MEDICAL SCHEMES Annual Report 2004-5
R E V I E W O FO P E R A T I O N S
4
Dental Specialists 1,9%Total Hospitals 1,5%
Medicines 34,0%
Allied and SupportHealth Professionals 16,6%
Ex-Gratia Payments 0,0%
Other benefits 1,0%Capitated Primary Care 0,0%General Practitioners 15,5%Medical Specialists 19,3%
Dentists 10,1%
Figure 13: Benefits paid from saving accounts in 2004
01
3
5
7
9
11
13
15
17
Rand Billion
95 96 97 98 99 2000 01 02 03 04
❚ General Practitioners
❚ Medical Specialists
❚ Dentists (incl specialists)
❚ Medicines
❚ Private Hospitals
❚ Total Hospitals
❚ Ex-Gratia Payments
❚ Provincial Hospitals
❚ Other benefits
❚ Allied and SupportHealth Professionals
❚ Capitated Primary Care
Figure 14: Total benefits paid, 2004 prices

0
20
40
60
80
100
120
140
160
180
200
Rand PBPM
95 96 97 98 99 2000 01 02 03 04
❚ General Practitioners
❚ Medical Specialists
❚ Dentists (incl specialists)
❚ Medicines
❚ Private Hospitals
❚ Total Hospitals
❚ Ex-Gratia Payments
❚ Provincial Hospitals
❚ Other benefits
❚ Allied and SupportHealth Professionals
❚ Capitated Primary Care
Theatre fees and medicines dispensed in hospitals declined by 27,5% and 50,3%
respectively.
Expenditure on medical specialists increased by 6,9% to R8,2bn from R7,7bn
in 2003. General practitioners expenditure, on the other hand, declined by 3,1%
to R2,9bn from R3bn in 2003. Expenditure on medicines declined by 8,9% to
R8bn from R8,7bn in 2003. A similar trend was noted on dentists, including den-
tal specialists were expenditure declined by 5,2% to R2bn from R2,1bn in 2003.
There was a significant increase in expenditure on capitated primary care in which
rose by 106,1% to R886,4m from R430m in 2003. Expenditure on allied and sup-
port health professionals increased marginally by 1,0% from R2,7bn in 2003.
COUNCIL FOR MEDICAL SCHEMES Annual Report 2004-5 59
R E V I E W O FO P E R A T I O N S
4
Total benefits paid per beneficiary
Figure 15 shows the overall increase per beneficiary in expenditure. Expenditure on
hospitals increased by 17,1% to R189,7 per beneficiary per month from R162,1 in
2003. The increase in private hospitals was 17,3% while that of provincial hospi-
tals was comparatively lower at 4,0%.
Expenditure on medical specialists increased by 7,0% to R99,3 from R92,8 in
2003. General practitioners’ share of expenditure declined by 3,0% to R35 from
R36,1 in 2003. A similar trend was noted among dentists and dental specialists
where expenditure declined by 5,1% to R23,9 from R25,2 in 2003.
Expenditure on medicines, when adjusted for inflation and membership,
declined by 8,8% to R95,9 from R105,2 in 2003. The most significant increase in
per beneficiary expenditure was that of capitated primary care which rose by
106,4% to R10,7 from R5,2 in 2003. Expenditure on allied and health profession-
als increased marginally by 1,1% to R33,0 from R32,6 in 2003.
Figure 15: Total benefits paid per beneficiary per annum, 2004 prices

Average utilisation of services
The average number of visits to a general practitioner per beneficiary was 3,3 in
2004; a slight decline from 3,4 in 2003. The visits were higher for restricted
schemes (3,9 visits per annum) compared to open schemes (3,0 visits per annum).
The average length of stay in private hospitals was 1,1 in 2004. This was high-
er for restricted schemes (2,4 days per annum) compared to open schemes (0,5
days per annum). The length of stay in provincial hospital was lower (0,1) than in
private hospitals.
The utilisation levels of primary healthcare services in registered schemes, particu-
larly general practitioners, declined from an average of 803,8 per 1000 beneficiar-
ies in 2003 to 740,5 per 1000 beneficiaries in 2004.
Admissions to both public and private hospitals were also lower than in the
previous year. Private hospital admissions declined to 197,9 per 1000 beneficiar-
ies from 243,5 in 2003. Public hospital admission declined to 11,5 admissions per
1000 beneficiaries from 24,1 in 2003. On the whole, utilisation levels were high-
er in restricted than open schemes, particularly for primary care services and
admissions to hospitals.
60 COUNCIL FOR MEDICAL SCHEMES Annual Report 2004-5
R E V I E W O FO P E R A T I O N S
4
Utilisation of health services
Provider group Open Restricted Consolidated Consolidatedschemes schemes 2004 2003
per 1000 Beneficiaries
PRIVATE PROVIDERS
Number of beneficiaries visiting a GP at least once a year 710,99 811,31 740,46 803,76
Number of beneficiaries visiting a dentist at least once a year 260,65 335,59 282,66 301,02
Number of beneficiaries visiting a private nurse at least once a year 4,91 8,15 5,87 9,63
PRIVATE FACILITIES
Number of admissions to hospitals 190,43 216,04 197,95 243,49
PUBLIC FACILITIES
Number of admissions to hospitals 9,23 17,09 11,54 24,31
Table 8: Utilisation of services
Table 9: Average utilisation of services
Average utilisation Open Restricted Consolidatedof services schemes schemes 2004 2003
Visits to a general practitioner per year 3,03 3,93 3,30 3,44
Visits to a dentist per year 0,54 0,63 0,57 0,67
Visits to a private nurse per year 0,01 0,03 0,02 –
Length of stay in private hospital – 2,36 1,06 –
Length of stay in provincial hospitals – 0,06 0,05 –

Generally, the prevalence of chronic conditions in registered schemes was high-
er in restricted than in open medical schemes. The higher prevalence in restricted
schemes may be related to the higher age profile of these schemes compared with
that of open schemes.
Contributions, claims and trends during 2004
Total contributions and claims during 2004
Total contributions for all schemes increased on average by 7,4% to R52,2 bn from
R48,6bn in 2003. Total gross claims incurred went up 7,0% to R41,4bn from
R38,7bn in 2003. Gross contributions attributable to registered schemes only
(excluding bargaining council schemes) grew by 7,1% per beneficiary per month to
R645 from R602 in 2003, while gross claims per beneficiary per month jumped 6,7%
to R511 from R479.
In general, there has been a decline in the level
of utilisation of services of medical specialists
and allied health professionals. There was
however a noticeable increase in the level of
utilization of other benefits such as appli-
ances, prostheses and ambulance services
(Annexure G).
Burden of disease
A new set of 25 legislated chronic conditions
was introduced in the medical schemes envi-
ronment in January 2004. The regulations
required that these 25 prescribed chronic con-
ditions should be covered in all medical
schemes benefit options. Figure 16 shows the
prevalence of these chronic conditions. The
data represents 77,4% of schemes and 76,7%
of beneficiaries. Schemes that did not submit
any data on chronic conditions were excluded
from the analysis as were schemes that sub-
mitted poor quality data. The analysis showed
that the most prevalent condition in medical
schemes is hypertension (91 cases/1000 bene-
ficiaries), followed by hyperlipidaemia (34 cases/1000 beneficiaries) and asthma
(25 cases/1000) beneficiaries.
COUNCIL FOR MEDICAL SCHEMES Annual Report 2004-5 61
R E V I E W O FO P E R A T I O N S
4
Hypertension
Hyperlipidaemia
Asthma
Diabetes Mellitus Type 2
Coronary Artery Disease
Hypothyroidism
Epilepsy
Diabetes Mellitus Type 1
Rheumatoid Arthritis
Cardiac Failure
Chronic Obstructive Pulmonary Disease
Glaucoma
Dysrythmias
Bipolar Mood Disorder
Parkinson’s Disease
Ulcerative Colitis
Cardiomyopathy Disease
Schizophrenia
Chronic Renal Disease
Systematic Lupus Erythromatosis
Chrohn’s Disease
Bronchiectasis
Multiple Sclerosis
Diabetes Insipidus
Addison’s Disease
Haemophilia
HIV
Figure 8: Chronic
0 10 20 30 40 50 60 70 80 90 100
Figure 16: Prevalence of chronic conditions in registered schemes

Medical savings accounts claims
as a percentage of total net claims
incurred went up from 10,9% in
2003 to 11,4% in 2004. The same fig-
ure increased to 13,1% from 12,7%
when viewed on a beneficiary basis. This would indicate a move towards benefit
designs requiring a greater proportion of benefits to be funded out of a member’s
savings rather than from the general risk pool.
Contributions and claims by open and restricted membership schemes
Table 10 and figures 18 and 19 show the contributions and claims per beneficiary
per month for open and restricted schemes.
Beneficiaries of restricted schemes saw lower gross contribution increases of
6,9% compared with the 7,4% for those in open scheme. Claims costs were high-
er in the restricted schemes than in the open ones. The risk claims ratio for open
schemes declined to 76,2% from 77,3% in 2003. The ratio for restricted schemes
increased to 84,3% from 83,6%.
Risk contributions and claims for registered schemes
Risk contributions (net of savings contributions) increased by 7,2% to R46bn
from R42,9bn in 2003. The comparable increase between 2002 and 2003 was
11,4%. Risk contributions per beneficiary per month increased to R577 from
R539, an increase of 7,1% (2003: 13,2%).
Risk claims increased by 6,5% to R36,2bn from R34,0bn (2003: 7,6%). Risk
claims per beneficiary went up to R453 per month from R426, an increase of
6,3%. (2003: 9,0%).
Medical savings accounts contributions and claims
Contributions to medical savings accounts increased by 9,9% to R5,5bn from
R5,0bn the year before. (2003: 19,0%). The increase per average beneficiary was
9,5% from R63 to R69 (2003:
21,2%).
Claims paid from savings
accounts increased by 9,5% to
R4,6bn from R4,2bn. (2003:
16,7%). Claims per beneficiary
were also 9,4% higher in 2004,
from R53 to R58. The comparable
increase between 2002 and 2003
was 17,8%.
62 COUNCIL FOR MEDICAL SCHEMES Annual Report 2004-5
R E V I E W O FO P E R A T I O N S
4
306340
301
426453
342
409
476
539577
39 46 52 63 6934 41 45 53 58
0
100
200
300
400
500
600Rand PABPM
2000 01 02 03 04
Risk Claims Savings Claims Risk Contributions Savings Contributions
Figure 17: Risk and savings contributions and claims for registered schemes
Figure 11 shows that open schemes are increasingly paying claims out of med-
ical savings accounts; with 13% of all claims paid out of medical savings accounts
compared with 12,3% in 2003. Put another way, the claims ratio of medical sav-
ings accounts in open schemes increased to 85,1% in 2004 from 82,6% in 2003.

COUNCIL FOR MEDICAL SCHEMES Annual Report 2004-5 63
R E V I E W O FO P E R A T I O N S
4
Risk Contributions Savings Contributions
42
50
57
7077
3136
3946
50
334
406
471
536574
361415
489546
583
0
100
200
300
400
500
600
700Rand PABPM
2000 01 02 03 04 2000 01 02 03 04Open Restricted
Risk Claims Savings Claims
3844
4958
65
2732
3439
41
292331
379414
437
333361
418456
491
0
100
200
300
400
500
600Rand PABPM
2000 01 02 03 04 2000 01 02 03 04Open Restricted
Figures 18 & 19: Risk and savings contributions and claims per average beneficiary per month for open and restricted schemes
Table 10: Contributions and claims per average beneficiary per month for open and restricted schemesRisk contributions Savings contributions Risk claims Savings claimsPABPM % PABPM % PABPM % PABPM %
R Change R Change R Change R Change
OPEN
2000 334 42 292 38
2001 406 21,8% 50 18,7% 331 13,3% 44 17,6%
2002 471 15,8% 57 14,2% 379 14,4% 49 10,8%
2003 536 13,8% 70 23,6% 414 9,1% 58 18,6%
2004 574 7,2% 77 8,8% 437 5,7% 65 11,9%
RESTRICTED
2000 361 31 333 27
2001 415 15,0% 36 14,6% 361 8,3% 32 17,6%
2002 489 17,8% 39 9,8% 418 15,8% 34 4,9%
2003 546 11,6% 46 17,1% 456 9,1% 39 15,3%
2004 583 6,8% 50 9,1% 491 7,7% 41 5,4%
*PABPM = per average beneficiary per month
Growth in restricted schemes claims paid out of medical savings accounts slowed to
7,7% in 2004 from 7,9% the year before. Medical savings accounts claims ratio for
restricted schemes declined to 82,1%, down from 85,0% in 2003.
Trends in contributions and claims since introduction of medical savingsaccounts
Figure 20 illustrates the increased utilisation of medical savings accounts in the
benefit design of all registered schemes since 1997 when schemes first started
using these. Risk contributions have increased by 60,5% and claims incurred
have gone up by 39,3% since 1997. Contributions to and claims from medical
savings accounts, on the other hand, have increased by 133,9% and 153,4%
respectively. This suggests that schemes are increasingly shifting benefits from the

Figures 22 and 23 shows the levels of claims
and non-health care expenditure after adjust-
ing contributions by removing the percentage
earmarked for reserves. The two figures show
that the claims ratios reduces by 5,8% com-
pared to non-health ratio which only reduces
by 1%.
Claims ratio for risk benefits
Figure 21 shows the relationship between risk
contributions and claims paid over the past
decade, adjusted for inflation. The claims ratio,
which is the percentage of contributions paid
out in claims, declined at a slower rate in 2004
compared to the last few years. The claims ratio
decreased to 78,6% from 79,2% in 2003 (claims ratio was over 90% before 1999).
The claims ratio effectively translates into medical schemes paying 78,6% (2003:
79,2%) of contributions towards benefits, leaving 21,4% (2003: 20,8%) of contri-
butions to non-health expenditure and reserves
(future benefits). As reserves for most schemes
are at the prescribed level, more of members’
contributions should in future be utilised
towards benefits. Trustees should ensure that
benefits are not substituted by high levels of
non-health expenditure.
64 COUNCIL FOR MEDICAL SCHEMES Annual Report 2004-5
R E V I E W O FO P E R A T I O N S
4
0
100
200
300
400
500
600Rand PABPM
75
77
79
81
83
85
87
89
91
93
95
Risk Contributions Risk Claims Risk Claims Ratio
%Claims Ratio
95 96 97 98 99 2000 01 02 03 04
risk pool into the medical savings account. In
other words, it would appear that members are
effectively funding more benefits out of their
own pockets rather than being funded within
the risk pool.
Non-health expenditure
Medical schemes’ non-health expenditure consists of administration, brokers fees,
impaired receivables (bad debts), reinsurance results and expenditure associated
with managed care.
Administration expenditure
Administration expenditure in registered medical schemes grew 10,5% to R5bn
from R4,5bn in 2003. Open scheme expenditure was R4bn, an increase of 12,1%
from R3,5bn in 2003. Restricted schemes raised their expenditure by a more mod-
est 5,0% to R1,0bn from R978m.
Risk Contributions Savings Contributions Risk Claims Savings Claims
29 4463
4853
5664
69
0
100
200
300
400
500
600
700Rand PABPM
23 33 49 4348 48 53
58
95 96 97 98 199 2000 01 02 03 04
Figure 20: Risk and savings contributions and claims, 2004 prices
Figure 21: Risk claims ratio for all schemes since 1995 adjusted for inflation, 2004 prices

Gross Contribution Income Adjusted Gross Contribution IncomeOriginal Gross Non-health Ratio Adjusted Gross Non-health Ratio
0
100
200
300
400
500
600
700
Non-health Ratio
6
8
10
12
14
16
Rand PABPM%
95 96 97 98 99 2000 01 02 03 04
COUNCIL FOR MEDICAL SCHEMES Annual Report 2004-5 65
R E V I E W O FO P E R A T I O N S
4
Risk Benefits Incurred Savings Benefits IncurredAdjusted Gross Claims Ratio Original Gross Claims Ratio
0
100
200
300
400
500
600Claims Ratio
75
77
79
81
83
85
87
89
91
93
95Rand PABPM%
95 96 97 98 99 2000 01 02 03 04
Figures 22 & 23: Claims ratio, non-health ratio and contributions since 1995 adjusted for reserve building and inflation, 2004 prices
Administration fees paid to administrators made up R3,7bn of the total (73,7%).
Staff remuneration and marketing expenses accounted for 10,2%, respectively.
Trustee remuneration represented 0,7% of gross administration expenditure whilst
principal officer fees represented 0,6%. Annexure O provides full details of these
expenditure items for each scheme.
Open schemes Restricted schemesPABPM PABPM
2004 2003 % 2004 2003 %R R Variance R R Variance
Direct administration fees 48,70 44,23 10,11% 33,83 31,79 6,42%
Co-administration fees 1,18 0,54 118,52% 0,50 0,55 -9,09%
Indirect expenses paid 0,81 0,80 1,25% 0,23 0,28 -17,86%
Total 50,68 45,57 11,24% 34,56 32,62 5,95%
*PABPM = per average beneficiary per month
Table 11 shows gross administration fees paid to third-party administrators
which comprises of direct administration fees, co-administration fees and indi-
rect expenses. The table shows that beneficiaries in open schemes paid on aver-
age 46,6% more for gross administration fees than restricted schemes in 2004
(2003: 39,7%).
Open schemes experienced an increase of 11,2% in the total administration
fees paid to third-party administrators; this increase is slightly lower than the over-
all increase in administration expenditure of 12,1% for open schemes. Restricted
schemes experienced an increase of 6,0% in the total administration fees paid to
third-party administrators; this increase is one percentage point higher than the
overall increase in administration expenditure of 5,0% for restricted schemes from
2003 to 2004.
Table 11: Total administration fees paid to third party administrators
In 2004, principal officer fees represented 0,6% of gross administration expen-
diture for open schemes compared to 1,1% in restricted medical schemes. This
translated into R0,43 per average beneficiary in the open scheme market (for those
schemes paying principal-officer fees), and R0,76 per average beneficiary in the
restricted scheme market; a difference of 76,7%.
Marketing and advertising fees represented 3,3% of gross administration
expenditure in respect of all registered schemes. Open schemes paid R0,93 per
average beneficiary per month for marketing and advertising, where as restricted
schemes paid R0,97 per average beneficiary per month, based on the number of
schemes that paid marketing and advertising expenditure. Interesting to note that
restricted schemes paid more towards marketing and advertising on an average
beneficiary level than open schemes.
Administration expenditure represented 69,8% (2003: 67,9%) of total non-
health expenditure.
Expenditure associated with management of benefits
Managed healthcare expenditure also jumped to R1,2bn from R1,1bn, an increased
of 11,8% from 2003. The average number of members covered by these interven-
tions grew by 1,2%. Managed care tools were used by 114 schemes during 2004
(2003: 109 schemes), and by 6 462 862 (97,1%) of beneficiaries (2003: 96,0%).
However, it should be noted that not all beneficiaries mentioned above are covered
by managed care due to some of the options not having managed care interventions.
Administration and managed-care expenditure jointly accounted for 12,1%
(2003: 11,7%) of gross contribution income, higher than the broad guideline of
10% that Council has established. Our analysis shows that there were 33 open
schemes, representing 2 992 999 beneficiaries, and 20 restricted schemes, repre-
senting 279 835 beneficiaries, whose overall administration expenditures were
still above the 10% level.
Table 12 shows administration and managed care expenditure for open and
restricted schemes by type of scheme administration. There were 7 self-adminis-
tered open schemes (2003: 9 schemes), representing 479 083 beneficiaries (2003:
511 885) and 42 third-party administered open schemes (2003: 40 schemes), rep-
resenting 4 238 353 beneficiaries (2003: 4 181 457).
Self-administered open schemes grew their expenditure by 10,9% to R77 pbpm
from R69 pbpm in 2003. Open schemes administered by third parties saw a rise
of 12,0% to R88 pbpm from R78 pbpm. The latter schemes spend 14,4% more on
administration and managed care expenditure than self-administered open
schemes.
66 COUNCIL FOR MEDICAL SCHEMES Annual Report 2004-5
R E V I E W O FO P E R A T I O N S
4
There were also 13 self-administered restricted schemes (2003: 13 schemes), rep-
resenting 238 744 beneficiaries (2003: 247 264) and 74 third party administered
restricted schemes (2003: 75 schemes), representing 1 697 094 beneficiaries (2002:
1 711 556). Self-administered restricted schemes paid on average R43 pbpm com-
pared with the R59 pbpm spent by restricted schemes administered by third parties.
The expenditure by the latter schemes was 36,5% higher than the former.

In the restricted schemes market, only four
schemes reported any commission payments
(three in 2003). However, these schemes paid
R2,2m in commission, up 107,3% from 2003.
Data from these four schemes shows that only
5 318 new members joined the schemes in
2004. The three schemes that paid broker
commission in 2003 had seen 10 495 new
members joining, which suggests that the
COUNCIL FOR MEDICAL SCHEMES Annual Report 2004-5 67
R E V I E W O FO P E R A T I O N S
4
OPEN SCHEMES RESTRICTED SCHEMESSelf -administered Third Party Self -administered Third Party
PABPM % PABPM % PABPM % PABPM % R Change R Change R Change R Change
2000 37,50 - 48,66 - 24,69 - 38,26 -
2001 62,83 67,5% 62,70 28,8% 31,26 26,6% 41,49 8,4%
2002 55,80 -11,2% 69,81 11,4% 37,31 19,4% 49,27 18,8%
2003 69,17 24,0% 78,38 12,3% 32,95 -11,7% 55,76 13,2%
2004 76,72 10,9% 87,78 12,0% 43,25 31,3% 59,02 5,9%
*PABPM = per average beneficiary per month
Table 12: Gross administration expenditure and managed care expenditure in respect of open and restricted schemes
Self-administered open schemes spent 77,4% more pbpm compared with self-
administered restricted schemes. Open schemes administered by third parties paid
on average 48,7% more pbpm than third-party administered restricted schemes.
This may be explained by the fact that:
• Restricted schemes usually have simpler benefit designs and fewer benefit
options, all of which results in simpler administration;
• Collection of contributions and credit control is much simpler for restricted
schemes; and
• Sometimes the employer group associated with a restricted scheme makes a
contribution to some of the capital and salary expenditure.
Fees paid to healthcare brokers
Commission fees paid to healthcare brokers again rose sharply to R704m from
R581m in 2003, an increase of 21,1%. Virtually all commission payments (99,7%)
were made by open schemes. Those schemes that paid broker commissions have
seen this expenditure increase as a percentage of gross contribution income to
1,9% from 1,7% in 2003. When expressed as a percentage of total non-health
expenditure, broker fees increased to 12,2% from 11,0% for those schemes that
paid broker fees.
Figure 24 shows trends in payments made
to brokers since 2000, as well as the percent-
age of total non-health expenditure that these
commissions have accounted for.
Per Average Member Per Month Percentage of Total Non-health Expenditure
15.6 16.8 17.0
26.3
30.9
02
6
10
14
18
22
26
30
34
Rand PAMPM
10.7
8.67.9
11.1
012345678910111213
%Percentage of non-health
12.4
2000 01 02 03 04
Figure 24: Trends in broker fees for the open scheme market

Marketing and advertising expenditure have
gone up year on year, without any perceptible
increase in many new members joining.
Schemes that had the highest increase in
broker fees pmpm and a decrease in the num-
ber of members joining between 2003 and
2004, are shown in table 13.
number joining in 2004 has gone down by 49,3% in spite of the substantial
increases in commission payments.
68 COUNCIL FOR MEDICAL SCHEMES Annual Report 2004-5
R E V I E W O FO P E R A T I O N S
4
The 47 open schemes that paid broker fees during 2004 indicated that 390 873
new members joined the schemes during 2004, a decrease of 9,8% from the 433
904 new members that joined the open schemes that paid broker fees in 2003.
Data from open schemes shows that 168 767 people were introduced to med-
ical schemes for the first time in 2004, compared with 215 845 in 2003. This is a
decline of 21,8%. Restricted schemes, on the other hand, saw 52 982 newly-intro-
duced members, a decrease of 35,3% on 2003. The increase in broker fees of 21,1%
is therefore not related to the introduction of members.
Broker commission per member per month
Figure 25 illustrates the actual broker fees per member per month (based on the
industry’s overall average principal members) compared with a fee per member per
month that includes broker fees, marketing
expenditure as well as advertising expenditure.
Actual Broker Fees Broker Fees plus Marketing and Advertising Costs
14
18 18
32
38
1113
16
26
31
0
5
10
15
20
25
30
35
40Rand PAMPM
2000 01 02 03 04
Figure 25: Costs incurred in sourcing membership
Figure 26 excludes from the analysis the top
three schemes in table 13, and illustrates the
trends in broker fee pmpm since 2000. The
information is based only on the average num-
ber of members of those schemes that paid bro-
ker fees.
Actual Broker Fees Broker Fees (excl. outliers)
15.8
20.0 20.623.3
25.0
15.6 16.8 17.0
26.3
30.9
0
5
10
15
20
25
30
35Rand PABPM
2000 01 02 03 04
Figure 26: Broker fees excludes the top three outliers
The actual broker fee per average member
per month for the open industry market esca-
lated by approximately 17,2% between 2003
and 2004. However, should the three outliers be
removed, this increase to 7,5%, hence the bro-
ker fee per average member per month would
reduce from R31 per average member per
month to R25.

*PAMPM = per average member per month
COUNCIL FOR MEDICAL SCHEMES Annual Report 2004-5 69
R E V I E W O FO P E R A T I O N S
4
Scheme name Type Broker fees paid Number of members joiningthe scheme
PAMPM PAMPM % Change 2004 2003 % Change2004 2003
R RBuilt Environment
Professional Associations Restricted 48,72 10,51 363,66% 378 1 173 -67,77%
Profmed Restricted 1,76 0,69 156,80% 2 542 4 029 -36,91%
Global Health Open 4,44 2,89 53,33% 2 152 13 298 -83,82%
Community Medical Aid
Scheme (COMMED) Open 12,76 8,83 44,45% 0 1 526 -100,00%
Topmed Medical Scheme Open 39,13 27,74 41,06% 1 357 1 520 -10,72%
Hosmed Medical Aid Scheme Open 7,65 5,67 34,87% 0 4 830 -100,00%
Discovery Health Medical
Scheme Open 41,69 32,72 27,42% 139 898 171 065 -18,22%
Medihelp Open 10,16 8,02 26,72% 9 055 9 589 -5,57%
Bestmed Medical Scheme Open 34,46 27,45 25,55% 9 095 11 376 -20,05%
SAMWUMED Restricted 0,19 - N/A 2 398 5 293 -54,69%
Table 13: Schemes with the largest increases in broker commission between 2003 and 2004
Reinsurance results
The number of reinsurance contracts entered into by schemes declined to 5 during
2004 from 10 the year before. Other reinsurance entries in a few schemes related
to prior year adjustments. The net effect was a decrease in the reinsurance deficit of
93,7%, decreasing to a deficit of R7,8m from R123m in 2003.
Impaired receivables
The total impaired receivables (previously known as bad debts) for the year
under review amounted to R211m compared to R321m in 2003, which is a
decrease of 34,3%. This movement resulted
from the net effect of the following three cat-
egories:
• The increase in impaired receivables writ-
ten off of approximately 45,2%.
• The increase in impaired receivables of
approximately 79,9%.
• The decrease in the provision for impaired
receivables of approximately 118,1%.
Impaired receivables for 2004 represented
3,0% of total non-health expenditure com-
pared to 4,8% in 2003.
There is some concern that medical
schemes have seen a 45,2% increase in
impaired receivables written off. This is espe-
Total Impaired Receivables – Open Total Impaired Receivables – Restricted
Contribution > 60 days as % of Arrear Contributions – Open
Contribution > 60 days as % of Arrear Contributions – Restricted
0
20
40
60
80
100
120
140
160
180
200Rand Million
0
5
10
15
20
25
30
35%
2000 01 02 03 04
Figure 27: Impaired receivables
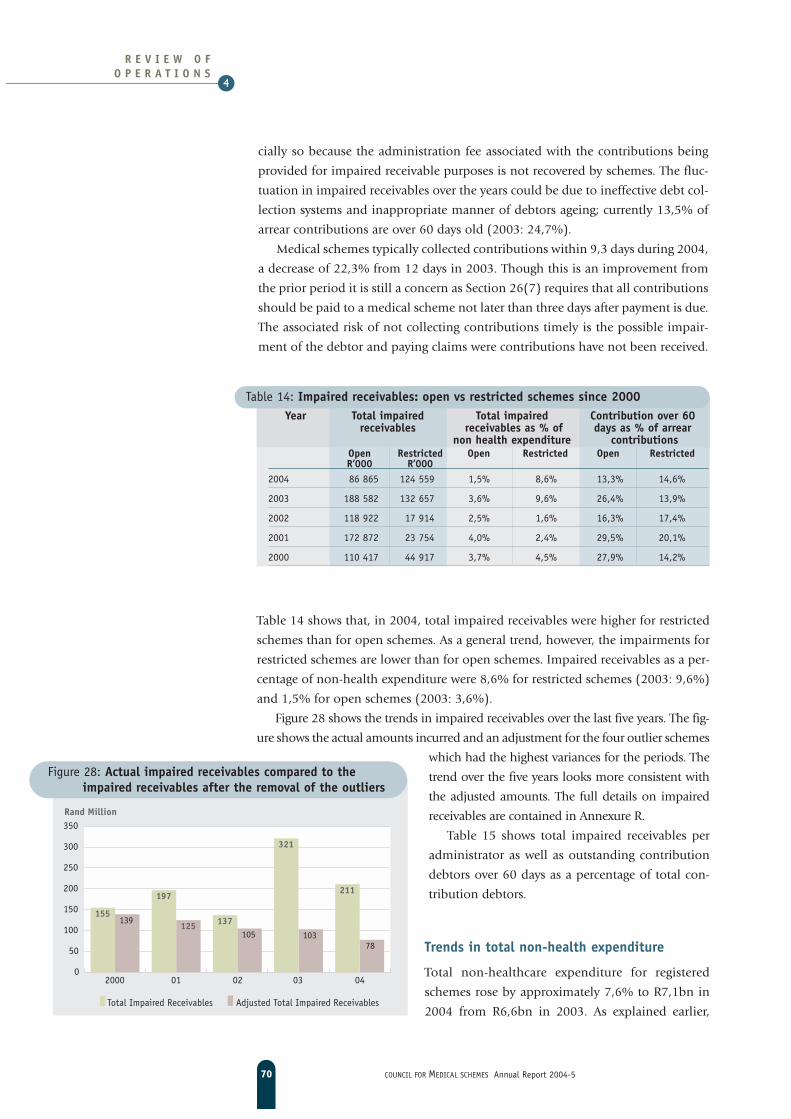
cially so because the administration fee associated with the contributions being
provided for impaired receivable purposes is not recovered by schemes. The fluc-
tuation in impaired receivables over the years could be due to ineffective debt col-
lection systems and inappropriate manner of debtors ageing; currently 13,5% of
arrear contributions are over 60 days old (2003: 24,7%).
Medical schemes typically collected contributions within 9,3 days during 2004,
a decrease of 22,3% from 12 days in 2003. Though this is an improvement from
the prior period it is still a concern as Section 26(7) requires that all contributions
should be paid to a medical scheme not later than three days after payment is due.
The associated risk of not collecting contributions timely is the possible impair-
ment of the debtor and paying claims were contributions have not been received.
70 COUNCIL FOR MEDICAL SCHEMES Annual Report 2004-5
R E V I E W O FO P E R A T I O N S
4
Year Total impaired Total impaired Contribution over 60 receivables receivables as % of days as % of arrear
non health expenditure contributionsOpen Restricted Open Restricted Open RestrictedR’000 R’000
2004 86 865 124 559 1,5% 8,6% 13,3% 14,6%
2003 188 582 132 657 3,6% 9,6% 26,4% 13,9%
2002 118 922 17 914 2,5% 1,6% 16,3% 17,4%
2001 172 872 23 754 4,0% 2,4% 29,5% 20,1%
2000 110 417 44 917 3,7% 4,5% 27,9% 14,2%
Table 14 shows that, in 2004, total impaired receivables were higher for restricted
schemes than for open schemes. As a general trend, however, the impairments for
restricted schemes are lower than for open schemes. Impaired receivables as a per-
centage of non-health expenditure were 8,6% for restricted schemes (2003: 9,6%)
and 1,5% for open schemes (2003: 3,6%).
Figure 28 shows the trends in impaired receivables over the last five years. The fig-
ure shows the actual amounts incurred and an adjustment for the four outlier schemes
which had the highest variances for the periods. The
trend over the five years looks more consistent with
the adjusted amounts. The full details on impaired
receivables are contained in Annexure R.
Table 15 shows total impaired receivables per
administrator as well as outstanding contribution
debtors over 60 days as a percentage of total con-
tribution debtors.
Total Impaired Receivables Adjusted Total Impaired Receivables
139125
105 10378
155
197
137
321
211
0
50
100
150
200
250
300
350Rand Million
2000 01 02 03 04
Figure 28: Actual impaired receivables compared to theimpaired receivables after the removal of the outliers
Trends in total non-health expenditure
Total non-healthcare expenditure for registered
schemes rose by approximately 7,6% to R7,1bn in
2004 from R6,6bn in 2003. As explained earlier,
Table 14: Impaired receivables: open vs restricted schemes since 2000

COUNCIL FOR MEDICAL SCHEMES Annual Report 2004-5 71
R E V I E W O FO P E R A T I O N S
4
Administrator Number Total Outstandings Number Total Outstanding of impaired contributions of impaired contributions
schemes receivables > 60 days as schemes receivables > 60 days as% of arrear % of arrear
contributions contributions
2004 2004 2004 2003 2003 2003R’000 % R’000 %
Medscheme (Pty) Ltd 22 17 277 30,07% 21 28 119 45,06%
Self-administered 19 10 589 20,97% 19 14 875 18,09%
Metropolitan Health Corporate (Pty) Ltd 16 4 313 17,79% 16 87 255 70,01%
Old Mutual Healthcare (Pty) Ltd 11 5 546 26,88% 13 (802) 15,78%
Sovereign Health -Division of Medscheme Holdings 11 (400) 1,99% 11 589 0,21%
Status Medical Aid Administrators (Pty) Ltd 9 (91) 1,81% 9 3 144 3,29%
Allcare Administrators (Pty) Ltd 8 12 240 7,48% 7 1 032 6,19%
Discovery Health (Pty) Ltd 8 20 428 -0,91% 10 (1 772) -1,11%
Mx Network Systems (Pty) Ltd 3 113 942 82,91% 3 122 163 83,74%
Other 26 27 581 26,72% 28 66 635 31,51%
Total 133 211 424 13,54% 137 321 239 24,65%
administration expenditure increased by 10,5%, managed care by 11,8%, broker
fees rose by 21,1% and impaired receivables decreased by 34,2%. There was a
decrease of 93,6% in reinsurance losses.
Figure 29 shows the trends in total non-health expenditure since 2000. Total
non-health expenditure has increased by approximately 79,5% over the five year
period. Administration expenditure rose by 99,3%; managed care by 39,1%; bro-
g p
4 98
2
1 23
2
704
8
211
7 13
6
4 50
8
1 10
2
581
123 32
1
6 63
5
4 08
3
966
354
297
137
5 83
6
3 52
7
986
289
334
197
5 33
2
2 49
9
885
230
207
155
3 97
6
0
1
2
3
4
5
6
7
Rand Million‘000
Administration Managed Care: Broker Nett Impaired Total(Risk only) Management Fees Reinsurance Receivables Non-health
Services Expenditure
2000 2001 2002 2003 2004
Figure 29: Total non-health expenditure for registered schemes
*The figures in brackets are credits
Table 15: Impaired receivables per administrator

ker fees by 206,4%, and impaired receivables by 36,1%. Net reinsurance losses
have decreased by 96,2%. Total non-health expenditure rose to 13,9% (2003:
13,8%) of contributions in 2004.
Figure 30 shows further that non-health expenditure per beneficiary increased
to R1 045 from R981 in 2003, an increase of 6,5% in real terms. The downward
sloping claims ratio decreased, on the other hand, to 79,2% from 79,6% in 2003.
Total non-health expenditure was fairly stable in 2001 and 2003, but has increased
considerably in 2004. This increase in non-health expenditure was mainly due to
the 19,6% increase in broker fees to R102 per beneficiary from R85.
Given the reduction in the proportion of claims being paid to 79,2% from
79,6% in 2003, it would seem that claims are not necessarily putting upwards
pressure on contributions. The increase in contributions (6,0% in 2004) continue
to finance higher non-health expenditure.
Figure 31 depicts the information on risk
contributions, risk benefits, administration
costs and annual surpluses/(deficits) dis-
cussed previously on a beneficiary per
month basis. From the figure, it is clear that
the rate of increase on administration
expenditure per beneficiary has declined,
while the rate of growth of member sur-
pluses has increased considerably. The
implication is that, unlike in previous years
when gross administration expenses per
beneficiary were growing at the expense of
the beneficiary surpluses, this pattern has
now started to reverse.
The figure also shows that the growing divergence in contributions and claims
per member per month has not levelled off (as shown by increases in rate of con-
tribution changes accompanied by declines in claims ratios).
Operating results during 2004 and changesover the last five years
Total surplus from operations for all schemes has
increased steadily since 2001, and increased again
to R2,8bn from R2,4bn in 2003, a growth of
17,2%. Operating surpluses had grown by a dra-
matic 547,4% and 114,5% during 2002 and
2003, respectively. The 2004 increase, though not
as dramatic, is still significant and may be an
indication of a possible stabilisation of the indus-
try. The industry net surplus grows to R5bn when
investments and other income are taken into
account, an increases 14,1% compared to 2003.
72 COUNCIL FOR MEDICAL SCHEMES Annual Report 2004-5
R E V I E W O FO P E R A T I O N S
4
0
200
400
600
800
1 000
1 200
Administration Expenditure (R+S) Managed Care: Management Services
Broker Fees Nett Reinsurance Other Claims ratio
Rand PBPA
70
75
80
85
90
95
100
Claims ratio
95 96 97 98 99 2000 01 02 03 04
Figure 30: Real non-health expenditure per beneficiary, 2004 prices
0
100
200
300
400
500
600Rand PBPM
95 96 97 98 99 2000 01 02 03 04
Risk Contributions Risk BenefitsAdministration & Managed Care: Management Services Nett Surplus/(Deficit)
Figure 31: Contributions, benefits and non-health expenditure, 2004 prices

COUNCIL FOR MEDICAL SCHEMES Annual Report 2004-5 73
R E V I E W O FO P E R A T I O N S
4
Year Surplus/(Deficit) Net investment Net surplus/from operations and other income (deficit)
R’000 R’000 R’000 % Growth2000 (1 040 566) 1 230 398 189 832
2001 169 725 1 278 153 1 447 878 662,7
2002 1 098 795 1 366 273 2 465 068 70,3
2003 2 356 497 2 030 368 4 386 865 78,0
2004 2 761 092 2 243 551 5 004 643 14,1
Investments
Net investment and other income decreased
as a percentage of net surplus to 44,8% from
46,3%. The decrease has largely mirrored
changes in interest rates.
Figure 33 provides information on the
composition of investments of medical
schemes during 2004. In open schemes, a
greater proportion (67,1%) of investments
was held in cash and cash equivalents. Bonds
accounted for 21,5%, equities accounted for
5,9%, insurance policies for 3,7%, properties
for 1,2% and 0,6% for other investments.
Restricted schemes also held a larger propor-
tion of their investments, 63,4%, in cash and
cash equivalents. Bonds accounted for 12,7%,
equities and insurance policies made up
11,4% and 9,3%, respectively. Other invest-
ments and property accounted for smaller
proportions; each represented 2,0% and 1,3%
respectively of total investments made by
restricted schemes.
The primary obligation of a medical
scheme is to ensure that it has built up suffi-
cient assets to pay benefits due to members as
they fall due. Asset management must there-
fore be structured to the demands, nature and
timing of the expected liabilities of the
scheme. A medical scheme should spread its assets in such a manner that it
matches its liabilities and minimum accumulated funds at any point in time.
Hence, trustees need to monitor investments more closely to ensure not only
compliance with Annexure B, but also that appropriate diversification of risk is
achieved.
397 6891 170
237 218 190
1 448
2 465
4 3875 005
(234) (356)220
(739)(1 112) (1 041)
170
1 099
2 3562 761
(2 000)
(1 000)
0
1 000
2 000
3 000
4 000
5 000
6 000Rand Million
Operating Results Nett Surplus/(Deficit)
95 96 97 98 99 2000 01 02 03 04
Figure 32: Operating results
0
2
4
6
8
10
12Rand Billion
Cash and Cash Equivalents Bonds Equities
Properties Insurance Policies Other
Open Restricted
Figure 33: Composition of scheme investments
Table 16: Operating results for all schemes since introduction of the new Medical Schemes Act

Matching assets and liabilities
The difference between the schemes total assets and its total liabilities represents
the liquidity gap. A positive difference indicates that the scheme has sufficient
assets to meet its liabilities, while a negative one indicates illiquidity. However, it
is key to consider not only the total asset and liability position but also the peri-
ods within which liabilities must be paid and assets can be converted to cash
flows. This is where the financing risks must be matched.
Figure 34 compares the matching of assets and liabilities in open and restrict-
ed schemes. The current assets:current liabilities ratio for open schemes was 2,21,
and 2,88 for restricted schemes. The total asset:
total liability ratios were 2,76 and 4,17 for open
and restricted schemes respectively.
Medical schemes were required to imple-
ment accounting standard AC133, with a fur-
ther requirement during 2004 of preparing a
risk management report. This report assesses the
various risks that a medical scheme may be
exposed to over the short, medium and long
term, including the risk to liquidity.
The liquidity analyses were done for periods
up to 1 month; 1-3 months and 3-12 months.
The quality of the data was in some cases unre-
liable, with total figures in the liquidity reports
not reconciling to the balance sheet. This is dis-
appointing as these are supposedly audited figures. We observed the following
with regard to those schemes with a quick ratio (current assets: current liabilities)
below 2:
• Generally, these schemes held a high proportion of their total investments in
cash;
• For the period up to 3 months, some open schemes had low cash holding, low
claims paying ability yet had very high exposures to equity. This is a fairly risky
strategy, especially for schemes with no excess reserves. Restricted schemes gen-
erally had excess reserves and had low cash holdings, coupled with high expo-
sure to bonds and insurance policies. While the investment strategies were not
so conservative, this was buttressed by the existence of excess reserves;
• However, in those cases where the bulk of a medical scheme’s investments are
held through insurance policies, trustees must consider whether such policies
are suitable given the scheme’s financial position and short term nature of its
liabilities. In this regard, it is also important for trustees to ensure that the
investment mandate and policy of the scheme are not only compliant with the
requirements of Annexure B of the Act, but also allow for easy cashing in of
investments; and
• Similar trends were observed for period up to 1 year both restricted and open
schemes. Some schemes had low cash and near cash holdings and more expo-
sure to bonds and equity, and lower than average claims paying ability. In such
74 COUNCIL FOR MEDICAL SCHEMES Annual Report 2004-5
R E V I E W O FO P E R A T I O N S
4
0
2
4
6
8
10
12
14
16
18
Rand Billion
Current Assets Current Liabilities Total Assets Total Liabilities
Open Schemes Restricted Schemes
Figure 34: Matching of assets and liabilities

COUNCIL FOR MEDICAL SCHEMES Annual Report 2004-5 75
R E V I E W O FO P E R A T I O N S
4
cases, trustees must be mindful of the volatility and short-term performance of
equities, and the possible capital loss in the case of bond holdings. This is espe-
cially critical for the schemes sampled above, whose liquidity ratio was below
industry average of 2.
The principle of matching assets with liabilities is particularly important in the
context of liquidity. Trustees should guard against longer-term and riskier invest-
ment when the scheme’s liquidity is well below the industry average.
Net assets, accumulated funds and solvency
The required “minimum accumulated funds” established by Regulation 29 of the
Medical Schemes Act increased to 25% of gross contributions at year end
December 2004. These “minimum accumulated funds” are more commonly
referred to as the “reserves” of a scheme. When expressed as a percentage of gross
contributions they reflect the solvency level of the scheme.
Net assets, defined as total assets less total liabilities, rose 35,4% to R20,0bn in
2004 from R14,7bn in 2003 in respect of reg-
istered medical schemes. Reserves grew con-
comitantly by 34,5% to R18,5bn from
R13,7bn the year before.
The overall industry average solvency
increased as a result, to 36,6% as at December
2004 from 29,3% as at December 2003. This
level was more than the prescribed solvency
level of 25%. The solvency ratio of open
schemes was 27,9% compared with 20,9% in
2003. Restricted schemes continued their
high performance and achieved a solvency
ratio of 58% compared to 49,6% in 2003. On
an industry basis, restricted scheme members
have a higher average reserve position per
member than members of open schemes. Full
details of the solvency levels of the various
schemes are detailed in Annexure K and L.
Figures 35, 36 and 37 show the changes in
solvency for all schemes, open and restricted
schemes respectively, since the implementa-
tion of the new Medical Schemes Act. All three
figures reflect improvements in the solvency
ratios since 2000, with the overall ratio for all
registered schemes now exceeding the pre-
scribed minimum 25% level.
20.2 20.422.9
29.3
36.6
10.013.5
17.5
22.025.0
0
5
10
15
20
25
30
35
40Solvency ratio%
Prescribed Solvency Level Industry Average All
2000 01 02 03 04
Figure 35: Solvency position of all registered schemes
10.0 13.5
17.5
22.025.0
13.3 13.515.1
20.9
27.9
0
5
10
15
20
25
30
Solvency ratio%
Prescribed Solvency Level Industry Average Open
2000 01 02 03 04
Figure 36: Solvency trends since 2000 for open schemes

Table 17 shows, for open and
restricted schemes, the number of
members in the schemes that failed to
meet the prescribed solvency level
compared to the number of members
in schemes that attained the solvency
level. The relevant prescribed solvency
levels used in the table are 10%,
13,5%, 17,5%, 22% and 25% for
2000, 2001, 2002, 2003 and 2004
respectively.
76 COUNCIL FOR MEDICAL SCHEMES Annual Report 2004-5
R E V I E W O FO P E R A T I O N S
4
34.2 36.341.3
49.6
58.0
10.013.5
17.522.0
25.0
0
10
20
30
40
50
60
70
Solvency ratio%
Prescribed Solvency Level Industry Average Restricted
2000 01 02 03 04
Figure 37: Solvency trends since 2000 for restricted schemes
Table 17: Prescribed solvency levels and number of members Open schemes Restricted schemes
Below Above Below AbovePrescribed Level Prescribed Level
Number of medical schemes 2000 15 33 15 86
2001 19 29 11 83
2002 24 25 7 86
2003 19 29 7 80
2004 18 30 4 81
Membership 2000 2 385 051 (51%) 2 291 048 839 029 (41%) 1 214 412
2001 2 650 934 (56%) 2 117 142 576 462 (29%) 1 419 862
2002 3 519 329 (74%) 1 211 882 251 050 (13%) 1 731 873
2003 3 426 988 (73%) 1 291 809 222 430 (11%) 1 730 574
2004 2 534 273 (53%) 2 221 030 80 160 (4%) 1 827 100
Table 17 and figure 38 illustrates that, for open schemes, the greater part of mem-
bers (53%) were in the 18 schemes that failed to meet the prescribed solvency
level in 2004 when compared to the number of members in the 30 open schemes
that attained the prescribed solvency level of 25%. This figure is skewed consid-
erably by the results of Discovery Health medical scheme. Should this largest open
scheme be removed from the analysis, only 20% of the members will be in the
group below the prescribed solvency level compared to 53% before. It should also
be noted that Discovery has also increased its solvency to over 23%, just below the
required 25%. These findings show that today more members of these schemes
enjoy greater solvency protection than ever before.
Restricted schemes, on the other hand, had the majority (only 4 of the 85
restricted schemes were below 25%) of their members within those schemes that
met the prescribed solvency level.
The Council has also instituted an early-warning system on financial soundness
made up of quarterly returns and a review of monthly management accounts in some
instances. This early-warning system is intended to enable the Registrar and trustees

COUNCIL FOR MEDICAL SCHEMES Annual Report 2004-5 77
R E V I E W O FO P E R A T I O N S
4
to take proactive steps to resolve financial diffi-
culties when they occur. Table 18 compares sol-
vency levels reported in the 2004 final quarterly
returns with the solvency as reported in the audit-
ed statutory return as at December 2004. We also
compared these figures with budgeted estimates
provided as part of the quarterly returns. Overall,
there were no significant variations between the
quarterly and audited results on an industry wide
basis. At the level of individual schemes, material
changes were generally linked to adjustments
made in respect of provisions for outstanding
claims and provisions for impaired receivables. No. of MS – 2003 No. of MS – 2004 Membership – 2003 Membership – 2004
18
30
4
81
19
29
7
80
0
10
20
30
40
50
60
70
80
90No. of Medical Schemes
2 534 2 221
80
1 827
3 427
1 292
222
1 731
0
500
1 000
1 500
2 000
2 500
3 000
3 500
4 000ThousandsMembers
Below Above Below AbovePrescribed Level Prescribed Level Prescribed Level Prescribed Level
OPEN SCHEMES RESTRICTED SCHEMES
Figure 38: Prescribed solvency levels and number of members
Unaudited Audited Budget Audited Unaudited Audited vs AuditedActuals Actuals Actuals Actuals Unaudited vs Budget
2003 2003 % Variance 2004 2004 2004 % Variance % Variance
Open schemes 20,96% 20,88% -0,4% 25,30% 27,63% 27,94% 1,1% 10,4%
Restricted schemes 49,86% 49,57% -0,6% 50,97% 57,22% 57,95% 1,3% 13,7%
Total Registered schemes 29,40% 29,30% -0,4% 32,21% 36,17% 36,61% 1,2% 13,7%
Table 19: Comparison of selected indicatorsBudget Unaudited Audited Audited Audited
actuals actuals vs Budget vs Unaudited2004 2004 2004 % Variance % Variance
PAMPM PAMPM PAMPMOPEN SCHEMES
Gross Contributions R1 689 R1 607 R1 615 -4.4% 0.5%
Nett Claims Incurred R1 166 R1 087 R1 085 -7.0% -0.1%
Total Non-health Expenditure R248 R244 R249 -0.5% 2.0%
Nett claims ratio 77,09% 76,68% 76,19% -1.2% -0.6%
Non-health as a % of GCI 14,68% 15,20% 15,44% 5.2% 1.6%
Average Members 1 958 828 1 912 063 1 900 692 -3.0% -0.6%
RESTRICTED SCHEMES
Gross Contributions R1 791 R1 506 R1 530 -14.6% 1.6%
Nett Claims Incurred R1 448 R1 178 R1 187 -18.0% 0.8%
Total Non-health Expenditure R169 R150 R151 -10.4% 0.5%
Nett claims ratio 87,52% 84,87% 84,26% -3.7% -0.7%
Non-health as a % of GCI 9,41% 9,98% 9,87% 4.9% -1.1%
Average Members 680 064 812 825 801 044 17.8% -1.5%
Table 19 represents the budget estimates, the
quarterly and audited annual results. Monitoring
*PAMPM = per average member per month
Table 18: Solvency comparison between quarterly, audited annual and budget reports

Table 20 and figure 39 shows that, for schemes under close monitoring, solvency
improved by 35,4% during 2004. However, non-health expenditure per benefici-
ary was 10% higher than the industry average and benefits were below the indus-
try average. These schemes are in some cases only starting now to address the high
levels of non-health expenditure and increasing benefits to the open scheme
industry average.
In the case of the 12
schemes which were previous-
ly under close monitoring but
have now achieved the 25%
reserve level, average solvency
improved by 277,8% to
32,9% from 8,7% in 2000.
Non-health expenditure per
beneficiary was 9,4% lower
than the industry average
while benefits were 14%
below the industry average.
78 COUNCIL FOR MEDICAL SCHEMES Annual Report 2004-5
R E V I E W O FO P E R A T I O N S
4
the accuracy of the budgeting process is crucial in ensuring that a scheme remains
financially viable, and any variance should be closely investigated.
Solvency, claims and non-health expenditure
Table 20 and figure 39 depict the relationships between the solvency position,
gross claims ratio and gross non-health expenditure of open schemes since 2000.
The table shows the results of schemes that were below 25% as at December
2004, and under our close monitoring programme and those that attained 25%
after being on close monitoring. New schemes that are below their respective
required phase-in solvency levels and schemes that amalgamated during the five-
year period were removed from the group for the sake of comparison.
Table 20: Solvency, claims ratio and non-health expenditure in open schemes
Solvency ratio Claims ratio Non-health ratioIndustry Industry Industryaverage < 25% > 25% average < 25% > 25% average < 25% > 25%
2000 13,35% 7,62% 8,70% 87,88% 85,59% 90,46% 15,27% 17,84% 13,90%
2001 13,47% 7,73% 10,35% 82,35% 78,90% 84,37% 16,81% 19,84% 15,49%
2002 15,05% 10,74% 11,16% 81,20% 77,26% 84,15% 15,50% 17,58% 14,47%
2003 20,88% 15,53% 19,69% 77,91% 76,15% 77,78% 15,40% 17,09% 14,32%
2004 27,89% 21,03% 32,87% 77,24% 76,86% 74,17% 15,49% 16,12% 15,66%
0
5
10
15
20
25
30
35Claims ratio
05
15
25
35
45
55
65
75
85
95%Non-health & Solvency ratio%
2000 01 02 03 04
<25% Solvency Ratio >25% Solvency Ratio Industry Average Solvency Ratio
<25% Claims Ratio >25% Claims Ratio Industry Average Claims Ratio
<25% Non-health Ratio >25% Non-health Ratio Industry Average Non-health Ratio
Figure 39: Solvency, claims and non-health expenditure ratios in open schemes

COUNCIL FOR MEDICAL SCHEMES Annual Report 2004-5 79
R E V I E W O FO P E R A T I O N S
4
Figure 40 depicts the same rela-
tionships for restricted schemes and
shows that claims ratios in the
restricted schemes under close mon-
itoring are generally higher than that
of open schemes, although there has
been a tendency to reduce benefits
instead of non-health expenditure in
order to increase solvency. These
schemes should pay more attention
to reducing non-health expenditure,
which is currently still above the
restricted scheme industry average.
0
10
20
30
40
50
60Claims ratio
0
10
20
30
40
50
60
70
80
90
100%Non-health & Solvency ratio%
2000 01 02 03 04
<25% Solvency Ratio >25% Solvency Ratio Industry Average Solvency Ratio
<25% Claims Ratio >25% Claims Ratio Industry Average Claims Ratio
<25% Non-health Ratio >25% Non-health Ratio Industry Average Non-health Ratio
Figure 40: Solvency, claims and non-health in restricted schemes
Risk assessment framework, high impact medical schemes and solvency
The risk assessment regulatory framework that was adopted in 2003 has allowed
us to categorize schemes into three impact bands – low, medium and high – on
the basis of the systemic impact that a scheme’s failure might have on Council’s
goals and the industry.
Table 21 below shows the solvency position of the 25 schemes categorised as
high impact. Three (3) high impact schemes had solvency below 15% (2003: 5);
five showed solvency between 15% and 22% (2003: 7); while the remaining 17
schemes were above the 25% prescribed solvency (2003: 13).
Claims paying ability of medical schemes
A scheme’s financial soundness is also measured by its ability to pay claims from
cash and cash equivalents in the immediate future. Figure 41 depicts the claims
paying ability of schemes measured in months of cover. This is the number of
months’ claims that the scheme is able to cover from its existing cash and cash
equivalents. The cash coverage improved by 35,7% to 5,7 from 4,2 months in
2004, implying that schemes in general have improved their claims paying abili-
ty.
Schemes’ payment cycles reflect a similar trend of 22,9 days compared to the 22,4
Table 21: High-impact schemes per typeType of Average Contributions Gross Gross Solvency scheme beneficiaries PABPM claims ratio non-health ratio ratio
2004 2003 2004 2003 2004 2003 2004 2003 2004 2003Open 4 040 067 4 022 084 R662 R616 77,19% 77,69% 15,23% 15,35% 26,95% 19,52%
Restricted 870 035 861 658 R621 R585 85,52% 82,17% 9,77% 10,26% 49,26% 42,43%
Total 4 910 102 4 883 742 R654 R610 78,59% 78,45% 14,31% 14,49% 30,78% 23,49%
*PABPM = per average beneficiary per month

80 COUNCIL FOR MEDICAL SCHEMES Annual Report 2004-5
R E V I E W O FO P E R A T I O N S
4
days in 2003. The provision for
outstanding claims, in terms of
months’ coverage, has
improved from 0,9 month to
0,8 months. The reduction in
the provision for unpaid claims
reflects an improvement in
schemes ability to pay claims
more timely. Details of individ-
ual scheme’s claims paying
ability are outlined in
Annexure N.
Medical schemes benefit options during 2004
There were 420 (2003: 415) benefit options in registered medical schemes during
2004. Open schemes accounted for 260 (61,9% ) of benefit options (2003: 253
options or 61,0%). Restricted membership schemes had 160 (38,1%) of all regis-
tered options (2003: 162 options or 39,0%). Open schemes had, on average, 5,4
options per scheme with an average membership of 7 400 per option. Restricted
schemes had an average of 1,9 options per schemes with an average membership
*GCI pbpm = Gross contribution income per beneficiary per month
*PMPM = per member per month
Table 22: Benefit options for open and restricted schemesOpen Restricted
schemes schemes TotalAll benefit options
Number of options 260 (61,9%) 160 (38,1%) 420 (100%)
Membership representing 1 924 343 (70,9%) 791 921 (29,1%) 2 716 264 (100%)
Number of Schemes 48 (36,1%) 85 (63,9%) 133 (100%)
Surplus from operations pmpm R89,88 R69,76 R84,01
Average GCI pbpm R642,42 R630,50 R639,02
Options with members > 2 500 42,3% 45,6% 43,6%
Number of options 110 (60,1%) 73 (39,9%) 183 (100%)
Membership representing 1 800 525 (71,8%) 706 145 (28,2%) 2 506 670 (100%)
Number of Schemes 38 (41,3%) 54 (58,7%) 92 (100%)
Surplus from operations pmpm R95,82 R68,64 R88,16
Average GCI pbpm R638,12 R628,52 R635,47
Options with members < 2 500 57,7% 54,4% 56,4%
Number of options 150 (63,3%) 87 (36,7%) 237 (100%)
Membership representing 123 818 (59,1%) 85 776 (40,9%) 209 594 (100%)
Number of Schemes 42 (43,8%) 54 (56,2%) 96 (100%)
Surplus from operations pmpm R3,46 R79,01 R34,38
Average GCI pbpm R710,77 R647,49 R684,57
0
5
10
15
20
25
30
35
40
45
Rand Million
2.0
2.6
3.5
4.2
5.7
0
1
2
3
4
5
6
Months covering
Cash and Cash Equivalents Gross Claims Incurred Months Covering
2000 01 02 03 04
Figure 41: Average gross claims covered by cash and cash equivalents

COUNCIL FOR MEDICAL SCHEMES Annual Report 2004-5 81
R E V I E W O FO P E R A T I O N S
4
of 4 950 per option.
The number of benefit options with fewer than 2 500 members increased to
56,4% (237 options in 2004) from 55,4% (230) the year before. There were 150
(57,7%) open schemes benefit options with less than 2 500 members and 87
(54,4%) restricted schemes options with less than 2 500 members.
One hundred (42,2%) of options with less than 2,500 members incurred oper-
ating losses in 2004 compared with 74 options (32,2%) in 2003.
The remaining 183 options (2003:185) had more than 2 500 members per
option - averaging 13 698 members per option. Of these, 70 options representing
38,3% incurred operating losses (2003: 56 options representing 30,3%).
It would thus appear that options with less than 2 500 members are more like-
ly to incur operating losses. They also have higher contributions and attract high-
er administration costs than other options.
Open Restrictedschemes schemes Total
Loss making options
Representing of total options 43,9% 35,0% 40,5%
Number of options 114 (67,1%) 56 (32,9%) 170 (100%)
Membership representing 522 474 (67,3%) 253 458 (32,7%) 775 932 (100%)
Number of schemes 42 (54,6%) 35 (45,4%) 77 (100%)
Deficit from operations pmpm (R126,05) (R95,91) (R116,20)
Average GCI pbpm R773,90 R648,66 R734,84
Loss making options with member < 2 500
Number of options 69 (69,0%) 31 (31,0%) 100 (100%)
Membership representing 52 810 (67,5%) 25 453 (32,5%) 78 263 (100%)
Number of schemes 34 (61,8%) 21 (38,2%) 55 (100%)
Deficit from operations pmpm (R193,87) (R206,28) (R197,91)
Average GCI pbpm R854,61 R727,53 R812,38
Loss making options with member > 2 500
Number of options 45 (64,3%) 25 (35,7%) 70 (100%)
Membership representing 469 664 (67,3%) 228 005 (32,7%) 697 669 (100%)
Number of schemes 27 (61,4%) 17 (38,6%) 44 (100%)
Deficit from operations pmpm (R118,42) (R83,59) (R107,04)
Average GCI pbpm R765,51 R639,56 R726,51
Table 23: Results of loss-making options
*GCI pbpm = Gross contribution income per beneficiary per month*PMPM = per member per month
Of the 420 benefit options within registered schemes during 2004, 170 (40,5%)
incurred operating losses. 114 (67,1%) of the loss making options were in open
schemes and 56 (32,9%) were in restricted membership schemes. The options with
less than 2,500 members realised an average R198 pmpm operating loss. Those
with more than 2 500 members made an average operating loss of R107 pmpm, or
a loss 1,85 times lower than the former options.
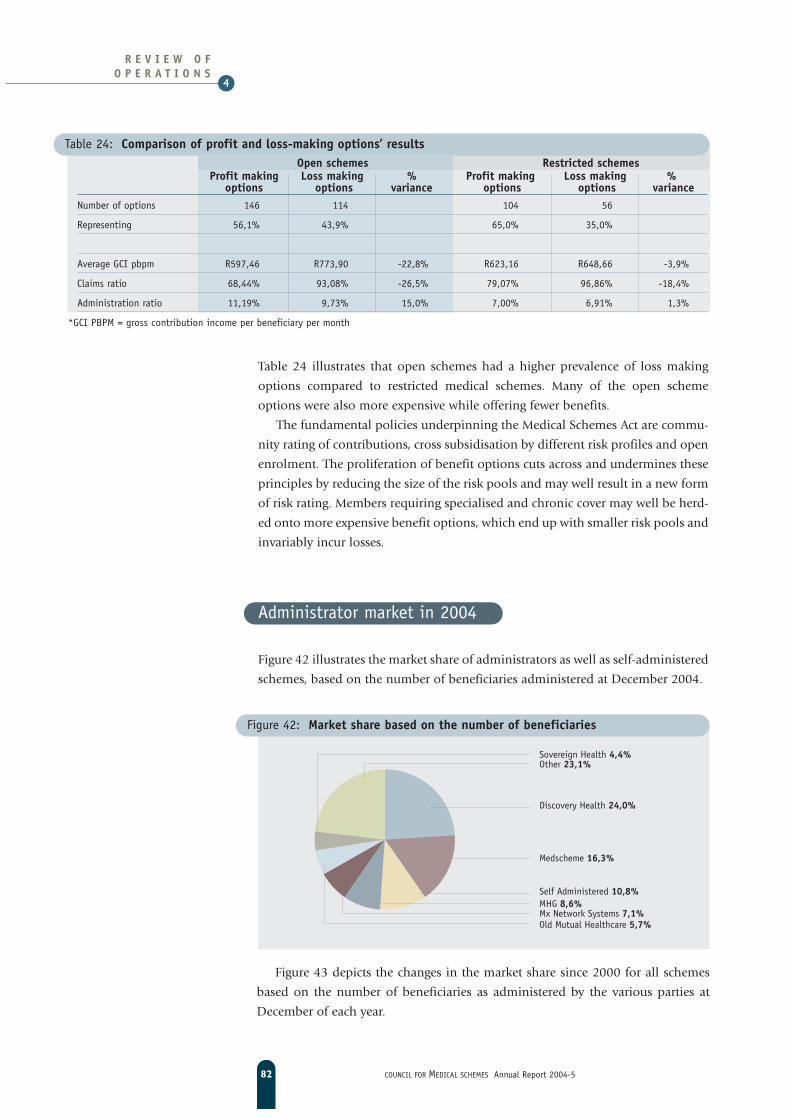
82 COUNCIL FOR MEDICAL SCHEMES Annual Report 2004-5
R E V I E W O FO P E R A T I O N S
4
Open schemes Restricted schemesProfit making Loss making % Profit making Loss making %
options options variance options options varianceNumber of options 146 114 104 56
Representing 56,1% 43,9% 65,0% 35,0%
Average GCI pbpm R597,46 R773,90 -22,8% R623,16 R648,66 -3,9%
Claims ratio 68,44% 93,08% -26,5% 79,07% 96,86% -18,4%
Administration ratio 11,19% 9,73% 15,0% 7,00% 6,91% 1,3%
*GCI PBPM = gross contribution income per beneficiary per month
Table 24: Comparison of profit and loss-making options’ results
Table 24 illustrates that open schemes had a higher prevalence of loss making
options compared to restricted medical schemes. Many of the open scheme
options were also more expensive while offering fewer benefits.
The fundamental policies underpinning the Medical Schemes Act are commu-
nity rating of contributions, cross subsidisation by different risk profiles and open
enrolment. The proliferation of benefit options cuts across and undermines these
principles by reducing the size of the risk pools and may well result in a new form
of risk rating. Members requiring specialised and chronic cover may well be herd-
ed onto more expensive benefit options, which end up with smaller risk pools and
invariably incur losses.
Administrator market in 2004
Figure 42 illustrates the market share of administrators as well as self-administered
schemes, based on the number of beneficiaries administered at December 2004.
Figure 43 depicts the changes in the market share since 2000 for all schemes
based on the number of beneficiaries as administered by the various parties at
December of each year.
Sovereign Health 4,4%Other 23,1%
Discovery Health 24,0%
Medscheme 16,3%
Self Administered 10,8%MHG 8,6%Mx Network Systems 7,1%Old Mutual Healthcare 5,7%
Figure 42: Market share based on the number of beneficiaries

COUNCIL FOR MEDICAL SCHEMES Annual Report 2004-5 83
R E V I E W O FO P E R A T I O N S
4
The market is dominated by five large
administrators who, together, hold
66% of the market. Sovereign Health
was owned by Medscheme Holdings at
end of the year under review.
Figures 44 and 45 indicate the
change in market shares for the five
largest administrators based on benefi-
ciaries of open and restricted schemes,
respectively. Discovery Pty (Ltd) has
increased its share of the open scheme
market to 30% in 2004 from 15% in
2000. The large drop in market share of
Medscheme in the restricted market in
2002 was due to the movement of one
scheme.
0
5
10
15
20
25
30
35
2000 2001 2002 2003 2004
Market share%
Discovery Medscheme Self MHG Mx Old Sovereign OtherHealth Administered Network Mutual Health
Systems Healthcare
Figure 43: Market share of all administrators based on the number of beneficiaries
2000 2001 2002 2003 2004 Open
%0 3 6 9 12 15 18 21 24 27 30 33 36 39 42 45
Other
MHG
Sovereign Health
Self Administered
Medscheme
Discovery Health
Figure 44: Market share of five largest administrators in the open schemes market
%0 3 6 9 12 15 18 21 24 27 30 33 36 39 42 45
2000 2001 2002 2003 2004 Restricted
Other
MHG
Sovereign Health
Self Administered
Medscheme
Discovery Health
Figure 45: Market share of five largest administrators in the restricted schemes market

84 COUNCIL FOR MEDICAL SCHEMES Annual Report 2004-5
R E V I E W O FO P E R A T I O N S
4
Despite the concentration of market power in the large administrators, there
appears to be little or no economies of scale reflected in the level of administra-
tion fees. Administration fees paid by open schemes to the five largest adminis-
trators were between 20% and 40% higher than the average for open scheme mar-
ket. Fees paid by restricted schemes were 30% to 50% higher than the market aver-
Name of Administrator No Beneficiaries Gross Fees paid to Gross Riskof Administration administrators Contributions Claims
Schemes Costs RatioMarket As % As %Share PABPM of GCI PABPM of GCI PABPM
2004 2004 2004 2004 2004 2004 2004 2004% R % % R %
Discovery Health (Pty) Ltd 1 32,02% 84,72 11,84% 68,78 9,62% 715,26 68,67%
Medscheme (Pty) Ltd 4 18,77% 51,99 8,68% 39,09 6,53% 598,97 78,75%
Self administered 7 10,16% 65,65 7,77% - 0,00% 845,29 86,26%
Old Mutual Healthcare (Pty) Ltd 4 5,09% 61,68 11,85% 50,97 9,79% 520,47 83,98%
Exclusive Health (Pty) Ltd 1 4,63% 89,51 17,17% 56,90 10,91% 521,42 58,26%
Sovereign Health -
Division of Medscheme Holdings 4 4,22% 62,02 8,40% 54,23 7,35% 738,28 81,55%
Allcare Administrators (Pty) Ltd 3 3,86% 58,43 12,43% 50,23 10,69% 469,92 82,03%
Rowan Angel (Pty) Ltd 1 3,74% 54,25 11,13% 46,82 9,61% 487,37 68,16%
Sizwe Medical Services (Pty) Ltd 1 3,32% 66,29 10,50% 53,53 8,48% 631,30 70,10%
Multimed 1 2,48% 63,24 8,77% 46,77 6,48% 721,35 87,43%
Sigma Health Fund Managers (Pty) Ltd 1 2,48% 57,80 9,48% 30,72 5,04% 609,92 92,50%
Metropolitan Health Corporate (Pty) Ltd 2 1,92% 74,86 10,96% 39,99 5,85% 683,34 88,40%
Medical Aid Administration Experts (Pty)Ltd 1 1,43% 123,91 25,94% 49,84 10,43% 477,76 54,97%
Amanzi Health Administrators (Pty) Ltd 1 1,32% 63,40 9,92% 50,14 7,84% 639,30 91,86%
Status Medical Aid Administrators (Pty) Ltd 5 1,27% 73,66 10,54% 65,00 9,30% 699,14 82,92%
Prosperity Health Corporate Fund
Managers (Pty)Ltd 2 0,87% 63,48 16,62% 43,40 11,36% 381,94 79,04%
African Life Health (Pty) Ltd 1 0,64% 52,24 14,21% 23,85 6,49% 367,51 75,72%
Definiti Medical Fund Managers (Pty) Ltd 1 0,48% 62,61 16,39% 54,44 14,25% 381,90 74,64%
Private Health Administrators 1 0,38% 99,00 15,88% 57,60 9,24% 623,54 79,94%
Hall Adminstrator cc 1 0,32% 114,88 25,12% 74,95 16,39% 457,38 63,48%
Integrated Healthcare (Pty) Ltd 1 0,27% 41,13 8,83% 36,71 7,88% 465,60 72,64%
Benmed Medical Scheme
Administrators (Pty) Ltd 1 0,15% 92,81 15,66% 58,19 9,82% 592,47 69,93%
Supreme Health Administrators (Pty) Ltd 1 0,08% 8,12 12,96% 7,85 12,54% 62,64 96,04%
Thebe ya Bophelo Healthcare Administration 1 0,06% 39,78 13,76% 31,80 11,01% 288,97 61,87%
Mx Network Systems (Pty) Ltd 1 0,05% 106,34 26,07% 18,66 4,57% 407,91 59,94%
Active Health 1 0,01% 37,95 10,11% 24,59 6,55% 375,28 85,13%
Average 70,17 10,79% 48,70 7,49% 650,57 76,19%
Table 25: Administrator market share since 2000 based number of beneficiaries – open schemes

COUNCIL FOR MEDICAL SCHEMES Annual Report 2004-5 85
R E V I E W O FO P E R A T I O N S
4
age for restricted schemes.
The open scheme market has shown a significant swing from self-administra-
tion to the large third party administrators, while restricted schemes have not seen
the same movement from self administered towards the large third party admin-
istrators.
Tables 25 and 26 illustrates the market share based on the number of benefi-
ciaries to whom services are being delivered by third party administrators as well
as those beneficiaries of self administered schemes, and the average cost of admin-
istration. Gross administration costs comprise administration costs charged both
to the risk pool and to the savings accounts. The administration fee includes co-
administration fees as well. It should also be noted that although Sovereign
Health was a division of Medscheme, its results have been disclosed separately.
Table 26: Administrator market share since 2000 based number of beneficiaries – restricted schemesName of Administrator No Beneficiaries Gross Fees paid to Gross Risk
of Administration administrators Contributions ClaimsSchemes Costs Ratio
Market As % As %Share PABPM of GCI PABPM of GCI PABPM
2004 2004 2004 2004 2004 2004 2004 2004% R % % R %
Metropolitan Health Corporate (Pty) Ltd 14 24,97% 45,19 7,17% 35,67 5,66% 630,67 88,22%
Mx Network Systems (Pty) Ltd 2 24,38% 36,52 5,93% 31,23 5,07% 616,07 80,31%
Self administered 13 12,33% 36,52 6,47% 0,97 0,17% 564,26 85,88%
Medscheme (Pty) Ltd 18 10,19% 41,60 5,61% 33,84 4,57% 740,92 82,50%
Old Mutual Healthcare (Pty) Ltd 9 7,25% 38,01 6,59% 43,50 7,54% 577,15 95,19%
Sovereign Health -Division of
Medscheme Holdings 7 4,80% 58,33 7,84% 51,06 6,86% 743,91 80,03%
Discovery Health (Pty) Ltd 8 4,39% 55,63 9,72% 46,61 8,14% 572,48 84,02%
PPS Insurance Co Ltd 1 3,63% 63,68 10,85% 54,86 9,34% 587,16 74,79%
Providence Healthcare Risk Managers (Pty) Ltd 2 1,91% 54,74 8,43% 46,71 7,19% 649,38 70,25%
Eternity Private Health (Pty) Ltd 1 1,73% 93,85 11,41% 82,28 10,01% 822,22 82,24%
Allcare Administrators (Pty) Ltd 5 1,63% 64,51 9,48% 57,37 8,43% 680,69 95,07%
Status Medical Aid Administrators (Pty) Ltd 4 1,53% 42,39 6,82% 35,43 5,71% 621,09 88,05%
Mpumalanga Managed Health Care (Pty) Ltd 1 0,78% 34,93 4,71% - 0,00% 741,68 89,85%
Amanzi Health Administrators (Pty) Ltd 1 0,36% 78,06 11,88% 65,63 9,99% 657,14 85,52%
Integrated Healthcare (Pty) Ltd 1 0,10% 64,96 9,43% 57,86 8,40% 689,16 69,64%
Average 44,24 6,99% 33,83 5,34% 632,94 84,26%

86 COUNCIL FOR MEDICAL SCHEMES Annual Report 2004-5
R E V I E W O FO P E R A T I O N S
4

COUNCIL FOR MEDICAL SCHEMES Annual Report 2004-5 87
ANNEXURE A5
Compliancewith submission of audited financial statementsand statutory returns
Section 37 of the Act requires that every medical scheme submit to the Registrar its
audited annual financial statements and statutory returns by 30 April in respect of
its financial year. A number of faulty or incomplete returns have once again
delayed the processing of the data. Better co-operation from the schemes in this
regard will be appreciated.
The following medical schemes submitted their documentation after the deadline
required by the Act. Section 66(3) requires that penalties be imposed on such
schemes unless good cause can be shown for the late submission of the returns.
1. Baymed (auditor’s management report + investment schedule)
2. Bestmed (auditor’s management report)
3. Bonitas (auditor’s management report + BOT report)
4. Commed (all required returns)
5. Eclipse (auditor’s management report)
6. Free State (auditor’s management report)
7. Hosmed (all required returns)
8. Ingwe (auditor’s management report)
9. Liberty (all required returns)
10. Lifemed (all required returns)
11. Munimed (all required returns)
12. Protector (all required returns)
13. Thebemed (AFS, BOT report & auditor’s management report)
14. ABI (auditor’s management report)
15. AECI (auditor’s management report)
16. Aranda (all required returns)
17. CAMAF (all required returns)
18. Mascom (auditor’s management report)
19. Moremed (all required returns)
20. Naspers (all required returns)
21. Old Mutual Staff (BoT Report)
22. Parmed (auditor’s management report)
23. Profmed (auditor’s management report)
24. Randwater (all required returns)
25. Polmed (auditor’s management report)
26. Transmed (auditor’s management report)
27. Umed (auditor’s management report)
28. Umvuzo (auditor’s management report)
29. Polprismed (all required returns)

88 COUNCIL FOR MEDICAL SCHEMES Annual Report 2004-5
ANNEXURE A5
The following schemes’ financial statements and/or returns were initially rejected
in terms of Section 38. The necessary changes have been made by the schemes and
revised financial statements have been submitted.
Ref no. Name1589 Baymed
1121 Klerksdorp Medical Benefit Society (KDM)
1214 Old Mutual Staff Medical Aid Scheme
1587 Pathfinder Medical Scheme
1454 Pro Sano Medical Scheme
1196 Protea Medical Aid Society
1575 Resolution Health Medical Scheme
1531 Sedmed
1544 Tiger Brands Medical Scheme
1582 Transmed Medical Fund
The following schemes’ financial statements and/or returns were rejected. The
necessary changes have been made in accordance with the Registrar’s interpreta-
tion of the events. The revised financial statements have not yet been resubmitted
by the schemes at time of printing.
Ref no. Name1170 NBC Medical Scheme
1158 Cawmed Medical Scheme
1561 Gen-Health Medical Scheme
1149 Medihelp
1557 Samancor Health Plan
1147 Telemed
1486 Sizwe Medical Fund
1565 Venda Police and Prisons Medical Scheme (Polprismed)

COUNCIL FOR MEDICAL SCHEMES Annual Report 2004-5 89
ANNEXURE B5
Composition of the Council during 2004-5
The composition of Council was as follows during the year under review:
Chairperson
Dr Nicky Padayachee, Formerly Dean of the Faculty of Health Sciences,
University of Cape Town.
Deputy Chairperson
Ms. Gando Matyumza, General Manager, Eskom KZN.
Dr. Siva Pillay, Medical Practitioner in Uitenhage, Eastern Cape
until 30 July 2004.
Professor Heather McLeod, Associate Professor of Actuarial Science, University
of Cape Town
Dr. Reno Morar, Director, Cape Clothing Benefit Fund
Dr. Kamy Chetty, Deputy-Director-General, National Department of
Health.
Dr. Jakes Jekwa, Medical Practitioner, East London
Mr. Barry Crookes, Formerly CEO of Old Mutual Employee Benefits
division, Retired Actuary
Mr. Boissie Mbha, Attorney in private practice and Acting Judge of the
High Court – until May 2004.
Ms. Nomonde Mgumane, Senior Consultant in mediation and arbitration.
Mr John Murphy, Acting Judge of the Labour Court and former
Pension Funds Adjudicator
Dr. MS Kariem, Chief Operations Officer, Groote Schuur Hospital,
University of Cape Town
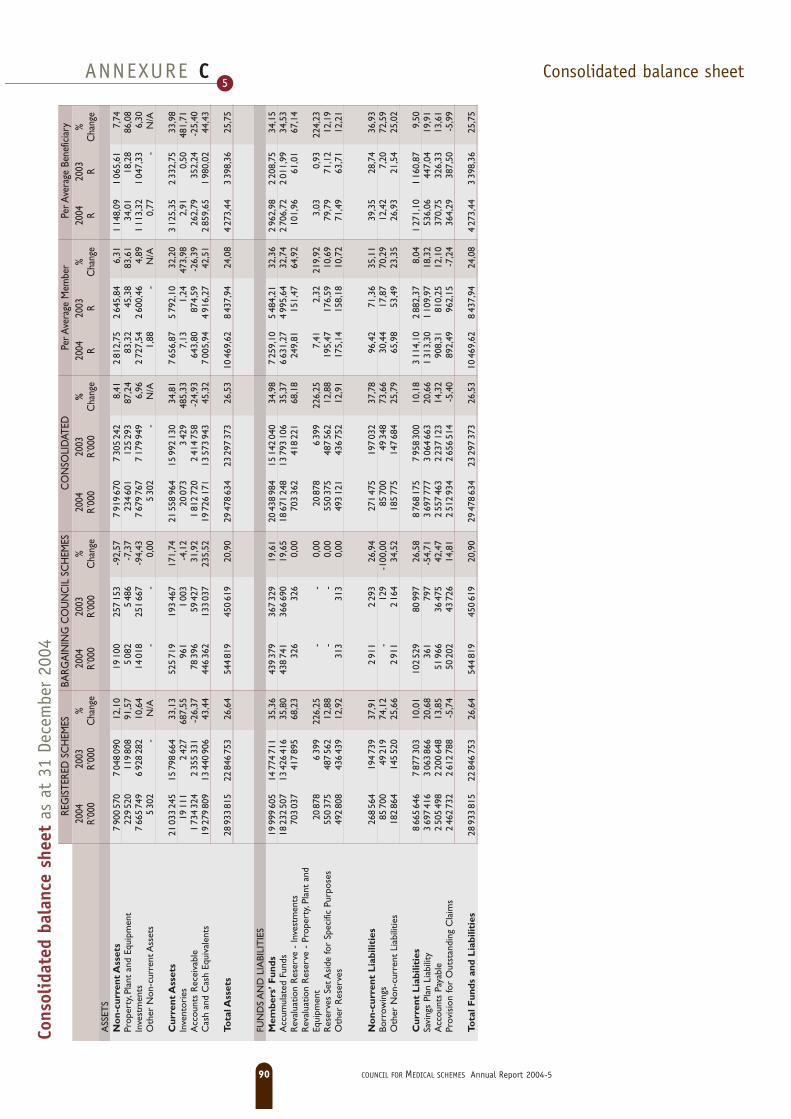
REG
ISTE
RED
SC
HEM
ESBA
RGA
ININ
G C
OU
NC
IL S
CH
EMES
CO
NSO
LID
ATED
Per A
vera
ge M
embe
rPe
r Ave
rage
Ben
efic
iary
2004
2003
%20
0420
03%
2004
2003
%20
0420
03%
2004
2003
%
R’00
0R’
000
Cha
nge
R’00
0R’
000
Cha
nge
R’00
0R’
000
Cha
nge
RR
Cha
nge
RR
Cha
nge
ASS
ETS
No
n-cu
rren
t A
sset
s7
900
570
704
809
012
,10
1910
025
715
3-9
2,57
791
967
07
305
242
8,41
281
2,75
264
5,84
6,31
114
8,09
106
5,61
7,74
Prop
erty
,Pla
nt a
nd E
quip
men
t22
952
011
980
891
,57
508
25
486
-7,3
723
460
112
529
387
,24
83,3
245
,38
83,6
134
,01
18,2
886
,08
Inve
stm
ents
766
574
96
928
282
10,6
414
018
251
667
-94,
437
679
767
717
994
96,
962
727,
542
600,
464,
891
113,
321
047,
336,
30O
ther
Non
-cur
rent
Ass
ets
530
2-
N/A
--
0,00
530
2-
N/A
1,88
-N
/A0,
77-
N/A
Cur
rent
Ass
ets
2103
324
515
798
664
33,1
352
571
919
346
717
1,74
2155
896
415
992
130
34,8
17
656,
875
792,
1032
,20
312
5,35
233
2,75
33,9
8In
vent
orie
s19
111
242
768
7,55
961
100
3-4
,12
2007
33
429
485,
337,
131,
2447
3,98
2,91
0,50
481,
71A
ccou
nts
Rec
eiva
ble
173
432
42
355
331
-26,
3778
396
5942
731
,92
181
272
02
414
758
-24,
9364
3,80
874,
59-2
6,39
262,
7935
2,24
-25,
40C
ash
and
Cas
h Eq
uiva
lent
s19
279
809
1344
090
643
,44
446
362
133
037
235,
5219
726
171
1357
394
345
,32
700
5,94
491
6,27
42,5
12
859,
651
980,
0244
,43
Tota
l Ass
ets
2893
381
522
846
753
26,6
454
481
945
061
920
,90
2947
863
423
297
373
26,5
310
469,
628
437,
9424
,08
427
3,44
339
8,36
25,7
5
FUN
DS
AN
D L
IABI
LIT
IES
Mem
bers
’ Fun
ds19
999
605
1477
471
135
,36
439
379
367
329
19,6
120
438
984
1514
204
034
,98
725
9,10
548
4,21
32,3
62
962,
982
208,
7534
,15
Acc
umul
ated
Fun
ds18
232
507
1342
641
635
,80
438
741
366
690
19,6
518
671
248
1379
310
635
,37
663
1,27
499
5,64
32,7
42
706,
722
011,
9934
,53
Rev
alua
tion
Res
erve
- In
vest
men
ts70
303
741
789
568
,23
326
326
0,00
703
362
418
221
68,1
824
9,81
151,
4764
,92
101,
9661
,01
67,1
4R
eval
uatio
n R
eser
ve -
Pro
pert
y,Pl
ant
and
Equi
pmen
t20
878
639
922
6,25
--
0,00
2087
86
399
226,
257,
412,
3221
9,92
3,03
0,93
224,
23R
eser
ves
Set A
side
for
Spec
ific
Purp
oses
550
375
487
562
12,8
8-
-0,
0055
037
548
756
212
,88
195,
4717
6,59
10,6
979
,79
71,1
212
,19
Oth
er R
eser
ves
492
808
436
439
12,9
231
331
30,
0049
312
143
675
212
,91
175,
1415
8,18
10,7
271
,49
63,7
112
,21
No
n-cu
rren
t L
iabi
litie
s26
856
419
473
937
,91
291
12
293
26,9
427
147
519
703
237
,78
96,4
271
,36
35,1
139
,35
28,7
436
,93
Borr
owin
gs85
700
4921
974
,12
-12
9-1
00,0
085
700
4934
873
,66
30,4
417
,87
70,2
912
,42
7,20
72,5
9O
ther
Non
-cur
rent
Lia
bilit
ies
182
864
145
520
25,6
62
911
216
434
,52
185
775
147
684
25,7
965
,98
53,4
923
,35
26,9
321
,54
25,0
2
Cur
rent
Lia
bilit
ies
866
564
67
877
303
10,0
110
252
980
997
26,5
88
768
175
795
830
010
,18
311
4,10
288
2,37
8,04
127
1,10
116
0,87
9,50
Savi
ngs
Plan
Lia
bilit
y3
697
416
306
386
620
,68
361
797
-54,
713
697
777
306
466
320
,66
131
3,30
110
9,97
18,3
253
6,06
447,
0419
,91
Acc
ount
s Pa
yabl
e2
505
498
220
064
813
,85
5196
636
475
42,4
72
557
463
223
712
314
,32
908,
3181
0,25
12,1
037
0,75
326,
3313
,61
Prov
isio
n fo
r O
utst
andi
ng C
laim
s2
462
732
261
278
8-5
,74
5020
243
726
14,8
12
512
934
265
651
4-5
,40
892,
4996
2,15
-7,2
436
4,29
387,
50-5
,99
Tota
l Fun
ds a
nd L
iabi
litie
s28
933
815
2284
675
326
,64
544
819
450
619
20,9
029
478
634
2329
737
326
,53
1046
9,62
843
7,94
24,0
84
273,
443
398,
3625
,75
90 COUNCIL FOR MEDICAL SCHEMES Annual Report 2004-5
ANNEXURE C5
Cons
olid
ated
bal
ance
she
etas
at
31 D
ecem
ber
2004
Consolidated balance sheet
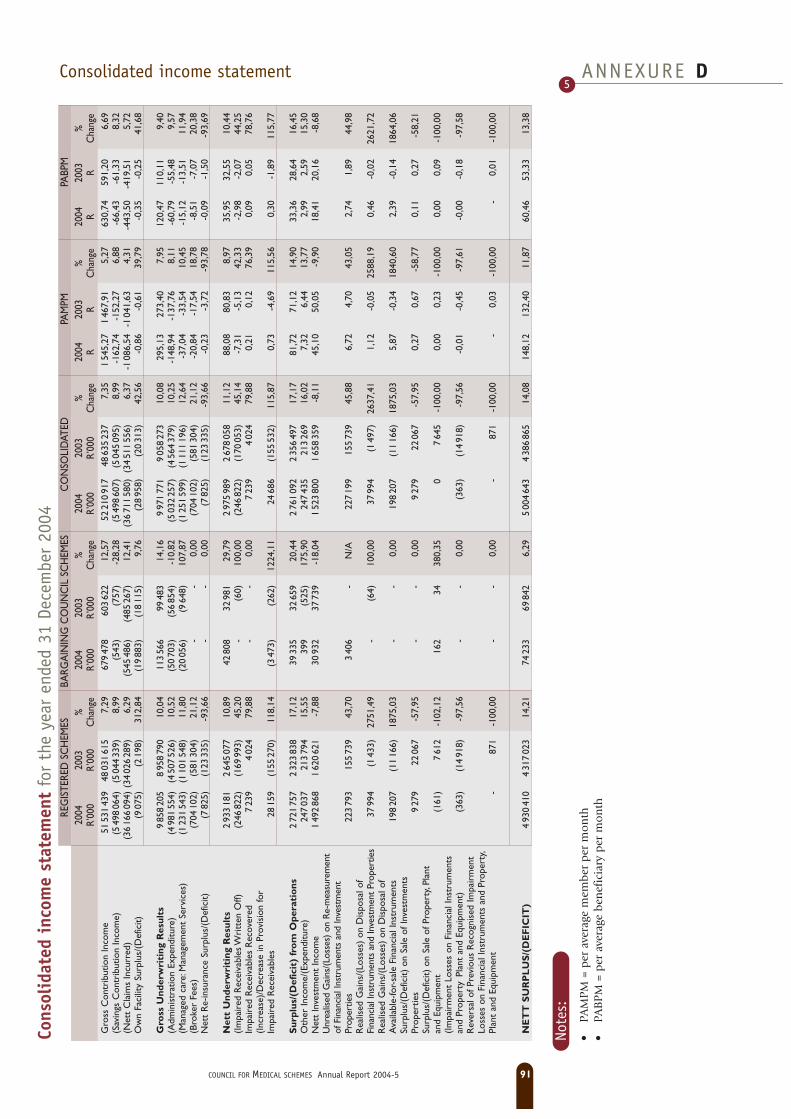
Note
s:•
PAM
PM
= p
er a
vera
ge m
emb
er p
er m
on
th•
PAB
PM
= p
er a
vera
ge b
enef
icia
ry p
er m
on
th
REG
ISTE
RED
SC
HEM
ESBA
RGA
ININ
G C
OU
NC
IL S
CH
EMES
CO
NSO
LID
ATED
PAM
PMPA
BPM
2004
2003
%20
0420
03%
2004
2003
%20
0420
03%
2004
2003
%R’
000
R’00
0C
hang
eR’
000
R’00
0C
hang
eR’
000
R’00
0C
hang
eR
RC
hang
eR
RC
hang
eG
ross
Con
trib
utio
n In
com
e51
531
439
4803
161
57,
2967
947
860
362
212
,57
5221
091
748
635
237
7,35
154
5,27
146
7,91
5,27
630,
7459
1,20
6,69
(Sav
ings
Con
trib
utio
n In
com
e)(5
498
064)
(504
433
9)8,
99(5
43)
(757
)-2
8,28
(549
860
7)(5
045
095)
8,99
-162
,74
-152
,27
6,88
-66,
43-6
1,33
8,32
(Net
t C
laim
s In
curr
ed)
(36
166
094)
(34
026
289)
6,29
(545
486)
(485
267)
12,4
1(3
671
158
0)(3
451
155
6)6,
37-1
086,
54-1
041,
634,
31-4
43,5
0-4
19,5
15,
72O
wn
Faci
lity
Surp
lus/
(Def
icit)
(907
5)(2
198)
312,
84(1
988
3)(1
811
5)9,
76(2
895
8)(2
031
3)42
,56
-0,8
6-0
,61
39,7
9-0
,35
-0,2
541
,68
Gro
ss U
nder
wri
ting
Res
ults
985
820
58
958
790
10,0
411
356
699
483
14,1
69
971
771
905
827
310
,08
295,
1327
3,40
7,95
120,
4711
0,11
9,40
(Adm
inis
trat
ion
Expe
nditu
re)
(498
155
4)(4
507
526)
10,5
2(5
070
3)(5
685
4)-1
0,82
(503
225
7)(4
564
379)
10,2
5-1
48,9
4-1
37,7
68,
11-6
0,79
-55,
489,
57(M
anag
ed c
are:
Man
agem
ent
Serv
ices
)(1
231
543)
(110
154
8)11
,80
(20
056)
(964
8)10
7,87
(125
159
9)(1
111
196)
12,6
4-3
7,04
-33,
5410
,45
-15,
12-1
3,51
11,9
4(B
roke
r Fe
es)
(704
102)
(581
304)
21,1
2-
-0,
00(7
0410
2)(5
8130
4)21
,12
-20,
84-1
7,54
18,7
8-8
,51
-7,0
720
,38
Net
t R
e-in
sura
nce
Surp
lus/
(Def
icit)
(782
5)(1
2333
5)-9
3,66
--
0,00
(782
5)(1
2333
5)-9
3,66
-0,2
3-3
,72
-93,
78-0
,09
-1,5
0-9
3,69
Net
t U
nder
wri
ting
Res
ults
293
318
12
645
077
10,8
942
808
3298
129
,79
297
598
92
678
058
11,1
288
,08
80,8
38,
9735
,95
32,5
510
,44
(Impa
ired
Rec
eiva
bles
Wri
tten
Off)
(246
822)
(169
993)
45,2
0-
(60)
100,
00(2
4682
2)(1
7005
3)45
,14
-7,3
1-5
,13
42,3
3-2
,98
-2,0
744
,25
Impa
ired
Rec
eiva
bles
Rec
over
ed7
239
402
479
,88
--
0,00
723
94
024
79,8
80,
210,
1276
,39
0,09
0,05
78,7
6(In
crea
se)/
Dec
reas
e in
Pro
visi
on fo
r Im
pair
ed R
ecei
vabl
es28
159
(155
270)
118,
14(3
473)
(262
)12
24,1
124
686
(155
532)
115,
870,
73-4
,69
115,
560,
30-1
,89
115,
77
Sur
plus
/(D
efic
it)
fro
m O
pera
tio
ns2
721
757
232
383
817
,12
3933
532
659
20,4
42
761
092
235
649
717
,17
81,7
271
,12
14,9
033
,36
28,6
416
,45
Oth
er In
com
e/(E
xpen
ditu
re)
247
037
213
794
15,5
539
9(5
25)
175,
9024
743
521
326
916
,02
7,32
6,44
13,7
72,
992,
5915
,30
Net
t In
vest
men
t In
com
e1
492
868
162
062
1-7
,88
3093
237
739
-18,
041
523
800
165
835
9-8
,11
45,1
050
,05
-9,9
018
,41
20,1
6-8
,68
Unr
ealis
ed G
ains
/(Los
ses)
on
Re-
mea
sure
men
t of
Fin
anci
al In
stru
men
ts a
nd In
vest
men
t Pr
oper
ties
223
793
155
739
43,7
03
406
-N
/A22
719
915
573
945
,88
6,72
4,70
43,0
52,
741,
8944
,98
Rea
lised
Gai
ns/(
Loss
es)
on D
ispo
sal o
f Fi
nanc
ial I
nstr
umen
ts a
nd In
vest
men
t Pr
oper
ties
3799
4(1
433)
2751
,49
-(6
4)10
0,00
3799
4(1
497)
2637
,41
1,12
-0,0
525
88,1
90,
46-0
,02
2621
,72
Rea
lised
Gai
ns/(
Loss
es)
on D
ispo
sal o
f A
vaila
ble-
for-
sale
Fin
anci
al In
stru
men
ts19
820
7(1
116
6)18
75,0
3-
-0,
0019
820
7(1
116
6)18
75,0
35,
87-0
,34
1840
,60
2,39
-0,1
418
64,0
6Su
rplu
s/(D
efic
it) o
n Sa
le o
f Inv
estm
ents
Pr
oper
ties
927
922
067
-57,
95-
-0,
009
279
2206
7-5
7,95
0,27
0,67
-58,
770,
110,
27-5
8,21
Surp
lus/
(Def
icit)
on
Sale
of P
rope
rty,
Plan
t an
d Eq
uipm
ent
(161
)7
612
-102
,12
162
3438
0,35
07
645
-100
,00
0,00
0,23
-100
,00
0,00
0,09
-100
,00
(Impa
irm
ent
Loss
es o
n Fi
nanc
ial I
nstr
umen
ts
and
Prop
erty
Plan
t an
d Eq
uipm
ent)
(363
)(1
491
8)-9
7,56
--
0,00
(363
)(1
491
8)-9
7,56
-0,0
1-0
,45
-97,
61-0
,00
-0,1
8-9
7,58
Rev
ersa
l of P
revi
ous
Rec
ogni
sed
Impa
irm
ent
Loss
es o
n Fi
nanc
ial I
nstr
umen
ts a
nd P
rope
rty,
Plan
t an
d Eq
uipm
ent
-87
1-1
00,0
0-
-0,
00-
871
-100
,00
-0,
03-1
00,0
0-
0,01
-100
,00
NE
TT
SU
RP
LU
S/(
DE
FIC
IT)
493
041
04
317
023
14,2
174
233
6984
26,
295
004
643
438
686
514
,08
148,
1213
2,40
11,8
760
,46
53,3
313
,38
COUNCIL FOR MEDICAL SCHEMES Annual Report 2004-5 91
ANNEXURE D5
Cons
olid
ated
inc
ome
stat
emen
tfo
r th
e ye
ar e
nded
31
Dece
mbe
r 20
04Consolidated income statement

REG
ISTE
RED
SC
HEM
ESBA
RGA
ININ
G C
OU
NC
IL S
CH
EMES
CO
NSO
LID
ATED
Per A
vera
ge M
embe
rPe
r Ave
rage
Ben
efic
iary
2004
2003
%20
0420
03%
2004
2003
%20
0420
03%
2004
2003
%R’
000
R’00
0C
hang
eR’
000
R’00
0C
hang
eR’
000
R’00
0C
hang
eR
RC
hang
eR
RC
hang
eA
CC
UM
ULA
TED
FU
ND
SBa
lanc
es a
t th
e Be
ginn
ing
of t
he Y
ear
1344
976
69
269
332
45,1
036
468
230
013
621
,51
1381
444
89
569
468
44,3
64
906
346
641
,56
200
31
396
43,4
7-
As
Prev
ious
ly R
epor
ted
1342
641
69
229
085
45,4
836
669
029
946
922
,45
1379
310
69
528
554
44,7
64
899
345
141
,95
200
01
390
43,8
6-
Pri
or Y
ear
Adj
ustm
ent
2335
044
151
99,0
5(2
008)
667
-400
,90
2134
31
108
1826
,36
80
1789
,00
30
1814
,46
- A
C 1
33 T
rans
ition
Adj
ustm
ent
-39
806
-100
,00
--
0,00
-39
806
-100
,00
-14
-100
,00
-6
-100
,00
Net
t Su
rplu
s/(D
efic
it) fo
r th
e Ye
ar4
930
410
431
702
314
,21
7423
369
842
6,29
500
464
34
386
865
14,0
81
777
158
911
,87
726
640
13,3
8U
nrea
lised
Gai
ns/(L
osse
s) o
n R
e-m
easu
rem
ent
of F
inan
cial
Inst
rum
ents
and
Inve
stm
ent
Prop
ertie
s(2
383)
(351
0)-3
2,12
--
0,00
(238
3)(3
510)
-32,
12-1
-1-3
3,43
-0-1
-32,
54Tr
ansf
er t
o/(fr
om) A
ccum
ulat
ed F
unds
(56
466)
(42
323)
33,4
2-
(320
2)10
0,00
(56
466)
(45
526)
24,0
3-2
0-1
621
,63
-8-7
23,2
6-
Due
to
Am
alga
mat
ion
734
9(4
772)
253,
990
(251
)10
0,00
734
9(5
023)
246,
303
-224
3,46
1-1
245,
39-
Due
to
Re-
mea
sure
men
t of
Fin
anci
al
Inst
rum
ents
and
Inve
stm
ent
Prop
ertie
s(8
581)
(52
349)
-83,
61-
-0,
00(8
581)
(52
349)
-83,
61-3
-19
-83,
93-1
-8-8
3,71
- O
ther
Tra
nsfe
rs(5
523
3)14
798
-473
,25
(0)
(295
1)-1
00,0
0(5
523
3)11
847
-566
,23
-20
4-5
57,1
9-8
2-5
63,3
5O
ther
(88
820)
(114
106)
-22,
16(1
75)
(85)
104,
20(8
899
4)(1
1419
1)-2
2,07
-32
-41
-23,
58-1
3-1
7-2
2,55
Bala
nces
at
the
End
of t
he Y
ear
1823
250
713
426
416
35,8
043
874
136
669
019
,65
1867
124
813
793
106
35,3
76
631
499
632
,74
270
72
012
34,5
3
REV
ALU
ATIO
N R
ESER
VE
(INV
EST
MEN
TS)
Bala
nces
at
the
Begi
nnin
g of
the
Yea
r41
740
521
790
891
,55
326
326
0,00
417
731
218
234
91,4
114
879
87,7
061
3290
,23
- A
s Pr
evio
usly
Rep
orte
d41
789
524
851
468
,16
326
326
0,00
418
221
248
839
68,0
714
990
64,8
161
3667
,03
- P
rior
Yea
r A
djus
tmen
t(4
90)
67-8
34,5
9-
-0,
00(4
90)
67-8
34,5
9-0
0-8
20,3
5-0
0-8
30,0
5-
AC
133
Tra
nsiti
on A
djus
tmen
t-
(30
672)
100,
00-
-0,
00-
(30
672)
100,
00-
-11
100,
00-
-410
0,00
Unr
ealis
ed G
ains
/(Lo
sses
) on
Re-
mea
sure
men
t of
Inve
stm
ents
328
984
218
272
50,7
2-
-0,
0032
898
421
827
250
,72
117,
0079
47,8
048
3249
,79
Tran
sfer
(to
)/fr
om In
com
e St
atem
ent
on
Dis
posa
l of I
nves
tmen
ts(1
652
7)(4
398)
275,
78-
-0,
00(1
652
7)(4
398)
275,
78-6
-226
8,49
-2-1
273,
46Tr
ansf
er (
to)/
from
Res
erve
s1
485
(188
6)17
8,72
--
0,00
148
5(1
886)
178,
721
-117
7,19
0-0
178,
23O
ther
(28
311)
(12
000)
135,
92-
-0,
00(2
831
1)(1
200
0)13
5,92
-10
-413
1,35
-4-2
134,
47
Bala
nces
at
the
End
of t
he Y
ear
703
037
417
895
68,2
332
632
60,
0070
336
241
822
168
,18
250
151
64,9
210
261
67,1
4
REV
ALU
ATIO
N R
ESER
VE
(PRO
PERT
Y,PL
AN
T A
ND
EQ
UIP
MEN
T)
Bala
nces
at
the
Begi
nnin
g of
the
Yea
r13
853
732
989
,02
--
0,00
1385
37
329
89,0
25
385
,36
21
87,8
6- A
s Pr
evio
usly
Rep
orte
d6
399
732
9-1
2,68
--
0,00
639
97
329
-12,
682
3-1
4,37
11
-13,
22-
Prio
r Yea
r A
djus
tmen
t7
453
-N
/A-
-0,
007
453
-N
/A3
-N
/A1
-N
/AU
nrea
lised
Gai
ns/(
Loss
es)
on R
e-m
easu
rem
ent
of P
rope
rty
Plan
t an
d Eq
uipm
ent
1263
7(9
29)
1459
,85
--
0,00
1263
7(9
29)
1459
,85
4-0
1433
,47
2-0
1451
,44
Tran
sfer
(to
)/fr
om In
com
e St
atem
ent
on
Dis
posa
l of P
rope
rty
Plan
t an
d Eq
uipm
ent
--
0,00
--
0,00
--
0,00
--
0,00
--
0,00
Tran
sfer
(to
)/fr
om R
eser
ves
--
0,00
--
0,00
--
0,00
--
0,00
--
0,00
Oth
er(5
612)
-N
/A-
-0,
00(5
612)
-N
/A-2
-N
/A-1
-N
/A
Bala
nces
at
the
End
of t
he Y
ear
2087
86
399
226,
25-
-0,
0020
878
639
922
6,25
72
219,
923
122
4,23
RES
ERV
ES S
ET A
SID
E FO
R S
PEC
IFIC
PU
RPO
SES
Bala
nces
at
the
Begi
nnin
g of
the
Yea
r48
756
244
152
410
,43
--
0,00
487
562
441
524
10,4
317
316
08,
2971
649,
74- A
s Pr
evio
usly
Rep
orte
d48
756
243
870
911
,14
--
0,00
487
562
438
709
11,1
417
315
98,
9871
6410
,45
- Pr
ior Y
ear
Adj
ustm
ent
-2
815
-100
,00
--
0,00
-2
815
-100
,00
-1
-100
,00
-0
-100
,00
Tran
sfer
(to
)/fr
om R
eser
ves
(439
8)(3
383
1)-8
7,00
--
0,00
(439
8)(3
383
1)-8
7,00
-2-1
2-8
7,25
-1-5
-87,
08O
ther
6721
179
869
-15,
85-
-0,
0067
211
7986
9-1
5,85
2429
-17,
4810
12-1
6,37
Bala
nces
at
the
End
of t
he Y
ear
550
375
487
562
12,8
8-
-0,
0055
037
548
756
212
,88
195
177
10,6
980
7112
,19
92 COUNCIL FOR MEDICAL SCHEMES Annual Report 2004-5
ANNEXURE E5
Cons
olid
ated
sta
tem
ent
of c
hang
es i
n fu
nds
and
rese
rves
for
the
year
end
ed 3
1 De
cem
ber
2004
Consolidated statement of changes in funds and reserves

OT
HER
RES
ERV
ESBa
lanc
es a
t th
e Be
ginn
ing
of t
he Y
ear
409
420
364
382
12,3
631
331
30,
0040
973
336
469
512
,35
146
132
10,1
759
5311
,66
- As
Prev
ious
ly R
epor
ted
436
439
364
382
19,7
831
331
30,
0043
675
236
469
519
,76
155
132
17,4
463
5319
,02
- Pr
ior Y
ear
Adj
ustm
ent
(27
019)
-N
/A-
-0,
00(2
701
9)-
N/A
-10
-N
/A-4
-N
/ATr
ansf
er (
to)/
from
Res
erve
s55
832
1483
927
6,24
--
0,00
5583
214
839
276,
2420
526
8,94
82
273,
91O
ther
2755
757
218
-51,
84-
-0,
0027
557
5721
8-5
1,84
1021
-52,
774
8-5
2,14
Bala
nces
at
the
End
of t
he Y
ear
492
808
436
439
12,9
231
331
30,
0049
312
143
675
212
,91
175
158
10,7
271
64,
12,2
1
REG
ISTE
RED
SC
HEM
ESBA
RGA
ININ
G C
OU
NC
IL S
CH
EMES
CO
NSO
LID
ATED
Per A
vera
ge M
embe
rPe
r Ave
rage
Ben
efic
iary
2004
2003
%20
0420
03%
2004
2003
%20
0420
03%
2004
2003
%R’
000
R’00
0C
hang
eR’
000
R’00
0C
hang
eR’
000
R’00
0C
hang
eR
RC
hang
eR
RC
hang
e
COUNCIL FOR MEDICAL SCHEMES Annual Report 2004-5 93
ANNEXURE E5
Cons
olid
ated
sta
tem
ent
of c
hang
es i
n fu
nds
and
rese
rves
for
the
year
end
ed 3
1 De
cem
ber
2004
Consolidated statement of changes in funds and reserves

MEM
BERS
DEP
END
AN
TSBE
NEF
ICIA
RIES
2004
2003
%20
0420
03%
2004
2003
%C
hang
eC
hang
eC
hang
eR
egis
tere
d S
chem
es2
716
264
268
805
51,
053
946
299
398
374
6-0
,94
666
256
36
671
801
-0,1
4-
Ope
n Sc
hem
es1
924
343
188
372
82,
162
830
960
283
506
9-0
,14
475
530
34
718
797
0,77
- R
estr
icte
d Sc
hem
es79
192
180
432
7-1
,54
111
533
91
148
677
-2,9
01
907
260
195
300
4-2
,34
Bar
gain
ing
Co
unci
l Sch
emes
117
058
114
760
2,00
136
045
138
125
-1,5
125
310
325
288
50,
09
TO
TA
L M
EM
BE
RS
HIP
283
332
22
802
815
1,09
408
234
44
121
871
-0,9
66
915
666
692
468
6-0
,13
Reg
iste
red
Sch
emes
270
173
62
665
280
1,37
395
153
83
986
882
-0,8
96
653
275
665
216
20,
02-
Ope
n Sc
hem
es1
900
692
185
981
62,
202
816
744
283
352
6-0
,59
471
743
64
693
342
0,51
- R
estr
icte
d Sc
hem
es80
104
480
546
4-0
,55
113
479
51
153
356
-1,6
11
935
838
195
882
0-1
,17
Bar
gain
ing
Co
unci
l Sch
emes
113
900
9574
718
,96
130
932
107
562
21,7
324
483
220
330
920
,42
AV
ER
AG
E M
EM
BE
RS
HIP
281
563
62
761
027
1,98
408
247
04
094
445
-0,2
96
898
107
685
547
10,
62
MEM
BER
SHIP
PER
PRO
VIN
CE
as a
t D
ecem
ber
% o
f tot
al%
of t
otal
% o
f tot
alG
aute
ng1
092
200
38,5
5%1
487
204
36,4
3%2
579
404
37,3
0%Li
mpo
po98
047
3,46
%18
161
14,
45%
279
658
4,04
%M
pum
alan
ga16
641
85,
87%
287
790
7,05
%45
420
86,
57%
Nor
th W
est
124
799
4,40
%18
813
14,
61%
312
930
4,52
%Fr
ee S
tate
130
568
4,61
%18
825
44,
61%
318
822
4,61
%K
wa-
Zul
u N
atal
417
706
14,7
4%61
089
414
,96%
102
860
014
,87%
Wes
tern
Cap
e50
858
517
,95%
685
300
16,7
9%1
193
885
17,2
6%Ea
ster
n C
ape
234
735
8,28
%36
109
18,
85%
595
826
8,62
%N
orth
ern
Cap
e60
264
2,13
%92
069
2,26
%15
233
32,
20%
Ave
rage
No
of D
epen
dant
s pe
r M
embe
r1,
451,
48O
vera
ll Pe
nsio
ner
Rat
io6,
66%
5,90
%A
vera
ge A
ge32
,02
94 COUNCIL FOR MEDICAL SCHEMES Annual Report 2004-5
ANNEXURE F5
Cons
olid
ated
mem
bers
hip
anal
ysis
as a
t 31
Dec
embe
r 20
04Consolidated membership analysis

PRIV
ATE
FAC
ILIT
IES
Num
ber
of:
Adm
issi
ons
to H
ospi
tals
190,
4321
6,04
197,
95A
dmis
sion
s fo
r PM
B in
ho
spita
ls26
,69
33,5
728
,71
Adm
issi
ons
to d
ay c
linic
s an
d op
erat
ing
thre
atre
s7,
6427
,52
13,4
8Be
nefic
iari
es a
dmitt
ed
to IC
U7,
855,
477,
15Be
nefic
iari
es a
dmitt
ed
to h
igh
care
war
d12
,00
7,78
10,7
6Be
nefic
iari
es a
dmitt
ed
to g
ener
al w
ard
67,3
310
8,33
79,3
7Pr
egna
ncie
s6,
786,
596,
72Bi
rths
7,79
5,12
7,01
Live
bir
ths
5,06
2,47
4,30
Cae
sare
an s
ectio
ns5,
615,
595,
60Be
nefic
iari
es a
dmitt
ed
for
dial
ysis
0,55
0,41
0,51
Sel
ecte
d m
edic
al in
vest
igat
ions
Num
ber
of:
Bene
ficia
ries
rec
eivi
ng
MR
I and
CT
sca
ns9,
8213
,35
10,8
6M
RI a
nd C
T s
cans
ad
min
iste
red
15,6
620
,00
16,9
4Be
nefic
iari
es r
ecei
ving
PE
T S
cans
0,00
0,61
0,18
PET
Sca
ns a
dmin
iste
red
0,00
1,34
0,40
Bene
ficia
ries
rec
eivi
ng
Ang
iogr
ams
2,97
2,60
2,86
Ang
iogr
ams
adm
inis
tere
d6,
185,
676,
03
Pre
vent
ativ
e H
ealt
hN
umbe
r of
:M
amm
ogra
ms
adm
inis
tere
d4,
376,
074,
87Pa
p sm
ears
adm
inis
tere
d47
,69
20,9
739
,84
Mo
rtal
ity
Num
ber
of d
eath
s1,
352,
021,
55
PUBL
IC F
AC
ILIT
IES
Num
ber
of:
Adm
issi
ons
to h
ospi
tals
9,23
17,0
911
,54
Adm
isso
ns fo
r PM
B in
ho
spita
ls0,
663,
431,
48Be
nefic
iari
es a
dmitt
ed
to IC
U0,
030,
110,
05Be
nefic
iari
es a
dmitt
ed
to h
igh
care
war
d0,
040,
030,
03Be
nefic
iari
es a
dmitt
ed
to g
ener
al w
ard
3,21
7,15
4,37
Preg
nanc
ies
0,07
0,12
0,09
Birt
hs0,
130,
100,
12Li
ve b
irth
s0,
020,
060,
03
PRIV
ATE
PRO
VID
ERS
Ben
efic
iari
es v
isit
ing
a p
rovi
der
at le
ast
once
a y
ear
Pri
vate
pro
vide
rsBe
nefic
iari
es v
isiti
ng a
G
P at
leas
t on
ce a
yea
r71
0,99
811,
3174
0,46
Bene
ficia
ries
vis
iting
a
Den
tist
at le
ast
once
a
year
260,
6533
5,59
282,
66Be
nefic
iari
es v
isiti
ng a
Pr
ivat
e N
urse
at
leas
t on
ce a
yea
r4,
918,
155,
87
Med
ical
Spe
cial
ists
Der
mat
olog
ist
14,6
930
,26
19,1
6O
bste
tric
s &
G
ynae
colo
gist
35,6
377
,94
47,7
8Pu
lmon
olog
ist
2,38
5,01
3,13
Phys
icia
n27
,11
60,4
836
,70
Gas
troe
nter
olog
ist
2,78
5,23
3,48
Neu
rolo
gist
4,70
10,3
76,
33C
ardi
olog
ist
9,19
17,3
611
,54
Psyc
hiat
rist
6,04
17,1
39,
23M
edic
al O
ncol
ogis
t0,
531,
230,
73N
euro
-Sur
geon
4,68
10,9
56,
48N
ucle
ar M
edic
ine
1,37
2,42
1,67
Oph
thal
mol
ogis
t19
,31
38,3
824
,79
Ort
hopa
edic
Sur
geon
20,5
844
,24
27,3
8O
torh
inol
aryn
golo
gist
14,8
733
,26
20,1
5Pa
edia
tric
ian
20,4
548
,78
28,5
9Pa
edia
tric
Car
diol
ogis
t0,
511,
020,
65Sp
ecia
list
Phys
ical
M
edic
ine
0,19
0,36
0,24
Plas
tic R
econ
stru
ctiv
e Su
rgeo
n2,
264,
752,
97Su
rgeo
n22
,42
47,6
429
,67
Tho
raci
c Su
rgeo
n1,
462,
971,
89U
rolo
gist
10,0
322
,00
13,4
7
Clin
ical
Sup
port
Spe
cial
ists
Ana
esth
etis
t41
,75
88,8
155
,27
Path
olog
ist
151,
1332
0,20
199,
71R
adio
logi
st94
,57
208,
3212
7,26
Rad
ioth
erap
ist
2,77
6,06
3,71
Labo
rato
ry T
echn
olog
ist
0,20
1,02
0,43
Oth
er3,
2119
,12
7,78
Den
tal S
peci
alis
tsM
axill
a,Fa
cial
& O
ral
Surg
eons
4,48
10,2
66,
14O
ral P
atho
logi
st0,
070,
120,
09O
rtho
dont
ist
4,22
12,2
16,
52Pe
riod
ontis
t0,
892,
281,
29Pr
osth
odon
tist
0,57
1,58
0,86
PRIV
ATE
PRO
VID
ERS
Ben
efic
iari
es v
isit
ing
a p
rovi
der
at le
ast
once
a y
ear
Alli
ed a
nd S
uppo
rt H
ealt
h P
rofe
ssio
nals
Med
ical
Tec
hnol
ogis
t15
,81
9,85
18,1
9Po
diat
rist
6,43
5,97
6,61
Opt
omet
rist
167,
1618
7,08
159,
22Ph
ysio
ther
apis
t85
,84
82,7
087
,09
Ort
hopt
ist
0,25
0,20
0,27
Spee
ch T
hera
pist
9,37
8,97
9,52
Psyc
holo
gist
29,0
728
,30
29,3
8O
ccup
atio
nal T
hera
py6,
475,
956,
67Pr
ivat
e N
urse
5,45
5,69
5,35
Die
ticia
n8,
638,
648,
62C
hiro
prac
tor
&
Ost
eopa
th10
,20
7,94
11,1
0H
omeo
path
7,55
5,45
8,38
Nat
urop
ath
&
Phyt
othe
rapi
st0,
020,
060,
00T
hera
peut
ic M
assa
ge,
Aro
mat
hera
py a
nd
Ref
lexo
logy
0,00
0,00
0,00
Ayu
rved
ic P
ract
ition
er0,
020,
000,
03A
cupu
nctu
re &
Chi
nese
M
edic
ine
0,00
0,00
0,00
Oth
er32
,65
26,7
335
,01
Oth
er B
enef
its
App
lianc
es21
,54
41,1
835
,56
Pros
thes
es11
,78
8,13
9,17
Am
bula
nce
Serv
ice
3,72
4,89
4,56
Oth
er3,
674,
073,
95
Tota
l num
ber
of v
isit
s to
a p
rovi
der
Alli
ed a
nd S
uppo
rt H
ealt
h P
rofe
ssio
nals
Med
ical
Tec
hnol
ogis
t54
,58
30,3
447
,67
Podi
atri
st15
,14
13,3
314
,63
Opt
omet
rist
201,
6923
3,04
210,
62Ph
ysio
ther
apis
t41
4,05
430,
2841
8,68
Ort
hopt
ist
0,40
0,29
0,36
Spee
ch T
hera
pist
39,5
426
,86
35,9
3Ps
ycho
logi
st13
4,26
120,
5713
0,36
Occ
upat
iona
l The
rapy
53,6
441
,04
50,0
5Pr
ivat
e N
urse
16,6
723
,88
18,7
3D
ietic
ian
21,0
319
,43
20,5
8C
hiro
prac
tor
&
Ost
eopa
th42
,74
31,4
839
,53
Hom
eopa
th20
,45
14,5
718
,77
Nat
urop
ath
&
Phyt
othe
rapi
st0,
100,
230,
14T
hera
peut
ic M
assa
ge,
Aro
mat
hera
py a
nd
Ref
lexo
logy
0,00
0,03
0,01
Ayu
rved
ic P
ract
ition
er0,
010,
010,
01A
cupu
nctu
re &
Chi
nese
M
edic
ine
0,01
0,01
0,01
Oth
er51
,15
60,3
453
,77
BUR
DEN
OF
DIS
EASE
C
hro
nic
Co
ndit
ions
Add
ison
’s D
isea
se0,
120,
060,
10A
sthm
a19
,26
34,1
024
,56
Bipo
lar
Moo
d D
isor
der
1,04
1,78
1,31
Bron
chie
ctas
is0,
220,
350,
27C
ardi
ac F
ailu
re3,
077,
014,
48C
ardi
omyo
path
y D
iseas
e0,
600,
730,
65C
rohn
’s D
isea
se2,
303,
962,
89C
hron
ic O
bstr
uctiv
e Pu
lmon
ary
Dis
ease
0,46
0,53
0,48
Chr
onic
Ren
al D
isea
se4,
1130
,78
13,6
4C
oron
ary
Art
ery
Dis
ease
0,26
0,30
0,27
Dia
bete
s In
sipi
dus
0,06
0,19
0,11
Dia
bete
s M
ellit
us T
ype
15,
167,
756,
09D
iabe
tes
Mel
litus
Typ
e 2
13,8
020
,63
16,2
4D
ysry
thm
ias
1,48
3,37
2,16
Epile
psy
5,02
8,66
6,32
Gla
ucom
a2,
263,
722,
78H
aem
ophi
lia0,
030,
030,
03H
IV1,
154,
552,
36H
yper
lipid
aem
ia29
,46
42,5
934
,16
Hyp
erte
nsio
n73
,93
121,
1990
,82
Hyp
othy
roid
ism
10,5
415
,16
12,1
9M
ultip
le S
cler
osis
0,15
0,24
0,18
Park
inso
n’s
Dis
ease
0,68
1,41
0,94
Rhe
umat
oid
Art
hriti
s3,
696,
764,
79Sc
hizo
phre
nia
0,42
0,73
0,53
Syst
emat
ic L
upus
Er
ythr
omat
osis
0,29
0,35
0,31
Ulc
erat
ive
Col
itis
0,51
0,98
0,68
AV
ERA
GE
UT
ILIS
ATIO
N O
F SE
RVIC
ESO
pen
Rest
ricte
dC
onso
lidat
edSc
hem
esSc
hem
esSc
hem
es
Vis
its t
o a
Gen
eral
Pr
actit
ione
r pe
r ye
ar3,
033,
933,
30V
isits
to
a D
entis
t pe
r ye
ar0,
540,
630,
57V
isits
to
a Pr
ivat
e
nurs
e pe
r ye
ar0,
010,
030,
02Le
ngth
of s
tay
in
priv
ate
hosp
ital
0,51
2,36
1,06
Leng
th o
f sta
y in
pu
blic
hos
pita
l 0,
030,
060,
05
UTI
LISA
TIO
NU
TILI
SATI
ON
UTI
LISA
TIO
NN
UM
BER
OF
CA
SES
OPEN
REST
RICTE
DCO
NSOL
IDAT
EDOP
ENRE
STRIC
TED
CONS
OLID
ATED
OPEN
REST
RICTE
DCO
NSOL
IDAT
EDOP
ENRE
STRIC
TED
CONS
OLID
ATED
per 1
000
per 1
000
per 1
000
per 1
000
per 1
000
per 1
000
per 1
000
per 1
000
per 1
000
per 1
000
per 1
000
per 1
000
Bene
ficiar
iesBe
nefic
iaries
Bene
ficiar
iesBe
nefic
iaries
Bene
ficiar
iesBe
nefic
iaries
Bene
ficiar
iesBe
nefic
iaries
Bene
ficiar
iesBe
nefic
iaries
Bene
ficiar
iesBe
nefic
iaries
COUNCIL FOR MEDICAL SCHEMES Annual Report 2004-5 95
ANNEXURE G5
Uti
lisat
ion
of s
ervi
ces
for
the
year
end
ed 3
1 De
cem
ber
2004
Utilisation of services

UTI
LISA
TIO
NU
TILI
SATI
ON
UTI
LISA
TIO
NN
UM
BER
OF
CA
SES
OPEN
REST
RICTE
DCO
NSOL
IDAT
EDOP
ENRE
STRIC
TED
CONS
OLID
ATED
OPEN
REST
RICTE
DCO
NSOL
IDAT
EDOP
ENRE
STRIC
TED
CONS
OLID
ATED
per 1
000
per 1
000
per 1
000
per 1
000
per 1
000
per 1
000
per 1
000
per 1
000
per 1
000
per 1
000
per 1
000
per 1
000
Bene
ficiar
iesBe
nefic
iaries
Bene
ficiar
iesBe
nefic
iaries
Bene
ficiar
iesBe
nefic
iaries
Bene
ficiar
iesBe
nefic
iaries
Bene
ficiar
iesBe
nefic
iaries
Bene
ficiar
iesBe
nefic
iaries
Oth
er B
enef
its
App
lianc
es64
,32
30,3
454
,59
Pros
thes
es9,
3017
,03
11,5
1A
mbu
lanc
e Se
rvic
e6,
386,
116,
30O
ther
9,44
29,2
015
,10
Cae
sare
an s
ectio
ns0,
080,
150,
10Be
nefic
iari
es a
dmitt
ed
for
dial
ysis
0,12
0,08
0,11
Sel
ecte
d m
edic
al in
vest
igat
ions
Num
ber
of:
Bene
ficia
ries
rec
eivi
ng
MR
I and
CT
sca
ns0,
120,
340,
18M
RI a
nd C
T s
cans
ad
min
iste
red
0,15
0,59
0,28
Bene
ficia
ries
rec
eivi
ng
PET
Sca
ns0,
000,
010,
00PE
T S
cans
adm
inis
tere
d0,
000,
010,
00Be
nefic
iari
es r
ecei
ving
A
ngio
gram
s0,
010,
100,
03A
ngio
gram
s ad
min
iste
red
0,01
0,23
0,08
Pre
vent
ativ
e H
ealt
hN
umbe
r of
:M
amm
ogra
ms
adm
inis
tere
d0,
010,
060,
02Pa
p Sm
ears
adm
inis
tere
d0,
390,
080,
30
Mo
rtal
ity
Num
ber
of d
eath
s 0,
030,
510,
17
Tota
l num
ber
of v
isit
s to
a p
rovi
der
Med
ical
Spe
cial
ists
Der
mat
olog
ist
49,8
050
,14
49,9
0O
bste
tric
s &
G
ynae
colo
gist
196,
4720
8,71
199,
98Pu
lmon
olog
ist
17,5
818
,57
17,8
6Ph
ysic
ian
174,
9723
7,35
192,
89G
astr
oent
erol
ogis
t12
,90
13,8
613
,17
Neu
rolo
gist
21,0
024
,22
21,9
3C
ardi
olog
ist
42,2
045
,49
43,1
4Ps
ychi
atri
st49
,65
74,9
756
,93
Med
ical
Onc
olog
ist
8,21
6,31
7,66
Neu
ro-S
urge
on23
,00
28,6
524
,62
Nuc
lear
Med
icin
e3,
553,
033,
40O
phth
alm
olog
ist
67,0
473
,96
69,0
3O
rtho
paed
ic S
urge
on83
,97
95,0
687
,15
Oto
rhin
olar
yngo
logi
st57
,88
62,2
559
,13
Paed
iatr
icia
n16
2,22
167,
2116
3,65
Paed
iatr
ic C
ardi
olog
ist
2,89
2,47
2,77
Spec
ialis
t Ph
ysic
al
Med
icin
e0,
941,
431,
08Pl
astic
Rec
onst
ruct
ive
Surg
eon
8,95
8,79
8,91
Surg
eon
94,2
510
9,96
98,7
6T
hora
cic
Surg
eon
9,04
11,0
59,
62U
rolo
gist
41,3
647
,29
43,0
6
Clin
ical
Sup
port
Spe
cial
ists
Ana
esth
etis
t10
8,10
120,
8711
1,77
Path
olog
ist
737,
1487
7,01
777,
33R
adio
logi
st32
5,18
361,
3733
5,58
Rad
ioth
erap
ist
41,4
945
,72
42,7
0La
bora
tory
Tec
hnol
ogis
t1,
862,
422,
02O
ther
5,72
34,0
213
,85
Den
tal S
peci
alis
tsM
axill
a,Fa
cial
& O
ral
Surg
eon
15,9
216
,72
16,1
5O
ral P
atho
logi
st0,
140,
140,
14O
rtho
dont
ist
58,1
960
,18
58,7
6Pe
riod
ontis
t5,
934,
695,
58Pr
osth
odon
tist
3,87
7,07
4,79
Note
s:•
Ch
ron
ic c
on
dit
ion
s:-
76,7
% o
f m
edic
al s
chem
es h
ave
subm
itte
d da
ta r
epre
sen
tin
g 82
,0%
of
ben
efic
iari
es•
Uti
lisa
tio
n o
f h
ealt
h c
are
serv
ices
:-
78,9
% o
f m
edic
al s
chem
es h
ave
subm
itte
d da
ta r
epre
sen
tin
g 85
,0%
of
ben
efic
iari
es•
Excl
usi
on
s:-
sch
emes
th
at d
id n
ot
sub
mit
th
e d
ata
wer
e ex
clu
ded
fro
m t
he
anal
ysis
- sc
hem
es w
ith
po
or
qu
aliy
dat
a w
ere
also
exc
lud
ed f
rom
th
e an
alys
is
96 COUNCIL FOR MEDICAL SCHEMES Annual Report 2004-5
ANNEXURE G5
Uti
lisat
ion
of s
ervi
ces
for
the
year
end
ed 3
1 De
cem
ber
2004
Utilisation of services

OPE
NRE
STRI
CTE
DO
PEN
REST
RIC
TED
BARG
AIN
ING
CO
UN
CIL
SC
HEM
ESC
ON
SOLI
DAT
EDPA
BPM
SCH
EMES
SCH
EMES
SCH
EMES
SCH
EMES
2004
%20
04%
2003
2003
%20
04%
2003
%20
04%
2003
%20
0420
03%
R’00
0of
tota
lR’
000
of to
tal
R’00
0R’
000
Cha
nge
R’00
0of
tota
lR’
000
Cha
nge
R’00
0of
tota
lR’
000
Cha
nge
RR
Cha
nge
GE
NE
RA
L P
RA
CT
ITIO
NE
RS
189
137
26,
6595
468
97,
662
017
075
880
402
-1,8
5828
710
,69
5791
80,
62
904
348
7,00
295
539
4-1
,735
,09
35,9
3-2
,3M
ED
ICA
L S
PE
CIA
LIS
TS
582
211
520
,46
230
629
618
,50
532
909
52
169
248
8,4
112
095
20,5
610
639
75,
48
240
506
19,8
77
604
740
8,4
99,5
592
,44
7,7
Der
mat
olog
ists
4857
30,
1718
682
0,15
5425
218
472
-7,5
884
0,16
842
4,9
6813
90,
1673
566
-7,4
0,82
0,89
-8,0
Obs
tetr
ics
& G
ynae
colo
gist
s44
961
01,
5816
474
21,
3241
040
215
094
49,
47
804
1,43
677
315
,262
215
61,
5056
812
09,
57,
526,
918,
8Pu
lmon
olog
ist
3208
40,
1112
093
0,10
3074
59
838
8,9
696
0,13
526
32,3
4487
30,
1141
109
9,2
0,54
0,50
8,5
Phys
icia
ns29
106
51,
0212
312
30,
9925
880
311
521
510
,75
303
0,97
470
812
,641
949
21,
0137
872
610
,85,
074,
6010
,1G
astr
oent
erol
ogis
t30
209
0,11
1101
70,
0929
264
1013
74,
655
90,
1046
021
,441
785
0,10
3986
14,
80,
500,
484,
2N
euro
logi
sts
4798
90,
1720
919
0,17
4737
718
704
4,3
832
0,15
723
15,0
6973
90,
1766
805
4,4
0,84
0,81
3,7
Car
diol
ogis
t16
592
60,
5858
819
0,47
136
734
4873
321
,24
029
0,74
315
327
,822
877
40,
5518
862
021
,32,
762,
2920
,5Ps
ychi
atri
sts
8957
80,
3143
507
0,35
9112
940
517
1,1
605
0,11
539
12,3
133
690
0,32
132
185
1,1
1,62
1,61
0,5
Med
ical
Onc
olog
ist
6961
30,
2419
094
0,15
6238
419
994
7,7
927
0,17
117
3-2
0,9
8963
40,
2283
550
7,3
1,08
1,02
6,6
Neu
ro-s
urge
ons
108
733
0,38
4259
00,
3492
227
3852
615
,72
508
0,46
194
628
,915
383
20,
3713
269
815
,91,
861,
6115
,2N
ucle
ar M
edic
ine
3172
70,
1112
713
0,10
3108
111
794
3,6
696
0,13
614
13,4
4513
60,
1143
489
3,8
0,55
0,53
3,1
Oph
thal
mol
ogis
ts23
620
20,
8310
468
50,
8423
172
210
505
21,
25
949
1,09
505
217
,734
683
50,
8434
182
61,
54,
194,
160,
8O
rtho
paed
ic S
urge
ons
305
226
1,07
113
563
0,91
271
418
106
895
10,7
616
91,
135
792
6,5
424
958
1,02
384
104
10,6
5,13
4,67
10,0
Oto
rhin
olar
yngo
logi
sts
130
925
0,46
4778
60,
3812
474
546
472
4,4
273
30,
502
486
9,9
181
443
0,44
173
703
4,5
2,19
2,11
3,8
Paed
iatr
icia
ns18
932
90,
6765
242
0,52
168
024
5964
711
,83
171
0,58
264
819
,825
774
10,
6223
031
911
,93,
112,
8011
,2Pa
edia
tric
Car
diol
ogis
t8
336
0,03
274
90,
026
591
215
626
,716
80,
0314
417
,011
254
0,03
889
126
,60,
140,
1125
,8Sp
ecia
lists
in P
hysi
cal M
edic
ine
114
10,
0059
60,
002
036
396
-28,
623
0,00
1459
,31
760
0,00
244
6-2
8,1
0,02
0,03
-28,
5Pl
astic
& R
econ
stru
ctiv
e Su
rgeo
ns32
049
0,11
1166
60,
0934
067
1104
7-3
,163
00,
1247
731
,944
344
0,11
4559
1-2
,70,
540,
55-3
,3Su
rgeo
ns29
513
11,
0410
546
80,
8526
645
210
389
38,
26
277
1,15
554
113
,340
687
60,
9837
588
68,
24,
924,
577,
6T
hora
cic
Surg
eons
7054
30,
2523
607
0,19
6337
824
795
6,8
185
50,
341
414
31,2
9600
50,
2389
587
7,2
1,16
1,09
6,5
Uro
logi
sts
117
801
0,41
4567
90,
3710
908
744
291
6,6
232
90,
432
172
7,2
165
809
0,40
155
551
6,6
2,00
1,89
5,9
CLI
NIC
AL
SUPP
ORT
SPE
CIA
LIST
SA
naes
thet
ists
454
326
1,60
159
981
1,28
407
689
154
312
9,3
894
51,
648
247
8,5
623
253
1,50
570
249
9,3
7,53
6,93
8,6
Rad
iolo
gist
s1
078
798
3,79
489
850
3,93
991
994
446
933
9,0
2077
53,
8120
113
3,3
158
942
33,
831
459
040
8,9
19,2
017
,74
8,3
Path
olog
ists
105
607
53,
7139
210
73,
1483
217
434
211
823
,320
242
3,71
2124
0-4
,71
468
425
3,54
119
553
222
,817
,74
14,5
322
,1La
bora
tory
Tec
hnol
ogis
t12
036
0,04
287
50,
026
482
289
559
,015
60,
0328
5-4
5,4
1506
60,
049
662
55,9
0,18
0,12
55,0
Rad
ioth
erap
ists
236
866
0,83
7178
00,
5820
568
586
675
5,6
653
91,
206
826
-4,2
315
184
0,76
299
187
5,3
3,81
3,64
4,7
Oth
er23
222
50,
8214
136
31,
1336
315
514
879
6-2
7,0
129
20,
242
487
-48,
137
487
90,
9051
443
9-2
7,1
4,53
6,25
-27,
6D
EN
TIS
TS
112
926
23,
9752
595
34,
221
235
415
514
298
-5,4
2484
44,
5622
871
8,6
168
005
94,
051
772
584
-5,2
20,3
021
,55
-5,8
DE
NT
AL
SP
EC
IAL
IST
S21
183
90,
7490
660
0,73
204
650
8646
73,
93
030
0,56
287
95,
230
552
80,
7429
399
73,
93,
693,
573,
3M
axill
aFa
cial
& O
ral S
urge
ons
6013
50,
2129
926
0,24
6720
727
913
-5,3
136
30,
251
114
22,4
9142
40,
2296
233
-5,0
1,10
1,17
-5,6
Ora
l Pat
holo
gist
s10
20,
0027
90,
0040
361
1-6
2,4
00,
001
-82,
738
10,
001
015
-62,
40,
000,
01-6
2,7
Ort
hodo
ntis
ts12
329
20,
4349
680
0,40
109
754
4693
210
,41
618
0,30
153
75,
217
459
00,
4215
822
310
,32,
111,
929,
7Pe
riod
ontis
ts15
820
0,06
518
10,
0415
135
548
91,
837
0,01
125
-70,
221
038
0,05
2074
91,
40,
250,
250,
8Pr
osth
odon
tists
1249
00,
045
594
0,04
1215
25
523
2,3
110,
0010
2-8
9,1
1809
50,
0417
777
1,8
0,22
0,22
1,2
AL
LIE
D A
ND
SU
PP
OR
T H
EA
LTH
P
RO
FE
SS
ION
AL
S
192
356
76,
7678
240
06,
281
960
570
691
426
2,0
3117
05,
7221
652
44,0
273
713
76,
602
673
648
2,4
33,0
732
,50
1,7
Med
ical
Tec
hnol
ogis
ts14
256
40,
5036
160
0,29
8425
329
823
56,7
257
00,
4750
502
2,8
181
294
0,44
114
127
58,9
2,19
1,39
57,9
Podi
atri
sts
1034
10,
046
978
0,06
1119
93
323
19,3
197
0,04
181
8,8
1751
60,
0414
702
19,1
0,21
0,18
18,4
Opt
omet
rist
s97
174
63,
4138
737
83,
111
105
797
359
165
-7,2
1859
63,
4112
100
53,7
137
772
03,
321
477
062
-6,7
16,6
417
,95
-7,3
Phys
ioth
erap
ists
313
714
1,10
115
860
0,93
292
644
107
983
7,2
516
40,
956
322
-18,
343
473
91,
0540
694
96,
85,
254,
956,
2O
rtho
ptis
ts1
874
0,01
841
0,01
286
096
0-2
8,9
809
0,15
329
488,
33
524
0,01
382
3-7
,80,
040,
05-8
,4Sp
eech
The
rapi
sts
4458
70,
1623
661
0,19
4003
516
911
19,8
595
0,11
511
16,4
6884
20,
1757
458
19,8
0,83
0,70
19,1
Psyc
holo
gist
s15
370
60,
5457
322
0,46
160
545
5314
3-1
,21
406
0,26
119
218
,021
243
40,
5121
488
0-1
,12,
572,
61-1
,7O
ccup
atio
nal T
hera
py33
258
0,12
1175
20,
0933
341
1140
40,
671
0,01
133
-46,
645
081
0,11
4487
80,
50,
540,
55-0
,2Pr
ivat
e N
urse
s15
154
0,05
1428
10,
1120
450
1271
3-1
1,2
160
0,03
215
-25,
529
595
0,07
3337
8-1
1,3
0,36
0,41
-11,
9D
ietic
ians
1192
50,
044
360
0,03
1202
83
634
4,0
131
0,02
111
18,7
1641
60,
0415
773
4,1
0,20
0,19
3,4
Chi
ropr
acto
rs &
Ost
eopa
ths
2778
50,
106
285
0,05
2678
25
296
6,2
477
0,09
400
19,3
3454
70,
0832
478
6,4
0,42
0,39
5,7
Hom
eopa
ths
1413
10,
054
074
0,03
1630
64
794
-13,
715
40,
0313
910
,718
358
0,04
2123
8-1
3,6
0,22
0,26
-14,
1N
atur
opat
hs &
Phy
toth
erap
ists
184
0,00
100
0,00
421
330
,6-
0,00
-0,
028
40,
0021
730
,60,
000,
0029
,8T
hera
peut
ic M
assa
geA
rom
athe
rapy
&
Ref
lexo
logy
90,
008
0,00
55
63,8
-0,
00-
0,0
170,
0010
63,8
0,00
0,00
62,8
Ayu
rved
ic P
ract
ition
ers
149
0,00
860,
001
34
991,
5-
0,00
-0,
023
50,
005
499
1,5
0,00
0,00
496
0,1
Acu
punc
ture
& C
hine
se M
edic
ine
10,
001
0,00
50
-59,
1-
0,00
-0,
02
0,00
5-5
9,1
0,00
0,00
-59,
3O
ther
182
438
0,64
113
256
0,91
154
315
8205
425
,183
90,
1529
618
3,2
296
533
0,71
236
664
25,3
3,58
2,88
24,5
COUNCIL FOR MEDICAL SCHEMES Annual Report 2004-5 97
ANNEXURE H5
Anal
ysis
of
all
bene
fits
pai
dfo
r th
e ye
ar e
nded
31
Dece
mbe
r 20
04Analysis of all benefits paid

Note
s:•
PAB
PM
= p
er a
vera
ge b
enef
icia
ry p
er m
on
th
TO
TA
L H
OS
PIT
AL
S10
989
839
38,6
14
529
998
36,3
39
105
319
399
643
918
,522
413
541
,11
181
586
23,4
1574
397
337
,96
1328
334
418
,519
0,20
161,
4717
,8PR
IVAT
E H
OSP
ITA
LS9
966
935
35,0
23
979
647
31,9
28
131
406
353
913
019
,521
338
739
,13
176
967
20,6
1415
996
934
,14
1184
750
419
,517
1,06
144,
0218
,8W
ard
Fees
418
098
314
,69
183
530
414
,72
334
547
61
586
045
22,0
189
022
34,6
715
737
820
,16
205
309
14,9
65
088
898
21,9
74,9
661
,86
21,2
The
atre
Fee
s2
666
856
9,37
829
857
6,66
180
123
874
869
537
,112
940
2,37
542
913
8,3
350
965
28,
462
555
363
37,3
42,4
031
,06
36,5
Con
sum
able
s1
460
934
5,13
357
445
2,87
157
491
240
099
9-8
,02
459
0,45
157
656
,01
820
837
4,39
197
748
7-7
,922
,00
24,0
4-8
,5M
edic
ines
dis
pens
ed1
658
162
5,83
957
042
7,68
140
978
080
339
118
,28
966
1,64
1258
4-2
8,8
262
417
06,
332
225
755
17,9
31,7
027
,06
17,2
Glo
bal /
per
die
m fe
e91
013
43,
2040
768
53,
2784
741
133
963
811
,04
276
0,78
-N
/A1
322
096
3,19
118
704
911
,415
,97
14,4
310
,7PR
OV
INC
IAL
HO
SPIT
ALS
112
770
0,40
142
666
1,14
126
502
117
671
4,6
647
21,
194
619
40,1
261
908
0,63
248
792
5,3
3,16
3,02
4,6
War
d Fe
es87
958
0,31
104
926
0,84
9796
563
634
19,4
429
50,
793
649
17,7
197
179
0,48
165
248
19,3
2,38
2,01
18,6
The
atre
Fee
s4
981
0,02
1149
90,
098
495
1521
6-3
0,5
987
0,18
218
352,
717
468
0,04
2392
9-2
7,0
0,21
0,29
-27,
5C
onsu
mab
les
994
20,
0323
209
0,19
939
723
041
2,2
666
0,12
403
65,4
3381
70,
0832
841
3,0
0,41
0,40
2,3
Med
icin
es d
ispe
nsed
988
90,
033
033
0,02
1064
515
780
-51,
152
30,
1034
949
,913
445
0,03
2677
4-4
9,8
0,16
0,33
-50,
1M
ED
ICIN
ES
520
112
518
,27
267
430
121
,45
606
426
32
470
515
-7,7
8392
315
,39
8231
62,
07
959
349
19,1
98
617
094
-7,6
96,1
510
4,75
-8,2
Med
icin
es d
ispe
nsed
by
Phar
mac
ists
433
392
915
,23
220
092
117
,65
484
935
91
839
434
-2,3
6435
511
,80
5851
610
,06
599
204
15,9
16
747
309
-2,2
79,7
282
,02
-2,8
Med
icin
es d
ispe
nsed
by
Prac
titio
ners
852
057
465
106
119
707
161
656
8-2
7,4
1951
43,
5823
753
-17,
81
336
677
3,22
183
739
3-2
7,3
16,1
522
,33
-27,
7M
edic
ines
dis
pens
ed b
y A
llied
and
Su
ppor
t H
ealth
Pro
fess
iona
ls15
140
0,05
827
40,
0717
833
1451
3-2
7,6
540,
0146
17,3
2346
80,
0632
392
-27,
60,
280,
39-2
8,0
EX
-GR
AT
IA P
AY
ME
NT
S12
084
0,04
1375
00,
119
744
1248
516
,218
20,
032
087
-91,
326
015
0,06
2431
57,
00,
310,
306,
3O
TH
ER
BE
NE
FIT
S53
797
11,
8944
465
63,
5746
753
957
766
3-6
,07
596
1,39
270
018
1,3
990
223
2,39
104
790
2-5
,511
,96
12,7
4-6
,1A
pplia
nces
(su
pplie
d ou
tsid
e ho
spita
ls
excl
pro
sthe
sis)
108
388
0,38
6000
30,
4813
067
044
556
-3,9
215
0,04
1512
92,3
168
606
0,41
175
242
-3,8
2,04
2,13
-4,4
Pros
thes
es14
174
10,
5097
429
0,78
124
900
9480
78,
921
30,
0489
9-7
6,3
239
382
0,58
220
606
8,5
2,89
2,68
7,8
Am
bula
nce
Serv
ices
5259
80,
1811
832
0,09
4732
89
252
13,9
124
20,
2392
334
,565
671
0,16
5750
414
,20,
790,
7013
,5O
ther
235
245
0,83
275
393
2,21
164
641
429
047
-14,
05
926
1,09
862
587,
351
656
31,
2559
455
0-1
3,1
6,24
7,23
-13,
7C
AP
ITA
TE
D P
RIM
ARY
CA
RE
741
400
2,61
144
999
1,16
292
388
129
290
110,
2-
0,00
240
6-1
00,0
886
399
2,14
424
084
109,
010
,71
5,16
107,
7
TO
TA
L B
EN
EF
ITS
2846
057
510
012
467
702
100
2668
605
811
528
234
7,1
545
262
100
482
811
12,9
4147
353
810
038
697
103
7,17
501,
0347
0,39
6,5
OPE
NRE
STRI
CTE
DO
PEN
REST
RIC
TED
BARG
AIN
ING
CO
UN
CIL
SC
HEM
ESC
ON
SOLI
DAT
EDPA
BPM
SCH
EMES
SCH
EMES
SCH
EMES
SCH
EMES
2004
%20
04%
2003
2003
%20
04%
2003
%20
04%
2003
%20
0420
03%
R’00
0of
tota
lR’
000
of to
tal
R’00
0R’
000
Cha
nge
R’00
0of
tota
lR’
000
Cha
nge
R’00
0of
tota
lR’
000
Cha
nge
RR
Cha
nge
98 COUNCIL FOR MEDICAL SCHEMES Annual Report 2004-5
ANNEXURE H5
Anal
ysis
of
all
bene
fits
pai
dfo
r th
e ye
ar e
nded
31
Dece
mbe
r 20
04Analysis of all benefits paid
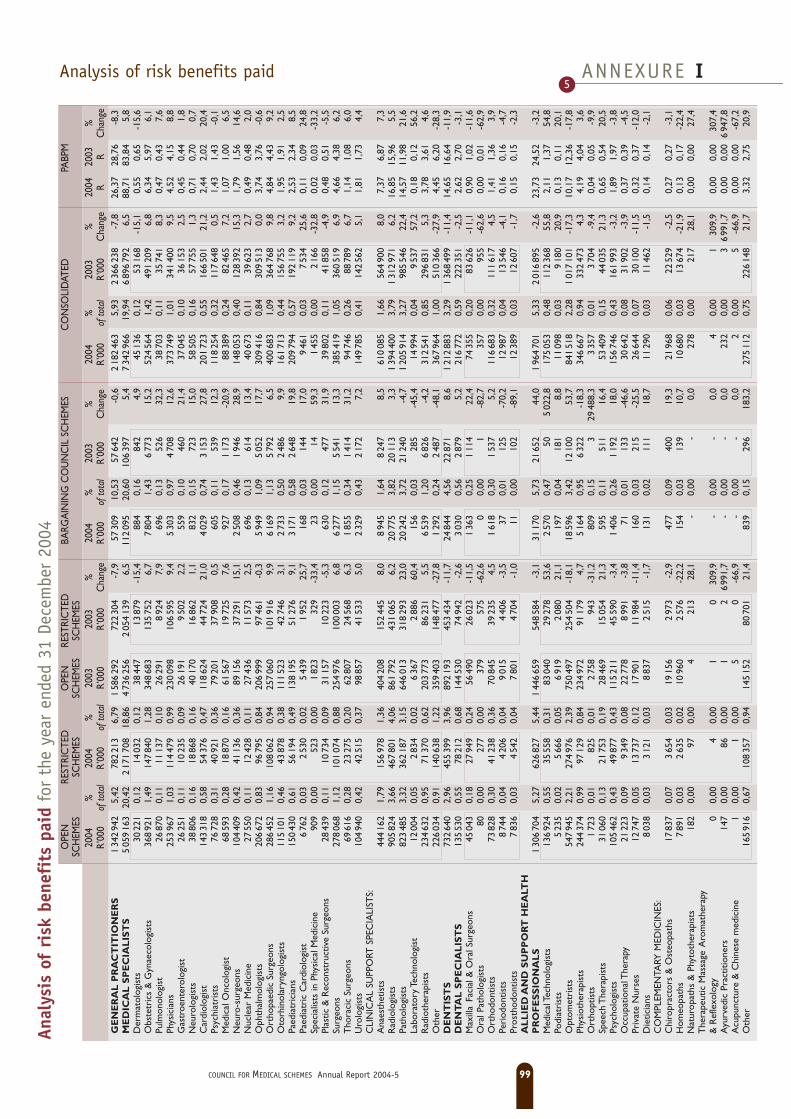
OPE
NRE
STRI
CTE
DO
PEN
REST
RIC
TED
BARG
AIN
ING
CO
UN
CIL
SC
HEM
ESC
ON
SOLI
DAT
EDPA
BPM
SCH
EMES
SCH
EMES
SCH
EMES
SCH
EMES
2004
%20
04%
2003
2003
%20
04%
2003
%20
04%
2003
%20
0420
03%
R’00
0of
tota
lR’
000
of to
tal
R’00
0R’
000
Cha
nge
R’00
0of
tota
lR’
000
Cha
nge
R’00
0of
tota
lR’
000
Cha
nge
RR
Cha
nge
GE
NE
RA
L P
RA
CT
ITIO
NE
RS
134
294
25,
4278
221
36,
791
586
292
722
304
-7,9
5730
910
,53
5764
2-0
,62
182
463
5,93
236
623
8-7
,826
,37
28,7
6-8
,3M
ED
ICA
L S
PE
CIA
LIS
TS
505
916
320
,42
217
170
818
,86
473
625
62
054
139
6,5
112
095
20,6
010
639
75,
47
342
966
19,9
46
896
792
6,5
88,7
183
,84
5,8
Der
mat
olog
ists
3022
10,
1214
032
0,12
3844
713
879
-15,
488
40,
1684
24,
945
136
0,12
5316
8-1
5,1
0,55
0,65
-15,
6O
bste
tric
s &
Gyn
aeco
logi
sts
368
921
1,49
147
840
1,28
348
683
135
752
6,7
780
41,
436
773
15,2
524
564
1,42
491
209
6,8
6,34
5,97
6,1
Pulm
onol
ogis
t26
870
0,11
1113
70,
1026
291
892
47,
969
60,
1352
632
,338
703
0,11
3574
18,
30,
470,
437,
6Ph
ysic
ians
253
967
1,03
114
479
0,99
230
098
106
595
9,4
530
30,
974
708
12,6
373
749
1,01
341
400
9,5
4,52
4,15
8,8
Gas
troe
nter
olog
ist
2625
10,
1110
235
0,09
2619
19
502
2,2
559
0,10
460
21,4
3704
50,
1036
153
2,5
0,45
0,44
1,8
Neu
rolo
gist
s38
806
0,16
1886
80,
1640
170
1686
21,
183
20,
1572
315
,058
505
0,16
5775
51,
30,
710,
700,
7C
ardi
olog
ist
143
318
0,58
5437
60,
4711
862
444
724
21,0
402
90,
743
153
27,8
201
723
0,55
166
501
21,2
2,44
2,02
20,4
Psyc
hiat
rist
s76
728
0,31
4092
10,
3679
201
3790
80,
560
50,
1153
912
,311
825
40,
3211
764
80,
51,
431,
43-0
,1M
edic
al O
ncol
ogis
t68
593
0,28
1887
00,
1661
567
1972
57,
692
70,
171
173
-20,
988
389
0,24
8246
57,
21,
071,
006,
5N
euro
-sur
geon
s10
440
90,
4241
136
0,36
8915
637
291
15,1
250
80,
461
946
28,9
148
053
0,40
128
392
15,3
1,79
1,56
14,6
Nuc
lear
Med
icin
e27
550
0,11
1242
80,
1127
436
1157
32,
569
60,
1361
413
,440
673
0,11
3962
32,
70,
490,
482,
0O
phth
alm
olog
ists
206
672
0,83
9679
50,
8420
699
997
461
-0,3
594
91,
095
052
17,7
309
416
0,84
309
513
0,0
3,74
3,76
-0,6
Ort
hopa
edic
Sur
geon
s28
645
21,
1610
806
20,
9425
706
010
191
69,
96
169
1,13
579
26,
540
068
31,
0936
476
89,
84,
844,
439,
2O
torh
inol
aryn
golo
gist
s11
510
10,
4643
878
0,38
111
523
4274
63,
12
733
0,50
248
69,
916
171
30,
4415
675
53,
21,
951,
912,
5Pa
edia
tric
ians
150
430
0,61
5619
40,
4913
819
551
276
9,1
317
10,
582
648
19,8
209
794
0,57
192
119
9,2
2,53
2,34
8,5
Paed
iatr
ic C
ardi
olog
ist
676
20,
032
530
0,02
543
91
952
25,7
168
0,03
144
17,0
946
10,
037
534
25,6
0,11
0,09
24,8
Spec
ialis
ts in
Phy
sica
l Med
icin
e90
90,
0052
30,
001
823
329
-33,
423
0,00
1459
,31
455
0,00
216
6-3
2,8
0,02
0,03
-33,
2Pl
astic
& R
econ
stru
ctiv
e Su
rgeo
ns28
439
0,11
1073
40,
0931
157
1022
3-5
,363
00,
1247
731
,939
802
0,11
4185
8-4
,90,
480,
51-5
,5Su
rgeo
ns27
806
81,
1210
107
40,
8825
497
610
000
36,
86
277
1,15
554
113
,338
541
91,
0536
051
96,
94,
664,
386,
2T
hora
cic
Surg
eons
6961
60,
2823
275
0,20
6280
724
568
6,3
185
50,
341
414
31,2
9474
60,
2688
789
6,7
1,14
1,08
6,0
Uro
logi
sts
104
940
0,42
4251
50,
3798
857
4153
35,
02
329
0,43
217
27,
214
978
50,
4114
256
25,
11,
811,
734,
4C
LIN
ICA
L SU
PPO
RT S
PEC
IALI
STS:
Ana
esth
etis
ts44
416
21,
7915
697
81,
3640
420
815
244
58,
08
945
1,64
824
78,
561
008
51,
6656
490
08,
07,
376,
877,
3R
adio
logi
sts
905
824
3,66
467
801
4,06
861
792
431
065
6,2
2077
53,
8220
113
3,3
139
440
03,
791
312
971
6,2
16,8
515
,96
5,5
Path
olog
ists
823
485
3,32
362
187
3,15
646
013
318
293
23,0
2024
23,
7221
240
-4,7
120
591
43,
2798
554
622
,414
,57
11,9
821
,6La
bora
tory
Tec
hnol
ogis
t12
004
0,05
283
40,
026
367
288
660
,415
60,
0328
5-4
5,4
1499
40,
049
537
57,2
0,18
0,12
56,2
Rad
ioth
erap
ists
234
632
0,95
7137
00,
6220
377
386
231
5,5
653
91,
206
826
-4,2
312
541
0,85
296
831
5,3
3,78
3,61
4,6
Oth
er22
603
40,
9114
063
81,
2235
940
314
847
7-2
7,8
129
20,
242
487
-48,
136
796
41,
0051
036
6-2
7,9
4,45
6,20
-28,
3D
EN
TIS
TS
732
640
2,96
455
399
3,96
892
193
453
434
-11,
724
844
4,56
2287
18,
61
212
883
3,29
136
849
9-1
1,4
14,6
516
,64
-11,
9D
EN
TA
L S
PE
CIA
LIS
TS
135
530
0,55
7821
20,
6814
453
074
942
-2,6
303
00,
562
879
5,2
216
772
0,59
222
351
-2,5
2,62
2,70
-3,1
Max
illa
Faci
al &
Ora
l Sur
geon
s45
043
0,18
2794
90,
2456
490
2602
3-1
1,5
136
30,
251
114
22,4
7435
50,
2083
626
-11,
10,
901,
02-1
1,6
Ora
l Pat
holo
gist
s80
0,00
277
0,00
379
575
-62,
60
0,00
1-8
2,7
357
0,00
955
-62,
60,
000,
01-6
2,9
Ort
hodo
ntis
ts73
828
0,30
4123
80,
3670
845
3923
54,
51
618
0,30
153
75,
211
668
30,
3211
161
74,
51,
411,
363,
9Pe
riod
ontis
ts8
744
0,04
420
60,
049
015
440
6-3
,537
0,01
125
-70,
212
987
0,04
1354
6-4
,10,
160,
16-4
,7Pr
osth
odon
tists
783
60,
034
542
0,04
780
14
704
-1,0
110,
0010
2-8
9,1
1238
90,
0312
607
-1,7
0,15
0,15
-2,3
AL
LIE
D A
ND
SU
PP
OR
T H
EA
LTH
P
RO
FE
SS
ION
AL
S1
306
704
5,27
626
827
5,44
144
665
954
858
4-3
,131
170
5,73
2165
244
,01
964
701
5,33
201
689
5-2
,623
,73
24,5
2-3
,2M
edic
al T
echn
olog
ists
136
924
0,55
3555
80,
3183
040
2927
853
,62
570
0,47
505
022,
817
505
30,
4811
236
855
,82,
111,
3754
,8Po
diat
rist
s5
235
0,02
566
60,
056
919
208
021
,119
70,
0418
18,
811
098
0,03
918
020
,90,
130,
1120
,1O
ptom
etri
sts
547
945
2,21
274
976
2,39
750
497
254
504
-18,
118
596
3,42
1210
053
,784
151
82,
281
017
101
-17,
310
,17
12,3
6-1
7,8
Phys
ioth
erap
ists
244
374
0,99
9712
90,
8423
497
291
179
4,7
516
40,
956
322
-18,
334
666
70,
9433
247
34,
34,
194,
043,
6O
rtho
ptis
ts1
723
0,01
825
0,01
275
894
3-3
1,2
809
0,15
329
488,
33
357
0,01
370
4-9
,40,
040,
05-9
,9Sp
eech
The
rapi
sts
3106
00,
1321
753
0,19
2846
915
054
21,3
595
0,11
511
16,4
5340
90,
1544
035
21,3
0,65
0,54
20,5
Psyc
holo
gist
s10
546
20,
4349
877
0,43
115
211
4559
0-3
,41
406
0,26
119
218
,015
674
60,
4316
199
3-3
,21,
891,
97-3
,8O
ccup
atio
nal T
hera
py21
223
0,09
934
90,
0822
778
899
1-3
,871
0,01
133
-46,
630
642
0,08
3190
2-3
,90,
370,
39-4
,5Pr
ivat
e N
urse
s12
747
0,05
1373
70,
1217
901
1198
4-1
1,4
160
0,03
215
-25,
526
644
0,07
3010
0-1
1,5
0,32
0,37
-12,
0D
ietic
ians
803
80,
033
121
0,03
883
72
515
-1,7
131
0,02
111
18,7
1129
00,
0311
462
-1,5
0,14
0,14
-2,1
CO
MPL
EMEN
TARY
MED
ICIN
ES:
Chi
ropr
acto
rs &
Ost
eopa
ths
1783
70,
073
654
0,03
1915
62
973
-2,9
477
0,09
400
19,3
2196
80,
0622
529
-2,5
0,27
0,27
-3,1
Hom
eopa
ths
789
10,
032
635
0,02
1096
02
576
-22,
215
40,
0313
910
,710
680
0,03
1367
4-2
1,9
0,13
0,17
-22,
4N
atur
opat
hs &
Phy
toth
erap
ists
182
0,00
970,
004
213
28,1
-0,
00-
0,0
278
0,00
217
28,1
0,00
0,00
27,4
The
rape
utic
Mas
sage
Aro
mat
hera
py
& R
efle
xolo
gy0
0,00
40,
001
030
9,9
-0,
00-
0,0
40,
001
309,
90,
000,
0030
7,4
Ayu
rved
ic P
ract
ition
ers
147
0,00
860,
001
269
91,7
-0,
00-
0,0
232
0,00
36
991,
70,
000,
006
947,
8A
cupu
nctu
re &
Chi
nese
med
icin
e1
0,00
10,
005
0-6
6,9
-0,
00-
0,0
20,
005
-66,
90,
000,
00-6
7,2
Oth
er16
591
60,
6710
835
70,
9414
515
280
701
21,4
839
0,15
296
183,
227
511
20,
7522
614
821
,73,
322,
7520
,9
COUNCIL FOR MEDICAL SCHEMES Annual Report 2004-5 99
ANNEXURE I5
Anal
ysis
of
risk
ben
efit
s pa
idfo
r th
e ye
ar e
nded
31
Dece
mbe
r 20
04Analysis of risk benefits paid

TO
TA
L H
OS
PIT
AL
S10
929
417
44,1
24
519
608
39,2
69
074
696
394
635
218
,622
413
541
,18
181
586
23,4
1567
316
142
,56
1320
263
418
,718
9,34
160,
4918
,0PR
IVAT
E H
OSP
ITA
LS9
909
179
40,0
03
970
880
34,4
98
103
130
349
945
719
,621
338
739
,21
176
967
20,6
1409
344
638
,27
1177
955
419
,617
0,26
143,
1918
,9W
ard
Fees
417
096
316
,84
183
338
615
,93
333
863
91
578
094
22,1
189
022
34,7
315
737
820
,16
193
371
16,8
25
074
110
22,1
74,8
261
,68
21,3
The
atre
Fee
s2
635
992
10,6
482
820
37,
191
789
103
743
751
36,8
1294
02,
385
429
138,
33
477
135
9,44
253
828
337
,042
,01
30,8
536
,1C
onsu
mab
les
145
290
25,
8635
595
13,
091
572
865
390
751
-7,9
245
90,
451
576
56,0
181
131
14,
921
965
192
-7,8
21,8
823
,89
-8,4
Med
icin
es d
ispe
nsed
164
932
36,
6695
334
08,
281
402
523
786
861
18,9
896
61,
6512
584
-28,
82
611
628
7,09
220
196
818
,631
,55
26,7
717
,9G
loba
l / p
er d
iem
fee
910
134
3,67
407
685
3,54
847
411
339
638
11,0
427
60,
79-
N/A
132
209
63,
591
187
049
11,4
15,9
714
,43
10,7
PRO
VIN
CIA
L H
OSP
ITA
LS11
010
40,
4414
104
31,
2312
415
510
725
78,
56
472
1,19
461
940
,125
761
90,
7023
603
19,
13,
112,
878,
5W
ard
Fees
8575
70,
3510
353
10,
9096
182
6330
618
,74
295
0,79
364
917
,719
358
30,
5316
313
618
,72,
341,
9817
,9T
heat
re F
ees
491
50,
0211
472
0,10
842
115
194
-30,
698
70,
1821
835
2,7
1737
40,
0523
832
-27,
10,
210,
29-2
7,6
Con
sum
able
s9
743
0,04
2309
20,
209
040
1347
945
,866
60,
1240
365
,433
501
0,09
2292
346
,10,
400,
2845
,2M
edic
ines
dis
pens
ed9
689
0,04
294
80,
0310
512
1527
9-5
1,0
523
0,10
349
49,9
1316
10,
0426
140
-49,
70,
160,
32-5
0,0
ME
DIC
INE
S4
011
826
16,1
92
284
526
19,8
44
781
306
209
952
3-8
,583
923
15,4
282
316
2,0
638
027
617
,32
696
314
5-8
,477
,08
84,6
4-8
,9M
edic
ines
dis
pens
ed b
y Ph
arm
acis
ts3
322
643
13,4
11
871
236
16,2
53
696
177
155
723
1-1
,164
355
11,8
258
516
10,0
525
823
414
,28
531
192
5-1
,063
,52
64,5
7-1
,6M
edic
ines
dis
pens
ed b
y Pr
actit
ione
rs67
780
22,
7440
651
83,
531
073
074
529
581
-32,
319
514
3,59
2375
3-1
7,8
110
383
43,
001
626
408
-32,
113
,33
19,7
7-3
2,6
Med
icin
es d
ispe
nsed
by
Alli
ed a
nd
Supp
ort
Hea
lth P
rofe
ssio
nals
1138
10,
056
772
0,06
1205
512
711
-26,
754
0,01
4617
,318
207
0,05
2481
2-2
6,6
0,22
0,30
-27,
1E
X-G
RA
TIA
PA
YM
EN
TS
1205
30,
0513
732
0,12
973
212
481
16,1
182
0,03
208
7-9
1,3
2596
70,
0724
300
6,9
0,31
0,30
6,2
OT
HE
R B
EN
EF
ITS
501
662
2,03
435
208
3,78
444
818
570
006
-7,7
759
61,
402
700
181,
394
446
62,
561
017
524
-7,2
11,4
112
,37
-7,8
App
lianc
es (
supp
lied
outs
ide
hosp
itals
ex
cl p
rost
hesi
s)80
371
0,32
5780
10,
5011
367
042
254
-11,
421
50,
0415
129
2,3
138
387
0,38
155
939
-11,
31,
671,
90-1
1,8
Pros
thes
es14
070
60,
5796
038
0,83
123
125
9359
59,
221
30,
0489
9-7
6,3
236
957
0,64
217
619
8,9
2,86
2,65
8,2
Am
bula
nce
Serv
ices
5252
00,
2111
706
0,10
4729
39
099
13,9
124
20,
2392
334
,565
468
0,18
5731
514
,20,
790,
7013
,5O
ther
228
064
0,92
269
664
2,34
160
730
425
058
-15,
05
926
1,09
862
587,
350
365
41,
3758
665
0-1
4,1
6,08
7,13
-14,
7C
AP
ITA
TE
D P
RIM
ARY
CA
RE
741
400
2,99
144
999
1,26
292
388
129
290
110,
2-
0,00
240
6-1
00,0
886
399
2,41
424
084
109,
010
,71
5,16
107,
7
TO
TA
L R
ISK
BE
NE
FIT
S24
773
338
100
1151
243
210
023
408
869
1061
105
66,
754
428
410
048
253
612
,836
830
053
100
3450
246
16,
7544
4,93
419,
406,
1
OPE
NRE
STRI
CTE
DO
PEN
REST
RIC
TED
BARG
AIN
ING
CO
UN
CIL
SC
HEM
ESC
ON
SOLI
DAT
EDPA
BPM
SCH
EMES
SCH
EMES
SCH
EMES
SCH
EMES
2004
%20
04%
2003
2003
%20
04%
2003
%20
04%
2003
%20
0420
03%
R’00
0of
tota
lR’
000
of to
tal
R’00
0R’
000
Cha
nge
R’00
0of
tota
lR’
000
Cha
nge
R’00
0of
tota
lR’
000
Cha
nge
RR
Cha
nge
Note
s:•
PAB
PM
= p
er a
vera
ge b
enef
icia
ry p
er m
on
th
100 COUNCIL FOR MEDICAL SCHEMES Annual Report 2004-5
ANNEXURE I5
Anal
ysis
of
risk
ben
efit
s pa
idfo
r th
e ye
ar e
nded
31
Dece
mbe
r 20
04Analysis of risk benefits paid

GE
NE
RA
L P
RA
CT
ITIO
NE
RS
548
431
14,8
717
247
618
,06
430
783
158
098
22,4
979
100,
0027
525
5,8
721
885
15,5
558
915
622
,58,
727,
1621
,8M
ED
ICA
L S
PE
CIA
LIS
TS
762
952
20,6
913
458
814
,09
592
839
115
110
26,8
-0,
00-
0,0
897
540
19,3
370
794
926
,810
,84
8,61
26,0
Der
mat
olog
ists
1835
20,
504
650
0,49
1580
54
593
12,8
-0,
00-
0,0
2300
30,
5020
398
12,8
0,28
0,25
12,1
Obs
tetr
ics
& G
ynae
colo
gist
s80
689
2,19
1690
21,
7761
719
1519
226
,9-
0,00
-0,
097
592
2,10
7691
226
,91,
180,
9326
,1Pu
lmon
olog
ist
521
30,
1495
70,
104
454
914
14,9
-0,
00-
0,0
617
00,
135
368
14,9
0,07
0,07
14,2
Phys
icia
ns37
099
1,01
864
40,
9028
705
862
022
,6-
0,00
-0,
045
743
0,99
3732
522
,60,
550,
4521
,8G
astr
oent
erol
ogis
t3
958
0,11
782
0,08
307
363
527
,8-
0,00
-0,
04
740
0,10
370
827
,80,
060,
0527
,0N
euro
logi
sts
918
30,
252
051
0,21
720
71
842
24,1
-0,
00-
0,0
1123
50,
249
050
24,1
0,14
0,11
23,4
Car
diol
ogis
t22
609
0,61
444
20,
4718
110
400
922
,3-
0,00
-0,
027
051
0,58
2211
922
,30,
330,
2721
,5Ps
ychi
atri
sts
1285
00,
352
586
0,27
1192
82
609
6,2
-0,
00-
0,0
1543
60,
3314
536
6,2
0,19
0,18
5,5
Med
ical
Onc
olog
ist
102
00,
0322
50,
0281
726
814
,7-
0,00
-0,
01
245
0,03
108
514
,70,
020,
0114
,0N
euro
-sur
geon
s4
324
0,12
145
50,
153
071
123
534
,2-
0,00
-0,
05
779
0,12
430
634
,20,
070,
0533
,4N
ucle
ar M
edic
ine
417
70,
1128
50,
033
645
222
15,4
-0,
00-
0,0
446
20,
103
866
15,4
0,05
0,05
14,7
Oph
thal
mol
ogis
ts29
530
0,80
789
00,
8324
723
759
015
,8-
0,00
-0,
037
419
0,81
3231
315
,80,
450,
3915
,1O
rtho
paed
ic S
urge
ons
1877
30,
515
501
0,58
1435
74
979
25,5
-0,
00-
0,0
2427
50,
5219
336
25,5
0,29
0,24
24,8
Oto
rhin
olar
yngo
logi
sts
1582
30,
433
908
0,41
1322
23
726
16,4
-0,
00-
0,0
1973
10,
4216
948
16,4
0,24
0,21
15,7
Paed
iatr
icia
ns38
899
1,05
904
80,
9529
828
837
125
,5-
0,00
-0,
047
947
1,03
3820
025
,50,
580,
4624
,7Pa
edia
tric
Car
diol
ogis
t1
574
0,04
219
0,02
115
220
432
,2-
0,00
-0,
01
793
0,04
135
732
,20,
020,
0231
,4Sp
ecia
lists
in P
hysi
cal M
edic
ine
232
0,01
730,
0121
267
8,9
-0,
00-
0,0
305
0,01
280
8,9
0,00
0,00
8,2
Plas
tic &
Rec
onst
ruct
ive
Surg
eons
361
00,
1093
20,
102
909
824
21,7
-0,
00-
0,0
454
20,
103
733
21,7
0,05
0,05
20,9
Surg
eons
1706
30,
464
394
0,46
1147
63
890
39,6
-0,
00-
0,0
2145
70,
4615
366
39,6
0,26
0,19
38,8
Tho
raci
c Su
rgeo
ns92
70,
0333
20,
0357
022
757
,9-
0,00
-0,
01
259
0,03
798
57,9
0,02
0,01
56,9
Uro
logi
sts
1286
10,
353
164
0,33
1023
12
758
23,4
-0,
00-
0,0
1602
50,
3512
989
23,4
0,19
0,16
22,6
CLI
NIC
AL
SUPP
ORT
SPE
CIA
LIST
SA
naes
thet
ists
1016
40,
283
003
0,31
348
21
867
146,
2-
0,00
-0,
013
168
0,28
534
914
6,2
0,16
0,07
144,
7R
adio
logi
sts
172
974
4,69
2204
92,
3113
020
215
868
33,5
-0,
00-
0,0
195
022
4,20
146
070
33,5
2,36
1,78
32,7
Path
olog
ists
232
591
6,31
2992
03,
1318
616
123
825
25,0
-0,
00-
0,0
262
511
5,65
209
986
25,0
3,17
2,55
24,2
Labo
rato
ry T
echn
olog
ist
310,
0041
0,00
115
10-4
1,8
-0,
00-
0,0
730,
0012
5-4
1,8
0,00
0,00
-42,
2R
adio
ther
apis
ts2
234
0,06
410
0,04
191
244
412
,2-
0,00
-0,
02
644
0,06
235
612
,20,
030,
0311
,5O
ther
619
10,
1772
40,
083
753
320
69,8
-0,
00-
0,0
691
50,
154
073
69,8
0,08
0,05
68,7
DE
NT
IST
S39
662
210
,76
7055
47,
3934
322
160
864
15,6
-0,
00-
0,0
467
176
10,0
640
408
515
,65,
644,
9114
,9D
EN
TA
L S
PE
CIA
LIS
TS
7630
92,
0712
448
1,30
6012
111
525
23,9
-0,
00-
0,0
8875
61,
9171
646
23,9
1,07
0,87
23,1
Max
illa
Faci
al &
Ora
l Sur
geon
s15
091
0,41
197
80,
2110
717
189
035
,4-
0,00
-0,
017
069
0,37
1260
735
,40,
210,
1534
,6O
ral P
atho
logi
sts
230,
001
0,00
2436
-59,
6-
0,00
-0,
024
0,00
60-5
9,6
0,00
0,00
-59,
8O
rtho
dont
ists
4946
41,
348
443
0,88
3890
97
697
24,2
-0,
00-
0,0
5790
71,
2546
606
24,2
0,70
0,57
23,5
Peri
odon
tists
707
60,
1997
50,
106
120
108
311
,8-
0,00
-0,
08
051
0,17
720
311
,80,
100,
0911
,1Pr
osth
odon
tists
465
40,
131
051
0,11
435
181
910
,4-
0,00
-0,
05
706
0,12
517
010
,40,
070,
069,
7A
LL
IED
AN
D S
UP
PO
RT
HE
ALT
H
PR
OF
ES
SIO
NA
LS
616
863
16,7
315
557
416
,29
513
910
142
842
17,6
-0,
00-
0,0
772
436
16,6
365
675
317
,69,
337,
9816
,9M
edic
al T
echn
olog
ists
564
00,
1560
10,
061
214
545
254,
9-
0,00
-0,
06
242
0,13
175
925
4,9
0,08
0,02
252,
7Po
diat
rist
s5
106
0,14
131
10,
144
280
124
316
,2-
0,00
-0,
06
418
0,14
552
316
,20,
080,
0715
,5O
ptom
etri
sts
423
801
11,4
911
240
211
,77
355
300
104
662
16,6
-0,
00-
0,0
536
202
11,5
545
996
116
,66,
485,
5915
,9Ph
ysio
ther
apis
ts69
340
1,88
1873
11,
9657
672
1680
418
,3-
0,00
-0,
088
071
1,90
7447
618
,31,
060,
9117
,5O
rtho
ptis
ts15
10,
0016
0,00
102
1740
,6-
0,00
-0,
016
70,
0011
940
,60,
000,
0039
,7Sp
eech
The
rapi
sts
1352
60,
371
907
0,20
1156
61
857
15,0
-0,
00-
0,0
1543
40,
3313
424
15,0
0,19
0,16
14,3
Psyc
holo
gist
s48
244
1,31
744
40,
7845
334
755
35,
3-
0,00
-0,
055
688
1,20
5288
85,
30,
670,
644,
6O
ccup
atio
nal T
hera
py12
035
0,33
240
30,
2510
563
241
311
,3-
0,00
-0,
014
438
0,31
1297
611
,30,
170,
1610
,6Pr
ivat
e N
urse
s2
407
0,07
544
0,06
254
972
9-1
0,0
-0,
00-
0,0
295
10,
063
278
-10,
00,
040,
04-1
0,5
Die
ticia
ns3
887
0,11
123
90,
133
191
111
918
,9-
0,00
-0,
05
126
0,11
431
018
,90,
060,
0518
,2C
hiro
prac
tors
& O
steo
path
s9
948
0,27
263
00,
287
625
232
426
,4-
0,00
-0,
012
578
0,27
994
926
,40,
150,
1225
,6H
omeo
path
s6
240
0,17
143
90,
155
346
221
81,
5-
0,00
-0,
07
678
0,17
756
41,
50,
090,
090,
9N
atur
opat
hs &
Phy
toth
erap
ists
20,
003
0,00
--
N/A
-0,
00-
0,0
50,
00-
N/A
0,00
0,00
N/A
The
rape
utic
Mas
sage
Aro
mat
hera
py &
R
efle
xolo
gy9
0,00
40,
004
537
,1-
0,00
-0,
013
0,00
937
,10,
000,
0036
,3A
yurv
edic
Pra
ctiti
oner
s2
0,00
00,
001
176
,6-
0,00
-0,
02
0,00
176
,60,
000,
0075
,5A
cupu
nctu
re &
Chi
nese
med
icin
e0
0,00
00,
00-
-N
/A-
0,00
-0,
00
0,00
-N
/A0,
000,
00N
/AO
ther
1652
30,
454
899
0,51
916
31
353
103,
7-
0,00
-0,
021
421
0,46
1051
610
3,7
0,26
0,13
102,
4
OPE
NRE
STRI
CTE
DO
PEN
REST
RIC
TED
BARG
AIN
ING
CO
UN
CIL
SC
HEM
ESC
ON
SOLI
DAT
EDPA
BPM
SCH
EMES
SCH
EMES
SCH
EMES
SCH
EMES
2004
%20
04%
2003
2003
%20
04%
2003
%20
04%
2003
%20
0420
03%
R’00
0of
tota
lR’
000
of to
tal
R’00
0R’
000
Cha
nge
R’00
0of
tota
lR’
000
Cha
nge
R’00
0of
tota
lR’
000
Cha
nge
RR
Cha
nge
COUNCIL FOR MEDICAL SCHEMES Annual Report 2004-5 101
ANNEXURE J5
Anal
ysis
of
savi
ngs
bene
fits
pai
dfo
r th
e ye
ar e
nded
31
Dece
mbe
r 20
04Analysis of savings benefits paid

OPE
NRE
STRI
CTE
DO
PEN
REST
RIC
TED
BARG
AIN
ING
CO
UN
CIL
SC
HEM
ESC
ON
SOLI
DAT
EDPA
BPM
SCH
EMES
SCH
EMES
SCH
EMES
SCH
EMES
2004
%20
04%
2003
2003
%20
04%
2003
%20
04%
2003
%20
0420
03%
R’00
0of
tota
lR’
000
of to
tal
R’00
0R’
000
Cha
nge
R’00
0of
tota
lR’
000
Cha
nge
R’00
0of
tota
lR’
000
Cha
nge
RR
Cha
nge
TO
TA
L H
OS
PIT
AL
S60
421
1,64
1039
01,
0930
624
5008
7-1
2,3
-0,
00-
0,0
7081
21,
5280
710
-12,
30,
860,
98-1
2,8
PRIV
ATE
HO
SPIT
ALS
5775
51,
578
768
0,92
2827
739
673
-2,1
-0,
00-
0,0
6652
31,
4367
950
-2,1
0,80
0,83
-2,7
War
d Fe
es10
020
0,27
191
80,
206
837
795
1-1
9,3
-0,
00-
0,0
1193
80,
2614
788
-19,
30,
140,
18-1
9,8
The
atre
Fee
s30
864
0,84
165
30,
1712
136
494
490
,4-
0,00
-0,
032
517
0,70
1708
090
,40,
390,
2189
,2C
onsu
mab
les
803
20,
221
494
0,16
204
710
248
-22,
5-
0,00
-0,
09
526
0,21
1229
5-2
2,5
0,12
0,15
-23,
0M
edic
ines
dis
pens
ed8
840
0,24
370
20,
397
257
1653
0-4
7,3
-0,
00-
0,0
1254
20,
2723
787
-47,
30,
150,
29-4
7,6
Glo
bal /
per
die
m fe
e-
0,00
-0,
00-
-0,
0-
0,00
-0,
0-
0,00
-0,
00,
000,
000,
0PR
OV
INC
IAL
HO
SPIT
ALS
266
60,
071
623
0,17
234
710
413
-66,
4-
0,00
-0,
04
289
0,09
1276
1-6
6,4
0,05
0,16
-66,
6W
ard
Fees
220
10,
061
394
0,15
178
332
870
,3-
0,00
-0,
03
596
0,08
211
170
,30,
040,
0369
,3T
heat
re F
ees
670,
0027
0,00
7423
-3,1
-0,
00-
0,0
940,
0097
-3,1
0,00
0,00
-3,7
Con
sum
able
s19
80,
0111
70,
0135
79
561
-96,
8-
0,00
-0,
031
60,
019
918
-96,
80,
000,
12-9
6,8
Med
icin
es d
ispe
nsed
199
0,01
850,
0113
350
1-5
5,2
-0,
00-
0,0
284
0,01
634
-55,
20,
000,
01-5
5,5
ME
DIC
INE
S1
189
299
32,2
538
977
540
,80
128
295
737
099
2-4
,5-
0,00
-0,
01
579
074
34,0
11
653
949
-4,5
19,0
820
,10
-5,1
Med
icin
es d
ispe
nsed
by
Phar
mac
ists
101
128
527
,43
329
685
34,5
11
153
182
282
203
-6,6
-0,
00-
0,0
134
097
028
,88
143
538
5-6
,616
,20
17,4
5-7
,2M
edic
ines
dis
pens
ed b
y Pr
actit
ione
rs17
425
64,
7358
587
6,13
123
997
8698
710
,4-
0,00
-0,
023
284
35,
0121
098
410
,42,
812,
569,
7M
edic
ines
dis
pens
ed b
y A
llied
and
Su
ppor
t H
ealth
Pro
fess
iona
ls3
758
0,10
150
20,
165
778
180
2-3
0,6
-0,
00-
0,0
526
00,
117
580
-30,
60,
060,
09-3
1,0
EX
-GR
AT
IA P
AY
ME
NT
S31
0,00
170,
0012
320
8,5
-0,
00-
0,0
480,
0016
208,
50,
000,
0020
6,6
OT
HE
R B
EN
EF
ITS
3630
90,
989
448
0,99
2272
17
657
50,6
-0,
00-
0,0
4575
80,
9930
378
50,6
0,55
0,37
49,7
App
lianc
es (
supp
lied
outs
ide
hosp
itals
ex
cl p
rost
hesi
s)28
017
0,76
220
20,
2317
000
230
356
,6-
0,00
-0,
030
219
0,65
1930
356
,60,
370,
2355
,6Pr
osth
eses
103
50,
031
391
0,15
177
51
212
-18,
8-
0,00
-0,
02
426
0,05
298
7-1
8,8
0,03
0,04
-19,
3A
mbu
lanc
e Se
rvic
es77
0,00
126
0,01
3515
47,
8-
0,00
-0,
020
40,
0018
97,
80,
000,
007,
1O
ther
718
00,
195
729
0,60
391
13
989
63,4
-0,
00-
0,0
1290
90,
287
899
63,4
0,16
0,10
62,4
CA
PIT
AT
ED
PR
IMA
RY C
AR
E-
0,00
-0,
00-
-0,
0-
0,00
-0,
0-
0,00
-0,
00,
000,
000,
0
TO
TA
L S
AV
ING
S B
EN
EF
ITS
368
723
710
095
527
010
03
277
189
917
178
10,7
979
100
275
255,
84
643
485
100
419
464
210
,70
56,1
050
,99
10,0
Note
s:•
Glo
bal
/ p
er d
iem
ho
spit
al f
ee a
nd
cap
itat
ed p
rim
ary
care
are
no
t ap
pli
cab
le i
n t
his
sch
edu
le•
PAB
PM
= p
er a
vera
ge b
enef
icia
ry p
er m
on
th
102 COUNCIL FOR MEDICAL SCHEMES Annual Report 2004-5
ANNEXURE J5
Anal
ysis
of
savi
ngs
bene
fits
pai
dfo
r th
e ye
ar e
nded
31
Dece
mbe
r 20
04Analysis of savings benefits paid

RE
GIS
TE
RE
D S
CH
EM
ES
– O
PE
N15
89Ba
ymed
100
34
003
2,99
300
963
390
12,9
68
-0,
00-
60-
96,0
411
9(3
31)
(331
)(3
31)
(331
)(3
31)
-10,
99i
1252
Best
med
Med
ical
Sch
eme
2971
082
284
1,77
644
428
677
6011
29,
3363
777
51,
218
1184
2-
67,9
115
997
880
249
7475
492
148
206
012
206
012
31,9
715
12Bo
nita
s M
edic
al A
id F
und
206
175
527
575
1,58
388
396
757
328
953
87,
4543
135
157
3,48
2061
312
-78
,04
838
340
352
333
333
186
444
020
142
339
01
208
443
31,1
110
34C
ape
Med
ical
Pla
n5
464
1203
01,
1865
736
509
1622
524
,68
126
-0,
00-
25-
106,
99(4
131)
(20
381)
(20
265)
(942
4)14
895
612
276
218
6,75
1048
Com
mer
cial
and
Indu
stri
al
Med
ical
Aid
Soc
iety
(C
IMA
S)2
899
758
21,
6281
480
894
816
810
,02
902
451
3,01
2799
496
390
,35
779
0(2
860)
(315
5)5
116
116
427
107
638
132,
1015
52C
omm
unity
Med
ical
Aid
Sc
hem
e (C
OM
MED
)11
362
3157
01,
8322
245
957
237
856
17,0
297
389
01,
7510
175
3-
79,1
846
317
281
71
262
1308
014
418
912
786
957
,48
b14
91C
ompc
are
Med
ical
Sch
eme
1112
327
748
1,54
265
498
747
2832
410
,67
806
826
2,57
196
130
-77
,92
5568
114
401
1509
423
336
100
970
9864
837
,16
1125
Dis
cove
ry H
ealth
Med
ical
Sc
hem
e65
928
51
564
874
1,38
1296
589
271
51
535
728
11,8
485
319
549
2,46
1831
726
2(4
727)
68,6
73
323
070
114
580
31
125
562
140
347
73
067
443
306
285
123
,62
1596
Eclip
se M
edic
al S
chem
e46
21
023
1,23
216
237
521
910
,11
38-
0,00
-64
-85
,13
309
2626
4747
472,
19i
1202
Fedh
ealth
5894
814
224
71,
441
150
211
681
140
511
12,2
283
2352
82,
0514
2567
8-
79,9
118
564
9(4
067)
(260
8)43
281
307
940
296
465
25,7
715
01Fr
ee S
tate
Med
ical
Aid
Sch
eme
121
329
1,72
201
748
324
011
,90
58-
0,00
--
-91
,88
147
(93)
(93)
3896
596
547
,84
1554
Gen
esis
Med
ical
Sch
eme
868
726
588
2,10
104
085
382
1706
416
,39
63-
0,00
-1
748
-74
,64
2173
42
922
292
28
826
6032
060
320
57,9
515
61G
en-H
ealth
Med
ical
Sch
eme
671
616
856
1,48
8173
345
720
529
25,1
211
5-
0,00
-2
740
-63
,48
2534
92
080
(170
5)95
046
231
4623
156
,56
1162
Glo
bal H
ealth
2473
557
665
1,40
478
171
639
4742
39,
9263
907
61,
9012
138
0-
91,8
632
149
(25
731)
(26
200)
(476
2)10
084
698
556
20,6
114
66G
ood
Hop
e M
edic
al A
id
Soci
ety
325
010
393
2,30
2675
121
12
948
11,0
223
235
0,88
242
1-
89,4
12
834
(769
)(9
45)
150
234
163
3392
412
6,81
1537
Hos
med
Med
ical
Aid
Sch
eme
3551
513
299
22,
8859
772
737
967
829
11,3
543
2390
74,
0015
311
020
283
,56
9828
23
638
(613
2)9
486
182
218
182
218
30,4
9a
1577
Ingw
e H
ealth
Pla
n19
752
3322
80,
8013
253
936
818
840
14,2
152
1601
912
,09
443
838
-75
,72
3188
1(6
815)
(678
3)(1
988)
4280
742
807
32,3
015
56K
waZ
ulu-
Nat
al M
edic
al A
id
Sche
me
439
916
998
2,85
6566
836
013
597
20,7
175
163
72,
499
210
3-
79,6
513
364
(397
3)(6
201)
(355
)73
402
6808
410
3,68
1576
Libe
rty
Med
ical
Sch
eme
4149
594
833
1,30
764
819
667
7216
59,
4463
3415
54,
4730
922
2-
70,9
418
533
769
795
7248
686
490
165
209
158
948
20,7
815
36Li
fem
ed M
edic
al S
chem
e3
318
885
11,
6791
063
847
936
710
,29
872
277
2,50
211
813
-82
,54
1589
52
438
242
04
182
3215
030
007
32,9
511
42M
edic
al E
xpen
ses
Dist
ribu
tion
Soci
ety
(MED
S)10
892
2253
11,
0922
107
476
723
454
10,6
181
480
22,
1717
253
3-
83,6
235
010
422
14
115
1044
797
510
8381
737
,91
1549
Med
icov
er 2
000
3791
110
273
71,
7057
476
050
645
648
7,94
4010
068
1,75
914
297
-76
,52
113
562
4354
941
711
7980
849
522
649
460
186
,05
1149
Med
ihel
p10
566
219
754
00,
862
636
709
110
820
150
67,
6485
3674
21,
3915
1298
2-
88,6
828
612
534
895
3629
975
762
502
665
495
544
27,1
2d
1506
Med
imed
Med
ical
Sch
eme
472
112
724
1,70
7029
146
66
209
8,83
4139
40,
563
--
72,6
416
437
983
49
834
1194
431
806
3180
645
,25
1140
Med
shie
ld M
edic
al S
chem
e75
418
199
070
1,72
136
533
852
123
437
717
,17
9047
807
3,50
1844
488
-58
,26
495
624
186
912
176
077
236
450
553
207
553
207
40,5
210
21M
erid
ian
Hea
lth1
878
428
91,
2754
040
862
413
67,
6566
146
32,
7123
950
1778
,16
940
62
874
273
910
228
4546
838
670
71,5
610
87M
unim
ed46
227
119
484
1,59
101
261
672
188
777
8,77
6327
621
2,73
2027
238
-87
,43
122
569
(21
067)
(23
811)
470
912
465
310
663
310
,53
1148
Myh
ealth
Med
ical
Sch
eme
0-
1,07
7278
835
58
904
12,2
343
165
12,
278
106
6-
77,7
115
351
373
02
866
463
4(0
)(0
)-
j11
66N
atio
nal I
ndep
ende
nt M
edic
al
Aid
Soc
iety
(N
IMA
S)15
580
3669
81,
3725
893
560
518
551
7,16
4323
30,
091
259
4-
88,6
128
054
677
16
631
1281
253
456
5261
920
,32
1167
Nat
iona
l Med
ical
Pla
n (N
MP)
6235
414
174
81,
281
292
193
745
101
195
7,83
5857
393
4,44
3319
910
-83
,72
168
623
(987
6)(9
599)
3795
329
878
228
019
321
,68
1170
NBC
Med
ical
Sch
eme
726
517
519
1,42
206
886
945
2203
010
,65
101
321
41,
5515
295
7-
80,5
737
158
895
88
730
921
836
769
3676
917
,77
1139
Om
nihe
alth
1388
634
811
1,64
380
375
685
4365
011
,48
793
183
0,84
68
160
-90
,67
3172
7(2
326
5)(2
663
4)(1
242
6)43
(693
)-0
,18
1560
Ope
npla
n M
edic
al S
chem
e18
394
4193
31,
2936
202
768
137
680
10,4
171
821
72,
2715
729
7-
86,0
345
466
(772
9)(7
176)
1009
216
101
515
817
143
,69
1215
Oxy
gen
8104
120
049
81,
4594
599
947
611
868
712
,55
6022
446
2,37
1126
064
-84
,95
132
095
(35
101)
(36
020)
(964
7)16
177
615
383
216
,26
1587
Path
finde
r M
edic
al S
chem
e2
194
486
20,
9812
298
408
320
626
,07
106
375
3,05
1232
7-
59,9
44
304
396
2733
3333
0,27
f15
46Ph
aros
Med
ical
Pla
n7
571
1876
21,
5213
327
962
421
161
15,8
899
264
41,
9812
158
6-
79,9
426
298
906
906
315
620
443
2044
315
,34
1454
Pro
Sano
Med
ical
Sch
eme
4307
111
641
41,
7185
502
161
081
033
9,48
5814
869
1,74
112
248
-92
,50
5028
8(4
786
3)(4
539
6)21
831
377
257
372
864
43,6
111
96Pr
otea
Med
ical
Aid
Soc
iety
180
93
132
0,74
3813
499
44
180
10,9
610
973
71,
9319
147
-97
,76
791
(427
2)(4
068)
(231
9)19
685
1954
451
,25
1285
Prot
ecto
r H
ealth
2217
770
356
1,69
566
492
556
5028
28,
8849
664
11,
177
985
5-
90,9
848
861
(17
917)
(20
860)
(20
620)
119
(384
9)-0
,68
1595
Pulz
Med
ical
Sch
eme
842
119
019
1,26
9140
256
513
780
15,0
885
206
0,23
12
786
(489
2)57
,73
3268
111
017
1068
411
719
1284
212
842
14,0
5h
1575
Res
olut
ion
Hea
lth M
edic
al
Sche
me
3013
776
819
1,54
385
918
478
100
088
25,9
412
414
062
3,64
179
064
-54
,97
159
531
3631
735
431
4113
495
622
9562
224
,78
1446
Selfm
ed M
edic
al S
chem
e13
522
3213
81,
4025
905
964
826
581
10,2
667
631
62,
4416
293
0-
82,5
641
914
608
76
049
2550
111
763
011
670
645
,05
1486
Sizw
e M
edic
al F
und
5825
315
372
81,
661
187
572
631
124
696
10,5
066
3669
63,
0920
866
9-
70,1
035
436
218
430
116
940
818
990
841
457
039
920
433
,62
1141
Spec
tram
ed68
302
200
224
1,97
103
064
848
711
471
711
,13
5421
759
2,11
1027
783
-68
,16
307
315
143
056
149
926
167
488
265
214
265
214
25,7
314
64Su
rem
ed H
ealth
286
97
269
1,44
4911
959
27
694
15,6
693
841
1,71
101
526
(199
)69
,93
1471
74
457
312
34
025
835
78
357
17,0
111
47Te
lem
ed24
847
5872
41,
3867
696
794
035
139
5,19
498
799
1,30
121
597
-95
,10
3292
0(1
261
6)(1
001
8)10
572
164
260
159
759
23,6
0
Ref
.N
ame
of M
edic
al S
chem
eM
embe
rsBe
nefic
iarie
sN
o.of
Gro
ssG
ross
Adm
inist
ratio
nM
anag
ed C
are:
Brok
erN
ett
Net
tClai
ms
Gro
ssN
ett
Surp
lus/
Net
tN
ett A
sset
sN
ett
Solve
ncy
No.
Dep
end-
Con
trib
utio
ns
Expe
nses
(RISK
+PM
SA)
Man
agem
ent S
ervic
esFe
esRe
insu
r-In
curr
ed:
Unde
rwrit
ingUn
derw
riting
(Def
icit)
Surp
lus/
(Mem
bers
Asse
ts p
erRa
tioan
ts p
eran
ceN
ett C
on-
Resu
ltsRe
sults
from
(Def
icit)
Fund
sRe
gulat
ion
Mem
ber
Resu
ltstr
ibut
ions
Ope
ratio
nspe
r BS)
29PA
BPM
As%
ofPA
BPM
As%
ofPA
BPM
31/1
2/04
31/1
2/04
R’00
0R
R’00
0G
CI
RR’
000
GC
IR
R’00
0R’
000
%R’
000
R’00
0R’
000
R’00
0R’
000
R’00
0%
COUNCIL FOR MEDICAL SCHEMES Annual Report 2004-5 103
ANNEXURE K5
Deta
iled
fina
ncia
l re
sult
s: r
egis
tere
d sc
hem
esfo
r th
e ye
ar e
nded
31
Dece
mbe
r 20
04Detailed financial results: registered schemes
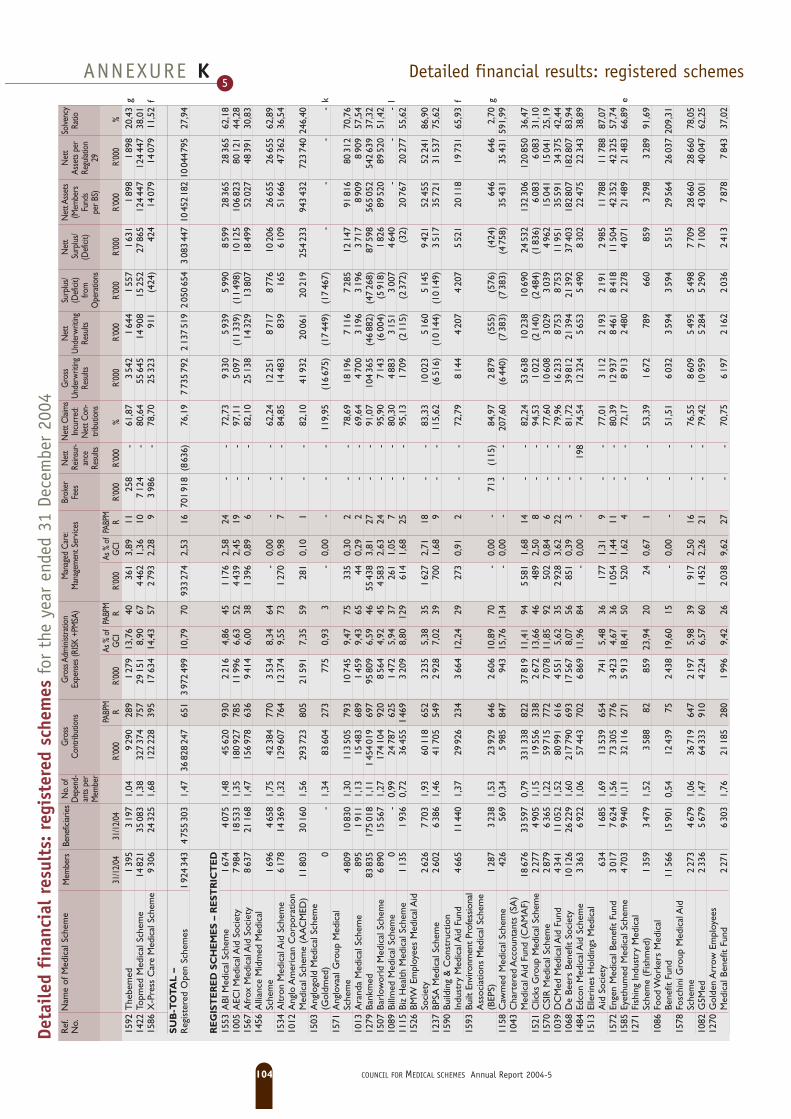
Ref
.N
ame
of M
edic
al S
chem
eM
embe
rsBe
nefic
iarie
sN
o.of
Gro
ssG
ross
Adm
inist
ratio
nM
anag
ed C
are:
Brok
erN
ett
Net
tClai
ms
Gro
ssN
ett
Surp
lus/
Net
tN
ett A
sset
sN
ett
Solve
ncy
No.
Dep
end-
Con
trib
utio
ns
Expe
nses
(RISK
+PM
SA)
Man
agem
ent S
ervic
esFe
esRe
insu
r-In
curr
ed:
Unde
rwrit
ingUn
derw
riting
(Def
icit)
Surp
lus/
(Mem
bers
Asse
ts p
erRa
tioan
ts p
eran
ceN
ett C
on-
Resu
ltsRe
sults
from
(Def
icit)
Fund
sRe
gulat
ion
Mem
ber
Resu
ltstr
ibut
ions
Ope
ratio
nspe
r BS)
29PA
BPM
As%
ofPA
BPM
As%
ofPA
BPM
31/1
2/04
31/1
2/04
R’00
0R
R’00
0G
CI
RR’
000
GC
IR
R’00
0R’
000
%R’
000
R’00
0R’
000
R’00
0R’
000
R’00
0%
1592
The
bem
ed1
395
319
71,
049
290
289
127
913
,76
4036
13,
8911
258
-61
,87
354
21
644
155
71
631
189
81
898
20,4
3g
1422
Topm
ed M
edic
al S
chem
e14
821
3508
31,
3832
737
475
729
151
8,90
674
462
1,36
107
124
-80
,64
5564
514
908
1525
227
865
124
447
124
447
38,0
115
86X
-Pre
ss C
are
Med
ical
Sch
eme
930
624
325
1,68
122
228
395
1763
414
,43
572
793
2,28
93
986
-78
,70
2532
391
1(4
24)
424
1407
914
079
11,5
2f
SU
B-T
OT
AL
–
Reg
iste
red
Ope
n Sc
hem
es1
924
343
475
530
31,
4736
828
247
651
397
249
910
,79
7093
327
42,
5316
701
918
(863
6)76
,19
773
579
22
137
519
205
065
43
083
447
1045
218
210
0447
9527
,94
RE
GIS
TE
RE
D S
CH
EM
ES
– R
EST
RIC
TE
D15
53A
BI M
edic
al S
chem
e1
674
407
51,
4845
620
930
221
64,
8645
117
62,
5824
--
72,7
39
330
593
95
990
859
928
365
2836
562
,18
1005
AEC
I Med
ical
Aid
Soc
iety
798
418
533
1,35
180
927
785
1199
66,
6352
443
92,
4519
--
97,1
15
097
(11
339)
(11
498)
1012
510
682
380
121
44,2
815
67A
frox
Med
ical
Aid
Soc
iety
863
721
168
1,47
156
978
636
941
46,
0038
139
60,
896
--
82,1
025
138
1432
913
807
1849
952
027
4839
130
,83
1456
Alli
ance
Mid
med
Med
ical
Sc
hem
e1
696
465
81,
7542
384
770
353
48,
3464
-0,
00-
--
62,2
412
251
871
78
776
1020
626
655
2665
562
,89
1534
Altr
on M
edic
al A
id S
chem
e6
178
1436
91,
3212
960
776
412
374
9,55
731
270
0,98
7-
-84
,85
1448
383
916
56
109
5166
647
362
36,5
410
12A
nglo
Am
eric
an C
orpo
ratio
n M
edic
al S
chem
e (A
AC
MED
)11
803
3016
01,
5629
372
380
521
591
7,35
5928
10,
101
--
82,1
041
932
2006
120
219
254
233
943
432
723
740
246,
4015
03A
nglo
gold
Med
ical
Sch
eme
(Gol
dmed
)0
-1,
3483
604
273
775
0,93
3-
0,00
--
-11
9,95
(16
675)
(17
449)
(17
467)
--
--
k15
71A
nglo
vaal
Gro
up M
edic
al
Sche
me
480
910
830
1,30
113
505
793
1074
59,
4775
335
0,30
2-
-78
,69
1819
67
116
728
512
147
9181
680
312
70,7
610
13A
rand
a M
edic
al S
chem
e89
51
911
1,13
1548
368
91
459
9,43
6544
0,29
2-
-69
,64
470
03
196
319
63
717
890
98
909
57,5
412
79Ba
nkm
ed83
835
175
018
1,11
145
401
969
795
809
6,59
4655
438
3,81
27-
-91
,07
104
365
(46
882)
(47
268)
8759
856
505
254
263
937
,32
1507
Barl
owor
ld M
edic
al S
chem
e6
890
1556
71,
2717
410
492
08
564
4,92
454
583
2,63
24-
-95
,90
714
3(6
004)
(591
8)1
826
8952
089
520
51,4
210
89Bi
llmed
Med
ical
Sch
eme
0-
0,99
2478
762
51
472
5,94
3726
11,
057
--
80,3
04
883
315
13
007
464
0-
--
l11
15Bi
z H
ealth
Med
ical
Sch
eme
113
51
936
0,72
3645
51
469
320
98,
8012
961
41,
6825
--
95,1
31
709
(211
5)(2
372)
(32)
2076
720
277
55,6
215
26BM
W E
mpl
oyee
s M
edic
al A
id
Soci
ety
262
67
703
1,93
6011
865
23
235
5,38
351
627
2,71
18-
-83
,33
1002
35
160
514
59
421
5245
552
241
86,9
012
37BP
SA M
edic
al S
chem
e2
602
638
61,
4641
705
549
292
87,
0239
700
1,68
9-
-11
5,62
(651
6)(1
014
4)(1
014
9)3
517
3572
131
537
75,6
215
90Bu
ildin
g &
Con
stru
ctio
n In
dust
ry M
edic
al A
id F
und
466
511
440
1,37
2992
623
43
664
12,2
429
273
0,91
2-
-72
,79
814
44
207
420
75
521
2011
819
731
65,9
3f
1593
Built
Env
ironm
ent
Prof
essio
nal
Ass
ocia
tions
Med
ical
Sch
eme
(BEP
S)1
287
323
81,
5323
929
646
260
610
,89
70-
0,00
-71
3(1
15)
84,9
72
879
(555
)(5
76)
(424
)64
664
62,
70g
1158
Caw
med
Med
ical
Sch
eme
426
569
0,34
598
584
794
315
,76
134
-0,
00-
--
207,
60(6
440)
(738
3)(7
383)
(475
8)35
431
3543
159
1,99
1043
Cha
rter
ed A
ccou
ntan
ts (
SA)
Med
ical
Aid
Fun
d (C
AM
AF)
1867
633
597
0,79
331
338
822
3781
911
,41
945
581
1,68
14-
-82
,24
5363
810
238
1069
024
532
132
306
120
850
36,4
715
21C
licks
Gro
up M
edic
al S
chem
e2
277
490
51,
1519
556
338
267
213
,66
4648
92,
508
--
94,5
31
022
(214
0)(2
484)
(183
6)6
083
608
331
,10
1570
CSI
R M
edic
al S
chem
e2
879
636
51,
2259
715
772
707
811
,85
9250
20,
846
--
77,6
010
608
302
93
039
496
215
041
1504
125
,19
1039
DC
Med
Med
ical
Aid
Fun
d4
341
1105
21,
5280
991
616
455
15,
6235
292
83,
6222
--
79,9
616
233
875
38
753
1195
135
591
3437
542
,44
1068
De
Beer
s Be
nefit
Soc
iety
1012
626
229
1,60
217
790
693
1756
78,
0756
851
0,39
3-
-81
,72
3981
221
394
2139
237
403
182
807
182
807
83,9
414
84Ed
con
Med
ical
Aid
Sch
eme
336
36
922
1,06
5744
370
26
869
11,9
684
-0,
00-
-19
874
,54
1232
45
653
549
08
302
2247
522
343
38,8
915
13El
leri
nes
Hol
ding
s M
edic
al
Aid
Soc
iety
634
168
51,
6913
539
654
741
5,48
3617
71,
319
--
77,0
13
112
219
32
191
298
511
788
1178
887
,07
1572
Enge
n M
edic
al B
enef
it Fu
nd3
017
762
41,
5673
305
776
342
34,
6736
105
41,
4411
--
80,3
912
937
846
18
418
1150
442
352
4232
557
,74
1585
Eyet
hum
ed M
edic
al S
chem
e4
703
994
01,
1132
116
271
591
318
,41
5052
01,
624
--
72,1
78
913
248
02
278
407
121
489
2148
366
,89
e12
71Fi
shin
g In
dust
ry M
edic
al
Sche
me
(Fis
hmed
)1
359
347
91,
523
588
8285
923
,94
2024
0,67
1-
-53
,39
167
278
966
085
93
298
328
991
,69
1086
Food
Wor
kers
Med
ical
Be
nefit
Fun
d11
566
1590
10,
5412
439
752
438
19,6
015
-0,
00-
--
51,5
16
032
359
43
594
551
529
564
2603
720
9,31
1578
Fosc
hini
Gro
up M
edic
al A
id
Sche
me
227
34
679
1,06
3671
964
72
197
5,98
3991
72,
5016
--
76,5
58
609
549
55
498
770
928
660
2866
078
,05
1082
G5M
ed2
336
567
91,
4764
333
910
422
46,
5760
145
22,
2621
--
79,4
210
959
528
45
290
710
043
001
4004
762
,25
1270
Gol
den
Arr
ow E
mpl
oyee
s M
edic
al B
enef
it Fu
nd2
271
630
31,
7621
185
280
199
69,
4226
203
89,
6227
--
70,7
56
197
216
22
036
241
37
878
784
337
,02
104 COUNCIL FOR MEDICAL SCHEMES Annual Report 2004-5
ANNEXURE K5
Deta
iled
fina
ncia
l re
sult
s: r
egis
tere
d sc
hem
esfo
r th
e ye
ar e
nded
31
Dece
mbe
r 20
04Detailed financial results: registered schemes
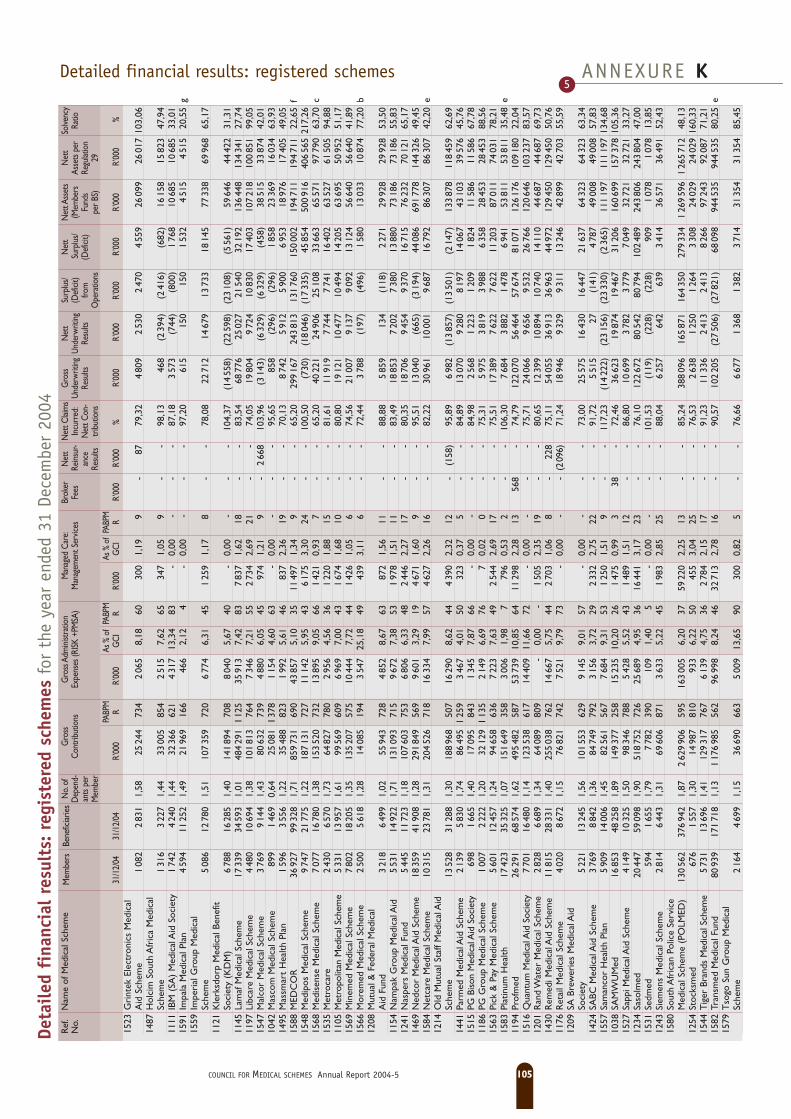
Ref
.N
ame
of M
edic
al S
chem
eM
embe
rsBe
nefic
iarie
sN
o.of
Gro
ssG
ross
Adm
inist
ratio
nM
anag
ed C
are:
Brok
erN
ett
Net
tClai
ms
Gro
ssN
ett
Surp
lus/
Net
tN
ett A
sset
sN
ett
Solve
ncy
No.
Dep
end-
Con
trib
utio
ns
Expe
nses
(RISK
+PM
SA)
Man
agem
ent S
ervic
esFe
esRe
insu
r-In
curr
ed:
Unde
rwrit
ingUn
derw
riting
(Def
icit)
Surp
lus/
(Mem
bers
Asse
ts p
erRa
tioan
ts p
eran
ceN
ett C
on-
Resu
ltsRe
sults
from
(Def
icit)
Fund
sRe
gulat
ion
Mem
ber
Resu
ltstr
ibut
ions
Ope
ratio
nspe
r BS)
29PA
BPM
As%
ofPA
BPM
As%
ofPA
BPM
31/1
2/04
31/1
2/04
R’00
0R
R’00
0G
CI
RR’
000
GC
IR
R’00
0R’
000
%R’
000
R’00
0R’
000
R’00
0R’
000
R’00
0%
1523
Gri
ntek
Ele
ctro
nics
Med
ical
A
id S
chem
e1
082
283
11,
5825
244
734
206
58,
1860
300
1,19
9-
8779
,32
480
92
530
247
04
559
2609
926
017
103,
0614
87H
olci
m S
outh
Afr
ica
Med
ical
Sc
hem
e1
316
322
71,
4433
005
854
251
57,
6265
347
1,05
9-
-98
,13
468
(239
4)(2
416)
(682
)16
158
1582
347
,94
1111
IBM
(SA
) M
edic
al A
id S
ocie
ty1
742
424
01,
4432
366
621
431
713
,34
83-
0,00
--
-87
,18
357
3(7
44)
(800
)1
768
1068
510
685
33,0
115
91Im
pala
Med
ical
Pla
n4
594
1125
21,
4921
969
166
466
2,12
4-
0,00
--
-97
,20
615
150
150
153
24
515
451
520
,55
g15
59Im
peri
al G
roup
Med
ical
Sc
hem
e5
086
1278
01,
5110
735
972
06
774
6,31
451
259
1,17
8-
-78
,08
2271
214
679
1373
318
145
7733
869
968
65,1
711
21K
lerk
sdor
p M
edic
al B
enef
it So
ciet
y (K
DM
)6
788
1628
51,
4014
189
470
88
040
5,67
40-
0,00
--
-10
4,37
(14
558)
(22
598)
(23
108)
(556
1)59
646
4442
231
,31
1145
Lam
af M
edic
al S
chem
e17
339
3459
31,
0148
429
11
125
3591
37,
4283
783
71,
6218
--
83,5
468
776
2502
721
540
3219
213
644
813
434
127
,74
1197
Libc
are
Med
ical
Sch
eme
448
010
694
1,38
101
813
764
734
67,
2155
273
42,
6921
--
74,0
519
804
972
410
830
1740
310
721
810
085
199
,05
1547
Mal
cor
Med
ical
Sch
eme
376
99
144
1,43
8063
273
94
880
6,05
4597
41,
219
-2
668
103,
96(3
143)
(632
9)(6
329)
(458
)38
515
3387
442
,01
1042
Mas
com
Med
ical
Sch
eme
899
146
90,
6425
081
137
81
154
4,60
63-
0,00
--
-95
,65
858
(296
)(2
96)
185
823
369
1603
463
,93
1495
Mas
smar
t H
ealth
Pla
n1
596
355
61,
2235
488
823
199
25,
6146
837
2,36
19-
-70
,13
874
25
912
590
06
953
1897
617
405
49,0
515
88M
EDC
OR
3692
799
328
1,71
859
731
690
4385
75,
1035
1149
71,
349
--
65,2
029
916
724
381
313
176
015
000
219
471
119
471
122
,65
f15
48M
edip
os M
edic
al S
chem
e9
747
2177
51,
2218
713
172
711
142
5,95
436
175
3,30
24-
-10
0,50
(730
)(1
804
6)(1
733
5)45
854
500
916
406
565
217,
2615
68M
edis
ense
Med
ical
Sch
eme
707
716
780
1,38
153
520
732
1389
59,
0566
142
10,
937
--
65,2
040
221
2490
625
108
3366
365
571
9779
063
,70
c15
35M
etro
care
243
06
570
1,73
6482
778
02
956
4,56
361
220
1,88
15-
-81
,61
1191
97
744
774
116
402
6352
761
505
94,8
811
05M
etro
polit
an M
edic
al S
chem
e5
331
1395
71,
6199
569
609
696
97,
0043
167
41,
6810
--
80,8
019
121
1047
710
494
1420
563
695
5095
251
,17
1569
Min
emed
Med
ical
Sch
eme
780
218
205
1,35
135
207
575
1044
47,
7244
142
61,
056
--
74,5
621
007
913
79
092
1312
456
640
5664
041
,89
1566
Mor
emed
Med
ical
Sch
eme
250
05
618
1,28
1408
519
43
547
25,1
849
439
3,11
6-
-72
,44
378
8(1
97)
(496
)1
580
1303
310
874
77,2
0b
1208
Mut
ual &
Fed
eral
Med
ical
A
id F
und
321
86
499
1,02
5594
372
84
852
8,67
6387
21,
5611
--
88,8
85
859
134
(118
)2
271
2992
829
928
53,5
011
54N
ampa
k G
roup
Med
ical
Aid
553
114
922
1,71
131
093
715
967
27,
3853
197
81,
5111
--
83,4
918
853
720
27
380
1388
073
186
7318
655
,83
1241
Nas
pers
Med
ical
Fun
d5
445
1172
31,
1810
760
375
36
806
6,33
482
446
2,27
17-
-80
,35
1870
69
454
937
016
715
7623
270
121
65,1
714
69N
edco
r M
edic
al A
id S
chem
e18
359
4190
81,
2829
184
956
99
601
3,29
194
671
1,60
9-
-95
,51
1304
0(6
65)
(319
4)44
086
691
778
144
326
49,4
515
84N
etca
re M
edic
al S
chem
e10
315
2378
11,
3120
452
671
816
334
7,99
574
627
2,26
16-
-82
,22
3096
110
001
968
716
792
8630
786
307
42,2
0e
1214
Old
Mut
ual S
taff
Med
ical
Aid
Sc
hem
e13
528
3128
81,
3018
896
850
716
290
8,62
444
390
2,32
12-
(158
)95
,89
698
2(1
385
7)(1
350
1)(2
147)
133
878
118
459
62,6
914
41Pa
rmed
Med
ical
Aid
Sch
eme
213
95
830
1,74
8649
51
259
346
74,
0150
323
0,37
5-
-84
,89
1307
09
280
819
714
067
4310
339
576
45,7
615
15PG
Bis
on M
edic
al A
id S
ocie
ty69
81
665
1,40
1709
584
31
345
7,87
66-
0,00
--
-84
,98
256
81
223
120
91
824
1158
611
586
67,7
811
86PG
Gro
up M
edic
al S
chem
e1
007
222
21,
2032
129
113
52
149
6,69
767
0,02
0-
-75
,31
597
53
819
398
86
358
2845
328
453
88,5
615
63Pi
ck &
Pay
Med
ical
Sch
eme
560
112
457
1,24
9465
863
67
223
7,63
492
544
2,69
17-
-75
,51
1738
97
622
762
211
203
8701
174
031
78,2
115
83Pl
atin
um H
ealth
1742
335
325
1,07
151
649
358
300
61,
987
796
0,53
2-
-10
6,30
768
43
882
147
86
941
5381
153
811
35,4
8e
1194
Prof
med
2629
168
574
1,62
495
482
587
5373
910
,85
6411
298
2,28
1356
8-
74,7
912
207
056
464
5767
481
071
126
176
109
180
22,0
415
16Q
uant
um M
edic
al A
id S
ocie
ty7
701
1648
01,
1412
353
861
714
409
11,6
672
-0,
00-
--
75,7
124
066
965
69
532
2676
612
064
610
323
783
,57
1201
Ran
d W
ater
Med
ical
Sch
eme
282
86
689
1,34
6408
980
9-
0,00
-1
505
2,35
19-
-80
,65
1239
910
894
1074
014
110
4468
744
687
69,7
314
30R
emed
i Med
ical
Aid
Sch
eme
1181
528
331
1,40
255
038
762
1466
75,
7544
270
31,
068
-22
875
,11
5405
536
913
3696
344
972
129
450
129
450
50,7
611
76R
etai
l Med
ical
Sch
eme
402
08
672
1,15
7682
174
27
521
9,79
73-
0,00
--
(209
6)71
,24
1894
69
329
931
113
246
4289
942
703
55,5
912
09SA
Bre
wer
ies
Med
ical
Aid
So
ciet
y5
221
1324
51,
5610
155
362
99
145
9,01
57-
0,00
--
-73
,00
2557
516
430
1644
721
637
6432
364
323
63,3
414
24SA
BC M
edic
al A
id S
chem
e3
769
884
21,
3684
749
792
315
63,
7229
233
22,
7522
--
91,7
25
515
27(1
41)
478
749
008
4900
857
,83
1557
Sam
anco
r H
ealth
Pla
n5
909
1400
61,
4582
561
567
768
49,
3153
125
01,
519
--
117,
23(1
422
2)(2
315
6)(2
333
0)(2
365)
111
197
111
197
134,
6810
38SA
MW
UM
ed16
853
4825
81,
8914
937
725
815
235
10,2
026
147
50,
993
38-
72,4
636
623
1987
419
467
3120
616
069
915
737
810
5,36
1527
Sapp
i Med
ical
Aid
Sch
eme
414
910
325
1,50
9834
678
85
428
5,52
431
489
1,51
12-
-86
,80
1069
93
782
377
97
049
3272
132
721
33,2
712
34Sa
solm
ed20
447
5909
81,
9051
875
272
625
689
4,95
3616
441
3,17
23-
-76
,10
122
672
8054
280
794
102
489
243
806
243
804
47,0
015
31Se
dmed
594
165
51,
797
782
390
109
1,40
5-
0,00
--
-10
1,53
(119
)(2
28)
(228
)90
91
078
107
813
,85
1243
Siem
ens
Med
ical
Sch
eme
281
46
443
1,31
6960
687
13
633
5,22
451
983
2,85
25-
-88
,04
625
764
263
93
414
3657
136
491
52,4
315
80So
uth
Afr
ican
Pol
ice
Serv
ice
Med
ical
Sch
eme
(PO
LMED
)13
056
237
694
21,
872
629
906
595
163
005
6,20
3759
220
2,25
13-
-85
,24
388
096
165
871
164
350
279
334
126
959
61
265
712
48,1
312
54St
ocks
med
676
155
71,
3014
987
810
933
6,22
5045
53,
0425
--
76,5
32
638
125
01
264
330
824
029
2402
916
0,33
1544
Tig
er B
rand
s M
edic
al S
chem
e5
731
1369
61,
4112
931
776
76
139
4,75
362
784
2,15
17-
-91
,23
1133
62
413
241
38
266
9724
392
087
71,2
115
82Tr
ansm
ed M
edic
al F
und
8093
917
171
81,
131
176
985
562
9699
88,
2446
3271
32,
7816
--
90,5
710
220
5(2
750
6)(2
782
1)68
098
944
535
944
535
80,2
5e
1579
Tso
go S
un G
roup
Med
ical
Sc
hem
e2
164
469
91,
1536
690
663
500
913
,65
9030
00,
825
--
76,6
66
677
136
81
382
371
431
354
3135
485
,45
COUNCIL FOR MEDICAL SCHEMES Annual Report 2004-5 105
ANNEXURE K5
Deta
iled
fina
ncia
l re
sult
s: r
egis
tere
d sc
hem
esfo
r th
e ye
ar e
nded
31
Dece
mbe
r 20
04Detailed financial results: registered schemes
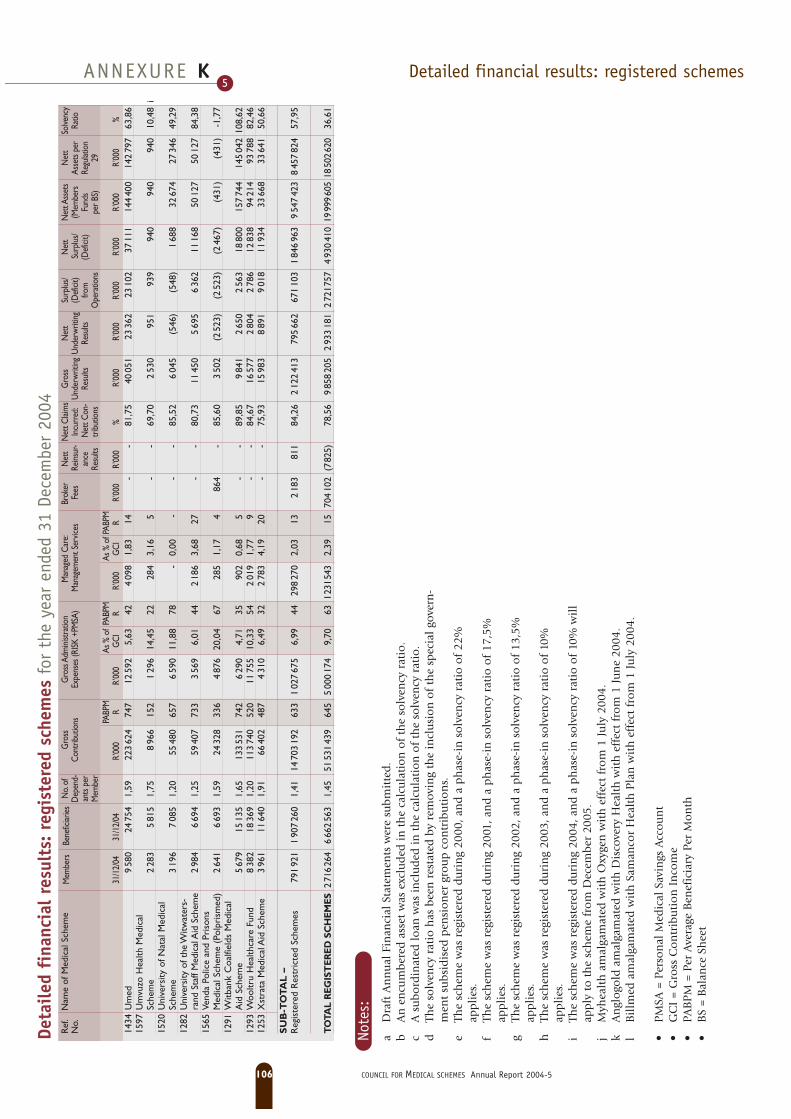
Ref
.N
ame
of M
edic
al S
chem
eM
embe
rsBe
nefic
iaries
No.
ofG
ross
Gro
ss A
dmin
istra
tion
Man
aged
Car
e:Br
oker
Net
tN
ettC
laim
sG
ross
Net
tSu
rplu
s/N
ett
Net
t Ass
ets
Net
t So
lvenc
yN
o.D
epen
d-C
ontr
ibut
ions
Ex
pens
es (R
ISK +
PMSA
) M
anag
emen
t Ser
vices
Fees
Rein
sur-
Incu
rred
:U
nder
writ
ing
Und
erw
ritin
g(D
efici
t)Su
rplu
s/(M
embe
rsAs
sets
per
Ratio
ants
per
ance
Net
t Con
-Re
sults
Resu
ltsfro
m(D
efici
t)Fu
nds
Regu
latio
nM
embe
rRe
sults
trib
utio
nsO
pera
tions
per B
S)29
PABP
MAs
% of
PABP
MAs
%of
PABP
M31
/12/
0431
/12/
04R’
000
RR’
000
GC
IR
R’00
0G
CI
RR’
000
R’00
0%
R’00
0R’
000
R’00
0R’
000
R’00
0R’
000
%14
34U
med
958
024
754
1,59
223
624
747
1259
25,
6342
409
81,
8314
--
81,7
540
051
2336
223
102
3711
114
440
014
279
763
,86
1597
Um
vuzo
Hea
lth M
edic
al
Sche
me
228
35
815
1,75
896
615
21
296
14,4
522
284
3,16
5-
-69
,70
253
095
193
994
094
094
010
,48
i15
20U
nive
rsity
of N
atal
Med
ical
Sc
hem
e3
196
708
51,
2055
480
657
659
011
,88
78-
0,00
--
-85
,52
604
5(5
46)
(548
)1
688
3267
427
346
49,2
912
82U
nive
rsity
of t
he W
itwat
ers-
rand
Sta
ff M
edic
al A
id S
chem
e2
984
669
41,
2559
407
733
356
96,
0144
218
63,
6827
--
80,7
311
450
569
56
362
1116
850
127
5012
784
,38
1565
Vend
a Po
lice
and
Pris
ons
Med
ical
Sch
eme
(Pol
pris
med
)2
641
669
31,
5924
328
336
487
620
,04
6728
51,
174
864
-85
,60
350
2(2
523)
(252
3)(2
467)
(431
)(4
31)
-1,7
712
91W
itban
k C
oalfi
elds
Med
ical
A
id S
chem
e5
679
1513
51,
6513
353
174
26
290
4,71
3590
20,
685
--
89,8
59
841
265
02
563
1880
015
774
414
504
210
8,62
1293
Woo
ltru
Hea
lthca
re F
und
838
218
369
1,20
113
740
520
1175
510
,33
542
019
1,77
9-
-84
,67
1657
72
804
278
612
838
9421
493
788
82,4
612
53X
stra
ta M
edic
al A
id S
chem
e3
961
1164
01,
9166
402
487
431
06,
4932
278
34,
1920
--
75,9
315
983
889
19
018
1193
433
668
3364
150
,66
SU
B-T
OT
AL
–
Reg
iste
red
Res
tric
ted
Sche
mes
791
921
190
726
01,
4114
703
192
633
102
767
56,
9944
298
270
2,03
132
183
811
84,2
62
122
413
795
662
671
103
184
696
39
547
423
845
782
457
,95
TO
TAL
REG
IST
ERED
SC
HEM
ES2
716
264
666
256
31,
4551
531
439
645
500
017
49,
7063
1231
543
2,39
1570
410
2(7
825)
78,5
69
858
205
293
318
12
7217
574
930
410
1999
960
518
502
620
36,6
1
Note
s:a
Dra
ft A
nn
ual
Fin
anci
al S
tate
men
ts w
ere
sub
mit
ted
.b
An
en
cum
ber
ed a
sset
was
exc
lud
ed i
n t
he
calc
ula
tio
n o
f th
e so
lven
cy r
atio
.c
A s
ub
ord
inat
ed l
oan
was
in
clu
ded
in
th
e ca
lcu
lati
on
of
the
solv
ency
rat
io.
dTh
e so
lven
cy r
atio
has
bee
n r
esta
ted
by
rem
ovin
g th
e in
clu
sio
n o
f th
e sp
ecia
l go
vern
-m
ent
sub
sid
ised
pen
sio
ner
gro
up
co
ntr
ibu
tio
ns.
eTh
e sc
hem
e w
as r
egis
tere
d d
uri
ng
2000
, an
d a
ph
ase-
in s
olv
ency
rat
io o
f 22
%ap
pli
es.
fTh
e sc
hem
e w
as r
egis
tere
d d
uri
ng
2001
, an
d a
ph
ase-
in s
olv
ency
rat
io o
f 17
,5%
app
lies
.g
The
sch
eme
was
reg
iste
red
du
rin
g 20
02, a
nd
a p
has
e-in
so
lven
cy r
atio
of
13,5
%ap
pli
es.
hTh
e sc
hem
e w
as r
egis
tere
d d
uri
ng
2003
, an
d a
ph
ase-
in s
olv
ency
rat
io o
f 10
%ap
pli
es.
iTh
e sc
hem
e w
as r
egis
tere
d d
uri
ng
2004
, an
d a
ph
ase-
in s
olv
ency
rat
io o
f 10
% w
ill
app
ly t
o t
he
sch
eme
fro
m D
ecem
ber
200
5.j
Myh
ealt
h a
mal
gam
ated
wit
h O
xyge
n w
ith
eff
ect
fro
m 1
Ju
ly 2
004.
kA
ngl
ogo
ld a
mal
gam
ated
wit
h D
isco
very
Hea
lth
wit
h e
ffec
t fr
om
1 J
un
e 20
04.
lB
illm
ed a
mal
gam
ated
wit
h S
aman
cor
Hea
lth
Pla
n w
ith
eff
ect
fro
m 1
Ju
ly 2
004.
•P
MSA
= P
erso
nal
Med
ical
Sav
ings
Acc
ou
nt
•G
CI
= G
ross
Co
ntr
ibu
tio
n I
nco
me
•PA
BP
M =
Per
Ave
rage
Ben
efic
iary
Per
Mo
nth
•B
S =
Bal
ance
Sh
eet
106 COUNCIL FOR MEDICAL SCHEMES Annual Report 2004-5
ANNEXURE K5
Deta
iled
fina
ncia
l re
sult
s: r
egis
tere
d sc
hem
esfo
r th
e ye
ar e
nded
31
Dece
mbe
r 20
04Detailed financial results: registered schemes

RE
GIS
TE
RE
D S
CH
EM
ES
– O
PE
N14
96Al
lCar
e M
edica
l Aid
Sch
eme
012
501
-100
011
6831
-100
077
9-1
000
1041
14-1
000
694
-100
010
251
-100
068
-100
029
65-1
000
282
-100
N/A
2,54
1589
Baym
ed40
03N
/AN
/A30
09N
/AN
/A37
6N
/AN
/A28
90N
/AN
/A36
1N
/AN
/A39
0N
/AN
/A49
N/A
N/A
(331
)N
/AN
/A-8
3N
/AN
/A-1
0,99
N/A
j12
52Be
stmed
Med
ical S
chem
e79
376
6747
518
6444
2851
9821
2467
764
25
4742
1639
8979
1949
849
31
6788
751
288
3271
6313
2060
1211
3864
8125
0415
3663
31,97
21,90
1512
Bonit
as M
edica
l Aid
Fun
d56
4554
6687
80-1
638
8396
745
1786
3-1
457
356
32
3006
354
3780
416
-20
444
471
-642
4695
3703
2215
6346
3612
0844
371
7017
6922
9111
0110
831
,1115
,8710
34Ca
pe M
edica
l Plan
1076
380
6333
6573
647
463
3850
949
14
6831
556
874
2052
958
8-1
016
225
1471
710
126
152
-17
1227
6213
2186
-710
205
1413
0-2
818
6,75
278,5
010
48Co
mm
ercia
l and
Indu
strial
Med
ical
Aid
Socie
ty (C
IMAS
)75
9278
92-4
8148
092
397
-12
894
976
-873
999
7740
8-4
812
817
-110
620
1082
5-2
117
114
210
7638
1025
225
1419
713
268
713
2,10
110,9
615
52Co
mm
unity
Med
ical A
id S
chem
e (C
OM
MED
)32
424
3432
8-6
2224
5921
6273
357
252
59
1761
4217
5426
045
342
66
4174
629
873
4010
773
4812
7869
1146
0012
4050
3391
1957
,4852
,99b
1491
Com
pcar
e M
edica
l Sch
eme
2961
239
247
-25
2654
9830
7556
-14
747
653
1420
5829
2413
12-1
557
951
213
3515
038
707
-999
8220
9864
875
141
3135
5520
9170
37,16
24,43
1125
Disc
over
y H
ealth
Med
ical S
chem
e15
1062
313
7720
410
1296
5892
1099
8972
1871
566
67
9479
580
7974
441
1952
348
38
1855
277
1550
780
2010
294
930
6285
116
5605
785
1957
1160
6923
,6215
,0615
96Ec
lipse
Med
ical S
chem
e48
0N
/AN
/A21
62N
/AN
/A50
0N
/AN
/A17
74N
/AN
/A41
1N
/AN
/A21
9N
/AN
/A51
N/A
N/A
47N
/AN
/A46
N/A
N/A
2,19
N/A
j12
02Fe
dhea
lth14
0713
1532
39-8
1150
211
1123
175
268
161
112
8744
6185
3858
251
846
412
1640
3916
5962
-197
908
2964
6525
3183
1720
8417
7817
25,77
22,54
1501
Free
Sta
te M
edica
l Aid
Sch
eme
348
463
-25
2017
2321
-13
483
418
1619
1325
06-2
445
845
22
240
233
358
4237
965
927
429
3221
0639
47,84
39,93
1554
Gen
esis
Med
ical S
chem
e22
712
1437
258
1040
8564
929
6038
237
61
8159
245
535
7929
926
413
1706
410
804
5863
630
6032
051
494
1722
6932
12-2
957
,9579
,3115
61G
en-H
ealth
Med
ical S
chem
e14
892
1447
33
8173
361
711
3245
735
529
5337
939
360
3629
922
732
2052
916
036
2811
592
2446
231
4528
12
2743
3387
-19
56,56
73,38
1162
Glo
bal H
ealth
6233
047
715
3147
8171
3572
6234
639
624
243
6587
3181
7237
584
556
556
499
3815
748
7667
1398
556
9637
72
1709
1489
1520
,6126
,9814
66G
ood
Hop
e M
edica
l Aid
Soc
iety
1058
710
578
026
751
2432
010
211
192
1023
917
2108
213
188
166
1331
8224
6029
2519
2933
924
3242
25
3264
3005
912
6,81
133,3
115
37H
osm
ed M
edica
l Aid
Sch
eme
1314
6812
4507
659
7727
5507
969
379
369
349
9445
4269
1317
317
286
1191
736
8050
514
5854
818
2218
1727
335
1370
1374
030
,4931
,36a
1577
Ingw
e H
ealth
Plan
3005
434
537
-13
1325
3913
8871
-536
833
510
9955
687
453
1427
621
131
3485
826
748
3097
6550
4280
744
795
-412
8812
910
32,30
32,26
1556
KwaZ
ulu-N
atal
Med
ical A
id S
chem
e15
191
1096
539
6566
839
950
6436
030
419
5230
430
713
7028
723
323
1523
417
922
-15
8413
6-3
968
084
6843
9-1
4005
5094
-21
103,6
817
1,31
1576
Liber
ty M
edica
l Sch
eme
9550
610
7105
-11
7648
1972
0870
666
756
119
5826
9958
8487
-150
845
811
1063
2010
1324
593
7918
1589
4872
458
119
1676
701
139
20,78
10,05
1536
Lifem
ed M
edica
l Sch
eme
8956
9194
-391
063
8203
611
847
744
1475
149
6683
112
699
606
1511
644
1017
114
108
9218
3000
726
214
1433
9028
6418
32,95
31,95
1142
Med
ical E
xpen
ses D
istrib
utio
n So
ciety
(MED
S)24
024
2945
0-1
822
1074
2375
89-7
767
672
1418
5525
1845
511
644
522
2328
256
3079
4-8
9887
1283
817
7337
014
3720
2731
3637
,9130
,8815
49M
edico
ver 2
000
9465
282
962
1457
4760
4771
6920
506
479
640
8720
3183
3128
360
320
1355
716
4243
431
4943
1549
4601
3997
9324
4814
4631
486
,0583
,78c
1149
Med
ihelp
1982
7420
5038
-326
3670
925
4639
64
1108
1035
722
9608
222
3449
93
965
908
623
8248
2212
448
100
9011
4955
4441
8037
1925
0920
7221
27,12
24,14
e15
06M
edim
ed M
edica
l Sch
eme
1258
195
5232
7029
148
543
4546
642
310
5285
436
602
4435
031
910
6603
4606
4344
409
3180
619
862
6025
0020
4422
45,25
40,92
1140
Med
shiel
d M
edica
l Sch
eme
2182
1026
1881
-17
1365
338
1537
838
-11
521
489
787
1958
9384
17-7
333
299
1228
2184
3065
88-8
108
9810
5532
0731
6745
7527
7912
6412
040
,5220
,6010
21M
erid
ian H
ealth
5225
1251
2-5
854
040
1239
01-5
686
282
54
4474
587
749
-49
714
584
2255
9813
650
-59
8991
-238
670
3293
617
9016
2934
207
71,56
26,58
1087
Mun
imed
1169
8199
267
1810
1261
679
3866
2872
166
68
8757
4067
3939
3062
456
610
1163
9810
1860
1483
86-3
1066
3311
0672
-489
295
6-7
10,53
13,94
1148
Myh
ealth
Med
ical S
chem
e17
098
2115
5-1
972
788
1424
29-4
971
056
126
5909
212
9219
-54
576
509
1310
555
2241
0-5
310
388
17-
3221
-100
-15
9-1
00N
/A2,2
6k
1166
Nat
iona
l Ind
epen
dent
Med
ical A
id
Socie
ty (N
IMAS
)35
669
3324
17
2589
3522
2230
1760
555
79
2268
4919
5525
1653
049
08
1878
414
080
3344
3524
5261
940
645
2914
3412
0419
20,32
18,29
1167
Nat
iona
l Med
ical P
lan (N
MP)
1444
9115
1428
-512
9219
312
1641
96
745
669
1110
5611
710
0869
75
609
555
1015
8588
1546
483
9185
728
0193
2608
297
1977
1735
1421
,6821
,4411
70N
BC M
edica
l Sch
eme
1824
515
993
1420
6886
1690
0822
945
881
716
3882
1306
6925
749
681
1025
243
1873
235
115
9818
3676
924
825
4820
9915
9931
17,77
14,69
1139
Om
nihea
lth46
257
8888
3-4
838
0375
6463
39-4
168
560
613
3393
0951
2389
-34
611
480
2746
833
9713
0-5
284
91-7
(693
)11
733
-106
-20
161
-112
-0,18
1,82
1560
Ope
nplan
Med
ical S
chem
e44
279
5382
4-1
836
2027
3965
48-9
681
614
1131
4048
3217
27-2
591
498
1945
897
5044
3-9
8678
1115
8171
1480
797
3772
2996
2643
,6937
,3412
15O
xyge
n16
5576
1164
8042
9459
9960
6837
5647
643
410
7936
1846
4522
7139
933
220
1411
3393
411
5171
676
1538
3215
5623
-176
713
05-4
116
,2625
,6415
87Pa
thfin
der M
edica
l Sch
eme
2512
2022
2412
298
6819
8040
828
145
7076
5764
2323
523
8-1
3581
3269
1011
913
5-1
233
-10
07
-10
00,2
70,0
0g
1546
Phar
os M
edica
l Plan
1781
215
788
1313
3279
1039
6928
624
549
1410
6789
8376
927
500
442
1323
806
1676
142
111
8826
2044
317
287
1810
9010
692
15,34
16,63
1242
Pret
oria
Mun
icpal
Med
ical A
id
(PRE
TMED
)-
2649
0-1
00-
1284
47-1
00-
539
-100
-11
3515
-100
-47
6-1
00-
1221
2-1
00-
51-1
00-
-N
/A-
-N
/AN
/AN
/A14
54Pr
o Sa
no M
edica
l Sch
eme
1168
2111
1571
585
5021
7444
6315
610
556
1075
4345
6354
1819
538
475
1395
903
9182
24
6869
037
2864
3552
605
3203
3283
-243
,6147
,7211
96Pr
otea
Med
ical A
id S
ociet
y31
9835
25-9
3813
438
314
099
490
610
3680
835
018
595
982
816
4917
4962
-112
811
79
1954
421
863
-11
6240
6544
-551
,2557
,0612
85Pr
otec
tor H
ealth
8484
382
938
256
6492
5334
966
556
536
451
9635
4730
9810
510
475
756
923
7045
8-1
956
71-2
1(3
849)
2159
5-1
18-5
523
5-1
23-0
,684,0
515
95Pu
lz M
edica
l Sch
eme
1347
412
8195
291
402
3955
2211
565
515
1053
302
1086
4808
330
141
133
1398
670
118
9487
91-5
1284
211
2310
4367
542
858
14,05
28,40
i15
75Re
solut
ion
Hea
lth M
edica
l Sch
eme
6731
552
921
2738
5918
2775
2939
478
437
920
8497
1641
0227
258
258
011
4150
6876
866
141
108
3095
622
5448
875
1245
883
4124
,7819
,6314
46Se
lfmed
Med
ical S
chem
e33
299
3868
7-1
425
9059
2781
93-7
648
599
821
4441
2216
48-3
537
477
1232
897
3512
9-6
8276
911
6706
9120
428
3631
2566
4245
,0532
,7814
86Siz
we M
edica
l Fun
d15
6764
1695
96-8
1187
572
1114
384
763
154
815
8326
9787
5982
-544
343
03
1613
9215
8599
286
7810
3992
0420
9296
9125
9712
7810
333
,6218
,7811
41Sp
ectr
amed
1762
2513
6599
2910
3064
869
9750
4748
742
714
7095
9156
7115
2533
634
6-3
1364
7581
166
6865
5030
2652
1497
726
171
1325
618
114
25,73
13,97
1464
Sure
med
Hea
lth69
0972
51-5
4911
941
897
1759
248
223
3423
028
010
2241
332
228
8535
7141
2010
382
2583
5743
3293
1150
552
108
17,01
10,34
1147
Telem
ed60
001
5382
611
6769
6754
7823
2494
084
811
6390
4650
9871
2588
878
912
4393
838
829
1361
602
1597
5914
9187
727
2128
84-6
23,60
27,23
1592
Theb
emed
2679
399
572
9290
1168
695
289
244
1857
4888
854
717
918
6-4
1640
7620
5051
1622
018
9826
761
159
458
22
20,43
22,85
h14
22To
pmed
Med
ical S
chem
e36
036
4537
5-2
132
7374
3788
84-1
475
769
69
2689
7529
0371
-762
253
317
3361
336
338
-778
6716
1244
4796
582
2935
4722
7756
38,01
25,49
1586
X-Pr
ess C
are
Med
ical S
chem
e25
805
2077
124
1222
2877
953
5739
531
326
9481
853
900
7630
621
642
2042
712
670
6166
5130
1407
913
655
357
953
78
11,52
17,52
g
SUB-
TOTA
L –
Regis
tere
d O
pen
Sche
mes
4717
436
4693
342
136
8282
4734
1255
718
651
606
728
4446
3826
5862
737
502
472
649
0577
343
5801
713
8777
1210
0447
9569
2891
245
2112
1468
4427
,9420
,88
Ref.
Nam
e of
Med
ical S
chem
eBe
nefic
iarie
sG
ross
Con
trib
utio
n In
com
e N
ett C
laim
s In
curr
edG
ross
Adm
inist
ratio
n Ex
pens
es
Year
-End
Res
erve
Pos
ition
So
lvenc
y N
o.(G
CI)
(incl
PMSA
Clai
ms)
(Incl
PMSA
& M
anag
ed C
are)
(per
Reg
ulat
ion
29)
Ratio
Aver
age
Aver
age
%20
0420
03%
PABP
M%
2004
2003
%PA
BPM
%20
0420
03%
PABP
M%
2004
2003
%PB
PB%
2004
2003
2004
2003
Grow
thR’
000
R’00
0Gr
owth
2004
2003
Grow
thR’
000
R’00
0Gr
owth
2004
2003
Grow
thR’
000
R’00
0Gr
owth
2004
2003
Grow
thR’
000
R’00
0Gr
owth
2004
2003
Grow
th%
%R
RR
RR
RR
R
COUNCIL FOR MEDICAL SCHEMES Annual Report 2004-5 107
ANNEXURE L5
Deta
iled
fina
ncia
l in
form
atio
n: r
egis
tere
d sc
hem
esfo
r th
e ye
ar e
nded
31
Dece
mbe
r 20
04Detailed financial information: registered schemes

Ref.
Nam
e of
Med
ical S
chem
eBe
nefic
iarie
sG
ross
Con
trib
utio
n In
com
e N
ett C
laim
s In
curr
edG
ross
Adm
inist
ratio
n Ex
pens
es
Year
-End
Res
erve
Pos
ition
So
lvenc
y N
o.(G
CI)
(incl
PMSA
Clai
ms)
(Incl
PMSA
& M
anag
ed C
are)
(per
Reg
ulat
ion
29)
Ratio
Aver
age
Aver
age
%20
0420
03%
PABP
M%
2004
2003
%PA
BPM
%20
0420
03%
PABP
M%
2004
2003
%PB
PB%
2004
2003
2004
2003
Grow
thR’
000
R’00
0Gr
owth
2004
2003
Grow
thR’
000
R’00
0Gr
owth
2004
2003
Grow
thR’
000
R’00
0Gr
owth
2004
2003
Grow
thR’
000
R’00
0Gr
owth
2004
2003
Grow
th%
%R
RR
RR
RR
RR
EG
IST
ER
ED
SC
HE
ME
S –
RE
ST
RIC
TE
D15
53AB
I Med
ical S
chem
e40
8941
83-2
4562
042
193
893
084
011
2956
327
169
960
354
111
3391
3225
569
648
2836
519
766
4469
6148
1844
62,18
46,85
1005
AECI
Med
ical A
id S
ociet
y19
199
2023
1-5
1809
2716
9674
778
569
912
1717
9015
3077
1274
663
118
1643
515
962
371
669
8012
169
996
1443
2334
9624
44,28
41,25
1567
Afro
x M
edica
l Aid
Soc
iety
2058
519
306
715
6978
1332
2718
636
575
1113
2191
1225
878
535
529
110
810
8593
2644
3718
4839
131
940
5222
8615
9743
30,83
23,97
1456
Allia
nce
Mid
med
Med
ical S
chem
e45
8945
361
4238
439
276
877
072
27
2833
025
220
1251
546
311
3534
3416
364
632
2665
516
449
6257
2236
0659
62,89
41,88
1534
Altro
n M
edica
l Aid
Sch
eme
1414
513
442
512
9607
1017
2627
764
631
2110
8818
9675
212
641
600
713
644
1949
600
8012
565
4736
241
254
1532
9630
638
36,54
40,55
1012
Anglo
Am
erica
n Co
rpor
atio
n M
edica
l Sch
eme
(AAC
MED
)30
407
3049
30
2937
2326
6611
1080
572
910
2454
3323
8503
367
365
23
2187
220
843
560
575
7237
4060
5511
2023
997
1968
322
246,4
022
7,11
1503
Anglo
gold
Med
ical S
chem
e (G
oldm
ed)
2548
526
284
-383
604
1859
02-5
565
658
911
1002
7923
5797
-57
787
748
577
511
53-3
36
466
-75
87-1
00-
292
-100
N/A
4,08
l15
71An
glova
al G
roup
Med
ical S
chem
e11
923
1233
9-3
1135
0510
7615
579
372
79
9266
594
312
-264
863
72
1108
010
586
577
718
8031
268
166
1874
1655
3234
70,76
63,34
1013
Aran
da M
edica
l Sch
eme
1872
2016
-715
483
1483
24
689
613
1210
783
1005
87
480
416
1515
0415
19-1
6763
789
0951
9272
4662
2579
8157
,5435
,0112
79Ba
nkm
ed17
3745
1722
211
1454
019
1249
939
1669
760
515
1298
489
1196
519
962
357
98
1512
4713
0791
1673
6315
5426
3945
7683
1931
0026
5617
37,32
36,62
1507
Barlo
world
Med
ical S
chem
e15
767
1624
1-3
1741
0417
0880
292
087
75
1669
6114
3948
1688
273
919
1314
713
932
-669
71-3
8952
087
694
257
5154
665
51,42
51,32
1089
Billm
ed M
edica
l Sch
eme
3307
3405
-324
787
4521
5-4
512
4911
0613
1990
337
097
-46
1003
908
1017
3335
39-5
187
871
-46
436
-100
-13
899
-100
N/A
102,7
0m
1115
Biz H
ealth
Med
ical S
chem
e20
6923
98-1
436
455
3842
6-5
1469
1335
1034
188
3549
4-4
1377
1233
1238
2332
2818
154
112
3720
277
2031
00
1047
489
9016
55,62
52,85
1526
BMW
Em
ploye
es M
edica
l Aid
So
ciety
7689
7994
-460
118
5709
75
652
595
950
095
4187
120
543
437
2448
6349
47-2
5352
252
241
4282
022
6782
5531
2386
,9074
,9912
37BP
SA M
edica
l Sch
eme
6330
6371
-141
705
3792
110
549
496
1148
221
4264
713
635
558
1436
2833
598
4844
931
537
3220
4-2
4938
5089
-375
,6284
,9315
90Bu
ilding
& C
onstr
uctio
n In
dustr
y M
edica
l Aid
Fun
d10
662
1101
1-3
2992
628
976
323
421
97
2178
222
126
-217
016
72
3937
3346
1831
2522
1973
114
210
3917
2513
0432
65,93
49,04
g15
93Bu
ilt E
nviro
nmen
t Pro
fessio
nal
Asso
ciatio
ns M
edica
l Sch
eme
(BEP
S)30
8523
0834
2392
918
176
3264
665
6-1
2059
113
341
5455
648
215
2606
2509
470
91-2
264
610
70-4
019
939
3-4
92,7
05,8
8h
1158
Cawm
ed M
edica
l Sch
eme
589
632
-759
8557
744
847
761
1112
425
1176
16
1759
1550
1494
313
00-2
713
417
1-2
235
431
4019
0-1
262
269
6664
9-7
591,9
969
6,03
1043
Char
tere
d Acc
ount
ants
(SA)
Med
ical A
id F
und
(CAM
AF)
3358
233
416
033
1338
3036
629
822
757
927
0214
2449
4310
671
611
1043
400
4066
87
108
101
612
0850
9618
926
3597
2917
2336
,4731
,6815
21Cl
icks G
roup
Med
ical S
chem
e48
2544
608
1955
616
651
1733
831
19
1845
713
209
4031
924
729
3162
2439
3055
4620
6083
7919
-23
1240
1783
-30
31,10
47,56
1570
CSIR
Med
ical S
chem
e64
4365
36-1
5971
555
718
777
271
09
4862
750
568
-462
964
5-2
7579
6340
2098
8121
1504
110
079
4923
6315
5552
25,19
18,09
1039
DCM
ed M
edica
l Aid
Fun
d10
964
1090
11
8099
170
724
1561
654
114
6475
957
533
1349
244
012
7480
7222
457
553
3437
523
267
4831
1021
3846
42,44
32,90
1068
De
Beer
s Ben
efit
Socie
ty26
192
2644
4-1
2177
9020
0792
869
363
310
1779
7816
0523
1156
650
612
1841
813
762
3459
4335
1828
0714
5404
2669
7054
9327
83,94
72,42
1484
Edco
n M
edica
l Aid
Sch
eme
6822
6890
-157
443
5206
910
702
630
1144
623
4309
94
545
521
568
6955
0525
8467
2622
343
1404
159
3228
2030
5938
,8926
,9715
13Ell
erine
s Hol
dings
Med
ical A
id So
ciety
1724
1809
-513
539
1197
113
654
551
1910
427
1094
3-5
504
504
091
979
615
4437
2111
788
8803
3469
9648
9643
87,07
73,54
1572
Enge
n M
edica
l Ben
efit
Fund
7872
8310
-573
305
7034
54
776
705
1060
174
5981
11
637
600
644
7638
6416
4739
2242
325
3082
137
5552
3783
4757
,7443
,8115
85Ey
ethu
med
Med
ical S
chem
e98
7110
194
-332
116
3120
13
271
255
623
155
1966
218
195
161
2264
3346
0540
5438
4421
483
1743
523
2161
1766
2266
,8955
,88f
1271
Fishin
g In
dustr
y M
edica
l Sch
eme
(Fish
med
)36
3532
6012
3588
2967
2182
768
1916
1557
2344
4010
883
885
020
23-1
132
8924
3035
946
709
3391
,6981
,9210
86Fo
od W
orke
rs M
edica
l Ben
efit
Fund
1386
814
641
-512
439
1129
710
7564
1664
0758
0410
3833
1724
3829
70-1
815
17-1
326
037
2052
227
1637
1264
3020
9,31
181,6
515
78Fo
schin
i Gro
up M
edica
l Aid
Sch
eme
4732
4848
-236
719
3390
68
647
583
1128
110
2712
14
495
466
631
1427
6013
5547
1628
660
2095
137
6125
4239
4578
,0561
,7910
82G
5Med
5893
6342
-764
333
6135
55
910
806
1346
844
4275
710
662
562
1856
7556
401
8074
840
047
3294
722
7052
5431
3062
,2553
,7012
70G
olde
n Arr
ow E
mplo
yees
Med
ical
Bene
fit F
und
6295
6203
121
185
1894
712
280
255
1014
989
9301
6119
812
559
4034
9357
-57
5312
6-5
878
4354
2944
1244
863
4437
,0228
,6615
23G
rinte
k Ele
ctro
nics M
edica
l Aid
Sc
hem
e28
6527
982
2524
422
815
1173
468
08
2009
820
551
-258
561
2-4
2366
1951
2169
5818
2601
721
457
2191
9074
3524
103,0
694
,0511
77H
ighve
ld M
edica
l Sch
eme
-70
90-1
00-
5172
3-1
00-
608
-100
-43
289
-100
-50
9-1
00-
2764
-100
-32
-100
-33
513
-100
-49
58-1
00N
/A64
,7914
87H
olcim
Sou
th A
frica
Med
ical S
chem
e32
2133
39-4
3300
530
289
985
475
613
3072
727
212
1379
567
917
2862
2481
1574
6220
1582
316
840
-649
0350
94-4
47,94
55,60
1111
IBM
(SA)
Med
ical A
id S
ociet
y43
4645
77-5
3236
637
638
-14
621
685
-929
220
3097
1-6
560
564
-143
1742
132
8377
810
685
8917
2025
2019
9027
33,01
23,69
1591
Impa
la M
edica
l Plan
1105
410
330
721
969
1712
828
166
138
2021
353
1660
329
161
134
2046
642
510
43
245
1529
8251
401
276
4520
,5517
,41h
1559
Impe
rial G
roup
Med
ical S
chem
e12
431
1217
52
1073
5999
859
872
068
35
8396
979
004
656
354
14
8033
6157
3054
4228
6996
851
823
3554
7542
7128
65,17
51,90
1116
Jom
ed M
edica
l Sch
eme
-16
329
-100
-13
2905
-100
-101
7-1
00-
1240
30-1
00-
949
-100
-76
86-1
00-
59-1
00-
-N
/A-
-N
/AN
/AN
/A11
21Kl
erks
dorp
Med
ical B
enef
it So
ciety
(K
DM
)16
701
1983
3-1
614
1894
1491
75-5
708
627
1314
8094
1448
602
739
609
2180
4070
9513
4030
3544
422
5264
1-1
627
2830
40-1
031
,3135
,2911
45La
maf
Med
ical S
chem
e35
863
3503
72
4842
9138
8994
2411
2592
522
4032
4632
7707
2393
777
920
4375
033
063
3210
279
2913
4341
1010
4633
3883
2665
4627
,7425
,9811
97Lib
care
Med
ical S
chem
e11
105
1113
30
1018
1397
126
576
472
75
7706
264
901
1957
848
619
1008
085
6518
7664
1810
0851
8344
821
9431
7249
3099
,0585
,9215
47M
alcor
Med
ical S
chem
e90
9296
12-5
8063
278
170
373
967
89
8339
781
192
376
470
49
5854
6469
-10
5456
-433
874
3410
0-1
3704
3786
-242
,0143
,6210
42M
asco
m M
edica
l Sch
eme
1516
1654
-825
081
2291
89
1378
1155
1923
300
2140
29
1281
1079
1911
5494
422
6348
3316
034
1417
613
1091
588
6623
63,93
61,86
1495
Mas
smar
t Hea
lth P
lan35
9536
76-2
3548
832
836
882
374
411
2554
725
503
059
257
82
2830
2972
-566
67-3
1740
510
452
6748
9528
2673
49,05
31,83
1588
MED
COR
1038
1510
7733
-485
9731
7976
568
690
617
1256
0564
5772
84-3
450
447
155
354
5125
68
4440
1219
4711
4470
833
619
6041
337
522
,655,6
0g
1548
Med
ipos M
edica
l Sch
eme
2144
722
151
-318
7131
1814
053
727
682
718
3175
1798
772
712
677
517
316
1241
140
6747
4440
6565
3607
1013
1867
116
597
1321
7,26
198,8
415
68M
edise
nse
Med
ical S
chem
e17
469
1992
6-1
215
3520
1667
04-8
732
697
510
8345
1357
65-2
051
756
8-9
1531
516
047
-573
679
9779
064
694
5158
2834
9867
63,70
38,81
d15
35M
etro
care
6923
7717
-10
6482
766
347
-278
071
79
5290
851
568
363
755
714
4176
4191
050
4511
6150
545
103
3693
6261
9051
94,88
67,98
108 COUNCIL FOR MEDICAL SCHEMES Annual Report 2004-5
ANNEXURE L5
Deta
iled
fina
ncia
l in
form
atio
n: r
egis
tere
d sc
hem
esfo
r th
e ye
ar e
nded
31
Dece
mbe
r 20
04Detailed financial information: registered schemes
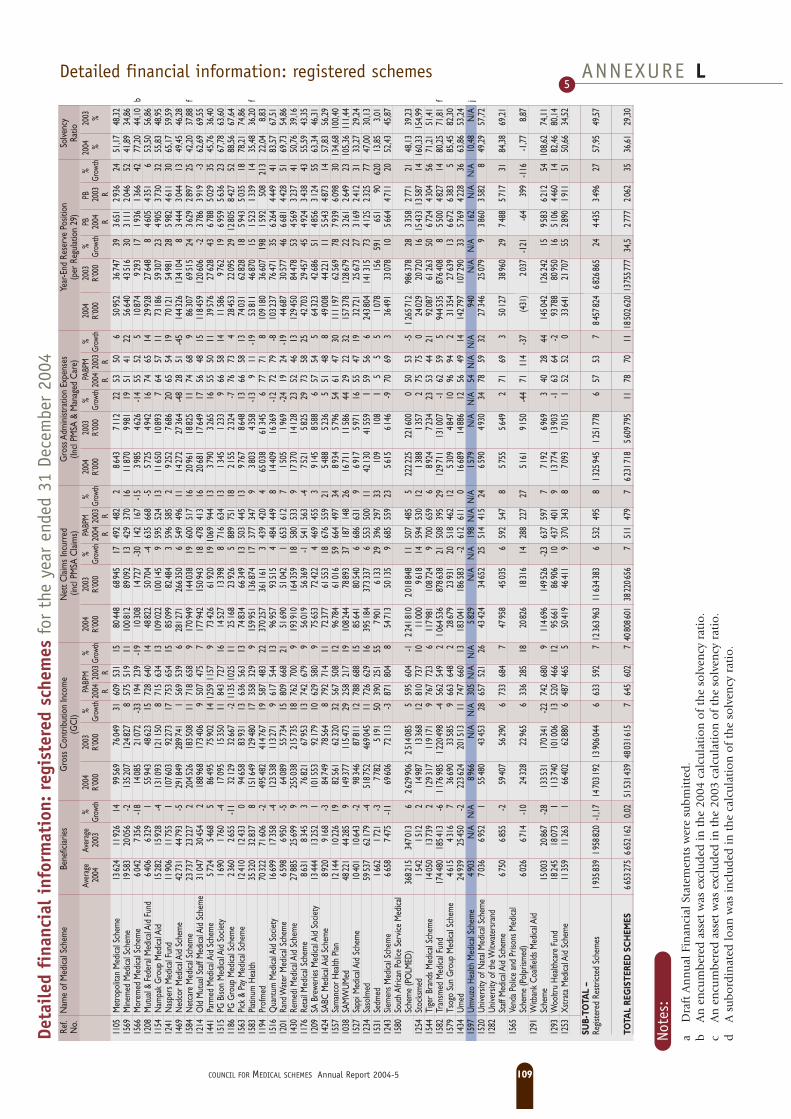
1105
Met
ropo
litan
Med
ical S
chem
e13
624
1192
614
9956
976
049
3160
953
115
8044
868
945
1749
248
22
8643
7112
2253
506
5095
236
747
3936
5129
3624
51,17
48,32
1569
Mine
med
Med
ical S
chem
e19
583
2005
6-2
1352
0712
4827
857
551
911
1008
1289
092
1342
937
016
1187
099
8119
5141
2256
640
4351
630
3111
2046
5241
,8934
,8615
66M
orem
ed M
edica
l Sch
eme
6042
7356
-18
1408
521
072
-33
194
239
-19
1030
814
727
-30
142
167
-15
3985
4626
-14
5552
510
874
9293
1719
3613
6642
77,20
44,10
b12
08M
utua
l & F
eder
al M
edica
l Aid
Fun
d64
0663
291
5594
348
623
1572
864
014
4882
250
704
-463
566
8-5
5725
4942
1674
6514
2992
827
648
846
0543
516
53,50
56,86
1154
Nam
pak
Gro
up M
edica
l Aid
1528
215
928
-413
1093
1211
508
715
634
1310
9022
1001
459
595
524
1311
650
1089
37
6457
1173
186
5930
723
4905
3730
3255
,8348
,9512
41N
aspe
rs M
edica
l Fun
d11
906
1175
51
1076
0392
273
1775
365
415
8509
982
484
359
658
52
9252
7686
2065
5419
7012
154
981
2859
8246
1130
65,17
59,59
1469
Ned
cor M
edica
l Aid
Sch
eme
4273
144
793
-529
1849
2897
411
569
539
628
1271
2663
506
549
496
1114
272
2736
4-4
828
51-4
514
4326
1341
048
3444
3044
1349
,4546
,2815
84N
etca
re M
edica
l Sch
eme
2373
723
227
220
4526
1835
0811
718
658
917
0949
1440
3819
600
517
1620
961
1882
511
7468
986
307
6951
524
3629
2897
2542
,2037
,88f
1214
Old
Mut
ual S
taff
Med
ical A
id Sc
hem
e31
047
3045
42
1889
6817
3406
950
747
57
1779
4215
0943
1847
841
316
2068
117
649
1756
4815
1184
5912
0606
-237
8639
19-3
62,69
69,55
1441
Parm
ed M
edica
l Aid
Sch
eme
5724
5468
586
495
7590
214
1259
1157
973
426
6192
019
1069
944
1337
9032
6516
5550
1139
576
2762
843
6788
5029
3545
,7636
,4015
15PG
Biso
n M
edica
l Aid
Soc
iety
1690
1760
-417
095
1535
011
843
727
1614
527
1339
88
716
634
1313
4512
339
6658
1411
586
9762
1969
5956
3623
67,78
63,60
1186
PG G
roup
Med
ical S
chem
e23
6026
55-1
132
129
3266
7-2
1135
1025
1125
168
2392
65
889
751
1821
5523
24-7
7673
428
453
2209
529
1280
584
2752
88,56
67,64
1563
Pick
& P
ay M
edica
l Sch
eme
1241
012
433
094
658
8393
113
636
563
1374
834
6634
913
503
445
1397
6786
4813
6658
1374
031
6282
818
5943
5035
1878
,2174
,8615
83Pl
atinu
m H
ealth
3532
032
837
815
1649
1294
8017
358
329
915
9951
1368
7417
377
347
938
0343
58-1
39
11-1
953
811
4687
015
1523
1339
1435
,4836
,20f
1194
Prof
med
7032
271
606
-249
5482
4147
6719
587
483
2237
0257
3611
613
439
420
465
038
6134
56
7771
810
9180
3660
719
815
9250
821
322
,048,8
315
16Q
uant
um M
edica
l Aid
Soc
iety
1669
917
358
-412
3538
1132
719
617
544
1396
957
9351
54
484
449
814
409
1636
9-1
272
79-8
1032
3776
471
3562
6444
4941
83,57
67,51
1201
Rand
Wat
er M
edica
l Sch
eme
6598
6950
-564
089
5573
415
809
668
2151
690
5104
21
653
612
715
0519
69-2
419
24-1
944
687
3057
746
6681
4428
5169
,7354
,8614
30Re
med
i Med
ical A
id S
chem
e27
885
2569
99
2550
3821
5735
1876
270
09
1939
1016
4359
1858
053
39
1737
014
128
2352
4613
1294
5084
478
5345
6932
3741
50,76
39,16
1176
Reta
il M
edica
l Sch
eme
8631
8345
376
821
6795
313
742
679
956
019
5636
9-1
541
563
-475
2158
2529
7358
2542
703
2945
745
4924
3438
4355
,5943
,3512
09SA
Bre
werie
s Med
ical A
id S
ociet
y13
444
1325
21
1015
5392
179
1062
958
09
7565
372
422
446
945
53
9145
8588
657
545
6432
342
686
5148
5631
2455
63,34
46,31
1424
SABC
Med
ical A
id S
chem
e89
2091
68-3
8474
978
564
879
271
411
7237
761
553
1867
655
921
5488
5236
551
488
4900
844
221
1155
4348
7314
57,83
56,29
1557
Sam
anco
r Hea
lth P
lan12
144
1022
619
8256
162
320
3256
750
812
9678
461
016
5966
449
734
8934
5796
5461
4730
1111
9762
569
7879
3960
9830
134,6
810
0,40
1038
SAM
WUM
ed48
221
4428
59
1493
7711
5473
2925
821
719
1082
4478
893
3718
714
826
1671
111
586
4429
2232
1573
7812
8679
2232
6126
4923
105,3
611
1,44
1527
Sapp
i Med
ical A
id S
chem
e10
401
1064
3-2
9834
687
811
1278
868
815
8564
180
540
668
663
19
6917
5971
1655
4719
3272
125
673
2731
6924
1231
33,27
29,24
1234
Saso
lmed
5953
762
179
-451
8752
4690
4511
726
629
1639
5184
3733
376
553
500
1142
130
4155
91
5956
624
3804
1413
1573
4125
2325
7747
,0030
,1315
31Se
dmed
1662
1721
-377
8251
9150
390
251
5579
0161
3329
396
297
3310
910
81
55
510
7815
659
165
190
620
13,85
3,01
1243
Siem
ens M
edica
l Sch
eme
6658
7475
-11
6960
672
113
-387
180
48
5471
350
135
968
555
923
5615
6146
-970
693
3649
133
078
1056
6447
1120
52,43
45,87
1580
Sout
h Afri
can
Polic
e Se
rvice
Med
ical
Sche
me
(PO
LMED
)36
8215
3470
136
2629
906
2514
085
559
560
4-1
2241
810
2018
848
1150
748
55
2222
2522
1600
050
53-5
1265
712
9863
7828
3358
2771
2148
,1339
,2312
54St
ocks
med
1542
1512
214
987
1336
812
810
737
1011
000
9618
1459
453
012
1388
1357
275
750
2402
920
720
1615
433
1358
714
160,3
315
4,99
1544
Tige
r Bra
nds M
edica
l Sch
eme
1405
013
739
212
9317
1191
719
767
723
611
7981
1087
249
700
659
689
2472
3423
5344
2192
087
6126
350
6724
4304
5671
,2151
,4115
82Tr
ansm
ed M
edica
l Fun
d17
4480
1854
13-6
1176
985
1220
498
-456
254
92
1064
536
8786
3821
508
395
2912
9711
1310
07-1
6259
594
4535
8764
088
5500
4827
1480
,2571
,81f
1579
Tsog
o Su
n G
roup
Med
ical S
chem
e46
1543
167
3669
033
585
966
364
82
2867
923
931
2051
846
212
5309
4847
1096
942
3135
427
639
1366
7263
835
85,45
82,30
1434
Umed
2493
925
450
-222
3624
2015
1311
747
660
1318
3041
1865
83-2
612
611
016
689
1488
612
5649
1414
2797
1072
9033
5769
4228
3663
,8653
,2415
97Um
vuzo
Hea
lth M
edica
l Sch
eme
4903
N/A
N/A
8966
N/A
N/A
305
N/A
N/A
5829
N/A
N/A
198
N/A
N/A
1579
N/A
N/A
54N
/AN
/A94
0N
/AN
/A16
2N
/AN
/A10
,48N
/Aj
1520
Unive
rsity
of N
atal
Med
ical S
chem
e70
3669
521
5548
043
453
2865
752
126
4342
434
652
2551
441
524
6590
4930
3478
5932
2734
625
079
938
6035
828
49,29
57,72
1282
Unive
rsity
of t
he W
itwat
ersr
and
Staff
Med
ical A
id S
chem
e67
5068
55-2
5940
756
290
673
368
47
4795
845
035
659
254
78
5755
5649
271
693
5012
738
960
2974
8857
1731
84,38
69,21
1565
Vend
a Po
lice
and
Priso
ns M
edica
l Sc
hem
e (P
olpr
ismed
)60
2667
14-1
024
328
2296
56
336
285
1820
826
1831
614
288
227
2751
6191
50-4
471
114
-37
(431
)20
37-1
21-6
439
9-1
16-1
,778,8
712
91W
itban
k Co
alfiel
ds M
edica
l Aid
Sc
hem
e15
003
2086
7-2
813
3531
1703
41-2
274
268
09
1146
9614
9526
-23
637
597
771
9269
693
4028
4414
5042
1262
4215
9583
6212
5410
8,62
74,11
1293
Woo
ltru
Hea
lthca
re F
und
1824
518
073
111
3740
1010
0613
520
466
1295
661
8690
610
437
401
913
774
1390
3-1
6364
-293
788
8095
016
5106
4460
1482
,4680
,1412
53Xs
trat
a M
edica
l Aid
Sch
eme
1135
911
263
166
402
6288
06
487
465
550
419
4641
19
370
343
870
9370
151
5252
033
641
2170
755
2890
1911
5150
,6634
,52
SUB-
TOTA
L –
Regis
tere
d Re
strict
ed S
chem
es19
3583
919
5882
0-1
,1714
7031
9213
9060
446
633
592
712
3639
6311
6343
836
532
495
813
2594
512
5177
86
5753
784
5782
468
2686
524
4435
3496
2757
,9549
,57
TOTA
L RE
GIS
TERE
D S
CH
EMES
6653
275
6652
162
0,02
5153
1439
4803
1615
764
560
27
4080
8601
3822
0656
751
147
97
6231
718
5609
795
1178
7011
1850
2620
1375
5777
34,5
2777
2062
3536
,6129
,30
Ref.
Nam
e of
Med
ical S
chem
eBe
nefic
iarie
sG
ross
Con
trib
utio
n In
com
e N
ett C
laim
s In
curr
edG
ross
Adm
inist
ratio
n Ex
pens
es
Year
-End
Res
erve
Pos
ition
So
lvenc
y N
o.(G
CI)
(incl
PMSA
Clai
ms)
(Incl
PMSA
& M
anag
ed C
are)
(per
Reg
ulat
ion
29)
Ratio
Aver
age
Aver
age
%20
0420
03%
PABP
M%
2004
2003
%PA
BPM
%20
0420
03%
PABP
M%
2004
2003
%PB
PB%
2004
2003
2004
2003
Grow
thR’
000
R’00
0Gr
owth
2004
2003
Grow
thR’
000
R’00
0Gr
owth
2004
2003
Grow
thR’
000
R’00
0Gr
owth
2004
2003
Grow
thR’
000
R’00
0Gr
owth
2004
2003
Grow
th%
%R
RR
RR
RR
R
Note
s:a
Dra
ft A
nn
ual
Fin
anci
al S
tate
men
ts w
ere
sub
mit
ted
.b
An
en
cum
ber
ed a
sset
was
exc
lud
ed i
n t
he
2004
cal
cula
tio
n o
f th
e so
lven
cy r
atio
.c
An
en
cum
ber
ed a
sset
was
exc
lud
ed i
n t
he
2003
cal
cula
tio
n o
f th
e so
lven
cy r
atio
.d
A s
ub
ord
inat
ed l
oan
was
in
clu
ded
in
th
e ca
lcu
lati
on
of
the
solv
ency
rat
io.
COUNCIL FOR MEDICAL SCHEMES Annual Report 2004-5 109
ANNEXURE L5
Deta
iled
fina
ncia
l in
form
atio
n: r
egis
tere
d sc
hem
esfo
r th
e ye
ar e
nded
31
Dece
mbe
r 20
04Detailed financial information: registered schemes

eTh
e so
lven
cy r
atio
has
bee
n r
esta
ted
by
rem
ovin
g th
e in
clu
sio
n o
f th
e sp
ecia
l go
vern
-m
ent
sub
sid
ized
pen
sio
ner
gro
up
co
ntr
ibu
tio
ns.
fTh
e sc
hem
e w
as r
egis
tere
d d
uri
ng
2000
, an
d a
ph
ase-
in s
olv
ency
rat
io o
f 22
%ap
pli
es.
gTh
e sc
hem
e w
as r
egis
tere
d d
uri
ng
2001
, an
d a
ph
ase-
in s
olv
ency
rat
io o
f 17
,5%
app
lies
.h
The
sch
eme
was
reg
iste
red
du
rin
g 20
02, a
nd
a p
has
e-in
so
lven
cy r
atio
of
13,5
%ap
pli
es.
iTh
e sc
hem
e w
as r
egis
tere
d d
uri
ng
2003
, an
d a
ph
ase-
in s
olv
ency
rat
io o
f 10
%ap
pli
es.
jTh
e sc
hem
e w
as r
egis
tere
d d
uri
ng
2004
, an
d a
ph
ase-
in s
olv
ency
rat
io o
f 10
% w
ill
app
ly t
o t
he
sch
eme
fro
m D
ecem
ber
200
5.k
Myh
ealt
h a
mal
gam
ated
wit
h O
xyge
n w
ith
eff
ect
fro
m 1
Ju
ly 2
004.
lA
ngl
ogo
ld a
mal
gam
ated
wit
h D
isco
very
Hea
lth
wit
h e
ffec
t fr
om
1 J
un
e 20
04.
mB
illm
ed a
mal
gam
ated
wit
h S
aman
cor
Hea
lth
Pla
n w
ith
eff
ect
fro
m 1
Ju
ly 2
004.
•P
MSA
= P
erso
nal
Med
ical
Sav
ings
Acc
ou
nt
•G
CI
= G
ross
Co
ntr
ibu
tio
n I
nco
me
•PA
BP
M =
Per
Ave
rage
Ben
efic
iary
Per
Mo
nth
•P
B =
Per
Ben
efic
iary
•Th
ere
are
no
200
4 fi
gure
s fo
r th
e co
lou
r co
ded
sch
emes
du
e to
:–
Sch
emes
liq
uid
atin
g d
uri
ng
the
year
(H
igh
veld
fu
rnis
hed
th
e O
ffic
e w
ith
man
-ag
emen
t ac
cou
nts
fo
r th
e 20
03 f
inan
cial
yea
r).
The
foll
owin
g sc
hem
es a
mal
gam
ated
in
200
4:•
All
care
wit
h N
BC
wit
h e
ffec
t fr
om
1 J
anu
ary
2004
.•
An
glo
gold
wit
h D
isco
very
Hea
lth
wit
h e
ffec
t fr
om
1 J
un
e 20
04.
•M
yhea
lth
wit
h O
xyge
n w
ith
eff
ect
fro
m 1
Ju
ly 2
004.
•B
illm
ed w
ith
Sam
anco
r w
ith
eff
ect
fro
m 1
Ju
ly 2
004.
•Th
ere
are
no
200
3 fi
gure
s fo
r th
e co
lou
r co
ded
sch
emes
du
e to
:–
Sch
emes
reg
iste
rin
g d
uri
ng
2004
. Th
e so
lven
cy r
atio
is
no
t d
irec
tly
com
par
able
to t
hat
of
oth
er s
chem
es.
110 COUNCIL FOR MEDICAL SCHEMES Annual Report 2004-5
ANNEXURE L5
Deta
iled
fina
ncia
l in
form
atio
n: r
egis
tere
d sc
hem
esfo
r th
e ye
ar e
nded
31
Dece
mbe
r 20
04Detailed financial information: registered schemes

1139
Om
nihea
lth34
811
7289
8-5
246
257
8888
338
0375
6463
39-4
168
560
613
3393
0951
2389
-34
611
480
2758
362
2082
27-7
215
3210
519
5-4
6(6
93)
1173
3-1
06-2
016
1-1
12-0
,181,8
27,9
21,6
95,2
312
15O
xyge
n20
0498
1192
6068
1655
7611
6480
9459
9960
6837
5647
643
410
7936
1846
4522
7139
933
220
1681
1510
9010
5418
1885
788
1538
3215
5623
-176
713
05-4
116
,2625
,6415
,4310
,974,1
211
70N
BC M
edica
l Sch
eme
1751
915
524
1318
245
1599
320
6886
1690
0822
945
881
716
3882
1306
6925
749
681
1028
428
2250
326
1413
130
117
1136
769
2482
548
2099
1599
3117
,7714
,694,8
9-1
,112,5
215
76Lib
erty
Med
ical S
chem
e94
833
1034
22-8
9550
610
7105
7648
1972
0870
666
756
119
5826
9958
8487
-150
845
811
1128
5010
6115
615
1598
8319
1589
4872
458
119
1676
701
139
20,78
10,05
7,99
7,16
3,45
1125
Disc
over
y H
ealth
M
edica
l Sch
eme
1564
874
1427
167
1015
1062
313
7720
412
9658
9210
9989
7218
715
666
794
7958
079
7444
119
523
483
821
9750
819
1172
115
1717
121
116
530
6285
116
5605
785
1957
1160
6923
,6215
,067,3
32,5
81,7
011
66N
atio
nal I
ndep
ende
nt
Med
ical A
id S
ociet
y (N
IMAS
)36
698
3375
39
3566
933
241
2589
3522
2230
1760
555
79
2268
4919
5525
1653
049
08
2151
816
129
338
750
4024
5261
940
645
2914
3412
0419
20,32
18,29
12,72
12,13
16,74
1575
Reso
lutio
n H
ealth
M
edica
l Sch
eme
7681
961
713
2467
315
5292
138
5918
2775
2939
478
437
920
8497
1641
0227
258
258
012
4100
7908
557
3228
154
125
2395
622
5448
875
1245
883
4124
,7819
,6316
,4913
,1812
,1712
85Pr
otec
tor H
ealth
7035
691
876
-23
8484
382
938
5664
9253
3496
655
653
64
5196
3547
3098
1051
047
57
6972
177
864
-10
1215
6878
-12
(384
9)21
595
-118
-55
235
-123
-0,68
4,05
7,42
25,45
27,71
1587
Path
finde
r Med
ical
Sche
me
4862
1684
189
2512
2022
1229
868
1980
408
281
4570
7657
6423
235
238
-142
7734
1325
3550
142
141
133
N/A
N/A
7N
/AN
/A0,2
70,0
0-1
2,56
N/A
N/A
1546
Phar
os M
edica
l Plan
1876
216
170
1617
812
1578
813
3279
1039
6928
624
549
1410
6789
8376
927
500
442
1325
392
1779
943
1917
119
9426
2044
317
287
1810
9010
692
15,34
16,63
13,49
13,55
11,19
1464
Sure
med
Hea
lth72
6978
43-7
6909
7251
4911
941
897
1759
248
223
3423
028
010
2241
332
228
1159
313
714
-15
2433
140
158
-11
8357
4332
9311
5055
210
817
,0110
,3417
,4715
,1427
,7010
87M
unim
ed11
9484
1157
283
1169
8199
267
1012
616
7938
6628
721
666
887
5740
6739
3930
624
566
1014
6380
1315
0411
1417
104
110
-610
6633
1106
72-4
892
956
-710
,5313
,9420
,0420
,9022
,3811
67N
atio
nal M
edica
l Plan
(N
MP)
1417
4815
0341
-614
4491
1514
2812
9219
312
1641
96
745
669
1110
5611
710
0869
75
609
555
1017
8222
1703
565
1414
103
9410
2801
9326
0829
719
7717
3514
21,68
21,44
20,93
17,06
18,50
1589
Baym
ed40
03N/
AN/
A40
03N/
A30
09N/
AN/
A63
N/A
N/A
2890
N/A
N/A
60N/
AN/
A45
0N/
AN/
A15
N/A
9N/
AN/
A(3
31)
N/A
N/A
-83
N/A
N/A
-10,9
9N/
AN/
AN/
AN/
A15
86Xp
ress
Car
e M
edica
l Sc
hem
e24
325
2540
6-4
2580
520
771
1222
2877
953
5739
531
326
9481
853
900
7630
621
642
2574
716
582
5521
2183
6725
1407
913
655
357
953
78
11,52
17,52
16,60
0,00
N/A
1162
Glo
bal H
ealth
5766
564
725
-11
6233
047
715
4781
7135
7262
3463
962
42
4365
8731
8172
3758
455
65
5834
939
197
4912
1178
6814
9855
696
377
217
0914
8915
20,61
26,98
28,68
22,47
19,36
1147
Telem
ed58
724
5172
714
6000
153
826
6769
6754
7823
2494
084
811
6390
4650
9871
2588
878
912
4293
741
707
36
860
65-8
1597
5914
9187
727
2128
84-6
23,60
27,23
26,18
24,83
16,89
Mov
emen
t in
the
solv
ency
pos
ition
s of o
pen
med
ical
sche
mes
that
ach
ieve
d 25
% as
at D
ecem
ber
2004
but w
ere
prev
ious
ly b
elow
the
pres
crib
ed le
vels
1202
Fedh
ealth
1422
4714
2384
014
0713
1532
3911
5021
111
2317
52
681
611
1287
4461
8538
582
518
464
1218
8258
1909
49-1
1617
111
104
729
6465
2531
8317
2084
1778
1725
,7722
,5414
,366,5
70,3
712
52Be
stmed
Med
ical S
chem
e82
284
7415
111
7937
667
475
6444
2851
9821
2467
764
25
4742
1639
8979
1949
849
31
8522
459
978
4213
1289
7421
2060
1211
3864
8125
0415
3663
31,97
21,90
13,08
6,93
-1,13
1577
Ingw
e H
ealth
Plan
3322
834
702
-430
054
3453
713
2539
1388
71-5
368
335
1099
556
8745
314
276
211
3138
664
3344
116
2924
107
8133
4280
744
795
-412
8812
910
32,30
32,26
16,63
9,22
6,74
1422
Topm
ed M
edica
l Sch
eme
3508
342
415
-17
3603
645
375
3273
7437
8884
-14
757
696
926
8975
2903
71-7
622
533
1740
393
4394
8-8
1212
9381
1612
4447
9658
229
3547
2277
5638
,0125
,497,6
71,8
91,0
511
40M
edsh
ield
Med
ical
Sche
me
1990
7025
0642
-21
2182
1026
1881
1365
338
1537
838
-11
521
489
787
1958
9384
17-7
333
299
1233
7507
3937
75-1
425
2612
912
53
5532
0731
6745
7527
7912
6412
040
,5220
,607,2
16,3
1-0
,3615
60O
penp
lan M
edica
l Sc
hem
e41
933
4942
9-1
544
279
5382
436
2027
3965
48-9
681
614
1131
4048
3217
27-2
591
498
1952
642
5782
0-9
1515
9990
1115
8171
1480
797
3772
2996
2643
,6937
,3418
,552,2
91,4
414
46Se
lfmed
Med
ical S
chem
e32
138
3554
5-1
033
299
3868
725
9059
2781
93-7
648
599
821
4441
2216
48-3
537
477
1235
865
3939
4-9
1414
9085
611
6706
9120
428
3631
2566
4245
,0532
,7820
,8413
,797,8
011
41Sp
ectr
amed
2002
2415
8041
2717
6225
1365
9910
3064
869
9750
4748
742
714
7095
9156
7115
2533
634
6-3
1573
8996
565
6315
1474
5926
2652
1497
726
171
1325
618
114
25,73
13,97
11,34
9,47
10,01
1506
Med
imed
Med
ical
Sche
me
1272
497
1631
1258
195
5270
291
4854
345
466
423
1052
854
3660
244
350
319
1066
0346
2943
910
4440
831
806
1986
260
2500
2044
2245
,2540
,9225
,2810
,6112
,7710
21M
erid
ian H
ealth
4289
1122
6-6
252
2512
512
5404
012
3901
-56
862
825
444
745
8774
9-4
971
458
422
6667
1507
6-5
612
1210
610
06
3867
032
936
1790
1629
3420
771
,5626
,5810
,4813
,4412
0,24
1512
Bonit
as M
edica
l Aid
Fund
5275
7565
1511
-19
5645
5466
8780
3883
967
4517
863
-14
573
563
230
0635
437
8041
6-2
044
447
1-6
5051
5445
5016
1113
1075
5732
1208
443
7170
1769
2291
1101
108
31,11
15,87
9,49
16,71
18,13
1486
MSP
Sizw
e M
edica
l Sc
hem
e15
3728
1637
65-6
1567
6416
9596
1187
572
1114
384
763
154
815
8326
9787
5982
-544
343
03
1849
5416
7436
1016
1598
8220
3992
0420
9296
9125
9712
7810
333
,6218
,7812
,2813
,8011
,02
Ref.
Nam
e of
Med
ical S
chem
eBe
nefic
iarie
sG
ross
Con
trib
utio
n In
com
e N
ett C
laim
s In
curr
edG
ross
Non
-Hea
lth E
xpen
ses
Year
End
Res
erve
Pos
ition
So
lvenc
y N
o.(G
CI)
(incl
PMSA
Clai
ms)
(incl
PMSA
)(P
er R
egul
atio
n 29
)Ra
tio%
%%
%%
%As
As%
%%
2004
Aver
ageAv
erage
2004
2003
2004
PABP
M20
0420
0420
0320
04PA
BPM
2004
2004
2003
2004
%of
%of
PABP
M20
0420
0420
0320
04PB
PB20
0420
0420
0320
0220
0120
0031
/12/20
0431
/12/20
03Gr
owth
2004
2003
R’000
R’000
Grow
th20
0420
03Gr
owth
R’000
R’000
Grow
th20
0420
03Gr
owth
R’000
R’000
Grow
thGC
IGC
I200
420
03Gr
owth
R’000
R’000
Grow
th20
0420
03Gr
owth
25,0%
22,0%
17,50
%13
,50%
10%
RR
RR
2004
2003
RR
RR
Mov
emen
t in
the
solv
ency
pos
ition
s of o
pen
med
ical
sche
mes
that
did
not
ach
ieve
25%
as a
t Dec
embe
r 20
04
Note
s:Sc
hem
es p
lace
d u
nd
er c
lose
mo
nit
ori
ng
du
rin
g th
e 20
00 y
ear
Sch
emes
pla
ced
un
der
clo
se m
on
ito
rin
g d
uri
ng
the
2001
yea
rSc
hem
es p
lace
d u
nd
er c
lose
mo
nit
ori
ng
du
rin
g th
e 20
02 y
ear
Sch
emes
pla
ced
un
der
clo
se m
on
ito
rin
g d
uri
ng
the
2003
yea
rSc
hem
es p
lace
d u
nd
er c
lose
mo
nit
ori
ng
du
rin
g th
e 20
04 y
ear
Ple
ase
take
no
te t
hat
all
sch
emes
th
at a
mal
gam
ated
or
liq
uid
ated
wer
e re
mov
ed f
rom
the
tab
le
•P
MSA
= P
erso
nal
Med
ical
Sav
ings
Acc
ou
nt
•G
CI
= G
ross
Co
ntr
ibu
tio
n I
nco
me
•PA
BP
M =
Per
Ave
rage
Ben
efic
iary
Per
Mo
nth
•P
B =
Per
Ben
efic
iary
COUNCIL FOR MEDICAL SCHEMES Annual Report 2004-5 111
ANNEXURE M5
Mov
emen
t in
the
sol
venc
y po
siti
ons
of o
pen
med
ical
sch
emes
as a
t 31
Dec
embe
r 20
04Movement in the solvency positions of open medical schemes

RE
GIS
TE
RE
D S
CH
EM
ES
– O
PE
N15
89Ba
ymed
133
627
,10
133
627
,10
121
325
,61
637
N/A
0,44
183
--
--
-0,
1312
52Be
stm
ed M
edic
al S
chem
e5
998
3,40
781
0,44
4819
337
,09
1290
072
,62
0,46
302
937
748
43
957
746
254
53
236
7,80
1512
Boni
tas
Med
ical
Aid
Fun
d65
225
6,13
9185
68,
6331
068
837
,72
177
249
114,
080,
711
120
484
220
138
453
601
2805
664
651
537
84,
1510
34C
ape
Med
ical
Pla
n4
504
25,0
186
0,48
301
416
,10
500
011
9,98
0,95
4918
527
643
6645
716
530
-1
230
8,64
1048
Com
mer
cial
and
Indu
stri
al M
edic
al
Aid
Soc
iety
(C
IMA
S)7
603
34,0
66
041
27,0
66
367
31,4
02
500
92,1
60,
4191
595
165
915
870
682
1167
2-
14,0
615
52C
omm
unity
Med
ical
Aid
Sch
eme
(CO
MM
ED)
527
78,
666
819
11,1
914
590
30,2
312
000
103,
950,
8287
560
3440
743
086
-30
614
45,
5314
91C
ompc
are
Med
ical
Sch
eme
1071
714
,73
956
613
,15
1642
429
,12
1059
910
3,66
0,65
128
676
-98
42
388
--
7,50
1125
Dis
cove
ry H
ealth
Med
ical
Sch
eme
602
559
16,9
652
189
614
,69
358
489
13,8
040
350
811
1,28
0,66
214
017
42
019
169
--
--
5,27
1596
Eclip
se M
edic
al S
chem
e52
6,56
526,
5633
551
,97
455
N/A
2,32
865
--
--
-4,
3912
02Fe
dhea
lth67
758
21,5
072
160
22,9
015
277
6,38
6198
511
2,94
1,01
324
128
7156
950
227
110
823
879
512
2,69
1501
Free
Sta
te M
edic
al A
id S
chem
e31
5,66
-0,
0011
922
,73
105
0,00
0,76
900
554
--
-2
9,12
1554
Gen
esis
Med
ical
Sch
eme
161
0,56
330,
129
264
41,4
47
051
93,2
91,
3284
994
--
--
-12
,50
1561
Gen
-Hea
lth M
edic
al S
chem
e6
859
30,6
36
443
28,7
76
245
42,7
04
544
53,3
31,
2457
845
--
--
685
13,0
011
62G
loba
l Hea
lth28
625
21,8
529
303
22,3
725
637
21,4
318
000
111,
340,
6081
608
538
63
457
503
979
105
102
72,
3914
66G
ood
Hop
e M
edic
al A
id S
ocie
ty41
55,
67-
0,00
178
927
,31
630
32,6
60,
3229
101
-14
3-
692
3-
14,6
015
37H
osm
ed M
edic
al A
id S
chem
e19
936
12,1
714
169
8,65
2926
421
,39
8647
611
7,58
2,08
277
737
--
--
286
6,67
a15
77In
gwe
Hea
lth P
lan
385
510
,62
135
43,
7312
050
44,1
85
145
103,
930,
6259
625
--
--
-7,
1915
56K
waZ
ulu-
Nat
al M
edic
al A
id
Sche
me
496
2,76
245
113
,62
1021
671
,29
690
095
,18
1,58
8463
6-
531
8-
-68
19,4
215
76Li
bert
y M
edic
al S
chem
e4
286
2,05
409
81,
9612
579
7,88
3600
089
,22
0,95
172
867
9856
39
080
--
-4,
0815
36Li
fem
ed M
edic
al S
chem
e5
717
22,9
15
556
22,2
74
847
23,5
44
017
106,
000,
6430
583
-3
659
107
4-
-4,
8811
42M
edic
al E
xpen
ses
Dis
trib
utio
n So
ciet
y (M
EDS)
1461
224
,12
1370
122
,62
229
64,
528
000
104,
930,
5433
136
3899
628
824
--
-1,
3415
49M
edic
over
200
023
350
14,8
395
0,06
983
48,
7826
132
87,2
20,
8560
610
720
255
1456
433
231
-3
553
18,3
611
49M
edih
elp
141
379
19,5
728
571
3,96
115
443
18,3
565
520
98,6
00,
3558
615
7-
2378
517
992
-24
433
3,06
1506
Med
imed
Med
ical
Sch
eme
465
824
,19
433
022
,49
224
515
,51
360
986
,21
0,99
3445
4-
--
-22
7,82
1140
Med
shie
ld M
edic
al S
chem
e27
827
7,44
3480
99,
3117
009
571
,20
4109
697
,21
0,71
696
705
3983
3-
-12
621
419
10,1
410
21M
erid
ian
Hea
lth2
284
15,4
31
978
13,3
698
58,
043
155
93,3
91,
1211
295
2094
221
307
--
-3,
0310
87M
unim
ed14
795
5,33
696
32,
5148
045
20,0
234
000
104,
170,
4893
198
3368
165
766
1865
915
538
188
2,67
1166
Nat
iona
l Ind
epen
dent
Med
ical
Aid
So
ciet
y (N
IMA
S)10
145
14,3
06
285
8,86
1087
817
,50
2510
045
,97
1,38
9336
618
23
971
--
797
2,21
1167
Nat
iona
l Med
ical
Pla
n (N
MP)
1865
15,
2714
867
4,20
2478
28,
5683
419
97,6
21,
1535
901
322
748
9-
--
3261
32,
3711
70N
BC M
edic
al S
chem
e9
128
16,1
09
858
17,3
91
258
2,80
1350
010
2,25
1,05
5268
6-
--
--
3,86
1139
Om
nihe
alth
1545
414
,83
2232
321
,42
1949
520
,97
1350
099
,22
0,53
4220
4-
244
6-
-1
231
1,49
1560
Ope
npla
n M
edic
al S
chem
e4
254
4,29
428
14,
3222
095
25,6
814
021
97,9
10,
6015
627
555
008
3249
0-
165
05,
6812
15O
xyge
n5
086
1,96
713
82,
7559
726
27,4
752
300
138,
060,
8410
920
221
352
1-
253
7-
-1,
4515
87Pa
thfin
der
Med
ical
Sch
eme
229
6,80
737
21,8
83
153
162,
6564
447
,85
1,20
462
9-
--
-64
7,85
1546
Phar
os M
edic
al P
lan
346
49,
493
023
8,28
326
011
,14
950
798
,52
1,09
3070
2-
--
--
3,45
1454
Pro
Sano
Med
ical
Sch
eme
1760
27,
5125
418
10,8
566
368
32,1
137
000
114,
980,
7259
133
612
52
010
3998
4-
371
59,
4111
96Pr
otea
Med
ical
Aid
Soc
iety
325
231
,13
302
128
,92
726
7,20
311
599
,08
1,08
1805
92
930
984
--
-0,
6412
85Pr
otec
tor
Hea
lth14
763
9,51
1150
97,
4222
895
16,0
819
000
104,
520,
4644
566
352
712
257
--
221,
3915
95Pu
lz M
edic
al S
chem
e20
695
82,6
42
330
9,30
2607
817
8,58
611
211
7,86
1,64
3047
8-
--
--
6,86
1575
Res
olut
ion
Hea
lth M
edic
al
Sche
me
344
33,
262
080
1,97
398
06,
9713
410
100,
240,
8313
480
8-
--
-12
72,
1014
46Se
lfmed
Med
ical
Sch
eme
201
82,
841
203
1,70
1660
028
,25
1450
092
,25
0,88
101
708
2991
425
842
306
6-
206
03,
4014
86Si
zwe
Med
ical
Fun
d69
559
21,3
873
123
22,4
733
611
14,7
350
000
94,1
10,
7235
746
039
863
3345
3-
-94
4,81
1141
Spec
tram
ed44
161
15,6
420
650
7,31
1966
310
,11
6705
30,
001,
2234
859
4-
--
814
019
45,
9014
64Su
rem
ed H
ealth
984
7,31
117
08,
695
910
63,0
14
950
92,3
81,
7418
479
--
--
-6,
4811
47Te
lem
ed12
157
6,55
1011
35,
457
326
4,18
4550
090
,37
0,85
224
158
--
645
5-
326
4,21
1592
The
bem
ed29
811
,69
367
14,4
336
022
,84
169
5N
/A3,
543
655
--
--
-7,
63
Ref.
Nam
e of
Med
ical
Sch
eme
Acc
ount
s Re
ceiv
able
Con
trib
utio
n D
ebto
rsA
ccou
nts
Paya
ble
Out
stan
ding
Cla
ims
Prov
ision
Inve
stm
ents
Gro
ss C
laim
s
No.
Prio
r Yea
rC
over
ing
Cas
h an
dBo
nds
Equi
ties
Prop
ertie
sIn
sura
nce
Oth
erIn
curr
ed
Cla
ims
Net
tC
ash
and
Polic
yC
ash
and
Prov
ision
Cla
ims
Equi
vale
nts
Deb
entu
res
Cas
h
Util
ised
Equi
vale
nts
Day
sD
ays
Day
sC
over
age
R’00
0O
utst
andi
ngR’
000
Out
stan
ding
R’00
0O
utst
andi
ngR’
000
%M
onth
sR’
000
R’00
0R’
000
R’00
0R’
000
R’00
0M
onth
s
112 COUNCIL FOR MEDICAL SCHEMES Annual Report 2004-5
ANNEXURE N5
Deta
iled
fina
ncia
l re
sult
s: r
egis
tere
d sc
hem
esas
at
31 D
ecem
ber
2004
Detailed financial results: registered schemes

Ref.
Nam
e of
Med
ical
Sch
eme
Acc
ount
s Re
ceiv
able
Con
trib
utio
n D
ebto
rsA
ccou
nts
Paya
ble
Out
stan
ding
Cla
ims
Prov
ision
Inve
stm
ents
Gro
ss C
laim
s
No.
Prio
r Yea
rC
over
ing
Cas
h an
dBo
nds
Equi
ties
Prop
ertie
sIn
sura
nce
Oth
erIn
curr
ed
Cla
ims
Net
tC
ash
and
Polic
yC
ash
and
Prov
ision
Cla
ims
Equi
vale
nts
Deb
entu
res
Cas
h
Util
ised
Equi
vale
nts
Day
sD
ays
Day
sC
over
age
R’00
0O
utst
andi
ngR’
000
Out
stan
ding
R’00
0O
utst
andi
ngR’
000
%M
onth
sR’
000
R’00
0R’
000
R’00
0R’
000
R’00
0M
onth
s14
22To
pmed
Med
ical
Sch
eme
488
35,
441
251
1,40
1687
822
,90
1901
199
,56
0,98
156
602
2517
4-
--
-8,
0215
86X
-Pre
ss C
are
Med
ical
Sch
eme
292
88,
743
756
11,2
26
619
25,4
88
991
102,
971,
1532
912
--
--
-3,
78
SUB
-TO
TAL
–R
egist
ered
Ope
n Sc
hem
es1
333
468
13,2
21
088
952
10,7
91
607
204
20,6
21
539
540
100,
310,
7510
097
626
323
801
289
107
918
475
455
188
983
177
4,94
RE
GIS
TE
RE
D S
CH
EM
ES
– R
ES
TR
ICT
ED
1553
ABI
Med
ical
Sch
eme
880,
7065
0,52
508
6,27
170
475
,21
0,82
4576
5-
--
--
18,5
810
05A
ECI M
edic
al A
id S
ocie
ty7
668
15,4
77
646
15,4
23
540
7,52
1373
810
2,81
0,96
3842
319
137
6656
4-
--
2,81
1567
Afr
ox M
edic
al A
id S
ocie
ty16
343
38,0
012
376
28,7
84
471
12,3
46
298
106,
500,
6648
481
-9
401
--
-3,
9014
56A
llian
ce M
idm
ed M
edic
al S
chem
e2
817
24,2
62
206
19,0
025
53,
292
435
88,6
91,
4529
375
392
5-
--
-14
,11
1534
Altr
on M
edic
al A
id S
chem
e2
745
7,73
258
87,
291
620
5,43
934
599
,13
1,38
7933
98
316
-39
1-
-7,
4310
12A
nglo
Am
eric
an C
orpo
ratio
n M
edic
al S
chem
e (A
AC
MED
)10
152
12,6
28
382
10,4
21
663
2,47
1757
473
,24
1,10
114
847
241
449
590
410
208
946
471
-5,
6215
71A
nglo
vaal
Gro
up M
edic
al S
chem
e4
889
15,7
23
568
11,4
72
753
10,8
44
600
105,
360,
8259
255
1293
025
797
156
-18
309
7,67
1013
Ara
nda
Med
ical
Sch
eme
400
9,42
237
5,58
229
7,75
942
65,9
01,
059
681
--
--
-10
,77
1279
Bank
med
775
91,
953
396
0,85
184
698
51,9
244
777
94,3
80,
5052
431
532
731
410
855
021
957
-36
56,
6715
07Ba
rlow
orld
Med
ical
Sch
eme
226
34,
7422
20,
473
644
7,97
1230
310
3,25
0,88
109
346
--
--
-7,
8611
15Bi
z H
ealth
Med
ical
Sch
eme
403
140
,36
237
723
,80
362
738
,72
300
111,
020,
1120
748
274
913
--
-0,
8715
26BM
W E
mpl
oyee
s M
edic
al A
id
Soci
ety
447
2,72
710,
431
134
8,26
310
086
,42
0,74
4942
8-
--
681
4-
11,8
412
37BP
SA M
edic
al S
chem
e14
11,
2313
21,
152
441
18,4
82
256
98,8
90,
567
805
1324
215
033
419
8-
-1,
2715
90Bu
ildin
g &
Con
stru
ctio
n In
dust
ry
Med
ical
Aid
Fun
d29
03,
5311
81,
4430
75,
152
400
90,2
21,
3221
567
-96
9-
-0
11,8
815
93Bu
ilt E
nvir
onm
ent
Prof
essi
onal
A
ssoc
iatio
ns M
edic
al S
chem
e (B
EPS)
157
424
,01
120
218
,33
171
3,03
176
610
2,83
1,30
304
3-
--
--
1,77
1158
Caw
med
Med
ical
Sch
eme
140
385
,55
-0,
0013
53,
961
350
0,00
1,30
894
613
421
1314
6-
--
0,98
1043
Cha
rter
ed A
ccou
ntan
ts (
SA)
Med
ical
Aid
Fun
d (C
AM
AF)
1132
012
,47
1110
012
,23
517
16,
9926
000
102,
221,
2667
486
2485
917
823
498
567
963
-3,
0015
21C
licks
Gro
up M
edic
al S
chem
e97
118
,12
575
10,7
41
388
27,4
51
900
106,
781,
298
682
--
--
-5,
6415
70C
SIR
Med
ical
Sch
eme
682
4,17
450,
272
016
15,1
43
232
0,00
1,06
2722
2-
--
--
6,72
1039
DC
Med
Med
ical
Aid
Fun
d1
862
8,39
822
3,70
129
07,
274
082
92,4
00,
7635
516
-3
585
--
-6,
5810
68D
e Be
ers
Bene
fit S
ocie
ty4
285
7,18
-0,
0029
143
59,7
718
937
82,1
91,
2822
149
9-
--
-5
103
14,9
314
84Ed
con
Med
ical
Aid
Sch
eme
686
4,36
245
1,55
180
414
,76
390
081
,02
1,30
3167
0-
143
--
-8,
5515
13El
leri
nes
Hol
ding
s M
edic
al A
id
Soci
ety
206
5,55
661,
7998
3,44
600
93,9
70,
6912
280
--
--
-14
,13
1572
Enge
n M
edic
al B
enef
it Fu
nd48
82,
4325
0,13
263
315
,97
323
110
4,32
0,73
5056
11
038
--
--
8,21
1585
Eyet
hum
ed M
edic
al S
chem
e1
123
12,7
632
33,
672
982
47,0
01
300
76,5
20,
6720
317
438
0-
--
-5,
8512
71Fi
shin
g In
dust
ry M
edic
al S
chem
e (F
ishm
ed)
373
37,9
745
346
,04
312
59,3
713
093
,46
0,81
287
648
4-
--
719
,59
1086
Food
Wor
kers
Med
ical
Ben
efit
Fund
143
542
,12
131
438
,55
382
21,7
8-
N/A
-8
543
409
611
962
320
759
011
40,
2115
78Fo
schi
ni G
roup
Med
ical
Aid
Sc
hem
e3
468
34,4
72
938
29,2
186
611
,25
107
891
,77
0,46
2963
6-
--
--
12,6
510
82G
5Med
497
628
,23
402
822
,85
963
7,50
270
010
7,75
0,77
5481
147
76
112
114
--
13,7
612
70G
olde
n A
rrow
Em
ploy
ees
Med
ical
Be
nefit
Fun
d2
129
36,6
81
901
32,7
51
559
37,9
699
610
1,39
0,80
794
236
2-
--
-6,
6515
23G
rint
ek E
lect
roni
cs M
edic
al A
id
Sche
me
219
231
,69
176
225
,48
213
438
,75
400
107,
710,
2627
391
114
3-
--
-14
,64
1487
Hol
cim
Sou
th A
fric
a M
edic
al
Sche
me
431
4,77
220,
241
476
17,5
41
408
99,2
50,
6923
427
-14
3-
520
-4,
1511
11IB
M (
SA)
Med
ical
Aid
Soc
iety
357
940
,36
247
227
,88
199
724
,94
130
072
,53
0,64
1652
1-
--
-14
438
06,
7815
91Im
pala
Med
ical
Pla
n8
0,13
-0,
002
002
34,2
2-
N/A
-6
509
--
--
-3,
6615
59Im
peri
al G
roup
Med
ical
Sch
eme
330
911
,25
392
313
,34
167
57,
285
000
87,6
50,
7452
108
--
-32
257
-7,
45
COUNCIL FOR MEDICAL SCHEMES Annual Report 2004-5 113
ANNEXURE N5
Deta
iled
fina
ncia
l re
sult
s: r
egis
tere
d sc
hem
esas
at
31 D
ecem
ber
2004
Detailed financial results: registered schemes
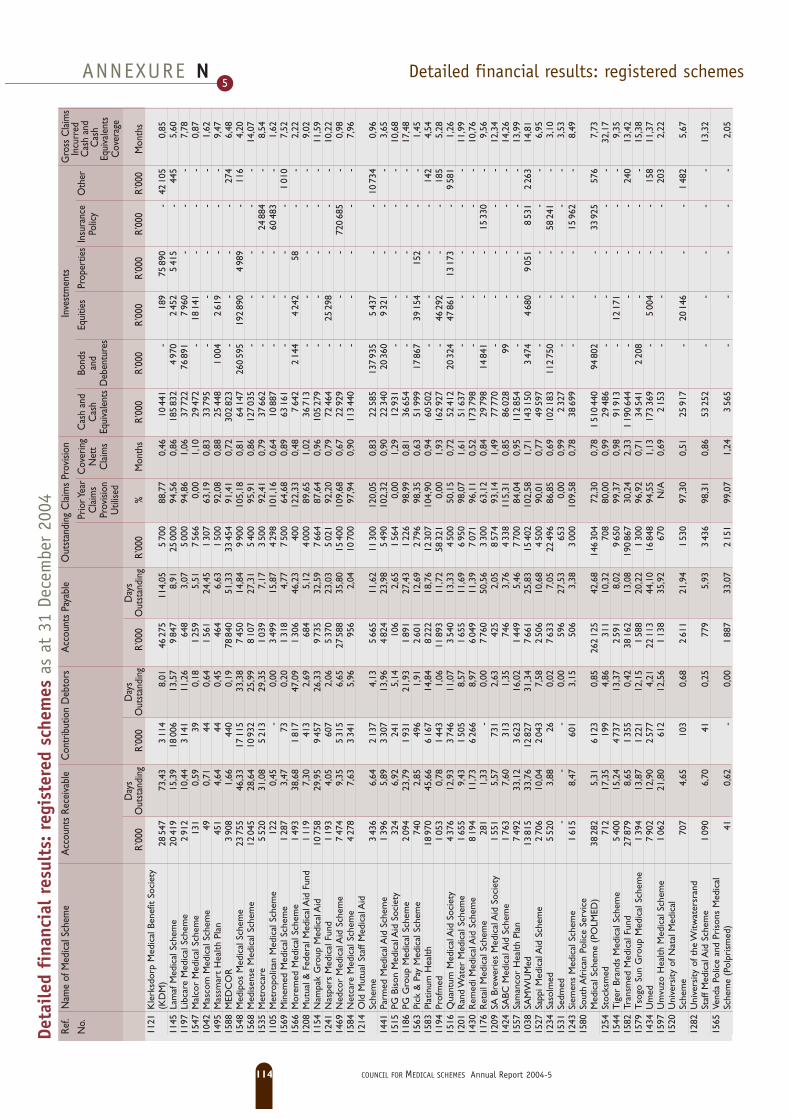
Ref.
Nam
e of
Med
ical
Sch
eme
Acc
ount
s Re
ceiv
able
Con
trib
utio
n D
ebto
rsA
ccou
nts
Paya
ble
Out
stan
ding
Cla
ims
Prov
ision
Inve
stm
ents
Gro
ss C
laim
s
No.
Prio
r Yea
rC
over
ing
Cas
h an
dBo
nds
Equi
ties
Prop
ertie
sIn
sura
nce
Oth
erIn
curr
ed
Cla
ims
Net
tC
ash
and
Polic
yC
ash
and
Prov
ision
Cla
ims
Equi
vale
nts
Deb
entu
res
Cas
h
Util
ised
Equi
vale
nts
Day
sD
ays
Day
sC
over
age
R’00
0O
utst
andi
ngR’
000
Out
stan
ding
R’00
0O
utst
andi
ngR’
000
%M
onth
sR’
000
R’00
0R’
000
R’00
0R’
000
R’00
0M
onth
s11
21K
lerk
sdor
p M
edic
al B
enef
it So
ciet
y (K
DM
)28
547
73,4
33
114
8,01
4627
511
4,05
570
088
,77
0,46
1044
1-
189
7589
0-
4210
50,
8511
45La
maf
Med
ical
Sch
eme
2041
915
,39
1800
613
,57
984
78,
9125
000
94,5
60,
8618
583
24
970
245
25
415
-44
55,
6011
97Li
bcar
e M
edic
al S
chem
e2
912
10,4
43
141
11,2
664
83,
075
000
94,8
61,
0637
722
7689
17
960
--
-7,
7815
47M
alco
r M
edic
al S
chem
e13
10,
5939
0,18
125
95,
517
566
0,00
1,10
2947
2-
1814
1-
--
0,87
1042
Mas
com
Med
ical
Sch
eme
490,
7144
0,64
156
124
,45
130
763
,19
0,83
3379
5-
--
--
1,62
1495
Mas
smar
t H
ealth
Pla
n45
14,
6444
0,45
464
6,63
150
092
,08
0,88
2544
81
004
261
9-
--
9,47
1588
MED
CO
R3
908
1,66
440
0,19
7884
051
,33
3345
491
,41
0,72
302
823
--
--
274
6,48
1548
Med
ipos
Med
ical
Sch
eme
2375
546
,33
1711
533
,38
745
014
,84
990
010
5,18
0,81
6414
726
059
519
289
04
989
-11
64,
2015
68M
edis
ense
Med
ical
Sch
eme
1204
528
,64
1093
225
,99
810
727
,31
540
095
,91
0,86
127
035
--
--
-14
,07
1535
Met
roca
re5
520
31,0
85
213
29,3
51
039
7,17
350
092
,41
0,79
3766
2-
--
2488
4-
8,54
1105
Met
ropo
litan
Med
ical
Sch
eme
122
0,45
-0,
003
499
15,8
74
298
101,
160,
6410
887
--
-60
483
-1,
6215
69M
inem
ed M
edic
al S
chem
e1
287
3,47
730,
201
318
4,77
750
064
,68
0,89
6316
1-
--
-1
010
7,52
1566
Mor
emed
Med
ical
Sch
eme
149
338
,68
181
747
,09
130
646
,23
400
122,
330,
487
642
214
44
242
58-
-2,
2212
08M
utua
l & F
eder
al M
edic
al A
id F
und
111
97,
3041
32,
6968
45,
124
000
89,6
51,
0236
713
--
--
-9,
0211
54N
ampa
k G
roup
Med
ical
Aid
1075
829
,95
945
726
,33
973
532
,59
766
487
,64
0,96
105
279
--
--
-11
,59
1241
Nas
pers
Med
ical
Fun
d1
193
4,05
607
2,06
537
023
,03
502
192
,20
0,79
7246
4-
2529
8-
--
10,2
214
69N
edco
r M
edic
al A
id S
chem
e7
474
9,35
531
56,
6527
588
35,8
015
400
109,
680,
6722
929
--
-72
068
5-
0,98
1584
Net
care
Med
ical
Sch
eme
427
87,
633
341
5,96
956
2,04
1070
097
,94
0,90
113
440
--
--
-7,
9612
14O
ld M
utua
l Sta
ff M
edic
al A
id
Sche
me
343
66,
642
137
4,13
566
511
,62
1130
012
0,05
0,83
2258
513
793
55
437
--
1073
40,
9614
41Pa
rmed
Med
ical
Aid
Sch
eme
139
65,
893
307
13,9
64
824
23,9
85
490
102,
320,
9022
340
2036
09
321
--
-3,
6515
15PG
Bis
on M
edic
al A
id S
ocie
ty32
46,
9224
15,
1410
62,
651
564
0,00
1,29
1293
1-
--
--
10,6
811
86PG
Gro
up M
edic
al S
chem
e2
094
23,7
91
931
21,9
31
891
27,4
31
226
98,9
90,
8136
654
--
--
-17
,48
1563
Pick
& P
ay M
edic
al S
chem
e74
02,
8549
61,
912
601
12,6
92
796
98,3
50,
6351
999
1786
739
154
152
--
1,45
1583
Plat
inum
Hea
lth18
970
45,6
66
167
14,8
48
222
18,7
612
307
104,
900,
9460
502
--
--
142
4,54
1194
Prof
med
105
30,
781
443
1,06
1189
311
,72
5832
10,
001,
9316
292
7-
4629
2-
-18
55,
2815
16Q
uant
um M
edic
al A
id S
ocie
ty4
376
12,9
33
746
11,0
73
540
13,3
34
500
50,1
50,
7252
412
2032
447
861
1317
3-
958
11,
2612
01R
and
Wat
er M
edic
al S
chem
e1
655
9,43
150
58,
571
655
11,6
96
950
98,0
71,
6151
637
--
--
-11
,99
1430
Rem
edi M
edic
al A
id S
chem
e8
194
11,7
36
266
8,97
604
911
,39
707
196
,11
0,52
173
798
--
--
-10
,76
1176
Ret
ail M
edic
al S
chem
e28
11,
33-
0,00
776
050
,56
330
063
,12
0,84
2979
814
841
--
1533
0-
9,56
1209
SA B
rew
erie
s M
edic
al A
id S
ocie
ty1
551
5,57
731
2,63
425
2,05
857
493
,14
1,49
7777
0-
--
--
12,3
414
24SA
BC M
edic
al A
id S
chem
e1
763
7,60
313
1,35
746
3,76
433
811
5,31
0,85
8602
899
--
--
14,2
615
57Sa
man
cor
Hea
lth P
lan
749
233
,12
362
316
,02
144
95,
467
700
84,0
40,
9511
285
4-
--
--
13,9
910
38SA
MW
UM
ed13
815
33,7
612
827
31,3
47
661
25,8
315
402
102,
581,
7114
315
03
474
468
09
051
853
12
263
14,8
115
27Sa
ppi M
edic
al A
id S
chem
e2
706
10,0
42
043
7,58
250
610
,68
450
090
,01
0,77
4959
7-
--
--
6,95
1234
Saso
lmed
552
03,
8826
0,02
763
37,
0522
496
86,8
50,
6910
218
311
275
0-
-58
241
-3,
1015
31Se
dmed
--
-0,
0059
627
,53
653
0,00
0,99
232
7-
--
--
3,53
1243
Siem
ens
Med
ical
Sch
eme
161
58,
4760
13,
1550
63,
383
000
109,
580,
7838
699
--
-15
962
-8,
4915
80So
uth
Afr
ican
Pol
ice
Serv
ice
Med
ical
Sch
eme
(PO
LMED
)38
282
5,31
612
30,
8526
212
542
,68
146
304
72,3
00,
781
510
440
9480
2-
-33
925
576
7,73
1254
Stoc
ksm
ed71
217
,35
199
4,86
311
10,3
270
880
,00
0,99
2948
6-
--
--
32,1
715
44T
iger
Bra
nds
Med
ical
Sch
eme
540
015
,24
473
713
,37
259
18,
029
650
99,3
70,
9891
913
-12
171
--
-9,
3515
82Tr
ansm
ed M
edic
al F
und
2787
98,
651
355
0,42
3816
213
,08
190
867
30,2
42,
331
190
644
--
--
240
13,4
215
79T
sogo
Sun
Gro
up M
edic
al S
chem
e1
394
13,8
71
221
12,1
51
588
20,2
21
300
96,9
20,
7134
541
220
8-
--
-15
,38
1434
Um
ed7
902
12,9
02
577
4,21
2211
344
,10
1684
894
,55
1,13
173
369
-5
004
--
158
11,3
715
97U
mvu
zo H
ealth
Med
ical
Sch
eme
106
221
,80
612
12,5
61
138
35,9
267
0N
/A0,
692
153
--
--
203
2,22
1520
Uni
vers
ity o
f Nat
al M
edic
al
Sche
me
707
4,65
103
0,68
261
121
,94
153
097
,30
0,51
2591
7-
2014
6-
-1
482
5,67
1282
Uni
vers
ity o
f the
Witw
ater
sran
d St
aff M
edic
al A
id S
chem
e1
090
6,70
410,
2577
95,
933
436
98,3
10,
8653
252
--
--
-13
,32
1565
Vend
a Po
lice
and
Pris
ons
Med
ical
Sc
hem
e (P
olpr
ism
ed)
410,
62-
0,00
188
733
,07
215
199
,07
1,24
356
5-
--
--
2,05
114 COUNCIL FOR MEDICAL SCHEMES Annual Report 2004-5
ANNEXURE N5
Deta
iled
fina
ncia
l re
sult
s: r
egis
tere
d sc
hem
esas
at
31 D
ecem
ber
2004
Detailed financial results: registered schemes
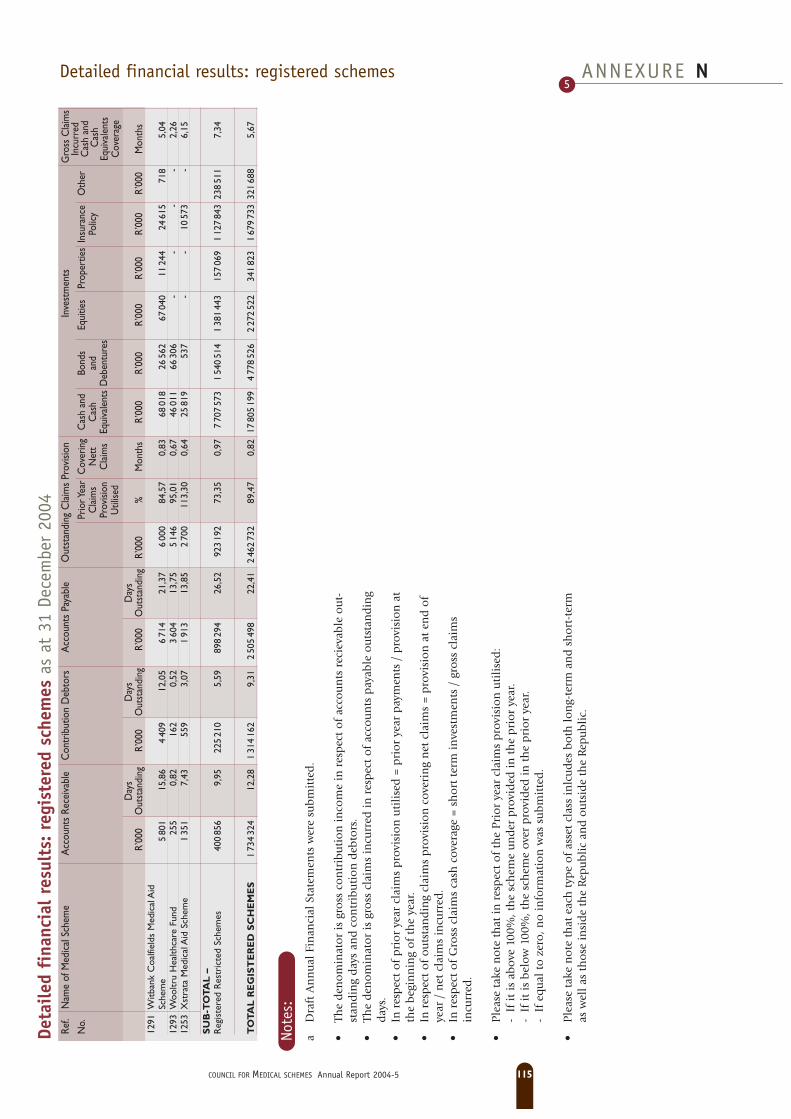
Ref.
Nam
e of
Med
ical
Sch
eme
Acc
ount
s Re
ceiv
able
Con
trib
utio
n D
ebto
rsA
ccou
nts
Paya
ble
Out
stan
ding
Cla
ims
Prov
ision
Inve
stm
ents
Gro
ss C
laim
s
No.
Prio
r Yea
rC
over
ing
Cas
h an
dBo
nds
Equi
ties
Prop
ertie
sIn
sura
nce
Oth
erIn
curr
ed
Cla
ims
Net
tC
ash
and
Polic
yC
ash
and
Prov
ision
Cla
ims
Equi
vale
nts
Deb
entu
res
Cas
h
Util
ised
Equi
vale
nts
Day
sD
ays
Day
sC
over
age
R’00
0O
utst
andi
ngR’
000
Out
stan
ding
R’00
0O
utst
andi
ngR’
000
%M
onth
sR’
000
R’00
0R’
000
R’00
0R’
000
R’00
0M
onth
s12
91W
itban
k C
oalfi
elds
Med
ical
Aid
Sc
hem
e5
801
15,8
64
409
12,0
56
714
21,3
76
000
84,5
70,
8368
018
2656
267
040
1124
424
615
718
5,04
1293
Woo
ltru
Hea
lthca
re F
und
255
0,82
162
0,52
360
413
,75
514
695
,01
0,67
4601
166
306
--
--
2,26
1253
Xst
rata
Med
ical
Aid
Sch
eme
135
17,
4355
93,
071
913
13,8
52
700
113,
300,
6425
819
537
--
1057
3-
6,15
SU
B-T
OT
AL
–R
egis
tere
d R
estr
icte
d Sc
hem
es40
085
69,
9522
521
05,
5989
829
426
,52
923
192
73,3
50,
977
707
573
154
051
41
381
443
157
069
112
784
323
851
17,
34
TO
TA
L R
EG
IST
ER
ED
SC
HE
ME
S1
734
324
12,2
81
314
162
9,31
250
549
822
,41
246
273
289
,47
0,82
1780
519
94
778
526
227
252
234
182
31
679
733
321
688
5,67
Note
s:a
Dra
ft A
nn
ual
Fin
anci
al S
tate
men
ts w
ere
sub
mit
ted
.
•Th
e d
eno
min
ato
r is
gro
ss c
on
trib
uti
on
in
com
e in
res
pec
t o
f ac
cou
nts
rec
ieva
ble
ou
t-st
and
ing
day
s an
d c
on
trib
uti
on
deb
tors
.•
The
den
om
inat
or
is g
ross
cla
ims
incu
rred
in
res
pec
t o
f ac
cou
nts
pay
able
ou
tsta
nd
ing
day
s.•
In r
esp
ect
of
pri
or
year
cla
ims
pro
visi
on
uti
lise
d =
pri
or
year
pay
men
ts /
pro
visi
on
at
the
beg
inn
ing
of
the
year
.•
In r
esp
ect
of
ou
tsta
nd
ing
clai
ms
pro
visi
on
cov
erin
g n
et c
laim
s =
pro
visi
on
at
end
of
year
/ n
et c
laim
s in
curr
ed.
•In
res
pec
t o
f G
ross
cla
ims
cash
cov
erag
e =
sho
rt t
erm
in
vest
men
ts /
gro
ss c
laim
sin
curr
ed.
•P
leas
e ta
ke n
ote
th
at i
n r
esp
ect
of
the
Pri
or
year
cla
ims
pro
visi
on
uti
lise
d:
- I
f it
is
abov
e 10
0%, t
he
sch
eme
un
der
pro
vid
ed i
n t
he
pri
or
year
.-
If
it i
s b
elow
100
%, t
he
sch
eme
over
pro
vid
ed i
n t
he
pri
or
year
.-
If
equ
al t
o z
ero
, no
in
form
atio
n w
as s
ub
mit
ted
.
•P
leas
e ta
ke n
ote
th
at e
ach
typ
e o
f as
set
clas
s in
lcu
des
bo
th l
on
g-te
rm a
nd
sh
ort
-ter
mas
wel
l as
th
ose
in
sid
e th
e R
epu
bli
c an
d o
uts
ide
the
Rep
ub
lic.
COUNCIL FOR MEDICAL SCHEMES Annual Report 2004-5 115
ANNEXURE N5
Deta
iled
fina
ncia
l re
sult
s: r
egis
tere
d sc
hem
esas
at
31 D
ecem
ber
2004
Detailed financial results: registered schemes

REG
ISTE
RED
SC
HEM
ES –
OPE
N15
89Ba
ymed
100
34
003
300
937
639
012
,96
4937
747
--
0,00
-N
/AN
/A-
0,00
--
0,00
--
0,00
--
0,00
1252
Best
med
Med
ical
Sch
eme
2863
379
376
644
428
677
6011
29,
3363
1751
818
118
0,12
0,20
558
1831
012
7,03
0,93
103
51,
091,
7213
592
1422
,61
716
97,
5311
,93
1512
Boni
tas
Med
ical
Aid
Fun
d21
843
156
455
43
883
967
573
289
538
7,45
4324
815
937
960
0,14
0,33
380
483
4583
36,
741,
3199
20,
150,
3414
20
0,05
876
51,
293,
0310
34C
ape
Med
ical
Pla
n4
937
1076
365
736
509
1622
524
,68
126
--
290
2,25
1,79
583
1935
85,
400,
3637
72,
922,
327
006
5443
,18
350
2,71
2,16
1048
Com
mer
cial
and
Indu
stria
l Med
ical
A
id S
ocie
ty (C
IMA
S)2
894
759
281
480
894
816
810
,02
906
151
6812
41,
361,
5251
510
200
6,72
0,62
185
2,03
2,26
--
0,00
114
512
,57
14,0
215
52C
omm
unity
Med
ical
Aid
Sch
eme
(CO
MM
ED)
1145
532
424
222
459
572
3785
617
,02
9732
579
8451
51,
321,
3694
810
9478
929
,23
2,50
344
0,88
0,91
844
22,
2326
80,
690,
7114
91C
ompc
are
Med
ical
Sch
eme
1165
829
612
265
498
747
2832
410
,67
8026
365
7420
80,
590,
7354
124
500
1,82
0,19
285
0,80
1,01
--
0,00
360,
100,
1311
25D
iscov
ery
Hea
lth M
edic
al S
chem
e63
410
01
510
623
1296
589
271
515
3572
811
,84
851
246
750
691
357
0,07
0,09
381
754
381
0,25
0,02
785
0,04
0,05
210
939
1213
,74
--
0,00
1596
Eclip
se M
edic
al S
chem
e21
648
02
162
500
219
10,1
151
142
33-
-0,
00-
N/A
N/A
-0,
0068
15,8
331
,28
--
0,00
--
0,00
1202
Fedh
ealth
5757
214
071
31
150
211
681
140
511
12,2
283
114
719
6862
60,
370,
451
149
1388
368
8,16
0,82
780
0,46
0,56
--
0,00
1487
48,
8110
,59
1501
Free
Sta
te M
edic
al A
id S
chem
e12
834
82
017
483
240
11,9
058
--
163,
806,
60-
N/A
N/A
-0,
0065
15,5
226
,98
4010
16,5
3-
-0,
0015
54G
enes
is M
edic
al S
chem
e7
328
2271
210
408
538
217
064
16,3
963
1483
754
720,
260,
4265
34
163
303
28,7
63,
8326
00,
951,
52-
-0,
00-
-0,
0015
61G
en-H
ealth
Med
ical
Sch
eme
601
014
892
8173
345
720
529
25,1
211
513
394
7516
70,
940,
8216
05
3201
010
,75
0,78
195
1,09
0,95
919
54,
483
113
17,4
215
,17
1162
Glo
bal H
ealth
2592
362
330
478
171
639
4742
39,
9263
3750
450
210
0,28
0,44
585
2424
390
9,39
1,23
133
31,
782,
81-
-0,
003
383
4,52
7,13
1466
Goo
d H
ope
Med
ical
Aid
Soc
iety
321
010
587
2675
121
12
948
11,0
223
247
419
570,
451,
9437
57
300
3,45
1,24
137
1,08
4,64
--
0,00
900,
713,
0715
37H
osm
ed M
edic
al A
id S
chem
e33
878
131
468
597
727
379
6782
911
,35
4356
598
3672
60,
461,
071
208
717
251
79,
191,
7868
10,
431,
0066
10
0,97
173
31,
102,
55a
1577
Ingw
e H
ealth
Pla
n16
679
3005
413
253
936
818
840
14,2
152
860
124
513
1,42
2,72
484
1207
71,
610,
2693
62,
604,
97-
-0,
007
932
21,9
942
,10
1556
Kw
aZul
u-N
atal
Med
ical
Aid
Sch
eme
394
515
191
6566
836
013
597
20,7
175
839
746
175
0,96
1,29
-N
/AN
/A-
0,00
397
2,18
2,92
526
33,
871
142
6,26
8,40
1576
Libe
rty
Med
ical
Sch
eme
4147
495
506
764
819
667
7216
59,
4463
6727
959
316
0,28
0,44
706
710
082
97,
390,
9813
00,
110,
18-
-0,
0047
20,
410,
6515
36Li
fem
ed M
edic
al S
chem
e3
355
895
691
063
847
936
710
,29
878
588
8095
0,88
1,01
113
716
211
12,6
71,
2154
0,50
0,58
--
0,00
220,
200,
2311
42M
edic
al E
xpen
ses
Dist
ribut
ion
Soci
ety
(MED
S)11
510
2402
422
107
476
723
454
10,6
181
2164
275
222
0,77
0,95
101
1031
80,
430,
0427
40,
951,
17-
-0,
00-
-0,
0015
49M
edic
over
200
035
030
9465
257
476
050
645
648
7,94
40-
-44
10,
390,
97-
N/A
N/A
-0,
00-
-0,
0012
960
1128
,39
691
46,
0915
,15
1149
Med
ihel
p10
646
419
827
42
636
709
110
820
150
67,
6485
--
295
0,12
0,15
855
995
008
4,31
0,42
114
40,
480,
5711
425
448
56,7
09
076
3,81
4,50
1506
Med
imed
Med
ical
Sch
eme
465
712
581
7029
146
66
209
8,83
415
542
3742
0,28
0,67
-N
/AN
/A-
0,00
--
0,00
--
0,00
--
0,00
1140
Med
shie
ld M
edic
al S
chem
e80
164
218
210
136
533
852
123
437
717
,17
9017
414
067
529
0,20
0,23
199
413
153
402
9,14
0,85
371
0,14
0,16
--
0,00
3472
813
,26
14,8
210
21M
erid
ian
Hea
lth2
300
522
554
040
862
413
67,
6566
265
242
129
2,06
3,12
241
926
778
46,1
35,
8321
63,
455,
22-
-0,
00-
-0,
0010
87M
unim
ed45
171
116
981
101
261
672
188
777
8,77
6375
991
5433
80,
240,
3897
419
5126
38,
331,
1092
00,
661,
0495
81
1,08
281
12,
003,
1711
48M
yhea
lth M
edic
al S
chem
e8
267
1709
872
788
710
890
412
,23
875
771
5657
0,28
0,64
218
543
560
12,7
42,
451
470
14,3
316
,51
460
0,51
378
3,69
4,25
b11
66N
atio
nal I
ndep
ende
nt M
edic
al A
id
Soci
ety
(NIM
AS)
1506
735
669
258
935
605
1855
17,
1643
--
226
0,53
1,22
173
1017
312
4,85
0,93
509
1,19
2,74
903
921
48,7
31
368
3,20
7,38
1167
Nat
iona
l Med
ical
Pla
n (N
MP)
6346
414
449
11
292
193
745
101
195
7,83
5891
960
5333
60,
190,
3363
110
6305
94,
360,
6285
00,
490,
8419
70
0,19
465
32,
684,
6011
70N
BC M
edic
al S
chem
e7
525
1824
520
688
694
522
030
10,6
510
120
615
9413
00,
600,
59-
N/A
N/A
-0,
0010
80,
490,
49-
-0,
0057
92,
642,
6311
39O
mni
heal
th17
524
4625
738
037
568
543
650
11,4
879
1467
926
348
0,63
0,80
124
37
177
637
26,8
82,
8585
91,
551,
974
461
810
,22
368
36,
648,
4415
60O
penp
lan
Med
ical
Sch
eme
1931
044
279
362
027
681
3768
010
,41
7128
768
5432
00,
600,
851
305
1111
867
329
,48
3,46
470
0,88
1,25
168
83
4,48
183
23,
454,
8612
15O
xyge
n67
686
165
576
945
999
476
118
687
12,5
560
106
820
5477
30,
390,
6584
18
105
157
5,08
0,71
796
0,40
0,67
30
0,00
500
02,
524,
2115
87Pa
thfin
der
Med
ical
Sch
eme
126
82
512
1229
840
83
206
26,0
710
656
319
311,
020,
9624
124
000
9,55
0,75
497
16,4
715
,49
646
2120
,14
647
21,4
420
,17
1546
Phar
os M
edic
al P
lan
707
217
812
133
279
624
2116
115
,88
9912
311
5838
81,
821,
8461
610
208
3,44
0,29
182
0,85
0,86
--
0,00
708
733
,16
33,4
914
54Pr
o Sa
no M
edic
al S
chem
e43
168
116
821
855
021
610
8103
39,
4858
4307
131
115
40,
821,
423
619
2713
405
430
,98
4,47
553
0,39
0,68
466
43
5,76
311
72,
223,
8511
96Pr
otea
Med
ical
Aid
Soc
iety
183
33
198
3813
499
44
180
10,9
610
93
180
8392
2,39
2,20
416
690
012
,94
0,99
324
8,45
7,76
--
0,00
262
6,83
6,27
1285
Prot
ecto
r H
ealth
3154
584
843
566
492
556
5028
28,
8849
4214
741
895
0,88
1,78
124
293
40,
140,
0252
90,
521,
0517
60
0,35
461
0,45
0,92
1595
Pulz
Med
ical
Sch
eme
595
313
474
9140
256
513
780
15,0
885
1218
475
112
0,69
0,81
100
911
151
7,45
0,73
901,
110,
65-
-0,
00-
-0,
0015
75Re
solu
tion
Hea
lth M
edic
al S
chem
e26
475
6731
538
591
847
810
008
825
,94
124
4025
750
170
0,21
0,17
272
1369
10,
410,
0345
90,
570,
4642
61
0,43
649
68,
046,
4914
46Se
lfmed
Med
ical
Sch
eme
1388
333
299
259
059
648
2658
110
,26
6712
549
3124
00,
600,
901
537
530
731
146
,14
5,78
410
1,03
1,54
382
910
14,4
12
820
7,06
10,6
114
86Si
zwe
Med
ical
Fun
d58
987
156
764
118
757
263
112
469
610
,50
6610
069
754
452
0,24
0,36
335
1917
626
2,14
0,27
602
0,32
0,48
140
51
1,13
430
02,
293,
4511
41Sp
ectr
amed
5933
117
622
51
030
648
487
114
717
11,1
354
9900
647
432
0,20
0,38
108
715
429
0,61
0,09
188
90,
891,
6531
70
0,28
816
23,
867,
1214
64Su
rem
ed H
ealth
283
56
909
4911
959
27
694
15,6
693
482
558
114
1,38
1,48
376
312
529
254
,41
4,89
275
3,31
3,57
--
0,00
--
0,00
1147
Tele
med
2525
860
001
676
967
940
3513
95,
1949
--
489
0,68
1,39
197
921
924
3,29
0,56
198
0,28
0,56
2021
028
57,5
11
022
1,42
2,91
1592
Theb
emed
131
22
679
929
028
91
279
13,7
640
102
232
391,
213,
05-
N/A
N/A
-0,
0020
0,61
1,52
--
0,00
160,
501,
2514
22To
pmed
Med
ical
Sch
eme
1517
036
036
327
374
757
2915
18,
9067
2519
158
628
1,45
2,16
812
711
599
922
,53
2,79
346
0,80
1,19
--
0,00
108
92,
523,
7315
86X
-Pre
ss C
are
Med
ical
Sch
eme
963
625
805
122
228
395
1763
414
,43
5712
955
4284
0,27
0,48
400
666
667
15,5
02,
2798
0,32
0,56
--
0,00
209
06,
7511
,85
SUB
-TO
TAL
–Re
giste
red
Ope
n Sc
hem
es1
900
692
471
743
636
8282
4765
139
7249
910
,79
702
868
971
5116
054
0,28
0,40
2665
042
762
411
0,47
0,67
2349
80,
420,
5940
994
87
10,3
215
908
52,
814,
00
Ref.
Nam
e of
Med
ical S
chem
eM
embe
rsBe
nefic
iaries
Gro
ss
Gro
ss A
dmin
istra
tion
Gros
s Adm
inistr
atio
nAu
dit F
ees
Trus
tee
Rem
uner
atio
nPr
incip
al O
fficer
Fee
sSt
affM
arke
ting
and
Adve
r- N
o.C
ontr
ibut
ions
Expe
nses
(RISK
+PM
SA)
Fees
Paid
& Ex
pens
esRe
mun
erat
ion
tisin
g Ex
pend
iture
AsAs
No
ofAV
G pe
rAs
As
AsAs
PA
BPM
% of
PABP
MPA
BPM
PABP
M%
oftru
stees
Trus
tee
PABP
M%
ofPA
BPM
% of
PABP
M%
ofPA
BPM
% of
Aver
age
Aver
age
R'00
0R
R'00
0G
CI
RR'
000
RR'
000
RG
AER'
000
RR
GAE
R'00
0R
GAE
R'00
0R
GAE
R'00
0R
GAE
116 COUNCIL FOR MEDICAL SCHEMES Annual Report 2004-5
ANNEXURE O5
Deta
iled
fina
ncia
l re
sult
s: r
egis
tere
d sc
hem
esfo
r th
e ye
ar e
nded
31
Dece
mbe
r 20
04Detailed financial results: registered schemes
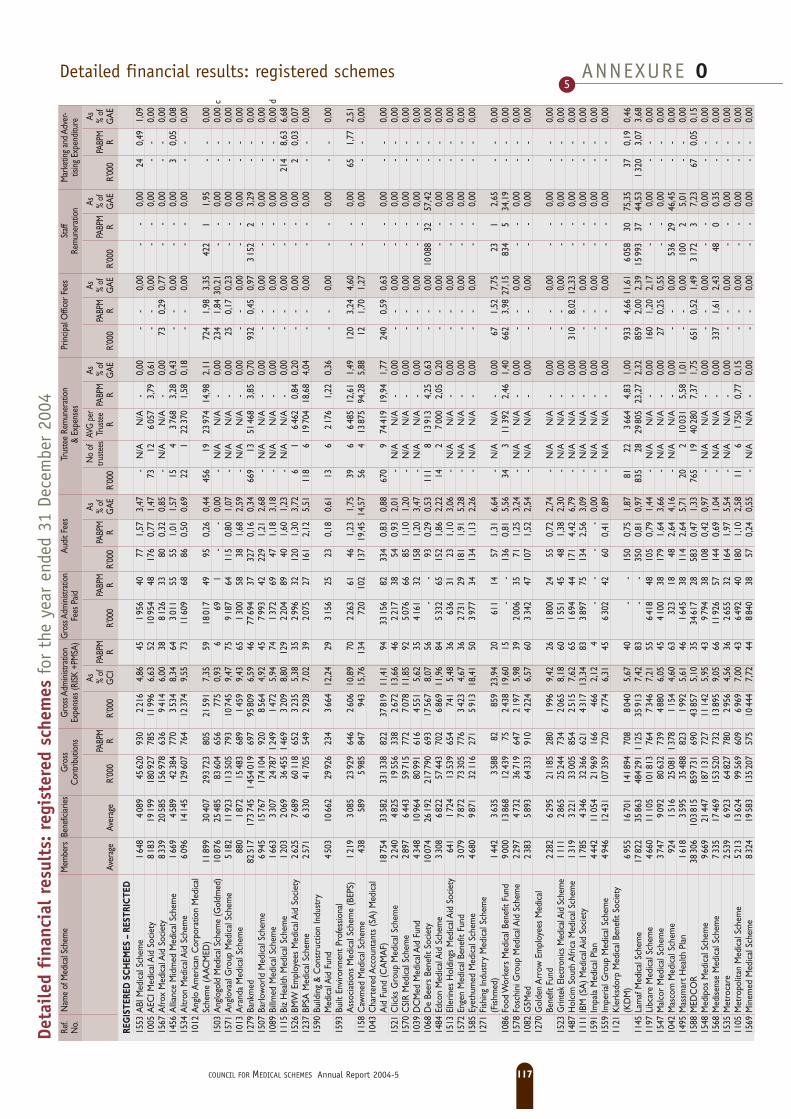
Ref.
Nam
e of
Med
ical S
chem
eM
embe
rsBe
nefic
iaries
Gro
ss
Gro
ss A
dmin
istra
tion
Gros
s Adm
inistr
atio
nAu
dit F
ees
Trus
tee
Rem
uner
atio
nPr
incip
al O
fficer
Fee
sSt
affM
arke
ting
and
Adve
r- N
o.C
ontr
ibut
ions
Expe
nses
(RISK
+PM
SA)
Fees
Paid
& Ex
pens
esRe
mun
erat
ion
tisin
g Ex
pend
iture
AsAs
No
ofAV
G pe
rAs
As
AsAs
PA
BPM
% of
PABP
MPA
BPM
PABP
M%
oftru
stees
Trus
tee
PABP
M%
ofPA
BPM
% of
PABP
M%
ofPA
BPM
% of
Aver
age
Aver
age
R'00
0R
R'00
0G
CI
RR'
000
RR'
000
RG
AER'
000
RR
GAE
R'00
0R
GAE
R'00
0R
GAE
R'00
0R
GAE
REG
ISTE
RED
SC
HEM
ES –
RES
TRIC
TED
1553
ABI
Med
ical
Sch
eme
164
84
089
4562
093
02
216
4,86
451
956
4077
1,57
3,47
-N
/AN
/A-
0,00
--
0,00
--
0,00
240,
491,
0910
05A
ECI M
edic
al A
id S
ocie
ty8
183
1919
918
092
778
511
996
6,63
5210
954
4817
60,
771,
4773
126
057
3,79
0,61
--
0,00
--
0,00
--
0,00
1567
Afro
x M
edic
al A
id S
ocie
ty8
339
2058
515
697
863
69
414
6,00
388
126
3380
0,32
0,85
-N
/AN
/A-
0,00
730,
290,
77-
-0,
00-
-0,
0014
56A
llian
ce M
idm
ed M
edic
al S
chem
e1
669
458
942
384
770
353
48,
3464
301
155
551,
011,
5715
43
768
3,28
0,43
--
0,00
--
0,00
30,
050,
0815
34A
ltron
Med
ical
Aid
Sch
eme
609
614
145
129
607
764
1237
49,
5573
1160
968
860,
500,
6922
122
370
1,58
0,18
--
0,00
--
0,00
--
0,00
1012
Ang
lo A
mer
ican
Cor
pora
tion
Med
ical
Sc
hem
e (A
ACM
ED)
1189
930
407
293
723
805
2159
17,
3559
1801
749
950,
260,
4445
619
2397
414
,98
2,11
724
1,98
3,35
422
11,
95-
-0,
0015
03A
nglo
gold
Med
ical S
chem
e (G
oldm
ed)
1087
625
485
8360
465
677
50,
936
691
--
0,00
-N
/AN
/A-
0,00
234
1,84
30,2
1-
-0,
00-
-0,
00c
1571
Ang
lova
al G
roup
Med
ical
Sch
eme
518
211
923
113
505
793
1074
59,
4775
918
764
115
0,80
1,07
-N
/AN
/A-
0,00
250,
170,
23-
-0,
00-
-0,
0010
13A
rand
a M
edic
al S
chem
e88
01
872
1548
368
91
459
9,43
651
300
5838
1,68
2,59
-N
/AN
/A-
0,00
--
0,00
--
0,00
--
0,00
1279
Bank
med
8251
717
374
51
454
019
697
9580
96,
5946
7769
437
327
0,16
0,34
669
1351
468
3,85
0,70
932
0,45
0,97
315
22
3,29
--
0,00
1507
Barlo
wor
ld M
edic
al S
chem
e6
945
1576
717
410
492
08
564
4,92
457
993
4222
91,
212,
68-
N/A
N/A
-0,
00-
-0,
00-
-0,
00-
-0,
0010
89Bi
llmed
Med
ical
Sch
eme
166
33
307
2478
71
249
147
25,
9474
137
269
471,
183,
18-
N/A
N/A
-0,
00-
-0,
00-
-0,
00-
-0,
00d
1115
Biz
Hea
lth M
edic
al S
chem
e1
203
206
936
455
146
93
209
8,80
129
220
489
401,
601,
23-
N/A
N/A
-0,
00-
-0,
00-
-0,
0021
48,
636,
6815
26BM
W E
mpl
oyee
s M
edic
al A
id S
ocie
ty2
625
768
960
118
652
323
55,
3835
299
632
120
1,30
3,72
61
646
20,
840,
20-
-0,
00-
-0,
002
0,03
0,07
1237
BPSA
Med
ical
Sch
eme
257
16
330
4170
554
92
928
7,02
392
075
2716
12,
125,
5111
86
1970
418
,68
4,04
--
0,00
--
0,00
--
0,00
1590
Build
ing
& C
onst
ruct
ion
Indu
stry
M
edic
al A
id F
und
450
310
662
2992
623
43
664
12,2
429
315
625
230,
180,
6113
62
176
1,22
0,36
--
0,00
--
0,00
--
0,00
1593
Built
Env
ironm
ent P
rofe
ssio
nal
Ass
ocia
tions
Med
ical
Sch
eme
(BEP
S)1
219
308
523
929
646
260
610
,89
702
263
6146
1,23
1,75
396
648
512
,61
1,49
120
3,24
4,60
--
0,00
651,
772,
5111
58C
awm
ed M
edic
al S
chem
e43
858
95
985
847
943
15,7
613
472
010
213
719
,45
14,5
756
413
875
94,2
85,
8812
1,70
1,27
--
0,00
--
0,00
1043
Cha
rter
ed A
ccou
ntan
ts (S
A) M
edic
al
Aid
Fun
d (C
AM
AF)
1875
433
582
331
338
822
3781
911
,41
9433
156
8233
40,
830,
8867
09
7441
919
,94
1,77
240
0,59
0,63
--
0,00
--
0,00
1521
Clic
ks G
roup
Med
ical
Sch
eme
224
04
825
1955
633
82
672
13,6
646
221
738
540,
932,
01-
N/A
N/A
-0,
00-
-0,
00-
-0,
00-
-0,
0015
70C
SIR
Med
ical
Sch
eme
289
76
443
5971
577
27
078
11,8
592
507
666
851,
101,
20-
N/A
N/A
-0,
00-
-0,
00-
-0,
00-
-0,
0010
39D
CM
ed M
edic
al A
id F
und
434
810
964
8099
161
64
551
5,62
354
161
3215
81,
203,
47-
N/A
N/A
-0,
00-
-0,
00-
-0,
00-
-0,
0010
68D
e Be
ers
Bene
fit S
ocie
ty10
074
2619
221
779
069
317
567
8,07
56-
-93
0,29
0,53
111
813
913
4,25
0,63
--
0,00
1008
832
57,4
2-
-0,
0014
84Ed
con
Med
ical
Aid
Sch
eme
330
86
822
5744
370
26
869
11,9
684
533
265
152
1,86
2,22
142
700
02,
050,
20-
-0,
00-
-0,
00-
-0,
0015
13El
lerin
es H
oldi
ngs
Med
ical
Aid
Soc
iety
641
172
413
539
654
741
5,48
3663
631
231,
103,
06-
N/A
N/A
-0,
00-
-0,
00-
-0,
00-
-0,
0015
72En
gen
Med
ical
Ben
efit
Fund
307
97
872
7330
577
63
423
4,67
362
731
2918
11,
915,
28-
N/A
N/A
-0,
00-
-0,
00-
-0,
00-
-0,
0015
85Ey
ethu
med
Med
ical
Sch
eme
468
09
871
3211
627
15
913
18,4
150
397
734
134
1,13
2,26
-N
/AN
/A-
0,00
--
0,00
--
0,00
--
0,00
1271
Fish
ing
Indu
stry
Med
ical
Sch
eme
(Fish
med
)1
442
363
53
588
8285
923
,94
2061
114
571,
316,
64-
N/A
N/A
-0,
0067
1,52
7,75
231
2,65
--
0,00
1086
Food
Wor
kers
Med
ical
Ben
efit
Fund
900
013
868
1243
975
243
819
,60
15-
-13
60,
815,
5634
311
392
2,46
1,40
662
3,98
27,1
583
45
34,1
9-
-0,
0015
78Fo
schi
ni G
roup
Med
ical
Aid
Sch
eme
229
74
732
3671
964
72
197
5,98
392
006
3571
1,25
3,24
-N
/AN
/A-
0,00
--
0,00
--
0,00
--
0,00
1082
G5M
ed2
383
589
364
333
910
422
46,
5760
334
247
107
1,52
2,54
-N
/AN
/A-
0,00
--
0,00
--
0,00
--
0,00
1270
Gol
den
Arr
ow E
mpl
oyee
s M
edic
al
Bene
fit F
und
228
26
295
2118
528
01
996
9,42
261
800
2455
0,72
2,74
-N
/AN
/A-
0,00
--
0,00
--
0,00
--
0,00
1523
Grin
tek
Elec
tron
ics M
edica
l Aid
Sch
eme
111
12
865
2524
473
42
065
8,18
601
551
4548
1,38
2,30
-N
/AN
/A-
0,00
--
0,00
--
0,00
--
0,00
1487
Hol
cim
Sou
th A
fric
a M
edic
al S
chem
e1
319
322
133
005
854
251
57,
6265
169
444
171
4,42
6,79
-N
/AN
/A-
0,00
310
8,02
12,3
3-
-0,
00-
-0,
0011
11IB
M (S
A) M
edic
al A
id S
ocie
ty1
785
434
632
366
621
431
713
,34
833
897
7513
42,
563,
09-
N/A
N/A
-0,
00-
-0,
00-
-0,
00-
-0,
0015
91Im
pala
Med
ical
Pla
n4
442
1105
421
969
166
466
2,12
4-
--
-0,
00-
N/A
N/A
-0,
00-
-0,
00-
-0,
00-
-0,
0015
59Im
peria
l Gro
up M
edic
al S
chem
e4
946
1243
110
735
972
06
774
6,31
456
302
4260
0,41
0,89
-N
/AN
/A-
0,00
--
0,00
--
0,00
--
0,00
1121
Kle
rksd
orp
Med
ical
Ben
efit
Soci
ety
(KD
M)
695
516
701
141
894
708
804
05,
6740
--
150
0,75
1,87
8122
366
44,
831,
0093
34,
6611
,61
605
830
75,3
537
0,19
0,46
1145
Lam
af M
edic
al S
chem
e17
822
3586
348
429
11
125
3591
37,
4283
--
350
0,81
0,97
835
2829
805
23,2
72,
3285
92,
002,
3915
993
3744
,53
132
03,
073,
6811
97Li
bcar
e M
edic
al S
chem
e4
660
1110
510
181
376
47
346
7,21
556
418
4810
50,
791,
44-
N/A
N/A
-0,
0016
01,
202,
17-
-0,
00-
-0,
0015
47M
alco
r M
edic
al S
chem
e3
747
909
280
632
739
488
06,
0545
410
038
179
1,64
3,66
-N
/AN
/A-
0,00
270,
250,
55-
-0,
00-
-0,
0010
42M
asco
m M
edic
al S
chem
e92
41
516
2508
11
378
115
44,
6063
323
1848
2,64
4,16
-N
/AN
/A-
0,00
--
0,00
536
2946
,45
--
0,00
1495
Mas
smar
t Hea
lth P
lan
161
83
595
3548
882
31
992
5,61
461
645
3811
42,
645,
7120
210
031
5,58
1,01
--
0,00
100
25,
01-
-0,
0015
88M
EDC
OR
3830
610
381
585
973
169
043
857
5,10
3534
617
2858
30,
471,
3376
519
4028
07,
371,
7565
10,
521,
493
172
37,
2367
0,05
0,15
1548
Med
ipos
Med
ical
Sch
eme
966
921
447
187
131
727
1114
25,
9543
979
438
108
0,42
0,97
-N
/AN
/A-
0,00
--
0,00
--
0,00
--
0,00
1568
Med
isens
e M
edic
al S
chem
e7
335
1746
915
352
073
213
895
9,05
6611
926
5714
40,
691,
04-
N/A
N/A
-0,
0033
71,
612,
4348
00,
35-
-0,
0015
35M
etro
care
253
96
923
6482
778
02
956
4,56
362
655
3216
41,
975,
54-
N/A
N/A
-0,
00-
-0,
00-
-0,
00-
-0,
0011
05M
etro
polit
an M
edic
al S
chem
e5
213
1362
499
569
609
696
97,
0043
649
240
180
1,10
2,58
116
175
00,
770,
15-
-0,
00-
-0,
00-
-0,
0015
69M
inem
ed M
edic
al S
chem
e8
324
1958
313
520
757
510
444
7,72
448
840
3857
0,24
0,55
-N
/AN
/A-
0,00
--
0,00
--
0,00
--
0,00
COUNCIL FOR MEDICAL SCHEMES Annual Report 2004-5 117
ANNEXURE O5
Deta
iled
fina
ncia
l re
sult
s: r
egis
tere
d sc
hem
esfo
r th
e ye
ar e
nded
31
Dece
mbe
r 20
04Detailed financial results: registered schemes

Ref.
Nam
e of
Med
ical S
chem
eM
embe
rsBe
nefic
iaries
Gro
ss
Gro
ss A
dmin
istra
tion
Gros
s Adm
inistr
atio
nAu
dit F
ees
Trus
tee
Rem
uner
atio
nPr
incip
al O
fficer
Fee
sSt
affM
arke
ting
and
Adve
r- N
o.C
ontr
ibut
ions
Expe
nses
(RISK
+PM
SA)
Fees
Paid
& Ex
pens
esRe
mun
erat
ion
tisin
g Ex
pend
iture
AsAs
No
ofAV
G pe
rAs
As
AsAs
PA
BPM
% of
PABP
MPA
BPM
PABP
M%
oftru
stees
Trus
tee
PABP
M%
ofPA
BPM
% of
PABP
M%
ofPA
BPM
% of
Aver
age
Aver
age
R'00
0R
R'00
0G
CI
RR'
000
RR'
000
RG
AER'
000
RR
GAE
R'00
0R
GAE
R'00
0R
GAE
R'00
0R
GAE
1566
Mor
emed
Med
ical
Sch
eme
265
36
042
1408
519
43
547
25,1
849
272
138
470,
651,
33-
N/A
N/A
-0,
0016
62,
284,
67-
-0,
00-
-0,
0012
08M
utua
l & F
eder
al M
edic
al A
id F
und
316
96
406
5594
372
84
852
8,67
634
362
5711
11,
442,
29-
N/A
N/A
-0,
00-
-0,
00-
-0,
00-
-0,
0011
54N
ampa
k G
roup
Med
ical
Aid
563
515
282
131
093
715
967
27,
3853
791
343
109
0,59
1,13
-N
/AN
/A-
0,00
--
0,00
--
0,00
--
0,00
1241
Nas
pers
Med
ical
Fun
d5
473
1190
610
760
375
36
806
6,33
482
381
1715
11,
062,
21-
N/A
N/A
-0,
00-
-0,
001
333
919
,59
--
0,00
1469
Ned
cor
Med
ical
Aid
Sch
eme
1877
742
731
291
849
569
960
13,
2919
2445
548
131
0,26
1,36
-N
/AN
/A-
0,00
--
0,00
--
0,00
--
0,00
1584
Net
care
Med
ical
Sch
eme
1027
723
737
204
526
718
1633
47,
9957
1583
156
108
0,38
0,66
-N
/AN
/A-
0,00
--
0,00
--
0,00
--
0,00
1214
Old
Mut
ual S
taff
Med
ical
Aid
Sch
eme
1347
731
047
188
968
507
1629
08,
6244
1497
240
121
0,33
0,74
661
6571
32,
120,
40-
-0,
00-
-0,
00-
-0,
0014
41Pa
rmed
Med
ical
Aid
Sch
eme
209
25
724
8649
51
259
346
74,
0150
283
541
--
0,00
628
770
710
,77
1,78
264
3,84
7,61
--
0,00
103
1,49
2,96
1515
PG B
ison
Med
ical
Aid
Soc
iety
705
169
017
095
843
134
57,
8766
115
757
613,
034,
56-
N/A
N/A
-0,
00-
-0,
00-
-0,
00-
-0,
0011
86PG
Gro
up M
edic
al S
chem
e1
072
236
032
129
113
52
149
6,69
761
889
6790
3,18
4,19
-N
/AN
/A-
0,00
291,
011,
33-
-0,
0011
0,39
0,52
1563
Pick
& P
ay M
edic
al S
chem
e5
549
1241
094
658
636
722
37,
6349
564
238
104
0,70
1,44
-N
/AN
/A-
0,00
--
0,00
--
0,00
--
0,00
1583
Plat
inum
Hea
lth17
094
3532
015
164
935
83
006
1,98
7-
-33
50,
7911
,14
-N
/AN
/A-
0,00
--
0,00
201
65
67,0
4-
-0,
0011
94Pr
ofm
ed26
878
7032
249
548
258
753
739
10,8
564
4629
855
--
0,00
998
1190
719
14,1
91,
8669
80,
831,
3085
21
1,59
625
0,74
1,16
1516
Qua
ntum
Med
ical
Aid
Soc
iety
780
816
699
123
538
617
1440
911
,66
7212
618
6320
11,
001,
3912
52
428
0,73
0,08
--
0,00
--
0,00
--
0,00
1201
Rand
Wat
er M
edic
al S
chem
e2
821
659
864
089
809
-0,
00-
--
133
1,68
N/A
-N
/AN
/A-
N/A
--
N/A
157
920
N/A
--
N/A
1430
Rem
edi M
edic
al A
id S
chem
e11
612
2788
525
503
876
214
667
5,75
4413
020
3923
30,
701,
59-
N/A
N/A
-0,
0030
60,
922,
09-
-0,
00-
-0,
0011
76Re
tail
Med
ical
Sch
eme
401
88
631
7682
174
27
521
9,79
736
766
6511
91,
151,
59-
N/A
N/A
-0,
00-
-0,
00-
-0,
00-
-0,
0012
09SA
Bre
wer
ies
Med
ical
Aid
Soc
iety
524
813
444
101
553
629
914
59,
0157
884
955
160
0,99
1,75
11
796
0,06
0,01
--
0,00
--
0,00
--
0,00
1424
SABC
Med
ical
Aid
Sch
eme
378
78
920
8474
979
23
156
3,72
292
855
2793
0,87
2,93
-N
/AN
/A-
0,00
--
0,00
--
0,00
--
0,00
1557
Sam
anco
r H
ealth
Pla
n4
965
1214
482
561
567
768
49,
3153
708
349
530,
360,
69-
N/A
N/A
-0,
00-
-0,
00-
-0,
00-
-0,
0010
38SA
MW
UM
ed16
663
4822
114
937
725
815
235
10,2
026
403
128
50,
491,
8755
818
3102
011
,58
3,66
436
0,75
2,86
681
612
44,7
458
51,
013,
8415
27Sa
ppi M
edic
al A
id S
chem
e4
156
1040
198
346
788
542
85,
5243
467
537
750,
601,
3961
230
299
5,83
1,12
--
0,00
--
0,00
--
0,00
1234
Saso
lmed
2055
159
537
518
752
726
2568
94,
9536
2193
131
163
0,23
0,63
281
2848
80,
480,
11-
-0,
00-
-0,
00-
-0,
0015
31Se
dmed
595
166
27
782
390
109
1,40
5-
-16
0,79
14,3
6-
N/A
N/A
-0,
00-
-0,
00-
-0,
00-
-0,
0012
43Si
emen
s M
edic
al S
chem
e2
885
665
869
606
871
363
35,
2245
329
741
127
1,59
3,50
171
1722
92,
590,
47-
-0,
00-
-0,
00-
-0,
0015
80So
uth
Afr
ican
Pol
ice
Serv
ice
Med
ical
Sc
hem
e (P
OLM
ED)
128
218
368
215
262
990
659
516
300
56,
2037
142
266
321
492
0,34
0,92
472
767
371
1,28
0,29
942
0,21
0,58
350
41
2,15
--
0,00
1254
Stoc
ksm
ed66
91
542
1498
781
093
36,
2250
817
4463
3,38
6,71
-N
/AN
/A-
0,00
--
0,00
--
0,00
--
0,00
1544
Tige
r Br
ands
Med
ical
Sch
eme
583
514
050
129
317
767
613
94,
7536
569
334
123
0,73
2,01
-N
/AN
/A-
0,00
--
0,00
--
0,00
--
0,00
1582
Tran
smed
Med
ical
Fun
d81
866
174
480
117
698
556
296
998
8,24
4680
354
381
128
0,54
1,16
843
1652
676
4,83
0,87
738
0,35
0,76
764
00,
792
308
1,10
2,38
1579
Tsog
o Su
n G
roup
Med
ical
Sch
eme
214
74
615
3669
066
35
009
13,6
590
457
983
139
2,51
2,78
-N
/AN
/A-
0,00
--
0,00
--
0,00
--
0,00
1434
Um
ed9
616
2493
922
362
474
712
592
5,63
42-
-18
90,
631,
5011
25
287
0,42
0,08
637
2,13
5,06
570
519
45,3
114
20,
471,
1315
97U
mvu
zo H
ealth
Med
ical
Sch
eme
178
04
903
896
630
51
296
14,4
544
--
--
0,00
-N
/AN
/A-
0,00
682,
305,
2312
74
9,81
394
13,3
930
,41
1520
Uni
vers
ity o
f Nat
al M
edic
al S
chem
e3
191
703
655
480
657
659
011
,88
785
541
6667
0,80
1,02
596
976
08,
320,
8932
03,
794,
8575
11,
14-
-0,
0012
82U
nive
rsity
of t
he W
itwat
ersr
and
Staf
fM
edic
al A
id S
chem
e3
004
675
059
407
733
356
96,
0144
312
139
106
1,31
2,97
142
680
02,
010,
38-
-0,
00-
-0,
00-
-0,
0015
65Ve
nda
Polic
e an
d Pr
isons
Med
ical
Sc
hem
e (P
olpr
ismed
)2
326
602
624
328
336
487
620
,04
674
130
5757
0,79
1,17
151
818
850
25,0
23,
0917
42,
413,
58-
-0,
00-
-0,
0012
91W
itban
kC
oalfie
ldsM
edica
lAid
Sche
me
566
115
003
133
531
742
629
04,
7135
--
258
1,43
4,10
-N
/AN
/A-
0,00
524
2,91
8,33
340
219
54,1
0-
-0,
0012
93W
ooltr
u H
ealth
care
Fun
d8
278
1824
511
374
052
011
755
10,3
354
1024
847
209
0,96
1,78
101
1000
00,
550,
09-
-0,
00-
-0,
00-
-0,
0012
53X
stra
ta M
edic
al A
id S
chem
e3
905
1135
966
402
487
431
06,
4932
400
629
110,
080,
25-
N/A
N/A
-0,
00-
-0,
00-
-0,
00-
-0,
00
SUB
-TO
TAL
–Re
gist
ered
Res
tric
ted
Sche
mes
801
044
193
583
914
7031
9263
310
2767
56,
9944
802
718
3512
951
0,56
1,26
736
826
128
230
0,32
0,72
1166
60,
501,
1466
599
36,
485
901
0,25
0,57
TOTA
L R
EGIS
TER
ED S
CH
EMES
270
173
66
653
275
5153
1439
645
5000
174
9,70
633
671
689
4629
005
0,36
0,58
3401
868
849
444
0,43
0,68
3516
40,
440,
7047
654
76
9,53
164
986
2,07
3,30
Note
s:a
Dra
ft A
nn
ual
Fin
anci
al S
tate
men
ts w
ere
sub
mit
ted
bM
yhea
lth
am
alga
mat
ed w
ith
Oxy
gen
wit
h e
ffec
t fr
om
1 J
uly
200
4c
An
glo
gold
am
alga
mat
ed w
ith
Dis
cove
ry H
ealt
h w
ith
eff
ect
fro
m 1
Ju
ne
2004
dB
illm
ed a
mal
gam
ated
wit
h S
aman
cor
Hea
lth
Pla
n w
ith
eff
ect
fro
m 1
Ju
ly 2
004
•P
MSA
= P
erso
nal
Med
ical
Sav
ings
Acc
ou
nt
•G
CI
= G
ross
Co
ntr
ibu
tio
n I
nco
me
•PA
BP
M =
Per
Ave
rage
Ben
efic
iary
Per
Mo
nth
•G
AE
= G
ross
Ad
min
istr
atio
n E
xpen
ses
•Tr
ust
ee R
emu
ner
atio
n a
nd
Exp
ense
s: N
o. o
f tr
ust
ees
and
th
e av
erag
e p
er t
rust
ee o
nly
app
lies
to
th
ose
th
at h
ave
rece
ived
an
y p
aym
ents
an
d c
on
sid
erat
ion
fro
m t
he
Sch
eme
118 COUNCIL FOR MEDICAL SCHEMES Annual Report 2004-5
ANNEXURE O5
Deta
iled
fina
ncia
l re
sult
s: r
egis
tere
d sc
hem
esfo
r th
e ye
ar e
nded
31
Dece
mbe
r 20
04Detailed financial results: registered schemes

Ref.
Nam
e of
Med
ical S
chem
esG
ross
Con
trib
utio
nsG
ross
Clai
ms I
ncur
red
Gro
ss C
laim
s Inc
urre
d:G
ross
Non
-Hea
lth
Gro
ss N
on-H
ealth
Exp
endi
ture
:Su
rplu
s/(D
efici
t) Su
rplus
/(Defi
cit) f
rom
Ope
ratio
ns:
No.
Gro
ss C
ontr
ibut
ions
Expe
nditu
reG
ross
Con
trib
utio
nsfro
m O
pera
tions
Gro
ss C
ontr
ibut
ions
2004
2003
%20
0420
03%
2004
2003
%20
0420
03%
2004
2003
%20
0420
03%
2004
2003
%PA
BPM
PABP
MG
row
thPA
BPM
PABP
MG
row
th%
%G
row
thPA
BPM
PABP
MG
row
th%
%G
row
thPA
BPM
PABP
MG
row
th%
%G
row
thR
RR
RR
RR
RRE
GIS
TERE
D S
CH
EMES
– O
PEN
1496
AllC
are
Med
ical
Aid
Sch
eme
N/A
779
N/A
N/A
694
N/A
N/A
89,1
2N
/AN
/A76
N/A
N/A
9,69
N/A
N/A
7N
/AN
/A0,
88N
/A15
89Ba
ymed
376
N/A
N/A
361
N/A
N/A
96,0
4N
/AN
/A56
N/A
N/A
14,9
6N
/AN
/A-4
1N
/AN
/A-1
1,00
N/A
N/A
1252
Best
med
Med
ical
Sch
eme
677
642
5,38
498
493
1,04
73,5
976
,75
-4,1
289
7420
,79
13,2
211
,54
14,6
278
6031
,08
11,6
09,
3324
,38
1512
Boni
tas
Med
ical
Aid
Fun
d57
356
31,
8444
447
1-5
,79
77,4
083
,68
-7,5
075
5731
,51
13,0
110
,07
29,1
449
3539
,16
8,58
6,28
36,6
510
34C
ape
Med
ical
Pla
n50
949
13,
7552
958
8-1
0,02
103,
9211
9,83
-13,
2712
515
5-1
9,39
24,5
431
,59
-22,
30-1
57-2
75-4
2,95
-30,
83-5
6,07
-45,
0210
48C
omm
erci
al a
nd In
dust
rial
Med
ical
Aid
Soc
iety
(C
IMA
S)89
497
6-8
,33
812
817
-0,6
290
,82
83,7
88,
4012
011
91,
3813
,43
12,1
510
,59
-35
38-1
90,5
6-3
,87
3,92
-198
,78
1552
Com
mun
ity M
edic
al A
id S
chem
e (C
OM
MED
)57
252
58,
9045
342
66,
3079
,18
81,1
1-2
,38
116
8241
,35
20,2
515
,60
29,8
03
17-8
1,18
0,57
3,28
-82,
7214
91C
ompc
are
Med
ical
Sch
eme
747
653
14,4
157
951
213
,05
77,5
378
,46
-1,1
911
410
311
,12
15,2
915
,74
-2,8
842
3138
,17
5,69
4,71
20,7
711
25D
isco
very
Hea
lth M
edic
al S
chem
e71
566
67,
4752
348
38,
3873
,11
72,5
00,
8412
111
64,
8016
,95
17,3
8-2
,49
6252
19,3
58,
687,
8211
,06
1596
Eclip
se M
edic
al S
chem
e50
0N
/AN
/A41
1N
/AN
/A82
,07
N/A
N/A
65N
/AN
/A13
,07
N/A
N/A
6N
/AN
/A1,
20N
/AN
/A12
02Fe
dhea
lth68
161
111
,52
518
464
11,5
376
,03
76,0
20,
0111
110
47,
3716
,37
17,0
0-3
,73
-23
-146
,96
-0,2
30,
54-1
42,1
115
01Fr
ee S
tate
Med
ical
Aid
Sch
eme
483
418
15,6
245
845
21,
5394
,83
107,
99-1
2,19
5842
37,2
411
,90
10,0
218
,70
-22
-59
-61,
83-4
,63
-14,
03-6
6,99
1554
Gen
esis
Med
ical
Sch
eme
382
376
1,44
299
264
13,3
978
,39
70,1
311
,78
6966
4,78
18,0
717
,50
3,29
1150
-78,
692,
8113
,37
-79,
0015
61G
en-H
ealth
Med
ical
Sch
eme
457
355
28,7
329
922
731
,81
65,3
163
,78
2,39
151
103
47,6
733
,10
28,8
514
,71
-10
18-1
53,1
9-2
,09
5,05
-141
,32
1162
Glo
bal H
ealth
639
624
2,46
584
556
5,04
91,3
089
,06
2,52
7868
13,9
612
,20
10,9
711
,22
-35
-15
138,
39-5
,48
-2,3
513
2,67
1466
Goo
d H
ope
Med
ical
Aid
Soc
iety
211
192
9,90
188
166
13,3
589
,41
86,6
93,
1430
2331
,74
14,1
311
,79
19,8
7-7
3-3
54,0
9-3
,53
1,53
-331
,20
1537
Hos
med
Med
ical
Aid
Sch
eme
379
369
2,77
317
286
10,8
083
,56
77,5
17,
8066
5618
,04
17,4
715
,21
14,8
5-4
27-1
14,4
8-1
,03
7,28
-114
,09
a15
77In
gwe
Hea
lth P
lan
368
335
9,68
276
211
30,8
275
,11
62,9
719
,28
107
8132
,87
29,1
724
,08
21,1
4-1
942
-144
,78
-5,1
212
,54
-140
,82
1556
Kw
aZul
u-N
atal
Med
ical
Aid
Sch
eme
360
304
18,6
428
723
322
,92
79,6
576
,88
3,60
107
150
-28,
6329
,79
49,5
3-3
9,85
-34
-80
-57,
58-9
,44
-26,
41-6
4,24
1576
Libe
rty
Med
ical
Sch
eme
667
561
18,9
850
845
811
,04
76,1
981
,64
-6,6
798
8319
,26
14,7
614
,72
0,24
6315
333,
439,
482,
6026
4,28
1536
Life
med
Med
ical
Sch
eme
847
744
13,9
669
960
615
,44
82,5
281
,47
1,30
125
109
14,6
514
,80
14,7
10,
6123
29-2
3,25
2,66
3,95
-32,
6511
42M
edic
al E
xpen
ses
Dis
trib
utio
n So
ciet
y (M
EDS)
767
672
14,0
764
452
223
,24
83,9
277
,68
8,04
107
979,
9313
,98
14,5
0-3
,63
1449
-71,
091,
867,
34-7
4,65
1549
Med
icov
er 2
000
506
479
5,58
360
320
12,5
471
,11
66,7
16,
5963
5025
,77
12,5
010
,49
19,1
237
62-4
0,41
7,26
12,8
6-4
3,56
1149
Med
ihel
p1
108
103
57,
0896
590
86,
2687
,08
87,7
5-0
,76
105
969,
299,
479,
282,
0615
151,
091,
381,
46-5
,59
1506
Med
imed
Med
ical
Sch
eme
466
423
9,95
350
319
9,64
75,1
975
,40
-0,2
744
408,
319,
399,
54-1
,49
6564
1,43
13,9
915
,17
-7,7
511
40M
edsh
ield
Med
ical
Sch
eme
521
489
6,55
333
299
11,5
163
,86
61,0
24,
6612
912
52,
8624
,72
25,6
1-3
,46
6753
26,6
212
,90
10,8
518
,84
1021
Mer
idia
n H
ealth
862
825
4,44
714
584
22,1
082
,80
70,8
216
,91
106
100
5,90
12,3
412
,17
1,40
4410
9-6
0,05
5,07
13,2
5-6
1,75
1087
Mun
imed
721
666
8,24
624
566
10,2
786
,48
84,8
91,
8710
411
0-5
,54
14,4
616
,57
-12,
73-1
7-2
4-2
9,17
-2,3
5-3
,59
-34,
5611
48M
yhea
lth M
edic
al S
chem
e71
056
126
,47
576
509
13,1
781
,18
90,7
3-1
0,52
122
107
13,9
517
,15
19,0
4-9
,90
28-5
814
8,00
3,94
-10,
3713
7,95
1166
Nat
iona
l Ind
epen
dent
Med
ical
Aid
Soc
iety
(N
IMA
S)60
555
78,
5953
049
08,
1387
,61
87,9
8-0
,43
5040
24,3
38,
317,
2614
,50
1519
-17,
442,
563,
37-2
3,97
1167
Nat
iona
l Med
ical
Pla
n (N
MP)
745
669
11,3
360
955
59,
7381
,73
82,9
2-1
,44
103
949,
6413
,79
14,0
0-1
,52
-6-2
1-7
3,50
-0,7
4-3
,12
-76,
1911
70N
BC M
edic
al S
chem
e94
588
17,
3174
968
19,
9479
,21
77,3
22,
4513
011
710
,74
13,7
413
,31
3,20
4072
-44,
964,
228,
23-4
8,71
1139
Om
nihe
alth
685
606
13,0
861
148
027
,24
89,2
079
,28
12,5
210
519
5-4
6,14
15,3
432
,22
-52,
37-4
8-8
4-4
3,17
-7,0
0-1
3,93
-49,
7515
60O
penp
lan
Med
ical
Sch
eme
681
614
10,9
759
149
818
,65
86,7
581
,13
6,92
9990
10,6
714
,54
14,5
8-0
,27
-14
28-1
48,7
5-1
,98
4,51
-143
,93
1215
Oxy
gen
476
434
9,67
399
332
20,1
983
,89
76,5
59,
5985
788,
4917
,77
17,9
6-1
,07
-18
20-1
91,8
8-3
,81
4,54
-183
,78
1587
Path
finde
r M
edic
al S
chem
e40
828
145
,16
235
238
-1,2
057
,54
84,5
4-3
1,94
142
141
0,88
34,7
850
,04
-30,
501
-104
100,
860,
22-3
6,98
100,
6015
46Ph
aros
Med
ical
Pla
n62
454
913
,62
500
442
12,9
980
,12
80,5
7-0
,55
119
9426
,44
19,0
517
,12
11,2
94
12-6
4,81
0,68
2,20
-69,
0312
42Pr
etor
ia M
unic
pal M
edic
al A
id (
PRET
MED
)N
/A53
9N
/AN
/A47
6N
/AN
/A88
,37
N/A
N/A
64N
/AN
/A11
,82
N/A
N/A
-20
N/A
N/A
-3,7
3N
/A
1454
Pro
Sano
Med
ical
Sch
eme
610
556
9,69
538
475
13,3
888
,23
85,3
53,
3768
70-2
,88
11,1
912
,64
-11,
46-3
2-1
413
8,04
-5,3
1-2
,45
117,
0211
96Pr
otea
Med
ical
Aid
Soc
iety
994
906
9,69
959
828
15,8
496
,53
91,4
05,
6112
713
1-3
,72
12,7
414
,52
-12,
22-1
06-6
561
,98
-10,
67-7
,22
47,6
612
85Pr
otec
tor
Hea
lth55
653
63,
8051
047
57,
3791
,73
88,6
83,
4468
78-1
2,47
12,3
114
,60
-15,
67-2
0-2
6-2
1,41
-3,6
8-4
,86
-24,
2915
95Pu
lz M
edic
al S
chem
e56
551
59,
8433
014
113
3,24
58,3
227
,46
112,
3413
619
7-3
0,81
24,0
738
,21
-37,
0166
142
-53,
5711
,69
0,00
100,
0015
75R
esol
utio
n H
ealth
Med
ical
Sch
eme
478
437
9,32
258
258
-0,1
154
,03
59,1
3-8
,63
154
125
23,3
732
,16
28,5
012
,85
4442
4,47
9,18
9,61
-4,4
414
46Se
lfmed
Med
ical
Sch
eme
648
599
8,19
537
477
12,4
082
,78
79,6
73,
8990
855,
7713
,84
14,1
6-2
,23
1530
-50,
022,
335,
05-5
3,80
1486
Sizw
e M
edic
al F
und
631
548
15,2
944
343
02,
8470
,12
78,6
1-1
0,80
9882
19,5
015
,57
15,0
33,
6590
3515
8,37
14,2
76,
3712
4,11
1141
Spec
tram
ed48
742
714
,17
336
346
-3,0
168
,85
81,0
5-1
5,05
7459
26,3
415
,27
13,8
010
,66
7115
388,
0814
,55
3,40
327,
5014
64Su
rem
ed H
ealth
592
482
23,0
441
332
228
,25
69,6
966
,85
4,24
140
158
-11,
2823
,60
32,7
3-2
7,89
382
2357
,77
6,36
0,32
1897
,59
1147
Tele
med
940
848
10,8
688
878
912
,44
94,4
093
,07
1,42
6065
-7,6
56,
347,
61-1
6,69
-14
-863
,81
-1,4
8-1
,00
47,7
715
92T
hebe
med
289
244
18,3
817
918
6-3
,64
61,8
776
,01
-18,
6062
1823
4,96
21,3
77,
5518
2,97
4840
20,6
516
,76
16,4
41,
9214
22To
pmed
Med
ical
Sch
eme
757
696
8,79
622
533
16,6
482
,16
76,6
47,
2193
8115
,73
12,3
411
,60
6,37
3570
-49,
384,
6610
,01
-53,
4715
86X
-Pre
ss C
are
Med
ical
Sch
eme
395
313
26,2
130
621
641
,60
77,5
769
,14
12,1
983
6724
,98
21,0
621
,27
-0,9
7-1
26-1
05,2
7-0
,35
8,31
-104
,17
SU
B-T
OT
AL
–R
egis
tere
d O
pen
Sche
mes
651
606
7,37
502
472
6,44
77,2
477
,91
-0,8
610
193
7,97
15,4
915
,40
0,56
3628
27,8
45,
574,
6819
,06
COUNCIL FOR MEDICAL SCHEMES Annual Report 2004-5 119
ANNEXURE P5
Deta
iled
fina
ncia
l re
sult
s: r
egis
tere
d sc
hem
esfo
r th
e ye
ar e
nded
31
Dece
mbe
r 20
04Detailed financial results: registered schemes

Ref.
Nam
e of
Med
ical S
chem
esG
ross
Con
trib
utio
nsG
ross
Clai
ms I
ncur
red
Gro
ss C
laim
s Inc
urre
d:G
ross
Non
-Hea
lth
Gro
ss N
on-H
ealth
Exp
endi
ture
:Su
rplu
s/(D
efici
t) Su
rplus
/(Defi
cit) f
rom
Ope
ratio
ns:
No.
Gro
ss C
ontr
ibut
ions
Expe
nditu
reG
ross
Con
trib
utio
nsfro
m O
pera
tions
Gro
ss C
ontr
ibut
ions
2004
2003
%20
0420
03%
2004
2003
%20
0420
03%
2004
2003
%20
0420
03%
2004
2003
%PA
BPM
PABP
MG
row
thPA
BPM
PABP
MG
row
th%
%G
row
thPA
BPM
PABP
MG
row
th%
%G
row
thPA
BPM
PABP
MG
row
th%
%G
row
thR
RR
RR
RR
RRE
GIS
TERE
D S
CH
EMES
– R
ESTR
ICTE
D15
53A
BI M
edic
al S
chem
e93
084
010
,62
603
541
11,3
364
,80
64,3
90,
6468
637,
947,
327,
50-2
,43
122
146
-16,
6313
,13
17,4
2-2
4,63
1005
AEC
I Med
ical
Aid
Soc
iety
785
699
12,3
674
663
118
,26
94,9
590
,22
5,24
7266
8,45
9,17
9,50
-3,4
8-5
0-1
523
1,78
-6,3
5-2
,15
195,
2715
67A
frox
Med
ical
Aid
Soc
iety
636
575
10,5
153
552
91,
1384
,21
92,0
1-8
,48
4638
19,5
97,
226,
678,
2256
16
472,
518,
800,
155
847,
6714
56A
llian
ce M
idm
ed M
edic
al S
chem
e77
072
26,
6751
546
311
,04
66,8
464
,21
4,10
6364
-1,9
18,
208,
91-8
,04
159
164
-2,7
820
,71
22,7
2-8
,86
1534
Altr
on M
edic
al A
id S
chem
e76
463
121
,07
641
600
6,88
83,9
695
,11
-11,
7284
-110
260,
6811
,05
-0,1
3-8
492,
221
16-9
3,88
0,13
2,52
-94,
9510
12A
nglo
Am
eric
an C
orpo
ratio
n M
edic
al S
chem
e (A
AC
MED
)80
572
910
,48
673
652
3,20
83,5
689
,46
-6,5
960
574,
737,
397,
80-5
,20
55-1
067
1,20
6,88
-1,3
361
7,02
1503
Ang
logo
ld M
edic
al S
chem
e (G
oldm
ed)
656
589
11,3
278
774
85,
2711
9,95
126,
84-5
,44
64
76,4
30,
950,
6058
,49
-137
-162
-15,
23-2
0,89
-27,
44-2
3,85
1571
Ang
lova
al G
roup
Med
ical
Sch
eme
793
727
9,15
648
637
1,68
81,6
487
,64
-6,8
576
734,
199,
6110
,07
-4,5
551
41
334,
776,
420,
491
214,
4910
13A
rand
a M
edic
al S
chem
e68
961
312
,40
480
416
15,4
369
,64
67,8
22,
6967
653,
439,
7110
,55
-7,9
814
213
37,
2820
,64
21,6
3-4
,55
1279
Bank
med
697
605
15,3
162
357
97,
5789
,30
95,7
3-6
,71
7364
14,4
810
,43
10,5
0-0
,71
-23
-53
-57,
46-3
,25
-8,8
1-6
3,11
1507
Barl
owor
ld M
edic
al S
chem
e92
087
74,
9588
273
919
,47
95,9
084
,24
13,8
469
71-2
,80
7,50
8,10
-7,3
8-3
167
-146
,57
-3,4
07,
66-1
44,3
710
89Bi
llmed
Med
ical
Sch
eme
124
91
106
12,9
01
003
908
10,5
080
,30
82,0
4-2
,13
9580
18,8
07,
577,
195,
2215
211
927
,29
12,1
310
,76
12,7
411
15Bi
z H
ealth
Med
ical
Sch
eme
146
91
335
9,98
137
71
233
11,6
693
,78
92,3
71,
5316
411
147
,55
11,1
98,
3434
,16
-96
-24
304,
49-6
,51
-1,7
726
7,77
1526
BMW
Em
ploy
ees
Med
ical
Aid
Soc
iety
652
595
9,46
543
437
24,3
983
,33
73,3
313
,63
5351
3,31
8,11
8,60
-5,6
256
108
-48,
168,
5618
,07
-52,
6412
37BP
SA M
edic
al S
chem
e54
949
610
,69
635
558
13,8
011
5,62
112,
462,
8148
4020
,38
8,71
8,01
8,75
-134
-102
31,5
6-2
4,34
-20,
4718
,86
1590
Build
ing
& C
onst
ruct
ion
Indu
stry
Med
ical
Aid
Fun
d23
421
96,
6617
016
71,
6772
,79
76,3
6-4
,68
3125
21,5
213
,16
11,5
513
,93
3327
23,9
914
,06
12,0
916
,25
1593
Built
Env
iron
men
t Pr
ofes
sion
al A
ssoc
iatio
ns
Med
ical
Sch
eme
(BEP
S)64
665
6-1
,49
556
482
15,4
886
,05
73,4
017
,24
9399
-6,1
614
,44
15,1
6-4
,74
-16
34-1
45,8
8-2
,41
5,17
-146
,57
1158
Caw
med
Med
ical
Sch
eme
847
761
11,3
61
759
155
013
,50
207,
6020
3,68
1,93
134
171
-22,
0215
,76
22,5
1-2
9,97
-104
5-9
608,
87-1
23,3
6-1
26,1
8-2
,24
1043
Cha
rter
ed A
ccou
ntan
ts (
SA)
Med
ical
Aid
Fun
d (C
AM
AF)
822
757
8,58
671
611
9,77
81,5
580
,66
1,10
107
101
5,08
12,9
613
,39
-3,2
227
37-2
8,83
3,23
4,92
-34,
4515
21C
licks
Gro
up M
edic
al S
chem
e33
831
18,
5631
924
729
,15
94,3
879
,33
18,9
761
4826
,70
17,9
315
,36
16,7
1-4
315
-378
,52
-12,
704,
95-3
56,5
515
70C
SIR
Med
ical
Sch
eme
772
710
8,72
629
645
-2,4
581
,43
90,7
6-1
0,27
9884
16,8
912
,67
11,7
97,
5239
-19
309,
925,
09-2
,64
293,
0710
39D
CM
ed M
edic
al A
id F
und
616
541
13,8
649
244
011
,91
79,9
681
,35
-1,7
157
58-1
,42
9,24
10,6
7-1
3,42
6743
54,1
110
,81
7,98
35,3
510
68D
e Be
ers
Bene
fit S
ocie
ty69
363
39,
5156
650
611
,94
81,7
279
,94
2,22
5943
35,1
08,
466,
8623
,37
6884
-18,
519,
8213
,20
-25,
5914
84Ed
con
Med
ical
Aid
Sch
eme
702
630
11,4
254
552
14,
5777
,68
82,7
7-6
,15
8370
18,9
111
,90
11,1
56,
7267
3972
,80
9,56
6,16
55,0
815
13El
leri
nes
Hol
ding
s M
edic
al A
id S
ocie
ty65
455
118
,67
504
504
-0,0
377
,01
91,4
2-1
5,75
4430
47,4
66,
805,
4724
,26
106
1751
7,40
16,1
93,
1142
0,28
1572
Enge
n M
edic
al B
enef
it Fu
nd77
670
510
,00
637
600
6,20
82,0
985
,03
-3,4
548
3922
,41
6,17
5,54
11,2
889
6733
,23
11,4
89,
4821
,12
1585
Eyet
hum
ed M
edic
al S
chem
e27
125
56,
3019
516
121
,63
72,1
063
,02
14,4
156
3752
,62
20,6
614
,39
43,5
719
58-6
6,63
7,09
22,5
9-6
8,60
1271
Fish
ing
Indu
stry
Med
ical
Sch
eme
(Fis
hmed
)82
768,
4444
4010
,31
53,3
952
,49
1,73
2323
2,48
28,2
029
,84
-5,4
915
1312
,93
18,4
017
,67
4,15
1086
Food
Wor
kers
Med
ical
Ben
efit
Fund
7564
16,2
438
3316
,54
51,5
151
,38
0,26
1517
-13,
3219
,60
26,2
9-2
5,43
2214
50,3
528
,89
22,3
429
,34
1578
Fosc
hini
Gro
up M
edic
al A
id S
chem
e64
758
310
,96
495
466
6,20
76,5
579
,99
-4,2
955
4423
,30
8,47
7,62
11,1
297
7234
,12
14,9
712
,39
20,8
710
82G
5Med
910
806
12,8
366
256
217
,89
72,8
269
,69
4,49
8072
11,6
78,
818,
90-1
,03
7511
4-3
4,45
8,22
14,1
5-4
1,91
1270
Gol
den
Arr
ow E
mpl
oyee
s M
edic
al B
enef
it Fu
nd28
025
510
,18
198
125
58,7
970
,75
49,0
944
,12
5512
6-5
6,19
19,6
449
,39
-60,
2427
459
6,93
9,61
1,52
532,
5315
23G
rint
ek E
lect
roni
cs M
edic
al A
id S
chem
e73
468
08,
0658
561
2-4
,49
79,6
190
,08
-11,
6168
5328
,77
9,27
7,77
19,1
772
882
4,13
9,79
1,14
755,
2211
77H
ighv
eld
Med
ical
Sch
eme
N/A
608
N/A
N/A
509
N/A
N/A
83,6
9N
/AN
/A32
N/A
N/A
5,34
N/A
N/A
29N
/AN
/A4,
73N
/A
1487
Hol
cim
Sou
th A
fric
a M
edic
al S
chem
e85
475
612
,96
795
679
17,0
593
,10
89,8
43,
6375
5827
,87
8,74
7,72
13,2
0-6
2-8
653,
45-7
,32
-1,1
056
7,01
1111
IBM
(SA
) M
edic
al A
id S
ocie
ty62
168
5-9
,45
560
564
-0,6
590
,28
82,2
99,
7184
91-8
,04
13,5
113
,30
1,55
-15
28-1
55,7
0-2
,47
4,02
-161
,51
1591
Impa
la M
edic
al P
lan
166
138
19,8
616
113
420
,18
97,2
096
,94
0,27
43
2,44
2,12
2,48
-14,
531
139
,91
0,68
0,58
16,7
315
59Im
peri
al G
roup
Med
ical
Sch
eme
720
683
5,29
563
541
4,09
78,2
179
,12
-1,1
460
4148
,11
8,36
5,95
40,6
792
93-0
,56
12,7
913
,54
-5,5
611
16Jo
med
Med
ical
Sch
eme
N/A
101
7N
/AN
/A94
9N
/AN
/A93
,32
N/A
N/A
60N
/AN
/A5,
94N
/AN
/A8
N/A
N/A
0,74
N/A
11
21K
lerk
sdor
p M
edic
al B
enef
it So
ciet
y (K
DM
)70
862
712
,96
739
609
21,4
110
4,37
97,1
17,
4843
414,
726,
036,
50-7
,29
-115
-23
410,
04-1
6,29
-3,6
135
1,53
1145
Lam
af M
edic
al S
chem
e1
125
925
21,6
393
777
920
,22
83,2
784
,24
-1,1
611
080
36,9
99,
758,
6612
,63
5039
26,8
24,
454,
274,
2711
97Li
bcar
e M
edic
al S
chem
e76
472
75,
0957
848
619
,04
75,6
966
,82
13,2
767
73-8
,33
8,81
10,1
0-1
2,76
8112
0-3
2,08
10,6
416
,46
-35,
3715
47M
alco
r M
edic
al S
chem
e73
967
89,
0576
470
48,
5910
3,43
103,
87-0
,42
2956
-47,
933,
958,
28-5
2,25
-58
-82
-29,
50-7
,85
-12,
14-3
5,35
1042
Mas
com
Med
ical
Sch
eme
137
81
155
19,3
41
281
107
918
,72
92,9
093
,39
-0,5
263
4833
,31
4,60
4,12
11,7
0-1
61
-189
3,29
-1,1
80,
08-1
602,
6314
95M
assm
art
Hea
lth P
lan
823
744
10,5
259
257
82,
4471
,99
77,6
7-7
,31
6667
-2,2
98,
019,
06-1
1,59
137
5913
1,86
16,6
27,
9210
9,78
1588
MED
CO
R69
061
711
,85
450
447
0,77
65,2
072
,37
-9,9
113
412
66,
7319
,47
20,4
1-4
,58
106
4513
7,38
15,3
37,
2211
2,23
1548
Med
ipos
Med
ical
Sch
eme
727
682
6,54
712
677
5,18
97,8
999
,16
-1,2
865
3871
,67
8,87
5,51
61,1
3-6
7-4
647
,65
-9,2
6-6
,68
38,5
815
68M
edis
ense
Med
ical
Sch
eme
732
697
5,04
517
568
-8,9
770
,57
81,4
4-1
3,34
7276
-5,2
39,
8410
,91
-9,7
812
038
218,
6816
,36
5,39
203,
3815
35M
etro
care
780
717
8,90
637
557
14,3
581
,61
77,7
25,
0050
4413
,77
6,45
6,17
4,47
9311
5-1
9,26
11,9
416
,11
-25,
8611
05M
etro
polit
an M
edic
al S
chem
e60
953
114
,61
492
482
2,14
80,8
090
,66
-10,
8853
506,
598,
669,
32-6
,99
640
4583
3,91
10,5
40,
0339
978,
4315
69M
inem
ed M
edic
al S
chem
e57
551
910
,93
429
370
15,8
974
,56
71,3
74,
4751
4122
,26
8,81
8,00
10,2
139
64-3
9,36
6,72
12,3
0-4
5,34
1566
Mor
emed
Med
ical
Sch
eme
194
239
-18,
6214
216
7-1
4,79
73,1
869
,89
4,71
5948
21,9
530
,42
20,3
049
,86
-712
-154
,97
-3,5
25,
21-1
67,5
512
08M
utua
l & F
eder
al M
edic
al A
id F
und
728
640
13,6
863
566
8-4
,86
87,2
710
4,28
-16,
3178
6126
,91
10,6
99,
5711
,64
-2-9
9-9
8,45
-0,2
1-1
5,53
-98,
64
120 COUNCIL FOR MEDICAL SCHEMES Annual Report 2004-5
ANNEXURE P5
Deta
iled
fina
ncia
l re
sult
s: r
egis
tere
d sc
hem
esfo
r th
e ye
ar e
nded
31
Dece
mbe
r 20
04Detailed financial results: registered schemes

Ref.
Nam
e of
Med
ical S
chem
esG
ross
Con
trib
utio
nsG
ross
Clai
ms I
ncur
red
Gro
ss C
laim
s Inc
urre
d:G
ross
Non
-Hea
lth
Gro
ss N
on-H
ealth
Exp
endi
ture
:Su
rplu
s/(D
efici
t) Su
rplus
/(Defi
cit) f
rom
Ope
ratio
ns:
No.
Gro
ss C
ontr
ibut
ions
Expe
nditu
reG
ross
Con
trib
utio
nsfro
m O
pera
tions
Gro
ss C
ontr
ibut
ions
2004
2003
%20
0420
03%
2004
2003
%20
0420
03%
2004
2003
%20
0420
03%
2004
2003
%PA
BPM
PABP
MG
row
thPA
BPM
PABP
MG
row
th%
%G
row
thPA
BPM
PABP
MG
row
th%
%G
row
thPA
BPM
PABP
MG
row
th%
%G
row
thR
RR
RR
RR
R11
54N
ampa
k G
roup
Med
ical
Aid
715
634
12,7
859
552
413
,47
83,1
682
,66
0,61
6358
8,70
8,75
9,08
-3,6
240
401,
565,
636,
25-9
,95
1241
Nas
pers
Med
ical
Fun
d75
365
415
,14
596
585
1,87
79,0
989
,39
-11,
5365
5519
,86
8,68
8,34
4,10
66-1
491
4,51
8,71
-0,2
14
281,
4414
69N
edco
r M
edic
al A
id S
chem
e56
953
95,
5954
949
610
,70
96,3
891
,93
4,84
3349
-33,
355,
769,
12-3
6,88
-6-1
481,
27-1
,09
-0,2
045
0,50
1584
Net
care
Med
ical
Sch
eme
718
658
9,06
600
517
16,1
383
,58
78,4
96,
4975
689,
7810
,40
10,3
30,
6634
62-4
4,99
4,74
9,39
-49,
5612
14O
ld M
utua
l Sta
ff M
edic
al A
id S
chem
e50
747
56,
8947
841
315
,63
94,1
787
,05
8,18
5549
11,6
110
,84
10,3
84,
41-3
64
-962
,17
-7,1
40,
89-9
06,5
814
41Pa
rmed
Med
ical
Aid
Sch
eme
125
91
157
8,86
106
994
413
,28
84,8
981
,58
4,06
7154
30,7
65,
634,
6920
,11
119
159
-24,
879,
4813
,73
-30,
9815
15PG
Bis
on M
edic
al A
id S
ocie
ty84
372
716
,01
716
634
12,9
584
,98
87,2
8-2
,64
6768
-1,4
67,
959,
36-1
5,06
6024
144,
327,
073,
3611
0,59
1186
PG G
roup
Med
ical
Sch
eme
113
51
025
10,6
788
975
118
,37
78,3
473
,24
6,96
7078
-9,7
36,
187,
58-1
8,43
141
148
-4,7
912
,41
14,4
3-1
3,97
1563
Pick
& P
ay M
edic
al S
chem
e63
656
312
,99
503
445
13,0
079
,06
79,0
50,
0166
5813
,11
10,3
210
,31
0,10
5152
-1,8
88,
059,
27-1
3,16
1583
Plat
inum
Hea
lth35
832
98,
8937
734
78,
6410
5,47
105,
71-0
,22
1511
32,4
14,
093,
3721
,60
34
-18,
650,
971,
30-2
5,29
1194
Prof
med
587
483
21,6
443
942
04,
3974
,73
87,0
8-1
4,18
7677
-0,2
913
,00
15,8
5-1
8,03
68-1
749
9,74
11,6
4-3
,54
428,
6315
16Q
uant
um M
edic
al A
id S
ocie
ty61
754
413
,37
484
449
7,78
78,4
882
,56
-4,9
473
77-6
,33
11,7
614
,24
-17,
3848
1037
4,32
7,72
1,84
318,
3712
01R
and
Wat
er M
edic
al S
chem
e80
966
821
,11
653
612
6,66
80,6
591
,58
-11,
9321
24-1
1,30
2,59
3,53
-26,
7613
633
315,
4416
,76
4,89
243,
0214
30R
emed
i Med
ical
Aid
Sch
eme
762
700
8,95
580
533
8,73
76,0
376
,19
-0,2
051
494,
956,
706,
96-3
,67
110
100
10,2
914
,49
14,3
21,
2311
76R
etai
l Med
ical
Sch
eme
742
679
9,30
541
563
-3,9
272
,92
82,9
5-1
2,09
9330
211,
4612
,54
4,40
184,
9790
7618
,41
12,1
211
,19
8,34
1209
SA B
rew
erie
s M
edic
al A
id S
ocie
ty62
958
08,
5946
945
52,
9774
,50
78,5
7-5
,18
5754
5,19
8,99
9,28
-3,1
310
268
50,5
316
,20
11,6
838
,62
1424
SABC
Med
ical
Aid
Sch
eme
792
714
10,8
867
655
920
,86
85,4
078
,35
9,00
5348
10,5
86,
676,
69-0
,27
-157
-102
,31
-0,1
77,
95-1
02,0
915
57Sa
man
cor
Hea
lth P
lan
567
508
11,5
666
449
733
,57
117,
2397
,91
19,7
362
4731
,95
11,0
39,
3318
,29
-160
-37
335,
82-2
8,26
-7,2
329
0,68
1038
SAM
WU
Med
258
217
18,8
018
714
826
,00
72,4
668
,32
6,06
3023
29,4
811
,48
10,5
48,
9934
34-1
,56
13,0
315
,73
-17,
1415
27Sa
ppi M
edic
al A
id S
chem
e78
868
814
,61
686
631
8,81
87,0
891
,72
-5,0
655
4329
,18
7,04
6,24
12,7
230
827
0,78
3,84
1,19
223,
5312
34Sa
solm
ed72
662
915
,51
553
500
10,5
576
,18
79,6
0-4
,29
5954
7,73
8,07
8,66
-6,7
311
373
54,8
615
,57
11,6
234
,07
1531
Sedm
ed39
025
155
,27
396
297
33,4
410
1,53
118,
13-1
4,06
55
4,65
1,40
2,08
-32,
60-1
1-5
1-7
7,49
-2,9
3-2
0,21
-85,
5112
43Si
emen
s M
edic
al S
chem
e87
180
48,
3768
555
922
,52
78,6
069
,52
13,0
670
691,
378,
078,
63-6
,46
880
-89,
960,
929,
91-9
0,73
1580
Sout
h Af
rican
Pol
ice S
ervic
e M
edica
l Sch
eme
(PO
LMED
)59
560
4-1
,42
507
485
4,65
85,2
480
,30
6,15
5156
-9,1
38,
519,
23-7
,82
3763
-41,
156,
2510
,47
-40,
3012
54St
ocks
med
810
737
9,89
594
530
12,1
273
,40
71,9
42,
0374
689,
009,
169,
24-0
,81
6872
-5,1
18,
449,
77-1
3,65
1544
Tig
er B
rand
s M
edic
al S
chem
e76
772
36,
1270
065
96,
1291
,23
91,2
30,
0053
4420
,64
6,90
6,07
13,6
814
19-2
6,60
1,87
2,70
-30,
8315
82Tr
ansm
ed M
edic
al F
und
562
549
2,48
508
395
28,7
590
,45
71,9
925
,64
6259
4,68
11,0
510
,81
2,15
-13
93-1
14,2
6-2
,36
16,9
9-1
13,9
115
79T
sogo
Sun
Gro
up M
edic
al S
chem
e66
364
82,
1851
846
212
,09
78,1
771
,26
9,70
9611
5-1
6,60
14,4
317
,68
-18,
3825
47-4
7,23
3,77
7,29
-48,
3514
34U
med
747
660
13,2
461
261
10,
1181
,85
92,5
9-1
1,60
5749
14,6
27,
587,
491,
2277
-110
826,
1610
,33
-0,1
19
571,
7215
97U
mvu
zo H
ealth
Med
ical
Sch
eme
305
N/A
N/A
198
N/A
N/A
65,0
1N
/AN
/A54
N/A
N/A
17,7
4N
/AN
/A32
N/A
N/A
10,4
8N
/AN
/A15
20U
nive
rsity
of N
atal
Med
ical
Sch
eme
657
521
26,1
651
441
523
,83
78,2
779
,75
-1,8
578
6030
,98
11,8
811
,45
3,82
-68
-185
,01
-0,9
91,
47-1
67,3
812
82U
nive
rsity
of t
he W
itwat
ersr
and
Staf
f Med
ical
A
id S
chem
e73
368
47,
1959
254
78,
1580
,73
80,0
00,
9063
69-8
,46
8,56
10,0
3-1
4,59
7968
15,1
610
,71
9,97
7,44
1565
Vend
a Po
lice
and
Pris
ons
Med
ical
Sch
eme
(Pol
pris
med
)33
628
518
,03
288
227
26,6
985
,60
79,7
57,
3483
122
-31,
9824
,77
42,9
8-4
2,37
-35
-65
-46,
15-1
0,37
-22,
73-5
4,38
1291
Witb
ank
Coa
lfiel
ds M
edic
al A
id S
chem
e74
268
09,
0363
759
76,
6985
,90
87,7
8-2
,15
4028
43,6
05,
454,
1431
,71
1411
33,9
81,
921,
5622
,89
1293
Woo
ltru
Hea
lthca
re F
und
520
466
11,5
543
740
19,
0484
,11
86,0
4-2
,25
6364
-1,7
812
,13
13,7
7-1
1,95
134
223,
402,
450,
8418
9,92
1253
Xst
rata
Med
ical
Aid
Sch
eme
487
465
4,71
370
343
7,72
75,9
373
,81
2,87
5147
9,70
10,4
910
,01
4,76
6675
-12,
1013
,58
16,1
8-1
6,06
SU
B-T
OT
AL
–R
egis
tere
d R
estr
icte
d Sc
hem
es63
359
26,
9953
249
57,
5384
,09
83,6
60,
5162
596,
419,
879,
93-0
,54
2931
-6,7
14,
565,
23-1
2,80
TO
TA
L R
EG
IST
ER
ED
SC
HE
ME
S64
560
27,
2751
147
96,
7579
,19
79,5
7-0
,48
9083
7,81
13,8
813
,82
0,50
3429
17,1
05,
284,
849,
17
Note
s:a
Dra
ft a
nn
ual
fin
anci
al s
tate
men
ts w
ere
sub
mit
ted
fo
r 20
04.
•Th
e Su
rplu
s/(d
efic
it)
fro
m o
per
atio
ns
rep
rese
nts
th
e ri
sk p
ort
ion
on
ly, w
her
eas
all
the
oth
er i
tem
s in
clu
de
savi
ngs
am
ou
nts
.•
PAB
PM
= P
er A
vera
ge B
enef
icia
ry P
er M
on
th
•Th
ere
are
no
200
4 fi
gure
s fo
r th
e co
lor
cod
ed s
chem
es d
ue
to:
-Sc
hem
es l
iqu
idat
ing
du
rin
g th
e ye
ar (
Hig
hve
ld f
urn
ish
ed t
he
Off
ice
wit
hm
anag
emen
t ac
cou
nts
fo
r th
e 20
03 f
inan
cial
yea
r).
The
foll
owin
g sc
hem
es a
mal
gam
ated
in
200
4, a
nd
in
200
3•
All
care
wit
h N
BC
wit
h e
ffec
t fr
om
1 J
anu
ary
2004
.•
An
glo
gold
wit
h D
isco
very
Hea
lth
wit
h e
ffec
t fr
om
1 J
un
e 20
04.
•M
yhea
lth
wit
h O
xyge
n w
ith
eff
ect
fro
m 1
Ju
ly 2
004.
•B
illm
ed w
ith
Sam
anco
r w
ith
eff
ect
fro
m 1
Ju
ly 2
004.
•Jo
med
wit
h L
amaf
wit
h e
ffec
t fr
om
1 S
epte
mb
er 2
003.
•P
retm
ed w
ith
Glo
bal
Hea
lth
wit
h e
ffec
t fr
om
1 O
cto
ber
200
3.
•Th
ere
are
no
200
3 fi
gure
s fo
r th
e co
lor
cod
ed s
chem
es d
ue
to:
- Sc
hem
es r
egis
teri
ng
du
rin
g 20
04.
COUNCIL FOR MEDICAL SCHEMES Annual Report 2004-5 121
ANNEXURE P5
Deta
iled
fina
ncia
l re
sult
s: r
egis
tere
d sc
hem
esfo
r th
e ye
ar e
nded
31
Dece
mbe
r 20
04Detailed financial results: registered schemes

Disc
over
y H
ealth
(Pty
) Ltd
81
595
586
23,9
89
145
749
121
,91
91
191
284
17,6
68
967
703
14,4
013
549
575
708
26,2
911
633
525
665
24,2
28
725
186
610
20,4
35
990
482
516
16,3
47
693
257
402
Med
sche
me
(Pty
) Ltd
221
082
923
16,2
820
112
326
916
,89
291
550
996
23,0
030
181
289
826
,98
811
976
262
515
,76
797
027
359
116
,59
927
623
149
821
,72
958
130
544
026
,13
602
532
946
4Se
lf-ad
min
ister
ed20
717
826
10,7
922
759
149
11,4
124
801
757
11,8
924
670
061
9,97
647
610
575
212
,57
623
081
768
412
,97
563
579
158
613
,20
467
034
758
112
,74
517
935
360
1M
etro
polit
an H
ealth
Cor
pora
te
(Pty
) Ltd
1657
399
58,
6316
630
752
9,48
1458
124
88,
6217
761
397
11,3
34
401
241
639
8,54
440
545
858
29,
173
562
854
511
8,34
403
697
644
211
,01
337
964
249
1M
x N
etw
ork
Syst
ems
(Pty
) Ltd
347
454
27,
133
456
767
6,87
344
934
36,
662
106
771
1,59
350
193
561
56,
803
318
560
605
6,91
305
868
056
77,
1647
657
637
21,
302
808
815
493
Old
Mut
ual H
ealth
care
(Pty
) Ltd
1138
037
65,
7213
347
122
5,22
1235
268
95,
2311
342
472
5,10
247
116
054
14,
802
203
340
529
4,59
195
320
246
24,
571
572
311
383
4,29
203
438
944
6So
vere
ign
Hea
lth -D
ivisi
on o
f M
edsc
hem
e H
oldi
ngs
1129
212
94,
3911
302
993
4,55
624
922
63,
707
278
835
4,15
259
434
574
05,
032
476
726
681
5,16
188
460
663
04,
411
683
025
503
4,59
173
187
749
4Ex
clus
ive H
ealth
(Pty
) Ltd
121
821
03,
281
261
881
3,94
227
715
24,
112
290
605
4,32
136
533
852
12,
651
537
838
489
3,20
162
046
448
73,
791
138
853
327
3,11
691
924
264
Allc
are
Adm
inist
rato
rs (P
ty) L
td8
213
680
3,21
760
656
0,91
768
759
1,02
763
109
0,94
128
471
850
12,
4950
982
370
01,
0651
009
461
81,
1941
779
155
21,
141
041
062
406
Row
an A
ngel
(Pty
) Ltd
117
622
52,
651
136
599
2,05
111
483
01,
701
9530
81,
421
030
648
487
2,00
699
750
427
1,46
543
087
394
1,27
371
338
325
1,01
657
768
311
Sizw
e M
edic
al S
ervi
ces
(Pty
) Ltd
115
676
42,
361
169
596
2,55
119
014
32,
821
227
050
3,38
118
757
263
12,
301
114
384
548
2,32
101
252
344
42,
371
191
761
437
3,25
830
899
442
Mul
timed
111
698
11,
761
9926
71,
491
7299
51,
081
6371
00,
951
012
616
721
1,97
793
866
666
1,65
564
356
644
1,32
482
175
631
1,32
852
446
607
Sigm
a H
ealth
Fun
d M
anag
ers
(Pty
) Ltd
111
682
11,
761
111
571
1,68
112
129
81,
801
128
502
1,91
855
021
610
1,66
744
463
556
1,55
705
564
485
1,65
652
623
423
1,78
620
228
442
Stat
us M
edic
al A
id A
dmin
istra
tors
(P
ty) L
td9
8959
01,
359
100
382
1,51
910
363
81,
549
103
160
1,53
723
868
673
1,40
754
011
626
1,57
677
270
545
1,59
556
020
449
1,52
594
559
553
PPS
Insu
ranc
e C
o Lt
d1
7032
21,
061
7160
61,
081
6624
20,
981
6228
60,
9349
548
258
70,
9641
476
748
30,
8631
466
539
60,
7427
675
337
00,
7536
222
342
9A
man
zi H
ealth
Adm
inist
rato
rs
(Pty
) Ltd
269
365
1,04
254
667
0,82
247
525
0,70
245
617
0,68
533
651
641
1,04
400
715
611
0,83
316
744
555
0,74
269
151
492
0,73
398
682
479
Med
ical
Aid
Adm
inist
ratio
n Ex
pert
s (P
ty) L
td1
6731
51,
011
5292
10,
801
3174
50,
471
1188
50,
1838
591
847
80,
7527
752
943
70,
5815
278
840
10,
3652
981
371
0,14
194
729
241
Pros
perit
y H
ealth
Cor
pora
te F
und
Man
ager
s (P
ty)L
td2
4099
60,
622
3173
60,
481
946
20,
141
291
30,
0418
789
638
20,
3611
790
331
00,
2537
638
331
0,09
1374
539
30,
0414
586
529
7Pr
ovid
ence
Hea
lthca
re R
isk
Man
ager
s (P
ty) L
td2
3705
20,
561
2005
60,
301
1768
80,
26-
-0,
0028
872
764
90,
5612
482
751
90,
2697
629
460
0,23
--
0,00
176
180
396
Eter
nity
Priv
ate
Hea
lth (P
ty) L
td1
3358
20,
501
3341
60,
50-
-0,
00-
-0,
0033
133
882
20,
6430
366
275
70,
63-
-0,
00-
-0,
0024
836
161
6A
fric
an L
ife H
ealth
(Pty
) Ltd
130
054
0,45
134
537
0,52
269
906
1,04
259
179
0,88
132
539
368
0,26
138
871
335
0,29
315
561
376
0,74
217
977
307
0,59
9943
327
6D
efin
iti M
edic
al F
und
Man
ager
s (P
ty) L
td1
2271
20,
341
1437
20,
221
1128
30,
17-
-0,
0010
408
538
20,
2064
929
376
0,14
4406
532
50,
10-
-0,
0063
982
235
Priv
ate
Hea
lth A
dmin
istra
tors
117
812
0,27
115
788
0,24
225
152
0,37
226
485
0,39
133
279
624
0,26
103
969
549
0,22
128
091
424
0,30
118
024
371
0,32
104
792
490
Mpu
mal
anga
Man
aged
Hea
lth C
are
(Pty
) Ltd
115
003
0,23
227
957
0,42
229
577
0,44
232
275
0,48
133
531
742
0,26
222
065
662
0,46
206
460
582
0,48
206
746
534
0,56
8710
148
4H
all A
dmin
stra
tor
cc1
1489
20,
221
1447
30,
221
1858
30,
281
1622
00,
2481
733
457
0,16
6171
135
50,
1370
366
316
0,16
5964
430
60,
1644
069
247
Inte
grat
ed H
ealth
care
(Pty
) Ltd
214
453
0,22
211
568
0,17
211
292
0,17
215
460
0,23
8577
549
50,
1763
374
457
0,13
5511
240
70,
1377
593
418
0,21
5450
831
4Be
nmed
Med
ical
Sch
eme
Adm
inist
rato
rs (P
ty) L
td1
690
90,
101
725
10,
111
387
60,
06-
--
4911
959
20,
1041
897
482
0,09
2069
244
50,
05-
-0,
0034
217
413
Supr
eme
Hea
lth A
dmin
istra
tors
(P
ty) L
td1
400
30,
06-
--
--
--
--
300
963
0,01
--
--
--
--
-2
890
60Th
ebe
ya B
ophe
lo H
ealth
care
A
dmin
istra
tion
12
679
0,04
212
490
61,
882
139
702
2,07
114
555
82,
179
290
289
0,02
551
964
368
1,15
513
521
306
1,20
443
893
254
1,21
574
817
9A
ctive
Hea
lth1
480
0,01
--
--
--
--
-2
162
375
0,00
--
--
--
--
-1
766
307
Prot
ecto
r G
roup
Fun
d M
anag
ers
(Pty
) Ltd
--
-2
9313
21,
402
9739
81,
442
7310
51,
09-
--
564
696
505
1,18
499
727
428
1,17
350
466
399
0,96
--
Igol
ide
Hea
lth N
etw
orks
(Pty
)Ltd
--
-1
2628
40,
401
3032
40,
451
4026
90,
60-
--
185
902
589
0,39
188
220
517
0,44
214
235
443
0,58
--
Sanl
am H
ealth
Man
agem
ent S
ervi
ces
(Pty
) Ltd
--
--
--
--
-2
107
679
1,60
--
--
--
--
-67
382
852
11,
84-
-M
edic
over
Inve
stm
ents
Ltd
--
--
--
--
-1
7430
91,
11-
--
--
--
--
394
765
443
1,08
--
Libe
rty
Hea
lthca
re (P
ty) L
td-
--
--
--
--
152
132
0,78
--
--
--
--
-28
440
445
50,
78-
-Vi
simed
Pro
pert
ies
& A
dmin
istra
tors
(P
ty) L
td,
--
--
--
--
-1
3413
20,
51-
--
--
--
--
176
190
430
0,48
--
Relia
nce
Med
ical
Sch
eme
Adm
inist
ratio
n (P
ty) L
td-
--
--
-2
922
90,
142
956
30,
14-
--
--
-18
445
167
0,04
929
181
0,03
--
Gra
nd T
otal
133
665
327
510
013
76
652
162
100
143
674
434
010
014
66
720
647
100
5153
143
964
510
048
031
615
601
100
4270
963
252
810
036
661
269
455
100
3616
609
445
3
Adm
inist
rato
r Nam
eNo
.of
Aver
age
Mark
etNo
.of
Aver
age
Mark
etNo
.of
Bene
ficiar
iesMa
rket
No.o
fBe
nefic
iaries
Mark
etGr
oss
PABP
MMa
rket
Gros
sPA
BPM
Mark
etGr
oss
PABP
MMa
rket
Gros
sPA
BPM
Mark
etNe
tt Cl
aimsP
ABPM
Medic
alBe
nefic
iaries
Share
Medic
alBe
nefic
iaries
Share
Medic
alSh
areMe
dical
Share
Cont
ribut
ionSh
areCo
ntrib
ution
Share
Cont
ribut
ionSh
areCo
ntrib
ution
Share
Incur
red
Sche
mes
Sche
mes
Sche
mes
Sche
mes
Incom
e (GC
I)Inc
ome (
GCI)
Incom
e (GC
I)Inc
ome (
GCI)
2004
2004
2004
2003
2003
2003
2002
2002
2002
2001
2001
2001
2004
2004
2004
2003
2003
2003
2002
2002
2002
2001
2001
2001
2004
2004
%%
%%
R’00
0R
%R’
000
R%
R’00
0R
%R’
000
R%
R’00
0R
122 COUNCIL FOR MEDICAL SCHEMES Annual Report 2004-5
ANNEXURE Q5
Adm
inis
trat
ors’
mar
ket
shar
es a
nd r
elev
ant
cash
flo
ws
for
the
year
end
ed 3
1 De
cem
ber
2004
Administrators’ market shares and relevant cash flows

Adm
inist
rato
r na
me
Claim
sN
ett C
laim
sPA
BPM
Claim
sN
ett C
laim
sPA
BPM
Claim
sN
ett C
laim
sPA
BPM
Claim
sG
ross
PABP
MAs
% o
fG
ross
PABP
MAs
% o
fG
ross
PABP
MAs
% o
fG
ross
PABP
MAs
% o
fRa
tioIn
curr
edRa
tioIn
curr
edRa
tioIn
curr
edRa
tioAd
mini
strat
ion
GCI
Adm
inistr
atio
nG
CIAd
mini
strat
ion
GCI
Adm
inistr
atio
nG
CIEx
pend
iture
Expe
nditu
reEx
pend
iture
Expe
nditu
re20
0420
0320
0320
0320
0220
0220
0220
0120
0120
0120
0420
0420
0420
0320
0320
0320
0220
0220
0220
0120
0120
01%
R’00
0R
%R’
000
R%
R’00
0R
%R’
000
R%
R’00
0R
%R’
000
R%
R’00
0R
%D
iscov
ery
Hea
lth (P
ty) L
td69
,35
647
378
337
069
,30
498
681
834
971
,41
315
632
127
268
,71
159
245
183
11,7
51
344
935
7711
,56
109
338
576
12,5
382
762
071
13,8
2M
edsc
hem
e (P
ty) L
td79
,57
614
500
345
681
,83
756
744
940
786
,34
794
224
736
586
,59
650
985
508,
0258
641
844
7,36
745
412
408,
0479
908
737
8,34
Self-
adm
inist
ered
86,1
65
074
979
557
87,0
24
792
079
498
90,4
44
078
548
507
92,3
048
204
556
7,44
455
623
507,
3141
522
943
7,37
332
223
417,
11M
etro
polit
an H
ealth
Cor
pora
te
(Pty
) Ltd
88,2
53
223
297
426
82,5
82
588
718
371
82,5
62
948
196
323
83,8
734
351
150
7,80
367
798
498,
3528
339
541
7,95
294
520
327,
30M
x N
etw
ork
Syst
ems
(Pty
) Ltd
80,2
42
601
733
475
78,4
12
411
847
447
78,8
650
225
639
210
5,42
210
067
376,
0019
904
636
6,00
208
898
396,
8321
511
174,
51O
ld M
utua
l Hea
lthca
re (P
ty) L
td88
,37
174
860
742
084
,05
152
330
736
082
,86
116
074
628
278
,68
241
661
539,
7822
396
654
10,1
621
636
251
11,0
816
518
340
10,5
1So
vere
ign
Hea
lth -D
ivisi
on o
f M
edsc
hem
e H
oldi
ngs
81,0
61
679
312
462
82,2
31
392
482
466
82,7
31
315
720
393
86,5
621
329
361
8,22
199
809
558,
0714
474
848
7,68
138
092
418,
20Ex
clus
ive H
ealth
(Pty
) Ltd
58,2
674
738
323
857
,14
773
086
232
62,8
758
826
016
969
,52
234
377
9017
,17
241
715
7715
,72
255
018
7715
,74
190
301
5516
,71
Allc
are
Adm
inist
rato
rs (P
ty) L
td84
,38
422
970
581
89,6
642
384
651
489
,53
350
078
462
89,9
615
213
359
11,8
443
711
608,
5741
338
508,
1034
667
468,
30Ro
wan
Ang
el P
ty) L
td68
,16
502
638
307
80,7
138
272
427
877
,57
306
870
268
88,9
611
471
754
11,1
368
977
429,
8649
839
369,
1827
224
247,
33Si
zwe
Med
ical
Ser
vice
s (P
ty) L
td70
,10
874
168
430
78,5
790
157
439
589
,21
976
222
358
82,0
612
469
666
10,5
012
521
462
11,2
410
531
046
10,4
010
873
340
9,12
Mul
timed
87,4
366
430
355
886
,58
464
892
531
82,5
738
917
550
980
,93
8877
763
8,77
8119
468
10,2
385
044
9715
,07
7497
598
15,5
5Si
gma
Hea
lth F
und
Man
ager
s (P
ty) L
td92
,50
498
246
372
86,7
848
340
233
286
,26
443
270
287
87,0
781
033
589,
4880
873
6010
,86
6646
246
9,42
6270
141
9,61
Stat
us M
edic
al A
id A
dmin
istra
tors
(P
ty) L
td84
,51
611
390
508
83,4
957
157
846
087
,19
483
435
391
88,6
668
065
639,
4068
931
579,
1461
865
509,
1348
627
398,
75PP
S In
sura
nce
Co
Ltd
74,7
935
333
441
187
,37
305
297
384
98,6
424
487
432
889
,91
5373
964
10,8
554
673
6413
,18
3655
146
11,6
229
581
4010
,69
Am
anzi
Hea
lth A
dmin
istra
tors
(P
ty) L
td91
,26
287
830
439
88,7
720
370
335
780
,51
171
224
313
81,3
454
013
6510
,12
3897
559
9,73
3120
655
9,85
2643
548
9,82
Med
ical
Aid
Adm
inist
ratio
n Ex
pert
s (P
ty) L
td54
,97
154
833
244
59,4
285
720
225
58,4
627
202
191
53,0
410
008
812
425
,94
6076
596
21,9
033
880
8922
,17
1593
111
230
,07
Pros
perit
y H
ealth
Cor
pora
te F
und
Man
ager
s (P
ty)L
td79
,04
8331
721
972
,06
2083
418
361
,26
706
920
261
,49
3123
163
16,6
228
828
7624
,45
534
647
14,2
02
521
7218
,34
Prov
iden
ce H
ealth
care
Risk
M
anag
ers
(Pty
) Ltd
70,2
589
092
370
71,3
776
924
362
78,7
9-
-0,
0024
338
558,
439
321
397,
477
440
357,
62-
--
Eter
nity
Priv
ate
Hea
lth (P
ty) L
td82
,24
225
308
562
80,2
0-
-0,
00-
-0,
0037
819
9411
,41
3592
490
11,8
3-
--
--
- A
fric
an L
ife H
ealth
(Pty
) Ltd
75,7
287
276
211
63,1
923
822
028
475
,88
174
125
245
80,2
118
840
5214
,21
1599
039
11,5
133
749
4010
,69
2780
539
12,7
6D
efin
iti M
edic
al F
und
Man
ager
s (P
ty) L
td74
,64
3212
318
661
,58
2360
717
468
,83
--
0,00
1706
463
16,3
910
804
6316
,64
748
755
16,9
9-
--
Priv
ate
Hea
lth A
dmin
istra
tors
79,9
483
548
441
80,6
210
337
834
380
,71
7918
524
967
,09
2116
199
15,8
816
761
8816
,12
2561
885
20,0
017
838
5615
,11
Mpu
mal
anga
Man
aged
Hea
lth C
are
(Pty
) Ltd
89,8
514
695
143
890
,78
159
786
450
98,4
213
871
935
885
,05
629
035
4,71
794
424
3,58
856
824
4,15
599
915
2,90
Hal
l Adm
inst
rato
r cc
63,4
829
765
171
58,7
227
993
126
47,8
822
588
116
47,6
220
529
115
25,1
216
036
9225
,99
1577
471
22,4
213
057
6721
,89
Inte
grat
ed H
ealth
care
(Pty
) Ltd
72,0
240
053
289
70,4
940
365
298
82,2
560
117
324
77,4
87
669
448,
945
838
429,
214
864
368,
825
543
307,
14Be
nmed
Med
ical
Sch
eme
Adm
inist
rato
rs (P
ty) L
td69
,93
2798
832
266
,90
1410
730
368
,38
--
-7
694
9315
,66
637
273
15,2
12
691
5813
,01
--
- Su
prem
e H
ealth
Adm
inist
rato
rs
(Pty
) Ltd
96,0
4-
--
--
--
--
390
812
,96
--
--
--
--
- Th
ebe
ya B
ophe
lo H
ealth
care
A
dmin
istra
tion
61,8
742
780
128
577
,51
388
249
232
75,6
133
671
919
375
,86
127
940
13,7
649
242
338,
9241
420
258,
0740
590
239,
14A
ctive
Hea
lth85
,13
--
--
--
--
-21
938
10,1
1-
--
--
--
--
Prot
ecto
r G
roup
Fun
d M
anag
ers
(Pty
) Ltd
-45
346
040
687
,65
431
910
370
97,1
735
150
140
111
0,03
--
-61
409
5510
,87
5224
445
10,4
538
721
4411
,05
Igol
ide
Hea
lth N
etw
orks
(Pty
) Ltd
-23
579
774
812
6,84
214
382
589
113,
9021
121
143
798
,59
--
-1
153
40,
6295
93
0,51
855
20,
40Sa
nlam
Hea
lth M
anag
emen
t Ser
vice
s (P
ty) L
td-
--
--
--
507
272
393
80,4
0-
--
--
--
--
8464
366
12,5
6M
edic
over
Inve
stm
ents
Ltd
--
--
--
-18
448
820
753
,94
--
--
--
--
-35
924
409,
10Li
bert
y H
ealth
care
(Pty
) Ltd
--
--
--
-13
872
522
263
,32
--
--
--
--
-34
628
5512
,18
Visim
ed P
rope
rtie
s &
Adm
inist
rato
rs
(Pty
) Ltd
,-
--
--
--
141
201
345
89,4
4-
--
--
--
--
2125
852
12,0
7Re
lianc
e M
edic
al S
chem
e A
dmin
istra
tion
(Pty
) Ltd
--
--
904
382
49,0
38
011
7086
,23
--
--
--
252
323
13,6
82
125
1922
,87
Gra
nd T
otal
78,5
634
026
289
426
79,1
531
607
318
391
82,0
527
445
575
340
83,2
15
000
174
639,
704
508
247
569,
394
082
627
509,
563
528
918
449,
63
COUNCIL FOR MEDICAL SCHEMES Annual Report 2004-5 123
ANNEXURE Q5
Adm
inis
trat
ors’
mar
ket
shar
es a
nd r
elev
ant
cash
flo
ws
for
the
year
end
ed 3
1 De
cem
ber
2004
Administrators’ market shares and relevant cash flows
Note
s:•
Ingw
e M
ed (
Pty
) Lt
d c
han
ged
its
nam
e to
Afr
ican
Lif
e H
ealt
h (
Pty
) Lt
d•
Hea
lth
Man
agem
ent
Inst
itu
te (
Pty
) Lt
d c
han
ged
its
nam
e to
MX
Net
wo
rk S
yste
ms
(Pty
) Lt
d•
Ave
rage
ben
efic
iari
es f
or
the
year
wer
e u
sed
.•
Co
mp
arat
ive
figu
res
wer
e re
stat
ed•
PAB
PM
= P
er A
vera
ge B
enef
icia
ry P
er M
on
th•
B a
nd
M M
edic
al S
chem
e A
dm
inis
trat
ors
(P
ty)
Ltd
ch
ange
d i
ts n
ame
to B
enm
edM
edic
al S
chem
e A
dm
inis
trat
ors
(P
ty)
Ltd
•W
her
e sc
hem
es a
mal
gam
ated
du
rin
g th
e ye
ar, t
he
resu
lts
wer
e in
clu
ded
in
th
e ad
min
-is
trat
or
as a
t ye
ar-e
nd
.
124 COUNCIL FOR MEDICAL SCHEMES Annual Report 2004-5
ANNEXURE Q5
Adm
inis
trat
ors’
mar
ket
shar
es a
nd r
elev
ant
cash
flo
ws
for
the
year
end
ed 3
1 De
cem
ber
2004
Administrators’ market shares and relevant cash flows

Ref.
Nam
e of
Med
ical S
chem
e20
0420
0320
0220
0120
00No
.Im
paire
dIm
paire
d(In
crease
)/To
tal%
Contr
ibutio
nsIm
paire
dIm
paire
d(In
crease
)/To
tal%
Contr
ibutio
nsIm
paire
dIm
paire
d(In
crease
)/To
tal%
Contr
ibutio
nsIm
paire
dIm
paire
d(In
crease
)/To
tal%
Contr
ibutio
nsIm
paire
dIm
paire
d(In
crease
)/To
tal%
Contr
ibutio
nsRe
ceiva
blesR
eceiv
ables
Decre
aseIm
paire
dof
Non-
Outst
andin
gRe
ceiva
blesR
eceiv
ables
Decre
aseIm
paire
dof
Non-
Outst
andin
gRe
ceiva
blesR
eceiv
ables
Decre
aseIm
paire
dof
Non-
Outst
andin
gRe
ceiva
blesR
eceiv
ables
Decre
aseIm
paire
dof
Non-
Outst
andin
gRe
ceiva
blesR
eceiv
ables
Decre
aseIm
paire
dof
Non-
Outst
andin
gW
ritten
Reco
vered
inRe
ceiva
bles
Healt
hfor
Mor
e tha
nW
ritten
Reco
vered
inRe
ceiva
bles
Healt
hfor
Mor
e tha
nW
ritten
Reco
vered
inRe
ceiva
bles
Healt
hfor
Mor
e tha
nW
ritten
Reco
vered
inRe
ceiva
bles
Healt
hfor
Mor
e tha
nW
ritten
Reco
vered
inRe
ceiva
bles
Healt
hfor
Mor
e tha
nOf
fPro
vision
Expe
n-60
Days
asOf
fPro
vision
Expe
n-60
Days
asOf
fPro
vision
Expe
n-60
Days
asOf
fPro
vision
Expe
n-60
Days
asOf
fPro
vision
Expe
n-60
Days
asfor
Impa
ired
diture
of Ar
rear
for Im
paire
ddit
ureof
Arrea
rfor
Impa
ired
diture
of Ar
rear
for Im
paire
ddit
ureof
Arrea
rfor
Impa
ired
diture
of Ar
rear
Rece
ivable
sCo
ntribu
tions
Rece
ivable
sCo
ntribu
tions
Rece
ivable
sCo
ntribu
tions
Rece
ivable
sCo
ntribu
tions
Rece
ivable
sCo
ntribu
tions
R’00
0R’
000
R’00
0R’
000
%%
R’00
0R’
000
R’00
0R’
000
%%
R’00
0R’
000
R’00
0R’
000
%%
R’00
0R’
000
R’00
0R’
000
%%
R’00
0R’
000
R’00
0R’
000
%%
REG
ISTE
RED
SCH
EMES
– O
PEN
1589
Baym
ed-
--
-0,0
00,0
0N/
AN/
AN/
AN/
AN/
AN/
AN/
AN/
AN/
AN/
AN/
AN/
AN/
AN/
AN/
AN/
AN/
AN/
AN/
AN/
AN/
AN/
AN/
AN/
A12
52Be
stmed
Med
ical S
chem
e(8
70)
-(4
625)
(549
5)6,4
50,0
0(8
8)-
(385
)(4
73)
0,79
0,00
(177
)5
(262
2)(2
793)
5,97
0,00
(26)
0(1
037)
(106
3)3,2
20,0
0(5
0)84
(534
)(5
00)
1,64
66,39
1512
Bonit
as M
edica
l Aid
Fund
(147
)-
(190
00)
(191
47)
3,79
49,07
-1
(221
47)
(221
45)
4,87
57,29
--
1002
210
022
-2,76
65,00
(2382
6)-
6357
(174
69)
4,75
100,0
0-
-(1
09)
(109
)0,0
40,0
010
34Ca
pe M
edica
l Plan
(7)
-12
411
7-0
,720,0
0(2
37)
--
(237
)1,5
80,0
0(5
4)-
-(5
4)0,3
110
,84(1
07)
-55
(52)
0,34
11,25
(121
)-
200
79-0
,5336
,9010
48Co
mmer
cial a
nd In
dustr
ial
Medic
al Ai
d So
ciety
(CIM
AS)
(295
)-
-(2
95)
2,70
5,43
-2
-2
-0,01
0,95
(75)
--
(75)
0,67
2,00
(10)
--
(10)
0,13
4,00
(49)
-(5
00)
(549
)5,3
215
,0015
52Co
mmun
ity M
edica
l Aid
Sche
me (C
OMM
ED)
--
(155
5)(1
555)
3,45
0,00
(277
)-
(233
4)(2
611)
7,74
21,38
-1
(274
)(2
72)
0,99
5,05
(324
)-
1769
1444
-6,52
23,54
--
--
0,00
0,00
1491
Comp
care
Med
ical S
chem
e(2
139)
-28
3169
3-1
,710,2
4(2
88)
-(2
076)
(236
4)4,8
85,5
1(9
45)
-(1
135)
(208
0)4,7
812
,01-
-(1
92)
(192
)0,6
64,0
3-
--
-0,0
04,0
311
25Di
scov
ery H
ealth
Med
ical
Sche
me(2
35)
27(2
0033
)(2
0242
)0,9
2-0
,98(2
13)
-47
3945
26-0
,24-0
,67(1
839)
-(1
7591
)(1
9430
)1,2
60,0
0(2
31)
-(1
4400
)(1
4631
)1,1
30,0
0(2
97)
-(1
0862
)(1
1159
)1,8
20,0
015
96Ec
lipse
Med
ical S
chem
e-
--
-0,0
08,4
7N/
AN/
AN/
AN/
AN/
AN/
AN/
AN/
AN/
AN/
AN/
AN/
AN/
AN/
AN/
AN/
AN/
AN/
AN/
AN/
AN/
AN/
AN/
AN/
A12
02Fe
dhea
lth(2
032)
182
3309
1459
-0,78
17,20
-46
815
5720
25-1
,0619
,28(10
333)
-82
9(9
504)
3,84
10,17
(492
08)
8049
-(4
1159
)12
,8136
,53(1
5110
)84
16(1
2204
)(1
8898
)13
,2945
,1515
01Fr
ee St
ate M
edica
l Aid
Sche
me-
--
-0,0
00,0
0-
--
-0,0
00,0
0-
--
-0,0
00,0
0(0
)0
-(0
)0,0
00,0
0(1
)0
-(1
)0,2
520
,0015
54Ge
nesis
Med
ical S
chem
e-
--
-0,0
00,0
0-
--
-0,0
00,0
0-
--
-0,0
00,0
0-
--
-0,0
00,0
0-
--
-0,0
00,0
015
61Ge
n-He
alth
Medic
al Sc
heme
--
(378
4)(3
784)
13,99
92,92
--
--
0,00
19,30
(114
8)-
-(1
148)
5,05
0,00
--
--
0,00
0,00
--
--
0,00
0,00
1162
Glob
al He
alth
(343
)2
(128
)(4
69)
0,80
7,21
(61)
0(3
11)
(372
)0,9
515
,16(2
0)56
(105
)(6
9)0,2
50,0
0(8
3)61
(54)
(76)
0,33
0,00
(356
)9
182
(165
)1,0
40,0
014
66Go
od H
ope M
edica
l Aid
Socie
ty(1
81)
-5
(176
)4,6
60,0
0(4
1)6
-(3
5)1,2
10,0
0(9
)-
-(9
)0,3
80,0
0-
--
-0,0
031
,00-
-(1
12)
(112
)4,4
60,0
015
37Ho
smed
Med
ical A
id Sc
heme
--
(977
0)(9
770)
9,36
0,00
--
555
555
-0,66
0,00
--
(157
88)
(157
88)
18,02
0,00
(192
87)
-(3
000)
(222
87)
22,71
70,03
--
(495
4)(4
954)
5,59
0,00
a15
77Ing
we H
ealth
Plan
(750
)2
780
32-0
,0893
,43(3
0)3
(1)
(28)
0,08
12,63
(230
9)1
369
(193
9)5,2
532
,02(2
879)
-18
2(2
697)
15,90
51,20
(277
)-
(149
4)(1
771)
41,47
64,60
1556
KwaZ
ulu-N
atal M
edica
l Aid
Sche
me(1
13)
-(2
115)
(222
8)11
,3966
,42-
-(2
224)
(222
4)11
,2476
,51-
-(1
354)
(135
4)12
,7686
,21-
-(1
844)
(184
4)17
,5588
,98-
--
-0,0
00,0
015
76Lib
erty
Medic
al Sc
heme
(259
)-
2950
2691
-2,38
12,56
--
(719
1)(7
191)
6,78
47,89
--
(119
61)
(119
61)
10,59
46,54
(190
)-
(371
1)(3
902)
5,49
59,80
--
(187
0)(1
870)
3,42
81,70
1536
Lifem
ed M
edica
l Sch
eme
(71)
-53
(18)
0,13
1,00
(34)
-(1
09)
(143
)1,1
81,2
4(6
)-
-(6
)0,0
65,0
2-
-(6
0)(6
0)0,7
31,0
9-
--
-0,0
01,8
011
42Me
dical
Expe
nses
Di
stribu
tion
Socie
ty (M
EDS)
(484
)34
344
(106
)0,3
42,9
7(1
34)
-(7
32)
(865
)2,5
14,0
0(1
751)
-41
1(1
340)
3,29
7,12
--
(316
1)(3
161)
15,69
43,39
--
(526
4)(5
264)
27,92
70,66
1549
Medic
over
200
0(1
838)
--
(183
8)2,5
60,0
0-
-16
0616
06-3
,210,0
0-
-59
6259
62-1
5,55
0,00
(10)
-70
569
5-1
,760,0
0(3
4)-
(108
18)
(108
52)
11,08
0,00
1149
Medih
elp(3
81)
263
1522
1404
-0,56
13,76
(218
7)13
3(2
467)
(452
1)1,9
18,6
9(3
948)
8710
46(2
815)
1,39
15,60
(254
4)65
(384
)(2
863)
1,46
60,00
(130
8)42
(345
0)(4
715)
3,98
60,00
1506
Medim
ed M
edica
l Sch
eme
--
--
0,00
0,00
--
--
0,00
0,00
--
--
0,00
0,00
--
--
0,00
0,00
--
--
0,00
0,00
1140
Meds
hield
Medic
al Sc
heme
-9
(108
44)
(108
35)
3,39
85,88
(603
7)60
5(3
3706
)(3
9138
)9,9
482
,81-
-(1
2000
)(1
2000
)3,4
646
,34-
-(1
7590
)(1
7590
)6,5
12,0
9-
-(1
641)
(164
1)0,9
2-2
1,81
1021
Merid
ian H
ealth
(206
)-
71(1
35)
2,03
5,92
--
(210
)(2
10)
1,39
0,00
--
(549
)(5
49)
2,89
0,00
-35
3(1
90)
163
-0,88
0,00
(132
5)-
-(1
325)
30,38
0,00
1087
Munim
ed-
-(2
744)
(274
4)1,8
70,0
0(4
01)
-(7
908)
(830
9)6,3
20,0
0(1
979)
-(7
00)
(267
9)2,5
50,0
0(1
60)
--
(160
)0,1
819
,05(1
741)
--
(174
1)4,1
420
,0111
48My
healt
h Me
dical
Sche
me(2
40)
-(6
24)
(864
)6,9
20,0
0(1
500)
134
-(1
366)
5,04
0,72
(329
9)29
113
08(1
700)
6,08
63,82
(352
4)19
4311
57(4
24)
1,64
30,89
(107
76)
1052
1217
(850
7)41
,6170
,1611
66Na
tiona
l Inde
pend
ent
Medic
al Ai
d So
ciety
(NIM
AS)
(140
)-
-(1
40)
0,65
6,48
(115
)-
-(1
15)
0,72
-0,49
(136
)-
90(4
6)0,3
30,6
7(1
40)
-25
(115
)0,8
73,4
7(3
71)
-(6
5)(4
36)
4,18
3,68
1167
Natio
nal M
edica
l Plan
(NMP
)-
-27
727
7-0
,163,5
4-
-16
3916
39-0
,960,0
0-
-(1
220)
(122
0)0,7
90,0
0-
-(1
217)
(121
7)0,8
83,5
4-
-(1
108)
(110
8)0,8
50,0
011
70NB
C Me
dical
Sche
me-
-(2
28)
(228
)0,8
025
,13-
-(6
31)
(631
)2,8
01,9
5(1
81)
-23
453
-0,18
1,96
--
(356
)(3
56)
1,75
16,38
--
(92)
(92)
0,40
0,00
1139
Omn
ihealt
h(10
5809
)12
010
2320
(336
9)5,7
734
,65(7
061)
-(7
9649
)(8
6710
)41
,6489
,23(25
482)
12(6
656)
(321
26)
14,20
38,60
-5
(122
07)
(122
02)
4,44
21,43
(465
)2
3147
2684
-1,33
25,00
1560
Ope
nplan
Med
ical S
chem
e(4
99)
636
416
553
-1,05
6,97
(512
2)38
956
5792
4-1
,6020
,08(2
60)
683
2794
3217
-4,49
64,38
(114
0)-
(100
91)
(112
32)
6,14
61,22
(202
38)
415
(638
6)(2
6209
)13
,3834
,1512
15O
xyge
n(2
425)
440
1067
(918
)0,5
560
,65(1
629)
1289
711
371
-0,34
69,93
(781
8)-
1741
996
01-7
,6671
,57(5
12)
-(4
563)
(507
5)3,5
971
,38(2
78)
-(6
002)
(628
0)4,9
582
,2615
87Pa
thfin
der M
edica
l Sch
eme
--
(369
)(3
69)
8,63
34,13
--
(200
)(2
00)
5,88
92,92
--
--
0,00
0,00
--
--
0,00
0,00
N/A
N/A
N/A
N/A
N/A
N/A
1546
Phar
os M
edica
l Plan
--
--
0,00
4,83
--
--
0,00
2,22
--
(50)
(50)
0,34
4,52
--
255
255
-2,31
16,39
--
(60)
(60)
1,06
13,66
1454
Pro
Sano
Med
ical S
chem
e(1
2)6
2473
2467
-2,58
80,03
(75)
8(1
623)
(169
0)1,8
066
,26-
1618
9319
09-2
,5489
,20-
2623
3323
59-3
,3587
,07-
5881
8482
42-1
3,98
96,61
1196
Prot
ea M
edica
l Aid
Socie
ty(3
13)
-51
820
5-4
,213,1
9(3
20)
-(2
59)
(579
)10
,414,9
9(1
29)
-(2
10)
(339
)5,7
213
,94(2
89)
-37
586
-3,63
9,56
--
(550
)(5
50)
12,48
12,79
1285
Prot
ecto
r Hea
lth22
-(2
965)
(294
3)4,2
22,7
5(5
398)
268
3346
(178
4)2,2
94,0
1(8
57)
996
(217
3)(2
034)
3,32
6,61
(692
2)29
227
66(3
864)
7,81
29,69
(733
)-
(118
2)(1
914)
19,44
22,37
1595
Pulz
Medic
al Sc
heme
--
(332
)(3
32)
1,51
0,00
--
(39)
(39)
2,60
0,00
N/A
N/A
N/A
N/A
N/A
N/A
N/A
N/A
N/A
N/A
N/A
N/A
N/A
N/A
N/A
N/A
N/A
N/A
1575
Reso
lution
Hea
lth M
edica
l Sc
heme
(585
)-
(301
)(8
86)
0,71
8,90
(133
6)-
51(1
285)
1,62
12,74
--
440
440
-1,01
21,43
--
(565
)(5
65)
3,18
12,82
(50)
-56
6-0
,360,0
014
46Se
lfmed
Med
ical S
chem
e(1
56)
6256
(38)
0,11
53,22
-83
(116
1)(1
078)
2,74
40,13
(903
1)-
7202
(183
0)3,7
754
,32-
-(5
875)
(587
5)11
,5970
,50-
-(5
72)
(572
)1,0
810
0,00
1486
Sizwe
Med
ical F
und
(43)
-(1
4850
)(1
4893
)8,0
50,0
0(3
758)
-(1
453)
(521
0)3,1
14,4
9(10
336)
-85
83(1
753)
1,09
4,49
(660
)-
459
(200
)0,1
230
,95(1
498)
-(3
000)
(449
8)3,2
465
,3911
41Sp
ectra
med
(357
1)40
0064
4168
70-4
,360,0
0-
-34
7034
70-3
,6012
,30-
-(1
6920
)(1
6920
)18
,760,0
0(1
393)
-(1
116)
(250
9)8,1
923
,00(7
15)
-(5
83)
(129
7)3,7
735
,0014
64Su
reme
d He
alth
(669
)-
(665
)(1
334)
11,51
33,29
(283
5)-
(230
0)(5
135)
37,44
24,26
--
(821
)(8
21)
16,72
39,24
95-
(554
)(4
60)
13,20
0,00
(463
)-
(432
)(8
95)
35,08
62,40
COUNCIL FOR MEDICAL SCHEMES Annual Report 2004-5 125
ANNEXURE R5
Impa
ired
rec
eiva
bles
: 20
04 r
egis
tere
d sc
hem
esfo
r th
e ye
ar e
nded
31
Dece
mbe
r 20
04Impaired receivables: 2004 registered schemes

1147
Telem
ed-
-25
9825
98-6
,0561
,14(1
65)
-(2
713)
(287
8)6,9
038
,43(1
1)-
(159
9)(1
610)
3,17
5,92
(592
)-
(299
)(8
91)
2,03
0,00
(595
)-
(743
)(1
339)
3,05
22,53
1592
Theb
emed
--
(87)
(87)
4,41
23,81
--
--
0,00
0,00
--
--
0,00
0,00
N/A
N/A
N/A
N/A
N/A
N/A
N/A
N/A
N/A
N/A
N/A
N/A
1422
Topm
ed M
edica
l Sch
eme
(1)
1533
034
4-0
,853,5
3(4
415)
-29
53(1
462)
3,33
0,00
(452
3)-
976
(354
7)5,9
574
,72(8
)-
(178
8)(1
796)
2,73
29,98
(13)
-(1
346)
(135
8)4,0
210
0,00
1586
X-Pr
ess C
are M
edica
l Sch
eme
(430
)-
(905
)(1
334)
5,18
51,60
(880
)-
(367
)(1
246)
7,52
22,13
--
--
0,00
24,07
--
(360
)(3
60)
8,55
65,10
N/A
N/A
N/A
N/A
N/A
N/A
SUB
-TO
TAL
– Re
giste
red
Ope
n Sc
hem
es(12
5223
)57
9632
561
(868
65)
1,53
13,32
(446
35)
3389
(1459
12)(
1871
58)
3,58
26,44
(866
53)
2148
(341
48)
(1186
54)
2,55
16,24
(1139
72)
1079
4(6
8176
)(17
1354
)3,9
829
,56(56
864)
1007
8(6
2946
)(10
9732
)3,7
627
,83
RE
GIS
TE
RE
D S
CH
EM
ES
- R
EST
RIC
TE
D15
53AB
I Med
ical
Sche
me(4
4)8
8751
-1,53
0,40
(35)
193
58-1
,85-9
,81(5
8)1
(181
)(2
37)
7,64
22,06
(7)
219
13-0
,4911
,16-
2(4
6)(4
4)2,2
54,8
210
05AE
CI M
edica
l Aid
Socie
ty(6
9)-
(90)
(159
)0,9
62,3
8(1
77)
-15
(162
)1,0
030
,76(5
7)-
-(5
7)0,3
994
,68-
-(5
9)(5
9)0,5
10,0
0-
2(2
57)
(255
)2,5
643
,8815
67Af
rox
Medic
al Ai
d So
ciety
(164
)19
(376
)(5
21)
4,60
5,20
(163
)16
(147
)(2
93)
3,29
2,97
(2)
3(1
05)
(104
)1,4
60,0
0(5
1)-
(213
)(2
64)
4,04
0,00
--
(88)
(88)
1,84
0,00
1456
Allia
nce M
idmed
Med
ical
Sche
me(0
)-
5959
-1,71
0,00
(401
)-
204
(197
)5,6
33,8
6(1
5)-
(276
)(2
91)
8,43
1,97
(6)
-59
53-1
,820,0
0-
0(7
5)(7
5)2,6
87,4
015
34Al
tron
Medic
al Ai
d Sc
heme
(196
)-
(478
)(6
74)
4,70
1,78
--
(197
)(1
97)-1
47,07
1,02
--
(488
)(4
88)
14,02
0,00
--
(138
)(1
38)
1,59
13,66
(113
)-
(303
)(4
16)
4,43
0,00
1012
Anglo
Ame
rican
Cor
pora
tion
Medic
al Sc
heme
(AAC
MED)
(263
)21
221
115
9-0
,730,0
0(1
224)
105
1171
53-0
,250,0
0-
14(2
93)
(279
)1,3
00,0
0-
-64
464
4-2
,480,0
0(0
)-
(589
)(5
89)
1,90
39,59
1503
Anglo
gold
Medic
al Sc
heme
(G
oldme
d)-
-(1
8)(1
8)2,2
50,0
0-
-42
42-3
,7462
,96-
-78
78-8
,841,8
9-
-(3
71)
(371
)-40
,5949
,10-
-(3
4)(3
4)0,0
417
,5315
71An
glova
al Gr
oup
Medic
al Sc
heme
(19)
-18
916
9-1
,55-3
,32(1
3)-
(238
)(2
52)
2,32
-4,67
(1)
-(2
36)
(237
)2,2
7-3
,20(4
93)
4236
8(8
4)1,1
60,0
0(5
45)
459
200
114
-1,69
22,48
1013
Aran
da M
edica
l Sch
eme
--
--
0,00
0,00
--
--
0,00
0,00
--
--
0,00
0,00
--
--
0,00
0,00
--
--
0,00
0,00
1279
Bank
med
(157
)14
6(3
75)
(386
)0,2
534
,90(1
777)
103
1176
(497
)0,3
830
,01(1
80)
313
3011
53-1
,020,0
0(2
35)
-(1
150)
(138
5)1,3
936
,22(1
589)
-(5
198)
(678
7)7,9
20,0
015
07Ba
rlowo
rld M
edica
l Sch
eme
(54)
-13
985
-0,65
13,55
(76)
416
391
-0,66
13,43
(171
)-
1535
1363
-13,35
-0,13
(47)
-(1
343)
(139
1)10
,806,7
5(1
2)0
(119
)(1
31)
1,33
-6,67
1089
Billm
ed M
edica
l Sch
eme
-1
(145
)(1
44)
7,66
0,00
(104
)7
383
286
-8,79
2,37
0-
(143
)(1
43)
6,08
51,68
(18)
-(1
87)
(205
)8,0
166
,06(5
70)
-37
2(1
98)
7,08
76,15
1115
Biz H
ealth
Med
ical S
chem
e(2
57)
--
(257
)6,3
10,0
0(1
15)
-10
0(1
5)0,4
80,0
9(1
)-
5049
-1,66
5,51
--
(55)
(55)
1,59
6,00
--
387
387
-14,05
15,00
1526
BMW
Emp
loyee
s Med
ical
Aid
Socie
ty(1
1)0
(4)
(15)
0,30
3,22
(66)
-10
438
-0,78
2,30
(143
6)-
(19)
(145
5)25
,030,0
0(4
)-
196
192
-4,53
0,00
-8
(163
)(1
55)
3,92
80,61
1237
BPSA
Med
ical S
chem
e(1
)-
(4)
(5)
0,14
37,10
(189
)-
187
(2)
0,07
1,96
(11)
-30
629
5-10
,1411
,48-
-(5
25)
(525
)68
,8083
,38-
-(2
5)(2
5)3,1
20,0
015
90Bu
ilding
& C
onstr
uctio
n Ind
ustry
Med
ical A
id Fu
nd-
--
-0,0
012
,61-
--
-0,0
00,0
0-
--
-0,0
00,0
0-
--
-0,0
00,0
0N/
AN/
AN/
AN/
AN/
AN/
A15
93Bu
ilt En
viron
ment
Profe
ssion
al
Asso
ciatio
ns M
edica
l Sch
eme
(BEP
S)-
-(2
1)(2
1)0,6
20,0
0(2
)-
(8)
(10)
0,37
0,40
--
--
0,00
0,00
N/A
N/A
N/A
N/A
N/A
N/A
N/A
N/A
N/A
N/A
N/A
N/A
1158
Cawm
ed M
edica
l Sch
eme
--
--
0,00
0,00
--
--
0,00
0,00
--
--
0,00
0,00
--
(25)
(25)
2,28
0,00
--
--
0,00
0,00
1043
Char
tere
d Acc
ount
ants
(SA)
Medic
al Ai
d Fu
nd (C
AMAF
)-
-45
245
2-1
,055,5
2-
-(2
)(2
)0,0
125
,29(1
8)48
(300
)(2
69)
0,76
17,08
(109
4)-
-(1
094)
3,41
30,95
(146
)16
300
170
-0,77
15,06
1521
Click
s Gro
up M
edica
l Sch
eme
(176
)1
(169
)(3
44)
9,82
86,39
(8)
-(1
10)
(118
)4,6
283
,10-
-26
626
6-13
,272,8
6(3
)-
171
169
-10,30
50,63
(43)
-(5
64)
(608
)25
,0813
,0615
70CS
IR M
edica
l Sch
eme
(1)
-12
11-0
,1410
2,28
--
(229
)(2
29)
3,48
0,00
(14)
--
(14)
0,60
0,00
(7)
--
(7)
0,10
0,00
--
--
0,00
0,00
1039
DCMe
d Me
dical
Aid
Fund
(37)
-37
-0,0
00,9
0(3
22)
--
(322
)4,2
7-7
0,71
(235
)-
-(2
35)
3,58
75,71
(154
)-
-(1
54)
2,52
0,00
(478
)-
-(4
78)
9,28
18,88
1068
De B
eers
Bene
fit So
ciety
(2)
--
(2)
0,01
0,00
(4)
--
(4)
0,03
0,00
(4)
--
(4)
0,03
0,00
(3)
--
(3)
0,04
0,00
(6)
--
(6)
0,00
0,00
1484
Edco
n Me
dical
Aid
Sche
me(2
7)-
(136
)(1
63)
2,38
8,99
(176
)1
187
11-0
,20-3
5,42
(221
)-
82(1
39)
7,74
0,00
-36
2965
-1,26
57,08
--
(112
)(1
12)
2,96
0,00
1513
Eller
ines H
olding
s Med
ical
Aid
Socie
ty(2
)-
0(2
)0,2
00,0
0(7
)-
1(7
)1,0
0-0
,47(0
)-
55
-0,56
-55,8
5-
-(3
)(3
)0,6
70,0
0-
-(7
)(7
)1,4
334
,3815
72En
gen
Medic
al Be
nefit
Fund
(47)
4(1
)(4
3)0,9
50,0
0(1
42)
410
4(3
3)0,8
50,0
0(4
9)4
(21)
(67)
1,88
0,00
--
(38)
(38)
1,21
2,99
(1)
-(5
0)(5
1)1,7
90,0
015
85Ey
ethu
med
Medic
al Sc
heme
(2)
-(2
00)
(202
)3,0
429
,37-
-11
611
6-2
,5897
,05(8
55)
-(1
19)
(974
)22
,532,8
4-
--
-0,0
00,0
0-
--
-0,0
00,0
012
71Fis
hing I
ndus
try M
edica
l Sc
heme
(Fish
med)
--
(129
)(1
29)
12,76
34,64
--
--
0,00
0,00
--
--
0,00
0,85
--
--
0,00
0,00
--
--
0,00
0,00
1086
Food
Wor
kers
Medic
al Be
nefit
Fund
--
--
0,00
0,00
--
--
0,00
0,00
--
--
0,00
0,00
--
--
0,00
0,00
--
--
0,00
0,00
1578
Fosc
hini G
roup
Med
ical
Aid
Sche
me(2
)-
53
-0,09
0,08
(39)
-55
16-0
,600,0
09
-13
514
4-8
,092,5
2-
-(1
74)
(174
)5,5
90,0
0(3
4)-
-(3
4)1,2
20,0
010
82G5
Med
(102
)6
102
6-0
,1111
,08(2
)45
(79)
(36)
0,67
15,06
(285
)1
163
(121
)2,3
85,3
6(1
35)
0(5
7)(1
92)
3,88
-0,15
-0
(127
)(1
27)
2,68
2,80
1270
Golde
n Arro
w Em
ploye
es
Medic
al Be
nefit
Fund
(3)
-(1
23)
(126
)3,0
28,2
2-
--
-0,0
00,0
0-
--
-0,0
00,0
0-
--
-0,0
00,0
0-
--
-0,0
00,0
0
Ref.
Nam
e of
Med
ical S
chem
e20
0420
0320
0220
0120
00No
.Im
paire
dIm
paire
d(In
crease
)/To
tal%
Contr
ibutio
nsIm
paire
dIm
paire
d(In
crease
)/To
tal%
Contr
ibutio
nsIm
paire
dIm
paire
d(In
crease
)/To
tal%
Contr
ibutio
nsIm
paire
dIm
paire
d(In
crease
)/To
tal%
Contr
ibutio
nsIm
paire
dIm
paire
d(In
crease
)/To
tal%
Contr
ibutio
nsRe
ceiva
blesR
eceiv
ables
Decre
aseIm
paire
dof
Non-
Outst
andin
gRe
ceiva
blesR
eceiv
ables
Decre
aseIm
paire
dof
Non-
Outst
andin
gRe
ceiva
blesR
eceiv
ables
Decre
aseIm
paire
dof
Non-
Outst
andin
gRe
ceiva
blesR
eceiv
ables
Decre
aseIm
paire
dof
Non-
Outst
andin
gRe
ceiva
blesR
eceiv
ables
Decre
aseIm
paire
dof
Non-
Outst
andin
gW
ritten
Reco
vered
inRe
ceiva
bles
Healt
hfor
Mor
e tha
nW
ritten
Reco
vered
inRe
ceiva
bles
Healt
hfor
Mor
e tha
nW
ritten
Reco
vered
inRe
ceiva
bles
Healt
hfor
Mor
e tha
nW
ritten
Reco
vered
inRe
ceiva
bles
Healt
hfor
Mor
e tha
nW
ritten
Reco
vered
inRe
ceiva
bles
Healt
hfor
Mor
e tha
nOf
fPro
vision
Expe
n-60
Days
asOf
fPro
vision
Expe
n-60
Days
asOf
fPro
vision
Expe
n-60
Days
asOf
fPro
vision
Expe
n-60
Days
asOf
fPro
vision
Expe
n-60
Days
asfor
Impa
ired
diture
of Ar
rear
for Im
paire
ddit
ureof
Arrea
rfor
Impa
ired
diture
of Ar
rear
for Im
paire
ddit
ureof
Arrea
rfor
Impa
ired
diture
of Ar
rear
Rece
ivable
sCo
ntribu
tions
Rece
ivable
sCo
ntribu
tions
Rece
ivable
sCo
ntribu
tions
Rece
ivable
sCo
ntribu
tions
Rece
ivable
sCo
ntribu
tions
R’00
0R’
000
R’00
0R’
000
%%
R’00
0R’
000
R’00
0R’
000
%%
R’00
0R’
000
R’00
0R’
000
%%
R’00
0R’
000
R’00
0R’
000
%%
R’00
0R’
000
R’00
0R’
000
%%
126 COUNCIL FOR MEDICAL SCHEMES Annual Report 2004-5
ANNEXURE R5
Impa
ired
rec
eiva
bles
: 20
04 r
egis
tere
d sc
hem
esfo
r th
e ye
ar e
nded
31
Dece
mbe
r 20
04Impaired receivables: 2004 registered schemes

1523
Grint
ek E
lectro
nics M
edica
l Ai
d Sc
heme
--
(60)
(60)
2,57
0,00
--
(10)
(10)
0,56
0,61
--
(10)
(10)
0,49
0,00
(72)
--
(72)
6,42
0,00
--
--
0,00
15,00
1487
Holci
m So
uth A
frica
Med
ical
Sche
me(0
)1
(22)
(21)
0,74
122,4
9(1
16)
225
714
3-6
,140,2
6-
-23
923
9-1
0,03
15,63
(688
)-
1293
605
-30,4
670
,32(1
2)-
(167
3)(1
685)
40,33
0,00
1111
IBM (S
A) M
edica
l Aid
Socie
ty(2
16)
-16
0(5
6)1,2
80,8
4-
-(3
01)
(301
)6,0
00,7
5-
-(7
5)(7
5)1,4
80,0
0-
--
-0,0
00,7
9-
--
-0,0
00,0
015
91Im
pala
Medic
al Pla
n-
--
-0,0
00,0
0-
--
-0,0
010
0,00
--
--
0,00
0,00
N/A
N/A
N/A
N/A
N/A
N/A
N/A
N/A
N/A
N/A
N/A
N/A
1559
Impe
rial G
roup
Med
ical
Sche
me(1
63)
-(7
83)
(946
)10
,5335
,60(1
47)
1635
021
9-3
,6910
,41(1
326)
-14
9817
2-2
,9224
,70(6
)-
(722
)(7
28)
13,32
34,54
(39)
-(9
48)
(987
)20
,8930
,7411
21Kl
erks
dorp
Med
ical B
enefi
t So
ciety
(KDM
)(6
50)
9150
(509
)5,9
617
,46(6
34)
120
(208
6)(2
601)
26,82
0,00
(593
)94
(43)
(541
)10
,710,0
0(2
80)
134
63(8
3)2,2
80,0
0(3
77)
58(4
1)(3
60)
9,48
0,00
1145
Lama
f Med
ical S
chem
e(3
574)
-88
(348
6)7,3
89,2
0(2
74)
-(3
50)
(624
)1,8
519
,24-
3-
3-0
,0155
,42(1
81)
--
(181
)0,7
00,0
0(4
58)
--
(458
)1,3
90,0
011
97Lib
care
Med
ical S
chem
e(3
9)-
1145
1106
-12,3
211
,06(5
)65
(130
9)(1
249)
12,73
37,21
(4)
-(4
)(8
)0,1
17,5
4-
-31
731
7-5
,830,8
1-
-(3
00)
(300
)6,6
4-1
3,26
1547
Malco
r Med
ical S
chem
e-
--
-0,0
00,0
0-
--
-0,0
00,0
0-
--
-0,0
00,0
0-
--
-0,0
00,0
0-
--
-0,0
00,0
010
42Ma
scom
Med
ical S
chem
e-
--
-0,0
00,0
0-
--
-0,0
00,0
0-
--
-0,0
00,0
0-
--
-0,0
00,0
0-
--
-0,0
00,0
014
95Ma
ssmar
t Hea
lth P
lan-
2(1
4)(1
3)0,4
412
,47(2
77)
1226
2(3
)0,1
116
1,35
(38)
-24
020
2-8
,18-3
,85(3
64)
-23
6(1
28)
4,03
95,05
(204
)-
(496
)(7
00)
18,14
18,82
1588
MEDC
OR
(1088
18)
-(3
235)
(1120
52)
66,93
47,34
(1040
57)
-(7
457)
(1115
14)
68,51
100,0
5-
-(1
9)(1
9)0,0
50,0
0-
-(6
59)
(659
)3,2
40,0
0N/
AN/
AN/
AN/
AN/
AN/
A 15
48Me
dipos
Med
ical S
chem
e(1
86)
181
717
712
-4,29
10,99
(195
0)-
4371
2421
-24,23
13,45
(707
)-
(541
)(1
249)
9,92
28,52
(37)
-(3
896)
(393
3)26
,6227
,78(5
9)-
(558
)(6
17)
5,56
41,54
1568
Medis
ense
Med
ical S
chem
e(1
373)
-15
7620
3-1
,340,0
0-
-(2
142)
(214
2)11
,78-1
7,70
--
(314
)(3
14)
2,67
0,00
-99
911
2421
23-2
5,03
7,36
(435
)-
(569
)(1
004)
9,75
16,89
1535
Metro
care
(11)
08
(3)
0,07
0,45
(47)
-14
497
-2,37
0,27
--
(46)
(46)
1,17
1,88
--
(21)
(21)
0,54
1,28
--
(55)
(55)
1,51
2,76
1105
Metro
polita
n Med
ical S
chem
e(2
5)-
4217
-0,20
0,00
(71)
1683
28-0
,390,0
0(4
9)6
(11)
(53)
0,89
67,79
(23)
-(8
6)(1
09)
2,09
0,00
(54)
-(4
02)
(456
)27
,150,0
015
69Mi
neme
d Me
dical
Sche
me-
-(4
5)(4
5)0,3
80,0
0-
--
-0,0
00,0
0-
--
-0,0
00,0
0-
--
-0,0
00,0
0-
--
-0,0
00,0
015
66Mo
reme
d Me
dical
Sche
me(1
43)
0(1
55)
(299
)6,9
737
,19(1
07)
3426
519
2-4
,5024
,43(6
96)
-58
4(1
12)
1,69
3,34
(1)
-(5
96)
(598
)8,6
12,2
6-
-24
24-0
,3712
,5312
08Mu
tual
& Fe
dera
l Med
ical
Aid
Fund
(18)
5(2
40)
(253
)4,2
314
4,89
(261
)2
428
168
-3,62
8,87
(5)
-64
59-1
,4622
,62-
-(5
46)
(546
)15
,5131
,96(0
)-
(72)
(72)
2,86
11,24
1154
Namp
ak G
roup
Med
ical A
id-
-17
817
8-1
,550,6
7-
-(1
08)
(108
)0,9
80,0
0-
-(1
79)
(179
)1,7
50,0
0(1
56)
-(8
9)(2
46)
2,29
0,00
--
(368
)(3
68)
4,32
5,58
1241
Nasp
ers M
edica
l Fun
d(9
1)-
6(8
4)0,9
00,0
0(1
11)
-36
(75)
0,97
0,00
(277
)-
315
37-0
,510,0
0(1
89)
-12
5(6
3)2,6
20,0
0(1
7)-
(90)
(107
)22
,0798
,4214
69Ne
dcor
Med
ical A
id Sc
heme
(11)
4(2
522)
(252
8)15
,5772
,40(1
72)
-11
1394
2-3
,6239
,87(1
)-
874
872
-4,58
79,42
(2)
-(1
340)
(134
2)7,9
492
,13(3
2)-
783
752
-6,23
65,80
1584
Netca
re M
edica
l Sch
eme
--
(314
)(3
14)
1,47
5,89
--
(138
)(1
38)
0,73
0,00
(273
)-
123
(150
)0,9
80,0
0(8
8)-
(109
9)(1
187)
9,91
0,00
--
--
0,00
0,00
1214
Old
Mutu
al Sta
ff Me
dical
Aid
Sche
me(1
103)
5514
0435
6-1
,7425
,75(5
95)
-24
1(3
53)
1,96
86,36
(218
)-
332
114
-0,74
54,14
(133
)-
(891
)(1
024)
7,20
85,63
(41)
-(1
68)
(209
)1,6
991
,0214
41Pa
rmed
Med
ical A
id Sc
heme
(0)
-(1
082)
(108
3)22
,2271
,98(1
)-
(293
)(2
95)
8,28
78,90
(30)
010
0998
0-5
2,09
43,31
(38)
-93
289
4-56
,820,0
0(4
26)
-(2
948)
(337
4)62
,0590
,0115
15PG
Biso
n Med
ical A
id So
ciety
--
(14)
(14)
1,03
0,00
(56)
-(1
48)
(204
)14
,200,0
0-
-17
17-1
,520,0
0(1
88)
-(6
8)(2
56)
14,56
39,08
(158
)-
-(1
58)
14,62
9,26
1186
PG G
roup
Med
ical S
chem
e(1
4)22
0(3
7)16
9-8
,490,0
0(3
3)-
(120
)(1
53)
6,16
0,00
(33)
-17
(16)
0,85
0,00
-20
(111
)(9
1)9,9
70,0
0(1
9)32
1(8
3)21
8-12
,520,0
015
63Pic
k & P
ay M
edica
l Sch
eme
(39)
831
(0)
0,00
1,49
(61)
622
(33)
0,38
0,00
(93)
1510
123
-0,29
0,00
(155
)-
(208
)(3
63)
3,92
6,29
--
(435
)(4
35)
6,04
0,00
1583
Platin
um H
ealth
(28)
-(2
376)
(240
4)38
,7353
,00(0
)-
-(0
)0,0
142
,04(4
20)
-(9
21)
(134
0)22
,2919
,12-
-72
872
8-36
5,22
17,65
-1
(130
5)(1
304)
339,9
4-1
1,03
1194
Prof
med
(877
)29
2057
1210
-1,88
71,53
(695
)-
(350
0)(4
195)
6,38
108,5
7(1
1)-
-(1
1)0,0
326
,88-
--
-0,0
09,5
7-
--
-0,0
09,4
315
16Q
uant
um M
edica
l Aid
Socie
ty(5
8)0
(67)
(125
)0,8
63,6
8-
-24
124
1-1
,490,2
5(5
0)-
15(3
6)0,2
8-0
,96(6
8)-
(489
)(5
57)
4,58
1,72
(49)
-(1
03)
(152
)1,4
515
,3212
01Ra
nd W
ater M
edica
l Sch
eme
(153
)-
-(1
53)
9,25
66,69
--
--
0,00
0,00
--
--
0,00
0,00
--
--
0,00
0,00
--
--
0,00
100,0
014
30Re
medi
Medic
al Ai
d Sc
heme
(13)
163
51-0
,300,3
9(8
2)-
67(1
5)0,1
028
,39(1
142)
-11
6422
-0,18
23,82
--
(148
9)(1
489)
9,96
63,79
--
--
0,00
0,00
1176
Retai
l Med
ical S
chem
e(9
)-
(10)
(19)
0,19
0,00
--
1212
-0,39
0,00
--
(101
)(1
01)
4,03
0,00
(346
)-
(59)
(405
)8,9
50,0
0(1
82)
-(1
96)
(378
)5,1
90,0
012
09SA
Bre
werie
s Med
ical A
id So
ciety
(49)
-67
18-0
,190,0
0(1
02)
1012
735
-0,41
0,00
(178
)1
124
(53)
0,69
-42,5
9(1
03)
0(8
0)(1
83)
3,06
109,1
7-
0(1
59)
(159
)2,8
327
,4814
24SA
BC M
edica
l Aid
Sche
me(3
4)9
(143
)(1
68)
2,96
49,75
(70)
248
(20)
0,39
82,62
(123
)0
22(1
02)
2,02
-413
,06(1
78)
113
8(3
8)0,7
60,8
5-
046
46-0
,9910
1,99
1557
Sama
ncor
Hea
lth P
lan(1
25)
5(5
3)(1
73)
1,90
13,46
(109
)14
79(1
6)0,2
82,8
8(1
370)
-17
9442
3-8
,567,5
5(1
7)-
(15)
(32)
0,54
48,12
(309
)-
(448
)(7
56)
12,55
27,52
1038
SAMW
UMed
(305
)-
(102
)(4
07)
2,37
15,00
(30)
-(5
53)
(583
)4,7
914
,00-
-54
54-0
,590,0
0(1
057)
-40
0(6
57)
6,93
0,00
--
(500
)(5
00)
6,43
0,00
1527
Sapp
i Med
ical A
id Sc
heme
(92)
783
(2)
0,04
0,71
(143
)15
340
212
-3,87
0,50
--
3737
-0,77
0,57
--
(261
)(2
61)
4,13
0,00
(468
)-
-(4
68)
8,51
0,16
1234
Saso
lmed
(974
)26
1200
252
-0,60
0,00
(156
6)4
2524
961
-2,37
9,76
(866
)1
(113
7)(2
002)
5,21
1,53
-0
231
231
-0,89
0,00
(600
)-
961
361
-2,63
0,00
1531
Sedm
ed-
--
-0,0
00,0
0-
--
-0,0
00,0
0-
--
-0,0
00,0
0-
--
-0,0
00,0
0-
--
-0,0
00,0
012
43Sie
mens
Med
ical S
chem
e(6
2)1
58(3
)0,0
61,4
3(1
8)0
(94)
(112
)1,8
00,0
6-
-41
41-0
,59-0
,10-
--
-0,0
035
,00-
--
-0,0
00,0
015
80So
uth A
frica
n Po
lice S
ervic
e Me
dical
Sche
me (P
OLM
ED)
-33
8(1
859)
(152
1)0,6
891
,34(7
565)
0(2
884)
(104
49)
4,50
83,09
-4
(953
7)(9
533)
3,95
76,68
-28
(497
)(4
70)
0,22
85,67
--
(371
3)(3
713)
2,34
81,58
1254
Stock
smed
(105
)8
111
14-1
,043,6
6(2
09)
1225
356
-4,53
3,75
(46)
-58
12-0
,7519
,16-
-84
84-5
,270,3
1-
-(4
06)
(406
)19
,2078
,9215
44Tig
er B
rands
Med
ical S
chem
e-
--
-0,0
01,7
1-
--
-0,0
03,7
1-
--
-0,0
02,5
8-
--
-0,0
016
,90-
--
-0,0
022
,3015
82Tr
ansm
ed M
edica
l Fun
d-
55(3
70)
(315
)0,2
43,7
6-
-(9
89)
(989
)0,7
539
,06(5
231)
-52
343
0,00
38,89
--
(673
4)(6
734)
5,91
57,54
(1281
8)-
5594
(722
4)6,3
45,5
315
79Ts
ogo
Sun
Grou
p Me
dical
Sche
me(3
3)-
4614
-0,26
13,73
--
(94)
(94)
1,59
8,54
--
(69)
(69)
1,13
0,00
(40)
--
(40)
0,69
0,00
(76)
-12
953
-1,76
0,00
Ref.
Nam
e of
Med
ical S
chem
e20
0420
0320
0220
0120
00No
.Im
paire
dIm
paire
d(In
crease
)/To
tal%
Contr
ibutio
nsIm
paire
dIm
paire
d(In
crease
)/To
tal%
Contr
ibutio
nsIm
paire
dIm
paire
d(In
crease
)/To
tal%
Contr
ibutio
nsIm
paire
dIm
paire
d(In
crease
)/To
tal%
Contr
ibutio
nsIm
paire
dIm
paire
d(In
crease
)/To
tal%
Contr
ibutio
nsRe
ceiva
blesR
eceiv
ables
Decre
aseIm
paire
dof
Non-
Outst
andin
gRe
ceiva
blesR
eceiv
ables
Decre
aseIm
paire
dof
Non-
Outst
andin
gRe
ceiva
blesR
eceiv
ables
Decre
aseIm
paire
dof
Non-
Outst
andin
gRe
ceiva
blesR
eceiv
ables
Decre
aseIm
paire
dof
Non-
Outst
andin
gRe
ceiva
blesR
eceiv
ables
Decre
aseIm
paire
dof
Non-
Outst
andin
gW
ritten
Reco
vered
inRe
ceiva
bles
Healt
hfor
Mor
e tha
nW
ritten
Reco
vered
inRe
ceiva
bles
Healt
hfor
Mor
e tha
nW
ritten
Reco
vered
inRe
ceiva
bles
Healt
hfor
Mor
e tha
nW
ritten
Reco
vered
inRe
ceiva
bles
Healt
hfor
Mor
e tha
nW
ritten
Reco
vered
inRe
ceiva
bles
Healt
hfor
Mor
e tha
nOf
fPro
vision
Expe
n-60
Days
asOf
fPro
vision
Expe
n-60
Days
asOf
fPro
vision
Expe
n-60
Days
asOf
fPro
vision
Expe
n-60
Days
asOf
fPro
vision
Expe
n-60
Days
asfor
Impa
ired
diture
of Ar
rear
for Im
paire
ddit
ureof
Arrea
rfor
Impa
ired
diture
of Ar
rear
for Im
paire
ddit
ureof
Arrea
rfor
Impa
ired
diture
of Ar
rear
Rece
ivable
sCo
ntribu
tions
Rece
ivable
sCo
ntribu
tions
Rece
ivable
sCo
ntribu
tions
Rece
ivable
sCo
ntribu
tions
Rece
ivable
sCo
ntribu
tions
R’00
0R’
000
R’00
0R’
000
%%
R’00
0R’
000
R’00
0R’
000
%%
R’00
0R’
000
R’00
0R’
000
%%
R’00
0R’
000
R’00
0R’
000
%%
R’00
0R’
000
R’00
0R’
000
%%
COUNCIL FOR MEDICAL SCHEMES Annual Report 2004-5 127
ANNEXURE R5
Impa
ired
rec
eiva
bles
: 20
04 r
egis
tere
d sc
hem
esfo
r th
e ye
ar e
nded
31
Dece
mbe
r 20
04Impaired receivables: 2004 registered schemes

1434
Umed
(260
)-
-(2
60)
1,54
12,98
(122
)-
(82)
(204
)1,3
520
,06(1
77)
--
(177
)1,2
513
,93(3
98)
812
6(2
65)
2,10
51,62
(125
)-
(17)
(142
)1,5
08,9
715
97Um
vuzo
Hea
lth M
edica
l Sc
heme
--
(12)
(12)
0,73
9,56
N/A
N/A
N/A
N/A
N/A
N/A
N/A
N/A
N/A
N/A
N/A
N/A
N/A
N/A
N/A
N/A
N/A
N/A
N/A
N/A
N/A
N/A
N/A
N/A
1520
Unive
rsity
of N
atal M
edica
l Sc
heme
(0)
-(2
)(2
)0,0
40,0
0(1
8)-
(26)
(44)
0,88
0,00
(52)
-(1
50)
(202
)4,8
40,0
0(0
)-
-(0
)0,0
00,0
0-
--
-0,0
00,0
012
82Un
iversi
ty of
the W
itwate
rs-ran
d Staf
f Med
ical A
id Sc
heme
(147
)-
814
668-
13,12
55,44
(283
)15
273
4-0
,08-1
06,65
(13)
1(7
)(1
9)0,4
176
,33(2
67)
048
321
5-4
,9838
,22-
0(2
07)
(206
)6,3
515
,0915
65Ve
nda P
olice
and P
rison
s Me
dical
Sche
me (P
olpris
med)
--
--
0,00
N/A
--
--
0,00
0,00
--
--
0,00
0,00
--
--
0,00
0,00
--
--
0,00
0,00
1291
Witb
ank C
oalfie
lds M
edica
l Ai
d Sc
heme
(87)
0-
(87)
1,20
0,00
(84)
4-
(80)
1,14
0,00
(74)
19-
(55)
0,67
0,00
(58)
4(3
50)
(404
)7,1
90,0
0(1
11)
3-
(108
)2,4
60,0
012
93W
ooltr
u He
althc
are F
und
(37)
018
(18)
0,13
0,00
(14)
08
(7)
0,05
0,00
(77)
183
6-0
,054,3
6(3
63)
1460
525
7-2
,6510
0,00
(111
)-
(753
)(8
64)
9,62
0,00
1253
Xstra
ta Me
dical
Aid
Sche
me(4
0)-
167
127
-1,82
1,12
(6)
-99
93-1
,473,1
7(9
9)-
(90)
(189
)3,1
11,3
0(7
7)-
(85)
(162
)3,5
00,8
8-
-(1
46)
(146
)3,6
34,0
1
SUB-
TOTA
L –
Regis
tere
d Re
strict
ed Sc
heme
s(1
2159
9)14
43(4
402)
(1245
59)
8,58
14,60
(1251
36)
634
(795
0)(1
3245
2)9,6
713
,93(1
7879
)22
025
54(1
5106
)1,3
418
,01(7
830)
1288
(163
60)
(229
02)
2,35
21,02
(207
18)
870
(161
14)
(359
62)
3,91
17,63
TOTA
L RE
GIST
ERED
SCH
EMES
(2468
22)
7239
2815
9(21
1424
)2,9
613
,54(16
9771
)40
24(15
3862
)(31
9610
)4,8
424
,70(10
4532
)23
68(3
1595
)(13
3759
)2,3
216
,52(12
1802
)12
081
(845
35)(
1942
56)
3,68
28,16
(7758
2)10
948
(7906
0)(14
5694
)3,8
025
,89
Ref.
Nam
e of
Med
ical S
chem
e20
0420
0320
0220
0120
00No
.Im
paire
dIm
paire
d(In
crease
)/To
tal%
Contr
ibutio
nsIm
paire
dIm
paire
d(In
crease
)/To
tal%
Contr
ibutio
nsIm
paire
dIm
paire
d(In
crease
)/To
tal%
Contr
ibutio
nsIm
paire
dIm
paire
d(In
crease
)/To
tal%
Contr
ibutio
nsIm
paire
dIm
paire
d(In
crease
)/To
tal%
Contr
ibutio
nsRe
ceiva
blesR
eceiv
ables
Decre
aseIm
paire
dof
Non-
Outst
andin
gRe
ceiva
blesR
eceiv
ables
Decre
aseIm
paire
dof
Non-
Outst
andin
gRe
ceiva
blesR
eceiv
ables
Decre
aseIm
paire
dof
Non-
Outst
andin
gRe
ceiva
blesR
eceiv
ables
Decre
aseIm
paire
dof
Non-
Outst
andin
gRe
ceiva
blesR
eceiv
ables
Decre
aseIm
paire
dof
Non-
Outst
andin
gW
ritten
Reco
vered
inRe
ceiva
bles
Healt
hfor
Mor
e tha
nW
ritten
Reco
vered
inRe
ceiva
bles
Healt
hfor
Mor
e tha
nW
ritten
Reco
vered
inRe
ceiva
bles
Healt
hfor
Mor
e tha
nW
ritten
Reco
vered
inRe
ceiva
bles
Healt
hfor
Mor
e tha
nW
ritten
Reco
vered
inRe
ceiva
bles
Healt
hfor
Mor
e tha
nOf
fPro
vision
Expe
n-60
Days
asOf
fPro
vision
Expe
n-60
Days
asOf
fPro
vision
Expe
n-60
Days
asOf
fPro
vision
Expe
n-60
Days
asOf
fPro
vision
Expe
n-60
Days
asfor
Impa
ired
diture
of Ar
rear
for Im
paire
ddit
ureof
Arrea
rfor
Impa
ired
diture
of Ar
rear
for Im
paire
ddit
ureof
Arrea
rfor
Impa
ired
diture
of Ar
rear
Rece
ivable
sCo
ntribu
tions
Rece
ivable
sCo
ntribu
tions
Rece
ivable
sCo
ntribu
tions
Rece
ivable
sCo
ntribu
tions
Rece
ivable
sCo
ntribu
tions
R’00
0R’
000
R’00
0R’
000
%%
R’00
0R’
000
R’00
0R’
000
%%
R’00
0R’
000
R’00
0R’
000
%%
R’00
0R’
000
R’00
0R’
000
%%
R’00
0R’
000
R’00
0R’
000
%%
Note
s:a
Dra
ft a
nn
ual
fin
anci
al s
tate
men
ts w
ere
sub
mit
ted
fo
r 20
04.
•Th
e co
mp
arit
ive
figu
res
wer
e o
nly
in
clu
ded
fo
r th
ose
sch
emes
th
at w
ere
in o
per
atio
nd
uri
ng
2004
.
The
foll
owin
g sc
hem
es a
mal
gam
ated
in
th
e 20
04 y
ear:
- A
llca
re w
ith
NB
C w
ith
eff
ect
fro
m 1
Jan
uar
y 20
04.
- A
ngl
ogo
ld w
ith
Dis
cove
ry H
ealt
h w
ith
eff
ect
fro
m 1
Ju
ne
2004
.-
Myh
ealt
h w
ith
Oxy
gen
wit
h e
ffec
t fr
om
1 J
uly
200
4.-
Bil
lmed
wit
h S
aman
cor
wit
h e
ffec
t fr
om
1 J
uly
200
4.
•Th
ere
are
no
co
mp
arit
ive
figu
res
for
the
colo
r co
ded
sch
emes
du
e to
:-
Sch
emes
wer
e re
gist
ered
du
rin
g th
e 20
04 y
ear.
128 COUNCIL FOR MEDICAL SCHEMES Annual Report 2004-5
ANNEXURE R5
Impa
ired
rec
eiva
bles
: 20
04 r
egis
tere
d sc
hem
esfo
r th
e ye
ar e
nded
31
Dece
mbe
r 20
04Impaired receivables: 2004 registered schemes

3456
Aut
owor
kers
Med
ical
Aid
Fun
d (A
utom
ed)
2722
268
303
1,51
155
738
202
1345
28,
6417
-0,
00-
-83
,72
2535
711
906
1024
321
355
157
414
157
310
101,
01a
3514
Barg
aini
ng C
ounc
il fo
r th
e Bu
ildin
g In
dust
ry (K
imbe
rly)
146
209
0,43
103
538
055
453
,52
203
-0,
00-
-24
,73
779
225
225
353
211
42
114
204,
1733
22Bu
ildin
g In
dust
ry M
edic
al A
id F
und
(Eas
tern
Cap
e)67
11
776
1,65
406
017
988
321
,74
39-
0,00
--
75,4
699
611
411
413
312
120,
3033
02Bu
ildin
g In
dust
ry M
edic
al A
id F
und
(Wes
tern
Cap
e)3
398
1158
02,
4112
074
872
678
22,1
819
-0,
00-
-65
,24
419
71
518
151
81
874
367
23
672
30,4
133
04C
loth
ing
Indu
stry
Hea
lth C
are
Fund
(C
ape
Tow
n)35
229
9106
21,
5829
094
2810
014
34,4
210
988
033
,96
10-
5,21
952
1(1
037
3)(1
167
7)(6
018)
2748
024
180
83,1
133
27C
loth
ing
Indu
stry
Med
ical
Ben
efit
Sche
me
(Fre
e St
ate
& N
othe
rn C
ape)
543
543
-26
341
4818
,24
7-
0,00
--
86,9
937
(11)
(11)
5352
850
519
1,78
3339
Clo
thin
g In
dust
ry M
edic
al B
enef
it So
ciet
y (N
orth
ern
Are
as)
633
06
330
-3
936
5274
118
,82
10-
0,00
--
82,8
267
6(6
4)(6
4)14
42
165
216
555
,00
3318
Clo
thin
g In
dust
ry S
ick
Bene
fit F
und
(Nat
al)
1668
916
689
-11
312
563
969
35,0
920
-0,
00-
-35
,72
549
81
529
152
22
587
1401
714
017
123,
9234
19K
nitt
ing
Indu
stry
Med
ical
Ben
efit
Soci
ety
(Nor
ther
n A
reas
)42
853
30,
2525
139
5220
,63
8-
0,00
--
58,1
750
(1)
(1)
204
218
32
100
838,
2833
24M
otor
Indu
stry
Med
ical
Aid
Fun
d (M
IMED
)24
214
5382
41,
2245
914
171
117
245
3,76
2710
176
2,22
16-
85,7
565
368
3794
737
447
5330
722
684
022
684
049
,41
3479
Nat
al F
urni
ture
Wor
kers
Sic
k Be
nefit
So
ciet
y1
466
146
6-
208
611
91
052
50,4
660
-0,
00-
-47
,60
109
340
4028
42
444
211
910
1,59
3314
Nat
al H
aird
ress
ers
Sick
Ben
efit
Fund
722
788
0,09
488
5215
3,06
2-
0,00
--
101,
46(7
)(2
2)(2
2)(4
3)51
051
010
4,56
TOTA
L B
AR
GA
ININ
G C
OU
NC
IL S
CH
EMES
117
058
253
103
1,16
679
478
224
5070
37,
4617
2005
62,
957
-80
,34
113
566
4280
839
335
7423
343
937
943
554
464
,10
Ref.
Nam
e of
Med
ical
Sch
eme
No.o
fGr
oss
Gros
s Adm
inistr
ation
Ma
nage
d Ca
re:
Nett
Nett
Claim
sGr
oss
Nett
Surp
lus/
Nett
Nett
Asse
tsNe
tt As
sets
Solve
ncy
No.
Memb
ers
Bene
ficiar
iesDe
pend
ants
Cont
ribut
ions
Expe
nses
(RISK
+PM
SA)
Mana
geme
nt Se
rvice
sRe
insur
ance
Inc
urre
d:Un
derw
riting
Unde
rwrit
ing
(Defi
cit)
Surp
lus/
(Mem
bers’
Per
Ratio
per M
embe
rRe
sults
Nett
Resu
ltsRe
sults
from
(Defi
cit)
Fund
sRe
gulat
ionCo
ntribu
tions
Ope
ratio
nspe
r BS)
29PA
BPM
As %
of
PABP
MAs
% o
fPA
BPM
31/12
/0431
/12/04
R’00
0R
R’00
0GC
IR
R’00
0GC
IR
R’00
0%
R’00
0R’
000
R’00
0R’
000
R’00
0R’
000
%
Note
s:a
An
en
cum
ber
ed a
sset
was
exc
lud
ed i
n t
he
2004
cal
cula
tio
n o
f th
e so
lven
cy r
atio
.
•P
MSA
= P
erso
nal
Med
ical
Sav
ings
Acc
ou
nt
•G
CI
= G
ross
Co
ntr
ibu
tio
n I
nco
me
•PA
BP
M =
Per
Ave
rage
Ben
efic
iary
Per
Mo
nth
•B
S =
Bal
ance
Sh
eet
•N
o b
roke
r fe
es w
ere
pai
d b
y th
e sc
hem
es
COUNCIL FOR MEDICAL SCHEMES Annual Report 2004-5 129
ANNEXURE S5
Deta
iled
fina
ncia
l re
sult
s: b
arga
inin
g co
unci
l sc
hem
esfo
r th
e ye
ar e
nded
31
Dece
mbe
r 20
04Detailed financial results: bargaining council schemes
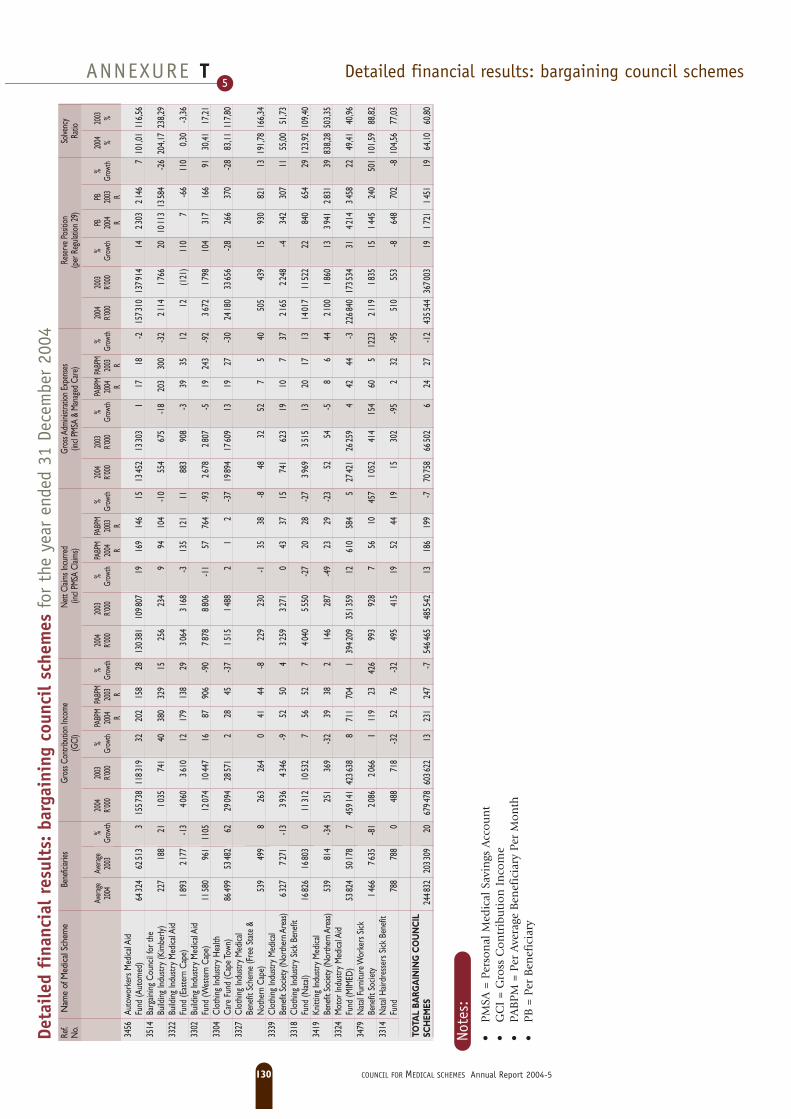
Ref.
Nam
e of
Med
ical S
chem
eBe
nefic
iaries
Gros
s Con
tribu
tion
Incom
e Ne
tt Cl
aims I
ncur
red
Gros
s Adm
inistr
ation
Exp
ense
s Re
serv
e Pos
ition
Solve
ncy
No.
(GCI
)(in
cl PM
SA C
laims
)(in
cl PM
SA &
Man
aged
Care
)(p
er R
egula
tion
29)
Ratio
Aver
ageAv
erage
%20
0420
03%
PABP
MPA
BPM
%20
0420
03%
PABP
MPA
BPM
%20
0420
03%
PABP
MPA
BPM
%20
0420
03%
PBPB
%20
0420
0320
0420
03Gr
owth
R’000
R’000
Grow
th20
0420
03Gr
owth
R’000
R’000
Grow
th20
0420
03Gr
owth
R’000
R’000
Grow
th20
0420
03Gr
owth
R’000
R’000
Grow
th20
0420
03Gr
owth
%%
RR
RR
RR
RR
3456
Auto
work
ers M
edica
l Aid
Fund
(Aut
omed
)64
324
6251
33
1557
3811
8319
3220
215
828
1303
8110
9807
1916
914
615
1345
213
303
117
18-2
1573
1013
7914
1423
0321
467
101,0
111
6,56
3514
Barg
aining
Cou
ncil
for t
he
Build
ing In
dustr
y (K
imbe
rly)
227
188
2110
3574
140
380
329
1525
623
49
9410
4-1
055
467
5-1
820
330
0-3
221
1417
6620
1011
313
584
-26
204,1
723
8,29
3322
Build
ing In
dustr
y M
edica
l Aid
Fu
nd (E
aste
rn C
ape)
1893
2177
-13
4060
3610
1217
913
829
3064
3168
-313
512
111
883
908
-339
3512
12(1
21)
110
7-6
611
00,3
0-3
,3633
02Bu
ilding
Indu
stry
Med
ical A
id
Fund
(Wes
tern
Cap
e)11
580
961
1105
1207
410
447
1687
906
-90
7878
8806
-11
5776
4-9
326
7828
07-5
1924
3-9
236
7217
9810
431
716
691
30,41
17,21
3304
Clot
hing
Indu
stry
Hea
lth
Care
Fun
d (C
ape T
own)
8649
953
482
6229
094
2857
12
2845
-37
1515
1488
21
2-3
719
894
1760
913
1927
-30
2418
033
656
-28
266
370
-28
83,11
117,8
033
27Cl
othin
g In
dustr
y M
edica
l Be
nefit
Sch
eme
(Fre
e St
ate
& N
othe
rn C
ape)
539
499
826
326
40
4144
-822
923
0-1
3538
-848
3252
75
4050
543
915
930
821
1319
1,78
166,3
433
39Cl
othin
g In
dustr
y M
edica
l Be
nefit
Soc
iety (
Nor
ther
n Are
as)
6327
7271
-13
3936
4346
-952
504
3259
3271
043
3715
741
623
1910
737
2165
2248
-434
230
711
55,00
51,73
3318
Clot
hing
Indu
stry
Sick
Bene
fit
Fund
(Nat
al)16
826
1680
30
1131
210
532
756
527
4040
5550
-27
2028
-27
3969
3515
1320
1713
1401
711
522
2284
065
429
123,9
210
9,40
3419
Knitt
ing In
dustr
y M
edica
l Be
nefit
Soc
iety (
Nor
ther
n Are
as)
539
814
-34
251
369
-32
3938
214
628
7-4
923
29-2
352
54-5
86
4421
0018
6013
3941
2831
3983
8,28
503,3
533
24M
otor
Indu
stry
Med
ical A
id
Fund
(MIM
ED)
5382
450
178
745
9141
4236
388
711
704
139
4209
3513
5912
610
584
527
421
2625
94
4244
-322
6840
1735
3431
4214
3458
2249
,4140
,9634
79N
atal
Furn
iture
Wor
kers
Sick
Be
nefit
Soc
iety
1466
7635
-81
2086
2066
111
923
426
993
928
756
1045
710
5241
415
460
512
2321
1918
3515
1445
240
501
101,5
988
,8233
14N
atal
Hair
dres
sers
Sick
Ben
efit
Fund
788
788
048
871
8-3
252
76-3
249
541
519
5244
1915
302
-95
232
-95
510
553
-864
870
2-8
104,5
677
,03
TOTA
L BA
RGA
ININ
G C
OU
NC
IL
SCH
EMES
2448
3220
3309
2067
9478
6036
2213
231
247
-754
6465
4855
4213
186
199
-770
758
6650
26
2427
-12
4355
4436
7003
1917
2114
5119
64,10
60,80
Note
s:•
PM
SA =
Per
son
al M
edic
al S
avin
gs A
cco
un
t•
GC
I =
Gro
ss C
on
trib
uti
on
In
com
e•
PAB
PM
= P
er A
vera
ge B
enef
icia
ry P
er M
on
th•
PB
= P
er B
enef
icia
ry
130 COUNCIL FOR MEDICAL SCHEMES Annual Report 2004-5
ANNEXURE T5
Deta
iled
fina
ncia
l re
sult
s: b
arga
inin
g co
unci
l sc
hem
esfo
r th
e ye
ar e
nded
31
Dece
mbe
r 20
04Detailed financial results: bargaining council schemes

• The following medical schemes changed their names during 2004:
Ref no. New name Old name With effect from
1487 The Holcim South Africa
Medical Scheme Alpha Group Medical Scheme 2-Feb-04
1042 Mascom Medical Scheme Chamber of Mines Medical Aid Society 1-Jul-04
1115 Biz Health Medical Scheme Johannesburg Metropolitan Chamber of Commerce 1-Jul-04
1579 Southern Sun Medical Aid Scheme Tsogo Sun Group Medical Scheme 1-Sep-04
1589 Baymed Co-ordinated Health Plan 24-Nov-04
• The following amalgamations took place during 2004:
Ref no. Name Scheme amalgamated with Ref no: With effect from
1496 Allcare Medical Aid Scheme NBC Medical Scheme 1170 1-Jan-04
1503 Anglogold Medical Scheme Discovery Health Medical Scheme 1125 1-Jun-04
1148 Myhealth Medical Scheme Oxygen 1215 1-Jul-04
1089 Billmed Medical Scheme Samancor Health Plan 1557 1-Jul-04
• The following medical schemes were wound up during 2004:
Ref no. Name
1177 Highveld Medical Scheme
• The following medical schemes began operations during 2004:
Ref no. Name With effect from
1596 Eclipse Medical Scheme 1-Apr-04
1597 Umvuzo Health Medical Scheme 1-Jul-04
1589 Baymed (registered in 2001) 1-Nov-04
• The following schemes submitted draft financial statements:
Ref no. Name
1537 Hosmed Medical Aid Scheme
3456 Autoworkers Medical Aid Fund (Automed)
3514 Bargaining Council for the Building Industry (Kimberly)
3304 Clothing Industry Health Care Fund (Cape Town)
3327 Clothing Industry Medical Benefit Scheme (Free State & Nothern Cape)
3339 Clothing Industry Medical Benefit Society (Northern Areas)
3318 Clothing Industry Sick Benefit Fund (Natal)
3419 Knitting Industry Medical Benefit Society (Northern Areas)
3479 Natal Furniture Workers Sick Benefit Society
3314 Natal Hairdressers Sick Benefit Fund
COUNCIL FOR MEDICAL SCHEMES Annual Report 2004-5 131
ANNEXURES5Explanatory notes to the annexures

• Projections were made in respect of the non-financial data with regards to the following
schemes:
Ref no. Name
3456 Autoworkers Medical Aid Fund (Automed)
3302 Building Industry Medical Aid Fund (Western Cape)
3318 Clothing Industry Sick Benefit Fund (Natal)
3324 Motor Industry Medical Aid Fund (MIMED)
3479 Natal Furniture Workers Sick Benefit Society
3314 Natal Hairdressers Sick Benefit Fund
• The 2003 comparative figures have been restated for the following schemes as a result of:
Ref no. Name Reason
1534 Altron Medical Aid Scheme Specific reserves transferred to accumulated funds
1012 Anglo American Corporation Medical
Scheme (AACMED) Reclassification
1593 Built Environment Professional
Associations Medical Scheme (BEPS) Reclassification
1202 Fedhealth Reclassification
1086 Food Workers Medical Benefit Fund Change in accounting policy
1162 Global Health Reclassification
1559 Imperial Group Medical Scheme Specific reserves transferred to accumulated funds
1576 Liberty Medical Scheme Reclassification
1495 Massmart Health Plan Reclassification
1560 Openplan Medical Scheme Reclassification
1583 Platinum Health Reclassification
1454 Pro Sano Medical Scheme Consolidation
1516 Quantum Medical Aid Society Change in accounting policy
1430 Remedi Medical Aid Scheme Reclassification
1209 SA Breweries Medical Aid Society Reclassification
1531 Sedmed Restatement
1422 Topmed Medical Scheme Reclassification
1582 Transmed Medical Fund Reclassification
1291 Witbank Coalfields Medical Aid Scheme Reclassification
1293 Wooltru Healthcare Fund Specific reserves transferred to accumulated funds
Although Klerksdorp Medical Benefit Society (KDM) submitted consolidated accounts for 2004,
the 2003 comparatives were not restated.
• Please take note that the figures were rounded off in the report; hence the percentage vari-
ance will be different to that in the Annexures
• Bargaining Council Schemes were formerly known as Exempt Schemes
132 COUNCIL FOR MEDICAL SCHEMES Annual Report 2004-5
ANNEXURES5
Explanatory notes to the annexures continued

Produced by the Council for Medical Schemes,
Designed by Shahn Irwin
COUNCIL FOR MEDICAL SCHEMES