count your smiles - michigan.gov · received an oral health kit that included a toothbrush,...
TRANSCRIPT

Count Your Smiles
2 0 0 5 - 2 0 0 6

Acknowledgements
State of MichiganGovernor Jennifer M. Granholm
Michigan Department of Community HealthDirector Janet Olszewski
Public Health AdministrationChief Administrative Officer Jean C. Chabut
Bureau of Family, Maternal, & Child HealthDirector Gary Kirk
Division of Family and Community HealthDirector Brenda Fink
Michael Paustian, MS
Sheila Semler, PhD
Michael Manz, DDS
Paula Bates, RDH
This report was prepared through a collaborative between the Michigan Department ofCommunity Health Division of Epidemiology and the Division of Family and Community Health.The development of this report was funded through cooperative agreement PA #033022 betweenthe Michigan Department of Community Health and the Centers for Disease Control andPrevention. Technical assistance was provided through the Association of State and TerritorialDental Directors. The Michigan Department of Community Health is an equal opportunity employer, services and programs provider.
Count Your Smiles i
A u g u s t 2 0 0 6
Table of Contents
Executive Summary. . . . . . . . . . . . . . . . . . . . . . . . . . . . . . . . . . . . . . . . . 1Introduction . . . . . . . . . . . . . . . . . . . . . . . . . . . . . . . . . . . . . . . . . . . . . . . 3Methods . . . . . . . . . . . . . . . . . . . . . . . . . . . . . . . . . . . . . . . . . . . . . . . . . . 4
Selection of Schools . . . . . . . . . . . . . . . . . . . . . . . . . . . . . . . . . . . . . . 4Recruitment of Participants . . . . . . . . . . . . . . . . . . . . . . . . . . . . . . . . . 4Survey of Parents . . . . . . . . . . . . . . . . . . . . . . . . . . . . . . . . . . . . . . . . 5Oral Screening of Children . . . . . . . . . . . . . . . . . . . . . . . . . . . . . . . . . 5Analysis . . . . . . . . . . . . . . . . . . . . . . . . . . . . . . . . . . . . . . . . . . . . . . . . 6
Population Demographics & Response Rates . . . . . . . . . . . . . . . . . . . 7Caries Experience . . . . . . . . . . . . . . . . . . . . . . . . . . . . . . . . . . . . . . . . . . 8Untreated Dental Disease . . . . . . . . . . . . . . . . . . . . . . . . . . . . . . . . . . . . 10Urgency of Needed Dental Care. . . . . . . . . . . . . . . . . . . . . . . . . . . . . . . 12Toothache When Biting or Chewing . . . . . . . . . . . . . . . . . . . . . . . . . . . 15Dental Visit in the Past Year . . . . . . . . . . . . . . . . . . . . . . . . . . . . . . . . . . 17Problem Obtaining Dental Care in Past Year . . . . . . . . . . . . . . . . . . . . 19Sealants Present on First Molars. . . . . . . . . . . . . . . . . . . . . . . . . . . . . . 20Upper Peninsula . . . . . . . . . . . . . . . . . . . . . . . . . . . . . . . . . . . . . . . . . . . 22Northern Lower Peninsula . . . . . . . . . . . . . . . . . . . . . . . . . . . . . . . . . . . 24Southern Lower Peninsula—Urban . . . . . . . . . . . . . . . . . . . . . . . . . . . . 26Southern Lower Peninsula—Rural . . . . . . . . . . . . . . . . . . . . . . . . . . . . 28Macomb County. . . . . . . . . . . . . . . . . . . . . . . . . . . . . . . . . . . . . . . . . . . . 30Oakland County . . . . . . . . . . . . . . . . . . . . . . . . . . . . . . . . . . . . . . . . . . . . 32Wayne County . . . . . . . . . . . . . . . . . . . . . . . . . . . . . . . . . . . . . . . . . . . . . 34Conclusion . . . . . . . . . . . . . . . . . . . . . . . . . . . . . . . . . . . . . . . . . . . . . . . . 36References . . . . . . . . . . . . . . . . . . . . . . . . . . . . . . . . . . . . . . . . . . . . . . . . 37Appendix . . . . . . . . . . . . . . . . . . . . . . . . . . . . . . . . . . . . . . . . . . . . . . . . . 38
Count Your Smiles ii

Executive Summary
This summary is intended to highlight important findings on dental diseaseand dental access for children in Michigan. This summary also addressesimportant regional concerns for oral health. Additional survey information isavailable in the full text of the Count Your Smiles report. For additional information about participant recruitment, an informational manual is availableat http://www.michigan.gov/oralhealth.
Oral Disease
Nearly one in 10 third grade children in Michigan (9.6%) have immediatedental care needs with signs or symptoms of pain, infection, or swelling.Children lacking dental insurance, children of lower socioeconomic status,and children who had not visited a dentist in the past year were most likelyto have immediate dental needs.
Oral pain can impact a child’s learning, nutrition, and sleeping. Over one ineight parents of third grade children in Michigan (13.0%) reported theirchild had a toothache when biting or chewing in the past six months.Toothaches were more common among children attending schools in thecity of Detroit and among children who had difficulty obtaining dental carein the past year.
One in four Michigan third grade children (25.0%) has untreated dentaldisease. Hispanic and African American schoolchildren had higher rates ofuntreated dental disease. Lower socioeconomic status and lack of dentalinsurance were also associated with untreated dental disease.
Michigan third grade children who attended schools in optimally fluoridatedcommunities had significantly fewer teeth affected by caries (cavities) thanchildren who attended schools in communities that lack optimallyfluoridated community water supplies.
Access to Oral Health Services
Lack of dental insurance is a significant barrier to obtaining dental care forchildren. Nearly one in six third grade children (15.1%) lack dentalinsurance—twice the number of Michigan children who lack medicalinsurance. Uninsured children had significantly more dental disease andsubstantially less access to dental services.
Roughly one in nine Michigan third grade children (11.2%) encounteredproblems that prevented them from obtaining dental care in the past year.Increased difficulty in obtaining dental care was common among all racialand ethnic minorities, as well as children not covered by private dentalinsurance. Cost and a lack of dental insurance were the two mostfrequently cited reasons for failure to obtain dental care.
Count Your Smiles 1

A substantial number of children visit the dentist every year, with 84.4% ofparents reporting that their child had visited the dentist in the past year.A lack of dental insurance was strongly associated with failing to visit thedentist, particularly among Hispanics.
Sealants are protective coatings placed on the grooved surfaces of teeth toprevent dental disease. Despite the high rate of dental service utilization,only 23.3% of third grade children in Michigan had sealants present on firstmolar teeth, far below the Healthy People 2010 goal of 50%. Hispanicchildren were much less likely to have sealants present (14.6%).
Regional Information
Upper Peninsula and Northern Lower Peninsula children had the highestrates of caries experience and untreated decay. Expansion of communitywater fluoridation could significantly reduce the number of teeth that havebeen affected by caries in the region.
The rural Southern Lower Peninsula had the lowest rates of sealantplacement and the highest proportion of uninsured children. In addition, freeand reduced lunch children encountered significantly more dental disease.
The urban Southern Lower Peninsula had the highest rates of immediatedental needs with 17.4% of children showing signs or symptoms of pain,swelling, or infection. The disease burden was substantially higher forAfrican American and Hispanic children in this region.
Children who attend school in Wayne County experience dental disease athigher rates compared to children who attend school in either Macomb orOakland County. Significant social and racial disparities exist in bothdental disease and access all across the Detroit Metropolitan area.
Count Your Smiles 2
Executive Summary

Introduction
In 2000, the United States Surgeon General’s Report: Oral Health in Americadocumented a “silent epidemic of oral disease affecting our most vulnerablecitizens” (USDHHS 2000a). This report identified a significant unmet need fordental care and delineated substantial disparities in oral disease.
In an effort to improve dental outcomes, Healthy People 2010 (HP2010)included several health objectives aimed at preventing and treating disease,as well as improving access to dental services (USDHHS 2000b). The CountYour Smiles (CYS) survey was designed to address dental outcomes inMichigan that pertain to those HP2010 objectives. In addition, CYS providesthe first statewide estimates of child dental disease in Michigan, and will contribute to Michigan’s oral health surveillance system. Comparisonsbetween the United States and Michigan can be found below (Table I).
Oral health is essential to overall health and well-being. Poor oral health cancontribute to difficulties learning, nutritional deficiencies, and low self-esteem(Moynihan 2004). Routine dental visits provide opportunities to prevent ordelay dental disease. However, substantial disparities exist in the access toroutine preventive dental care (Yu 2006).
Additional preventive measures include the use of sealants and communitywater fluoridation. Sealants are a transparent or opaque material that coversand protects the pit and fissure surfaces of teeth. When retained, they provide a cost-effective method of decay prevention (Kitchens 2005).Community water fluoridation remains the primary source of evidence-basedcaries prevention.
Often, people encounter barriers to accessing dental care and preventive dental services. These access-related barriers range from a lack of insuranceto the inability to speak English (Stevens 2006). The Count Your Smilessurvey addresses health disparities among children for both dental diseaseand access to dental care.
Count Your Smiles 3
Target Michigan United States
Healthy People 2010 Objective % % %
21-1b: Reduce the proportion ofchildren who have dental cariesexperience in their primary orpermanent teeth, age 6-8 years.
42% 58% 52%
21-2b: Reduce the proportion of childrenwho have untreated dentaldecay, age 6-8 years.
21% 25% 29%
21-8: Increase the proportion ofchildren who have receivedsealants on their molar teeth,age 8 years.
50% 23% 23%
Table I: Healthy People 2010 Oral Health indicators, target levels, and current status in theUnited States and Michigan

Methods
Selection of Schools
Michigan elementary schools were randomly selected through ordered probability proportional to size sampling. The sampling frame was basedupon school enrollment information from the 2003-2004 school year. Thenumber of schools chosen in each region was proportional to total district andschool enrollment figures. Exclusion criteria included private schools, home-schooled children, schools with fewer than 20 third grade students, andboth accelerated and special education classrooms. School sampling variedwithin each study-defined geographic region in Michigan. Replacementschools were selected due to school refusal, closure, or poor response rate.Free and reduced lunch enrollment was a proxy for socioeconomic status.
Upper Peninsula and Northern Lower PeninsulaThis region consisted of all counties north of and including Mason, Lake,Osceola, Clare, Gladwin, and Arenac counties. The number of schoolsselected in this region was increased to enhance the precision ofprevalence estimates for the region. Sampling was stratified between theUpper Peninsula and Northern Lower Peninsula. Schools were orderedgeographically and by the percentage of free and reduced lunch studentswithin the school to ensure geographic dispersion as well as adequatevariation in socioeconomic indicators.
Southeast MichiganThis region consisted of the three counties (Oakland, Macomb, Wayne)that comprise the major metropolitan Detroit area. Within this region,schools were further subdivided between the city of Detroit and outlyingareas (suburban Detroit). Schools were then ordered by percentage offree and reduced lunch participants.
Southern Lower PeninsulaThis region consisted of all remaining Michigan counties. School districtswere divided into rural and urban districts, with urban school districtshaving 285 or more third grade children. Within the urban and ruralclassifications, schools were ordered geographically and by percentage offree and reduced lunch participants.
Recruitment of Participants
Participants were recruited from 76 elementary schools. Consent to work withthe schools was first obtained through mailings to district superintendents.Upon confirmation, the school principal was contacted to obtain school consent, classroom selection, and a person to contact for follow-up. Consentforms were sent out to 2,337 parents for signed approval to permit their childto participate in the survey. In addition, children in participating classroomsreceived an oral health kit that included a toothbrush, toothpaste, and oralhealth education materials. Children who participated in the screening and
Count Your Smiles 4

teachers in participating classrooms also received a SpinbrushTM. Overall,1,866 consent forms were returned, and 1,687 of these had a positive consent. However, only 1,586 children were present at the time of the screening by the hygienist. Two schools that chose to not participate were notreplaced in the sample.
Survey of Parents
Consent forms sent to parents included a nine-question survey about theirchild’s access to dental care. To maintain confidentiality during data entry andanalysis, copies of these surveys were created with blacked-out signatures.Parent responses were linked to child clinical information through confidentialidentification numbers. Survey questions included a history of a toothache,time since last dental visit, reason for last dental visit, problems in obtainingdental care, and source of dental insurance. Surveys were available inEnglish, Spanish, and Arabic.
Oral Screening of Children
Volunteer licensed dental hygienists performed the oral screenings while following standard precautions for infection control. Prior to the screenings,
Count Your Smiles 5
Methods

the volunteer hygienists attended a training session to standardize measurement of dental disease and to facilitate the school screening.Measures of dental disease included the following:
Cavitated lesion: A loss of at least 0.5mm of tooth structure at the enamelsurface with brown to dark brown coloration of the walls of the lesion.
Caries experience: The presence of a cavitated lesion or a filling(permanent or temporary), a crown, or a tooth that is missing because itwas extracted as a result of caries were considered caries experience.Only missing permanent first molars were considered missing due to caries.
Untreated decay: An untreated cavitated lesion.
Sealants: Dental sealants are a transparent or opaque material applied toteeth to protect the pit and fissure surfaces. To be considered as having asealant, one must be present on at least one permanent first molar.
Treatment urgency: The examiner's recommendation of how soon the childshould visit the dentist for clinical diagnosis and any necessary treatment.“No obvious problem” corresponded to no dental problems observed.“Early dental care is needed” corresponded to a cavitated lesion withoutaccompanying signs or symptoms or when there were suspicious white orred soft tissue areas. “Immediate dental care is needed” corresponded tosigns or symptoms of pain, infection, or swelling.
Analysis
Sample weights were applied to participant observations and responses toachieve population-based estimates of results. These sample weights correspond to the child’s probability of selection and participation in the survey. Statistical analysis was performed in SAS version 9.1 using surveyprocedures that account for the complex sampling design. The MichiganDepartment of Community Health Institutional Review Board reviewed this survey.
Count Your Smiles 6
Methods
Participants were recruited from 76 elementaryschools. Consent to work with the schools
was first obtained through mailings to district superintendents. Upon confirmation, school
principals were contacted to obtain school consent,classroom selection, persons to contact for follow-up.
Consent forms were sent out to 2,337 parents for signed approval to permit their children
to participate in the survey.

Population Demographics & Response Rates
Positive consent forms were returned for 72% of children. However, due toabsences, 68% of all targeted children participated in the survey. Responserates also varied within geographic strata. In the Upper Peninsula, 80.4% oftargeted children were screened compared to 76.8% in the Northern LowerPeninsula, 72.1% in the Southern Lower Peninsula, 68.8% in suburbanDetroit, and 63.3% in Detroit. Characteristics of Count Your Smilesparticipants are available below (Table II).
The population reflects the general population closely with regard to genderand race/ethnicity. Overall, there was a slightly higher percentage of free andreduced lunch participants compared to the general population.
Count Your Smiles 7
Characteristic Number Screened (N)
EstimatedProportion (%)
By AgeLess than 9 years9 years or older
1,187393
75.9 +/- 2.724.1 +/- 2.7
By GenderMaleFemale
746828
48.1 +/- 2.651.9 +/- 2.6
By Race/Ethnicity*White**African AmericanHispanicNative AmericanAsian AmericanArab AmericanOther
1,2001948442332320
70.7 +/- 5.919.5 +/- 7.16.8 +/- 2.51.7 +/- 0.92.7 +/- 1.62.2 +/- 3.01.5 +/- 0.4
By Dental InsurancePrivatePublicUninsured
883415219
57.8 +/- 5.227.1 +/- 5.015.1 +/- 2.4
Other CharacteristicsFree/Reduced Lunch Program ParticipationNon-English-speaking household
588163
41.0 +/- 6.113.5 +/- 4.1
All proportion estimates include 95% confidence intervals*Parent may report more than one race and/or ethnicity**Does not include Hispanic or Arab persons
Table II: Characteristics of Count Your Smiles participants, 2005-06

Caries Experience
Twenty-eight percent of children bear 75% of teeth affected by dentalcaries.
Children who attended school in optimally fluoridated communities hadfewer teeth affected by caries than children who attended school innonfluoridated communities.
Socioeconomic differences may contribute substantially to cariesexperience. Free and reduced lunch participants and children not coveredby private dental insurance had higher rates of caries.
Caries experience (cavities) includes the presence of teeth with fillings, teethwith untreated decay, or the loss of first permanent molars due to caries. InMichigan, over half of all third grade children (58.0%) had experienced toothdecay. Prevalence of caries was higher outside suburban Detroit with thehighest rates occurring in the Upper Peninsula. Hispanic and Native Americanchildren, children not covered by private dental insurance, and free andreduced lunch participants all experienced higher rates of caries (Table A1 -see appendix).
Free and reduced lunch participants experienced higher caries rates in each geographic region except in the Upper Peninsula. The resulting disparityvaries in magnitude between the different regions. The largest socioeconomicdisparities in caries experience occurred among children from Detroit and children from the Northern Lower Peninsula (Figure 1).
Count Your Smiles 8
Figure 1: Proportion of Michigan third grade children with caries experience, by free/reducedlunch(FRL) program participation and geographic region, 2005-06

Children with any caries experience averaged 3.8 affected teeth per child.Among children with caries experience in primary teeth, 3.5 primary teeth onaverage had been affected. Among children with caries experience in permanent teeth, an average of 1.8 permanent teeth had been affected. Theaverage number of teeth affected by caries varied between types of dentalinsurance, but did not statistically vary by free and reduced lunch programparticipation within each insurance category (Figure 2). Children who attended school in communities with fluoridated community water supplies hadfewer teeth affected by caries than children who attended school in communities with nonfluoridated community water supplies (Figure 3).
Count Your Smiles 9
Figure 2: Average number of teeth affected by caries experience among Michigan third grade children with any caries experience, by type of dental insurance and enrollment in the free andreduced lunch (FRL) program, 2005-06
Figure 3: Average number of teeth affected by caries among all third grade Michigan childrenand among third grade Michigan children with any caries experience, by community water supply(CWS) fluoridation status, 2005-06
Caries Experience

Untreated Dental Disease
Access to dental care is significantly linked to untreated dental disease.Children who did not have an annual dental visit and children not coveredby private insurance had significantly more teeth with untreated decay.
As with caries experience, free and reduced lunch participants had higherrates of untreated dental decay, and the magnitude of this disparity variedbetween geographic regions.
Untreated dental disease refers to caries experience (a cavity) that is visible,but has not been filled or treated. One in four third grade children in Michigan(25.0%) have untreated dental disease. Prevalence of untreated dental disease was higher in all areas outside suburban Detroit. African Americanand Hispanic schoolchildren both had higher prevalence rates of untreateddental disease. One in three children who lacked private dental insurance haduntreated dental disease compared to one in six children with private insurance. Free and reduced lunch participants also had higher rates ofuntreated dental disease (Table A2 - see appendix).
Much like caries experience, socioeconomic differences contribute to disparities in untreated dental disease. This socioeconomic disparity varies inits magnitude across Michigan with substantial disparities in the SouthernLower Peninsula and suburban Detroit (Figure 4).
Count Your Smiles 10
Figure 4: Proportion of Michigan third grade children with untreated dental disease, by free/reduced lunch (FRL) program participation and geographic region, 2005-06

Children with untreated dental decay averaged 2.4 untreated teeth. Amongchildren with untreated primary tooth decay, 2.3 primary teeth were untreatedon average. Among children with untreated permanent tooth decay, 1.5 permanent teeth were untreated on average. Publicly insured childrenaveraged more untreated teeth than privately insured or uninsured children. However, there were no statistically significant differences between children enrolled in the free and reduced lunch program and those not enrolled afteraccounting for type of insurance (Figure 5). Children who had visited the dentist in the past year had substantially less untreated decay than childrenwho had not (Figure 6).
Count Your Smiles 11
Figure 5: Average number of teeth with untreated decay among Michigan third grade children, bytype of dental insurance and enrollment status in the free and reduced lunch (FRL) program,2005-06
Figure 6: Average number of teeth with untreated decay among Michigan third grade childrenwith untreated decay and all Michigan third grade children, for children with and without a dentalvisit in the past year
Untreated Dental Disease

Urgency of Needed Dental Care
Uninsured free and reduced lunch participants were six times more likely tohave immediate dental needs with signs or symptoms of pain, swelling, orinfection than privately insured, free and reduced lunch non-participants.
Barriers to receiving dental care and lack of an annual dental visit werestrongly associated with a child having immediate dental needs.
Screening revealed that nearly one in ten (9.6%) Michigan third gradechildren are in need of immediate dental care for signs or symptoms of pain,infection, or swelling. The need for routine dental care was found in 27.5% ofchildren, while 62.9% of children had no obvious dental problems.
Compared to children living in suburban Detroit, children in the NorthernLower Peninsula were five times more likely to have immediate dental careneeds and 4.4 times more likely to have routine dental care needs while children in the Southern Lower Peninsula were 6.4 times more likely to needimmediate dental care and four times more likely to need routine dental care.
Hispanic children had a higher prevalence of immediate and routine dentalcare needs (Table A3 - see appendix). However, after accounting for socioeconomic and insurance differences, there were no statistically significant racial or ethnic disparities associated with the immediacy of dentalcare needs among Michigan third grade children. Male children were morelikely to need both routine and immediate dental care than female children.
Access to care plays an important role in determining dental need (Figure 7).Children who visited the dentist in the past year were 73% less likely to haveimmediate dental care needs. Meanwhile, children who experienced difficultyin obtaining dental care were three times more likely to have immediate dentalcare needs and 1.7 times more likely to have routine dental care needs thanchildren who did not experience a problem in obtaining dental care.
Count Your Smiles 12
Figure 7: Immediacy of dental care needs among Michigan third grade children, by difficultyobtaining dental care and annual dental utilization, 2005-06

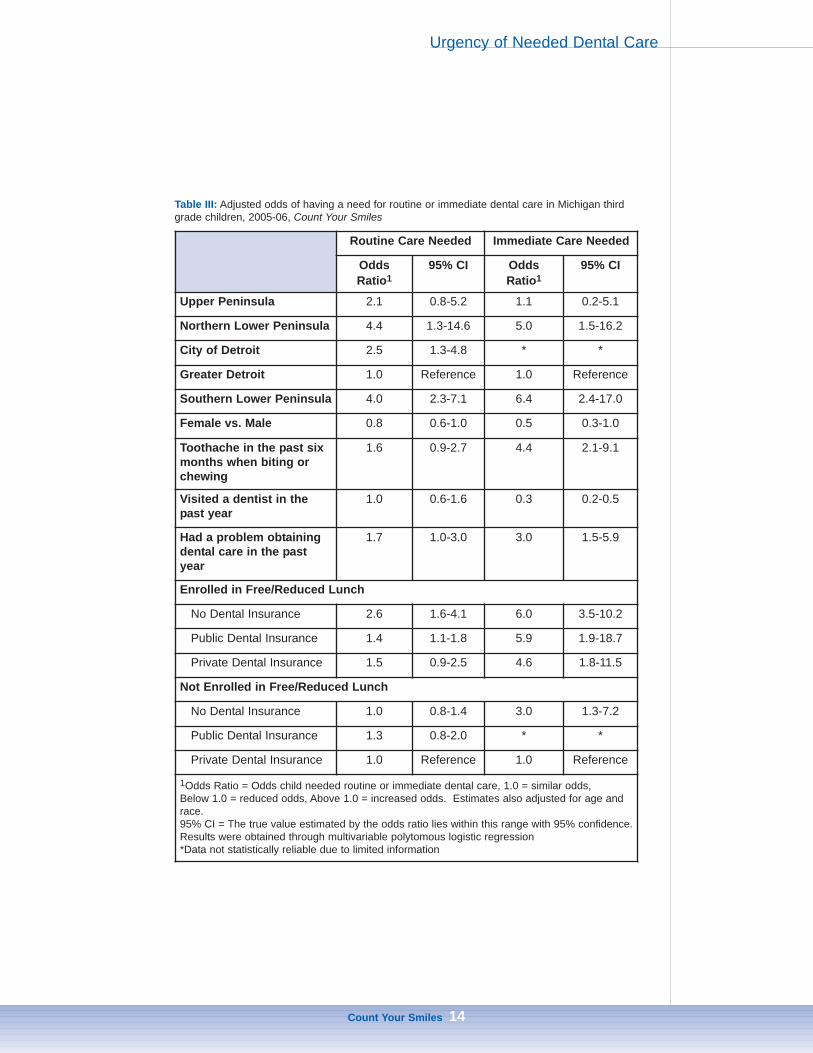
Immediacy of dental care needs was strongly associated with socioeconomicstatus, but this association varied with the type of dental insurance.Uninsured free and reduced lunch participants were six times more likely toneed immediate care and 2.6 times more likely to need routine dental care compared to privately insured free and reduced lunch non-participants.However, uninsured children not enrolled in the free and reduced lunch program were three times more likely to need immediate dental care than privately insured free and reduced lunch non-participants (Table III).
Count Your Smiles 13
Urgency of Needed Dental Care
Nearly one in 10 Michiganthird grade children are inneed of immediate dentalcare for signs or symptomsof pain, infection, orswelling. The need for routine dental care wasfound in 27.5% of children, while 62.9% ofchildren had no obvious dental problems.
Count Your Smiles 14
Table III: Adjusted odds of having a need for routine or immediate dental care in Michigan thirdgrade children, 2005-06, Count Your Smiles
Routine Care Needed Immediate Care Needed
OddsRatio1
95% CI OddsRatio1
95% CI
Upper Peninsula 2.1 0.8-5.2 1.1 0.2-5.1
Northern Lower Peninsula 4.4 1.3-14.6 5.0 1.5-16.2
City of Detroit 2.5 1.3-4.8 * *
Greater Detroit 1.0 Reference 1.0 Reference
Southern Lower Peninsula 4.0 2.3-7.1 6.4 2.4-17.0
Female vs. Male 0.8 0.6-1.0 0.5 0.3-1.0
Toothache in the past sixmonths when biting orchewing
1.6 0.9-2.7 4.4 2.1-9.1
Visited a dentist in thepast year
1.0 0.6-1.6 0.3 0.2-0.5
Had a problem obtainingdental care in the pastyear
1.7 1.0-3.0 3.0 1.5-5.9
Enrolled in Free/Reduced Lunch
No Dental Insurance 2.6 1.6-4.1 6.0 3.5-10.2
Public Dental Insurance 1.4 1.1-1.8 5.9 1.9-18.7
Private Dental Insurance 1.5 0.9-2.5 4.6 1.8-11.5
Not Enrolled in Free/Reduced Lunch
No Dental Insurance 1.0 0.8-1.4 3.0 1.3-7.2
Public Dental Insurance 1.3 0.8-2.0 * *
Private Dental Insurance 1.0 Reference 1.0 Reference
1Odds Ratio = Odds child needed routine or immediate dental care, 1.0 = similar odds, Below 1.0 = reduced odds, Above 1.0 = increased odds. Estimates also adjusted for age andrace.95% CI = The true value estimated by the odds ratio lies within this range with 95% confidence.Results were obtained through multivariable polytomous logistic regression*Data not statistically reliable due to limited information
Urgency of Needed Dental Care

Toothache When Biting or Chewing
Children with a toothache in the past six months when biting or chewinghad less access to needed dental care and significantly more teethaffected by untreated dental disease. Children with toothaches were4.4 times more likely to have immediate dental needs than children withouttoothaches.
African American and Hispanic children had higher rates of toothachesthan White children. Children who attend school in the city of Detroit hadthe highest rate of toothaches.
Oral pain can impact a child’s nutrition, learning, and sleeping. Unfortunately,12.9% of Michigan parents reported their child had a toothache when biting orchewing in the past six months. Toothaches were more prevalent among third grade children who attend school in Detroit, with nearly one in four parents reporting their child experienced a toothache in the past six months.African American and Hispanic children had higher rates than Whites, andfemales had slightly higher rates than males. Free and reduced lunch participants and children covered by public dental insurance also had elevated rates of toothaches in the past six months (Table A4 - see appendix).
Access to dental care plays a vital role in determining whether a child experiences oral pain. In addition to the association between toothaches andboth dental insurance and socioeconomic status, strong links exist betweentoothaches and both annual dental visits and difficulty obtaining dental care.Children who had not visited the dentist in the past year had slightly higherrates of toothaches. However, among children who had difficulty obtainingdental care in the past year, the rate of toothaches in the past six months was37.2% compared to 9.4% among children who did not encounter difficulties inobtaining dental care (Figure 8). A child with a toothache in the past sixmonths was 4.4 times more likely to need immediate dental care and 1.9 times more likely to need routine dental care than a child without report ofa toothache in the past six months.
Count Your Smiles 15
Figure 8: Proportion of Michigan third grade children with toothache in the past six months whenbiting or chewing, by annual dental visit and by difficulty obtaining dental care in the past year,2005-06

Report of a toothache in the previous six months corresponded to both a significantly higher number of teeth affected by caries and a significantly higher number of teeth with untreated decay (Figure 9). Children with atoothache averaged 3.3 teeth affected by caries and 1.4 teeth with untreateddecay while children without a toothache averaged two teeth affected bycaries and 0.5 teeth with untreated decay. Children with a toothache hadlower overall rates of dental access and significantly higher rates of untreateddental disease, thus demonstrating a painful consequence for children withuntreated disease who do not have access to needed dental care.
Count Your Smiles 16
Figure 9: Average number of teeth affected by caries and number of teeth with untreated decayamong Michigan third grade children with and without a toothache in the past six months when biting or chewing, 2005-06
Toothache When Biting or Chewing
Children with a toothache had lower overall rates of dental access and significantly higher rates
of untreated dental disease, thus demonstrating a painful consequence for children with untreated
disease who do not have access to needed dental care.

Dental Visit in the Past Year
Children who visited the dentist in the past year had significantly lessuntreated dental disease and fewer immediate dental needs than childrenwho had not visited the dentist in the past year.
Dental insurance plays an important role in accessing dental care.Hispanics without insurance were the least likely group to have a dentalvisit in the past year.
Children should have their teeth examined regularly. At a minimum, everychild should visit the dentist at least once per year. Among Count Your Smilesparticipants, 84.8% of parents reported that their child had visited the dentistin the past year. When compared to other studies, Count Your Smilesparticipants were more likely to use dental services than those who chose notto participate in Count Your Smiles. Still, substantial trends in use of dentalservices can be gained from the survey.
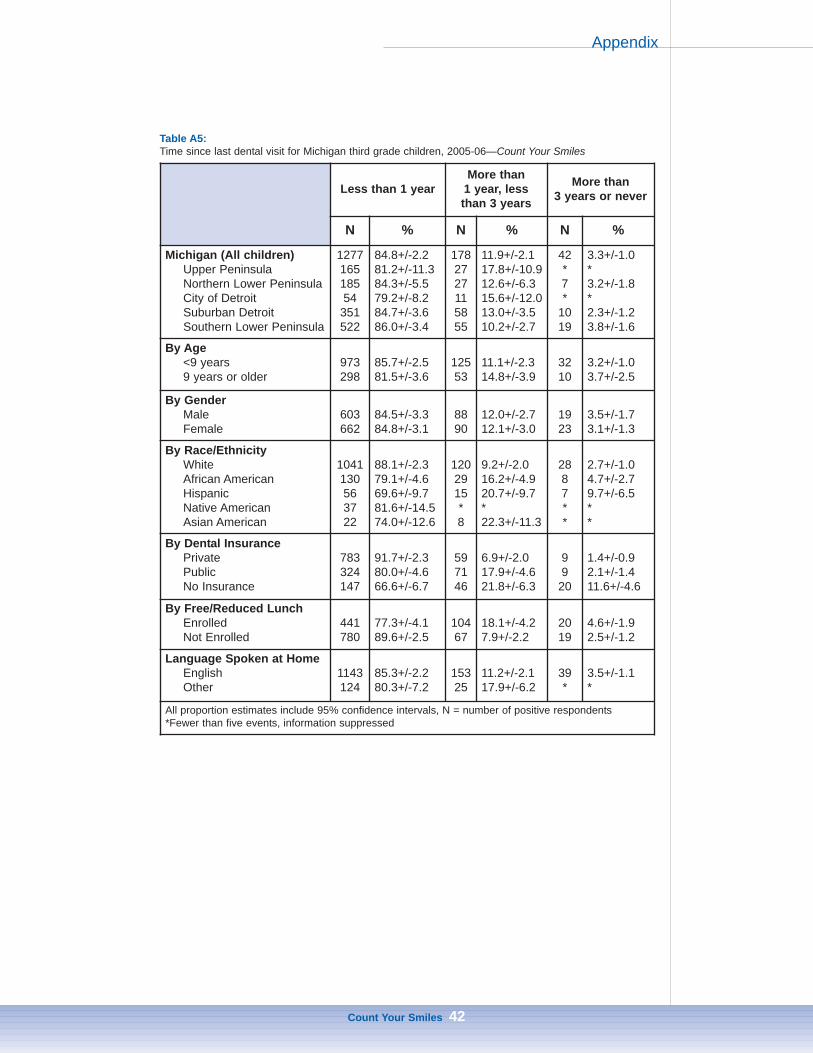
Dental utilization rates were similar across the state except in the city ofDetroit where children had significantly fewer recent dental visits than the restof Michigan. Racial and ethnic minorities had lower rates of dental utilizationcompared to Whites. Compared to 91.7% of privately insured children whohad a dental visit in the past year, only 66.6% of children without insuranceand 80.0% of children on public insurance had visited the dentist in the pastyear. Children enrolled in the free and reduced lunch program also had lowerrates of utilization (Table A5 - see appendix).
Annual dental service utilization also varied within type of insurance by race.A lack of dental insurance contributed strongly to disparate access toHispanics (Figure 10).
Count Your Smiles 17
Figure 10: Proportion of Michigan third grade children with a dental visit in the past year, by typeof insurance and race/ethnicity, 2005-06

Problems obtaining dental care also led to lower annual dental utilization(Figure 11).
Access to dental care is important to prevention of dental disease and haltingthe progression of existing dental disease. Children who had not visited thedentist in the past year had significantly less untreated dental decay and fewerimmediate dental needs than children who had a dental visit in the past year.
Count Your Smiles 18
Figure 11: Proportion of Michigan third grade children with a dental visit in the past year by difficulty in obtaining dental care and type of dental insurance, 2005-06
Figure 12: Proportion of Michigan third grade children with caries experience, untreated decay,immediate dental needs, and a toothache in the past six months among children with and withouta dental visit in the past year, 2005-06
Dental Visit in the Past Year
Problem Obtaining Dental Care in Past Year
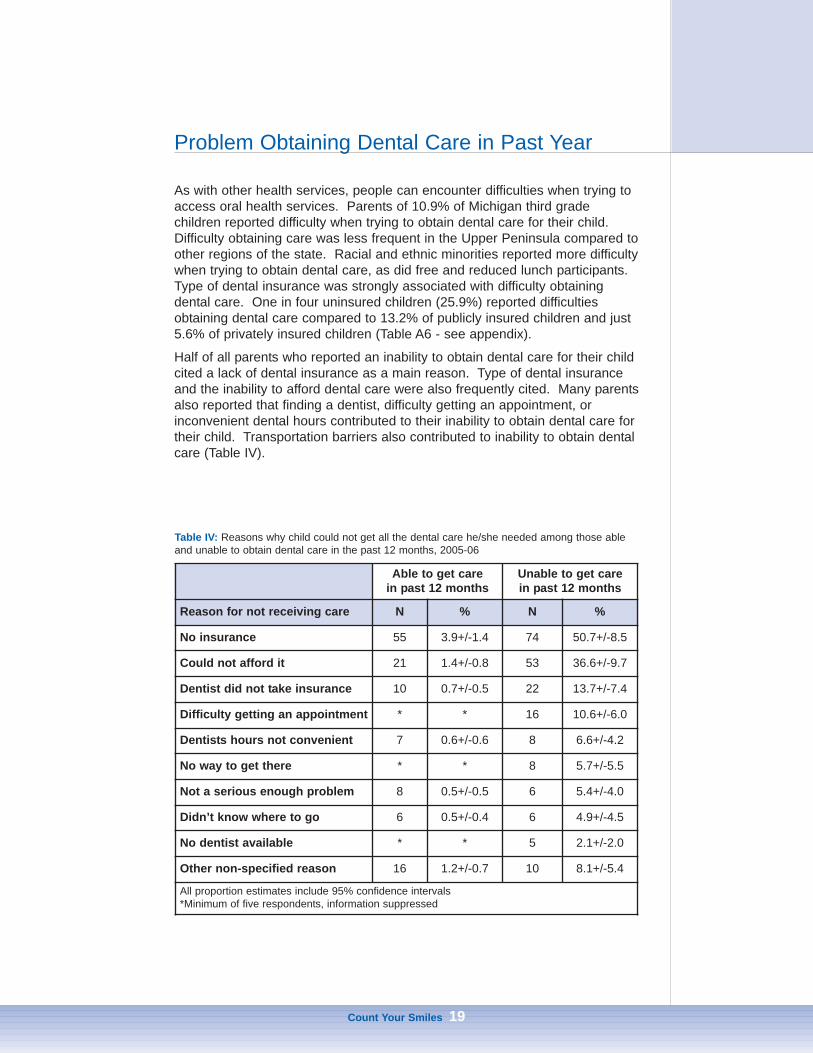
As with other health services, people can encounter difficulties when trying toaccess oral health services. Parents of 10.9% of Michigan third grade children reported difficulty when trying to obtain dental care for their child.Difficulty obtaining care was less frequent in the Upper Peninsula compared toother regions of the state. Racial and ethnic minorities reported more difficultywhen trying to obtain dental care, as did free and reduced lunch participants.Type of dental insurance was strongly associated with difficulty obtaining dental care. One in four uninsured children (25.9%) reported difficultiesobtaining dental care compared to 13.2% of publicly insured children and just5.6% of privately insured children (Table A6 - see appendix).
Half of all parents who reported an inability to obtain dental care for their childcited a lack of dental insurance as a main reason. Type of dental insuranceand the inability to afford dental care were also frequently cited. Many parentsalso reported that finding a dentist, difficulty getting an appointment, or inconvenient dental hours contributed to their inability to obtain dental care fortheir child. Transportation barriers also contributed to inability to obtain dentalcare (Table IV).
Count Your Smiles 19
Able to get care in past 12 months
Unable to get carein past 12 months
Reason for not receiving care N % N %
No insurance 55 3.9+/-1.4 74 50.7+/-8.5
Could not afford it 21 1.4+/-0.8 53 36.6+/-9.7
Dentist did not take insurance 10 0.7+/-0.5 22 13.7+/-7.4
Difficulty getting an appointment * * 16 10.6+/-6.0
Dentists hours not convenient 7 0.6+/-0.6 8 6.6+/-4.2
No way to get there * * 8 5.7+/-5.5
Not a serious enough problem 8 0.5+/-0.5 6 5.4+/-4.0
Didn’t know where to go 6 0.5+/-0.4 6 4.9+/-4.5
No dentist available * * 5 2.1+/-2.0
Other non-specified reason 16 1.2+/-0.7 10 8.1+/-5.4
All proportion estimates include 95% confidence intervals*Minimum of five respondents, information suppressed
Table IV: Reasons why child could not get all the dental care he/she needed among those ableand unable to obtain dental care in the past 12 months, 2005-06
Sealants Present on First Molars
Michigan ranks next to last among states in the percentage of third gradechildren with sealants present on first molars.
The Southern Lower Peninsula had the lowest rate of sealants present onfirst molars, particularly in rural areas and among Hispanics.
Nearly one in 10 third grade children lack both the application of sealants tofirst molars and access to an optimally fluoridated community water supply.
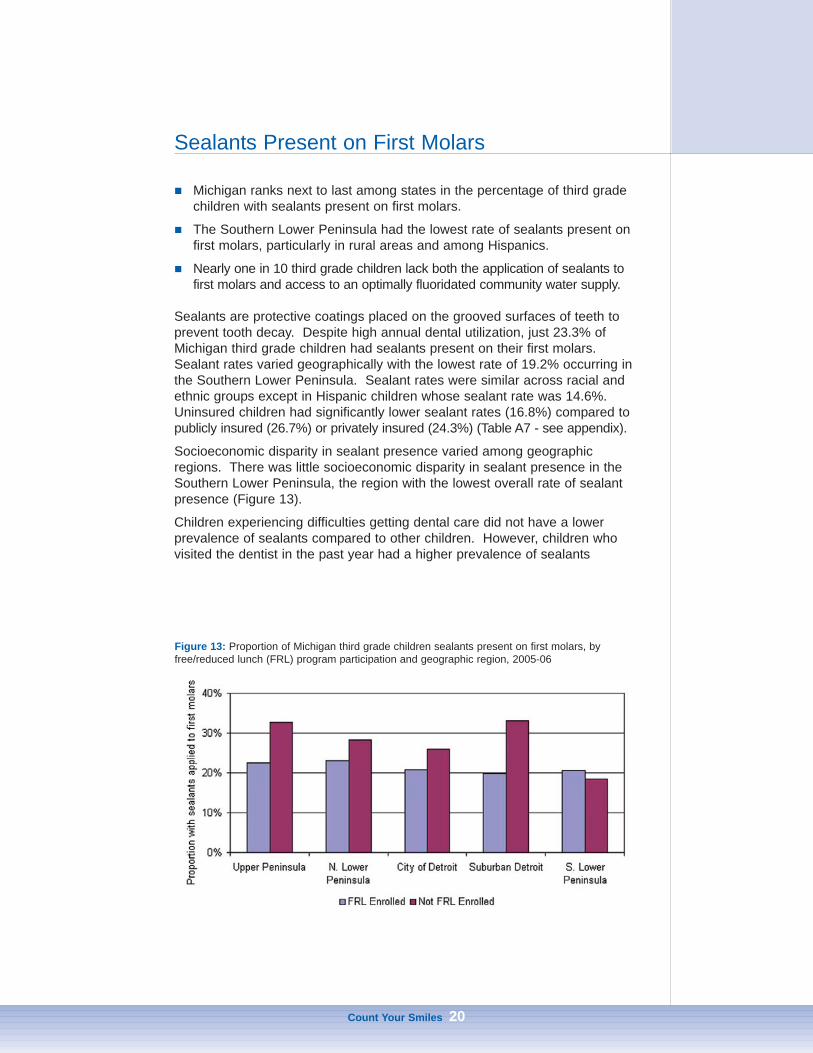
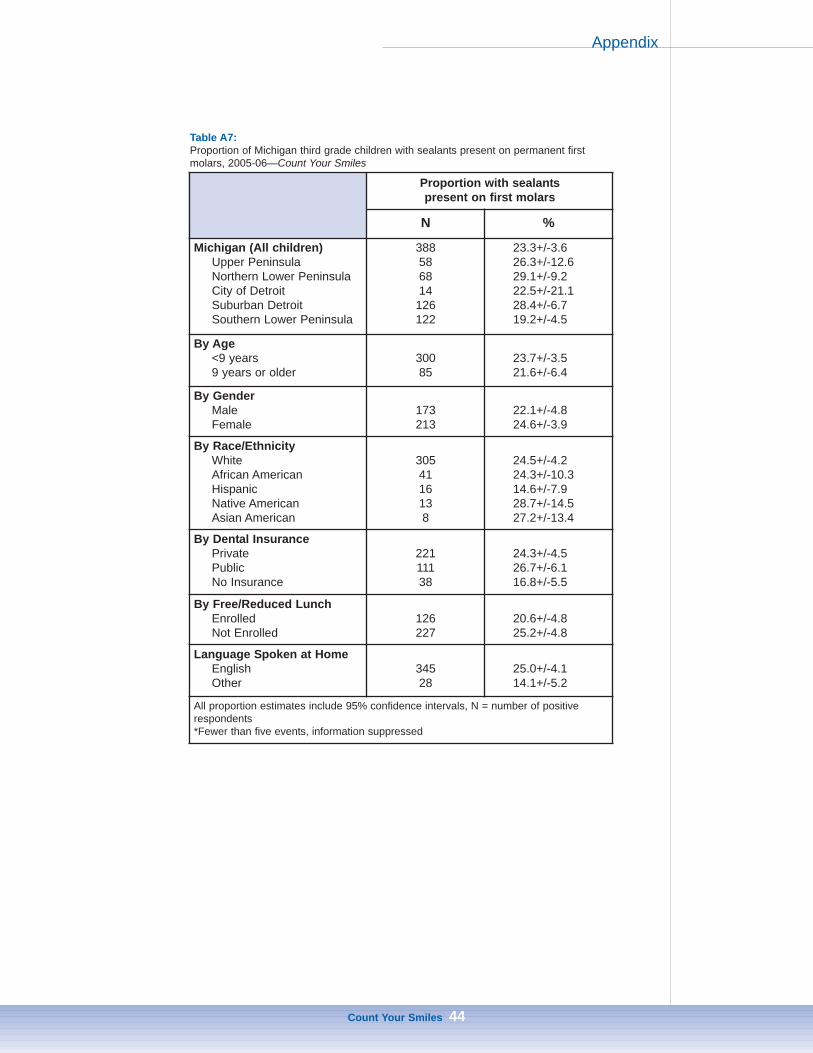
Sealants are protective coatings placed on the grooved surfaces of teeth toprevent tooth decay. Despite high annual dental utilization, just 23.3% ofMichigan third grade children had sealants present on their first molars.Sealant rates varied geographically with the lowest rate of 19.2% occurring inthe Southern Lower Peninsula. Sealant rates were similar across racial andethnic groups except in Hispanic children whose sealant rate was 14.6%.Uninsured children had significantly lower sealant rates (16.8%) compared topublicly insured (26.7%) or privately insured (24.3%) (Table A7 - see appendix).
Socioeconomic disparity in sealant presence varied among geographicregions. There was little socioeconomic disparity in sealant presence in theSouthern Lower Peninsula, the region with the lowest overall rate of sealantpresence (Figure 13).
Children experiencing difficulties getting dental care did not have a lowerprevalence of sealants compared to other children. However, children whovisited the dentist in the past year had a higher prevalence of sealants
Count Your Smiles 20
Figure 13: Proportion of Michigan third grade children sealants present on first molars, byfree/reduced lunch (FRL) program participation and geographic region, 2005-06
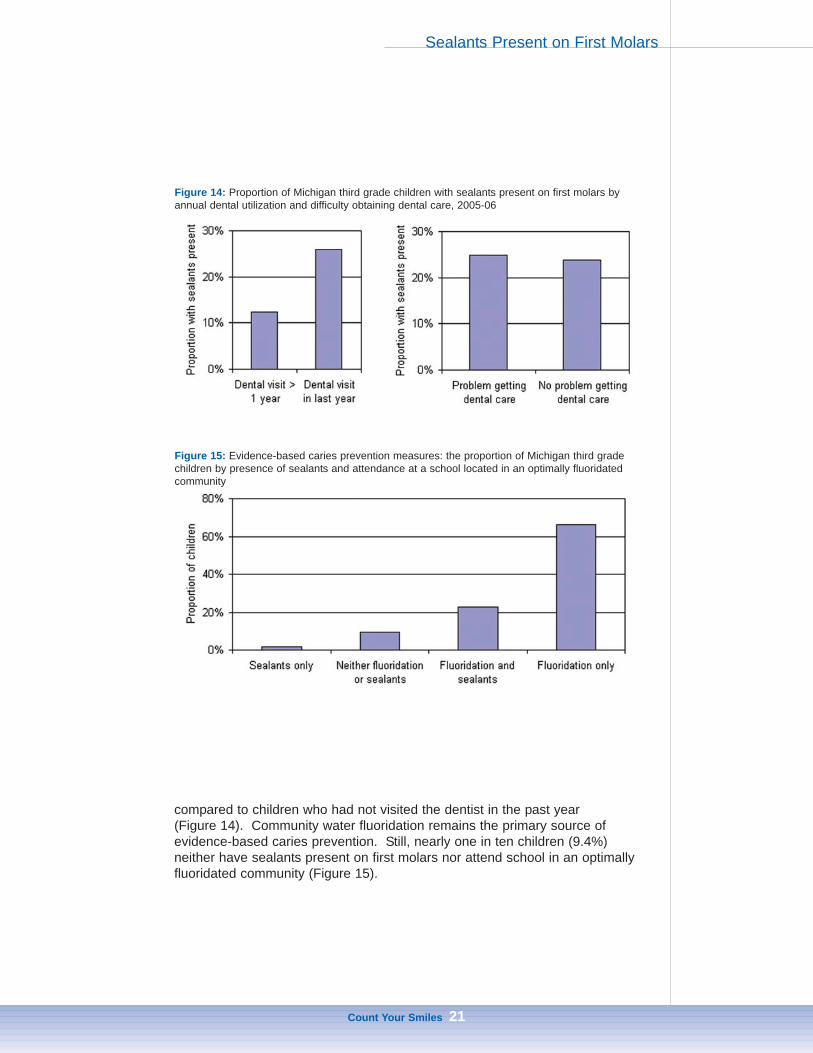
compared to children who had not visited the dentist in the past year (Figure 14). Community water fluoridation remains the primary source of evidence-based caries prevention. Still, nearly one in ten children (9.4%) neither have sealants present on first molars nor attend school in an optimallyfluoridated community (Figure 15).
Count Your Smiles 21
Figure 14: Proportion of Michigan third grade children with sealants present on first molars byannual dental utilization and difficulty obtaining dental care, 2005-06
Figure 15: Evidence-based caries prevention measures: the proportion of Michigan third gradechildren by presence of sealants and attendance at a school located in an optimally fluoridatedcommunity
Sealants Present on First Molars

Upper Peninsula
Children in the Upper Peninsula experience the highest rates of cariesexperience (cavities) and untreated dental disease in Michigan.
Increased application of sealants and expansion in community waterfluoridation could significantly reduce the rates of caries experience anduntreated dental disease in the Upper Peninsula.
Overall, children in the Upper Peninsula have higher rates of dental diseasecompared to the rest of Michigan. Fortunately, these high rates do not correspond to higher rates of severe dental disease. Access to preventivedental services such as sealants and community water fluoridation could significantly reduce dental disease in this region.
Oral DiseaseSeven out of 10 children in the Upper Peninsula had caries experience andone in three had untreated dental disease upon clinical examination, the highest among all geographic regions in Michigan. There were no significantdifferences in untreated decay or caries experience between Whites andNative Americans (Figure 16). Prevalence rates of caries experience anduntreated decay were higher among children attending school in communitieswith non-fluoridated community water supplies compared to children attendingschool in communities with fluoridated community water supplies (Figure 17). Fortunately, only 4.4% of children have immediate dental care needs showingsigns or symptoms of pain or swelling. Routine dental care was needed by27.3% of the population while 68.3% exhibited no obvious dental problemupon examination. Among participating children, 11.2% of parents reportedtheir child had a toothache when chewing or biting in the past six months.
Count Your Smiles 22
Table V: Healthy People 2010 Oral Health indicators, target levels, and current status in Michiganand the Upper Peninsula
Target Michigan Upper Peninsula
Healthy People 2010 Objective % % %
21-1b: Reduce the proportion of children whohave dental caries experience in their primaryor permanent teeth, age 6-8 years.
42% 58% 70%
21-2b: Reduce the proportion of children whohave untreated dental decay, age 6-8 years. 21% 25% 33%
21-8: Increase the proportion of children whohave received sealants on their molar teeth,age 8 years.
50% 23% 26%

Access to Oral Health ServicesWithin the past year, 81.2% of Upper Peninsula third grade children who participated in this survey had visited the dentist. Just 5.6% of parents reported encountering a barrier that prevented their child from obtaining dentalcare in the past year. A lack of dental insurance was the primary reason for47.3% of children who were unable to obtain dental care in this region, and38.4% were unable to obtain care because the dentist did not accept theirinsurance. Private dental insurance covered 45.9% of the population, publicdental insurance covered 42.7%, and 11.4% were uninsured for dental services. Over one quarter (26.3%) had sealants present on first molars.
Count Your Smiles 23
Figure 16: Proportion of Upper Peninsula third grade children with caries experience, untreateddental decay, and sealants present by race/ethnicity, 2005-06
Figure 17: Proportion of Upper Peninsula and Northern Lower Peninsula third grade children withcaries experience and untreated dental decay by community water supply (CWS) fluoridation status, 2005-06
Upper Peninsula

Northern Lower Peninsula
Children in the Northern Lower Peninsula experience caries and untreateddental disease at higher rates than the rest of Michigan. Unfortunately,children in the Northern Lower Peninsula are also more likely to haveimmediate and routine dental needs than children in most areas of Michigan.
The Northern Lower Peninsula has significant socioeconomic disparities incaries experience, untreated dental decay, and urgent dental needs.
Expansion of community water fluoridation and increased use of sealantscould significantly reduce dental disease in the Northern Lower Peninsula.
Children in the Northern Lower Peninsula have oral disease rates that arehigher than the state of Michigan as a whole. Unfortunately, this region alsoencounters some of the most substantial rates of severe oral disease.Socioeconomic differences in the Northern Lower Peninsula contribute substantially to disparities in oral disease. Expansion in community waterfluoridation and increased use of sealants could significantly reduce oral disease.
Oral DiseaseTwo out of every three children had experienced dental decay by the third grade in the Northern Lower Peninsula, and three out of 10 haduntreated dental disease. Rates of caries experience and untreated dentaldisease were higher among children enrolled in the free and reduced lunchprogram (Figure 18). Half of all children were in need of immediate dentalcare or routine dental care, thus having signs of an easily visible dental
Count Your Smiles 24
Table VI: Healthy People 2010 Oral Health indicators, target levels, and current status inMichigan and the Northern Lower Peninsula
Target MichiganNorthern
LowerPeninsula
Healthy People 2010 Objective % % %
21-1b: Reduce the proportion of children whohave dental caries experience in their primaryor permanent teeth, age 6-8 years.
42% 58% 66%
21-2b: Reduce the proportion of children whohave untreated dental decay, age 6-8 years. 21% 25% 28%
21-8: Increase the proportion of children whohave received sealants on their molar teeth,age 8 years.
50% 23% 30%

problem. Immediate dental care needs were higher among free and reducedlunch participants. In the past six months, 13.3% of children living in NorthernLower Peninsula had a toothache according to parental report.
Access to Oral Health ServicesIn the past year, 84.3% of Northern Lower Peninsula third grade children hadvisited the dentist. However, 13.6% of children encountered barriers to receiving dental care. There were several reasons cited why children failed toobtain dental care in this region, including a lack of insurance and difficulty ingetting a dental appointment (Figure 19). Private insurance covered 46.9% ofchildren in the Northern Lower Peninsula, 36.2% were covered by publicinsurance, and 16.9% lacked dental insurance altogether. Sealants werepresent on first molars in 29.9% of Northern Lower Peninsula children.
Count Your Smiles 25
Figure 18: Proportion of Northern Lower Peninsula third grade children with caries experience,untreated dental decay, sealants present on first molars and immediate dental needs by enrollment in the free and reduced lunch program, 2005-06
Figure 19: Reason for not obtaining dental care among children whose parent reported a barrierto obtaining dental care in the past year, 2005-06
Northern Lower Peninsula

Southern Lower Peninsula—Urban
Urban third grade children in the Southern Lower Peninsula had thehighest prevalence of immediate dental needs in Michigan.
Racial and ethnic disparities contribute substantially to dental disease, withHispanic and African American children experiencing most forms of dentaldisease at higher rates when compared to Whites.
Racial and ethnic disparities were also present in measures of dentalaccess. Whites had higher rates of annual dental utilization than Hispanicsor African Americans. However, African American children had higher ratesof sealant application than Hispanics or Whites.
Urban Southern Lower Peninsula children had the highest prevalence ofimmediate dental needs with signs or symptoms of pain, infection, or swelling.There are significant racial and ethnic disparities in both dental disease anddental access in this region. Hispanics in this region had the highest prevalence of disease as well as the lowest rates of access.
Oral DiseaseCaries experience and untreated dental disease were widely present in urbanSouthern Lower Peninsula third grade children, 59.8% and 31.3% respectively. The urban Southern Lower Peninsula had the highest prevalence for an immediate need for dental care due to signs or symptoms ofpain, infection, or swelling at 17.4% of children. There were significant racialand ethnic disparities in dental disease, with all classifications of diseaseoccurring at higher rates in African Americans and Hispanics (Figure 20).
Count Your Smiles 26
Table VII: Healthy People 2010 Oral Health indicators, target levels, and current status inMichigan and urban Southern Lower Peninsula
Target Michigan
UrbanSouthern
LowerPeninsula
Healthy People 2010 Objective % % %
21-1b: Reduce the proportion of children whohave dental caries experience in their primaryor permanent teeth, age 6-8 years.
42% 58% 60%
21-2b: Reduce the proportion of children whohave untreated dental decay, age 6-8 years. 21% 25% 31%
21-8: Increase the proportion of children whohave received sealants on their molar teeth,age 8 years.
50% 23% 21%

Parents reported their child had a toothache in the past six months when biting or chewing for 15.7% of urban Southern Lower Peninsula children.
Access to Oral Health ServicesAmong participating children, 86.6% of urban Southern Lower Peninsula children visited the dentist in the past year. However, significant racial andethnic disparities existed for annual dental utilization (Figure 21). Barriers toaccessing dental care were reported by 12.2% of parents in this region,including lack of insurance (32.1%), failure to find a dentist that accepted theirinsurance (25.7%), difficulty getting an appointment (24.8%), and affordabilityof dental care (20.5%). Private insurance covered 48.3% of children, while39.5% of children had public insurance and 12.2% had no dental insurance.Sealants were present on first molars in 21.2% of children, but rates werelower among both Whites and Hispanics.
Count Your Smiles 27
Figure 20: Proportion of urban Southern Lower Peninsula third grade children with caries experience, untreated dental decay, and immediate dental needs by race/ethnicity, 2005-06
Figure 21: Proportion of urban Southern Lower Peninsula third grade children with a dental visitin the past year and with sealants present on permanent first molars, by race/ethnicity, 2005-06
Southern Lower Peninsula—Urban

Southern Lower Peninsula—Rural
Children in the rural Southern Lower Peninsula were most likely to lack dentalinsurance and least likely to have sealants present when compared to allother areas in Michigan. The proportion of children who lack dental insuranceis higher than the proportion with sealants present on their first molars.
Socioeconomic differences in this population contribute significantly todisparate dental disease and dental utilization in this region.
Nearly half (44.6%) of all rural Southern Lower Peninsula third gradechildren have a visible need for either immediate or routine dental care.
Lack of dental insurance is a significant problem among rural Southern LowerPeninsula children. The proportion of children who lack dental insurance is higher than the proportion with sealants present on their first molars. These ruralchildren have the lowest prevalence of sealants among geographic regions in thestate. In addition, socioeconomic differences contribute to substantial disparitiesin untreated dental disease and immediate dental needs.
Oral DiseaseAmong rural Southern Lower Peninsula third grade children, 64.3% havecaries experience and 24.2% have untreated dental disease. Immediateneeds for dental care were observed for 12.5% of children, while 32.1% werein need of routine dental care. Children enrolled in the free and reduced lunchprogram had a higher prevalence of caries experience, untreated dentaldecay, and immediate dental needs than children who were not enrolled(Figure 22). A toothache in the past six months when biting or chewing wasreported by parents of 11.0% of third grade children.
Count Your Smiles 28
Table VIII: Healthy People 2010 Oral Health indicators, target levels, and current status inMichigan and rural Southern Lower Peninsula
Target Michigan
RuralSouthern
LowerPeninsula
Healthy People 2010 Objective % % %
21-1b: Reduce the proportion of children whohave dental caries experience in their primaryor permanent teeth, age 6-8 years.
42% 58% 64%
21-2b: Reduce the proportion of children whohave untreated dental decay, age 6-8 years. 21% 25% 24%
21-8: Increase the proportion of children whohave received sealants on their molar teeth,age 8 years.
50% 23% 18%

Access to Oral Health ServicesAnnual dental visits were reported for 85.5% of third grade children in the ruralSouthern Lower Peninsula. Problems obtaining dental care were reported for11.0% of children. Of those reporting a problem getting dental care, 51.2%lacked dental insurance, 39.7% could not afford dental care, and 16.3% couldnot find a dentist who accepted their insurance. Private insurance covered62.1% of third grade children, public insurance covered 18.3%, and 19.6%were uninsured for dental services. Sealants were present on first molars injust 18.1% of children. While free and reduced lunch participants had similarprevalence of sealants as those not enrolled, children attending schools with ahigh percentage of free and reduced lunch participation had higher rates ofsealants present than children attending schools with a low percentage of freeand reduced lunch participation (Figure 23).
Count Your Smiles 29
Figure 22: Proportion of rural Southern Lower Peninsula third grade children with caries experience, untreated dental disease and immediate dental needs by enrollment in the free andreduced lunch (FRL) program, 2005-06
Figure 23: Proportion of rural Southern Lower Peninsula third grade children with sealants present on first molars by enrollment in the free and reduced lunch (FRL) program and by percentof children enrolled in the free and reduced lunch program within the school
Southern Lower Peninsula—Rural

Macomb County
Macomb County third grade children meet the Healthy People 2010objective for untreated decay, but fall just short of meeting the HealthyPeople 2010 objective for caries experience.
Socioeconomic disparity appears to be a significant problem for dentaldisease among third grade children in Macomb County.
Macomb County third grade children perform well on Healthy People 2010measures for caries experience and untreated decay, but fall well short of theHealthy People 2010 goal for sealants. Free and reduced lunch participantshad more caries experience and untreated decay than children not enrolled inthis program, which is suggestive of socioeconomic disparities in dental disease. Lack of dental insurance was also a significant problem in MacombCounty with nearly one in five children lacking any dental coverage.
Oral DiseaseMacomb County third grade children had significantly lower rates of cariesexperience and untreated dental disease than the rest of Michigan. Carieswere present in 46.4% of children, but this was not statistically different thanthe Healthy People 2010 target of 42%. Untreated dental disease was present in 12.9% of Macomb County third grade children, statistically lowerthan the Healthy People 2010 target of 21%. Free and reduced lunch participants appear to experience a greater degree of dental decay (Figure 24). A substantial majority of children (87.5%) had no obvious dentalproblems at screening. Urgent dental needs were visible in 3.4% of children,while 9.1% were in need of routine dental care. Parents reported a toothachein the past six months when chewing or biting for 9.1% of Macomb Countychildren.
Count Your Smiles 30
Table IX: Healthy People 2010 Oral Health indicators, target levels, and current status inMichigan and Macomb County
Target Michigan MacombCounty
Healthy People 2010 Objective % % %
21-1b: Reduce the proportion of children whohave dental caries experience in their primaryor permanent teeth, age 6-8 years.
42% 58% 46%
21-2b: Reduce the proportion of children whohave untreated dental decay, age 6-8 years. 21% 25% 13%
21-8: Increase the proportion of children whohave received sealants on their molar teeth,age 8 years.
50% 23% 28%

Access to Oral Health ServicesWithin the past year, 90.6% of Macomb County third grade children had visit-ed the dentist. Meanwhile, 6.0% of parents reported a barrier to their childreceiving needed dental care. Among parents who reported a problem, 91.1%reported a lack of dental insurance as a reason for the child not getting dentalcare, and similarly, 91.1% also reported they could not afford dental care.Nearly two out of every three children (68.2%) were covered by private dentalinsurance, 13.4% by public insurance, and 18.4% were uninsured for dentalservices. Sealants were present on first molars in 28.5% of Macomb Countychildren. Unlike disease, access was similar between children enrolled in thefree and reduced lunch program and those not enrolled (Figure 25).
Count Your Smiles 31
Figure 24: Proportion of Macomb County third grade children with caries experience and untreated dental decay, by enrollment in the free and reduced lunch (FRL) program, 2005-06
Figure 25: Proportion of Macomb County third grade children with a dental visit in the past yearand with sealants present on first molars, by enrollment in the free and reduced lunch (FRL) program, 2005-06
Macomb County

Oakland County
Oakland County third grade children meet the Healthy People 2010objective for caries experience and exceed the Healthy People 2010objective for untreated decay. However, Oakland County third gradechildren fall significantly short of meeting the Healthy People 2010objective for sealants.
There are significant racial and socioeconomic disparities in untreateddental disease and immediacy of dental needs in Oakland County.Likewise, there are significant racial and socioeconomic disparities inmeasures of access such as annual dental visits, difficulty obtaining care,and presence of sealants.
Oakland County third grade children perform well on Healthy People 2010measures of caries experience and untreated decay. Similar to MacombCounty children however, Oakland County children fall significantly short ofthe Healthy People 2010 measure on sealants. Free and reduced lunchparticipants appear to have more dental disease and less dental care accessthan children not enrolled in the free and reduced lunch program.
Oral DiseaseOakland County has a much lower prevalence of caries experience (41.9%)compared to Michigan, thus meeting Healthy People 2010 objectives for thismeasure. Oakland County also has a substantially lower prevalence ofuntreated dental decay (16.2%) which exceeds the Healthy People 2010 target. Oakland County also had a relatively low prevalence of children inimmediate need of dental care (4.7%) and in need of routine dental care(12.4%). However, there were substantial racial and socioeconomic differences in most measures of dental disease in Oakland County. African American children and free and reduced lunch participants had higher rates of
Count Your Smiles 32
Table X: Healthy People 2010 Oral Health indicators, target levels, and current status in Michiganand Oakland County
Target Michigan OaklandCounty
Healthy People 2010 Objective % % %
21-1b: Reduce the proportion of children whohave dental caries experience in their primaryor permanent teeth, age 6-8 years.
42% 58% 42%
21-2b: Reduce the proportion of children whohave untreated dental decay, age 6-8 years. 21% 25% 16%
21-8: Increase the proportion of children whohave received sealants on their molar teeth,age 8 years.
50% 23% 29%

untreated dental disease than other children (Figure 26). Parents of 11.6% ofchildren reported their child had a toothache in the past six months when biting or chewing.
Access to Oral Health ServicesDespite the low prevalence of disease, 78.8% of Oakland County children visited the dentist in the past year. Problems obtaining dental care for theirchild in the past year were reported by 11.9% of parents. Among parents whoreported a problem, 53.2% reported a lack of insurance and 38.7% could notafford dental care. Nearly two in three children (65.5%) were covered by private insurance while 19.5% were covered through public insurance and15.1% were uninsured for dental care. Sealants were present on first molarsin 29.1% of Oakland County third grade children. Free and reduced lunch participants had fewer dental visits in the past year and lower rates of sealantspresent on first molars (Figure 27).
Count Your Smiles 33
Figure 26: Proportion of Oakland County third grade children with untreated dental decay byenrollment in the free and reduced lunch (FRL) program and race/ethnicity, 2005-06
Figure 27: Proportion of Oakland County third grade children with a dental visit in the past yearand sealants present on first molars, by enrollment in the free and reduced lunch (FRL) program, 2005-06
Oakland County

Wayne County
Wayne County third grade children fall short of meeting Healthy People2010 objectives for caries experience, untreated dental decay, andsealants.
There are substantial socioeconomic disparities in both dental disease anddental access among Wayne County third grade children.
One in nine Wayne County third grade children lack dental insurance. Lack ofinsurance was the primary cited reason for not getting needed dental care.
Wayne County third grade children have higher rates of caries experience anduntreated dental decay than Michigan third grade children as a whole.Sealant rates, however, are slightly higher in Wayne County children than inall Michigan children. Free and reduced lunch participants have substantiallyhigher rates of caries experience and untreated decay, less access to dentalcare, and a lower rate of sealants applied to first molars.
Oral DiseaseCaries experience was present in 59.6% of Wayne County third grade children, and untreated dental disease was present in 26.0%. There weresubstantial disparities in both caries experience and untreated dental diseasebetween free and reduced lunch participants and non-participants (Figure 28).Three out of four children (73.9%) had no immediate dental needs, but 23.2%were in need of routine care and 2.8% had immediate dental needs. Parentsreported a toothache in the past six months when chewing or biting for 16.6%of children, the highest level among the geographic regions.
Count Your Smiles 34
Table XI: Healthy People 2010 Oral Health indicators, target levels, and current status inMichigan and Wayne County
Target Michigan WayneCounty
Healthy People 2010 Objective % % %
21-1b: Reduce the proportion of children whohave dental caries experience in their primaryor permanent teeth, age 6-8 years.
42% 58% 60%
21-2b: Reduce the proportion of children whohave untreated dental decay, age 6-8 years. 21% 25% 26%
21-8: Increase the proportion of children whohave received sealants on their molar teeth,age 8 years.
50% 23% 26%
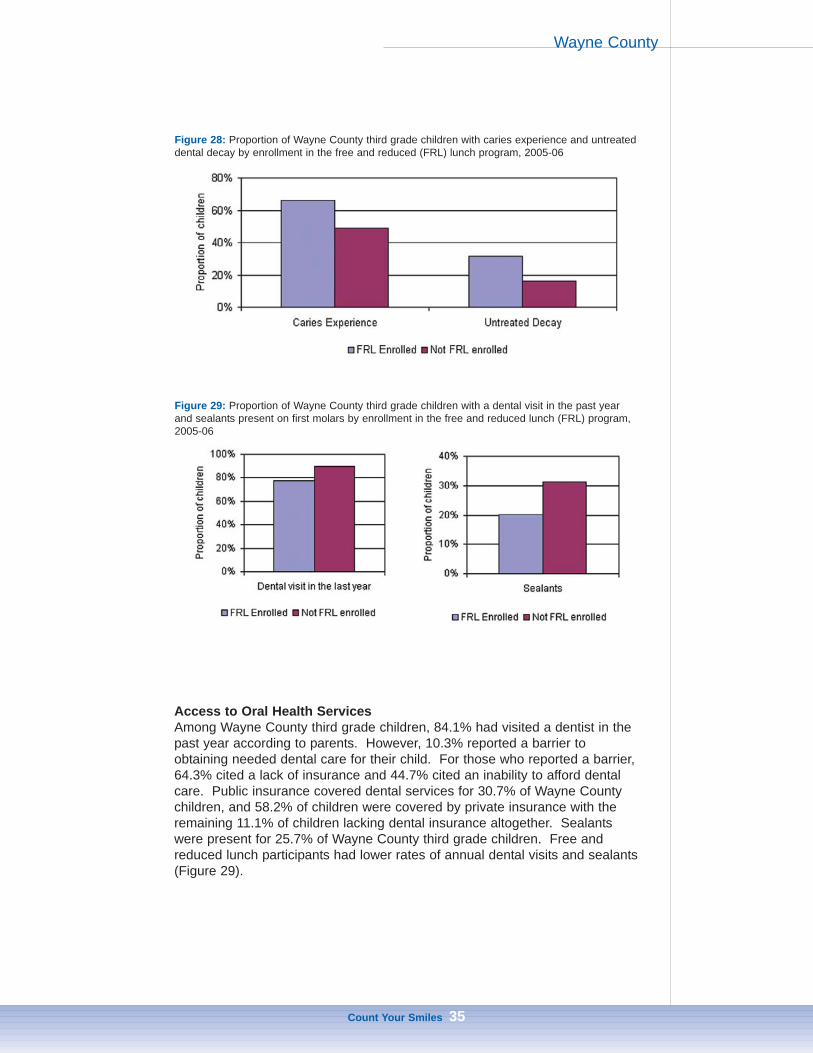
Access to Oral Health ServicesAmong Wayne County third grade children, 84.1% had visited a dentist in thepast year according to parents. However, 10.3% reported a barrier to obtaining needed dental care for their child. For those who reported a barrier,64.3% cited a lack of insurance and 44.7% cited an inability to afford dentalcare. Public insurance covered dental services for 30.7% of Wayne Countychildren, and 58.2% of children were covered by private insurance with theremaining 11.1% of children lacking dental insurance altogether. Sealantswere present for 25.7% of Wayne County third grade children. Free andreduced lunch participants had lower rates of annual dental visits and sealants(Figure 29).
Count Your Smiles 35
Figure 28: Proportion of Wayne County third grade children with caries experience and untreateddental decay by enrollment in the free and reduced (FRL) lunch program, 2005-06
Figure 29: Proportion of Wayne County third grade children with a dental visit in the past yearand sealants present on first molars by enrollment in the free and reduced lunch (FRL) program,2005-06
Wayne County

Conclusion
Dental disease in Michigan children is a significant yet preventable problem.As a result of this survey, populations with elevated rates of dental diseasehave been identified. Programs and policies targeting the specific needs ofthese populations must now be developed to reduce their burden of disease.
Access to needed dental services is limited by insurance, affordability, and availability. Disparate access to services corresponded to a disparate burden oforal disease in Michigan children. Improved access to needed dental care canreduce the burden of the associated pain of living with untreated dental disease.
Community water fluoridation can significantly reduce dental caries.Expansion of water fluoridation to all communities, particularly communities innorthern Michigan, could have a significant impact on caries reduction. Also,increased use of sealants could benefit children statewide. Michigan is currently one of 11 states nationally that lacks a statewide sealant program,perhaps the primary reason for Michigan’s next-to-last ranking among statesfor children having a sealant placed on first molars. Statewide, access to dental care appears positive, yet there are still pockets of the population whodo not have access to needed services. Many opportunities exist to reducedental disease in children all across Michigan.
For more information about this document or other oral health information,contact the Michigan Department of Community Health, Oral Health Programat 517/335-8388. Or visit the State of Michigan’s Oral Health website athttp://www.michigan.gov/oralhealth or e-mail [email protected].
Count Your Smiles 36

References
Kitchens DH. “The economics of pit and fissure sealants in preventivedentistry: a review”. Journal of Contemporary Dental Practice.2005;3:95-103.
Moynihan P, Petersen PE. “Diet, nutrition and the prevention of dentaldiseases.” Public Health Nutrition. 2004;7:201-26.
Stevens GD, Seid M, Mistry R, Halfon N. “Disparities in primary care for vulnerable children: the influence of multiple risk factors.” HealthServices Research. 2006;41:507-31.
(USDHHS) U.S. Department of Health and Human Services. Oral Health inAmerica: a Report of the Surgeon General. Rockville, MD: U.S.Department of Health and Human Services, National Institute ofDental and Craniofacial Research, National Institutes of Health, 2000.
(USDHHS) U.S. Department of Health and Human Services. Oral Health. In:Healthy People 2010 (2nd ed). With Understanding and ImprovingHealth and Objectives for Improving Health. 2 vols. Washington, DC:U.S. Government Printing Office; 2000.
Yu SM, Bellamy HA, Kogan MD, Dunbar JL, Schwalberg RH, Schuster MA. “Factors that influence receipt of recommended preventive pediatrichealth and dental care”. Pediatrics. 2002;110;73-80.
Count Your Smiles 37

Appendix
Count Your Smiles 38
Table A1:Proportion of Michigan third grade children with caries experience, 2005-06—Count Your Smiles
Primary Caries
Experience
PermanentCaries
Experience
Primary orPermanent
CariesExperience
N % N % N %
Michigan (All children)Upper PeninsulaNorthern Lower PeninsulaCity of DetroitSuburban DetroitSouthern Lower Peninsula
87112015148
201351
53.5+/-3.465.3+/-12.963.8+/-10.661.2+/-13.243.9+/-5.956.8+/-4.8
29453481957117
17.5+/-2.929.3+/-8.320.6+/-5.922.7+/13.011.5+/-3.419.7+/-4.9
94313215750
218386
58.0+/-3.270.3+/-12.966.2+/-11.363.2+/-12.847.9+/-5.162.1+/-4.6
By Age<9 years9 years or older
629238
51.7+/-3.759.1+/-6.7
21082
16.9+/-2.919.5+/-5.7
686253
56.5+/-3.562.7+/-6.6
By GenderMaleFemale
429435
54.2+/-4.052.7+/-4.4
131162
16.3+/-3.218.8+/-3.9
464472
58.7+/-3.857.1+/-4.2
By Race/EthnicityWhiteAfrican AmericanHispanicNative AmericanAsian American
650101573116
52.7+/-4.151.2+/-6.069.9+/-10.475.9+/-13.546.0+/-18.2
217441712*
16.7+/-3.122.0+/-7.222.0+/-10.017.1+/-12.7*
706111583218
57.3+/-3.856.5+/-5.671.6+/-10.276.4+/-13.550.2+/-17.6
By Dental InsurancePrivatePublicNo Insurance
416271118
47.5+/-4.463.5+/-5.051.1+/-7.7
11411446
12.6+/-2.725.7+/-4.520.5+/-7.6
451291131
51.6+/-3.967.8+/-4.857.7+/-7.6
By Free/Reduced LunchEnrolledNot Enrolled
375418
62.5+/-4.746.4+/-4.4
148122
24.3+/-4.613.1+/-2.6
401458
67.2+/-4.350.8+/-3.6
Language Spoken at HomeEnglishOther
72997
52.6+/-3.755.4+/-10.1
25224
17.7+/-3.114.4+/-6.9
791101
57.3+/-3.557.3+/-9.2
All proportion estimates include 95% confidence intervals, N=number of positive respondents*Fewer than five events, information suppressed

Count Your Smiles 39
Table A2:Proportion of Michigan third grade children with untreated dental decay, 2005-06—Count Your Smiles
UntreatedPrimary Decay
UntreatedPermanent
Decay
UntreatedPrimary orPermanent
Decay
N % N % N %
Michigan (All children)Upper PeninsulaNorthern Lower PeninsulaCity of DetroitSuburban DetroitSouthern Lower Peninsula
35252582277
143
21.+/-3.228.7+/-15.925.9+/-14.626.7+/-9.716.6+/-5.423.6+/-4.5
12421238
2448
7.3+/-2.210.0+/-4.39.6+/-4.58.7+/-9.34.5+/-2.28.5+/-3.8
40363642585
166
25.0+/-3.633.0+/-15.228.1+/-13.929.6+/-9.918.3+/-5.527.9+/-5.7
By Age<9 years9 years or older
241110
19.6+/-3.328.9+/-6.6
8934
6.7+/-2.39.2+/-3.7
281121
23.0+/-3.831.6+/-7.1
By GenderMaleFemale
168181
21.0+/-3.822.5+/-4.2
5865
6.9+/-2.97.7+/-2.3
195205
24.8+/-4.725.3+/-4.6
By Race/EthnicityWhiteAfrican AmericanHispanicNative AmericanAsian American
2296232129
17.2+/-3.330.7+/-6.340.5+/-12.220.7+/-15.129.6+/-29.3
8326116*
6.2+/-2.411.3+/-5.213.5+/-6.69.0+/-10.4*
26771341511
20.5+/-3.934.7+/-5.742.6+/-12.223.7+/-15.133.8+/-28.7
By Dental InsurancePrivatePublicNo Insurance
13612656
15.0+/-3.331.8+/-4.823.4+/-6.7
355225
3.3+/-1.410.7+/-3.313.1+/-5.2
15414468
16.8+/-3.535.5+/-4.831.2+/-6.8
By Free/Reduced LunchEnrolledNot Enrolled
174142
29.7+/-4.515.3+/-3.3
7039
11.5+/-4.33.9+/-1.6
198163
34.2+/-5.217.5+/-3.6
Language Spoken at HomeEnglishOther
28643
20.3+/-3.026.6+/-8.7
1069
7.2+/-2.45.5+/-3.6
33146
23.8+/-3.627.9+/-9.0
All proportion estimates include 95% confidence intervals, N = number of positive respondents*Fewer than five events, information suppressed
Appendix

Count Your Smiles 40
Table A3:Urgency of dental treatment needs in Michigan third grade children, 2005-06—Count Your Smiles
No ObviousProblem
Routine DentalCare Needed
ImmediateDental Care
Needed
N % N % N %
Michigan (All children)Upper PeninsulaNorthern Lower PeninsulaCity of DetroitSuburban DetroitSouthern Lower Peninsula
100113512849
352337
62.9+/-5.568.3+/-15.850.0+/-23.669.4+/-7.782.0+/-5.250.8+/-9.8
43852772660
223
27.5+/-4.227.3+/-13.539.3+/-25.530.6+/-7.713.8+/-4.334.4+/-6.9
1478
26*
2489
9.6+/-2.44.4+/-3.410.7+/-5.3*4.2+/-2.714.7+/-4.3
By Age<9 years9 years or older
768231
65.2+/-4.956.2+/-9.9
324111
26.6+/-3.930.1+/-6.6
9551
8.3+/-2.413.7+/-4.9
By GenderMaleFemale
449543
60.8+/-6.064.7+/-6.1
213223
27.7+/-4.927.4+/-4.6
8462
11.5+/-4.07.9+/-2.8
By Race/EthnicityWhiteAfrican AmericanHispanicNative AmericanAsian American
778108422519
65.1+/-6.457.4+/-10.048.8+/-13.064.2+/-13.854.6+/-30.2
3226724148
26.7+/-5.533.4+/-7.125.6+/-10.925.9+/-12.423.9+/-14.3
1001918*6
8.2+/-2.29.3+/-5.625.5+/-14.4*21.5+/-21.9
By Dental InsurancePrivatePublicNo Insurance
596231123
71.5+/-5.753.5+/-7.054.2+/-10.2
20813264
22.8+/-4.732.9+/-5.230.4+/-8.4
495232
5.7+/-2.213.7+/-4.515.4+/-5.3
By Free/Reduced LunchEnrolledNot Enrolled
336598
54.6+/-6.670.9+/-6.0
177213
32.2+/-5.322.4+/-4.8
7558
13.2+/-4.16.6+/-2.4
Language Spoken at HomeEnglishOther
860108
63.8+/-5.866.8+/-10.7
37237
27.6+/-4.920.3+/-6.7
11818
8.6+/-2.212.9+/-7.5
All proportion estimates include 95% confidence intervals, N = number of positive respondents*Fewer than five events, information suppressed
Appendix

Count Your Smiles 41
Table A4:Proportion of Michigan third grade children who had a toothache when biting or chewingin the past six months, 2005-06—Count Your Smiles
Proportion with a toothache when biting or chewing, past 6 months
N %
Michigan (All children)Upper PeninsulaNorthern Lower PeninsulaCity of DetroitSuburban DetroitSouthern Lower Peninsula
1722131184668
12.9+/-2.711.2+/-5.013.3+/-9.221.4+/-3.811.4+/-9.912.6+/-4.3
By Age<9 years9 years or older
12843
13.0+/-2.812.6+/-4.9
By GenderMaleFemale
7397
11.0+/-3.114.7+/-3.5
By Race/EthnicityWhiteAfrican AmericanHispanicNative AmericanAsian American
1123215*7
9.7+/-2.520.7+/-6.821.8+/-8.2*20.9+/-19.9
By Dental InsurancePrivatePublicNo Insurance
597624
8.2+/-2.321.7+/-5.410.2+/-4.5
By Free/Reduced LunchEnrolledNot Enrolled
10761
18.9+/-5.17.9+/-2.6
Language Spoken at HomeEnglishOther
14631
11.8+/-2.617.0+/-6.7
All proportion estimates include 95% confidence intervals, N = number of positiverespondents*Fewer than five events, information suppressed
Appendix
Count Your Smiles 42
Table A5:Time since last dental visit for Michigan third grade children, 2005-06—Count Your Smiles
Less than 1 yearMore than
1 year, lessthan 3 years
More than 3 years or never
N % N % N %
Michigan (All children)Upper PeninsulaNorthern Lower PeninsulaCity of DetroitSuburban DetroitSouthern Lower Peninsula
127716518554
351522
84.8+/-2.281.2+/-11.384.3+/-5.579.2+/-8.284.7+/-3.686.0+/-3.4
1782727115855
11.9+/-2.117.8+/-10.912.6+/-6.315.6+/-12.013.0+/-3.510.2+/-2.7
42*7*
1019
3.3+/-1.0*3.2+/-1.8*2.3+/-1.23.8+/-1.6
By Age<9 years9 years or older
973298
85.7+/-2.581.5+/-3.6
12553
11.1+/-2.314.8+/-3.9
3210
3.2+/-1.03.7+/-2.5
By GenderMaleFemale
603662
84.5+/-3.384.8+/-3.1
8890
12.0+/-2.712.1+/-3.0
1923
3.5+/-1.73.1+/-1.3
By Race/EthnicityWhiteAfrican AmericanHispanicNative AmericanAsian American
1041130563722
88.1+/-2.379.1+/-4.669.6+/-9.781.6+/-14.574.0+/-12.6
1202915*8
9.2+/-2.016.2+/-4.920.7+/-9.7*22.3+/-11.3
2887**
2.7+/-1.04.7+/-2.79.7+/-6.5**
By Dental InsurancePrivatePublicNo Insurance
783324147
91.7+/-2.380.0+/-4.666.6+/-6.7
597146
6.9+/-2.017.9+/-4.621.8+/-6.3
99
20
1.4+/-0.92.1+/-1.411.6+/-4.6
By Free/Reduced LunchEnrolledNot Enrolled
441780
77.3+/-4.189.6+/-2.5
10467
18.1+/-4.27.9+/-2.2
2019
4.6+/-1.92.5+/-1.2
Language Spoken at HomeEnglishOther
1143124
85.3+/-2.280.3+/-7.2
15325
11.2+/-2.117.9+/-6.2
39*
3.5+/-1.1*
All proportion estimates include 95% confidence intervals, N = number of positive respondents*Fewer than five events, information suppressed
Appendix

Count Your Smiles 43
Table A6:Proportion of Michigan third grade children who experienced difficulty obtaining dentalcare in the past year, 2005-06—Count Your Smiles
Proportion who experienced difficulty obtaining dental care
N %
Michigan (All children)Upper PeninsulaNorthern Lower PeninsulaCity of DetroitSuburban DetroitSouthern Lower Peninsula
14511296
4059
10.9+/-2.15.6+/-4.213.6+/-5.710.1+/-7.710.1+/-3.411.5+/-3.3
By Age<9 years9 years or older
10738
10.9+/-2.611.3+/-4.1
By GenderMaleFemale
6283
10.0+/-2.612.0+/-3.0
By Race/EthnicityWhiteAfrican AmericanHispanicNative AmericanAsian American
1102413*5
9.8+/-2.115.7+/-6.421.7+/-9.1*14.4+/-11.8
By Dental InsurancePrivatePublicNo Insurance
444351
5.6+/-2.013.2+/-3.525.9+/-5.6
By Free/Reduced LunchEnrolledNot Enrolled
7756
15.7+/-3.86.7+/-1.9
Language Spoken at HomeEnglishOther
12915
10.6+/-2.213.4+/-5.5
All proportion estimates include 95% confidence intervals, N = number of positiverespondents*Fewer than five events, information suppressed
Appendix
Count Your Smiles 44
Table A7:Proportion of Michigan third grade children with sealants present on permanent firstmolars, 2005-06—Count Your Smiles
Proportion with sealants present on first molars
N %
Michigan (All children)Upper PeninsulaNorthern Lower PeninsulaCity of DetroitSuburban DetroitSouthern Lower Peninsula
388586814
126122
23.3+/-3.626.3+/-12.629.1+/-9.222.5+/-21.128.4+/-6.719.2+/-4.5
By Age<9 years9 years or older
30085
23.7+/-3.521.6+/-6.4
By GenderMaleFemale
173213
22.1+/-4.824.6+/-3.9
By Race/EthnicityWhiteAfrican AmericanHispanicNative AmericanAsian American
3054116138
24.5+/-4.224.3+/-10.314.6+/-7.928.7+/-14.527.2+/-13.4
By Dental InsurancePrivatePublicNo Insurance
22111138
24.3+/-4.526.7+/-6.116.8+/-5.5
By Free/Reduced LunchEnrolledNot Enrolled
126227
20.6+/-4.825.2+/-4.8
Language Spoken at HomeEnglishOther
34528
25.0+/-4.114.1+/-5.2
All proportion estimates include 95% confidence intervals, N = number of positiverespondents*Fewer than five events, information suppressed
Appendix

Michigan Department of Community Health
This report was prepared through a collaborative between the Michigan Department of Community Health Division of Epidemiology and the Division of Family and Community Health. The development of this report was funded through cooperative agreement PA #033022
between the Michigan Department of Community Health and the Centers for Disease Control and Prevention. Technical assistance was provided through the Association of State and Territorial Dental Directors. The Michigan Department of Community Health
is an equal opportunity employer, services and programs provider.