counting students in total vet students and courses€¦ · web viewcounting students in . total...
TRANSCRIPT
TECHNICAL PAPER
Counting students in Total VET students and courses
Toni Cavallaro, Hiranya Senarath and Jesse AscensioNational Centre for Vocational Education Research
Publisher’s note
The views and opinions expressed in this document are those of NCVER and do not necessarily reflect the views of the Australian Government, or state and territory governments. Any interpretation of data is the responsibility of the author/project team.
© National Centre for Vocational Education Research, 2017
With the exception of the Commonwealth Coat of Arms, the Department’s logo, any material protected by a trade mark and where otherwise noted all material presented in this document is provided under a Creative Commons Attribution 3.0 Australia <http://creativecommons.org/licenses/by/3.0/au> licence.
The details of the relevant licence conditions are available on the Creative Commons website (accessible using the links provided) as is the full legal code for the CC BY 3.0 AU licence <http://creativecommons.org/licenses/by/3.0/legalcode>.
The Creative Commons licence conditions do not apply to all logos, graphic design, artwork and photographs. Requests and enquiries concerning other reproduction and rights should be directed to the National Centre for Vocational Education Research (NCVER).
This document should be attributed as Cavallaro, T, Senarath, H, Ascensio, J 2017, Counting students in Total VET students and courses, NCVER, Adelaide.
This work has been produced by NCVER on behalf of the Australian Government and state and territory governments, with funding provided through the Australian Government Department of Education and Training.
COVER IMAGE: GETTY IMAGES/iStock
ISBN 978-1-925173-91-8TD/TNC 129.06
Published by NCVER, ABN 87 007 967 311
Level 5, 60 Light Square, Adelaide SA 5000PO Box 8288 Station Arcade, Adelaide SA 5000, Australia
Phone +61 8 8230 8400 Email [email protected] Web <https://www.ncver.edu.au> <https://www.lsay.edu.au>
Contents
i Introduction 4Background 5Methodology 6
Options considered 6Methodology applied (option 2) 7Assumptions and limitations 8Duplication in training activity 8Counting total VET students by training provider 9Counting students in government-funded training 10
Future considerations 11Attachment A 12
Summary of USI data qualityAttachment B 14
Pseudo code for the de-duplication method applied to TVA student counts (option 2)
Attachment C 15Logic applied to mismatching student demographics
Attachment D 18Rates of de-duplication by selected student characteristics, 2015—16
Attachment E 20Impact on NCVER publications and data products
Tables1 The number of students with subject enrolments or program completions that
were reported with a USI by submission pathway 52 Options considered 63 Estimated TVA student counts by option, 2015—16 74 Number and percentage of records that have mismatching characteristics for
de-duplicated student counts 85 Estimated duplication rate by individual training provider, 2016 96 Estimated duplication in government-funded student counts by state/territory,
2015—16 10A1 Students with missing USIs by demographic characteristics, 2016 12A2 Compromised USIs by submission pathway, 2016 13
D1 Rates of de-duplication by selected student characteristics, 2015—1618
E1 Summary of impacts on NCVER publications and data products 20
NCVER 3
i
IntroductionVocational education and training (VET) by nature is diverse, spanning a wide range of learning engagements from full-time programs across multiple years, short ‘skill set’ programs, to single subject enrolments. Student participation can also be wide ranging, with some students receiving training from multiple training organisations within the same year.
If a student has enrolled with more than one training provider during a collection period, it is possible for them to be counted more than once. Therefore, estimated total VET student counts (and the participation rate based on these counts) may be inflated, as noted in Total VET students and courses 2015. Until now, the National Centre for Vocational Education Research (NCVER) has had no reliable way to identify and eliminate duplicate student records, as NCVER does not hold students’ names or addresses.
From 1 January 2015, all new and continuing students undertaking nationally recognised VET in Australia are required to have a unique student identifier (USI) in order to receive a qualification or statement of attainment. The USI is a randomly generated alpha-numeric code recorded against any nationally recognised training undertaken and remains with an individual for life. The implementation of the USI provides a mechanism with which to identify and potentially remove duplicate student records.
This is a technical paper describing options and the optimal method used to remove duplicate student records.
4 Counting students in Total VET students and courses
BackgroundSince the introduction of total VET activity (TVA), NCVER has applied a process to identify
and remove duplicate training activity where the same activity is reported for the same training provider, in the same collection period, via different data submitters. Student numbers were calculated based on a count of distinct client identifiers within each submission, which may have been received from a State Training Authority (STA), a Board of Study (BoS) or a registered training organisation (RTO).
Implementation of the unique student identifier in 2015 provides a means to derive a more accurate estimate of distinct student counts. The USI scheme encompasses nationally recognised training delivered by RTOs to either an Australian citizen or international student studying VET within Australia (below the bachelor degree level). Its scope is slightly different from that of TVA in that it excludes off-shore international students and non-nationally recognised training activity.
Although USI coverage is improving, it is neither complete nor perfect in its use. In 2016, 83% of total VET students were reported with a USI, compared with 71% in 2015. Table 1 provides information on the number of students with subject enrolments or program completions that were reported with a USI by submission pathway. Given this improving coverage and the latest collection findings, which show growth (still minority) in the proportion of enrolments in shorter courses, skill sets and subject only enrolments, the opportunity to tackle de-duplication of student counts is now.
NCVER evaluated several options before settling on an appropriate de-duplication process for student counts that can be applied to 2015 and 2016 total VET activity data (but not to 2014 as the USI is not available). The developed process considered the need to facilitate reporting on the:
number of VET students nationally and by state/territory
number of VET students enrolled with each training provider, noting these will not sum to the national total where students have enrolled with more than one training provider in the same collection period.
The adoption of an optimal de-duplication process for 2015 and 2016 TVA data also needed to be replicable and reliable in future years, potentially subject to further incremental refinements (as needed) as we approach the ideal of full adoption of the USI.
To this end, NCVER settled on a two-step process to de-duplicate student counts in Total VET students and courses 2016, using the USI where available and then applying a subsequent process on the residual data. This paper describes the method in detail, as well as outlining the other options considered.
Table 1 The number of students with subject enrolments or program completions that were reported with a USI by submission pathway
Submission pathway
2015 2016
USI reported USI missing USI reported USI missing
Students % Students % Total Students % Students % Total
State training authority 1 592 900 71 655 300 29 2 248 100 1 871 400 85 328 300 15 2 199 700
Direct submitter 1 712 200 74 600 100 26 2 312 300 2 295 200 83 473 800 17 2 769 000
NCVER 5
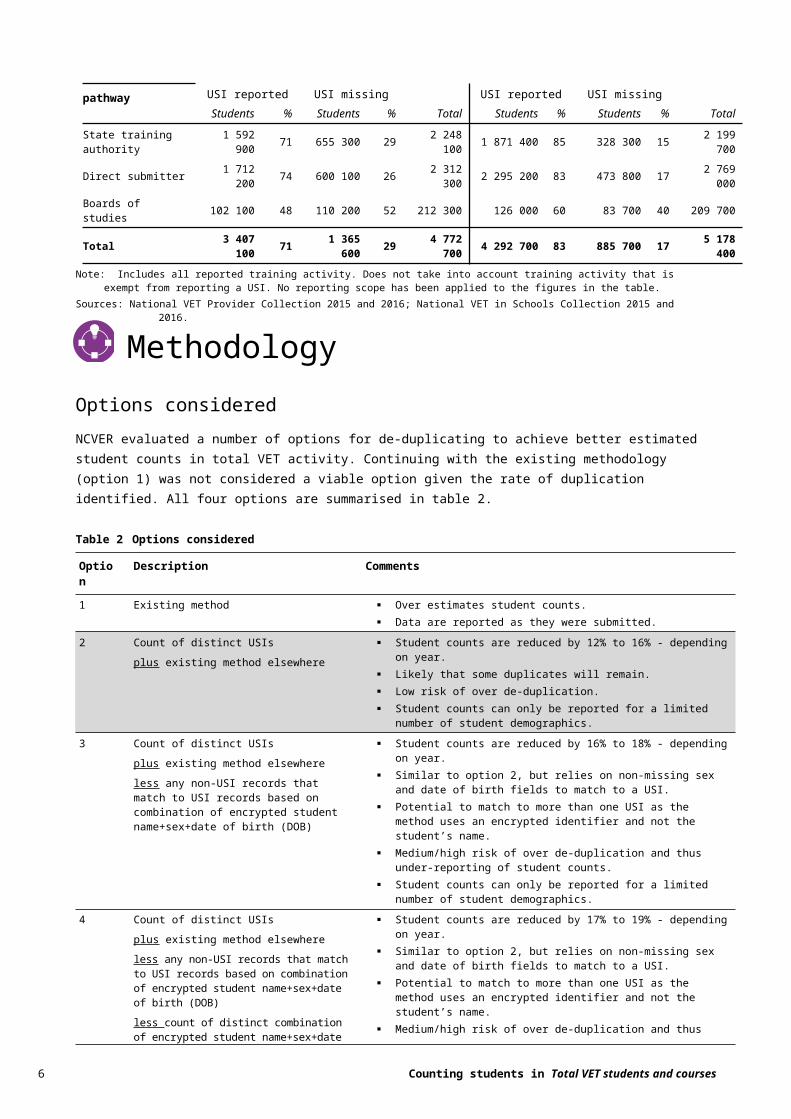
Boards of studies 102 100 48 110 200 52 212 300 126 000 60 83 700 40 209 700
Total 3 407 100 71 1 365 600 29 4 772 700 4 292 700 83 885 700 17 5 178 400
Note: Includes all reported training activity. Does not take into account training activity that is exempt from reporting a USI. No reporting scope has been applied to the figures in the table.
Sources: National VET Provider Collection 2015 and 2016; National VET in Schools Collection 2015 and 2016.
MethodologyOptions considered
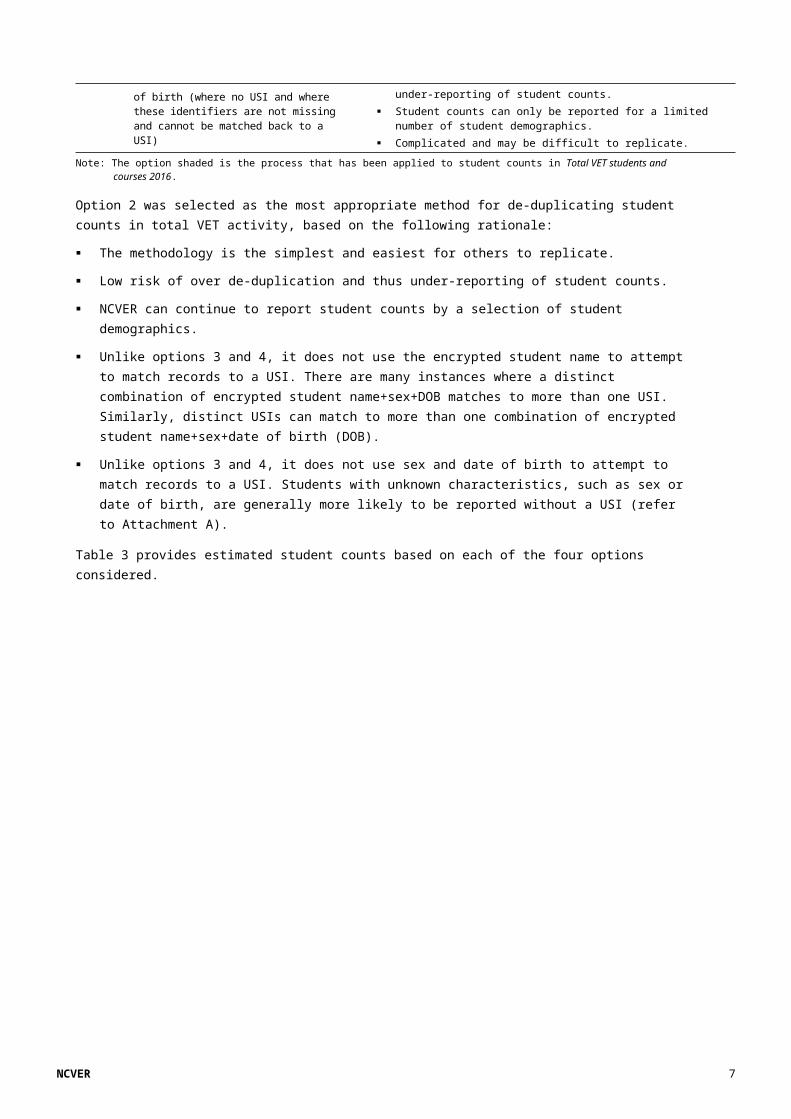
NCVER evaluated a number of options for de-duplicating to achieve better estimated student counts in total VET activity. Continuing with the existing methodology (option 1) was not considered a viable option given the rate of duplication identified. All four options are summarised in table 2.
Table 2 Options considered
Option Description Comments
1 Existing method Over estimates student counts. Data are reported as they were submitted.
2 Count of distinct USIs
plus existing method elsewhere
Student counts are reduced by 12% to 16% - depending on year. Likely that some duplicates will remain. Low risk of over de-duplication. Student counts can only be reported for a limited number of student
demographics.
3 Count of distinct USIs
plus existing method elsewhere
less any non-USI records that match to USI records based on combination of encrypted student name+sex+date of birth (DOB)
Student counts are reduced by 16% to 18% - depending on year. Similar to option 2, but relies on non-missing sex and date of birth
fields to match to a USI. Potential to match to more than one USI as the method uses an
encrypted identifier and not the student’s name. Medium/high risk of over de-duplication and thus under-reporting of
student counts. Student counts can only be reported for a limited number of student
demographics.
4 Count of distinct USIs
plus existing method elsewhere
less any non-USI records that match to USI records based on combination of encrypted student name+sex+date of birth (DOB)
less count of distinct combination of encrypted student name+sex+date of birth (where no USI and where these identifiers are not missing and cannot be matched back to a USI)
Student counts are reduced by 17% to 19% - depending on year. Similar to option 2, but relies on non-missing sex and date of birth
fields to match to a USI. Potential to match to more than one USI as the method uses an
encrypted identifier and not the student’s name. Medium/high risk of over de-duplication and thus under-reporting of
student counts. Student counts can only be reported for a limited number of student
demographics. Complicated and may be difficult to replicate.
Note: The option shaded is the process that has been applied to student counts in Total VET students and courses 2016.
Option 2 was selected as the most appropriate method for de-duplicating student counts in total VET activity, based on the following rationale:
The methodology is the simplest and easiest for others to replicate.
Low risk of over de-duplication and thus under-reporting of student counts.
NCVER can continue to report student counts by a selection of student demographics.
Unlike options 3 and 4, it does not use the encrypted student name to attempt to match records to a USI. There are many instances where a distinct combination of encrypted student name+sex+DOB matches to more than one USI. Similarly, distinct USIs can match to more than one combination of encrypted student name+sex+date of birth (DOB).
6 Counting students in Total VET students and courses
Unlike options 3 and 4, it does not use sex and date of birth to attempt to match records to a USI. Students with unknown characteristics, such as sex or date of birth, are generally more likely to be reported without a USI (refer to Attachment A).
Table 3 provides estimated student counts based on each of the four options considered.
NCVER 7
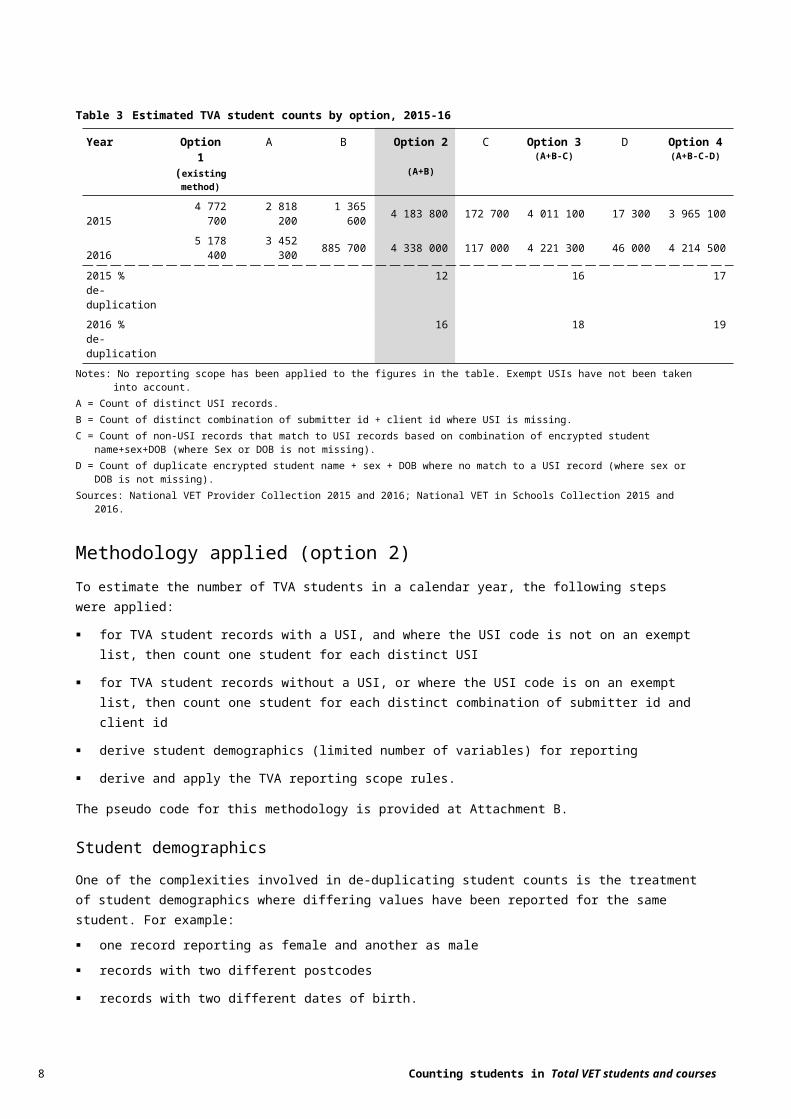
Table 3 Estimated TVA student counts by option, 2015-16
Year Option 1 (existing method)
A B Option 2 (A+B)
C Option 3(A+B-C)
D Option 4(A+B-C-D)
2015 4 772 700 2 818 200 1 365 600 4 183 800 172 700 4 011 100 17 300 3 965 100
2016 5 178 400 3 452 300 885 700 4 338 000 117 000 4 221 300 46 000 4 214 500
2015 % de-duplication
12 16 17
2016 % de-duplication
16 18 19
Notes: No reporting scope has been applied to the figures in the table. Exempt USIs have not been taken into account.A = Count of distinct USI records.B = Count of distinct combination of submitter id + client id where USI is missing.C = Count of non-USI records that match to USI records based on combination of encrypted student name+sex+DOB (where Sex or DOB is
not missing).D = Count of duplicate encrypted student name + sex + DOB where no match to a USI record (where sex or DOB is not missing).Sources: National VET Provider Collection 2015 and 2016; National VET in Schools Collection 2015 and 2016.
Methodology applied (option 2)
To estimate the number of TVA students in a calendar year, the following steps were applied:
for TVA student records with a USI, and where the USI code is not on an exempt list, then count one student for each distinct USI
for TVA student records without a USI, or where the USI code is on an exempt list, then count one student for each distinct combination of submitter id and client id
derive student demographics (limited number of variables) for reporting
derive and apply the TVA reporting scope rules.
The pseudo code for this methodology is provided at Attachment B.
Student demographics
One of the complexities involved in de-duplicating student counts is the treatment of student demographics where differing values have been reported for the same student. For example: one record reporting as female and another as male records with two different postcodes
records with two different dates of birth.
In cases where there are mismatching demographics, NCVER has developed and applied a set of rules when reporting student numbers by demographics (Attachment C). As a result, de-duplicated student counts are only reported for a limited number of demographic variables. These are: Sex Age Group State ID (client residential) Indigenous Flag Disability Flag At School Flag Highest Education Level
SA2 ID SEIFA ARIA Student Full-Time Flag Client Delivery Location State ID Provider Type Total VET Scope Flag
8 Counting students in Total VET students and courses
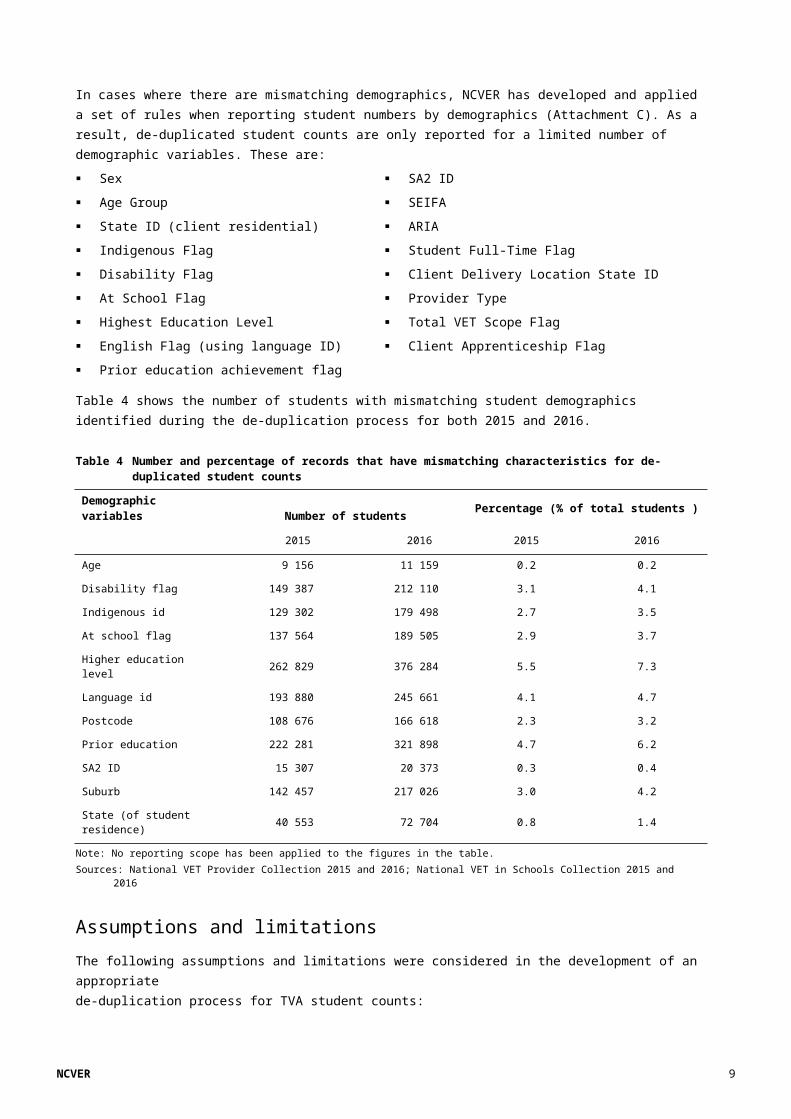
English Flag (using language ID) Prior education achievement flag
Client Apprenticeship Flag
Table 4 shows the number of students with mismatching student demographics identified during the de-duplication process for both 2015 and 2016.
Table 4 Number and percentage of records that have mismatching characteristics for de-duplicated student counts
Demographic variables Number of students Percentage (% of total students )
2015 2016 2015 2016
Age 9 156 11 159 0.2 0.2
Disability flag 149 387 212 110 3.1 4.1
Indigenous id 129 302 179 498 2.7 3.5
At school flag 137 564 189 505 2.9 3.7
Higher education level 262 829 376 284 5.5 7.3
Language id 193 880 245 661 4.1 4.7
Postcode 108 676 166 618 2.3 3.2
Prior education 222 281 321 898 4.7 6.2
SA2 ID 15 307 20 373 0.3 0.4
Suburb 142 457 217 026 3.0 4.2
State (of student residence) 40 553 72 704 0.8 1.4
Note: No reporting scope has been applied to the figures in the table.Sources: National VET Provider Collection 2015 and 2016; National VET in Schools Collection 2015 and 2016
Assumptions and limitations
The following assumptions and limitations were considered in the development of an appropriate de-duplication process for TVA student counts:
NCVER does not collect student names and addresses, and thus counting students is heavily reliant on using the USI, which in itself is not a perfect tool (refer to Attachment A for a summary of data quality issues identified with the reporting of the USI in 2015 and 2016).
Where supplied, the USI is valid, noting that NCVER introduced tighter validation rules for the 2016 collections to improve USI data quality.
As coverage of the USI becomes more complete and data quality on this field improves, the accuracy of student counts will improve.
A higher proportion of students were reported with a USI in 2016 compared with 2015, at 83% and 71% respectively.
Caution must be used when comparing de-duplicated student counts between 2015 and 2016, due to different rates of duplication across reported variables, which in part could be due to varying rates of USI provision (Attachment D).
A summary of the impact on NCVER’s statistical publications and data products from the application of the de-duplication process for TVA student counts is provided in Attachment E.
NCVER 9
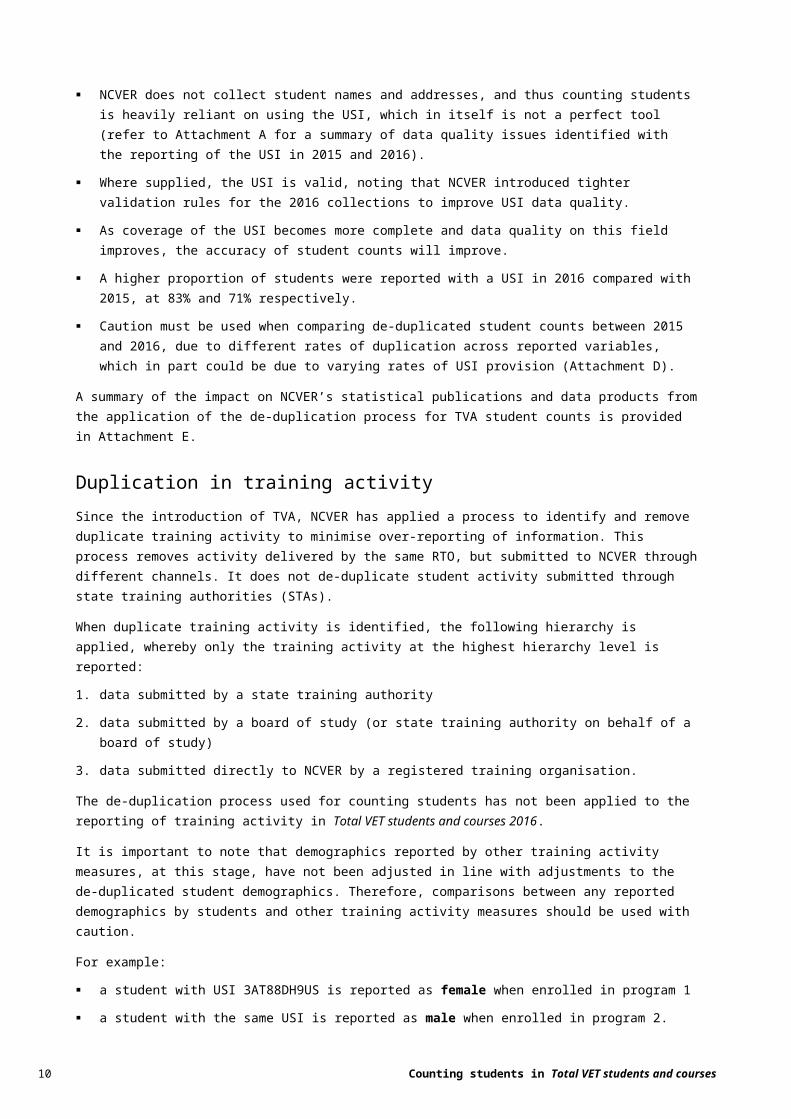
Duplication in training activity
Since the introduction of TVA, NCVER has applied a process to identify and remove duplicate training activity to minimise over-reporting of information. This process removes activity delivered by the same RTO, but submitted to NCVER through different channels. It does not de-duplicate student activity submitted through state training authorities (STAs).
When duplicate training activity is identified, the following hierarchy is applied, whereby only the training activity at the highest hierarchy level is reported:
1. data submitted by a state training authority
2. data submitted by a board of study (or state training authority on behalf of a board of study)
3. data submitted directly to NCVER by a registered training organisation.
The de-duplication process used for counting students has not been applied to the reporting of training activity in Total VET students and courses 2016.
It is important to note that demographics reported by other training activity measures, at this stage, have not been adjusted in line with adjustments to the de-duplicated student demographics. Therefore, comparisons between any reported demographics by students and other training activity measures should be used with caution.
For example:
a student with USI 3AT88DH9US is reported as female when enrolled in program 1
a student with the same USI is reported as male when enrolled in program 2.
This information will be reported by NCVER as:
one student with a ‘not known’ sex in estimates of student counts
one female program enrolment and one male program enrolment; rather than two program enrolments with a ‘not known’ sex.
Counting total VET students by training provider
As part of the de-duplication investigation, duplication rates by individual training provider were analysed. The results show that duplication by training provider is generally low, with more than 80% of training providers reporting no duplication in student counts, and 95% having less than 5% (table 5).
Table 5 Estimated duplication rate by individual training provider, 2016
Duplication rate Number of training providers
Per cent (%)
0 3 490 81.6
0.1 55 1.3
0.2-0.4% 119 2.8
0.5-0.9% 128 3.0
1-1.9% 112 2.6
2-2.9% 72 1.7
3-3.9% 56 1.3
4-4.9% 32 0.7
5-9.9% 97 2.3
10 Counting students in Total VET students and courses
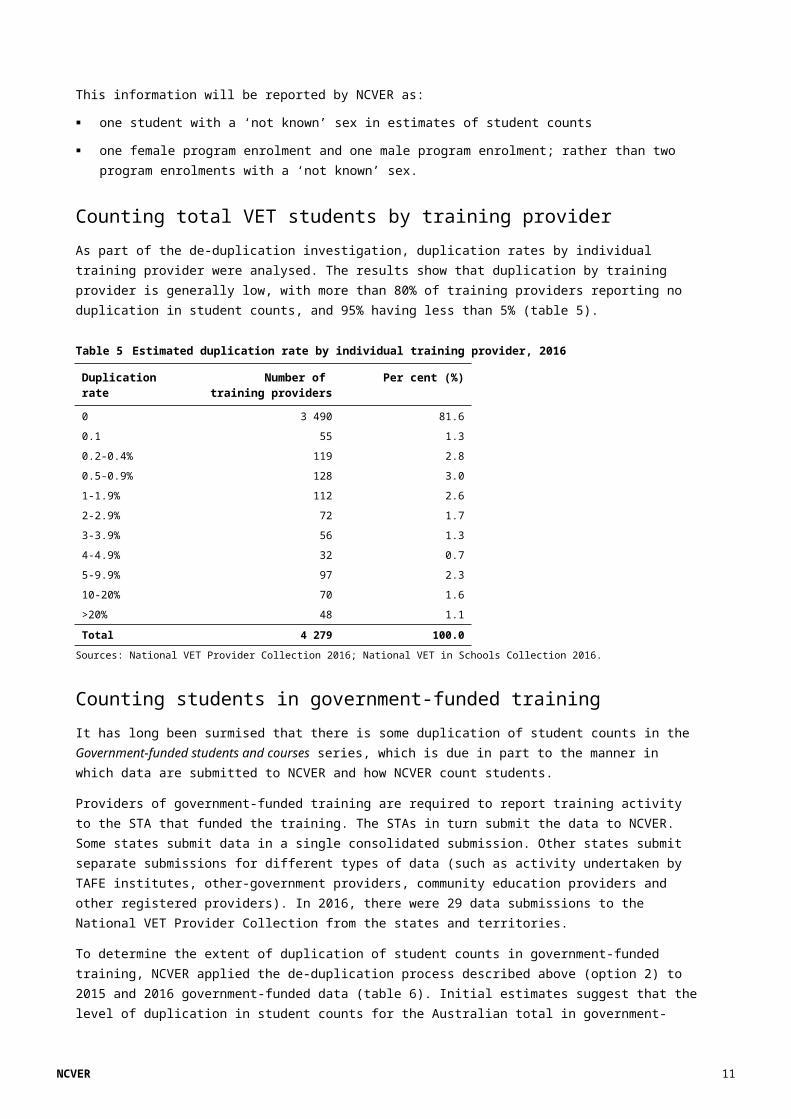
10-20% 70 1.6
>20% 48 1.1
Total 4 279 100.0Sources: National VET Provider Collection 2016; National VET in Schools Collection 2016.
Counting students in government-funded training
It has long been surmised that there is some duplication of student counts in the Government-funded students and courses series, which is due in part to the manner in which data are submitted to NCVER and how NCVER count students.
Providers of government-funded training are required to report training activity to the STA that funded the training. The STAs in turn submit the data to NCVER. Some states submit data in a single consolidated submission. Other states submit separate submissions for different types of data (such as activity undertaken by TAFE institutes, other-government providers, community education providers and other registered providers). In 2016, there were 29 data submissions to the National VET Provider Collection from the states and territories.
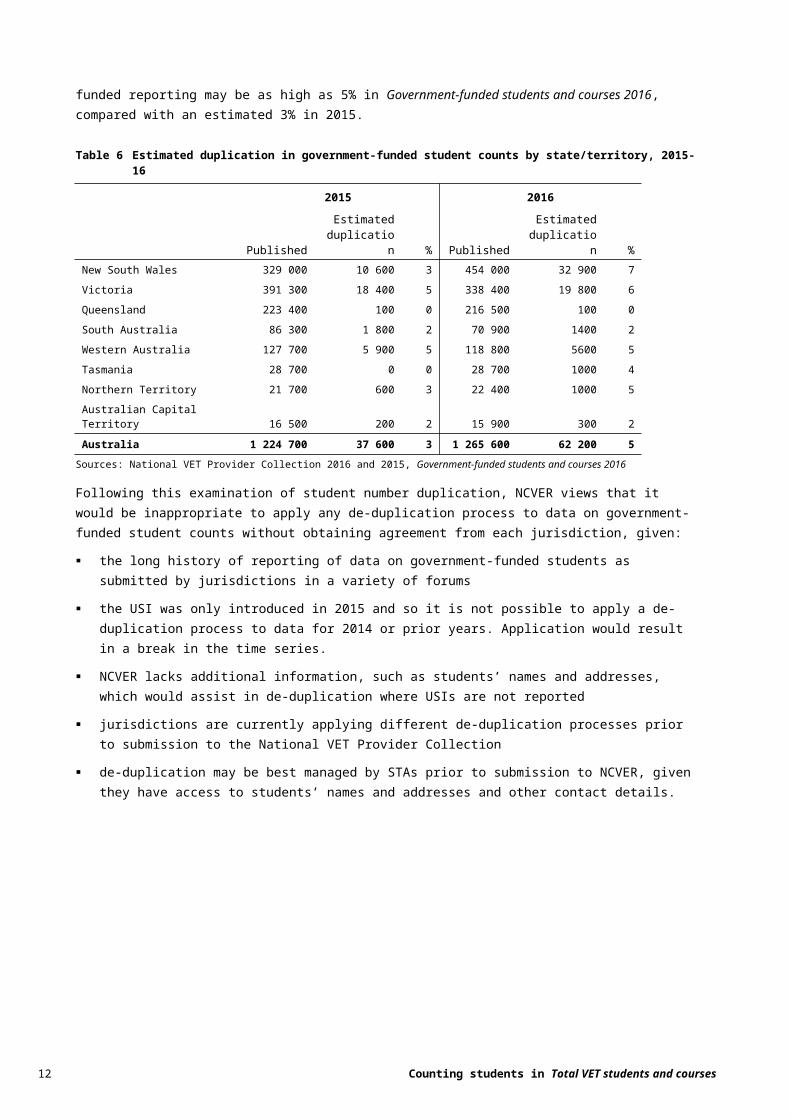
To determine the extent of duplication of student counts in government-funded training, NCVER applied the de-duplication process described above (option 2) to 2015 and 2016 government-funded data (table 6). Initial estimates suggest that the level of duplication in student counts for the Australian total in government-funded reporting may be as high as 5% in Government-funded students and courses 2016, compared with an estimated 3% in 2015.
Table 6 Estimated duplication in government-funded student counts by state/territory, 2015-16
2015 2016
PublishedEstimated
duplication % PublishedEstimated
duplication %
New South Wales 329 000 10 600 3 454 000 32 900 7
Victoria 391 300 18 400 5 338 400 19 800 6
Queensland 223 400 100 0 216 500 100 0
South Australia 86 300 1 800 2 70 900 1400 2
Western Australia 127 700 5 900 5 118 800 5600 5
Tasmania 28 700 0 0 28 700 1000 4
Northern Territory 21 700 600 3 22 400 1000 5
Australian Capital Territory 16 500 200 2 15 900 300 2
Australia 1 224 700 37 600 3 1 265 600 62 200 5Sources: National VET Provider Collection 2016 and 2015, Government-funded students and courses 2016
Following this examination of student number duplication, NCVER views that it would be inappropriate to apply any de-duplication process to data on government-funded student counts without obtaining agreement from each jurisdiction, given:
the long history of reporting of data on government-funded students as submitted by jurisdictions in a variety of forums
the USI was only introduced in 2015 and so it is not possible to apply a de-duplication process to data for 2014 or prior years. Application would result in a break in the time series.
NCVER lacks additional information, such as students’ names and addresses, which would assist in de-duplication where USIs are not reported
NCVER 11
jurisdictions are currently applying different de-duplication processes prior to submission to the National VET Provider Collection
de-duplication may be best managed by STAs prior to submission to NCVER, given they have access to students’ names and addresses and other contact details.
12 Counting students in Total VET students and courses
Future considerationsThis technical paper provides details of the methodology NCVER has applied to more
accurately estimate counts of TVA students for 2015 and 2016. It is a valuable starting point to begin consultation and discussion on potential future enhancements to TVA data and other national VET reporting.
NCVER 13
Attachment ASummary of USI data quality
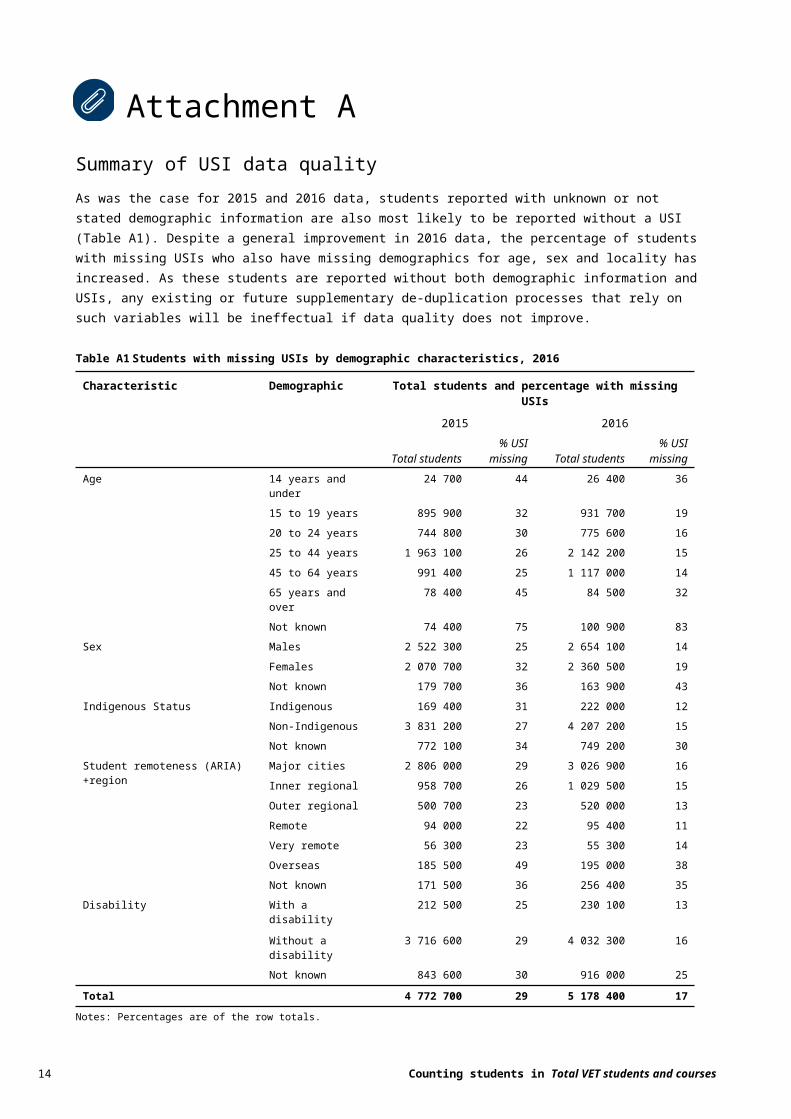
As was the case for 2015 and 2016 data, students reported with unknown or not stated demographic information are also most likely to be reported without a USI (Table A1). Despite a general improvement in 2016 data, the percentage of students with missing USIs who also have missing demographics for age, sex and locality has increased. As these students are reported without both demographic information and USIs, any existing or future supplementary de-duplication processes that rely on such variables will be ineffectual if data quality does not improve.
Table A1 Students with missing USIs by demographic characteristics, 2016
Characteristic Demographic Total students and percentage with missing USIs2015 2016
Total students% USI
missing Total students% USI
missingAge 14 years and under 24 700 44 26 400 36
15 to 19 years 895 900 32 931 700 19
20 to 24 years 744 800 30 775 600 16
25 to 44 years 1 963 100 26 2 142 200 15
45 to 64 years 991 400 25 1 117 000 14
65 years and over 78 400 45 84 500 32
Not known 74 400 75 100 900 83
Sex Males 2 522 300 25 2 654 100 14
Females 2 070 700 32 2 360 500 19
Not known 179 700 36 163 900 43
Indigenous Status Indigenous 169 400 31 222 000 12
Non-Indigenous 3 831 200 27 4 207 200 15
Not known 772 100 34 749 200 30
Student remoteness (ARIA)+region Major cities 2 806 000 29 3 026 900 16
Inner regional 958 700 26 1 029 500 15
Outer regional 500 700 23 520 000 13
Remote 94 000 22 95 400 11
Very remote 56 300 23 55 300 14
Overseas 185 500 49 195 000 38
Not known 171 500 36 256 400 35
Disability With a disability 212 500 25 230 100 13
Without a disability 3 716 600 29 4 032 300 16
Not known 843 600 30 916 000 25
Total 4 772 700 29 5 178 400 17Notes: Percentages are of the row totals.Sources: National VET Provider Collection 2015 and 2016; National VET in Schools Collection, 2015 and 2016
It is worth noting, that although instances of missing USIs are decreasing, the number is unlikely to reach zero while valid exemptions exist. In addition, it is possible for students to have multiple USIs and although a mechanism exists to account for this in the USI Transcript Service, it can result in small numbers of duplication within the data.
14 Counting students in Total VET students and courses
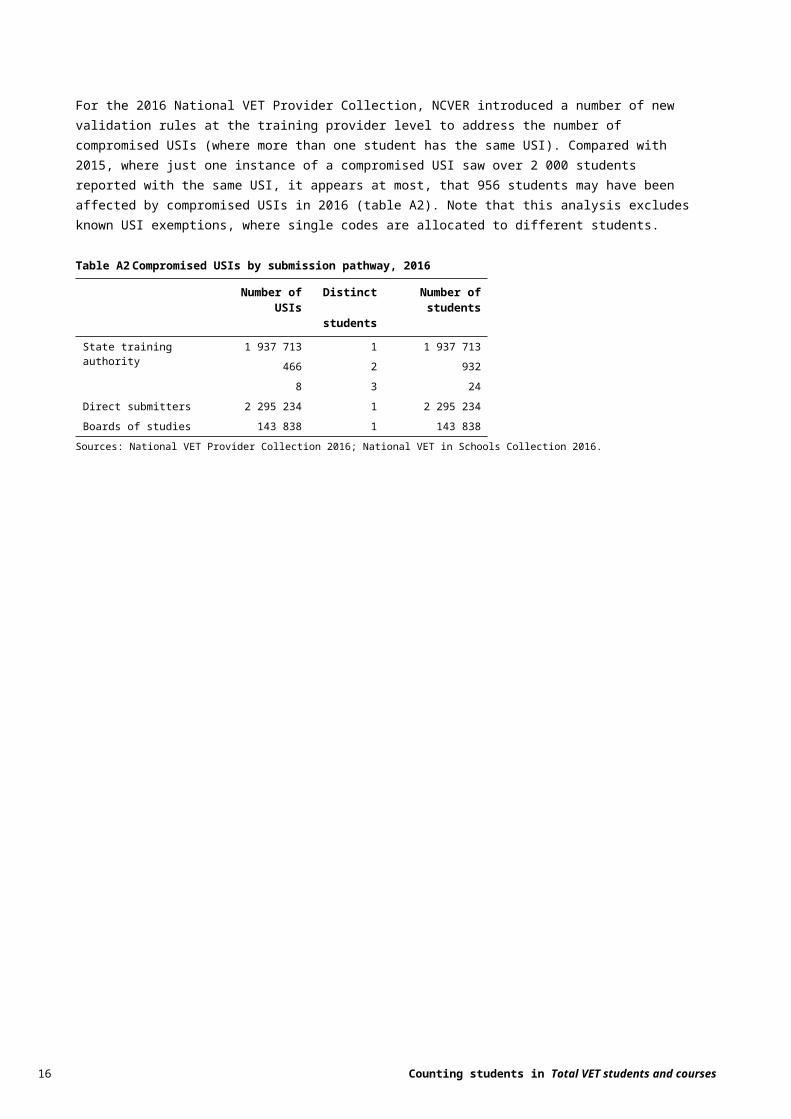
For the 2016 National VET Provider Collection, NCVER introduced a number of new validation rules at the training provider level to address the number of compromised USIs (where more than one student has the same USI). Compared with 2015, where just one instance of a compromised USI saw over 2 000 students reported with the same USI, it appears at most, that 956 students may have been affected by compromised USIs in 2016 (table A2). Note that this analysis excludes known USI exemptions, where single codes are allocated to different students.
Table A2 Compromised USIs by submission pathway, 2016
Number of USIs Distinct students
Number of students
State training authority 1 937 713 1 1 937 713
466 2 932
8 3 24
Direct submitters 2 295 234 1 2 295 234
Boards of studies 143 838 1 143 838
Sources: National VET Provider Collection 2016; National VET in Schools Collection 2016.
NCVER 15
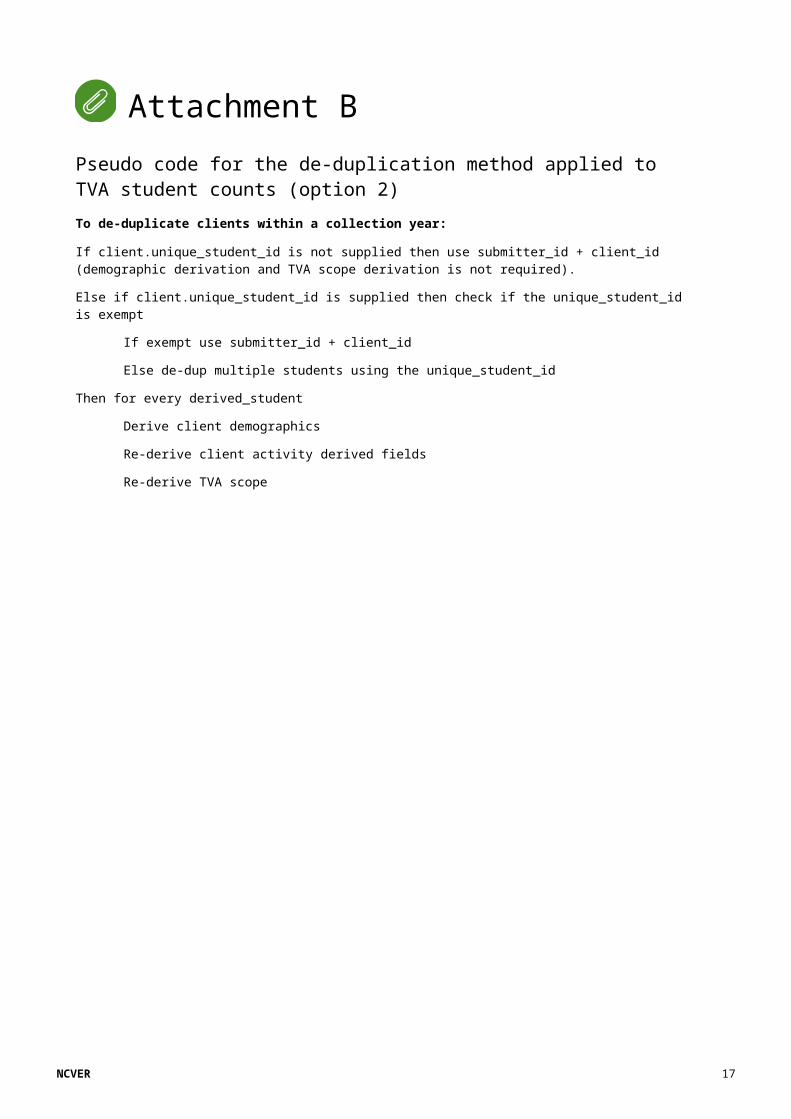
Attachment BPseudo code for the de-duplication method applied to TVA student
counts (option 2)
To de-duplicate clients within a collection year:
If client.unique_student_id is not supplied then use submitter_id + client_id (demographic derivation and TVA scope derivation is not required).
Else if client.unique_student_id is supplied then check if the unique_student_id is exempt
If exempt use submitter_id + client_id
Else de-dup multiple students using the unique_student_id
Then for every derived_student
Derive client demographics
Re-derive client activity derived fields
Re-derive TVA scope
16 Counting students in Total VET students and courses
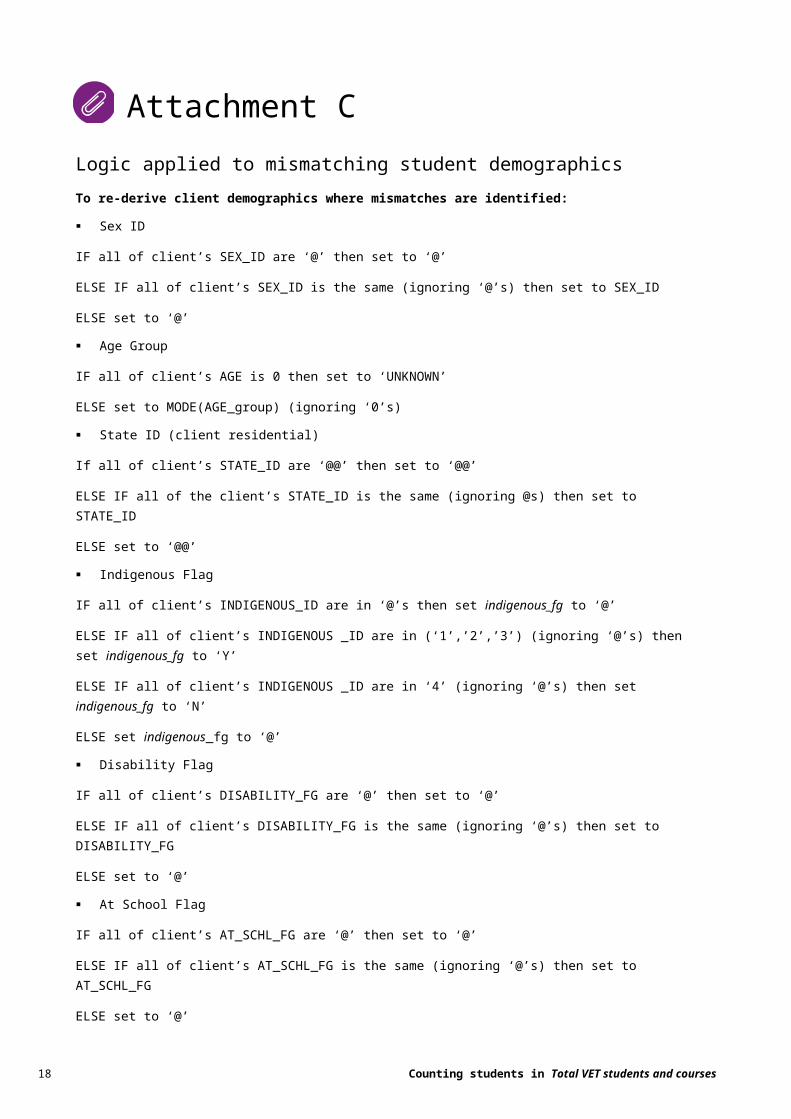
Attachment CLogic applied to mismatching student demographics
To re-derive client demographics where mismatches are identified:
Sex ID
IF all of client’s SEX_ID are ‘@’ then set to ‘@’
ELSE IF all of client’s SEX_ID is the same (ignoring ‘@’s) then set to SEX_ID
ELSE set to ‘@’
Age Group
IF all of client’s AGE is 0 then set to ‘UNKNOWN’
ELSE set to MODE(AGE_group) (ignoring ‘0’s)
State ID (client residential)
If all of client’s STATE_ID are ‘@@’ then set to ‘@@’
ELSE IF all of the client’s STATE_ID is the same (ignoring @s) then set to STATE_ID
ELSE set to ‘@@’
Indigenous Flag
IF all of client’s INDIGENOUS_ID are in ‘@’s then set indigenous_fg to ‘@’
ELSE IF all of client’s INDIGENOUS _ID are in (‘1’,’2’,’3’) (ignoring ‘@’s) then set indigenous_fg to ‘Y’
ELSE IF all of client’s INDIGENOUS _ID are in ‘4’ (ignoring ‘@’s) then set indigenous_fg to ‘N’
ELSE set indigenous_fg to ‘@’
Disability Flag
IF all of client’s DISABILITY_FG are ‘@’ then set to ‘@’
ELSE IF all of client’s DISABILITY_FG is the same (ignoring ‘@’s) then set to DISABILITY_FG
ELSE set to ‘@’
At School Flag
IF all of client’s AT_SCHL_FG are ‘@’ then set to ‘@’
ELSE IF all of client’s AT_SCHL_FG is the same (ignoring ‘@’s) then set to AT_SCHL_FG
ELSE set to ‘@’
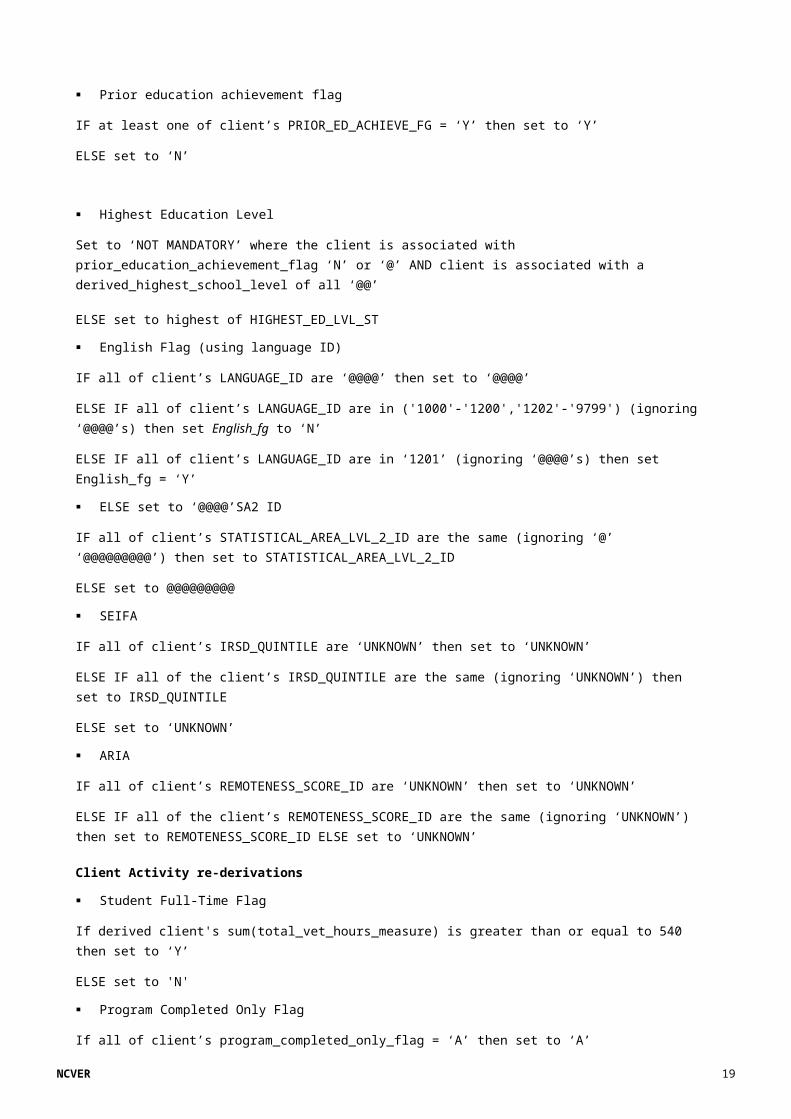
Prior education achievement flag
IF at least one of client’s PRIOR_ED_ACHIEVE_FG = ‘Y’ then set to ‘Y’
ELSE set to ‘N’
NCVER 17
Highest Education Level
Set to ‘NOT MANDATORY’ where the client is associated with prior_education_achievement_flag ‘N’ or ‘@’ AND client is associated with a derived_highest_school_level of all ‘@@’
ELSE set to highest of HIGHEST_ED_LVL_ST
English Flag (using language ID)
IF all of client’s LANGUAGE_ID are ‘@@@@’ then set to ‘@@@@’
ELSE IF all of client’s LANGUAGE_ID are in ('1000'-'1200','1202'-'9799') (ignoring ‘@@@@’s) then set English_fg to ‘N’
ELSE IF all of client’s LANGUAGE_ID are in ‘1201’ (ignoring ‘@@@@’s) then set English_fg = ‘Y’
ELSE set to ‘@@@@’SA2 ID
IF all of client’s STATISTICAL_AREA_LVL_2_ID are the same (ignoring ‘@’ ‘@@@@@@@@@’) then set to STATISTICAL_AREA_LVL_2_ID
ELSE set to @@@@@@@@@
SEIFA
IF all of client’s IRSD_QUINTILE are ‘UNKNOWN’ then set to ‘UNKNOWN’
ELSE IF all of the client’s IRSD_QUINTILE are the same (ignoring ‘UNKNOWN’) then set to IRSD_QUINTILE
ELSE set to ‘UNKNOWN’
ARIA
IF all of client’s REMOTENESS_SCORE_ID are ‘UNKNOWN’ then set to ‘UNKNOWN’
ELSE IF all of the client’s REMOTENESS_SCORE_ID are the same (ignoring ‘UNKNOWN’) then set to REMOTENESS_SCORE_ID ELSE set to ‘UNKNOWN’
Client Activity re-derivations
Student Full-Time Flag
If derived client's sum(total_vet_hours_measure) is greater than or equal to 540 then set to ‘Y’
ELSE set to 'N'
Program Completed Only Flag
If all of client’s program_completed_only_flag = ‘A’ then set to ‘A’
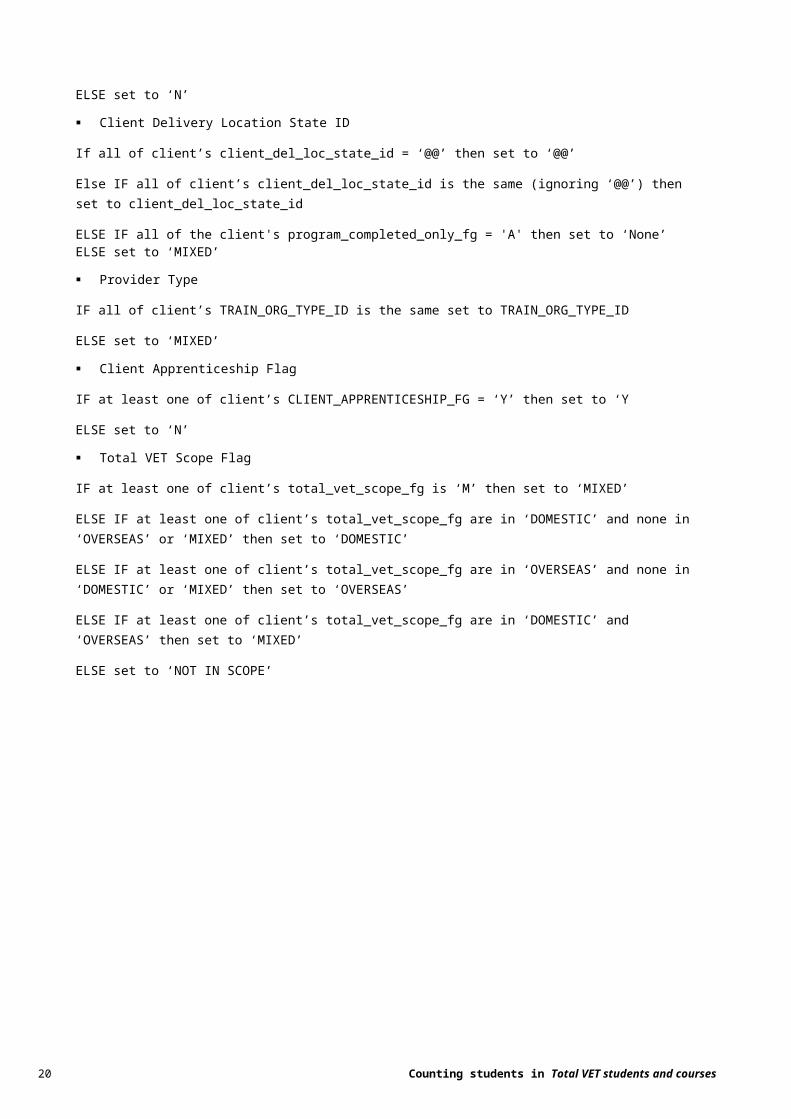
ELSE set to ‘N’
Client Delivery Location State ID
If all of client’s client_del_loc_state_id = ‘@@’ then set to ‘@@’
Else IF all of client’s client_del_loc_state_id is the same (ignoring ‘@@’) then set to client_del_loc_state_id
18 Counting students in Total VET students and courses
ELSE IF all of the client's program_completed_only_fg = 'A' then set to ‘None’ELSE set to ‘MIXED’
Provider Type
IF all of client’s TRAIN_ORG_TYPE_ID is the same set to TRAIN_ORG_TYPE_ID
ELSE set to ‘MIXED’
Client Apprenticeship Flag
IF at least one of client’s CLIENT_APPRENTICESHIP_FG = ‘Y’ then set to ‘Y
ELSE set to ‘N’
Total VET Scope Flag
IF at least one of client’s total_vet_scope_fg is ‘M’ then set to ‘MIXED’
ELSE IF at least one of client’s total_vet_scope_fg are in ‘DOMESTIC’ and none in ‘OVERSEAS’ or ‘MIXED’ then set to ‘DOMESTIC’
ELSE IF at least one of client’s total_vet_scope_fg are in ‘OVERSEAS’ and none in ‘DOMESTIC’ or ‘MIXED’ then set to ‘OVERSEAS’
ELSE IF at least one of client’s total_vet_scope_fg are in ‘DOMESTIC’ and ‘OVERSEAS’ then set to ‘MIXED’
ELSE set to ‘NOT IN SCOPE’
NCVER 19
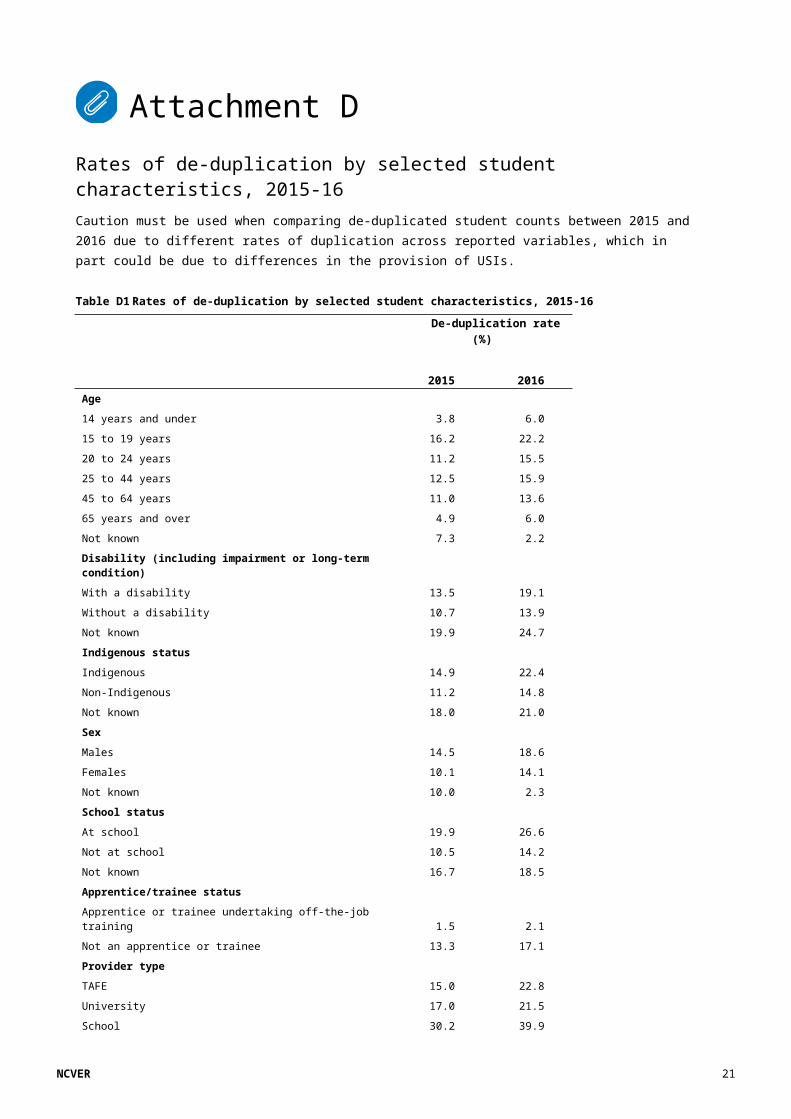
Attachment DRates of de-duplication by selected student characteristics, 2015-16
Caution must be used when comparing de-duplicated student counts between 2015 and 2016 due to different rates of duplication across reported variables, which in part could be due to differences in the provision of USIs.
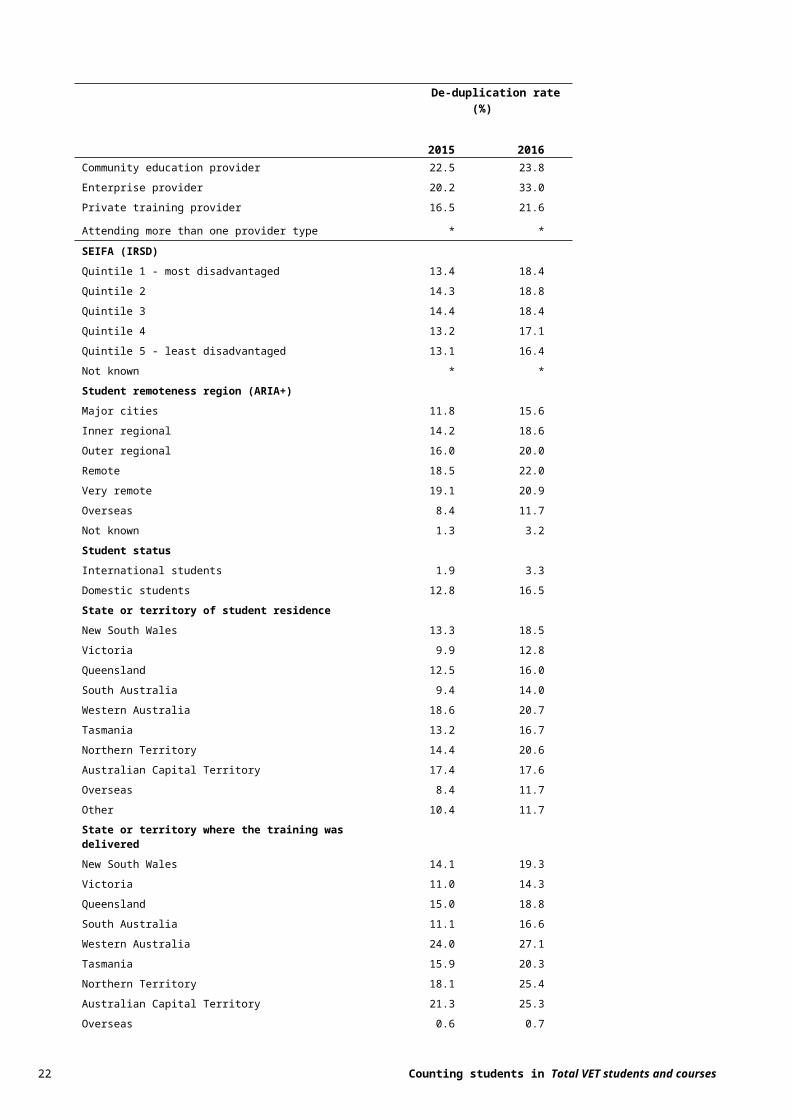
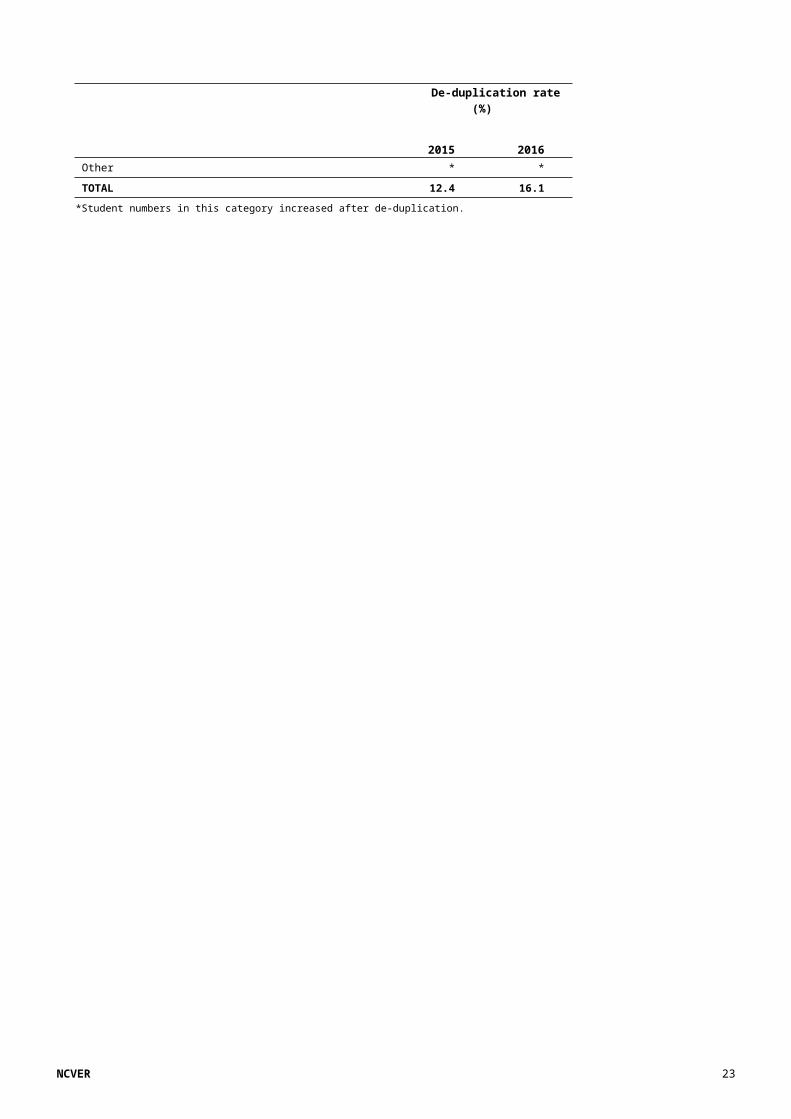
Table D1 Rates of de-duplication by selected student characteristics, 2015-16
De-duplication rate (%)
2015 2016Age
14 years and under 3.8 6.0
15 to 19 years 16.2 22.2
20 to 24 years 11.2 15.5
25 to 44 years 12.5 15.9
45 to 64 years 11.0 13.6
65 years and over 4.9 6.0
Not known 7.3 2.2
Disability (including impairment or long-term condition)
With a disability 13.5 19.1
Without a disability 10.7 13.9
Not known 19.9 24.7
Indigenous status
Indigenous 14.9 22.4
Non-Indigenous 11.2 14.8
Not known 18.0 21.0
Sex
Males 14.5 18.6
Females 10.1 14.1
Not known 10.0 2.3
School status
At school 19.9 26.6
Not at school 10.5 14.2
Not known 16.7 18.5
Apprentice/trainee status
Apprentice or trainee undertaking off-the-job training 1.5 2.1
Not an apprentice or trainee 13.3 17.1
Provider type
TAFE 15.0 22.8
University 17.0 21.5
School 30.2 39.9
Community education provider 22.5 23.8
Enterprise provider 20.2 33.0
Private training provider 16.5 21.6
Attending more than one provider type * *
20 Counting students in Total VET students and courses
De-duplication rate (%)
2015 2016SEIFA (IRSD)
Quintile 1 - most disadvantaged 13.4 18.4
Quintile 2 14.3 18.8
Quintile 3 14.4 18.4
Quintile 4 13.2 17.1
Quintile 5 - least disadvantaged 13.1 16.4
Not known * *
Student remoteness region (ARIA+)
Major cities 11.8 15.6
Inner regional 14.2 18.6
Outer regional 16.0 20.0
Remote 18.5 22.0
Very remote 19.1 20.9
Overseas 8.4 11.7
Not known 1.3 3.2
Student status
International students 1.9 3.3
Domestic students 12.8 16.5
State or territory of student residence
New South Wales 13.3 18.5
Victoria 9.9 12.8
Queensland 12.5 16.0
South Australia 9.4 14.0
Western Australia 18.6 20.7
Tasmania 13.2 16.7
Northern Territory 14.4 20.6
Australian Capital Territory 17.4 17.6
Overseas 8.4 11.7
Other 10.4 11.7
State or territory where the training was delivered
New South Wales 14.1 19.3
Victoria 11.0 14.3
Queensland 15.0 18.8
South Australia 11.1 16.6
Western Australia 24.0 27.1
Tasmania 15.9 20.3
Northern Territory 18.1 25.4
Australian Capital Territory 21.3 25.3
Overseas 0.6 0.7
Other * *
TOTAL 12.4 16.1*Student numbers in this category increased after de-duplication.
NCVER 21
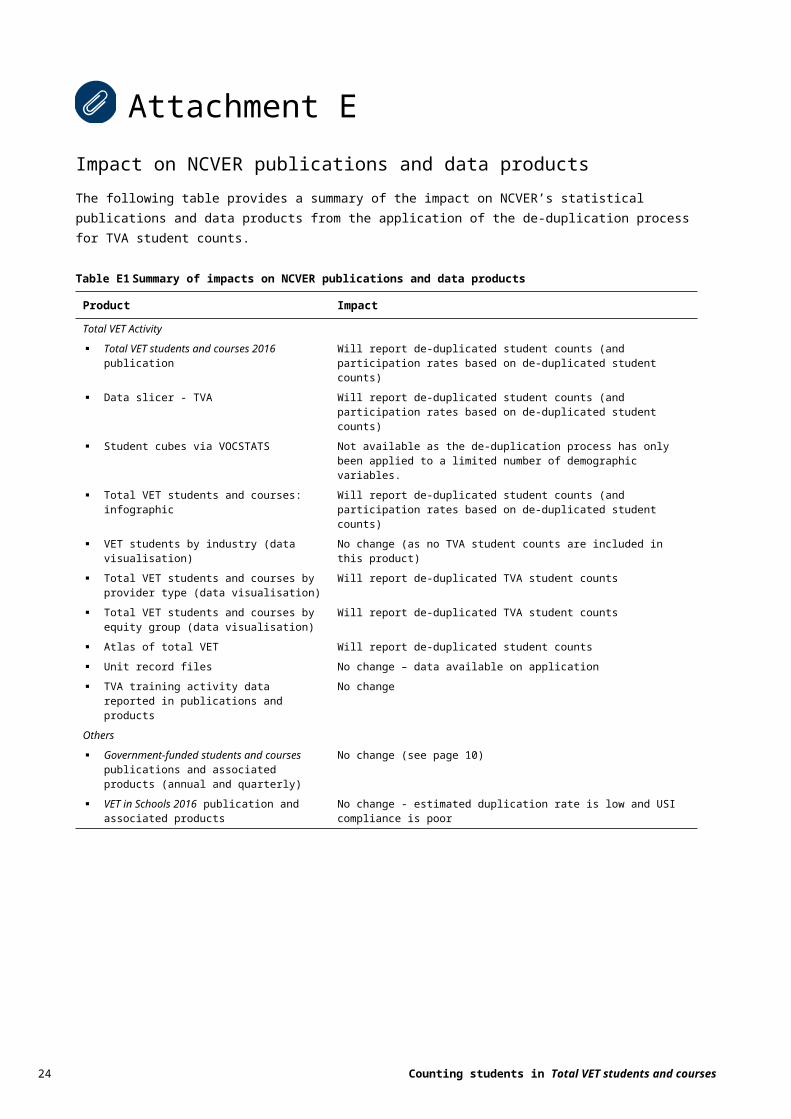
Attachment EImpact on NCVER publications and data products
The following table provides a summary of the impact on NCVER’s statistical publications and data products from the application of the de-duplication process for TVA student counts.
Table E1 Summary of impacts on NCVER publications and data products
Product Impact
Total VET Activity
Total VET students and courses 2016 publication
Will report de-duplicated student counts (and participation rates based on de-duplicated student counts)
Data slicer - TVA Will report de-duplicated student counts (and participation rates based on de-duplicated student counts)
Student cubes via VOCSTATS Not available as the de-duplication process has only been applied to a limited number of demographic variables.
Total VET students and courses: infographic Will report de-duplicated student counts (and participation rates based on de-duplicated student counts)
VET students by industry (data visualisation) No change (as no TVA student counts are included in this product)
Total VET students and courses by provider type (data visualisation)
Will report de-duplicated TVA student counts
Total VET students and courses by equity group (data visualisation)
Will report de-duplicated TVA student counts
Atlas of total VET Will report de-duplicated student counts
Unit record files No change – data available on application
TVA training activity data reported in publications and products
No change
Others
Government-funded students and courses publications and associated products (annual and quarterly)
No change (see page 10)
VET in Schools 2016 publication and associated products
No change - estimated duplication rate is low and USI compliance is poor
22 Counting students in Total VET students and courses
National Centre for Vocational Education Research
Level 5, 60 Light Square, Adelaide, SA 5000
PO Box 8288 Station Arcade, Adelaide SA 5000, Australia
Phone +61 8 8230 8400 Email [email protected]
Web <https://www.ncver.edu.au> <https://www.lsay.edu.au>
Follow us: <https://twitter.com/ncver> <https://www.linkedin.com/company/ncver>