country readiness to monitor sdg 4 education …unesdoc.unesco.org/images/0024/002458/245829e.pdf1...
TRANSCRIPT

1
Country readiness to monitor SDG 4 education targets
Regional survey for the Asia and Pacific region
INFORMATION PAPER NO. 31 SEPTEMBER 2016

UNESCO
The constitution of the United Nations Educational, Scientific and Cultural Organization (UNESCO) was adopted by 20 countries at the London Conference in November 1945 and entered into effect on 4 November 1946. The Organization currently has 195 Member States and 10 Associate Members.
The main objective of UNESCO is to contribute to peace and security in the world by promoting collaboration among nations through education, science, culture and communication in order to foster universal respect for justice, the rule of law, and the human rights and fundamental freedoms that are affirmed for the peoples of the world, without distinction of race, sex, language or religion, by the Charter of the United Nations.
To fulfil its mandate, UNESCO performs five principal functions: 1) prospective studies on education, science, culture and communication for tomorrow's world; 2) the advancement, transfer and sharing of knowledge through research, training and teaching activities; 3) standard-setting actions for the preparation and adoption of internal instruments and statutory recommendations; 4) expertise through technical co-operation to Member States for their development policies and projects; and 5) the exchange of specialized information.
UNESCO is headquartered in Paris, France.
UNESCO Institute for Statistics
The UNESCO Institute for Statistics (UIS) is the statistical office of UNESCO and is the UN depository for global statistics in the fields of education, science and technology, culture and communication.
The UIS was established in 1999. It was created to improve UNESCO's statistical programme and to develop and deliver the timely, accurate and policy-relevant statistics needed in today’s increasingly complex and rapidly changing social, political and economic environments.
The UIS is based in Montreal, Canada.
Published in 2016 by:
UNESCO Institute for Statistics P.O. Box 6128, Succursale Centre-Ville Montreal, Quebec H3C 3J7 Canada
Tel: +1 514-343-6880 Email: [email protected] http://www.uis.unesco.org
© UNESCO-UIS 2016
ISBN 978-92-9189-202-0 Ref: UIS/2016/SDG/TD/13
DataLink: http://dx.doi.org/10.15220/978-92-9189-202-0-en
© UNESCO-UIS 2016
This publication is available in Open Access under the Attribution-ShareAlike 3.0 IGO (CC-BY-SA 3.0 IGO) license (http://creativecommons.org/licenses/by-sa/3.0/igo/). By using the content of this publication, the users accept to be bound by the terms of use of the UNESCO Open Access Repository (http://www.unesco.org/open-access/terms-use-ccbysa-en).
The designations employed and the presentation of material throughout this publication do not imply the expression of any opinion whatsoever on the part of UNESCO concerning the legal status of any country, territory, city or area or of its authorities or concerning the delimitation of its frontiers or boundaries.
The ideas and opinions expressed in this publication are those of the authors; they are not necessarily those of UNESCO and do not commit the Organization.

- iii -
Table of contents Page
1. Monitoring the new global goals on education and development ....................... 5
2. Availability of indicators to monitor SDG 4: Results of the regional survey ...... 7 2.1 Data availability by target .................................................................................. 7 2.2 Data availability by indicator: Finding the gaps ................................................. 9
2.2.1 Data availability by sub-regional and national levels ............................. 9 2.2.2 Data availability by targets and difficulty levels .................................... 10
2.3 Data on learning outcomes ............................................................................. 11 2.4 National learning assessments and target grades as proposed by SDG 4 ..... 11 2.5 Disaggregation of indicators ............................................................................ 13
3. Existing challenges for measurement .................................................................. 14 3.1 Weak coverage outside the formal education system ..................................... 14 3.2 Fragmented institutional settings and legal frameworks .................................. 14 3.3 Low levels or insufficient technical and financial resources available
for education statistics ..................................................................................... 15
4. Advancing global and regional agendas for monitoring SDG 4: Next steps .... 16 4.1 Initiatives for coordination, indicator development and capacity support ........ 16 4.2 Mobilising partners and resources................................................................... 18
References ........................................................................................................................ 19
Annex A. SDG 4 targets .............................................................................................. 20 Annex B. Proposed SDG 4 global and thematic indicators ..................................... 21 Annex C. Methodology and coverage of the regional survey ................................. 24 Annex D. Sub-regions and countries covered by the survey .................................. 26 Annex E. Sub-regional classification of thematic indicators .................................. 27 List of figures Figure 1. Levels of monitoring the education targets (SDG 4) .......................................................5 Figure 2. Availability of indicators by SDG4 targets and means of implementation .......................8 Figure 3. Availability of thematic indicators by country ...................................................................9 Figure 4. Classification of thematic indicators based on the level of difficulty to collect
by targets .......................................................................................................................10 Figure 5. Availability of indicators on learning assessments ........................................................12 Figure 6. National learning assessments by measurement point .................................................12 Figure 7. Availability of indicators by disaggregation ....................................................................13 Figure 8. Number of respondent countries by Asia-Pacific sub-region ........................................24 Figure 9. Structure of questions in the questionnaire ...................................................................25 Figure 10. Classification of thematic indicators based on the level of difficulty to collect,
by sub-regions .............................................................................................................27
List of tables Table 1. Key platforms and initiatives at the global and regional levels ...................................16 Table 2. Countries, by sub-regions, which organised a national consultation on SDG 4 .........18
List of boxes Box 1. UIS and data to monitor the global development agenda ............................................6 Box 2. The need to harmonise data production in countries ..................................................15

- 5 -
1. Monitoring the new global goals on education and development
A new agenda for Sustainable Development, reached by consensus across the countries of the world, has become a reality. The 17 goals and 169 targets that comprise the Sustainable Development Goals (SDGs) were adopted by the UN General Assembly in September 2015. The education goal (Goal 4) aims to “ensure inclusive and equitable quality education and promote lifelong learning opportunities for all”.
The education goal is made up of seven key targets and three means of implementation which focus on how to achieve the outcomes described in the targets (see Annex A for the definition of targets and indicators). The scope of the education goal is broad – from ensuring effective early learning to access to adult learning opportunities. Ensuring educational quality and equity are two themes that are at the heart of the SDG education goal and which provide the lens through which countries will assess progress towards the achievement of the goal.
Attention has turned to the development of a similar global consensus around a robust set of indicators that can be used to monitor progress towards the goals. The Inter-Agency Expert Group on the Sustainable Development Goals (IAEG-SDGs), comprising 28 Member States, was tasked with this effort and undertook global consultations and expert meetings in order to set out an indicator framework. Their proposal for a global set of 229 indicators was endorsed by the UN Statistical Commission in March 2016 and has been considered for adoption by the United Nations Economic and Social Council (ECOSOC) in July 2016 and the United Nations General Assembly in September 2016.
The monitoring of the SDGs at the global level represents one level of monitoring. As presented in the United Nations General Secretary’s report – there are four levels of monitoring which have different purposes, varying number of indicators and different audiences (see Figure 1).
Figure 1. Levels of monitoring the education targets (SDG 4)
Source: Secretary General’s Synthesis Report, December 2014

- 6 -
To more comprehensively reflect the needs of national and international education stakeholders, a broader set of thematic indicators for education was proposed in a parallel but strongly linked process. These thematic indicators were included in the Education 2030 Framework for Action (FFA) endorsed by countries in 2015. The Technical Advisory Group on Education Indicators (TAG), made up of measurement experts from 14 countries, from civil society and international organizations developed a proposal for 43 indicators including the 11 global indicators based on inputs from technical experts and global consultations (see Annex B for the list of indicators).
And now the monitoring challenge relates directly to the information systems and capacities of individual Member States – across several key data sources: administrative data, assessment data and household survey based data. This summary presents the results of a Regional Survey among those responsible for data collection and reporting at the national level to better ascertain where countries stand now in terms of monitoring the global and thematic frameworks. This policy note provides a more detailed analysis of the Regional Survey results in the Asia and Pacific Region. This is a part of the new UNESCO Institute for Statistics (UIS) series – the Sustainable Development Data Digest – that examines the measurement challenges and countries’ readiness to monitor the new SDG 4 targets at the global level.
Box 1. UIS and data to monitor the global development agenda
The role of the UIS was set out in the Education 2030 Framework for Action: “the UIS will remain the official source of cross-nationally comparable data on education. It will continue to produce international monitoring indicators based on its annual education survey and on other data sources that guarantee international comparability for more than 200 countries and territories. In addition to collecting data, the UIS will work with partners to develop new indicators, statistical approaches and monitoring tools to better assess progress across the targets related to UNESCO’s mandate, working in coordination with the Education 2030 SC (paragraph 100).”
Source: Education 2030 Framework for Action, 2015
- 7 -
2. Availability of indicators to monitor SDG 4: Results of the regional survey
The survey examines country readiness to measure and monitor the 11 global indicators and the 43 thematic indicators which include the same global indicators. In order to better assess country readiness, the survey was able to collect important information on data availability at the country level which provides insights into the possible data gaps for each of the targets and indicators (for more information on the survey methodology, see Annex C).
2.1 Data availability by target
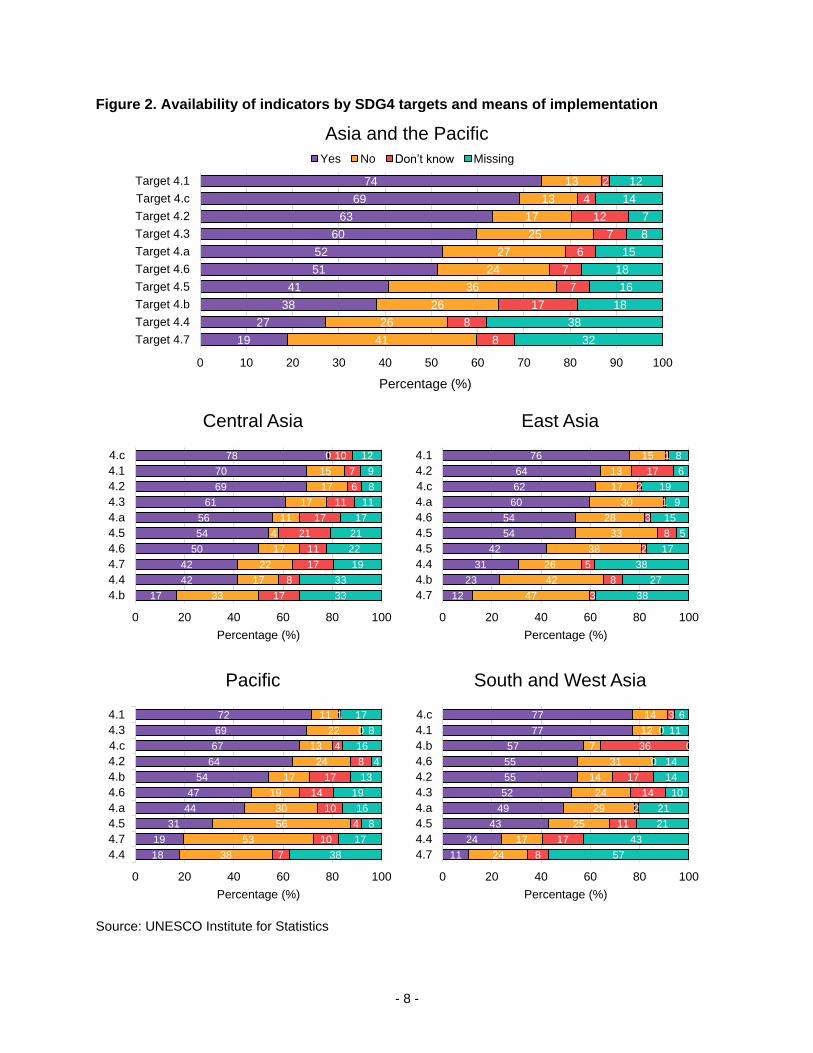
SDG 4 consists of seven targets that broadly cover education sub-sectors including basic education (4.1), ECCE (4.2), technical and vocational education (TVET) and higher education (4.3) as well as themes of education such as skill and employment (4.4), inclusiveness (4.5), literacy (4.6), and sustainable development (4.7). It also contains three targets of means of implementation, i.e., school environment (4.a), scholarship (4.b), and teachers (4.c) (see Annex A). The analysis of data availability by target shows that Target 4.7 has the least number of indicators available by countries (see Figure 2). Less than 20% of the indicators are available for this target in the region. However, more than 50% of the indicators for six targets are available. These indicators, which are calculated using administrative data, are mainly related to primary education, secondary education, TVET, tertiary education and education facilities. Indicators using other sources than administrative data are less available currently in the region. This represents an important challenge to overcome as the data to calculate most of the SDG 4 targets will come from student or adult assessments, household surveys or other alternative sources.
At the sub-regional level, the results follow similar patterns, with some specificities in each sub-region (see Figure 2). For example, Target 4.7 is not the target with the least indicators available in Central Asia (42% of the countries mentioned indicators were available) and in the Pacific. Respectively, in those sub-regions, Targets 4.b and 4.4 are the targets with the least indicators available. There are also differences for the targets where 50% or more of the indicators are available. In the Pacific, only five targets reach the 50%, while in Central Asia, this is true for seven targets. The highest proportion of indicators available is 78% in Central Asia for Target 4.c.
- 8 -
Figure 2. Availability of indicators by SDG4 targets and means of implementation
Source: UNESCO Institute for Statistics
19
27
38
41
51
52
60
63
69
74
41
26
26
36
24
27
25
17
13
13
8
8
17
7
7
6
7
12
4
2
32
38
18
16
18
15
8
7
14
12
0 10 20 30 40 50 60 70 80 90 100
Target 4.7
Target 4.4
Target 4.b
Target 4.5
Target 4.6
Target 4.a
Target 4.3
Target 4.2
Target 4.c
Target 4.1
Percentage (%)
Asia and the Pacific Yes No Don’t know Missing
17
42
42
50
54
56
61
69
70
78
33
17
22
17
4
11
17
17
15
0
17
8
17
11
21
17
11
6
7
10
33
33
19
22
21
17
11
8
9
12
0 20 40 60 80 100
4.b4.44.74.64.54.a4.34.24.14.c
Percentage (%)
Central Asia
12
23
31
42
54
54
60
62
64
76
47
42
26
38
33
28
30
17
13
15
3
8
5
2
8
3
1
2
17
1
38
27
38
17
5
15
9
19
6
8
0 20 40 60 80 100
4.74.b4.44.54.54.64.a4.c4.24.1
Percentage (%)
East Asia
18
19
31
44
47
54
64
67
69
72
38
53
56
30
19
17
24
13
22
11
7
10
4
10
14
17
8
4
0
1
38
17
8
16
19
13
4
16
8
17
0 20 40 60 80 100
4.44.74.54.a4.64.b4.24.c4.34.1
Percentage (%)
Pacific
11
24
43
49
52
55
55
57
77
77
24
17
25
29
24
14
31
7
12
14
8
17
11
2
14
17
0
36
0
3
57
43
21
21
10
14
14
0
11
6
0 20 40 60 80 100
4.74.44.54.a4.34.24.64.b4.14.c
Percentage (%)
South and West Asia

- 9 -
2.2 Data availability by indicator: Finding the gaps
2.2.1 Data availability by sub-regional and country levels
As the coverage and scope of the SDG 4 indicators are much broader than those of Education for All (EFA), the results of the mapping exercise show that many countries in the region have some difficulty in collecting all the proposed thematic indicators. Figure 3 summarises the availability of thematic indicators in Asia-Pacific countries. The percentage of indicators that the countries are able to collect ranges from 17% to 93%. On average, the countries are able to collect 54% of the indicators. In fact, none of the Asia-Pacific counties have the capacity to collect all the proposed thematic indicators. On average, Central Asia is the sub-region with the highest percentage of available data (59%), followed by South and West Asia (54%), East Asia (53%) and the Pacific (51%).
Figure 3. Availability of thematic indicators by country
Countries in the Asia and Pacific Region
Note: The row represents the thematic indictors and the column represents the countries. Colored-cells represent the countries which are able to collect data for the indicators. The global indicators are highlighted in yellow. Source: UNESCO Institute for Statistics
4.1.3 1 1 1 1 1 1 1 1 1 1 1 1 1 1 1 1 1 1 1 1 1 1 1 1 1 1 1 1 1 1 1 1 1 1 1 1 1 1
4.1.7 1 1 1 1 1 1 1 1 1 1 1 1 1 1 1 1 1 1 1 1 1 1 1 1 1 1 1 1 1 1 1 1 1 1 1 1 1 1
4.2.12 1 1 1 1 1 1 1 1 1 1 1 1 1 1 1 1 1 1 1 1 1 1 1 1 1 1 1 1 1 1 1 1 1 1 1 1 1 1
4.1.6 1 1 1 1 1 1 1 1 1 1 1 1 1 1 1 1 1 1 1 1 1 1 1 1 1 1 1 1 1 1 1 1 1 1 1 1 1
4.3.13 1 1 1 1 1 1 1 1 1 1 1 1 1 1 1 1 1 1 1 1 1 1 1 1 1 1 1 1 1 1 1 1 1 1 1 1 1
4.c.37 1 1 1 1 1 1 1 1 1 1 1 1 1 1 1 1 1 1 1 1 1 1 1 1 1 1 1 1 1 1 1 1 1 1 1
4.2.11 1 1 1 1 1 1 1 1 1 1 1 1 1 1 1 1 1 1 1 1 1 1 1 1 1 1 1 1 1 1 1 1 1 1
4.1.5 1 1 1 1 1 1 1 1 1 1 1 1 1 1 1 1 1 1 1 1 1 1 1 1 1 1 1 1 1 1 1 1
4.6.23 1 1 1 1 1 1 1 1 1 1 1 1 1 1 1 1 1 1 1 1 1 1 1 1 1 1 1 1 1 1 1
4.c.39 1 1 1 1 1 1 1 1 1 1 1 1 1 1 1 1 1 1 1 1 1 1 1 1 1 1 1 1 1 1
4.c.40 1 1 1 1 1 1 1 1 1 1 1 1 1 1 1 1 1 1 1 1 1 1 1 1 1 1 1 1 1 1
4.1.4 1 1 1 1 1 1 1 1 1 1 1 1 1 1 1 1 1 1 1 1 1 1 1 1 1 1 1 1
4.c.38 1 1 1 1 1 1 1 1 1 1 1 1 1 1 1 1 1 1 1 1 1 1 1 1 1 1 1 1
4.5.20 1 1 1 1 1 1 1 1 1 1 1 1 1 1 1 1 1 1 1 1 1 1 1 1 1 1
4.a.30 1 1 1 1 1 1 1 1 1 1 1 1 1 1 1 1 1 1 1 1 1 1 1 1 1 1
4.2.10 1 1 1 1 1 1 1 1 1 1 1 1 1 1 1 1 1 1 1 1 1 1 1 1 1
4.a.31 1 1 1 1 1 1 1 1 1 1 1 1 1 1 1 1 1 1 1 1 1 1 1 1
4.c.43 1 1 1 1 1 1 1 1 1 1 1 1 1 1 1 1 1 1 1 1 1 1 1 1
4.1.1 1 1 1 1 1 1 1 1 1 1 1 1 1 1 1 1 1 1 1 1
4.3.14 1 1 1 1 1 1 1 1 1 1 1 1 1 1 1 1 1 1 1 1
4.b.35 1 1 1 1 1 1 1 1 1 1 1 1 1 1 1 1 1 1 1
4.1.2 1 1 1 1 1 1 1 1 1 1 1 1 1 1 1 1 1 1
4.c.42 1 1 1 1 1 1 1 1 1 1 1 1 1 1 1 1 1 1
4.5.18 1 1 1 1 1 1 1 1 1 1 1 1 1 1 1
4.6.22 1 1 1 1 1 1 1 1 1 1 1 1 1 1 1
4.6.24 1 1 1 1 1 1 1 1 1 1 1 1 1 1 1
4.c.41 1 1 1 1 1 1 1 1 1 1 1 1 1 1 1
4.4.17 1 1 1 1 1 1 1 1 1 1 1 1 1 1
4.5.19 1 1 1 1 1 1 1 1 1 1 1 1 1 1
4.a.32 1 1 1 1 1 1 1 1 1 1 1 1
4.3.15 1 1 1 1 1 1 1 1 1 1 1
4.b.36 1 1 1 1 1 1 1 1 1 1
4.7.25 1 1 1 1 1 1 1 1 1
4.a.34 1 1 1 1 1 1 1 1 1
4.a.33 1 1 1 1 1 1 1 1
4.2.8 1 1 1 1 1 1 1
4.4.16.1 1 1 1 1 1 1 1
4.5.21 1 1 1 1 1 1 1
4.7.28 1 1 1 1 1 1 1
4.7.27 1 1 1 1
4.4.16.2 1 1 1
4.7.26 1 1 1
4.7.29 1 1 1
4.2.9 1 1

- 10 -
2.2.2 Data availability by targets and difficulty levels
The multi-dimensional analysis of the availability of global and thematic indicators shows huge variation in the proportion of countries being able to report thematic indicators in the region. The availability of the indicators is ranked by the level of difficulty to collect (see Figure 4).
There are 14 indicators, in the first group, which are ‘very difficult’ for many countries to collect (less than 30% of the countries are able to collect them). Five global indicators are part of this group (4.2.8, 4.3.15, 4.4.16.2, 4.7.25, 4.b.36). In this group, the lowest percentage of countries able to collect the data is 5% for 4.2.9.
The second group contains ten indicators amongst which three are global indicator (4.1.1, 4.6.22, 4.a.32). This group of indicators is ‘difficult’ to collect (less than 50% of countries are able to collect). Mostly, indicators related to concepts of ‘knowledge, skills, learning and readiness’ and ‘policy, provision and scholarship’ have been considered to be very difficult or difficult to collect.
The third group is composed of seven indicators which are available for 50% to 70% of the countries. There are three global indicators in this category (4.2.10, 4.a.30, 4.a.31).
Finally, 13 indicators are categorized as ‘easy’ to collect (more than 70% of the countries are able to collect those indicators). No global indicator belongs to this group. Most of the countries are currently able to collect data related to concepts of ‘participation and completion’ and ‘teachers’.
In summary, in terms of the smaller set of global indicators only three out of 11 global indicators are currently collected by more than 50% of the countries; less than 30% of the countries are able to collect five indicators. This shows clearly that even to collect the small set of global indicators, countries will have to make a major effort in collecting data from learning assessments and household surveys.
Figure 4. Classification of thematic indicators based on the level of difficulty to collect by targets
Target 4.1 4.2 4.3 4.4 4.5 4.6 4.7 4.a 4.b 4.c
Very difficult (<30)
4.2.8 4.3.15 4.4.16.1 4.5.21 4.7.25 4.a.33 4.b.36
4.2.9 4.4.16.2 4.7.26 4.a.34
4.7.27
4.7.28
4.7.29
Difficult (30≤x<50)
4.1.1 4.4.17 4.5.18 4.6.22 4.a.32 4.c.41
4.1.2 4.5.19 4.6.24 4.c.42
Fair (50≤x<70)
4.2.10 4.3.14 4.5.20 4.a.30 4.b.35 4.c.43
4.a.31
Easy (70≤)
4.1.3 4.2.11 4.3.13 4.6.23 4.c.37
4.1.4 4.2.12 4.c.38
4.1.5 4.c.39
4.1.6 4.c.40
4.1.7 Notes: Global indicators are shaded (refer to Annex B for the list of indicators). Additional results, by sub-regions, are available in Annex E. Source: UNESCO Institute for Statistics

- 11 -
2.3 Data on learning outcomes
Six out of 43 indicators directly measure learning outcomes and the survey shows that most of the countries in the region are not well-prepared to monitor these indicators (see Figure 5). For 4.1.1, which is about learning outcomes at early grades, end of primary and end of lower secondary, 48% the countries reported that they are able to monitor indicators. However, when it comes to measuring learning outcomes, i.e., achieving at least fixed level of proficiency in functional literacy and numeracy skills (4.6.22), only 34% of the countries can report the indicator. Only 18% of the countries are able to measure learning assessment indicators for 4.4.16.1, 11% for 4.7.27 and 8% for 4.7.26 and 4.4.16.2”. It shows clearly that a lot of efforts are needed to build national capacities in measuring learning outcomes at various education levels and age groups and in different areas (e.g. literacy, numeracy, digital literacy, environmental and geoscience). There are also cases where countries conduct national student assessments, but not all of them correspond with the grades as the SDG 4 proposed.
At the sub-regional level, the proportion for each of the indicators differs greatly. Countries in East Asia and South and West Asia mentioned that the indicators 4.7.27, 4.7.26 and 4.4.16.2 were not available, or the countries didn’t know. Central Asian countries clearly show a different pattern. 50% of the countries reported that indicator 4.7.27 is available while only 25% of the countries could monitor indicator 4.1.1. On the contrary, South West Asia, the Pacific and East Asia reported that indicator 4.1.1 is available in 60%, 58% and 51% of the countries respectively.
2.4 National learning assessments and target grades as proposed by SDG 4
Indicators for Target 4.1 specify assessments at different points in the educational career from the early grades in primary education, at the end of the primary education, and at the end of lower secondary education. Since this will take some time, a placeholder (like, whether assessments exist), could be considered.
In countries that conduct national assessments both at primary and lower secondary levels, assessed grades do not necessarily correspond to ones proposed in SDG 4. Four countries have national assessments at the early grades, seven at the last grade of primary, and only two at the end of lower secondary as desired. Four out of 12 countries where data are available do not conduct national assessment in grades in alignment with the SDG 4 targets (see Figure 6).

- 12 -
Figure 5. Availability of indicators on learning assessments
Source: UNESCO Institute for Statistics
Figure 6. National learning assessments by measurement point
Country Age
5 6 7 8 9 10 11 12 13 14 15 Afghanistan G1 G2 G3 G4 G5 G6 G7 G8 G9 Bangladesh G1 G2 G3 G4 G5 G6 G7 G8 G9 G10 Bhutan G1 G2 G3 G4 G5 G6 G7 G8 G9 G10 Brunei Darussalam G1 G2 G3 G4 G5 G6 G7 G8 G9 G10
Cambodia G1 G2 G3 G4 G5 G6 G7 G8 G9 G10 Lao PDR G1 G2 G3 G4 G5 G6 G7 G8 G9 G10 Mongolia G1 G2 G3 G4 G5 G6 G7 G8 G9 G10 Myanmar G1 G2 G3 G4 G5 G6 G7 G8 G9 G10 G11 Nepal G1 G2 G3 G4 G5 G6 G7 G8 G9 G10 G11 Pakistan G1 G2 G3 G4 G5 G6 G7 G8 G9 G10 G11 Sri Lanka G1 G2 G3 G4 G5 G6 G7 G8 G9 G10 G11 Viet Nam G1 G2 G3 G4 G5 G6 G7 G8 G9 G10
Note: ■ represents the existing assessment that the countries have and align with the SDG4 targets.
■ represents the existing assessment that the countries have and do not align with the SDG4 target. Source: UIS Data Centre, accessed in February 2015

- 13 -
2.5 Disaggregation of indicators
Equity is at the heart of the SDGs and Education 2030 agenda and countries should be able to provide equitable and quality education to all, leaving no one behind. Thus, the important dimension of equity must be reflected in the monitoring. The IAEG-SDGs proposes that the “Sustainable Development Goal indicators should be disaggregated, where relevant, by income, sex, age, race, ethnicity, migratory status, disability and geographic location, or other characteristics, in accordance with the Fundamental Principles of Official Statistics” (Paragraph 26, Report of the IAEG-SDGs to the 47th session of the UN Statistical Commission, E/CN.3/2016/2) 1. The survey looks at data by type of disaggregation (see Figure 7).
The mapping exercise shows that the availability of data disaggregated by wealth is very limited (10% of the indicators can be disaggregated by some measure of wealth), followed by disabilities (27% of the indicators). While wealth disaggregation is the least available in East Asia, the Pacific and South and West Asia, disability status is for Central Asia. Nonetheless, the availability of data disaggregated by disability is 35%, just after South and West Asia where it is available for 39% of the relevant indicators. In comparison, it is available for 13% of indicators in East Asia.
A larger proportion of the indicators can be disaggregated by location (78%) and sex (86%). Finally, a fair proportion of the indicators can be disaggregated by age (63%). The mapping examined whether the indicators are available by individual disaggregation by sex, by location, by wealth etc. but further mapping exercises should also examine the availability of multiple disaggregation (e.g. poor rural girls).
Figure 7. Availability of indicators by disaggregation
Source: UNESCO Institute for Statistics
1 More information on the Fundamental Principles of Official Statistics, General Assembly resolution
68/261 can be found here: http://www.un.org/en/ga/search/view_doc.asp?symbol=A/RES/68/261
- 14 -
3. Existing challenges for measurement
In order to comprehensively monitor the education SDG targets, a systematic data collection system – which draws on a range of data sources – needs to be in place. Most of the countries in the Asia and the Pacific region have set up an Education Management Information System (EMIS) for collecting, storing, analysing and disseminating education data as a pillar of their decision-making processes. However, in most cases, different challenges such as poor coordination amongst data producers, fragmented databases and lack of resources hampers the regular delivery of good quality data.
Furthermore, an effective monitoring of SDG 4 - Education 2030 will demand data not only for formal education but also for other areas such as early childhood care and education (ECCE), non-formal education (NFE), TVET, and higher education as the agenda has a holistic approach to education. National education information systems will need to collect data for all education sub-sectors. However, it is unlikely that sufficient technical and financial resources exist to maintain an information system with such a broad reach.
3.1 Weak coverage outside the formal education system
The data availability mapping exercise in Asia-pacific also included the information on data collection system and its coverage in the countries in the region. Almost all the countries (35 countries) who responded to the questions, have data collection systems for primary and secondary education, but less than 80 per cent of the participating countries have systems to collect data for TVET and higher education. There are also children, youth and adults that are engaged in non-formal and skills development training/programmes, but only 51 per cent of the countries have data collection systems for NFE programmes. Many countries will face serious challenges to monitor SDG 4 without strengthening data collection systems for TVET, NFE and higher education. Significant efforts will be needed to expand the coverage of data system to cover all the education provision that contribute to the objectives of the SDGs.
3.2 Fragmented institutional settings and legal frameworks
While most countries have data collection system in place, the quality of the data collection is often still problematic. Many countries have fragmented data collection systems where information across databases for different sub-sectors are neither linked nor integrated; poor standards of procedures; and even duplication of data collection. The mapping exercise also highlighted that many countries have weak data production chains which can also cause problems in generating the needed information. In addition, apart from the lack of coordination among various data producers, student learning outcomes data are rarely included or integrated with any other databases. Most of the countries have culture of treating such data differently and they are often not easy to access.
Box 2 shows some examples of countries where there is more than one entity responsible to collect data on education. Strong legal frameworks with an agency designated to collect and/or coordinate data collection and production for education are very much required to harmonise quality data production in the countries.

- 15 -
Box 2. The need to harmonise data production in countries
Myanmar: Higher education institutions are administered by 13 ministries and departments. Each Ministry (e.g. the Ministry of education (MoE) and the Ministry of Ministry of Science and Technology (MoST)) has its individual policy including a development plan of its education and training institutions. To support and monitor each Ministry’s programmes, there are separate data collection and production mechanisms. To ensure quality and coverage of the data for whole sub-sector, a strong coordination and collaboration among all the Ministries is required. Even if in principle there is an organization to coordinate those 13 ministries, the coordination amongst them is weak resulting in data for the higher education sub-sector fragmented and appearing as a whole.
Lao PDR: Although EMIS under the Department of Planning has been assigned as the official source for education data and information, the Ministry of Education departments have a culture of urgency (to obtain data rapidly with implications for data quality), and thus, cannot wait until the Department of Planning comes up with required data or publishes the Annual Bulletin. So different departments under the MoE (e.g. the Department of Teacher Education and TVET) collect their own data which generally causes confusion. Similarly, several databases such as personnel management information system (PMIS), financial management information system (FMIS) are available and there is less coordination among them. Some efforts to harmonise these different databases to improve the overall data production system in the country have started.
Sri Lanka: It has three ministries responsible for education - the Ministry of Higher Education, the Ministry of Education, and the Ministry of Skills Development and Vocational Training. Furthermore, the University Grants Commission (UGC) collects data from the universities and colleges. However, there are some universities which come directly under the Ministry of Higher Education not under the UGC. There are separate data collection and production mechanisms in these ministries and the UGC which need to be coordinated. The government is trying to establish a coordinating mechanism bringing all relevant ministries together to enhance harmonisation between the ministries and also to standardise the data collection and production mechanism.
Samoa: Currently, the production of ‘education official statistics’ is hindered by the inadequate inter-connectedness of existing EMIS due to the lack of mechanisms in place for the three major data producers to collaborate on methodologies, programmes and quality issues. To better align the education statistics produced in the country, an education sector-wide approach will be incorporated soon.
3.3. Low levels or insufficient technical and financial resources available for education statistics
Another challenge is a lack of capacity among government staff to analyse and generate education policy from the collected data. Data management and processing tasks are often assigned to employees not always capable and qualified to conduct proper assessments. Finally, there is often not enough personnel to do this kind of work, leading to long delays in the analysis production and, therefore, limiting the relevance of data.
The regional study for the APMED 2030 shows that less than 40 per cent of the countries report that they do not have sufficient technical and financial resources to produce the data needed to monitor SDG 4, whereas only 34 per cent of the countries mentioned they have both financial and technical resources. The limitation of the resources which constitutes a constraining factor for the development of a stronger data eco-system (across multiple data sources) is a challenge which the countries will need to address to better monitor at the national and international levels.

- 16 -
4. Advancing the global and regional agendas for monitoring SDG 4: Next steps
4.1 Initiatives for coordination, indicators development and capacity support
The SDG 4 - Education 2030 Framework for Action requested the UIS to work with partners to develop new indicators, statistical approaches and monitoring tools to better assess progress across the education targets. Therefore, the UIS proposed the creation of the Technical Cooperation Group on the Indicators for SDG 4 - Education 2030 (TCG SDG4-ED2030) with the overarching mission of coordinating the necessary efforts towards 2030 to efficiently implement the thematic monitoring framework on education. The UIS also established global platforms such as the Global Alliance to Monitor Learning (GAML) to enhance the capacity of countries in data availability and quality.
In Asia and the Pacific, a new thematic working group, the Thematic Working Group on Education 2030+ (TWG-Education 2030+) replaced the one on EFA as a regional coordination mechanism with the focus to provide support and assistance in SDG 4 implementation and monitoring.
Table 1 summarises the key platforms and initiatives which support the indicator development and implementation to achieve SDG 4.
Table 1. Key platforms and initiatives at the global and regional levels
Key platform and initiatives
Coverage
Types initiatives/ platforms
Objectives/Activities Leading Agency
TCG SDG4-ED20302
Global Technical group
- Provide a platform to discuss and develop the indicators used for monitoring Education 2030 targets in an open, inclusive and transparent manner, involving the main stakeholders - Responsible for reporting to the SDG 4 ‐ Education 2030 Steering Committee on the implementation of the thematic monitoring framework
UIS/ UNESCO
GAML3 Global Network - Ensure technically-sound and reliable approaches and developing innovative methodologies for the measurement of learning outcomes - Support TCG with technical solution in measuring learning
UIS/ UNESCO
APMED4 Regional Annual Event on Education 2030
- Build a common understanding among countries on SDG 4 implementation and monitoring - Develop strategies in coordination and partnership mechanisms - Produce analytical products (including factsheets and working papers) in preparation of the annual events
UNESCO, UIS, UNICEF
2 http://www.uis.unesco.org/Education/Pages/post-2015-indicators.aspx 3 http://www.uis.unesco.org/Education/Pages/gaml-meeting-may-2016.aspx 4 http://www.unescobkk.org/education/education-2030/

- 17 -
TWG-GEEW – Working Group on Gender Statistics5
Regional Regional workshops
- Discuss and develop strategies to disaggregate data to measure equity - Organize different workshops such as sex disaggregated data, disabilities, child labor etc. to understand the different practices in the countries and also to harmonise the methodologies
ESCAP
NEQMAP6 Regional Network - Improve the quality of learning in the Asia-Pacific by enhancing the use of student learning assessment to strengthen education systems (Major activities includes capacity development, research and knowledge sharing among network members and other relevant stakeholders) - Map learning assessment in 11 countries in the region, via LEAP
UNESCO Bangkok as secretariat
SEA-PLM7 Regional Regional Primary Assessment
- The Southeast Asia Primary Learning Metric (SEA-PLM) is a regional approach for system-level monitoring of learning outcomes for primary grades especially in the areas of reading, writing, numeracy and Global citizenship education - Phase II involves the actual development and testing of the tools and protocols that will be used for assessment in participating SEAMEO Member Countries (Brunei Darussalam, Lao PDR, Malaysia, Myanmar, the Philippines, and Thailand) - The main survey will take place during 2017 with the countries that have already conducted the field trial in 2016
SEAMEO/ UNICEF
TWG-Education 20308
Regional Working group on Education 2030
- Set up as a regional co-ordination mechanism with the focus to provide support and assistance in Education 2030 implementation and monitoring - Prepare technical guidelines on indicators and on monitoring at the regional level, as well as for the coordination at the national and regional levels for 2016
UNESCO BKK/ UNICEF, ILO, CBOs
Source: UNESCO Institute for Statistics
5 Asia-Pacific Regional Coordination Mechanism Thematic Working Group on Gender Equality and
empowerment of Women 6 http://www.unescobkk.org/education/quality-of-education/neqmap/ 7 http://www.seameo.org/index.php?option=com_content&view=article&id=512:southeast-asia-primary-
learning-metric-sea-plm&catid=90&Itemid=556 8 http://www.unescobkk.org/education/efa/efa-network/east-and-south-east-asia/twg-on-efa/twg-
education-2030-meetings/1st-meeting-of-the-education-2030-twg/

- 18 -
Regional support also includes participation in national SDGs or SDG 4 consultations when requested. As of May 2016, already 20 countries in the region have done some consultations on the SDG 4 localisation and monitoring (see Table 2). During the consultations, countries discuss the national alignment of indicators with the set of global/thematic indicators, as well as data availability (and gaps), data sources, and data collection processes. After the consultations, countries have the basis of a strategic implementation: how they will select and prioritise their national indicators.
Table 2. Countries, by sub-regions, which organised a national consultation on SDG 4
Central Asia East Asia South-West Asia Pacific Total
Turkmenistan, Uzbekistan
Cambodia, China, Lao PDR, Myanmar,
Philippines, Thailand
Afghanistan, Bangladesh, India,
Iran, Maldives, Nepal, Pakistan
Australia, Fiji, Cook Islands, Micronesia,
Palau 20
Note: The number of countries is as of May 2016. Source: UNESCO Institute for Statistics
4.2 Mobilising partners and resources
The Survey results on Asia and the Pacific countries’ readiness to measure and monitor the new SDG 4 targets show that there are important data gaps, more significant for certain targets, such as 4.7, and that countries’ capacities need to be strengthened.
Challenges arise from the use of different type of data sources to monitor the global and thematic indicators (administrative data, assessment data, and household survey data) and from the lack of harmonised education data collection and production systems at the national level, including the link between school data and student learning outcomes results.
For the successful implementation and monitoring of SDG 4 targets, partnerships at the global, regional and national levels, including civil society organizations and non-governmental organizations, are desirable. The partnership can be around data collection harmonisation, to strengthen countries capacities to produce the SDG 4 indicators, or as financial support.
At the global level, two essential structures will be put in place, the GAML and the TCG, to facilitate global monitoring. Similar platforms of coordination would be needed at the regional and national levels. At the regional level, consultation on an Asia and the Pacific monitoring and a regional indicators framework is foreseen as a next step. At the national level, the UIS would encourage the countries of the region to bring the different national actors around a national strategy that could be the National Strategies for the Development of Statistics (NSDS), specific to the area of education statistics. This strategy will support the implementation of the 2030 Agenda on Sustainable Development through effective and efficient support for SDG monitoring with a sustainable approach to statistical capacity development of national statistical systems and stakeholders of the national data ecosystem. This will be done through establishment, by the UIS in the countries, of a data education platform which should be coordinating all capacity building needs and activities.

- 19 -
References
Secretary General’s Synthesis Report, December 2014
UNESCO (2015). Education 2030 - Incheon Declaration and Framework for Action: Toward inclusive and equitable quality education and lifelong learning for all. Paris: UNESCO.
UIS country profile (accessed in February 2016). Retrieved from http://www.uis.unesco.org/DataCentre/Pages/country-profile.aspx?regioncode=40500&code=CAN
UIS Learning Outcome Database (accessed in February 2016). Retrieved from http://www.uis.unesco.org/Education/Pages/learning-assessments-database.aspx

- 20 -
Annex A. SDG 4 targets
Goal: Ensure inclusive and equitable quality education and promote lifelong learning opportunities for all Target 4.1: By 2030, ensure that all girls and boys complete free, equitable and quality primary and secondary education leading to relevant and effective learning outcomes. Target 4.2: By 2030, ensure that all girls and boys have access to quality early childhood development, care and pre-primary education so that they are ready for primary education. Target 4.3: By 2030, ensure equal access for all women and men to affordable quality technical, vocational and tertiary education, including university. Target 4.4: By 2030, ensure that all youth and adults have relevant skills, including technical and vocational skills, for employment, decent work and entrepreneurship Target 4.5: By 2030, eliminate gender disparities in education and ensure equal access to all levels of education and vocational training for the vulnerable, including persons with disabilities, indigenous peoples and children in vulnerable situations Target 4.6: By 2030, ensure that all youth and adults, both men and women, reach a proficiency level in literacy and numeracy sufficient to fully participate in society Target 4.7: By 2030, ensure all learners acquire knowledge and skills needed to promote sustainable development, including among others through education for sustainable development and sustainable lifestyles, human rights, gender equality, promotion of a culture of peace and non-violence, global citizenship, and appreciation of cultural diversity and of culture’s contribution to sustainable development. Target 4.a: By 2030, build and upgrade education facilities that are child, disability and gender sensitive and provide safe, non-violent, inclusive and effective learning environments for all. Target 4.b: By 2030, substantially increase support for scholarships available to developing countries, in particular least developed countries, Small Island developing States and African countries, for enrolment in higher education, including vocational training and information and communications technology, technical, engineering and scientific programmes, in developed countries and other developing countries Target 4.c: By 2030, all learners are taught by qualified teachers, including through international cooperation for teacher training in developing countries, especially least developed countries and Small Island developing States

- 21 -
Annex B. Proposed SDG 4 global and thematic indicators9
The indicators in bold are the global indicators.
Target 4.1
Percentage of children/young people (i) in Grade 2 or 3; (ii) at the end of primary education; and (iii) at the end of lower secondary education achieving at least a minimum proficiency level in (a) reading and (b) mathematics
Administration of a nationally-representative learning assessment (i) in Grade 2 or 3; (ii) at the end of primary education; and (iii) at the end of lower secondary education
Gross intake ratio to the last grade (primary, lower secondary)
Completion rate (primary, lower secondary, upper secondary)
Out-of-school rate (primary, lower secondary, upper secondary)
Percentage of children over-age for grade (primary, lower secondary)
Number of years of (i) free and (ii) compulsory primary and secondary education guaranteed in legal frameworks Target 4.2
Percentage of children under 5 years of age who are developmentally on track in health, learning and psychosocial well-being
Percentage of children under 5 years of age experiencing positive and stimulating home learning environments
Participation rate in organized learning (one year before the official primary entry age)
Gross pre-primary enrolment ratio
Number of years of (i) free and (ii) compulsory pre-primary education guaranteed in legal frameworks Target 4.3
Percentage of youth/adults participating in education and training in the last 12 months, by type of programme (formal and non-formal) and by age group
Gross enrolment ratio for tertiary education
Participation rate in technical-vocational education programmes (15- to 24-years old)
9 Source: Technical Advisory Group on Education Indicators (TAG). (2015). Thematic Indicators to
Monitor the Education 2030 Agenda.

- 22 -
Target 4.4
Percentage of youth/adults with ICT skills by type of skill
Percentage of youth/adults who have achieved at least a minimum level of proficiency in digital literacy skills
Youth/adult educational attainment rates by age group, economic activity status, level of education and programme orientation Target 4.5
Parity indices, (female/male, rural/urban, bottom/top wealth quintile and others such as disability status and conflict-affected as data become available) for all indicators on this list that can be disaggregated
Percentage of students in primary education whose first or home language is the language of instruction
Extent to which explicit formula-based policies reallocate education resources to disadvantaged populations
Education expenditure per student by level of education and source of funding
Percentage of total aid to education allocated to low income countries Target 4.6
Percentage of the population in a given age group achieving at least a fixed level of proficiency in functional (a) literacy and (b) numeracy skills
Youth/adult literacy rate
Participation rate of youth/adults in literacy programmes Target 4.7
Extent to which (i) global citizenship education; and (ii) education for sustainable development, including gender equality and human rights, are mainstreamed in (a) national education policies; (b) curricula; (c) teacher education; and (d) student assessment
Percentage of students by age group (or education level) showing adequate understanding of issues relating to global citizenship and sustainability
Percentage of 15-year old students showing proficiency in knowledge of environmental science and geoscience
Percentage of school that provide life skills-based HIV and sexuality education
Extent to which the framework on the World Programme on Human Rights Education is implemented nationally (as per UNGA Resolution 59/113)
- 23 -
Target 4.a
Percentage of schools with access to (i) basic drinking water; (ii) basic sanitation facilities; and (iii) basic handwashing facilities
Percentage of schools with access to (i) electricity; (ii) Internet for pedagogical purposes; and (iii) computers for pedagogical purposes
Percentage of schools with adapted infrastructure and materials for students with disabilities
Percentage of students experiencing bullying, corporal punishment, harassment, violence, sexual discrimination and abuse
Number of attacks on students, personnel and institutions Target 4.b
Volume of official development assistance (ODA) flows for scholarships by sector and type of study
Number of higher education scholarships awarded by beneficiary country Target 4.c
Percentage of teachers in (i) pre-primary education; (ii) primary education; (iii) lower secondary education; and (iv) upper secondary education who have received at least the minimum organized and recognised teacher (ie pedagogical) training pre-service or in-service required for teaching at the relevant level in a given country, by type of institution
Percentage of teachers qualified according to national standards by education level and type of institution
Pupil/qualified teacher ratio by education level
Pupil/trained teacher ratio by education level
Average teacher salary relative to other professions requiring a comparable level of education qualification
Teacher attrition rate by education level
Percentage of teachers who received in-service training in the last 12 months by type of training

- 24 -
Annex C. Methodology and coverage of the regional survey
A standardised questionnaire was used to collect data from countries in November 2015. The questionnaire had four parts which cover various issues related to data availability, quality of the information system, and available resources. In order to better capture the data availability, the distributed questionnaire had 83 indicators, which include 16 sub-categories. Responses for 83 indicators were converted to 43 indicators upon analysis, using the average recurrence of the sub-category availability. Taking into account that some indicators and data may have already exited, yet the countries failed to report them in the questionnaire, the availability of data was reviewed and updated, if necessary, based on the existing UIS database (i.e. 4.1.1-3, 4.1.5-7, 4.2.11-12, 4.3.13, 4.4.17, 4.5.20, 4.6.23, and 4.c.37-38). The questionnaire was sent to 52 countries in the Asia and Pacific region (see Annex D for the list of country groupings). 38 countries (or 81 per cent) responded to the questionnaire. Figure 8 summarises the number of respondent countries by sub-region.
Figure 8. Number of respondent countries by Asia-Pacific sub-region
Source: UNESCO Institute for Statistics
If the response is ‘Yes’, the indicator is available. The next question looks into what type of disaggregation for the indicator is available and how frequently the indicator is produced in the country. If the answer is ‘No’, the next question asks if the country has any plan to produce the indicator in the near future (see Figure 9).
7 7
12 12
0
2
4
6
8
10
12
14
16
18
Central Asia(9 countries)
South and West Asia(9 countries)
East Asia(17 countries/territories)
Pacific(17 countries/ territories)
Num
ber
of c
ount
ries
Respondents

- 25 -
Figure 9. Structure of questions in the questionnaire
There are several important limitations in interpretation of the results of the Regional Survey. First of all, the findings are based on self-assessment and some of the responses might have been provided without proper consultations with the concerned departments which could have effect on the responses. An in-depth assessment would be required at the country level to provide a more detailed mapping to inform strategies to fill the data gaps.
Question:
Does your country collect data require to
calculate this indicator?
Yes Type / level of disaggregation
No Intension to
produce
Data
source

- 26 -
Annex D. Sub-regions and countries covered by the survey
This mapping exercise uses the UIS regional and sub-regional groupings. The UIS has 52 Member States and Associate Members in the Asia-Pacific region, which have been grouped into the following sub-regions: Central Asia (9 countries):
Armenia, Azerbaijan, Georgia, Kazakhstan, Kyrgyzstan, Mongolia, Tajikistan, Turkmenistan, Uzbekistan
East Asia (17 countries/territories):
Brunei Darussalam, Cambodia, China, China, Hong Kong Special Administrative Region, China, Macao Special Administrative Region, Democratic People’s Republic of Korea, Indonesia, Japan, Lao People’s Democratic Republic, Malaysia, Myanmar, Philippines, Republic of Korea, Singapore, Thailand, Timor-Leste, Viet Nam
Pacific (17 countries/territories):
Australia, Cook Islands, Fiji, Kiribati, Marshall Islands, Micronesia (Federated States of), Nauru, New Zealand, Niue, Palau, Papua New Guinea, Samoa, Solomon Islands, Tokelau, Tonga, Tuvalu, Vanuatu
South and West Asia (9 countries):
Afghanistan, Bangladesh, Bhutan, India, Iran (Islamic Republic of), Maldives, Nepal, Pakistan, Sri Lanka

- 27 -
Annex E. Sub-regional classification of thematic indicators
Figure 10 presents the overview of the classification, at the regional level, of thematic indicator availability based on the level of difficulty to collect, for each target.
Figure 10 below adds the dimension of sub-region. In the South and West Asia, clearly the indicators are mostly classified in two out the four categories: 18 indicators are reported to be very difficult to collect as less than 30% of the countries in that sub-region mentioned the indicators as available. other 18 indicators are reported to be easily collected as more than 70% of the countries mentioned they were available. The remaining 8 indicators are classified as ‘fair’ and ‘difficult’ to collect.
Central Asia countries are able show less difficulty to collect quite a large numbers of indicators. Indeed, 50% or more the countries are able to collect 27 indicators. Pacific countries follow with 22 indicators for which more than 50% of the countries collect the indicators.
Figure 10. Classification of thematic indicators based on the level of difficulty to collect, by sub-regions
Source: UNESCO Institute for Statistics
4.c.41 4.c.43
4.a.34 4.c.40
4.b.36 4.a.33 4.c.39
4.a.34 4.a.32 4.c.38
4.a.32 4.7.29 4.c.40 4.c.40 4.c.37
4.7.29 4.a.33 4.7.28 4.c.43 4.c.43 4.c.39 4.c.37 4.b.35
4.7.28 4.7.29 4.7.27 4.c.42 4.c.41 4.c.38 4.a.31 4.a.31
4.7.27 4.7.28 4.7.26 4.c.41 4.c.40 4.c.37 4.a.30 4.c.39 4.6.23
4.b.36 4.7.26 4.7.27 4.7.25 4.a.32 4.c.38 4.6.23 4.6.23 4.c.37 4.5.20
4.b.35 4.7.25 4.7.26 4.6.22 4.c.42 4.a.31 4.a.31 4.5.20 4.5.20 4.b.35 4.5.18
4.a.34 4.6.22 4.7.25 4.5.21 4.c.41 4.a.30 4.a.30 4.3.13 4.3.13 4.3.13 4.3.13
4.a.33 4.5.21 4.5.21 4.5.19 4.7.26 4.b.35 4.c.42 4.7.27 4.6.23 4.2.12 4.2.12 4.2.12 4.2.12
4.7.29 4.5.18 4.5.19 4.4.16.2 4.6.22 4.a.33 4.b.36 4.7.25 4.6.22 4.2.11 4.2.11 4.2.11 4.2.11
4.7.28 4.4.16.2 4.4.17 4.4.16.1 4.5.21 4.6.24 4.a.34 4.5.19 4.c.43 4.5.20 4.1.7 4.1.7 4.2.10 4.1.7
4.6.24 4.4.16.1 4.4.16.2 4.3.15 4.4.16.2 4.5.19 4.a.32 4.b.36 4.5.18 4.c.39 4.3.15 4.c.42 4.1.6 4.1.6 4.1.7 4.1.6
4.3.15 4.3.15 4.4.16.1 4.2.9 4.4.16.1 4.4.17 4.6.24 4.4.17 4.4.17 4.c.38 4.3.14 4.a.30 4.1.5 4.1.5 4.1.6 4.1.5
4.2.9 4.2.9 4.2.9 4.2.8 4.2.8 4.3.14 4.5.18 4.3.14 4.3.14 4.2.10 4.1.4 4.6.24 4.1.4 4.1.4 4.1.5 4.1.4
4.1.1 4.2.8 4.2.8 4.1.2 4.1.2 4.1.2 4.1.1 4.2.10 4.2.10 4.1.1 4.1.2 4.1.1 4.1.3 4.1.3 4.1.3 4.1.3
Central
AsiaEast Asia Pacific
South and
West Asia
Central
AsiaEast Asia Pacific
South and
West Asia
Central
AsiaEast Asia Pacific
South and
West Asia
Central
AsiaEast Asia Pacific
South and
West Asia
Num
ber
of in
dic
ato
rs
Very difficult (<30) Difficult (30≤x<50) Fair (50≤x<70) Easy (70≤)