county snapshot - washcova.com
TRANSCRIPT

County Snapshot
County Snapshot | 2
CONTENTS
Introduction 4
Quick Facts 5
Population and Size 5
County Boards, Authorities, Commissions and Committees 5
Regional Boards, Authorities and Services 8
People 10
Population (Current) 10
Population History 10
Population Forecast 10
Sex and Age 12
Race 14
Relationships 17
Income 18
Education 20
Veterans 21
Economic Development 22
Economic Characteristics 22
2007 Economic Census 25
Natural and Cultural Resources 27
Natural Resources 27
Historic and Cultural Resources 29
Agriculture 33

County Snapshot | 3
Housing 36
Households By Type 36
Housing Occupancy 36
Housing Tenure 37
Housing Characteristics 37
Infrastructure & Community Facilities 42
Schools 42
Emergency Services 42
County Facilities (Parks, Community Buildings) 43
Sewer & Water 44
Transportation 45
The Local Government Comprehensive Plan and Transportation Plan 45
VDOT Six Year Improvement Program List 46
Mt. Rogers Planning District Commission – 2035 Rural Long Range Transportation Plan 47
Land Use 49
Appendix 53
2002 Comprehensive Plan 53
2013 Comprehensive Plan Project Outline 53

County Snapshot | 4
Introduction The Community Snapshot contains supporting information about the County which will be used as a reference during the comprehensive planning process. Data included in this document comes from a variety of sources. The document will be amended as new information is available.
County Snapshot | 5
Quick Facts Population and Size
Census 2010 Total Population - 54,876 people (U.S. Census Bureau 2010 Demographic Profile)
1990-2000 Population growth of 11%.
• 2000-2010 Population growth of 7.4% • April 1, 2010-July 1, 2012 percent change 0.6%
Washington County is approximately 560 square miles and is divided into seven electoral districts:
• A-11, Harrison District • B-11, Jefferson District • C-11, Madison District • D-11, Monroe District • E-11, Taylor District • F-11, Tyler District • G-11, Wilson District
There are three towns located in Washington County:
• Abingdon (County Seat) – population 8,193 (Source: U.S. Census Bureau 2010 Demographic Profile • Glade Spring – population 1,456 • Damascus – population 813
County Boards, Authorities, Commissions and Committees
Comprehensive Plan Advisory Committee – The Comprehensive Plan Advisory Committee was created by the Board of Supervisors on August 13, 2013. The purpose of the Committee is to help staff translate community feedback, review information and draft materials and to make recommendations regarding various components of the comprehensive plan. The Committee meets on the first Wednesday of every month. Members are:
• Phil Blevis • Mickey Tyler • Carol Jones • Duffy Carmack • Travis Staton • Talmage Stanley • Robbie Cornett • Phillip McCall • Bill Gibson
County Snapshot | 6
• Bruce Dando • Charlie Hargis • High School Representative from each Washington County high school
Board of Supervisors - The Board of Supervisors is the governing body of Washington County composed of seven Supervisors, one each elected from the County’s seven electoral districts for four year terms. All County ordinances, the County Operating Budget, and many of the primary public policies of the Washington County government originate from the Board of Supervisors. The Board of Supervisors meets twice monthly, the second and fourth Tuesday of the month, in regular sessions. Current Board members are:
• Joseph Straten, Taylor District (E-11) • Randy Pennington, Jefferson District (B-11) • Phillip McCall, Harrison District (A-11) • William Gibson, Madison District (C-11) • Dulcie Mumpower, Wilson District (G-11) • Wayne Stevens, Jr., Monroe District (D-11) • Odell Owens, Tyler District (F-11)
Planning Commission - The Washington County Planning Commission is charged with advising the Washington County Board of Supervisors on matters pertaining to the County’s zoning and subdivision codes and the County’s Comprehensive Plan. The Planning Commission is composed of seven Commissioners appointed by the Board of Supervisors, one Commissionr from each of the County’s seven Election Districts. The Commission meets on the fourth Monday of every month. Current members are:
• Joe Hutton, Harrison District (A-11) • Paul Widener, Jefferson District ((B-11) • Charlie Hargis, Madison District (C-11) • Bruce Dando, Monroe District, (D-11) • John Lentz, Taylor District (E-11) • Michael Felty, Tyler District (F-11) • Bill Canter, Wilson District (G-11)
Washington County Service Authority: The Washington County Service Authority (WCSA) provides public water throughout Washington County, as well as wastewater collection and treatment in portions of the County. The WCSA is an independent authority composed of a seven member Board of Commissioners appointed by the Board of Supervisors.
Industrial Development Authority: The Washington County Industrial Development Authority (IDA) is the primary organization responsible for industrial development within Washington County, including the development of publicly owned industrial parks and a variety of financing mechanisms to assist in the location or expansion of industry within the County. The IDA is composed of a seven member Board of Directors appointed at-large by the Board of Supervisors for four year terms.

County Snapshot | 7
Virginia Highlands Airport Authority: The Virginia Highlands Airport Authority (VHAA) is responsible for the operation of the Virginia Highlands Airport. The Authority is composed of a seven member Board of Commissioners, one member per election district, appointed by the Board of Supervisors.
Washington County Park Authority: The Park Authority owns and operates Washington County Park. The Authority is composed of an eight member Board of Directors appointed at-large by the Washington County Board of Supervisors.
Emergency Services Committee: The Washington County Emergency Services Committee provides review, oversee, investigate, develop recommendations on matters pertaining fire and emergency medical rescue services in Washington County.
Facilities Committee: The Washington County Facilities Committee provides review, oversee, investigate, develop recommendations and report on matters pertaining to County office and other building facilities, including the immediate and long-term needs of such facilities.
Personnel Committee: The Washington County Personnel Committee provides review, oversee, investigate, develop recommendations and report on matters pertaining to personnel needs, policies and practices within the Administrative Division of the County government.
Planning and Land Use Committee: The Washington County Joint Comprehensive Plan Steering Committee provides review, oversight, investigation, development of recommendations and reporting on matters pertaining to revising the Washington County Comprehensive Plan in coordination with the Washington County Planning Commission.
Economic Development Committee: The Washington County Economic Development Committee provides review, oversight, investigation, development of recommendations and reporting on matters involving coordination of County economic development activities between the Board of Supervisors and Washington County Industrial Development Authority (IDA).
School Budget Committee: The Washington County Joint School Budget Committee reviews the proposed Washington County School Board budget and the development of recommendations for funding of same for presentation in the County Administrator’s Proposed and Recommended County Operating Budget, in coordination with the Washington County School Board.
Utilities Committee: The Washington County Joint Utilities Committee provides review, oversight, investigation, development of recommendations and reporting on matters pertaining to the provision of public water and sanitary sewer services throughout Washington County, in coordination with the Washington County Service Authority and the Washington County Industrial Development Authority.
Board of Social Services: Controlling body of the Washington County Department of Social Services. Members of the Board of Social Services have a limit of two full consecutive terms. The Washington County Board of Supervisors appoints the Board of Social Services, one Board member from each of the County’s seven Election Districts.
Board of Zoning Appeals: The BZA is responsible for hearing and deciding requests for variances from the terms of the County Zoning Ordinance and for hearing and deciding appeals from determinations made by the Washington County Department of Zoning Administration in the administration of the County Zoning

County Snapshot | 8
Ordinance. The Washington County Board of Zoning Appeals (BZA) is composed of five residents of Washington County appointed by the Washington County Circuit Court.
Electoral Board: The Electoral Board shall ascertain from the returns the total votes in the County for each candidate and for and against each ballot question and complete the abstract of votes cast at elections. The Washington County Electoral Board is composed of three members appointed by a majority of the circuit judges of the 28th Judicial Circuit. Appointments are based on representation of the two political parties having the highest and next highest number of votes in the Commonwealth of Virginia for Governor at the last preceding gubernatorial election.
Public Library Board of Trustees: The Washington County Library Board of Trustees is responsible for the management and control of the County’s free public library system consisting of four branch library facilities in the Town of Damascus, Town of Glade Spring, Mendota and Hayter’s Gap Communities, and the main library located in the Town of Abingdon. The Board of Trustees is composed of seven Trustees appointed by the Washington County Board of Supervisors.
Planning Commission: The Washington County Planning Commission is charged with advising the Washington County Board of Supervisors on matters pertaining to the County’s zoning and subdivision codes and the County’s Comprehensive Plan. The Planning Commission is composed of seven Commissioners appointed by the Board of Supervisors, one Commissioner from each of the County’s seven Election Districts.
School Board: The Washington County School Board oversee the operations of the County’s Public School system. The Washington County School Board is made up of seven elected school board memebers, one from each of the seven election districts.
Regional Boards, Authorities and Services
The Bristol Virginia Utilities Authority (BVUA) is the executive body of Bristol Virginia Utilities, providing public water, sewer, electricity and telecommunications services to the City of Bristol Virginia and portions of Washington County.
The Highlands Community Services Board oversees the delivery of a variety of mental health and substance abuse programs for the City of Bristol, Virginia and Washington County. The Bristol, Virginia City Council and Washington County Board of Supervisors appoint members to the Highlands Community Services Board.
The Appalachian Juvenile Commission formulates and interprets the policy and procedures for all operations. They are considered a political sub-division as defined in the Code of Virginia. The Commission reviews and approves the annual budget and audit. The Commission approves any new programs or expansion. Formerly known as the Highlands Juvenile Detention Center Commission, the Commission expanded and was renamed in 2003.
The Southwest Virginia Regional Jail Authority (SWVRJA), a political subdivision of the Commonwealth of Virginia, was formed in May 2001 by the counties of Buchanan, Dickenson, Lee, Russell, Scott, Smyth, Washington, Wise and the City of Norton. Tazewell County joined the SWVRJA in 2005. The SWVRJA is

County Snapshot | 9
comprised of four correctional facilities which are located in Abingdon, Duffield, Haysi and Tazewell, Virginia. The jails have an average population of 1,700 inmates which consists of both males and females. SWVRJA offers a variety of educational and rehabilitative services to the inmates in their custody.
The Virginia Highlands Small Business Incubator Board of Directors serves as the official decision makers for the Incubator. They provide council to the Executive Director, approve all tenants for the Incubator, provide council and advice to tenants as requested, and vote on other business matters at their monthly meetings.
Officially established in July of 1969, the Mount Rogers Planning District Commission (MRPDC) is authorized under the Virginia Regional Cooperation Act to serve as one of the twenty-one planning district commissions in the State. The Commission was established for the purpose of promoting orderly and efficient development of economic, physical, and social elements of the region. The MRPDC serves the Counties of Bland, Carroll, Grayson, Smyth, Washington, and Wythe and the independent Cities of Bristol and Galax.
People Incorporated of Virginia is one of the Commonwealth of Virginia’s largest and most successful Community Action Agencies. Now serving Buchanan, Dickenson, Russell and Washington Counties and the city of Bristol, People Incorporated offers over 32 programs designed to, “give people a hand up, not a hand out.” Throughout its long history and to this day, the agency has worked to achieve the same mission: To provide opportunities for low-income people to improve their lives, their families, and their communities.
Ninth District Development Financing, Inc. meets its objectives to create and retain jobs, promote the region’s historical significance and cultural preservation, and attract tourists while supporting and expanding the tourism economy of the Ninth District by providing funding for a diverse set of thriving tourist related businesses including arts, cultural, historical, outdoor adventure, and entertainment venues.
The New River/Mount Rogers Workforce Investment Board (NRV/MRWIB), supported by federal and state funds and local service agencies, shows its commitment to the region’s quality of life by helping people find jobs and train for better careers. Qualified adults and youths can visit the One-Stop Centers for training, job and career counseling, and other job-related information. The WIB programs and activities carry out the Workforce Investment Act, which was written to address human needs associated with employment in each region, The Board is made up of local leaders and citizens so that all people and their interests are represented.
Virginia’s aCorridor consolidates marketing and presents regional demographics, and works with local governments to enhance their economic development programs. The Mount Rogers Development Partnership Inc. was created in 1989 to promote Virginia’s aCorridor as a location for new and expanded business. Stretching from the City of Bristol to the City of Galax along Interstates 81 and 77, the aCorridor includes the two cities and Washington, Smyth, Wythe, Grayson, Carroll and Bland counties.
District Three Governmental Cooperative is an agency owned and operated by its member local governments for the benefit of the citizens of Bland, Carroll, Grayson, Smyth, Washington and Wythe counties, and the cities of Bristol and Galax, Virginia. District Three Governmental Cooperative is dedicated to improving the quality of life for our citizens, especially those who are elderly and those who need assistance with transportation.

County Snapshot | 10
People A comprehensive understanding of a community’s past, present and future population characteristics and trends provides a basic and essential foundation for the planning process. The population information offers an overview of the socio-economic composition of Washington County. This population overview includes data related to existing and forecasted population, age, sex, race, household size, education, and income.
Population (Current)
Census 2010 Total Population – 54,876 persons
2012 Population Estimates – 55,190 persons (as of July 1, 2012)
April 1, 2010 Population Estimate (as of July 1) Census Estimates
Base 2010 2011 2012
Washington County, Virginia 54,876 54,876 54,879 54,188 55,190
Source: U.S. Census, 2012 Population Estimates
Population History
1960 Census 1970 Census 1980 Census 1990 Census
2000 Census 2010 Census
Washington County
38,076 40,835 46,487 45,887 51,103 54,876
Source: Weldon Cooper Center for Public Service
Population Forecast
2020 Population: 57,040
2030 Population: 58,800
2040 Population: 60,402
Source: Weldon Cooper Center for Public Service

County Snapshot | 11
Population Forecast By Age
Age Group 2020 2030 2040
Under 5 years 2,542 2,589 2,681
5 to 9 years 2,799 2,869 2,964
10 to 14 years 3,293 3,132 3,245
15 to 19 years 3,484 3,301 3,443
20 to 24 years 2,980 3,237 3,131
25 to 29 years 2,916 3,101 2,989
30 to 34 years 2,953 3,041 3,361
35 to 39 years 3,438 3,481 3,766
40 to 44 years 3,508 3,473 3,639
45 to 49 years 3,797 3,749 3,862
50 to 54 years 3,909 3,739 3,767
55 to 59 years 4,365 4,013 4,031
60 to 64 years 4,529 4,079 3,970
65 to 69 years 3,977 4,262 3,986
70 to 74 years 3,545 4,115 3,771
75 to 79 years 2,331 2,991 3,260
80 to 84 years 1,450 2,095 2,475
85 years and over 1,225 1,533 2,062
Total: 57,041 58,800 60,403

County Snapshot | 12
Population Forecast By Race
Race/Ethnicity Group 2020 2030 2040
White, Total 54,846 55,625 55,643
Black or African American, Total 726 781 802
Asian (All 41-48), Total 375 624 1,051
Other Races, Total 1,093 1,769 2,906
Total Population, Not Hispanic or Latino 55,748 56,453 56,151
Total Population, Hispanic or Latino (All 20-29) 1,292 2,347 4,250
Total: 57,041 58,800 60,403
Sex and Age
Median Age – 43.7 (SOURCE: U.S. Census, 2010 Demographic Profile)
Male Population – 49.3%
Female Population – 50.7% Subject Number Percent
SEX AND AGE Total population 54,876 100.0 Under 5 years 2,725 5.0 5 to 9 years 3,011 5.5 10 to 14 years 3,090 5.6 15 to 19 years 3,340 6.1 20 to 24 years 2,949 5.4 25 to 29 years 2,935 5.3 30 to 34 years 3,040 5.5 35 to 39 years 3,549 6.5 40 to 44 years 3,738 6.8 45 to 49 years 4,209 7.7 50 to 54 years 4,424 8.1

County Snapshot | 13
55 to 59 years 4,152 7.6 60 to 64 years 3,976 7.2 65 to 69 years 3,159 5.8 70 to 74 years 2,500 4.6 75 to 79 years 1,851 3.4 80 to 84 years 1,234 2.2 85 years and over 994 1.8 Median age (years) 43.7 ( X ) 16 years and over 45,423 82.8 18 years and over 44,122 80.4 21 years and over 42,042 76.6 62 years and over 12,056 22.0 65 years and over 9,738 17.7 Male population 27,070 49.3 Under 5 years 1,361 2.5 5 to 9 years 1,521 2.8 10 to 14 years 1,609 2.9 15 to 19 years 1,738 3.2 20 to 24 years 1,571 2.9 25 to 29 years 1,527 2.8 30 to 34 years 1,547 2.8 35 to 39 years 1,757 3.2 40 to 44 years 1,902 3.5 45 to 49 years 2,113 3.9 50 to 54 years 2,138 3.9 55 to 59 years 2,032 3.7 60 to 64 years 1,956 3.6 65 to 69 years 1,517 2.8 70 to 74 years 1,194 2.2 75 to 79 years 810 1.5 80 to 84 years 481 0.9 85 years and over 296 0.5 Median age (years) 42.4 ( X ) 16 years and over 22,245 40.5 18 years and over 21,585 39.3 21 years and over 20,494 37.3 62 years and over 5,414 9.9 65 years and over 4,298 7.8 Female population 27,806 50.7 Under 5 years 1,364 2.5 5 to 9 years 1,490 2.7 10 to 14 years 1,481 2.7 15 to 19 years 1,602 2.9 20 to 24 years 1,378 2.5 25 to 29 years 1,408 2.6

County Snapshot | 14
30 to 34 years 1,493 2.7 35 to 39 years 1,792 3.3 40 to 44 years 1,836 3.3 45 to 49 years 2,096 3.8 50 to 54 years 2,286 4.2 55 to 59 years 2,120 3.9 60 to 64 years 2,020 3.7 65 to 69 years 1,642 3.0 70 to 74 years 1,306 2.4 75 to 79 years 1,041 1.9 80 to 84 years 753 1.4 85 years and over 698 1.3 Median age (years) 45.1 ( X ) 16 years and over 23,178 42.2 18 years and over 22,537 41.1 21 years and over 21,548 39.3 62 years and over 6,642 12.1 65 years and over 5,440 9.9
SOURCE: U.S. Census, 2010 Demographic Profile
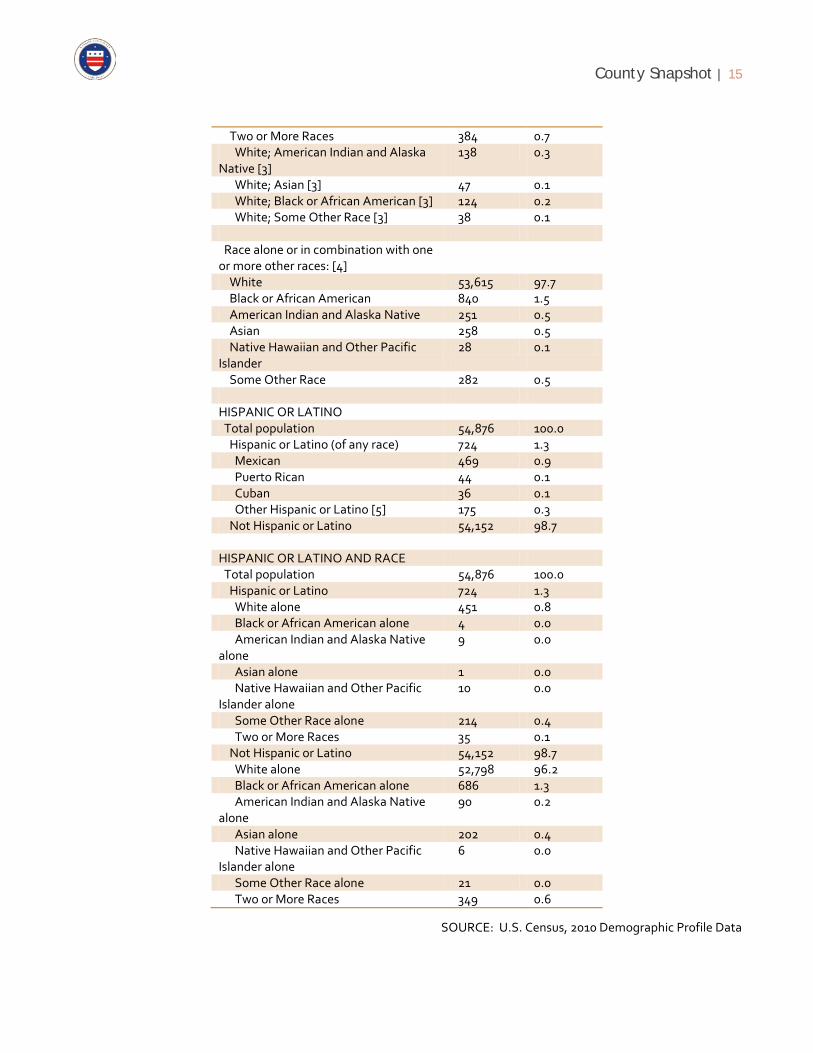
Race
RACE Total population 54,876 100.0 One Race 54,492 99.3 White 53,249 97.0 Black or African American 690 1.3 American Indian and Alaska Native 99 0.2 Asian 203 0.4 Asian Indian 40 0.1 Chinese 53 0.1 Filipino 21 0.0 Japanese 9 0.0 Korean 19 0.0 Vietnamese 21 0.0 Other Asian [1] 40 0.1 Native Hawaiian and Other Pacific Islander
16 0.0
Native Hawaiian 1 0.0 Guamanian or Chamorro 6 0.0 Samoan 3 0.0 Other Pacific Islander [2] 6 0.0 Some Other Race 235 0.4
County Snapshot | 15
Two or More Races 384 0.7 White; American Indian and Alaska Native [3]
138 0.3
White; Asian [3] 47 0.1 White; Black or African American [3] 124 0.2 White; Some Other Race [3] 38 0.1 Race alone or in combination with one or more other races: [4]
White 53,615 97.7 Black or African American 840 1.5 American Indian and Alaska Native 251 0.5 Asian 258 0.5 Native Hawaiian and Other Pacific Islander
28 0.1
Some Other Race 282 0.5 HISPANIC OR LATINO Total population 54,876 100.0 Hispanic or Latino (of any race) 724 1.3 Mexican 469 0.9 Puerto Rican 44 0.1 Cuban 36 0.1 Other Hispanic or Latino [5] 175 0.3 Not Hispanic or Latino 54,152 98.7 HISPANIC OR LATINO AND RACE Total population 54,876 100.0 Hispanic or Latino 724 1.3 White alone 451 0.8 Black or African American alone 4 0.0 American Indian and Alaska Native alone
9 0.0
Asian alone 1 0.0 Native Hawaiian and Other Pacific Islander alone
10 0.0
Some Other Race alone 214 0.4 Two or More Races 35 0.1 Not Hispanic or Latino 54,152 98.7 White alone 52,798 96.2 Black or African American alone 686 1.3 American Indian and Alaska Native alone
90 0.2
Asian alone 202 0.4 Native Hawaiian and Other Pacific Islander alone
6 0.0
Some Other Race alone 21 0.0 Two or More Races 349 0.6
SOURCE: U.S. Census, 2010 Demographic Profile Data

County Snapshot | 16
PLACE OF BIRTH Total population 54,628 ***** 54,628 (X) Native 54,090 +/-131 99.0% +/-0.2 Born in United States 53,956 +/-154 98.8% +/-0.3 State of residence 33,851 +/-1,064 62.0% +/-1.9 Different state 20,105 +/-1,090 36.8% +/-2.0 Born in Puerto Rico, U.S. Island areas, or born abroad to American parent(s)
134 +/-84 0.2% +/-0.2
Foreign born 538 +/-131 1.0% +/-0.2 U.S. CITIZENSHIP STATUS Foreign-born population 538 +/-131 538 (X) Naturalized U.S. citizen 220 +/-86 40.9% +/-16.5 Not a U.S. citizen 318 +/-136 59.1% +/-16.5 YEAR OF ENTRY Population born outside the United States
672 +/-154 672 (X)
Native 134 +/-84 134 (X) Entered 2000 or later 2 +/-4 1.5% +/-3.5 Entered before 2000 132 +/-84 98.5% +/-3.5 Foreign born 538 +/-131 538 (X) Entered 2000 or later 214 +/-95 39.8% +/-14.8 Entered before 2000 324 +/-111 60.2% +/-14.8 WORLD REGION OF BIRTH OF FOREIGN BORN
Foreign-born population, excluding population born at sea
538 +/-131 538 (X)
Europe 182 +/-83 33.8% +/-16.6 Asia 98 +/-57 18.2% +/-9.2 Africa 20 +/-31 3.7% +/-5.6 Oceania 0 +/-95 0.0% +/-6.7 Latin America 224 +/-127 41.6% +/-18.3 Northern America 14 +/-17 2.6% +/-3.3 LANGUAGE SPOKEN AT HOME Population 5 years and over 51,900 +/-61 51,900 (X) English only 50,911 +/-222 98.1% +/-0.4 Language other than English 989 +/-210 1.9% +/-0.4 Speak English less than "very well" 274 +/-118 0.5% +/-0.2 Spanish 547 +/-151 1.1% +/-0.3 Speak English less than "very well" 144 +/-77 0.3% +/-0.1 Other Indo-European languages 228 +/-100 0.4% +/-0.2 Speak English less than "very well" 20 +/-18 0.0% +/-0.1 Asian and Pacific Islander languages 123 +/-63 0.2% +/-0.1 Speak English less than "very well" 73 +/-57 0.1% +/-0.1 Other languages 91 +/-87 0.2% +/-0.2
County Snapshot | 17
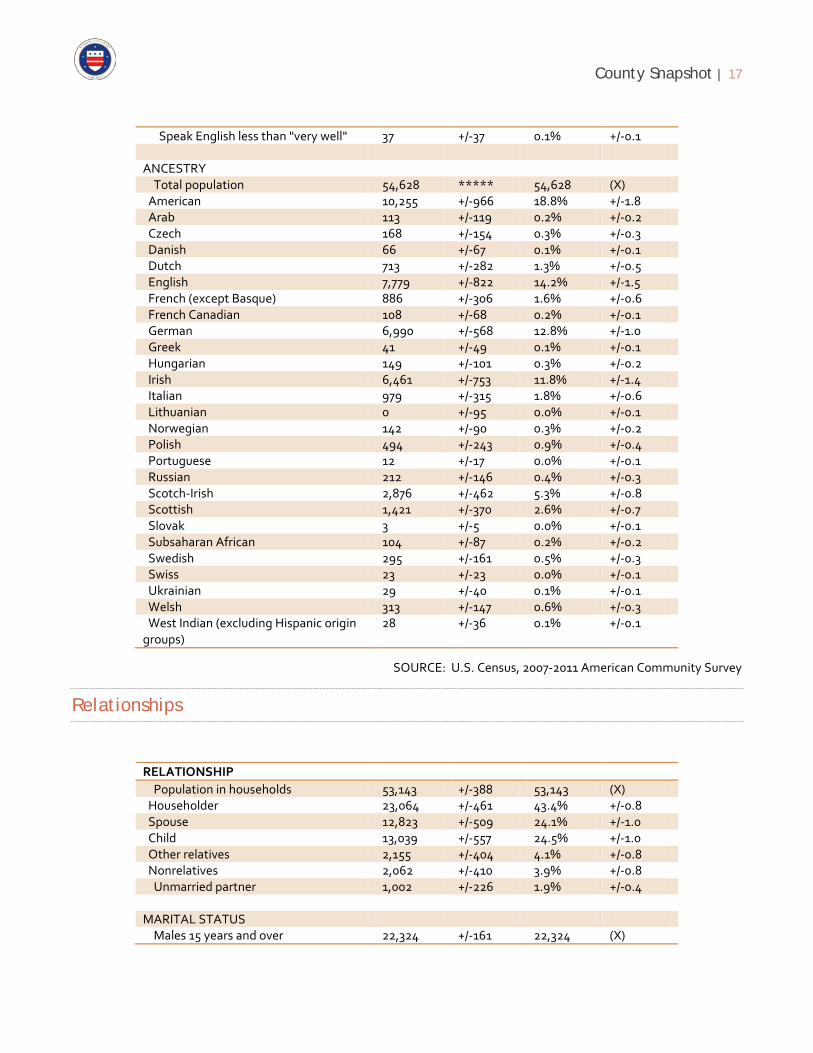
Speak English less than "very well" 37 +/-37 0.1% +/-0.1 ANCESTRY Total population 54,628 ***** 54,628 (X) American 10,255 +/-966 18.8% +/-1.8 Arab 113 +/-119 0.2% +/-0.2 Czech 168 +/-154 0.3% +/-0.3 Danish 66 +/-67 0.1% +/-0.1 Dutch 713 +/-282 1.3% +/-0.5 English 7,779 +/-822 14.2% +/-1.5 French (except Basque) 886 +/-306 1.6% +/-0.6 French Canadian 108 +/-68 0.2% +/-0.1 German 6,990 +/-568 12.8% +/-1.0 Greek 41 +/-49 0.1% +/-0.1 Hungarian 149 +/-101 0.3% +/-0.2 Irish 6,461 +/-753 11.8% +/-1.4 Italian 979 +/-315 1.8% +/-0.6 Lithuanian 0 +/-95 0.0% +/-0.1 Norwegian 142 +/-90 0.3% +/-0.2 Polish 494 +/-243 0.9% +/-0.4 Portuguese 12 +/-17 0.0% +/-0.1 Russian 212 +/-146 0.4% +/-0.3 Scotch-Irish 2,876 +/-462 5.3% +/-0.8 Scottish 1,421 +/-370 2.6% +/-0.7 Slovak 3 +/-5 0.0% +/-0.1 Subsaharan African 104 +/-87 0.2% +/-0.2 Swedish 295 +/-161 0.5% +/-0.3 Swiss 23 +/-23 0.0% +/-0.1 Ukrainian 29 +/-40 0.1% +/-0.1 Welsh 313 +/-147 0.6% +/-0.3 West Indian (excluding Hispanic origin groups)
28 +/-36 0.1% +/-0.1
SOURCE: U.S. Census, 2007-2011 American Community Survey
Relationships
RELATIONSHIP Population in households 53,143 +/-388 53,143 (X) Householder 23,064 +/-461 43.4% +/-0.8 Spouse 12,823 +/-509 24.1% +/-1.0 Child 13,039 +/-557 24.5% +/-1.0 Other relatives 2,155 +/-404 4.1% +/-0.8 Nonrelatives 2,062 +/-410 3.9% +/-0.8 Unmarried partner 1,002 +/-226 1.9% +/-0.4 MARITAL STATUS Males 15 years and over 22,324 +/-161 22,324 (X)

County Snapshot | 18
Never married 4,946 +/-323 22.2% +/-1.5 Now married, except separated 13,496 +/-526 60.5% +/-2.2 Separated 633 +/-204 2.8% +/-0.9 Widowed 815 +/-190 3.7% +/-0.9 Divorced 2,434 +/-301 10.9% +/-1.3 Females 15 years and over 23,459 +/-178 23,459 (X) Never married 4,163 +/-368 17.7% +/-1.6 Now married, except separated 13,080 +/-569 55.8% +/-2.5 Separated 649 +/-200 2.8% +/-0.8 Widowed 2,652 +/-283 11.3% +/-1.2 Divorced 2,915 +/-364 12.4% +/-1.6 FERTILITY Number of women 15 to 50 years old who had a birth in the past 12 months
679 +/-174 679 (X)
Unmarried women (widowed, divorced, and never married)
238 +/-130 35.1% +/-15.0
Per 1,000 unmarried women 44 +/-24 (X) (X) Per 1,000 women 15 to 50 years old 56 +/-14 (X) (X) Per 1,000 women 15 to 19 years old 42 +/-35 (X) (X) Per 1,000 women 20 to 34 years old 129 +/-35 (X) (X) Per 1,000 women 35 to 50 years old 9 +/-8 (X) (X) GRANDPARENTS Number of grandparents living with own grandchildren under 18 years
1,356 +/-298 1,356 (X)
Responsible for grandchildren 649 +/-196 47.9% +/-11.7 Years responsible for grandchildren Less than 1 year 168 +/-99 12.4% +/-6.7 1 or 2 years 45 +/-35 3.3% +/-2.7 3 or 4 years 152 +/-77 11.2% +/-5.6 5 or more years 284 +/-125 20.9% +/-8.5 Number of grandparents responsible for own grandchildren under 18 years
649 +/-196 649 (X)
Who are female 440 +/-162 67.8% +/-10.2 Who are married 338 +/-136 52.1% +/-17.0
SOURCE: U.S. Census, 2007-2011 American Community Survey
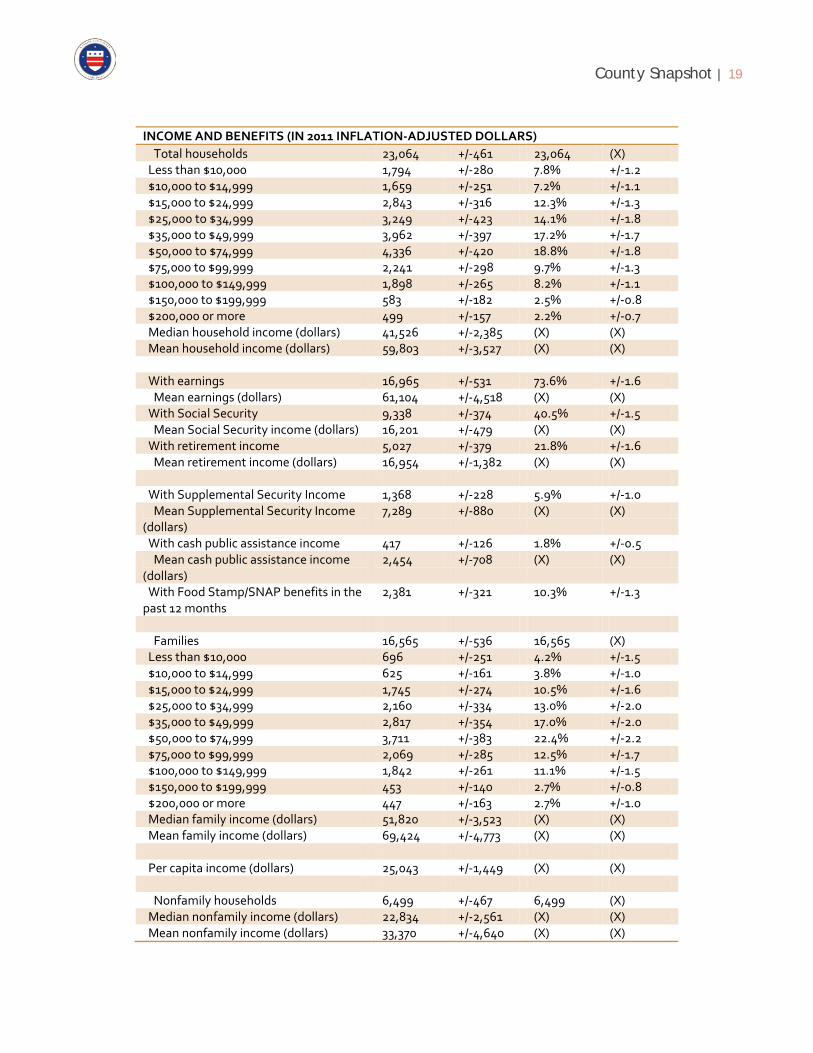
Income
Median Household Income - $41,526 (SOURCE: U.S. Census, 2007-2011 American Community Survey)
Individuals Below Poverty Level – 13.6% (SOURCE: U.S. Census, 2007-2011 American Community Survey)
County Snapshot | 19
INCOME AND BENEFITS (IN 2011 INFLATION-ADJUSTED DOLLARS) Total households 23,064 +/-461 23,064 (X) Less than $10,000 1,794 +/-280 7.8% +/-1.2 $10,000 to $14,999 1,659 +/-251 7.2% +/-1.1 $15,000 to $24,999 2,843 +/-316 12.3% +/-1.3 $25,000 to $34,999 3,249 +/-423 14.1% +/-1.8 $35,000 to $49,999 3,962 +/-397 17.2% +/-1.7 $50,000 to $74,999 4,336 +/-420 18.8% +/-1.8 $75,000 to $99,999 2,241 +/-298 9.7% +/-1.3 $100,000 to $149,999 1,898 +/-265 8.2% +/-1.1 $150,000 to $199,999 583 +/-182 2.5% +/-0.8 $200,000 or more 499 +/-157 2.2% +/-0.7 Median household income (dollars) 41,526 +/-2,385 (X) (X) Mean household income (dollars) 59,803 +/-3,527 (X) (X) With earnings 16,965 +/-531 73.6% +/-1.6 Mean earnings (dollars) 61,104 +/-4,518 (X) (X) With Social Security 9,338 +/-374 40.5% +/-1.5 Mean Social Security income (dollars) 16,201 +/-479 (X) (X) With retirement income 5,027 +/-379 21.8% +/-1.6 Mean retirement income (dollars) 16,954 +/-1,382 (X) (X) With Supplemental Security Income 1,368 +/-228 5.9% +/-1.0 Mean Supplemental Security Income (dollars)
7,289 +/-880 (X) (X)
With cash public assistance income 417 +/-126 1.8% +/-0.5 Mean cash public assistance income (dollars)
2,454 +/-708 (X) (X)
With Food Stamp/SNAP benefits in the past 12 months
2,381 +/-321 10.3% +/-1.3
Families 16,565 +/-536 16,565 (X) Less than $10,000 696 +/-251 4.2% +/-1.5 $10,000 to $14,999 625 +/-161 3.8% +/-1.0 $15,000 to $24,999 1,745 +/-274 10.5% +/-1.6 $25,000 to $34,999 2,160 +/-334 13.0% +/-2.0 $35,000 to $49,999 2,817 +/-354 17.0% +/-2.0 $50,000 to $74,999 3,711 +/-383 22.4% +/-2.2 $75,000 to $99,999 2,069 +/-285 12.5% +/-1.7 $100,000 to $149,999 1,842 +/-261 11.1% +/-1.5 $150,000 to $199,999 453 +/-140 2.7% +/-0.8 $200,000 or more 447 +/-163 2.7% +/-1.0 Median family income (dollars) 51,820 +/-3,523 (X) (X) Mean family income (dollars) 69,424 +/-4,773 (X) (X) Per capita income (dollars) 25,043 +/-1,449 (X) (X) Nonfamily households 6,499 +/-467 6,499 (X) Median nonfamily income (dollars) 22,834 +/-2,561 (X) (X) Mean nonfamily income (dollars) 33,370 +/-4,640 (X) (X)

County Snapshot | 20
Median earnings for workers (dollars) 25,452 +/-954 (X) (X) Median earnings for male full-time, year-round workers (dollars)
39,539 +/-2,402 (X) (X)
Median earnings for female full-time, year-round workers (dollars)
29,119 +/-1,767 (X) (X)
PERCENTAGE OF FAMILIES AND PEOPLE WHOSE INCOME IN THE PAST 12 MONTHS IS BELOW THE POVERTY LEVEL
All families (X) (X) 9.4% +/-1.6 With related children under 18 years (X) (X) 15.6% +/-3.2 With related children under 5 years only
(X) (X) 15.5% +/-7.9
Married couple families (X) (X) 6.2% +/-1.3 With related children under 18 years (X) (X) 9.9% +/-2.6 With related children under 5 years only
(X) (X) 7.7% +/-6.3
Families with female householder, no husband present
(X) (X) 26.0% +/-6.2
With related children under 18 years (X) (X) 36.7% +/-10.3 With related children under 5 years only
(X) (X) 51.9% +/-25.4
All people (X) (X) 13.6% +/-1.5 Under 18 years (X) (X) 17.2% +/-3.6 Related children under 18 years (X) (X) 16.7% +/-3.6 Related children under 5 years (X) (X) 19.3% +/-5.7 Related children 5 to 17 years (X) (X) 15.8% +/-3.9 18 years and over (X) (X) 12.8% +/-1.3 18 to 64 years (X) (X) 13.8% +/-1.6 65 years and over (X) (X) 9.1% +/-2.0 People in families (X) (X) 10.2% +/-1.8 Unrelated individuals 15 years and over (X) (X) 31.2% +/-3.5
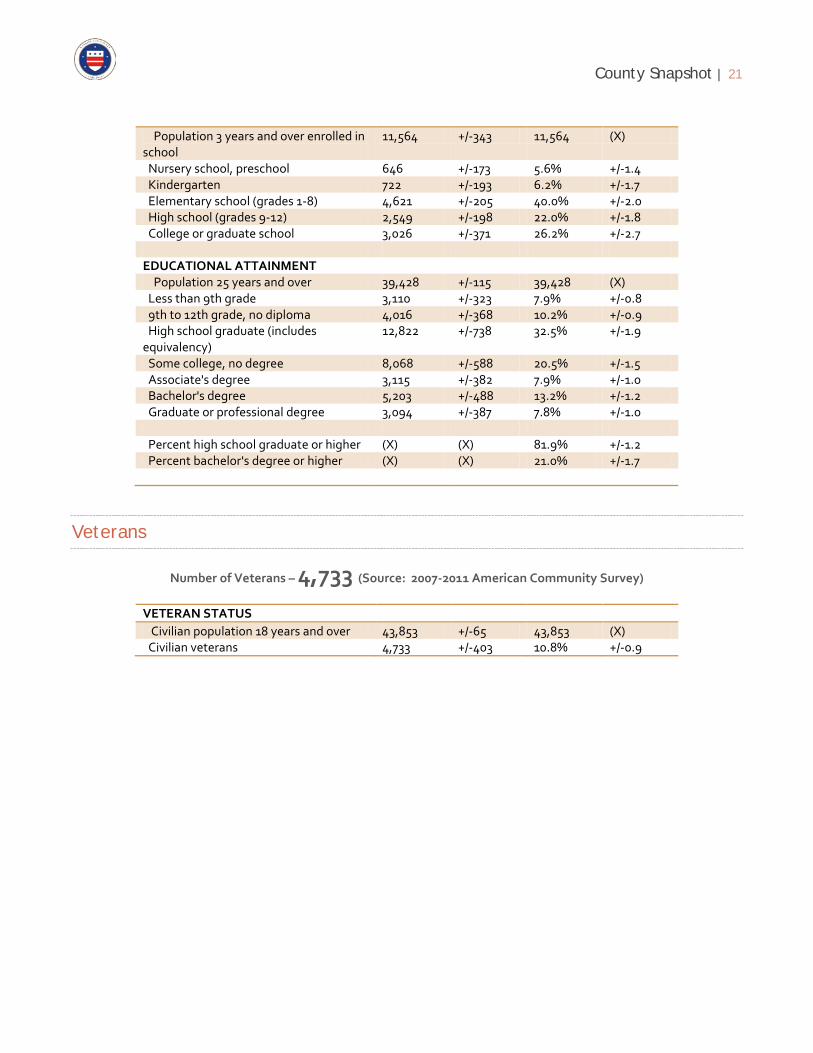
Education
Percent high school graduate or higher – 81.9% (Source: 2007-2011 American Community Survey)
Percent bachelor’s degree or higher – 21.0% (Source: 2007-2011 American Community Survey)
SCHOOL ENROLLMENT
County Snapshot | 21
Population 3 years and over enrolled in school
11,564 +/-343 11,564 (X)
Nursery school, preschool 646 +/-173 5.6% +/-1.4 Kindergarten 722 +/-193 6.2% +/-1.7 Elementary school (grades 1-8) 4,621 +/-205 40.0% +/-2.0 High school (grades 9-12) 2,549 +/-198 22.0% +/-1.8 College or graduate school 3,026 +/-371 26.2% +/-2.7 EDUCATIONAL ATTAINMENT Population 25 years and over 39,428 +/-115 39,428 (X) Less than 9th grade 3,110 +/-323 7.9% +/-0.8 9th to 12th grade, no diploma 4,016 +/-368 10.2% +/-0.9 High school graduate (includes equivalency)
12,822 +/-738 32.5% +/-1.9
Some college, no degree 8,068 +/-588 20.5% +/-1.5 Associate's degree 3,115 +/-382 7.9% +/-1.0 Bachelor's degree 5,203 +/-488 13.2% +/-1.2 Graduate or professional degree 3,094 +/-387 7.8% +/-1.0 Percent high school graduate or higher (X) (X) 81.9% +/-1.2 Percent bachelor's degree or higher (X) (X) 21.0% +/-1.7
Veterans
Number of Veterans – 4,733 (Source: 2007-2011 American Community Survey)
VETERAN STATUS Civilian population 18 years and over 43,853 +/-65 43,853 (X) Civilian veterans 4,733 +/-403 10.8% +/-0.9

County Snapshot | 22
Economic Development As the County prepares its comprehensive plan, community members will be asked to consider a range of questions - “What businesses support our community and do they meet our needs? What generates our material well-being and the well-being of our neighbors? How do our production and consumption patterns impact our infrastructure and environmental resources? What kind of jobs can we expect in the future? How will future businesses impact our infrastructure and environmental resources?”
Economic Characteristics
Number of Companies – 4,934 (Source: 2007 Survey of Business Owners)
Estimate Margin of Error
Percent Percent Margin of Error
EMPLOYMENT STATUS Population 16 years and over 45,117 +/-156 45,117 (X) In labor force 26,256 +/-690 58.2% +/-1.5 Civilian labor force 26,229 +/-689 58.1% +/-1.5 Employed 24,627 +/-712 54.6% +/-1.6 Unemployed 1,602 +/-326 3.6% +/-0.7 Armed Forces 27 +/-24 0.1% +/-0.1 Not in labor force 18,861 +/-679 41.8% +/-1.5 Civilian labor force 26,229 +/-689 26,229 (X) Percent Unemployed (X) (X) 6.1% +/-1.2 Females 16 years and over 23,146 +/-194 23,146 (X) In labor force 11,831 +/-482 51.1% +/-2.1 Civilian labor force 11,825 +/-482 51.1% +/-2.1 Employed 11,182 +/-453 48.3% +/-1.9 Own children under 6 years 3,239 +/-174 3,239 (X) All parents in family in labor force 1,992 +/-242 61.5% +/-6.4 Own children 6 to 17 years 6,786 +/-191 6,786 (X) All parents in family in labor force 4,419 +/-322 65.1% +/-4.7 COMMUTING TO WORK Workers 16 years and over 23,988 +/-699 23,988 (X) Car, truck, or van -- drove alone 20,208 +/-660 84.2% +/-1.7 Car, truck, or van -- carpooled 2,435 +/-397 10.2% +/-1.6 Public transportation (excluding taxicab) 64 +/-50 0.3% +/-0.2 Walked 426 +/-159 1.8% +/-0.6 Other means 85 +/-51 0.4% +/-0.2 Worked at home 770 +/-186 3.2% +/-0.8

County Snapshot | 23
Mean travel time to work (minutes) 22.9 +/-0.9 (X) (X) OCCUPATION Civilian employed population 16 years and over
24,627 +/-712 24,627 (X)
Management, business, science, and arts occupations
7,857 +/-624 31.9% +/-2.3
Service occupations 3,799 +/-413 15.4% +/-1.7 Sales and office occupations 6,282 +/-539 25.5% +/-2.0 Natural resources, construction, and maintenance occupations
2,638 +/-315 10.7% +/-1.3
Production, transportation, and material moving occupations
4,051 +/-460 16.4% +/-1.8
INDUSTRY Civilian employed population 16 years and over
24,627 +/-712 24,627 (X)
Agriculture, forestry, fishing and hunting, and mining
582 +/-147 2.4% +/-0.6
Construction 1,909 +/-310 7.8% +/-1.2 Manufacturing 3,488 +/-399 14.2% +/-1.6 Wholesale trade 750 +/-225 3.0% +/-0.9 Retail trade 3,501 +/-382 14.2% +/-1.4 Transportation and warehousing, and utilities
1,097 +/-242 4.5% +/-1.0
Information 371 +/-121 1.5% +/-0.5 Finance and insurance, and real estate and rental and leasing
1,017 +/-227 4.1% +/-0.9
Professional, scientific, and management, and administrative and waste management services
1,635 +/-299 6.6% +/-1.2
Educational services, and health care and social assistance
5,947 +/-467 24.1% +/-1.8
Arts, entertainment, and recreation, and accommodation and food services
1,767 +/-299 7.2% +/-1.2
Other services, except public administration
1,379 +/-288 5.6% +/-1.1
Public administration 1,184 +/-215 4.8% +/-0.9 CLASS OF WORKER Civilian employed population 16 years and over
24,627 +/-712 24,627 (X)
Private wage and salary workers 19,038 +/-690 77.3% +/-1.7 Government workers 4,042 +/-429 16.4% +/-1.7 Self-employed in own not incorporated business workers
1,520 +/-257 6.2% +/-1.0
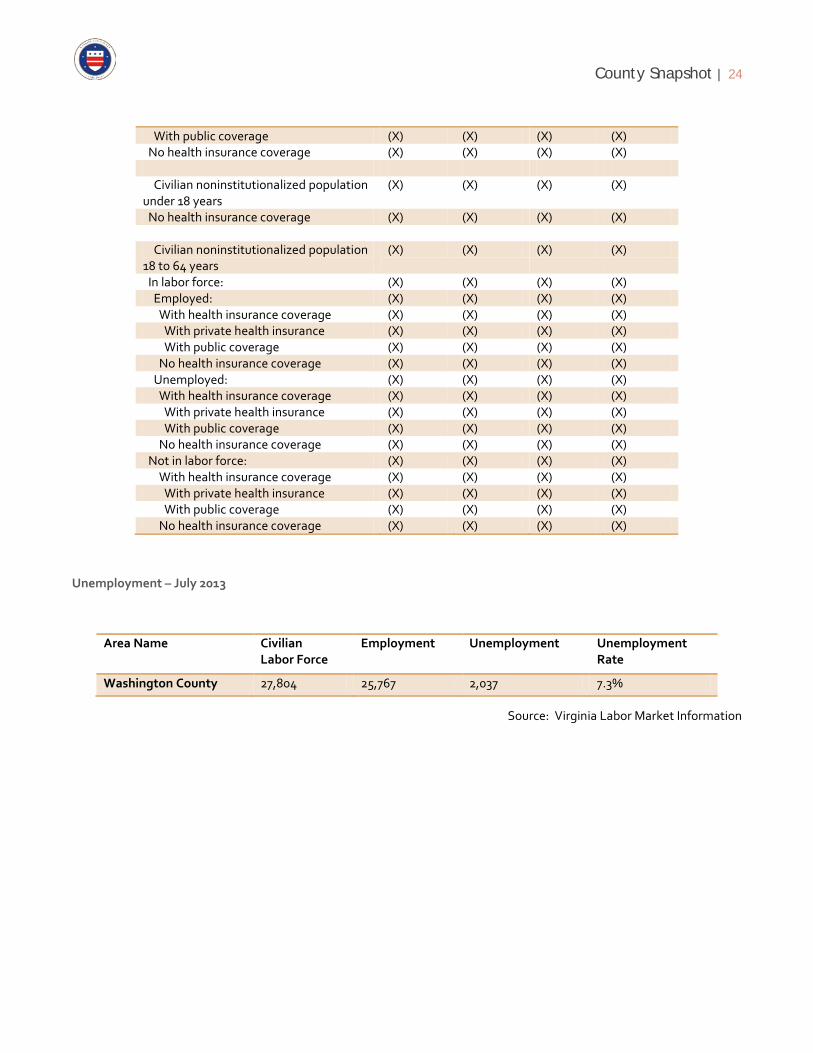
Unpaid family workers 27 +/-23 0.1% +/-0.1 HEALTH INSURANCE COVERAGE Civilian noninstitutionalized population (X) (X) (X) (X) With health insurance coverage (X) (X) (X) (X) With private health insurance (X) (X) (X) (X)
County Snapshot | 24
With public coverage (X) (X) (X) (X) No health insurance coverage (X) (X) (X) (X) Civilian noninstitutionalized population under 18 years
(X) (X) (X) (X)
No health insurance coverage (X) (X) (X) (X) Civilian noninstitutionalized population 18 to 64 years
(X) (X) (X) (X)
In labor force: (X) (X) (X) (X) Employed: (X) (X) (X) (X) With health insurance coverage (X) (X) (X) (X) With private health insurance (X) (X) (X) (X) With public coverage (X) (X) (X) (X) No health insurance coverage (X) (X) (X) (X) Unemployed: (X) (X) (X) (X) With health insurance coverage (X) (X) (X) (X) With private health insurance (X) (X) (X) (X) With public coverage (X) (X) (X) (X) No health insurance coverage (X) (X) (X) (X) Not in labor force: (X) (X) (X) (X) With health insurance coverage (X) (X) (X) (X) With private health insurance (X) (X) (X) (X) With public coverage (X) (X) (X) (X) No health insurance coverage (X) (X) (X) (X)
Unemployment – July 2013
Area Name Civilian Labor Force
Employment Unemployment Unemployment Rate
Washington County 27,804 25,767 2,037 7.3%
Source: Virginia Labor Market Information

County Snapshot | 25
2007 Economic Census
Meaning of 2007 NAICS code
Meaning of Type
of operation or tax status code
Year # of employe
r est.
Employer value of sales, shipmen
ts, receipts
, revenue
, or business
done ($1,000)
Annual payroll
($1,000)
Number of
paid employees
for pay period includi
ng March
12
Number of
nonemployer est.’s
Nonemployer
value of sales,
shipments,
receipts, revenue,
or business
done ($1,000)
Manufacturing Total 2007 74 1,359,544
171,420 4,862 51 1,191
Wholesale trade Merchant wholesalers,
except manufacture
rs' sales branches
and offices
2007 43 279,623 20,724 417 N N
Retail trade Total 2007 230 701,610 58,990 2,940 372 13,955 Information Total 2007 9 N D b 20 481
Real estate and rental and leasing
Total 2007 48 15,434 3,139 131 322 19,472
Professional, scientific, and technical services
All establishme
nts
2007 110 49,583 24,662 742 332 9,807
Professional, scientific, and technical services
Establishments subject to federal
income tax
2007 110 49,583 24,662 742 N N
Administrative and support and waste management and
remediation services
Total 2007 42 D D e 330 5,769
Educational services All establishme
nts
2007 5 D D a 56 500
Educational services Establishments subject to federal
income tax
2007 3 D D a N N
Educational services Establishments exempt
from federal
2007 2 D D a N N

County Snapshot | 26
income tax Health care and social
assistance All
establishments
2007 143 197,740 76,091 2,092 225 9,081
Health care and social assistance
Establishments subject to federal
income tax
2007 112 D D g N N
Health care and social assistance
Establishments exempt
from federal income tax
2007 31 D D g N N
Arts, entertainment, and recreation
All establishme
nts
2007 20 D D e 124 2,074
Arts, entertainment, and recreation
Establishments subject to federal
income tax
2007 16 D D c N N
Arts, entertainment, and recreation
Establishments exempt
from federal income tax
2007 4 D D c N N
Accommodation and food services
Total 2007 91 59,216 16,720 1,505 51 1,254
Other services (except public administration)
All establishme
nts
2007 73 22,084 7,606 357 636 28,330
Other services (except public administration)
Establishments subject to federal
income tax
2007 60 D D e N N
Other services (except public administration)
Establishments exempt
from federal income tax
2007 13 D D b N N

County Snapshot | 27
Natural and Cultural Resources
Natural Resources The natural environment places certain opportunities and constraints on the way land is used. Soil conditions, slopes, flood frequency and wetlands all affect where development can safely and feasibly occur. These and other environmentally sensitive characteristics should be given consideration in the planning process. Data related to the natural characteristics of Washington County are examined in the following section.
SOILS
Washington County was included in the “Soil Survey of Washington County Area and the City of Bristol, Virginia,” a publication of the National Cooperative Soil Survey, a joint effort of the United States Department of Agriculture and other Federal and State agencies, including the Agricultural Experiment Stations and local agencies. The majority of the fieldwork for the study was completed in 1992.
Full copies of the report may be obtained through the Holston River Soil and Water Conservation District or at http://solidatamart.nrcs.usda.gov.
The majority of Washington County land (95%) lies in the Valley and Ridge physiographic province of Virginia. The Whitetop Mountain area (approximately 5%) in the extreme southeastern corner of the County lies in the Blue Ridge physiographic province. The County is underlain by sedimentary rocks consisting of limestone, shale, and sandstone. Limestone is the dominant rock underlying the valley and sandstone and shale form the ridges. Detailed soil maps and descriptions are contained within the “Soil Survey of Washington County Area and City of Bristol, Virginia,” report. The report provides a description of soil properties and qualities, their location and a discussion of their suitability, limitations, and use and management considerations.
Soil information contained within the soil survey is essential to the comprehensive plan to inform land use decisions and identify special practices needed to ensure proper performance. Differences in soil properties can occur within short distances and can determine usability of the land. Some soils are seasonally wet and subject to flooding, others are poorly suited to use for septic tank absorption fields.
WATER SUPPLY
Public water, supplied by the Washington County Service Authority, is sourced from the Middle Fork of the Holston River, two large springs (located in the Mill Creek and Taylor’s Valley communities) and from a well in Mendota.
WATERSHED
A watershed is simply the area of land that drains into a particular body of water. Bodies of water used to define a watershed may be a creek, pond or river. Virginia has defined 14 major watersheds and the entirety of Washington County lies within one of these 14, the Holston River Watershed. The three forks of the Holston River, North Middle and South, serve as drainage for the County and reach their confluence near Kingsport, Tennessee. Watershed consideration is important during the comprehensive planning process to maintain and improve water quality and ensure that future generations have adequate water supplies.

County Snapshot | 28
WETLANDS
The physical, chemical, and biological properties of the Commonwealth’s wetlands work in concert to perform “wetland functions.” Wetland functions may include: storage of water, ground water recharge, sediment trapping, transformation of nutrients, and wildlife habitat. Wetlands are some of the most productive habitats on earth, providing nursery grounds for shellfish, fish and other vertebrate wildlife.
The benefits society derives from wetlands functions are often referred to as wetland values. Some widely applicable wetland values include: flood attenuation, water purification, and wildlife habitat. When wetlands store water along a larger water body, they often serve to attenuate periodic flood waters. The process of storing water also slows water to trap sediment and pollutants caused by over land or upstream water flow. As wildlife habitat, wetlands provide hunting and fishing opportunities. The Commonwealth has five physiographic regions each with specific elevation, geologic, and hydrologic influences. Washington County is located in the Valley and Ridge region where most wetland forests or marshes are associated with streams.
Virginia’s landscape also is commonly categorized by seven ecoregions. According to the U.S. EPA, “Ecoregions reflect areas of general similarity in ecosystems and in the type, quality, and quantity of environmental resources, they are designed to serve as a spatial framework for the research, assessment, management, and monitoring of ecosystems and ecosystem components” (Woods et al. 2003). The seven ecoregions in Virginia include: Piedmont, Middle Atlantic Coastal Plan, Northern Piedmont, Southeastern Plains, Blue Ridge, Ridge and Valley, and Central Appalachian. Washington County is located in the Ridge and Valley ecoregion. Each ecoregion contains a characteristic, geographically distinct assemblage of natural communities and species. The biodiversity of flora, fauna, and ecosystems that characterize an ecoregion tend to be distinct from that of other ecoregions.
Source: Virginia Department of Environmental Quality
NATIONAL AND STATE FORESTS
Jefferson National Forest -
The George Washington National Forest in west central Virginia and the Jefferson National Forest in southwest Virginia were administratively combined in 1995 to form the George Washington and Jefferson National Forests. The two national forests contain nearly 1.8 million acres; one of the largest blocks of public land in the eastern United States. The forests include 1,664,110 acres in Virginia, 123,629 acres in West Virginia, and 961 acres in Kentucky. The forest headquarters is the Forest Supervisor’s Office in Roanoke, Virginia. The forests include the Mount Rogers National Recreation Area and seven Ranger Districts.
The forests are primarily Appalachian hardwood and mixed pine-hardwood forest types located within the Blue Ridge, Central Ridge and Valley, Allegheny, and Cumberland Plateau provinces. The forests are home to:
• 40 species of trees • 2,000 species of shrubs and herbaceous plants • 78 species of amphibians and reptiles • 200 species of birds • 60 species of mammals • 2,340 miles of perennial streams • 100 species of freshwater fishes and mussels • 53 federally-listed Threatened or Endangered animal and plant species.

County Snapshot | 29
The forests are managed for multiple uses and provide many products and benefits. Developed recreation opportunities are offered at over 200 sites on the forests (including campgrounds, picnic areas and boat launches), along with nearly 2,200 miles of trails, and 1,700 miles of open roads. Elevations range from 5,729 feet at Mount Rogers to 515 feet along the South Fork of the Shenandoah River. Highlights include:
• 325 miles of the Appalachian National Scenic Trail, • 12 National Recreation Trails totaling 143 miles, • the 140,000 acre Mount Rogers National Recreation Area, • 3 National Scenic Areas, • 3 National Forest Scenic Byways, • nearly 3 million annual recreation visits, • 23 Wildernesses, • 700,000 acres of lands actively managed for the production of timber and wood products, • Over 1 million acres classified as generally remote areas where a variety of activities may occur.
Mount Rogers National Recreation Area
Located in southwest Virginia, the Mount Rogers National Recreation Area (NRA) manages approximately 200,000 acres of National Forest land near Mount Rogers. The area features four Congressionally designated wilderness areas; the Virginia Creeper Trail; the Mount Rogers Scenic Byway which traverses over 50 miles offering views of the National Recreation Area and open rural countryside; the 5000 acre Crest Zone featuring elevations over 4,000 feet, large rock formations, and a mixture of mountain balds and spruce-fir forests; a herd of wild, free-ranging ponies; and the highest elevated road in the state of Virginia leading to the summit of Whitetop Mountain.
Many activities are available in the area including camping, picnicking, sight-seeing, bird watching, trout fishing, hunting, hiking, bicycling, horseback riding, cross-country skiing, and swimming. The U.S. Forest Service has 3 rental cabins and 11 campgrounds in the Mount Rogers NRA, four of which are set up for horseback riders. There are over 500 miles of trails in the area, including 60 miles of the Appalachian Trail, 18 miles of the Virginia Creeper Trail, and 67 miles of the Virginia Highland Horse Trail. Over one million visitors come to Mount Rogers every year.
The Mount Rogers NRA was officially established and designated a National Recreational Area by the Secretary of Agriculture in 1966.
Source: USDA Forest Service Website
Historic and Cultural Resources
A Brief History of Washington County, Virginia
Washington County was named for General George Washington before he was elected President. A history of Washington County, Virginia might include all the territory originally encompassed in Augusta County, formed by the Virginia House of Burgesses in 1738; Botetourt County in 1770; Fincastle County in 1772; and Washington County established on December 7, 1776. Each of the subsequent counties split from the Washington County of 1776: Russell County in 1786, Lee County in 1793, Tazewell County in 1800, Scott County in 1814, Smyth County in 1832, Wise County in 1836, Buchanan County in 1858, Dickenson County in 1880. Each has a history of its own. With a few exceptions, this article will be concerned with the current boundaries of Washington County, Virginia.

County Snapshot | 30
PRE-1777
The Great Valley of Virginia was a 'superhighway' for various tribes of original inhabitants of what is now known as the United States of America. Relics, such as arrowheads and tomahawk stones that attest to the presence of American Indians and continue to be found in local plowed fields. Scotch-Irish and German Settlers who traveled from Pennsylvania down what was called the Great Indian Trail encounter those people and the buffalo, which grazed along the way.
THE AMERICAN REVOLUTION
In the fall of 1780, four hundred men from Washington County were mustered to travel under the command of Colonel William Campbell to overcome the British troops under the command of Patrick Ferguson. North Carolina and Tennessee militia from various counties joined with the Virginians to pursue the British and engage them at King's Mountain, South Carolina. The "Overmountain Men" were ordered to yell like Indians during this attack. The confusion that resulted from the yelling and exceptional marksmanship as well as other tactics helped cause the death of Ferguson and the defeat of his troops October 7, 1780.
RAILROADS
Starting in the mid-1800's railroads carried passengers and materials through and from Washington County. Communities along the main route from Washington Springs to Goodson (now Bristol) included Glade Spring, Emory, Meadowview, Wolf Hills (now Abingdon), Fractionsville, Wyndale and Wallace. One line went from Glade Spring to Saltville by way of Litz, Keywood and Clinchburg; another line extended from Bristol to Mendota; another headed southeast from Abingdon to West Jefferson, North Carolina by way of Watauga, Barron (now Alvarado), Delmar, Drowning Ford Station, Hellena, Damascus, Laureldale, Taylors Valley, Creek Junction, Cant Work and Green Cove. For a period of time passengers arriving on a Virginia line at Bristol, Virginia had to disembark and walk a short distance to climb aboard a Tennessee train on a Tennessee line if they wanted to continue south. Roads suitable for automobiles have replaced the lines from Damascus to Laurel Bloomery, Tennessee and from Damascus to Shady Valley, Tennessee. The Virginia Creeper Trail is a linear park that has replaced the Norfolk & Western rails and crosses from Abingdon to the North Carolina line.
TOPOGRAPHY
A major part of Washington County is in the Great Valley region of Virginia, where Abingdon, the County Seat, was established. To the north are the North Fork of the Holston River and the Clinch mountain range; to the south and east are River Knobs, the junction of the Middle Fork and the South Fork of the Holston River, and the mountain ranges known as the Holston and the Virginia Iron. The combination of springs and elevation provided waterpower, harnessed behind small dams for milling grains and for sawing lumber from the abundant stands of trees. Water powered electrification with direct current brought light and heat to some homes early in the 20th Century. Grayson, Smyth, and Washington Counties join at the top of the second highest mountain (5,520 feet) in Virginia formerly known as "Meadow", because of its prominent bald field. Winter snows in that open field have caused the change of its name to White Top Mountain.
THE NOTCH
The southern boundary line of Virginia was assigned to parallel 36º 30’. In 1749 when Peter Jefferson, father of Thomas Jefferson, surveyed from about where Patrick County is today, he kept moving farther north away from the assigned parallel till he discontinued his survey east of Damascus. In 1800, the northeast tip of the new state of Tennessee joined Virginia and North Carolina on Pond Mountain. Tennessee continues on that northern parallel in Washington County, until it jogs south but not to 36o30'. Three stories are told about the Notch: (1) the surveyor was inebriated (2) iron deposits in the Iron Mountains interfered with readings of the compass and (3) the strong will of Tennesseans prevailed.
County Snapshot | 31
ABINGDON
In the County Seat, history can be found within the record books of the Washington County Courthouse, in the cemeteries dating before the Revolution, in the homes throughout the historic district, and dedicated markers. One historic house constructed in 1832 was the home of Brigadier General Francis Preston. After General Preston's death the Holston Conference of the Methodist Church acquired the property. On March 15, 1860 classes began in Martha Washington College for women, the first such recognition of Martha Custis, the wife of George Washington. The "War Between the States" interrupted classes while a hospital temporarily occupied the College. After that war classes resumed and continued until 1931. The enlarged campus of four buildings was purchased to change function once more to become Martha Washington Inn.
BRISTOL, VIRGINIA
Even though the General Assembly granted a charter and named the city Bristol on February 12, 1890, the area has a history dating back to 1749, when it was called Sapling Grove. At an elevation of 1672 feet, the northern half of State Street lies in Virginia; the southern half lies in Bristol, Tennessee.
DAMASCUS
Recipients of Revolutionary Land Grants were some of the earliest settlers in the southeastern part of Washington County. Even though Daniel Boone was born in Pennsylvania and moved with his father's family to the Yadkin River in North Carolina, he played an important part in future migrations by other Mocksville, North Carolina residents, who followed the Daniel Boone Trail to Kentucky and beyond. Some were so pleased by the conditions in the valley carved out by the Beaver Dam Creek and the Laurel Creek that they stayed in what would later be named Damascus.
EMORY
The village of Emory developed around the perimeter of Emory & Henry College for men, founded in 1836. Named for Bishop John Emory of the Methodist Church and Patrick Henry, the famed Virginia patriot and political leader, the college was planned by the Rev. Mr. Creed Fulton and Tobias Smyth, whose log cabin was moved from its original location to the campus, where it can be seen today. In 1861, all the students withdrew to join the army; and the main building became a hospital. In 1922, women were admitted to the college, which continues to be co-educational.
KONNAROCK
The community known as Konnarock lies In the far southeast corner of Washington County. Logging of the virgin timber in the valley and up the sides of White Top Mountain by the Hassinger Lumber Company from 1906 to Christmas Eve, 1928 provided a boom economy in the form of new homes, company buildings and sawmills, and a railroad spur to an existing line. After all the large timber was gone, the town reverted to being a remote village of people who love to live at the north base of White Top Mountain.
MENDOTA
The community in the northwest corner of Washington County took the name given the area by native people, because the name means "bend in the river." For the five eastern tribes who fished the river and hunted the woods, Mendota was an excellent place to meet. High on the cliffs, there are overlooks for viewing the river in both directions. When settlers moved in they found that the soil in this valley was rich for farming.
SALTVILLE

County Snapshot | 32
Part of a sea was captured in the valley near the northeast corner where Washington County borders Smyth County. This salty lake attracted birds and animals, then hunters of various tribes, then a surveyor Charles Campbell who was granted 330 acres including the remaining lake and swamp by King George II in 1748. Settlers and soldiers traveled to "The Lick" to purchase salt, the product of crystallization during boiling of the salty water. When spring rains and melting snows raised the level of the North Fork of the Holston River, flat bottom boats were used to carry salt to Chattanooga and beyond. From 1893 chemical factories provided jobs, while sadly polluting the rivers. Discovery of Wooly Mammoth remains has led to further paleontological digs and the Museum of the Middle Appalachians.
Source: Washington County website
The County possesses historic resources from different periods of significance. 13 sites are listed on the National Register of Historic Places. These include
• Abingdon Bank • Abingdon Historic District • Baker-St. John House • Brook Hall • Crabtree-Blackwell Farm • Edmondson Hall • Emory and Henry College • The Grove • Mont Calm • Moonlite Theatre • Dr. William H. House • Walnut Grove • White’s Mill
In addition to those listed on the National Register of Historic Places, historic homes, commercial buildings, mills, railroad resources, churches and cemeteries are scattered throughout the County.
The Abingdon Historic District is currently the only area in the County protected under a local historic preservation ordinance by the Town of Abingdon. At present, the Washington County Historical Society and individual, private citizens carry out historic preservation activities.
These nonrenewable resources yield unique information about our past and although many have been discovered, there are forgotten, undiscovered and unprotected cultural resources throughout the County.
County Snapshot | 33
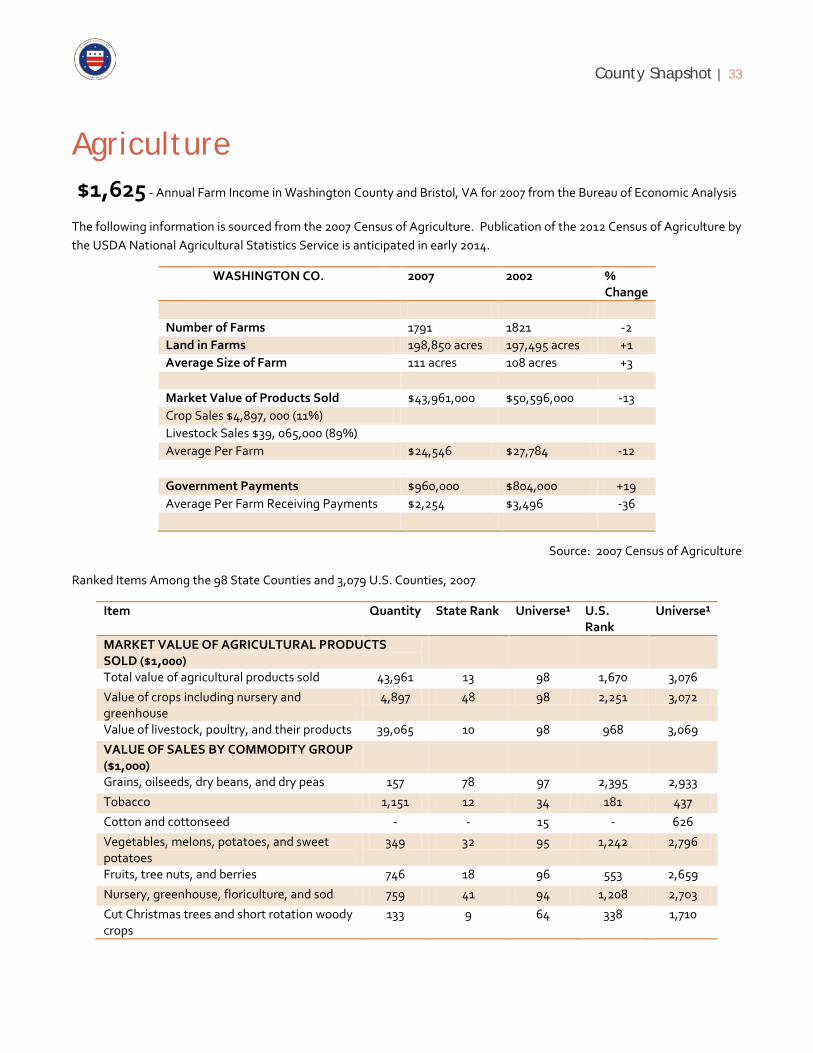
Agriculture $1,625 - Annual Farm Income in Washington County and Bristol, VA for 2007 from the Bureau of Economic Analysis
The following information is sourced from the 2007 Census of Agriculture. Publication of the 2012 Census of Agriculture by the USDA National Agricultural Statistics Service is anticipated in early 2014.
WASHINGTON CO. 2007 2002 % Change
Number of Farms 1791 1821 -2 Land in Farms 198,850 acres 197,495 acres +1 Average Size of Farm 111 acres 108 acres +3 Market Value of Products Sold $43,961,000 $50,596,000 -13 Crop Sales $4,897, 000 (11%) Livestock Sales $39, 065,000 (89%) Average Per Farm $24,546 $27,784 -12 Government Payments $960,000 $804,000 +19 Average Per Farm Receiving Payments $2,254 $3,496 -36
Source: 2007 Census of Agriculture
Ranked Items Among the 98 State Counties and 3,079 U.S. Counties, 2007
Item Quantity State Rank Universe¹ U.S. Rank
Universe¹
MARKET VALUE OF AGRICULTURAL PRODUCTS SOLD ($1,000)
Total value of agricultural products sold 43,961 13 98 1,670 3,076
Value of crops including nursery and greenhouse
4,897 48 98 2,251 3,072
Value of livestock, poultry, and their products 39,065 10 98 968 3,069
VALUE OF SALES BY COMMODITY GROUP ($1,000)
Grains, oilseeds, dry beans, and dry peas 157 78 97 2,395 2,933
Tobacco 1,151 12 34 181 437
Cotton and cottonseed - - 15 - 626
Vegetables, melons, potatoes, and sweet potatoes
349 32 95 1,242 2,796
Fruits, tree nuts, and berries 746 18 96 553 2,659
Nursery, greenhouse, floriculture, and sod 759 41 94 1,208 2,703
Cut Christmas trees and short rotation woody crops
133 9 64 338 1,710

County Snapshot | 34
Other crops and hay 1,602 11 98 1,064 3,054
Poultry and eggs (D) 22 96 (D) 3,020
Cattle and calves 28,768 3 96 445 3,054
Milk and other dairy products from cows 7,773 7 78 574 2,493
Hogs and pigs 39 34 86 1,684 2,922
Sheep, goats, and their products (D) 3 95 (D) 2,998
Horses, ponies, mules, burros, and donkeys 443 16 94 545 3,024
Aquaculture (D) (D) 44 (D) 1,498
Other animals and other animal products 6 61 94 2,220 2,875
TOP CROP ITEMS (acres)
Forage - land used for all hay and haylage, grass silage, and greenchop
40,250 6 98 449 3,060
Corn for silage 2,393 12 81 569 2,263
Corn for grain 440 72 94 2,077 2,634
Tobacco 388 10 34 170 437
Soybeans for beans (D) 67 77 (D) 2,039
TOP LIVESTOCK INVENTORY ITEMS (number)
Layers (D) 2 97 (D) 3,024
Cattle and calves 66,021 3 97 339 3,060
Sheep and lambs 7,649 1 94 138 2,891
Goats, all 3,773 1 97 102 3,023
Horses and ponies 2,866 5 97 291 3,066 See "Census of Agriculture, Volume 1, Geographic Area Series" for complete footnotes, explanations, definitions, and methodology. (D) Cannot be disclosed. (Z) Less than half of the unit shown. 1 -Universe is number of counties in state or U.S. with item. Data were collected for a maximum of three operators per farm.
Economic Characteristics Quantity
Farms by value of sales: 572
Less than $1,000 236
$1,000 to $2,499 248
$2,500 to $4,999 250
$5,000 to $9,999 181
$10,000 to $19,999 46
$20,000 to $24,999 87
$25,000 to $39,999 26
$40,000 to $49,999 78
$50,000 to $99,999 30
$100,000 to $249,999 20

County Snapshot | 35
$250,000 to $499,999 17
$500,000 or more 43,167
Total farm production expenses ($1,000) 24,102
Average per farm ($) 4,133
Net cash farm income of operation ($1,000) 2,308
Average per farm ($)
Operator Characteristics Quantity
Principal operators by primary occupation: Farming 679 Other 1,112 Principal operators by sex: Male 1,542 Female 249 Average age of principal operator (years) 58.5 All operators by race 9 American Indian or Alaska Native - Asian - Black or African American - Native Hawaiian or Other Pacific Islander 1 White 2,547 More than one race 34 All operators of Spanish, Hispanic, or Latino Origin
19
Source: 2007 Census of Agriculture

County Snapshot | 36
Housing
Total Housing Units: 25,601 (Source: U.S. Census Bureau 2010 Demographic Profile)
Households By Type
Subject Washington County, Virginia Estimate Margin of
Error Percent Percent
Margin of Error
HOUSEHOLDS BY TYPE Total households 23,064 +/-461 23,064 (X) Family households (families) 16,565 +/-536 71.8% +/-1.9 With own children under 18 years 6,174 +/-403 26.8% +/-1.6 Married-couple family 12,837 +/-497 55.7% +/-2.1 With own children under 18 years 4,353 +/-377 18.9% +/-1.6 Male householder, no wife present, family
1,074 +/-243 4.7% +/-1.0
With own children under 18 years 587 +/-180 2.5% +/-0.8 Female householder, no husband present, family
2,654 +/-365 11.5% +/-1.5
With own children under 18 years 1,234 +/-282 5.4% +/-1.2 Nonfamily households 6,499 +/-467 28.2% +/-1.9 Householder living alone 5,446 +/-406 23.6% +/-1.7 65 years and over 2,131 +/-242 9.2% +/-1.0 Households with one or more people under 18 years
7,011 +/-442 30.4% +/-1.8
Households with one or more people 65 years and over
6,829 +/-241 29.6% +/-1.0
Average household size 2.30 +/-0.04 (X) (X) Average family size 2.69 +/-0.07 (X) (X)
SOURCE: U.S. Census, 2007-2011 American Community Survey
Housing Occupancy
HOUSING OCCUPANCY Total housing units 25,601 100.0 Occupied housing units 22,843 89.2 Vacant housing units 2,758 10.8 For rent 577 2.3

County Snapshot | 37
Rented, not occupied 29 0.1 For sale only 275 1.1 Sold, not occupied 111 0.4 For seasonal, recreational, or occasional use
691 2.7
All other vacants 1,075 4.2 Homeowner vacancy rate (percent) [8] 1.6 ( X ) Rental vacancy rate (percent) [9] 9.0 ( X )
SOURCE: U.S. Census, 2007-2011 American Community Survey
Housing Tenure
HOUSING TENURE Occupied housing units 22,843 100.0 Owner-occupied housing units 17,032 74.6 Population in owner-occupied housing units
40,755 ( X )
Average household size of owner-occupied units
2.39 ( X )
Renter-occupied housing units 5,811 25.4 Population in renter-occupied housing units
12,494 ( X )
Average household size of renter-occupied units
2.15 ( X )
SOURCE: U.S. Census, 2007-2011 American Community Survey
Housing Characteristics
Subject Washington County, Virginia Estimate Margin of
Error Percent Percent
Margin of Error
HOUSING OCCUPANCY Total housing units 25,480 +/-171 25,480 (X) Occupied housing units 23,064 +/-461 90.5% +/-1.6 Vacant housing units 2,416 +/-400 9.5% +/-1.6 Homeowner vacancy rate 1.6 +/-0.7 (X) (X) Rental vacancy rate 6.1 +/-3.0 (X) (X) UNITS IN STRUCTURE

County Snapshot | 38
Total housing units 25,480 +/-171 25,480 (X) 1-unit, detached 17,656 +/-496 69.3% +/-1.9 1-unit, attached 458 +/-161 1.8% +/-0.6 2 units 618 +/-174 2.4% +/-0.7 3 or 4 units 704 +/-193 2.8% +/-0.8 5 to 9 units 665 +/-194 2.6% +/-0.8 10 to 19 units 512 +/-164 2.0% +/-0.6 20 or more units 344 +/-137 1.4% +/-0.5 Mobile home 4,523 +/-426 17.8% +/-1.7 Boat, RV, van, etc. 0 +/-95 0.0% +/-0.1 YEAR STRUCTURE BUILT Total housing units 25,480 +/-171 25,480 (X) Built 2005 or later 1,199 +/-223 4.7% +/-0.9 Built 2000 to 2004 2,205 +/-234 8.7% +/-0.9 Built 1990 to 1999 4,589 +/-465 18.0% +/-1.8 Built 1980 to 1989 4,649 +/-407 18.2% +/-1.6 Built 1970 to 1979 4,858 +/-375 19.1% +/-1.5 Built 1960 to 1969 2,432 +/-270 9.5% +/-1.1 Built 1950 to 1959 1,908 +/-292 7.5% +/-1.1 Built 1940 to 1949 1,244 +/-230 4.9% +/-0.9 Built 1939 or earlier 2,396 +/-367 9.4% +/-1.4 ROOMS Total housing units 25,480 +/-171 25,480 (X) 1 room 232 +/-116 0.9% +/-0.5 2 rooms 225 +/-97 0.9% +/-0.4 3 rooms 1,029 +/-251 4.0% +/-1.0 4 rooms 4,486 +/-495 17.6% +/-1.9 5 rooms 6,106 +/-518 24.0% +/-2.0 6 rooms 5,385 +/-476 21.1% +/-1.9 7 rooms 3,344 +/-337 13.1% +/-1.3 8 rooms 2,109 +/-237 8.3% +/-0.9 9 rooms or more 2,564 +/-302 10.1% +/-1.2 Median rooms 5.6 +/-0.2 (X) (X) BEDROOMS Total housing units 25,480 +/-171 25,480 (X) No bedroom 245 +/-120 1.0% +/-0.5 1 bedroom 1,259 +/-241 4.9% +/-0.9 2 bedrooms 7,566 +/-455 29.7% +/-1.8 3 bedrooms 11,934 +/-538 46.8% +/-2.1 4 bedrooms 3,720 +/-359 14.6% +/-1.4 5 or more bedrooms 756 +/-176 3.0% +/-0.7 HOUSING TENURE Occupied housing units 23,064 +/-461 23,064 (X) Owner-occupied 17,279 +/-457 74.9% +/-1.6 Renter-occupied 5,785 +/-407 25.1% +/-1.6 Average household size of owner- 2.36 +/-0.06 (X) (X)

County Snapshot | 39
occupied unit Average household size of renter-occupied unit
2.14 +/-0.11 (X) (X)
YEAR HOUSEHOLDER MOVED INTO UNIT
Occupied housing units 23,064 +/-461 23,064 (X) Moved in 2005 or later 7,505 +/-505 32.5% +/-1.9 Moved in 2000 to 2004 4,318 +/-396 18.7% +/-1.7 Moved in 1990 to 1999 5,002 +/-415 21.7% +/-1.7 Moved in 1980 to 1989 3,078 +/-344 13.3% +/-1.5 Moved in 1970 to 1979 1,779 +/-242 7.7% +/-1.1 Moved in 1969 or earlier 1,382 +/-202 6.0% +/-0.9 VEHICLES AVAILABLE Occupied housing units 23,064 +/-461 23,064 (X) No vehicles available 1,191 +/-214 5.2% +/-0.9 1 vehicle available 6,427 +/-533 27.9% +/-2.2 2 vehicles available 9,301 +/-566 40.3% +/-2.3 3 or more vehicles available 6,145 +/-413 26.6% +/-1.8 HOUSE HEATING FUEL Occupied housing units 23,064 +/-461 23,064 (X) Utility gas 1,970 +/-266 8.5% +/-1.1 Bottled, tank, or LP gas 844 +/-221 3.7% +/-0.9 Electricity 17,018 +/-524 73.8% +/-1.9 Fuel oil, kerosene, etc. 1,800 +/-293 7.8% +/-1.3 Coal or coke 57 +/-43 0.2% +/-0.2 Wood 1,287 +/-242 5.6% +/-1.0 Solar energy 0 +/-95 0.0% +/-0.2 Other fuel 30 +/-31 0.1% +/-0.1 No fuel used 58 +/-44 0.3% +/-0.2 SELECTED CHARACTERISTICS Occupied housing units 23,064 +/-461 23,064 (X) Lacking complete plumbing facilities 136 +/-79 0.6% +/-0.3 Lacking complete kitchen facilities 59 +/-52 0.3% +/-0.2 No telephone service available 499 +/-177 2.2% +/-0.8 OCCUPANTS PER ROOM Occupied housing units 23,064 +/-461 23,064 (X) 1.00 or less 22,793 +/-454 98.8% +/-0.5 1.01 to 1.50 240 +/-114 1.0% +/-0.5 1.51 or more 31 +/-34 0.1% +/-0.1 VALUE Owner-occupied units 17,279 +/-457 17,279 (X) Less than $50,000 2,576 +/-329 14.9% +/-1.8 $50,000 to $99,999 3,898 +/-392 22.6% +/-2.3 $100,000 to $149,999 3,213 +/-358 18.6% +/-2.0 $150,000 to $199,999 2,726 +/-327 15.8% +/-1.9
County Snapshot | 40
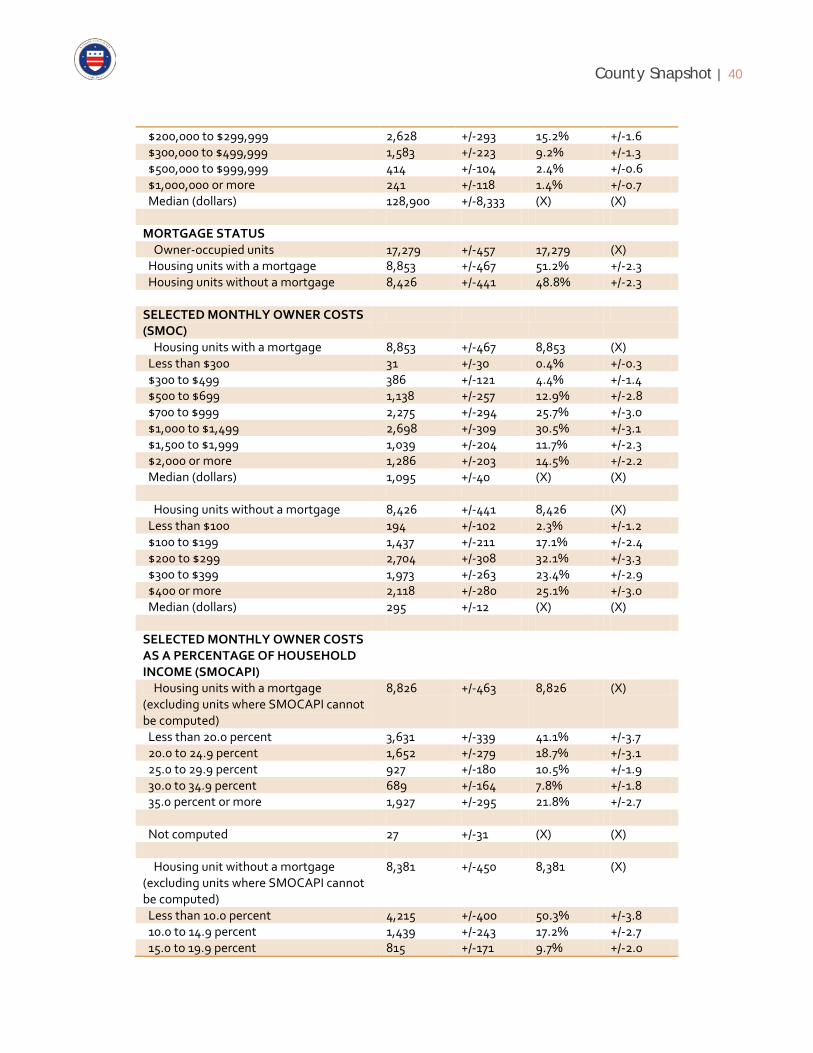
$200,000 to $299,999 2,628 +/-293 15.2% +/-1.6 $300,000 to $499,999 1,583 +/-223 9.2% +/-1.3 $500,000 to $999,999 414 +/-104 2.4% +/-0.6 $1,000,000 or more 241 +/-118 1.4% +/-0.7 Median (dollars) 128,900 +/-8,333 (X) (X) MORTGAGE STATUS Owner-occupied units 17,279 +/-457 17,279 (X) Housing units with a mortgage 8,853 +/-467 51.2% +/-2.3 Housing units without a mortgage 8,426 +/-441 48.8% +/-2.3 SELECTED MONTHLY OWNER COSTS (SMOC)
Housing units with a mortgage 8,853 +/-467 8,853 (X) Less than $300 31 +/-30 0.4% +/-0.3 $300 to $499 386 +/-121 4.4% +/-1.4 $500 to $699 1,138 +/-257 12.9% +/-2.8 $700 to $999 2,275 +/-294 25.7% +/-3.0 $1,000 to $1,499 2,698 +/-309 30.5% +/-3.1 $1,500 to $1,999 1,039 +/-204 11.7% +/-2.3 $2,000 or more 1,286 +/-203 14.5% +/-2.2 Median (dollars) 1,095 +/-40 (X) (X) Housing units without a mortgage 8,426 +/-441 8,426 (X) Less than $100 194 +/-102 2.3% +/-1.2 $100 to $199 1,437 +/-211 17.1% +/-2.4 $200 to $299 2,704 +/-308 32.1% +/-3.3 $300 to $399 1,973 +/-263 23.4% +/-2.9 $400 or more 2,118 +/-280 25.1% +/-3.0 Median (dollars) 295 +/-12 (X) (X) SELECTED MONTHLY OWNER COSTS AS A PERCENTAGE OF HOUSEHOLD INCOME (SMOCAPI)
Housing units with a mortgage (excluding units where SMOCAPI cannot be computed)
8,826 +/-463 8,826 (X)
Less than 20.0 percent 3,631 +/-339 41.1% +/-3.7 20.0 to 24.9 percent 1,652 +/-279 18.7% +/-3.1 25.0 to 29.9 percent 927 +/-180 10.5% +/-1.9 30.0 to 34.9 percent 689 +/-164 7.8% +/-1.8 35.0 percent or more 1,927 +/-295 21.8% +/-2.7 Not computed 27 +/-31 (X) (X) Housing unit without a mortgage (excluding units where SMOCAPI cannot be computed)
8,381 +/-450 8,381 (X)
Less than 10.0 percent 4,215 +/-400 50.3% +/-3.8 10.0 to 14.9 percent 1,439 +/-243 17.2% +/-2.7 15.0 to 19.9 percent 815 +/-171 9.7% +/-2.0

County Snapshot | 41
20.0 to 24.9 percent 491 +/-143 5.9% +/-1.7 25.0 to 29.9 percent 550 +/-172 6.6% +/-2.0 30.0 to 34.9 percent 146 +/-69 1.7% +/-0.8 35.0 percent or more 725 +/-199 8.7% +/-2.3 Not computed 45 +/-32 (X) (X) GROSS RENT Occupied units paying rent 5,010 +/-404 5,010 (X) Less than $200 145 +/-89 2.9% +/-1.8 $200 to $299 231 +/-98 4.6% +/-1.9 $300 to $499 1,114 +/-261 22.2% +/-4.8 $500 to $749 2,120 +/-247 42.3% +/-4.9 $750 to $999 951 +/-231 19.0% +/-4.0 $1,000 to $1,499 311 +/-133 6.2% +/-2.5 $1,500 or more 138 +/-93 2.8% +/-1.9 Median (dollars) 610 +/-23 (X) (X) No rent paid 775 +/-189 (X) (X) GROSS RENT AS A PERCENTAGE OF HOUSEHOLD INCOME (GRAPI)
Occupied units paying rent (excluding units where GRAPI cannot be computed)
4,973 +/-408 4,973 (X)
Less than 15.0 percent 744 +/-229 15.0% +/-4.3 15.0 to 19.9 percent 740 +/-188 14.9% +/-3.6 20.0 to 24.9 percent 830 +/-206 16.7% +/-3.8 25.0 to 29.9 percent 615 +/-171 12.4% +/-3.2 30.0 to 34.9 percent 497 +/-148 10.0% +/-3.0 35.0 percent or more 1,547 +/-268 31.1% +/-4.9 Not computed 812 +/-199 (X) (X) Average family size 2.69 +/-0.07 (X) (X)
SOURCE: U.S. Census, 2007-2011 American Community Survey
County Snapshot | 42
Infrastructure & Community Facilities Schools
Washington County Schools
Elementary
• Abingdon Elementary School • Greendale Elementary School • High Point Elementary School • Meadowview Elementary School • Rhea Valley Elementary School • Valley Institute Elementary School • Watauga Elementary School
Middle
• Damascus Middle School • E.B. Stanley Middle School • Glade Spring Middle School • Wallace Middle School
High School
• Abingdon High School • Holston High School • John S. Battle High School • Patrick Henry High School
Private Schools
• Cornerstone Christian Academy
Colleges
• Emory & Henry College • Virginia Highlands Community College • Southwest Virginia Higher Education Center
Emergency Services
EMS Agencies
• Damascus Rescue Squad • Glade Spring Life Saving Crew

County Snapshot | 43
• Washington County Life Saving Crew • Valley Rescue Squad
Fire Departments
• Abingdon Fire Department • Meadowview Fire Department • Clinch Mountain Fire Department
EMS/Fire Combination Departments
• Damascus Fire Department • Glade Spring Fire Department • Green Spring Fire Department • Brumley Gap Fire Department • Goodson-Kinderhook Fire Department • Washington County Fire Rescue
County Facilities (Parks, Community Buildings)
Parks
• Leo “Muscle” Sholes Memorial Park – 34202 Stagecoach Road, Glade Spring, VA Named after Leo "Muscle" Sholes, a Glade Spring native and noted Appalachian League baseball player of the 1950's, this park offers a public pool, softball and baseball fields, picnic shelters and open space amenities.
• Washington County Park – 19482 County Park Road, Abingdon, VA The Washington County Park Authority owns, operates and maintains this park. The Authority consists of an eight member Board of Directors who are appointed by The Washington County Board of Supervisors for four year terms. The park is located on South Holston Lake and offers camp sites, tent sites, trailer sites with electric and water, sanitation facilities, playground, picnic shelters, boat ramp and fishing.
Community Centers
• Green Cove Community Center, Damascus, VA • Hayter’s Gap Community Center, Saltville, VA • Taylor’s Valley Community Center, Damascus, VA • Mendota Community Center, Mendota, VA
Libraries
• Abingdon (Main Library) • Damascus • Glade Spring
County Snapshot | 44
• Hayters Gap • Mendota
Sewer & Water
WCSA serves approximately 20,500 water and 1,500 wastewater connections. The water system consists of approximately 900 miles of water line, a 4.6-million-gallon-per-day surface water treatment plant, a 2.5-million-gallon-per-day membrane filtration plant, two springs, one well, multiple pump stations and 17 water storage tanks. The wastewater system consists of approximately 65 miles of wastewater collection lines, 24 pump stations and a wastewater treatment plant.
County Snapshot | 45
Transportation The Local Government Comprehensive Plan and Transportation Plan
A comprehensive plan is an official public document adopted by a local government as a policy guide for making decisions about the long-range physical development of the community. It indicates in a general way how the government leaders, based on citizen input, want the community to develop in the future - the quantity, character, location, and rate of growth. The plan is comprehensive in that it encompasses all the functions that make a community work, e.g. land use, transportation, community facilities, economic development, housing, historic and natural resources. The comprehensive plan may include more detailed plans for specific areas of the community, e.g. neighborhoods, “villages”, and sub-areas (a certain highway corridor or portion of the locality). §15.2-2223 of the Code of Virginia requires the planning commission of every locality to prepare a comprehensive plan for consideration by the governing body and for the governing body o f every locality to adopt a comprehensive plan. Localities must review their comprehensive plan and associated transportation plan at least every five years, pursuant to §15.2-2230 of the Code , to determine whether it needs to be updated. The comprehensive plan must include a specific section dedicated to transportation planning or reference a document that serves as the community’s transportation plan. The comprehensive plan, therefore, provides policy guidance and criteria for making both land use and transportation decisions and recommendations
Source: Updated Traffic Impact Analysis Regulations Administrative Guidelines

County Snapshot | 46
VDOT Six Year Improvement Program List
Line Item Search Results (33 line items found) Total Line Item Estimate: $203,124 (K)
UPC Description Route District Road
System Jurisdiction Estimate Previous FY14
FY15-19 Balance
(Values in Thousands of Dollars)
91186
CONSTRUCTION OF TOURSIM CENTER &
BICYCLE/PEDESTRIAN FACILITY EN08 Bristol Enhancement
Washington County $1,252 $1,348 $0 $0 ($97)
50537
TRAILHEAD, RELATED FACILITIES &
RESTORATION HPEN Bristol Enhancement Washington
County $315 $308 $0 $0 $7
97556
ROUTE I-81 NBL - WASHINGTON COUNTY
STR #18928 81 Bristol Interstate Washington
County $4,526 $0 $0 $4,526 $0
97856
INTERSTATE 81 AT EXIT 14 RAMP
MODIFICATIONS 81 Bristol Interstate Washington
County $37,258 $2,600 $1,000 $33,658 $0
81124
GREEN COVE STATION IMPROVEMENTS TO
FOREST SERVICE FACILITY SLEN Bristol Miscellaneous
Washington County $15 $90 $0 $0 ($75)
81125
VIRGINIA CREEPER TRAIL - CONSTRUCT RESTROOM & PARK
EXPANSION SLEN Bristol Miscellaneous Washington
County $850 $931 $0 $0 ($81)
81132 WHITE'S MILL RENOVATION SLEN Bristol Miscellaneous
Washington County $500 $500 $0 $0 $0
76503
4 LANE RAISED MEDIAN W/SHARED USE PATH -
PHASE I & II PE 11 Bristol Primary Washington
County $2,723 $1,723 $1,000 $0 $0
103710
RW ONLY ON PORTION OF RTE. 11 CN PROJ.
UPC 99380; 11 Bristol Primary Washington
County $995 $1,000 $0 $0 ($5)
104671 PAVED SHOULDERS
AND RUMBLE STRIPS 19 Bristol Primary Washington
County $4,360 $0 $0 $4,360 $0
16382
RTE 58 - PARALLEL LN-CORRIDOR DEV PE AND
R/W ONLY IN SYP 58 Bristol Primary Washington
County $45,277 $7,896 $0 $0 $37,381
16383
IMPROVE EXISTING 2-LANE ROADWAY TO A
4-LANE DIVIDED FACILITY 58 Bristol Primary
Washington County $24,068 $21,998 $2,069 $0 $0
95490
ARRA - WASHINGTON 58 WIDENING
(ABINGTON TO DAMASCUS) 58 Bristol Primary
Washington County $23,735 $23,235 $0 $0 $500
90180 RTE 91 OVER N&W
RAILWAY & RTE 609 91 Bristol Primary Washington
County $3,109 $215 $625 $2,268 $0
98457
HRRR-,WIDEN/PAVE SHOULDERS AND ADD
GR 91 Bristol Primary Washington
County $311 $352 $0 $0 ($40)
103503
BRIDGE (FED ID 18969) RTE 91 OVER LAUREL
CREEK 91 Bristol Primary Washington
County $1,602 $375 $0 $1,227 $0
16971 RTE 609 -
RECONSTRUCTION 609 Bristol Secondary Washington
County $4,727 $4,628 $99 $0 $0

County Snapshot | 47
60792
RTE 611 - RECONSTRUCTION - PE
AND R/W ONLY IN PROGRAM 611 Bristol Secondary
Washington County $4,718 $1,490 $0 $0 $3,228
70847
RTE 611 - INTERSECTION IMPROVEMENT 611 Bristol Secondary
Washington County $488 $632 $0 $0 ($143)
86479
ROUTE 611 OVER TUMBLING CREEK VA
STRUC 6011 611 Bristol Secondary Washington
County $1,165 $654 $0 $511 $0
101388 RTE 613 OVER WOLF
CREEK ( VA STR 6100) 613 Bristol Secondary Washington
County $753 $140 $250 $363 $0
60791 RTE 614 -
RECONSTRUCTION 614 Bristol Secondary Washington
County $4,450 $3,861 $589 $0 $0
81437
RTE 647 - INSTALL GUARDRAIL & RUMBLE
STRIPS, PAVE SHOULDERS 647 Bristol Secondary
Washington County $193 $446 $0 $0 ($253)
T13937
BRIDGE REPL-GEN SPR RD OVER WOLF CREEK
(FED ID 19089) 670 Bristol Secondary Washington
County $950 $0 $0 $950 $0
82360
DEDICATED BRIDGE FUND -REPLACE STRUC
#6108 ON RTE 670 670 Bristol Secondary Washington
County $24,118 $14,368 $2,016 $7,734 $0
104831
BRIDGE REPL-WATAUGA RD OVER
HUGHES CREEK (FED ID 19098) 677 Bristol Secondary
Washington County $900 $0 $0 $900 $0
12501
RTE 725 - RECONSTRUCT
EXISTING ROADWAY PE ONLY IN SYIP 725 Bristol Secondary
Washington County $5,463 $1,510 $0 $0 $3,953
104828
BRIDGE REPL-TAYOR VALLEY RD OVER
LAUREL CREEK (FED ID 19162) 725 Bristol Secondary
Washington County $725 $0 $0 $725 $0
86293
RTE 747 OVER TUMBLING CREEK VA
STRUC 6308 747 Bristol Secondary Washington
County $936 $936 $0 $0 $0
101380
BRIDGE REPLACEMENT RTE 747 OVER
TUMBLING CK (VA STR 6424) 747 Bristol Secondary
Washington County $562 $100 $0 $462 $0
104994
BRIDGE REPL-WALTER ST OVER BEAVER DAM CREEK (FED ID 19212) 1203 Bristol Secondary
Washington County $850 $0 $0 $850 $0
86595 RTE 1212 OVER LAUREL CREEK VA STRUC 6110 1212 Bristol Secondary
Washington County $872 $1,576 $0 $0 ($704)
81129
SLEN - CHESTNUT MOUNTAIN ROAD
SAFETY IMPROVEMENTS SLEN Bristol Secondary
Washington County $359 $448 $0 $0 ($88)
Source: VDOT website, accessed 9-4-2013
Mt. Rogers Planning District Commission – 2035 Rural Long Range Transportation Plan The Transportation and Mobility Planning Division (TMPD) of the Virginia Department of Transportation (VDOT) has worked with other modal agencies to develop VTrans 2035, the Commonwealth’s multi-modal long
County Snapshot | 48
range plan and a more detailed subset report known as the 2035 Surface Trans-portation Plan. The highway element of the 2035 Surface Transportation Plan includes proposed improvements on Virginia’s federal functionally classified roadways. This Rural Long Range Transportation Plan is one piece of the 2035 Plan. VDOT, Virginia’s Planning District Commissions (PDCs), and the local governments they represent are partners in the development of this new initiative to create regional transportation plans in rural and small urban areas that complement those in Virginia’s metropolitan areas. *Washington County recommendations included as excerpt
Source: Mount Rogers Planning District Commission – 2035 Rural Long Range Transportation Plan

County Snapshot | 49
Land Use Land Use is may be defined as the manner in which a parcel of land is used or occupied. An understanding of current land use conditions is an essential first step in the comprehensive planning process. The development patterns in the county are influenced by historic factors, economic and demographic trends and a host of other forces. The distribution of people and activities within a city impacts all other aspects of the process. Existing Zoning Classifications
• Highland Recreation District (HR) - The HR highland recreation district consists of all of the national recreation area (NRA) within the county as designated by the United States Congress. In order to accomplish the necessary controls for this area, the boundaries of this district shall be concurrent with those of the national recreation area. The intent is to keep the use of privately owned land within the national recreation area and on this designated perimeter in harmony with the rural American theme of the national recreation area. It is not intended that these lands should develop intensively for residence, either yearround or second homes. It is the intent that the primary uses will be forestry and agriculture together with certain recreational activities appropriate to the mountains.
• Shoreland Recreation District (SR) - The SR shoreland recreation district contains the land area adjacent to the South Holston Reservoir. The regulations for this district are designed to provide standards for the orderly development of land surrounding the reservoir, to protect the public access to the reservoir and to prevent pollution, including sedimentation. This district should be low-density development from the maximum contour elevation of 1,747 feet to State Route 664; and in all other areas surrounding the lake, the outside boundary line shall be located 500 feet from the Tennessee Valley Authority easement boundary line. This district shall also include all land located below the 1,747-foot elevation subject to flowage easements rights required by the Tennessee Valley Authority for the operation of South Holston Reservoir.
• Conservation Recreation District (CR) - The objective of the CR conservation and recreation district is
the preservation of open space for recreation and other compatible uses consistent with some of the present characteristics. In order to prevent future indiscriminate development, it is the intent of this division to promote orderly, but limited, growth. Since much of the land area in this district has a slope steepness in excess of 20 percent, it precludes intensive development for most uses. This district includes, but is not limited to, all of the land north of the north fork of the Holston River. Any new growth that occurs in this district should not be in conflict with the existing public recreation facilities. Thus, such development must be of particular interest to the whole community, and it must be planned for before development occurs. In all instances, the development should be limited to sparse occupation for purposes of safety, health, convenience, order, etc., of the community.
• Agricultural, Limited District (A-1) - The A-1 limited agricultural district covers the portions of the county which are occupied by various open uses, such as forests, parks, farms, lakes or mountains. The A-1 limited agricultural district is established for the specific purpose of facilitating existing and future farming operations, conservation of water and other natural resources, reducing soil erosion, protecting watersheds, and reducing hazards from flood and fire. Uses not consistent with the existing character of the A-1 limited agricultural district are not permitted.

County Snapshot | 50
• Agricultural, General District (A-2) - Generally, the A-2 general agricultural district covers the portion of
the county into which urban-type development could logically expand as the need occurs. As a general rule, it surrounds residential sections. Domestic water and sewerage facilities, police and fire protection, and other services necessary to accommodate urban-type development already exist in the district or can be economically extended as urbanization takes place. The A-2 general agricultural district is established for the specific purpose of providing for the orderly expansion of urban development into territory surrounding incorporated areas within or adjacent to the county, confining such development to such locations as can feasibly be supplied urban-type facilities, and discouraging the random scattering of residential, commercial and industrial uses into the area.
• Village District - Certain conglomerate communities exist in the county, and for the most part these communities remain as crossroad developments. In order to prevent the continuation of such haphazard development of mixed uses in a limited space, it is proposed to control the potential growth by these regulations. This is necessary because none of these communities is large enough to institute effective controls adequately and efficiently by its own contrivances. In these smaller compacted communities, it is desirable to establish a set of standards for expanding growth. The basic elements contained in this division are created to permit orderly growth to occur so that these communities may become viable local trade and service centers of the county. Included in this array of smaller unincorporated communities are Clinchburg, Emory, Greendale, Meadowview, Mendota and Taylor's Valley.
• Konnarock District - Konnarock, by its proximity to the main attractions of the National Recreation Area around Whitetop Mountain and Mount Rogers, must be guarded from development that would be detrimental to the natural beauty and culture of the region. It is the intent of this division to help with maintaining its uniqueness while still permitting orderly development.
• Residential, Limited District (R-1) - The R-1 limited residential district is composed of certain quiet, low-density residential areas plus certain open areas where similar residential development appears likely to occur. The regulations for this district are designed to stabilize and protect the essential characteristics of the district, to promote and encourage a suitable environment for family life where there are children, and to prohibit all activities of a commercial nature. To these ends, development in the R-1 limited residential district is limited to relatively low concentration; and permitted uses are limited basically to single-unit dwellings providing homes for the residents plus certain additional uses, such as schools, parks, churches, and certain public facilities that serve the residents of the district. No home occupations (including room renting) are permitted in the R-1 limited residential district.
• Residential, General District (R-2) - The R-2 general residential district is composed of certain medium to high concentration of residential uses, ordinarily located between residential and commercial areas, plus certain open areas where similar development appears likely to occur. The regulations for the R-2 general residential district are designed to stabilize and protect the essential characteristics of the district; to promote and encourage, insofar as compatible with the intensity of land use, a suitable environment for family life composed of an adult population with some children; and to permit certain commercial uses of a character unlikely to develop general concentration of traffic, crowds of customers, and general outdoor advertising. To these ends retail activity in the R-2 general residential
County Snapshot | 51
district is sharply limited, and this district is protected against encroachment of general commercial or industrial uses. All residential types of structures for both permanent and transient occupancy, including institutions, are permitted, plus structures for commercial uses conforming to the pattern of the district. The R-2 general residential district is not completely residential as it includes public and semipublic, institutional and other related uses. However, the R-2 general residential district is basically residential in character and, as such, should not be spotted with commercial and industrial uses.
• Business, Limited District (B-1) - The primary purpose of the B-1 limited business district is to establish and protect a business district that will serve the surrounding residential districts. Traffic and parking congestion in the B-1 limited business district is to be held to a minimum to protect and preserve property values in the surrounding residential districts, and insofar as possible all neighborhood business development shall take place in a limited business district. The minimum area of such the B-1 limited business district shall be one block and only include such activities as are necessary for the day-to-day operation of a normal household. In most instances the B-1 limited business district is not located on major traffic arteries.
• Business, General, District (B-2) - Generally the B-2 general business district covers that portion of the community intended for the conduct of governmental, professional and general commercial (predominately retail) business to which the public requires direct and frequent access, but which is not generally characterized either by constant heavy trucking other than stocking and delivery of light retail goods or by any nuisance factors other than occasioned by incidental light and noise or congregation of people and passenger vehicles. Other uses of a predominately nonretail commercial character or those which may significantly contribute to nuisance factors may be permitted in the B-2 general business district by special exception on a case-by-case basis after evaluation of the relative impact of such uses or activities on the surrounding area and establishing mitigating conditions for such uses where deemed necessary.
• Industrial, Limited District (M-1) - The primary purpose of the M-1 limited industrial district is to permit certain industries and businesses that may have an adverse effect in the business districts, which with appropriate restrictions should not detract from adjacent residential uses. The limitations on or provisions relating to height of buildings, horsepower, heating, flammable liquids or explosives, controlling emission of fumes, odors or noise, landscaping, buffering requirements, restrictions on proximity to adjacent uses, and the number of persons employed in the M-1 limited industrial district are imposed to protect and foster adjacent residential desirability.
• Industrial, General District (M-2) - The primary purpose of the M-2 general industrial district is to establish an area where the principal use of land is for heavy commercial and industrial operations, which may create some nuisance and businesses that may have an adverse effect in the business districts, and which are not properly associated with, nor particularly compatible with, residential, institutional and neighborhood commercial service establishments. The specific intent of the M-2 district is to:
(1)Encourage the construction of and the continued use of the land for heavy commercial and industrial purposes and businesses that may have an adverse effect in the business districts.

County Snapshot | 52
(2)Prohibit residential and neighborhood commercial use of the land and prohibit any other use which would substantially interfere with the development, continuation and expansion of commercial and industrial uses in the district.
(3)Encourage the discontinuance of existing uses that would not be permitted as new uses under the provisions of this chapter.
• Flood Hazard District (FH) - The primary purpose of the M-2 general industrial district is to establish an area where the principal use of land is for heavy commercial and industrial operations, which may create some nuisance and businesses that may have an adverse effect in the business districts, and which are not properly associated with, nor particularly compatible with, residential, institutional and neighborhood commercial service establishments. The specific intent of the M-2 district is to:
(1)Encourage the construction of and the continued use of the land for heavy commercial and industrial purposes and businesses that may have an adverse effect in the business districts.
(2)Prohibit residential and neighborhood commercial use of the land and prohibit any other use which would substantially interfere with the development, continuation and expansion of commercial and industrial uses in the district.
(3)Encourage the discontinuance of existing uses that would not be permitted as new uses under the provisions of this chapter.
• Residential, Manufactured Home District (MHR) - The MHR manufactured home residential district is composed of certain quiet, low- to medium-density residential areas plus certain open areas where similar residential development appears likely to occur. The regulations for the MHR manufactured home residential district are designed to stabilize and protect the essential characteristics of the district, to promote and encourage a suitable environment for family life and to discourage all activities of a commercial nature. To these ends, development in the MHR manufactured home residential district is limited to relatively medium concentration, and permitted uses are limited basically to single-family and two-family dwellings, manufactured homes, plus certain additional uses which are complementary to the residential uses.
• Airport District - The airport district is intended for the protection of the utility of the Virginia Highlands airport and the public investment in the facilities located at the airport now and in the future, and to further the economic development of the county through providing necessary air transportation services to the county, to prevent obstructions that have the potential for endangering the lives and property of the users of the airport and the residents of the county, reduce the size of areas available for landing, takeoff and maneuvering of aircraft, or otherwise destroy or impair the utility of the airport. It is declared that in the interest of the public health, safety and general welfare that the creation or establishment of the airport district is of benefit to the county because of the enhanced potential for economic development and interstate commerce derived from the airport facility.

County Snapshot | 53
Appendix
2002 Comprehensive Plan
2013 Comprehensive Plan Project Outline