course code: 40 eee2018pt01 power quality course …
TRANSCRIPT

Sri Chandrasekharendra Saraswathi Viswa Maha Vidyalaya 231
Course Code:
EEE2018PT01
POWER QUALITY
L T P Credit CIA Marks 40
Course Category: PEC
3
0
0
3
SEE Marks 60
COURSE OBJECTIVES:
To introduce the power quality problem
To educate on production of voltages sags, over voltages and harmonics and metho ds of control.
To study overvoltage problems
To study the sources and effect of harmonics in power system
To impart knowledge on various methods of power quality monitoring.
COURSE OUTCOMES:
Ability to understand and analyze power quality problem, stability, control and protection.
After the successful completion of the course students will be able to
Cos No. Course Outcomes Bloom’s level
CO1 Explain various power quality problems
Understand
Co2 Discuss the root cause of power quality problems Understand
Co3 Explain the impact of PQ issues on various electrical components
Understand
Co4 Discuss the need for PQ monitoring and measurement
Understand
CO5 Compute the harmonics distortion in the given
electrical drive
Apply
Mapping of Course Outcome to Program Outcomes:
Course Outcomes
Program Outcomes
PO1 PO2 PO3 PO4 PO5 PO6 PO7 PO8 PO9 PO10 PO11 PO12
CO1 S S S S S S M M S M S S
CO2 S S M M S S S M S M M S
CO3 S S S S S M M M S M M S
CO4 S S M M S S S M S M S S
CO5 S S S S S S M M M M M S

Sri Chandrasekharendra Saraswathi Viswa Maha Vidyalaya 232
SYLLABUS:
MODULE I
INTRODUCTION
Definitions-Power quality, Voltage quality-Power quality issues: Short duration voltage variations, Long
duration voltage variations, Transients, Waveform distortion, Voltage imbalance, Voltage fluctuation,
Power frequency variations-Sources and Effects of power quality problems-Power quality terms- Power
quality and Electro Magnetic Compatibility (EMC),IEEE and IEC Standards.
MODULE II
SHORT AND LONG INTERRUPTIONS
Introduction-Origin of short interruptions: Voltage magnitude events due to re- closing, Voltage during the
interruption-Monitoring of short interruptions- Influence on induction motors, Synchronous motors,
Adjustable speed drives, Electronic equipments-Single phase tripping: Voltage during fault and post fault
period, Current during fault period-Prediction of short Interruptions.
LONG INTERRUPTIONS: Definition-Failure, Outage, Interruption-Origin of interruptions-Causes of long
interruptions – Principles of regulating the voltage-Voltage regulating devices, Applications: Utility side,
End-User side-Reliability evaluation-Cost of interruptions.
MODULE III
VOLTAGE SAG AND TRANSIENTS
VOLTAGE SAG: Introduction-Definition-Magnitude, Duration-Causes of Voltage Sag-Load influence on
voltage sags on Adjustable speed drives, Power electronics loads, Sensitive loads- Stochastic
assessment of voltage sags – Overview of mitigation methods.
TRANSIENTS: Definition-power system transient model-Principles of over voltage protection –Types and
causes of transients- Devices for over voltage protection- Capacitors witch in transients- Lightning
transients-Transients from load switching.
MODULE IV
WAVEFORM DISTORTION
Introduction - Definition and terms - Harmonics, Harmonics indices, Inter harmonics, Notching - voltage
Vs Current distortion - Harmonics Vs Transients - Sources and effects of harmonic distortion -
System response characteristics - Principles of controlling harmonics - Standards and limitation
MODULE V
POWER QUALITY SOLUTIONS
Introduction-Power quality monitoring: Need for power quality monitoring, Evolution of power quality
Monitoring, Deregulation effect on power quality monitoring-Brief introduction to power quality
measurement equipments and power conditioning equipments- Planning,Conducting and Analyzing
power quality survey-Mitigation and control techniques- Active Filters for Harmonic Reduction

Sri Chandrasekharendra Saraswathi Viswa Maha Vidyalaya 233
LEARNING RESOURCES:
Text Books:
1. Roger C.Dugan,Mark F.Mc Granaghan and H.Wayne Beaty, " Electrical Power Systems Quality",
McGraw-Hill,NewYork,3rd
Edition 2017.
2. Barry W.Kennedy, “Power QualityPrimer”, McGraw-Hill,NewYork, 2007.
References:
1. Sankaran.C,"PowerQuality",CRCPress,Washington,D.C., 2019.
2. Math H.J. Bollen, "Understanding Power Quality Problems: Voltage Sags and Interruptions", IEEE
Press, NewYork, 2000.
3. Arrillaga.J,Watson.N.RandChen.S,"PowerSystemQualityAssessment",JohnWiley. 2011.
Online resources:
1. www.nptel.ac.in
2. www.electrical4u.com
ASSESSMENT PATTERN:
Bloom’s Category
Continuous Assessment Tests
Assignment (10)
Terminal Examination (60)
(15) (15)
Remember 7 0
10
20
Understand 8 - 15
Apply 0 8 10
Analysis 0 4 10
Evaluate 0 3 5
Create 0 0 0
Total 15 15 60
A B C D
A+B+C+D = 100

COURSE PLAN
Topic No
Topic Name No. of
Periods Proposed Date of Completion
UNIT – I : INTRODUCTION
1
Introduction to power quality-Definitions:power quality-
voltage quality-Power quality issues:Short duration voltage variations-Long duration
voltage variations
2 14.7.21
2
Transients-Waveform distortion-Voltage imbalance,
Voltage fluctuation-Power frequency variations
2 21.7.21
3
Sources and Effects of power quality problems- Power
quality terms- Power quality and Electro Magnetic Compatibility (EMC)- IEC
Standards for power quality
2 28.7.21
UNIT – II SHORT AND LONG INTERRUPTIONS
1
Introduction-Origin of short
interruptions: Voltage magnitude events due to re-
closing, Voltage during the interruption- Monitoring of short interruptions- Influence
on induction motors, Synchronous motors
2 4.8.21
2
Monitoring of short
interruptions- Adjustable speed drives, Electronic equipments- Single phase
tripping: Voltage during fault and post fault period- Current during fault period-Prediction
of short Interruptions
2 11.8.21

3
LONG INTERRUPTIONS: Definition-Failure, Outage,
Interruption-Origin of interruptions Causes of long interruptions - Principles of
regulating the voltage Voltage regulating devices-
Applications: Utility side, End-User side-Reliability evaluation-Cost of
interruptions
2 25.8.21
UNIT – III VOLTAGE SAG AND TRANSIENTS
1
VOLTAGE SAG: Introduction-Definition-Magnitude,
Duration-Causes of Voltage Sag-
2 01.9.21
2
Load influence on voltage sags on Adjustable speed drives- Load influence on
voltage sags on Power electronics loads, Sensitive loads- Stochastic assessment
of voltage sags – Overview of mitigation methods
2 8.9.21
3
TRANSIENTS: Definition-
power system transient model-Principles of over voltage protection- Types and causes
of transients- Devices for over voltage protection- Capacitor
switch in transients- Lightning transients- Transients from load switching
2 15.9.21
UNIT – IV WAVEFORM DISTORTION
1
Introduction - Definition and terms - Harmonics, Harmonics
indices, Inter harmonics, Notching- voltage Vs Current
distortion - Harmonics Vs Transients
2
29.9.21
2
Power system quantities under
non sinusoidal conditions- Sources and effects of harmonic distortion -single
phase power supply
2
6.10.21

3
Sources and effects of harmonic distortion -
Fluorescent lighting- Adjustable speed drives for HVAC and elevators- System
response characteristics - Principles of controlling
harmonics - Standards and limitation
2 13.10.21
UNIT – V : POWER QUALITY SOLUTIONS
1
Introduction-Power quality monitoring: Need for power quality monitoring- Evolution of
power quality Monitoring, Deregulation effect on power quality monitoring
2
16.10.21
2
Brief introduction to power quality measurement
equipments - Brief introduction to power conditioning equipments
2 23.10.21
3
Planning,Conducting and Analyzing power quality survey- Mitigation and control
techniques- Active Filters for Harmonic Reduction
2 27.10.21
1
SUBJECT : POWER QUALITY
AIM :The quality of electrical power may be described as a set of values of parameters, such as:
Continuity of service (Whether the electrical power is subject to voltage drops or overages below or above a threshold level
thereby causing blackouts or brownouts)
Variation in voltage magnitude
Transient voltages and currents
Harmonic content in the waveforms for AC power
It is often useful to think of power quality as a compatibility problem: It is the equipment connected to the grid compatible with the
events on the grid, and is the power delivered by the grid, including the events, compatible with the equipment that is
connected.Compatibility problems always have at least two solutions: in this case, either clean up the power, or make the equipment
tougher.The tolerance of data-processing equipment to voltage variations is often characterized by the CBEMA curve, which give the
duration and magnitude of voltage variations that can be tolerated. This unit describes the definition os electric power quality,its
causes and classification.It describes the impact of poor power quality on power system and guidelines of various IEEE and IEC
standards.
OBJECTIVES :
Introduces the definition of electric power quality, its causes and classification: transients, short-duration voltage variations,
interruptions, sags, swells, long-duration voltage variations, sustained interruption, under- and over-voltage, voltage imbalance,
waveform distortion, DC offset, harmonics, inter-harmonics, non-integer harmonics, triplen harmonics, sub-harmonics, time and
space harmonics, characteristic and uncharacteristic harmonics, positive-negative- and zero-sequence harmonics, notching, electric
noise, voltage fluctuation and flicker, and power-frequency variations. The formulations and measures used for power quality;
impacts of poor power quality on power system and end-use devices; most important IEEE and IEC
guidelines/recommendations/standards referring to power quality are presented.
PRE TEST-MCQ TYPE:
1. Most of the power quality problems are related to ______
(a) Transmission Issue (b) Grounding Issue (c) Distribution Issue (d) all of the above
2. Which of the following is not considered as good power quality voltage
(a) Power Supply is more compared to demand (b) Constant sine wave (c) Constant Velocity (d) Constant RMS Value unchanged with time
3. Grounding is done (i) for safety (ii) to provide a low-impedance path for the flow of fault current in case of a ground fault (iii) to

2
create a ground reference plane for sensitive electrical equipment
(A) Only (i)
(B) Only (ii)
(C) (i) & (ii)
(D) (i), (ii), (iii)
4. _________________ refers to the interaction between electric and magnetic fields and sensitive electronic circuits and devices.
(A) Radio frequency interference
(B) Power frequency disturbances
(C) Electromagnetic interference
(D) Power system harmonics
5. All electrical devices are prone to failure or malfunction when exposed to one or more power quality problems
(A) True
(B) False

3
UNIT-I
Introduction to Power Quality
Terms and definitions: Overloading - under voltage - over voltage. Concepts of transients - short
duration variations such as interruption - long duration variation such as sustained interruption.
Sags and swells - voltage sag - voltage swell - voltage imbalance - voltage fluctuation - power
frequency variations. International standards of power quality. Computer Business Equipment
Manufacturers Associations (CBEMA) curve
1.1 Introduction
Power quality is any abnormal behavior on a power system arising in the form of
voltage or current, which affects the normal operation of electrical or electronic
equipment.
Power quality is any deviation of the voltage or current waveform from its normal
sinusoidal wave shape.
Power quality has been defined as the parameters of the voltage that affect the
customer’s supersensitive equipment.
Power quality problems are
o Voltage sag
o Voltage swell
o Voltage Flicker
o Harmonics
o Over voltage
o Under voltage
o Transients
Voltage sags are considered the most common power quality problem. These can
be caused by the utility or by customer loads. When sourced from the utility, they
are most commonly caused by faults on the distribution system. These sags will
be from 3 to 30 cycles and can be single or three phase. Depending on the design
of the distribution system, a ground fault on 1 phase can cause a simultaneous
swell on another phase.
Power quality problems are related to grounding, ground bonds and neutral to
ground voltages, ground loops, ground current or ground associated issues.

4
Harmonics are distortions in the AC waveform. These distortions are caused by
loads on the electrical system that use the electrical power at a different frequency
than the fundamental 50 or 60 Hz.
1.2 Terms and Definitions:
1.2.1 Power Quality:
It is any deviation of the voltage or current waveform from its normal sinusoidal
wave shape.
1.2.2 Voltage quality:
Deviations of the voltage from a sinusoidal waveform.
1.2.3 Current quality:
Deviations of the current from a sinusoidal waveform.
1.2.4 Frequency Deviation:
An increase or decrease in the power frequency.
1.2.5 Impulsive transient:
A sudden, non power frequency change in the steady state condition of voltage or
current that is unidirectional in polarity.
1.2.6 Oscillatory transients:
A sudden, non power frequency change in the steady state condition of voltage or
current that is bidirectional in polarity.
1.2.7 DC Offset:
The presence of a DC voltage or current in an AC power system.
1.2.8 Noises:
An unwanted electric signal in the power system.
1.2.9 Long duration Variation:
A variation of the RMS value of the voltage from nominal voltage for a time
greater than 1 min.
1.2.10 Short Duration Variation:
A variation of the RMS value of the voltage from nominal voltage for a time less
than 1 min.
1.2.11 Sag:
A decrease in RMS value of voltage or current for durations of 0.5 cycles to 1min.

5
1.2.12 Swell:
A Temporary increase in RMS value of voltage or current for durations of 0.5
cycles to 1 min.
1.2.13 Under voltage:
10% below the nominal voltage for a period of time greater than 1 min.
1.2.14 Over voltage:
10% above the nominal voltage for a period of time greater than 1 min.
1.2.15 Voltage fluctuation:
A cyclical variation of the voltage that results in flicker of lightning.
1.2.16 Voltage imbalance:
Three phase voltages differ in amplitude.
1.2.17 Harmonic:
It is a sinusoidal component of a periodic wave or quantity having a frequency
that is an integral multiple of the fundamental power frequency.
1.2.18 Distortion:
Any deviation from the normal sine wave for an AC quantity.
1.2.19 Total Harmonic Distortion:
The ratio of the root mean square of the harmonic content to the RMS value of the
fundamental quantity.
1.2.20 Interruption:
The complete loss of voltage on one or more phase conductors for a time greater
than 1 min.

6
1.3 Concepts of transients:
Transient over voltages in electrical transmission and distribution networks result
from the unavoidable effects of lightning strike and network switching operations.
Response of an electrical network to a sudden change in network conditions.
Oscillation is an effect caused by a transient response of a circuit or system. It is a
momentary event preceding the steady state (electronics) during a sudden change
of a circuit.
An example of transient oscillation can be found in digital (pulse) signals in
computer networks. Each pulse produces two transients, an oscillation resulting
from the sudden rise in voltage and another oscillation from the sudden drop in
voltage. This is generally considered an undesirable effect as it introduces
variations in the high and low voltages of a signal, causing instability.
Types of transient:
o Impulsive transient
o Oscillatory transient
1.3.1 Impulse transient:
A sudden, non power frequency change in the steady state condition of voltage or
current that is unidirectional in polarity.
1.3.2 Oscillatory transient:
A sudden, non power frequency change in the steady state condition of voltage or
current that is bidirectional in polarity.

7
1.3.3 Short duration variations – Interruption
The complete loss of voltage on one or more phase conductors for a time less than
1 min.
1.3.3.1 Types of Short Duration interruption:
Momentary Interruption < 1 min , <0.1 pu
Temporary Interruption < 1 min , <0.1 pu
1.3.4 Long duration variations – Sustained interruption
The complete loss of voltage on one or more phase conductors for a time greater than 1
min.

8
1.4 Sags and Swells:
1.4.1 Voltage sag:
A voltage sag or voltage dip is a short duration reduction in RMS voltage which
can be caused by a short circuit, overload or starting of electric motors.
Voltage sag happens when the RMS voltage decreases between 10 and 90 percent
of nominal voltage for one-half cycle to one minute.
Some references define the duration of sag for a period of 0.5 cycles to a few
seconds, and longer duration of low voltage would be called “sustained sag".
There are several factors which cause voltage sag to happen:
Since the electric motors draw more current when they are starting than when
they are running at their rated speed, starting an electric motor can be a reason of
voltage sag.
When a line-to-ground fault occurs, there will be voltage sag until the protective
switch gear operates.
Some accidents in power lines such as lightning or falling an object can be a
cause of line-to-ground fault and voltage sag as a result.
Sudden load changes or excessive loads can cause voltage sag.
Depending on the transformer connections, transformers energizing could be
another reason for happening voltage sags.
Voltage sags can arrive from the utility but most are caused by in-building
equipment. In residential homes, we usually see voltage sags when the
refrigerator, air-conditioner or furnace fan starts up.

9
1.4.2 Voltage Swell:
Swell - an increase to between 1.1pu and 1.8 pu in rms voltage or current at the
power frequency durations from 0.5 to 1 minute
In the case of a voltage swell due to a single line-to-ground (SLG) fault on the
system, the result is a temporary voltage rise on the un faulted phases, which last
for the duration of the fault. This is shown in the figure below:
Instantaneous Voltage Swell Due to SLG fault
Voltage swells can also be caused by the deenergization of a very large load.
It may cause breakdown of components on the power supplies of the equipment,
though the effect may be a gradual, accumulative effect. It can cause control
problems and hardware failure in the equipment, due to overheating that could
eventually result to shutdown. Also, electronics and other sensitive equipment are
prone to damage due to voltage swell.
Voltage Swell Magnitude Duration
Instantaneous 1.1 to 1.8 pu 0.5 to 30 cycles
Momentary 1.1 to 1.4 pu 30 cycles to 3 sec
Temporary 1.1 to 1.2 pu 3 sec to 1 min

10
\
1.4.3 Voltage unbalance:
In a balanced sinusoidal supply system the three line-neutral voltages are equal in
magnitude and are phase displaced from each other by 120 degrees (Figure 1).
Any differences that exist in the three voltage magnitudes and/or a shift in the
phase separation from 120 degrees is said to give rise to an unbalanced supply
(Figure 2)
The utility can be the source of unbalanced voltages due to malfunctioning
equipment, including blown capacitor fuses, open-delta regulators, and open-delta
transformers. Open-delta equipment can be more susceptible to voltage unbalance
than closed-delta since they only utilize two phases to perform their
transformations.
Also, voltage unbalance can also be caused by uneven single-phase load
distribution among the three phases - the likely culprit for a voltage unbalance of
less than 2%. Furthermore, severe cases (greater than 5%) can be attributed to

11
single-phasing in the utility’s distribution lateral feeders because of a blown fuse
due to fault or overloading on one phase.
1.4.4 Voltage Fluctuation:
Voltage fluctuations can be described as repetitive or random variations of the
voltage envelope due to sudden changes in the real and reactive power drawn by a
load. The characteristics of voltage fluctuations depend on the load type and size
and the power system capacity.
Figure 1 illustrates an example of a fluctuating voltage waveform. The voltage
waveform exhibits variations in magnitude due to the fluctuating nature or
intermittent operation of connected loads.
The frequency of the voltage envelope is often referred to as the flicker frequency.
Thus there are two important parameters to voltage fluctuations, the frequency of
fluctuation and the magnitude of fluctuation. Both of these components are
significant in the adverse effects of voltage fluctuations.
Voltage fluctuations are caused when loads draw currents having significant
sudden or periodic variations. The fluctuating current that is drawn from the
supply causes additional voltage drops in the power system leading to fluctuations
in the supply voltage. Loads that exhibit continuous rapid variations are thus the
most likely cause of voltage fluctuations.
Arc furnaces
Arc welders
Installations with frequent motor starts (air conditioner units, fans)
Motor drives with cyclic operation (mine hoists, rolling mills)
Equipment with excessive motor speed changes (wood chippers, car shredders)

12
1.5 Power frequency variations:
Power frequency variations are a deviation from the nominal supply frequency. The
supply frequency is a function of the rotational speed of the generators used to
produce the electrical energy.
At any instant, the frequency depends on the balance between the load and the
capacity of the available generation.
A frequency variation occurs if a generator becomes un-synchronous with the power
system, causing an inconsistency that is manifested in the form of a variation.
The specified frequency variation should be within the limits Hz at all times
for grid network.
1.6 International Standards of power quality:
1.6.1 IEEE Standards:
IEEE power quality standards: Institute Of Electrical and Electronics Engineer.
IEEE power quality standards: International Electro Technical Commission.
IEEE power quality standards: Semiconductor Equipment and Material International.
IEEE power quality standards: The International Union for Electricity Applications
IEEE Std 519-1992: IEEE Recommended practices and requirements for Harmonic
control in Electric power systems.
IEEE Std 1159-1995: IEEE Recommended practices for monitoring electrical power
IEEE std 141-1993, IEEE Recommended practice for electric power distribution for
industrial plants.
IEEE std 1159-1995, IEEE recommended practice for Monitoring electrical power
quality.
13
1.6.2. IEC Standards:
Definitions and methodology 61000-1-X
Environment 61000-2-X
Limits 61000-3-X
Tests and measurements 61000-4-X
Installation and mitigation 61000-5-X
Generic immunity and emissions 61000-6-X
1.7 CBEMA and ITI Curves:
One of the most frequently employed displays of data to represent the power quality
is the so-called CBEMA curve.
A portion of the curve adapted from IEEE Standard 4469 that we typically use in our
analysis of power quality monitoring results is shown in Fig. 1.5.
This curve was originally developed by CBEMA to describe the tolerance of
mainframe computer equipment to the magnitude and duration of voltage variations
on the power system.
While many modern computers have greater tolerance than this, the curve has
become a standard design target for sensitive equipment to be applied on the power
system and a common format for reporting power quality variation data.
The axes represent magnitude and duration of the event. Points below the envelope
are presumed to cause the load to drop out due to lack of energy. Points above the
envelope are presumed to cause other malfunctions such as insulation failure,
overvoltage trip, and over excitation.
The upper curve is actually defined down to 0.001 cycle where it has a value of about
375 percent voltage.
We typically employ the curve only from 0.1 cycles and higher due to limitations in
power quality monitoring instruments and differences in opinion over defining the
magnitude values in the sub cycle time frame.
The CBEMA organization has been replaced by ITI, and a modified curve has been
developed that specifically applies to common 120-V computer equipment (see Fig.
1.6). The concept is similar to the CBEMA curve. Although developed for 120-V

14
computer equipment, the curve has been applied to general power quality evaluation
like its predecessor curve.
Both curves are used as a reference in this book to define the withstand capability of
various loads and devices for protection from power quality variations.
For display of large quantities of power quality monitoring data, we frequently add a
third axis to the plot to denote the number of events within a certain predefined cell
of magnitude and duration.
Fig 1.5 A portion of the CBEMA curve commonly used as a design target for equipment
And a format for reporting power quality variation data.
Fig 1.6 ITI curve for susceptibility of 120-V computer equipment.

15
APPLICATIONS:
Active line filters (power quality management)
Operators of industrial facilities and rail networks, in particular, use active line filters with IGBT
modules to meet the requirements of energy suppliers in terms of low mains feedback. The
applications cover a wide range of outputs, from 1 kVA to several MW with parallel power
converters. Active line filters are controlled power sources that can feed current into the network with any amplitude, frequency or phasing to compensate for harmonics and reactive power
caused by the load. Their topology is that of an inverter with DC bus voltage, which is
connected to the network via a filter.
Constant comparison of the actual value of the current in the network against the target value determines the energy that must be fed from the DC link capacitors via the inverter into the
network, separately for each phase. In order to achieve good control dynamics, the highest
possible pulse frequencies must be used.
Figure 1.Block diagram of an active filter
Energy Storage
The application "Energy Storage" includes very diverse fields of application, e.g.:
Back-up of power failures to protect sensitive consumers with UPS systems (Uninterruptible Power Supplies)
Electric energy storage for short-term support of wind energy and PV solar systems during grid
faults and compensate for short-term production deficits
Storing large amounts of energy for long term support in a limited supply network or to integrate producers into the grid with non-predictable, uneven power generation.
Depending on the storage volume and discharge time, today electric energy storage systems either
store directly (e.g. battery storage or capacitor storage, superconducting magnetic storage) as
mechanical energy (flywheel energy storage, pump storage, compressed air storage), or in the form
of electrolytically produced hydrogen.

16
Figure 2.
17
UNIT-II
SHORT AND LONG INTERRUPTIONS
Transients:
The term transient refers to an event that is undesirable and momentary in nature.
Other definition of a transient is “that part of the change in a variable that
disappears during transition from one steady state operating condition to another.”
Transients can be classified into two categories- impulsive and oscillatory. These terms reflect
the wave shape of a current or voltage transient.
Impulsive transient: An impulsive transient is a sudden, non–power frequency change in the steady-state condition of
voltage, current, or both that is unidirectional in polarity (primarily either positive or negative).
Impulsive transients are normally characterized by their rise and decay times.
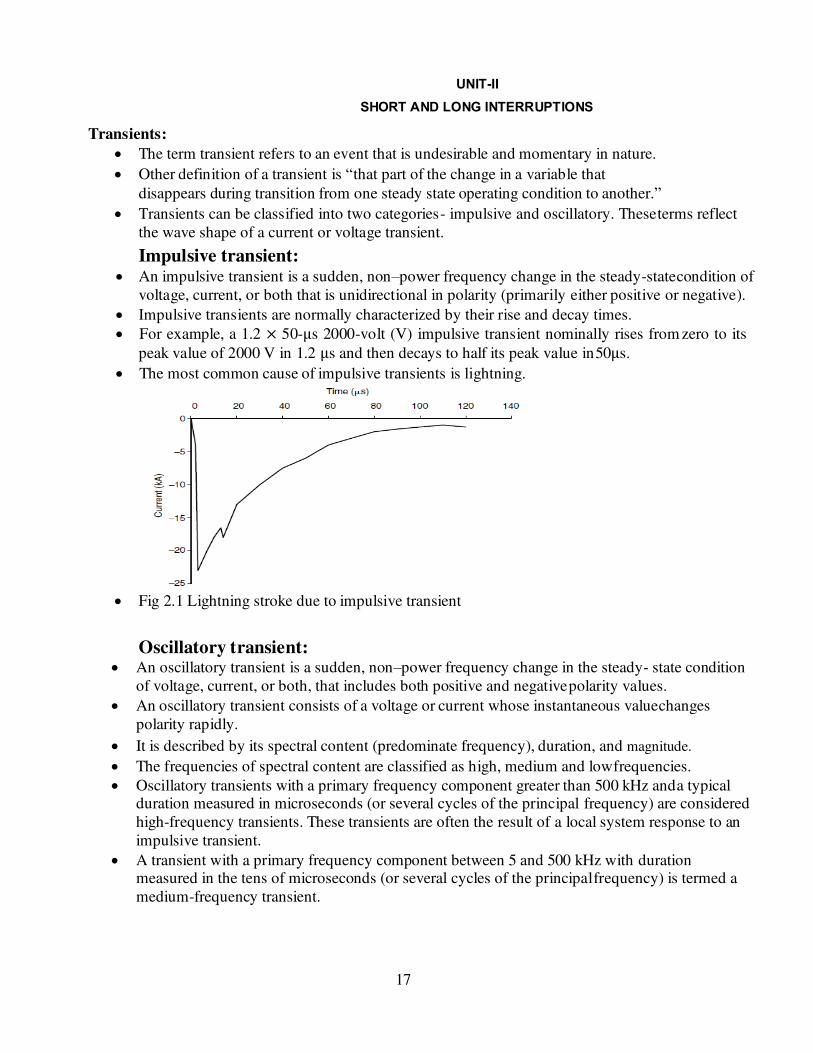
For example, a 1.2 × 50-μs 2000-volt (V) impulsive transient nominally rises from zero to its
peak value of 2000 V in 1.2 μs and then decays to half its peak value in 50μs.
The most common cause of impulsive transients is lightning.
Fig 2.1 Lightning stroke due to impulsive transient
Oscillatory transient: An oscillatory transient is a sudden, non–power frequency change in the steady- state condition
of voltage, current, or both, that includes both positive and negative polarity values.
An oscillatory transient consists of a voltage or current whose instantaneous value changes
polarity rapidly.
It is described by its spectral content (predominate frequency), duration, and magnitude.
The frequencies of spectral content are classified as high, medium and low frequencies.
Oscillatory transients with a primary frequency component greater than 500 kHz and a typical duration measured in microseconds (or several cycles of the principal frequency) are considered
high-frequency transients. These transients are often the result of a local system response to an
impulsive transient.
A transient with a primary frequency component between 5 and 500 kHz with duration measured in the tens of microseconds (or several cycles of the principal frequency) is termed a
medium-frequency transient.

18
Back-to-back capacitor energization results in oscillatory transient currents in the tens of
kilohertz as illustrated in Figure below.
Fig 2.2 Oscillatory transient current caused by back-to-back capacitor switching.
A transient with a primary frequency component less than 5 kHz, and a duration from 0.3 to 50
ms, is considered a low-frequency transient. This category of phenomena is frequently
encountered on utility subtransmission and distribution systems and is caused by many types of events.
Capacitor bank energization results in low frequency oscillatory voltage transient with a
primary frequency between 300 and 900 Hz.
Fig 2.3 Low-frequency oscillatory transient caused by capacitor bank energization.
Oscillatory transients with principal frequencies less than 300 Hz can also be found on the distribution system. These are generally associated with ferroresonance and transformer
energization.
Transients involving series capacitors could also fall into this category.
Fig 2.4 Low-frequency oscillatory transient caused by ferroresonance of an unloaded transformer.

19
Short Duration Voltage Variations:
Energization of large loads which require high starting currents, or intermittent loose connections in
power wiring. Depending on the fault location and the system conditions, the fault can cause either Temporary voltage drops (sags),
voltage rises (swells),
a complete loss of voltage (interruptions)
Interruption:
An interruption occurs when the supply voltage or load current decreases to less than 0.1 pu for a period of time not exceeding 1 min.
Interruptions can be the result of power system faults, equipment failures, and control malfunctions.
The interruptions are measured by their duration since the voltage magnitude is always less than
10 percent of nominal.
The duration of an interruption due to a fault on the utility system is determined by the operating
time of utility protective devices.
Instantaneous reclosing generally will limit the interruption caused by a non permanent fault to
less than 30 cycles.
Delayed reclosing of the protective device may cause a momentary or temporary interruption.
Fig 2.5 Three-phase rms voltages for a momentary interruption due to a fault and subsequent recloser
operation.
Sags (dips):
A sag is a decrease to between 0.1 and 0.9 pu in rms voltage or current at the power frequency for durations from 0.5 cycle to 1 min.
A short-duration voltage decrease is called as "sag".
The IEC definition for this phenomenon is “dip”.
Voltage sags are usually associated with system faults but can also be caused by energization
of heavy loads or starting of large motors.
Figure below shows a voltage sag waveform.

20
Fig 2.6 Voltage sag caused by an SLG fault. (a) RMS waveform for voltage sag event.
(b) Voltage sag waveform.
As shown in the Fig 2.6(b) An 80 percent sag exists for about 3 cycles until the substation breaker
is able to interrupt the fault current. Typical fault clearing times range from 3 to 30 cycles,
depending on the fault current magnitude and the type of overcurrent protection.
Fig 2.7 Temporary voltage sag caused by motor starting.
The above Fig illustrates the effect of a large motor starting. An induction motor will draw 6 to 10 times its full load current during start-up.
If the current magnitude is large relative to the available fault current in the system at that point,
the resulting voltage sag can be significant.
In this case, the voltage sags immediately to 80 percent and then gradually returns to normal in
about 3 s.
Swells: A swell is defined as an increase to between 1.1 and 1.8 pu in rms voltage or current at the power
frequency for durations from 0.5 cycle to 1 min.
Swells can occur due to temporary voltage rise on the unfaulted phases during an SLG fault.
Swells can also be caused by switching off a large load or energizing a large capacitor bank.
Fig 2.8 illustrates a voltage swell caused by an SLG fault.
Fig 2.8 Instantaneous voltage swell caused by an SLG fault.
Swells are characterized by their magnitude (rms value) and duration.
The severity of a voltage swell during a fault condition is a function of the fault location,
system impedance, and grounding.
A swell is commonly defined as "momentary over voltage".

21
Long Duration Voltage Variations:
Long-duration variations encompass root-mean-square (rms) deviations at power frequencies for
longer than 1 min.
The voltage variation is considered to be long duration when the ANSI limits are exceeded for
greater than 1 min.
Long-duration variations can be either over voltages or under voltages.
Over voltages and under voltages generally is not the result of system faults, but are caused by load
variations on the system and system switching operations.
Such variations are typically displayed as plots of rms voltage versus time.
Over voltage:
An overvoltage is an increase in the rms ac voltage greater than 110 percent at the power frequency for duration longer than 1 min.
Over voltage is usually the result of load switching (e.g., switching off a large load or energizing a
capacitor bank). The over voltages result because either the system is too weak for the desired
voltage regulation or voltage controls are inadequate.
Incorrect tap settings on transformers can also result in system over voltages.
Under voltage:
An under voltage is a decrease in the rms ac voltage to less than 90 percent at the power frequency
for a duration longer than 1 min.
Under voltages are the result of switching events that are the opposite of the events that cause over
voltages.
A load switching on or a capacitor bank switching off can cause an under voltage until voltage regulation equipment on the system can bring the voltage back to within tolerances.
Overloaded circuits can result in under voltages also.
Sustained Interruptions:
When the supply voltage has been zero for a period of time in excess of 1 min, the long-duration
voltage variation is considered a sustained interruption.
Voltage interruptions longer than 1 min are often permanent and require human
intervention to repair the system for restoration.
The term sustained interruption refers to specific power system phenomena and, in general, has no
relation to the usage of the term outage.
Outage, as defined in IEEE Standard 100, does not refer to a specific phenomenon, but rather to
the state of a component in a system that has failed to function.
In power quality monitoring, the term interruption has no relation to reliability or service
continuity.

22
MCQ POST TEST:
1. Lightening and Tree striking on a live conductor is an example________ Power Quality issue.
(a) Voltage Sag (b) Voltage Swell (c) Interruption (d) Surge
2. Interruption is
(a) complete loss of power (b) complete loss of voltage (c) complete loss of current (d) all the above
3. The Transients in the power system occurs for
a) less than two complete cycles b) exact two complete cycles c) less than one complete cycles d) exact one complete cycles
4. The most common cause of long interruption is ______ (a) Faults (b) Outages (c) Both (a) & (b)
(d) none of the above
5. Outage is the
(a) Removal of Primary Component (b) No Power Generation (c) Transmission Faults (d) None of the above
6.Single Phase Tripping is generally used in _________________.
(a) Transmission System (b) Distribution System (c) Low Voltage System (d) Generation System
7. The Short Interruptions occurs for
(a) Less than two complete cycles (b) exact two complete cycles (c) less than one complete cycles (d) exact one complete cycles
8. Most electrical equipment is designed to operate within a voltage of ± _____ of nominal with marginal decrease in performance.
(A) 5 %
(B) 1 %
(C) 10 %
(D) 0.5 %
9. Which of the following equipment has low immunity index?
(A) electronic medical equipment
(B) adjustable speed drives
(C) transformers
(D) electromechanical relays

23
10. As per the power quality indices, which of the following applications face low power quality problems?
(A) HVAC power panels
(B) lighting power distribution panel
(C) elevators
(D) large motors
CONCLUSION:
Power quality maintenance is an important aspect in the economic operation of a system. Various power
quality problems may lead to another undesirable problem. Proper mitigation devices may be used to maintain
the level of power quality as desired. Power-quality standards address limits to harmonics and power-quality
events at the point of common coupling in power systems. Emphasis is given to causes and effects of current
harmonics on different power system components.
REFERENCES :
1. Dugan, Roger C.; Mark McGranaghan; Surya Santoso; H. Wayne Beaty (2003). Electrical Power Systems Quality. McGraw-Hill Companies, Inc. ISBN 978-0-07-138622-7. 2. Meier, Alexandra von (2006). Electric Power Systems: A Conceptual Introduction. John Wiley & Sons,
Inc. ISBN 978-0471178590. 3. Heydt, G.T. (1991). Electric Power Quality. Stars in a Circle Publications. Library Of Congress 621.3191.
Bollen, Math H.J. (2000). Understanding Power Quality Problems: Voltage Sags and Interruptions. New York: IEEE Press. ISBN 0-7803-4713-7. 4. Sankaran, C. (2002). Power Quality. CRC Press LLC. ISBN 978-0-8493-1040-9.
5. Baggini, A. (2008). Handbook of Power Quality. Wiley. ISBN 978-0-470-06561-7.
ASSIGNMENTS :
1. What do you understand about power quality issues? Discuss all the power quality issues in brief.
2. Explain the cause and effect with respect to power quality point of view? What is an immunity of the
equipment? Discuss the treatment criteria for a machine.
3. Define and technically describe following terms: (1)Linear loads (2)Inrush current (3)Power
factor(displacement) (4)Voltage swell (5)Transient
4. What are the power quality standards? Discuss responsibilities of supplier and user of electrical power with respect to power quality
5. Define the following terms 1. Displacement Power Factor 2. Flicker 3. Nonlinear load
6. Explain following terms related to power quality. (1) Grounding (2) Noise (3) Notch.

24
7. Explain all power quality concerns in brief.
8. What are CBEMA and ITIC graphs? Draw and discuss the ITIC graph in detail
9. Explain different power quality solution techniques in detail.
10. Define the term “Power Quality”. Discuss the common power frequency disturbances with suitable
examples.