course overview and introduction -...
TRANSCRIPT

Course Overview and Introduction
Probabilistic Graphical Models
Sharif University of Technology
Soleymani
Spring 2017

Instructor: Mahdieh Soleymani
Email: [email protected]
Website: http://ce.sharif.edu/cources/95-96/2/ce768-1
Lectures: Sun-Tue (13:30-15:00) , Room 202
Teacher assistants:
Maryam Ramezani
Amirhossein Akbarnejad
Seyed Ali Osia
Seyed Mohammad Chavosian
Course info
2

Text book
D. Koller and N. Friedman, “Probabilistic Graphical Models: Principles and
Techniques”, MIT Press, 2009.
M.I. Jordan,“An Introduction to Probabilistic Graphical Models”, Preprint.
Other
C.M. Bishop,“Pattern Recognition and Machine Learning”, Springer, 2006.
Chapters 8-11,13.
K.P. Murphy,“Machine Learning:A Probabilistic Perspective”, MIT Press, 2012.
3
Evaluation policy
Mid-term: 25%
Final: 35%
Home works & course works: 40%
4
Why using probabilistic models?
5
Partial knowledge of the state of the world
Noisy or incomplete observations
We may not know or cover all the involved phenomena in our
model
Partial knowledge can cause the world seems to be stochastic
To deal with partial knowledge and/or stochastic worlds
we need reasoning under uncertainty

Why using a graph for representation?
6
Intuitively appealing interface by which we can models
highly interacting sets of variables
It allows us to design efficient general purpose inference
algorithms

Probability review
7
Marginal probabilities
𝑃 𝑋 = 𝑦 𝑃(𝑋, 𝑌 = 𝑦)
Conditional probabilities
𝑃 𝑋|𝑌 =𝑃(𝑋,𝑌)
𝑃(𝑌)
Bayes rule:
𝑃 𝑋|𝑌 =𝑃 𝑌|𝑋 𝑃(𝑋)
𝑃(𝑌)
Chain rule:
𝑃 𝑋1, … , 𝑋𝑛 = 𝑖=1𝑛 𝑃(𝑋𝑖|𝑋1, … , 𝑋𝑖−1)

Medical diagnosis example
8
Representation
𝑑1 𝑑2 𝑑4
𝑓1 𝑓2 𝑓4𝑓3
𝑑3
𝑓5
diseases
Findings
(symptoms & tests)
𝑃(𝑓1|𝑑1)
𝑃(𝑓2|𝑑1, 𝑑2, 𝑑3)
𝑃(𝑓3|𝑑3)
…

PGMs as a framework
9
General-purpose framework for representing uncertain
knowledge and learning and inference in uncertain
conditions.
A graph-based representation as the basis of encoding a
complex distribution compactly
allows declarative representation (with clear semantics) of the
probabilistic knowledge

PGMs as a framework
10
Intuitive & compact data structure for representation
Efficient reasoning using general-purpose algorithms
Sparse parameterization (enables us to elicit or learn
from data)

PGM: declarative representation
11
Separation of knowledge and reasoning
We need to specify our model for a specific application
that represents our probabilistic knowledge
There is a general suite of reasoning algorithms that can
be used.

History
12
Wright 1921, 1934 and before
Bayesian networks are independently developed by
Spiegelhalter and Lauritzen in statistics and Pearl in
computer science in the late 1980’s
First applications (1990’s): expert systems and information
retrieval

PGMs: some application areas
Machine Learning and computational statistics
Computer vision: e.g., segmenting and denoising images
Robotics: e.g., robot localization and mapping
Natural Language Processing
Speech recognition
Information Retrieval
AI: game playing, planning
Computational Biology
Networks: decoding messages (sent over a noisy channel)
Medical diagnosis and prognosis
…
13

Graphical models: directed & undirected
14
Two kinds of graphical models:
Directed: Bayesian Networks (BNs)
Undirected: Markov Random Fields (MRFs)
A B
C
D
A B
C D
Causality relations Correlation of variables

Graphical models: directed & undirected
15
[Pathfinder Project, 1992]
Representation, inference, and learning
16
We will cover three aspects of the graphical models:
Representation of probabilistic knowledge
Inference algorithms on these models
Using the data to acquire the distribution
Representation, inference, and learning
17
Representation: When variables tends to interact directly
with few other variables (local structure)
Inference: answering queries using the model
algorithms for answering questions/queries according to the
model and/or based given observation.
Learning of both the parameters and the structure of the
graphical models

Medical diagnosis example
18
Representation
Inference: Given symptoms, what disease is likely?
Eliciting or learning the required probabilities from the
data
𝑑1 𝑑2 𝑑4
𝑓1 𝑓2 𝑓4𝑓3
𝑑3
𝑓5
diseases
Findings
(symptoms & tests)

Representation: summary of advantages
19
Representing large multivariate distributions directly and
exhaustively is hopeless:
The number of parameters is exponential in the number of
random variables
Inference can be exponential in the number of variables
PGM representation
Compact representation of the joint distribution
Transparent
We can combine expert knowledge and accumulated data to learn
the model
Effective for inference and learning

Graph structure
20
Denotes conditional dependence structure between
random variables
One view: Graph represents a set of independencies
Another view: Graph shows a skeleton for factorizing a joint
distribution

Image denoising example
21 [Bishop]
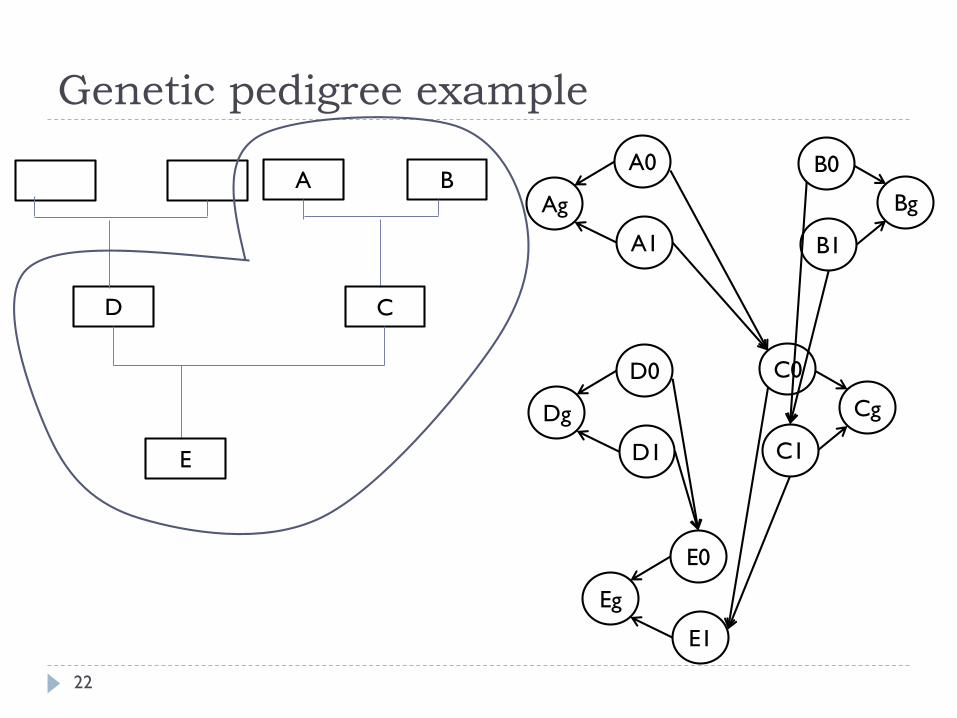
Genetic pedigree example
22
A B
CD
E
A0
A1
Ag
B0
B1
Bg
C0
C1
Cg
D0
D1
Dg
E0
E1
Eg
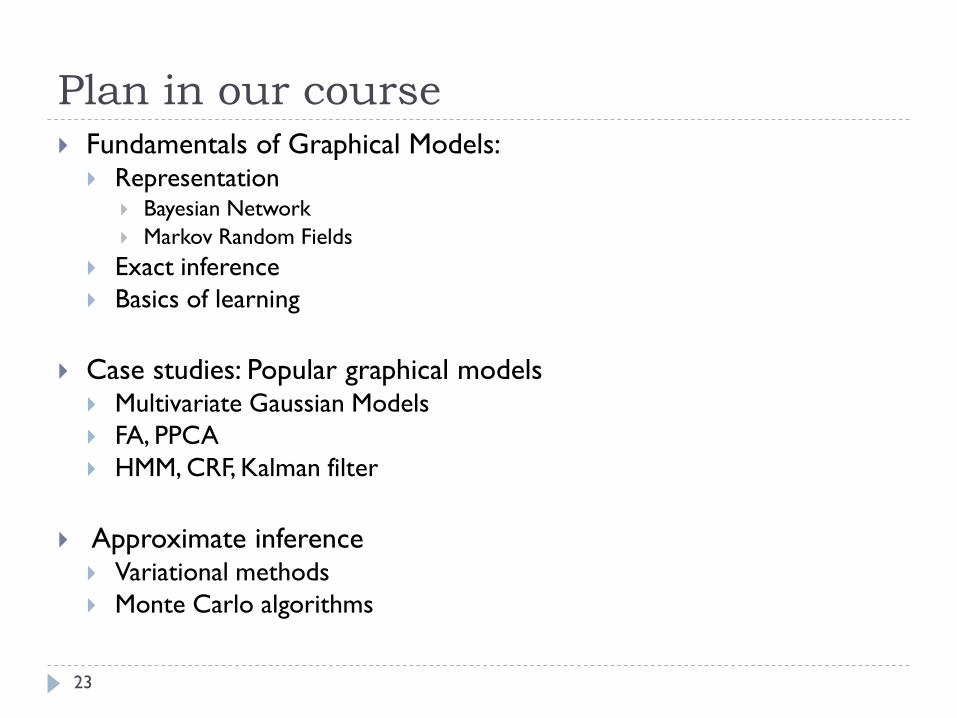
Plan in our course
23
Fundamentals of Graphical Models: Representation
Bayesian Network
Markov Random Fields
Exact inference
Basics of learning
Case studies: Popular graphical models Multivariate Gaussian Models
FA, PPCA
HMM, CRF, Kalman filter
Approximate inference Variational methods
Monte Carlo algorithms