cover page design concept: represents the fusion of … the fusion of sony’s hardware, content and...
TRANSCRIPT


Cover page design concept:Represents the fusion of Sony’s hardware, content and services into a united group positioned to advance to new heights.

1
246
16333446
Contents
Financial Highlights
Business Overview
Letter to Shareholders
Review of Operations
Board of Directors and Corporate Executive Officers
Financial Section
Supplemental Information
For more information about Sony’s financial information, corporate governance and CSR, please refer to the following websites.
2009 Annual Report on Form 20-F http://www.sony.net/SonyInfo/IR/library/sec.html
Corporate Governance Structure http://www.sony.net/SonyInfo/IR/governance.html
CSR Report http://www.sony.net/SonyInfo/Environment/index.html
2
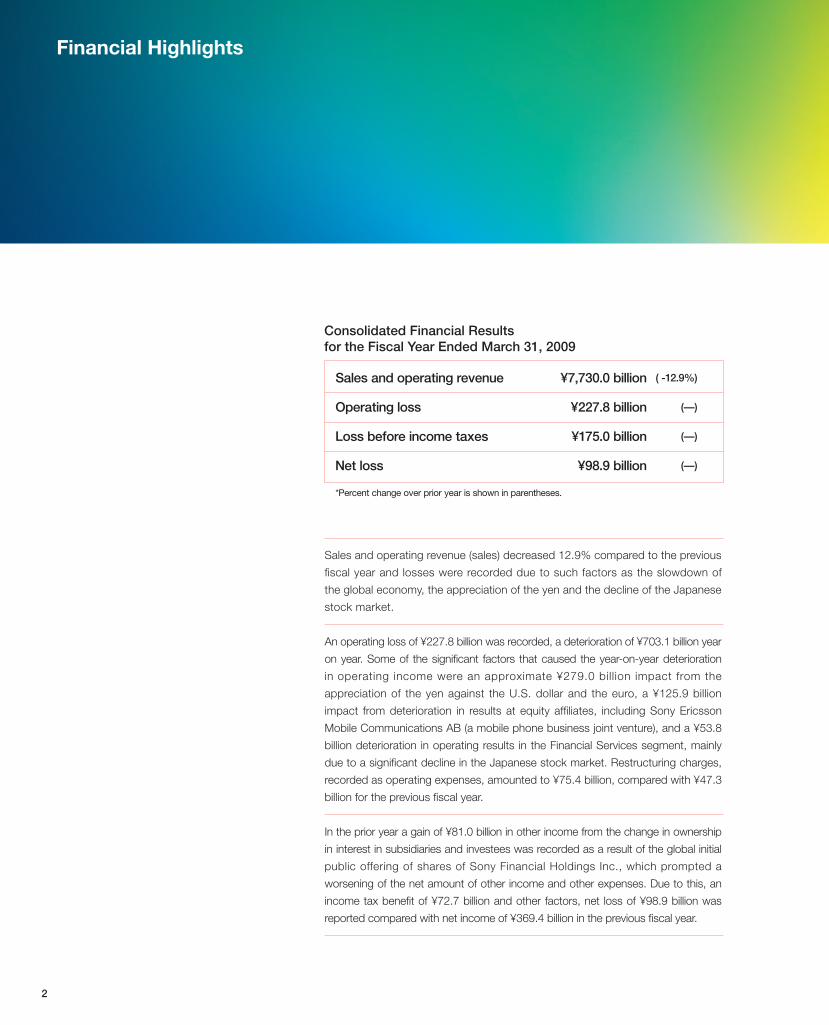
Financial Highlights
Sales and operating revenue ¥7,730.0 billion ( -12.9%)
Operating loss ¥227.8 billion (—)
Loss before income taxes ¥175.0 billion (—)
Net loss ¥98.9 billion (—)
*Percent change over prior year is shown in parentheses.
Consolidated Financial Results for the Fiscal Year Ended March 31, 2009
Sales and operating revenue (sales) decreased 12.9% compared to the previous
fiscal year and losses were recorded due to such factors as the slowdown of
the global economy, the appreciation of the yen and the decline of the Japanese
stock market.
An operating loss of ¥227.8 billion was recorded, a deterioration of ¥703.1 billion year
on year. Some of the significant factors that caused the year-on-year deterioration
in operating income were an approximate ¥279.0 billion impact from the
appreciation of the yen against the U.S. dollar and the euro, a ¥125.9 billion
impact from deterioration in results at equity affiliates, including Sony Ericsson
Mobile Communications AB (a mobile phone business joint venture), and a ¥53.8
billion deterioration in operating results in the Financial Services segment, mainly
due to a significant decline in the Japanese stock market. Restructuring charges,
recorded as operating expenses, amounted to ¥75.4 billion, compared with ¥47.3
billion for the previous fiscal year.
In the prior year a gain of ¥81.0 billion in other income from the change in ownership
in interest in subsidiaries and investees was recorded as a result of the global initial
public offering of shares of Sony Financial Holdings Inc., which prompted a
worsening of the net amount of other income and other expenses. Due to this, an
income tax benefit of ¥72.7 billion and other factors, net loss of ¥98.9 billion was
reported compared with net income of ¥369.4 billion in the previous fiscal year.

3
Sales and operating revenue
8.38.9
7.7
(Yen in trillions)
2007 2008 2009
Net income (loss)
126.33.8%
10.8%
-3.1%
369.4
(98.9)
(Yen in billions)
2007 2008 2009
Operating income (loss)
150.4110.5
475.3421.8
(227.8)(127.3)
(Yen in billions)
2007 2008 2009
Capital expenditures
414.1
335.7 332.1
(Yen in billions)
2007 2008 2009
Cash flows from operating activities Cash flows from investing activities Free cash flow (Combined total of cash flows from operating and investing activities)
Free cash flow (excluding Financial Services)
(125.5)
504.2305.6
(431.1)
519.1
112.7
(487.4)
(14.9)(374.7)
(Yen in billions)
2007 2008 2009
R&D investment
543.9 520.6 497.3
(Yen in billions)
2007 2008 2009
Net income (loss) Return on Equity (ROE)
Operating income (loss) Operating income (loss), as adjusted, which
excludes equity in net income (loss) of affili- ated companies and restructuring charges
Note: Years ended March 31

4
Electronics
Game
Business Overview (Fiscal Year in Review)
Japan U.S.A. Europe Other
*Year ended March 31
*Percentage of sales and operating revenue to outside customers
*Year ended March 31
*Percentage of sales and operating revenue to outside customers
*Sales and operating revenue accounted for by customers in each particular region
23.6%
24.2%
25.7%
26.5%
2009
Proportion of sales* by business segment and Electronics sales by product category
Proportion of sales* by region
12.7%
65.1%
9.3%
6.8%6.1%
Audio (9%)
Electronics
Video (21%)
Televisions (25%)
Information and Communications (19%)Semiconductors (4%)Components (13%)
Other (9%)
2009
The Electronics business comprises audio, video, televisions, information and communications, semiconductors, components and other products. Sales and operating revenue in the Electronics business decreased 17.0% year on year, to ¥5,488.0 billion. Sales to outside customers decreased 15.2%. Unit sales increased for BRAVIA™ LCD televisions, but declined significantly for products such as Handycam® video cameras, Cyber-shot™ compact digital cameras and VAIO™ PCs.
The absence of the previous year’s sales of LCD rear-projection televisions and CRT televisions, both businesses that Sony has exited, also contributed to the decline in segment sales.
The business recorded a ¥168.1 billion operating loss, a deterioration of ¥609.9 billion. This result was primarily due to the negative impact from the appreciation of the yen; the higher cost of sales ratio, due to intensified price competition and deterioration in the business environment; and a decline in equity in net income (loss) for Sony Ericsson Mobile Communications AB.
Operating income decreased significantly for such products as Cyber-shot compact digital cameras, VAIO PCs, BRAVIA LCD televisions and Handycam® video cameras.
Sony’s Game business consists of game consoles and software offered by Sony Computer Entertainment Inc. (SCE).Game business sales and operating revenue declined 18.0% year on year, to ¥1,053.1 billion. Overall hardware sales decreased, mainly due to the impact of the appreciation of the yen against the U.S. dollar and the euro, in addition to a decrease in unit sales of PlayStation®2 (PS2).
Despite an increase in sales of software for PLAYSTATION®3 (PS3™), overall sales of software declined as a result of the appreciation of the yen against the U.S. dollar and the euro, as well as the decline in PS2 software sales.
The business posted an operating loss of ¥58.5 billion, an improvement of ¥66.1 billion. The decrease in operating loss was due to an improvement in the operating performance of the PS3™ business as a result of hardware cost reductions and increased software sales despite the impact of the decrease in sales in the PS2 business.
6,072.46,613.8
441.8251.3
5,488.0
(168.1)
(Yen in billions)
2007 2008 2009
1,016.8
1,284.2
1,053.1
(232.3) (124.5) (58.5)
(Yen in billions)
2007 2008 2009
Sales Operating income (loss)
Sales Operating loss
Electronics Game Pictures Financial Services All Other

5
This category encompasses the music recording businesses of Sony Music Entertainment Inc. (SME) and Sony Music Entertainment (Japan) Inc. (SMEJ), and the network services-related business of So-net Entertainment Corporation (So-net). Aggregate sales and operating revenue of businesses in this category rose 41.2% year on year, to ¥539.6 billion. The increase in sales was largely attributable to the consolidation of SONY BMG, effective October 1, 2008. Excluding the impact of SME’s consolidation, sales decreased, due primarily to lower sales at SMEJ, as well as the receipt of a settlement payment related to copyright infringement claims in the prior fiscal year. This was partially offset by an increase of fee revenue from broadband connection services at So-net.
Operating income amounted to ¥30.4 billion, down 50.1%. The decline in operating income was mainly due to a ¥10.0 billion gain on the sale of the urban entertainment complex “The Sony Center am Potsdamer Platz” in Berlin, Germany, and the receipt of a settlement payment related to copyright infringement claims, both of which were reported in the previous fiscal year.
Pictures
Financial Services
All Other
The Pictures business centers on motion pictures and television programming distributed by Sony Pictures Entertainment (SPE).Sales and operating revenue in the Pictures business decreased 16.4% year on year, to ¥717.5 billion. Motion pictures revenues were down primarily due to lower home entertainment revenues owing to an accelerated contraction in this market, brought on principally by the global economic downturn, as well as fewer films being sold into the home entertainment market. The decline in sales also reflected the fact that sales in the previous fiscal year had benefited from the sale of a bankruptcy claim against a former licensee for film and television products. Theatrical releases contributing to sales included Hancock, Quantum of Solace and Paul Blart: Mall Cop.
Operating income in the business fell 48.9%, to ¥29.9 billion. This decrease was primarily due to the lower home entertainment sales and the absence of the previous year’s sale of the bankruptcy claim noted above. Television operating income benefited from higher advertising revenues from several international channels.
Sony’s Financial Services business is composed of Sony Financial Holdings Inc. (SFH) and its consolidated subsidiaries, Sony Life Insurance Co., Ltd. (Sony Life), Sony Assurance Inc. and Sony Bank Inc., as well as Sony Finance International Inc.Financial Services revenue declined 7.4% year on year, to ¥538.2 billion. The overall decrease in Financial Services revenue was due to a decrease in revenue at Sony Life. Revenue at Sony Life was ¥430.5 billion, a decrease of 7.2%. Sony Life’s revenue result reflected an increase in net valuation losses from convertible bonds and an increase in impairment losses on equity securities in the general account, as well as an increase of net losses from investments in the separate account. These losses were partially offset by an increase in revenue from insur-ance premiums reflecting a higher policy amount in force.
The business recorded an operating loss of ¥31.2 billion, a deterioration of ¥53.8 billion. The overall operating loss was mainly due to a deterioration in profitability at Sony Life, which reported an operating loss of ¥29.8 billion, compared to operating income of ¥11.5 billion in the previous fiscal year, as a result of a significant decline in the Japanese stock market.
Note: Results for Sony Life are based on generally accepted accounting principles in the United States (U.S. GAAP). Accordingly, the results for SFH and Sony Life shown here differ from the results published by the two companies in Japan, which are based on Japanese accounting standards.
Sony has changed its business segment classification to reflect the company’s reorganization as of April 1, 2009. Sony will report its operating results in line with new business segments from the first quarter of the fiscal year ending March 31, 2010.
Notes: 1. Years ended March 31 2. Sales = Sales and operating revenue 3. Includes intersegment transactions
966.3857.9
717.5
26.7 58.5 29.9
(Yen in billions)
2007 2008 2009
649.3538.2
84.1
581.1
22.6
(31.2)
(Yen in billions)
2007 2008 2009
355.1 382.2
539.6
32.8 60.8 30.4
(Yen in billions)
2007 2008 2009
Sales Operating income
Revenue Operating income (loss)
Sales Operating income

Letter to Shareholders: A Message from Howard Stringer, CEO

7
I am addressing you all today at a significant turning point in the
history of Sony. The fiscal year ended March 31, 2009 (fiscal year
2008) saw unprecedented economic turmoil the likes of which we
could not have imagined just one year earlier. The global economic
crisis, combined with the pronounced strength of the yen, signifi-
cantly impaired the health of our operating results—and those
of many other companies—with a speed and ferocity that were
unparalleled in recent history. This impact put us in an unsettling
financial situation and gave me, and many of you, rightful cause for
concern.
Despite the challenging nature of the past fiscal year, the
global economic crisis has presented us with an opportunity to
re-position ourselves to take on our competitors and be poised to
capitalize when the economy turns around. Before I discuss that,
however, I would like to mention some of the highlights of fiscal
year 2008, which demonstrate what Sony is capable of achieving
even in adverse economic situations and serve as beacons of
inspiration during these tough times.
• In the past fiscal year, we developed and launched some of the
most technologically innovative and unique products on the
market today:
• TheBRAVIA™ ZX1 is the world’s thinnest*1 and lightest*2 LCD
TV and features LED edge lighting (instead of the typical back
lighting). This elegant set can easily be hung on a wall despite
having a 40-inch screen, and it connects wirelessly to other
devices.

8
• TheHandycam® XR500V video camera features the back-
illuminated Exmor R CMOS image sensor, which allows users
to take high-quality video even in low-light conditions.
• TheCyber-shot™ HX1 compact digital camera is the world’s
first camera to allow users to capture wide-angle, panoramic
views by holding down the shutter button and sweeping the
camera across a range of 224 degrees, and it can capture
images at 10 frames per second to record action like a high-
end television camera at a sports event.
• TheVAIO™ P Series PC is the world’s lightest*3 8-inch note-
book PC, which has garnered acclaim for its unique ultra-
wide design, GPS and other functions.
• And finally, theXSeriesWalkman® digital music player
features a 3-inch OLED touch screen, digital noise canceling
functions, the S-Master™ digital amplifier aswell asWi-Fi
connectivity, which together provide a unique user experience
that brings together ease-of-use and superb audio and video
quality.
• Sony’s 4K digital cinema technology, which now has the back-
ing of four major studios (including, of course, Sony Pictures),
is taking the movie-viewing experience to a whole new level.
Featuring four times the resolution of Full HD and twice that of
the competing standard, this technology now has support from
theater chains in the U.S., and puts Sony at the forefront of
digital cinema technology.
• Wenearlydoubled thePLAYSTATION®3 (PS3™) installed base
over the year, while also reducing the cost of the hardware. As
of June 2009, PlayStation®Network had more than 24 million
registered accounts worldwide, through which more than 450
million pieces of content have been downloaded, and more
than 500 game titles, nearly 1,900 movies and more than 9,400
episodes of TV shows can be enjoyed. Through this progress,
we have built the foundation for what we hope will become a
robust and successful business.
• Blu-ray Disc™ has become the standard next-generation optical
disc format, which was good news not only for Sony and the
industry as a whole, but for millions of movie lovers around the
world. The number of Blu-ray Disc-compatible players—including
players, recorders, and PS3™—is growing sharply, with by far
the largest overall share coming from Sony.

9
• Films like Hancock,starringWillSmith,andQuantum of Solace,
the latest James Bond film, delighted audiences around the
world as Sony Pictures had one of its biggest years on record
at the worldwide box office, showing that demand for entertainment
is strong even in these trying economic times.
• Altogether, Sony’s music businesses were highly profitable in
fiscal year 2008, despite difficultmarket circumstances.We
acquired Bertelsmann AG’s half of the SONY BMG*4 joint
venture and welcomed the company back into the Sony Group
as Sony Music Entertainment (SME). Sony Music Entertainment
(Japan) Inc. increased its share to top the Japanese market,
and Sony/ATV Music Publishing grew its share of new releases
in the U.S. music publishing market, on its way to recording a
substantial increase in operating profit over the previous year.
Whileitisencouragingtoacknowledgethesesuccesses,thefact
remains that fiscal year 2008 was one of the most difficult years
in this company’s long history. It is indisputable that a substantial
portion of this is attributable to the global economy and the
strength of the yen, but the inescapable truth is that despite our
restructuring and cost-cutting efforts in past years, the downturn
exposed stresses and vulnerabilities in our company that have
built up over a long period of time. Addressing this—and helping
assure that it does not happen again—is my top priority.
Restructuring Plan/Progress
The first and most urgent steps to respond to the global economic
crisis in September 2008 were to quickly adjust our production
levels and to announce and engage in immediate restructuring
and other cost-cutting initiatives.
Below are some of the initiatives we announced*5 and the
progress we have made so far. As you can see, our efforts are
progressing more quickly than originally announced.
• Achieving cost reductions throughout the Sony Group of more
than ¥250 billion in fiscal year 2009 compared to fiscal year
2008throughrestructuringandotherinitiatives.Wenowbelieve
that these initiatives will reduce costs by more than ¥300 billion.
*1 The thinnest part of consumer-use televisions, as of August 28, 2008 *2 40-inch consumer-use televisions (monitor only), as of August 28, 2008*3 As of December 2008*4 SONY BMG MUSIC ENTERTAINMENT was a 50-50 joint venture be-
tween Sony Corporation of America and Bertelsmann AG until October 1, 2008, at which time Sony purchased the remaining half of the company, which was renamed Sony Music Entertainment (SME).
*5 Announced in December 2008 and January 2009
10
• Rationalizing our manufacturing operations, including reduc-
ing our 57 manufacturing sites by approximately 10%, and
furthering the shift to manufacturing in low-cost areas and with
OEM/ODM partners. Since the announcement, we have closed
or announced the closing of eight manufacturing sites.
• Streamlining our workforce through work reassignments and
outplacements, among others, as well as reducing headcount
in the Electronics business by approximately 8,000—for which we
are on track—in addition to reducing our temporary workforce
by more than 8,000, which we have since accomplished.
In addition, we have adjusted production, lowered inventory
levels, reduced marketing and other operational expenses, and
curtailed or delayedportions of our investment plans.Wewill
continue these and other efforts to improve efficiency and will
wage a continuous battle to make this company leaner, quicker
and stronger and, therefore, better able to innovate, lead and
flexibly navigate in these increasingly competitive times.
Reorganization
Sony’s true transformation began with the reorganization of
its Electronics and Game businesses, undertaken to enhance
competitiveness, improve profitability and accelerate innovation and
growth, so that we may strengthen our position in the continuously
challenging and evolving industries in which we operate.
Under the reorganization, effective on April 1, Sony’s Electron-
ics and Game businesses are now merged and reconfigured as
two strong new groups: the Consumer Products & Devices Group
and the Networked Products & Services Group. The first group
represents our traditional and vital hardware; the second will
provide new network differentiation which, when married to our
hardware, will spearhead our growth going forward.

11
The Consumer Products & Devices Group, which brings
together consumer electronic categories such as televisions,
digital cameras and camcorders,
home audio and home video, is
established to enhance product
compet i t i veness and increase
t h e s p e e d a n d e f f i c i e n c y o f
operat ions in order to improve
prof i tabi l i ty and sustain growth
in our v i ta l hardware offer ings.
In add i t ion, by in tegrat ing the
d e v i c e b u s i n e s s , i n c l u d i n g
batter ies and semiconductors, into the same group, we
aim to strengthen the coordinat ion of development and
strategy planning between f ina l products and their key
components. I have asked Hiroshi Yoshioka, with experience in
both Sony’s home and portable electronics business divisions, to
head this organization.
The Networked Products & Services Group is comprised
of Sony Computer Entertainment, VAIO personal comput-
ers,mobile products includingWalkman® digital music play-
ers, and Sony Media Software and Services, which is developing
a common service platform across Sony products. It also
includes a new incubation group tasked to develop new products
and serv ices . The mandate of
this group is to accelerate innova-
t ion of our networked products
and services to deliver new and
exciting user experiences to our
customers in part by maximizing
the coordination and integration
between the P layStat ion ® and
c o n s u m e r e l e c t r o n i c s b u s i -
nesses. Integral to this process
is the utilization and expansion of the PlayStation® Network
service platform. Kaz Hirai, concurrent President of Sony
Computer Entertainment, will bring his experience with both
networked products and network services as he leads this
strategically important group.
To support these two new business groups in terms of soft-
ware development and manufacturing, procurement and
logistics operations, we have created two cross-company plat-
forms:
Hiroshi YoshiokaCorporate Executive Officer,Executive Deputy President
Kazuo HiraiCorporate Executive Officer,Executive Vice President

12
The Common Software and Technology Platform is tasked to
develop and implement common software solutions and provide
coordinated software development
services to each business group
so our networked products and
services can communicate seam-
l e s s l y w i t h a c o m m o n u s e r
interface. Through this platform,
we wi l l streamline and optimize
t h e s o f t w a r e d e v e l o p m e n t
p r o c e s s a c r o s s t h e s e t w o
n e w b u s i n e s s g r o u p s a n d
p roceed w i th our R&D in a coord inated manner. T h i s
p l a t f o r m i s h e a d e d b y K e i i c h i r o S h i m a d a , w h o
understands the vital role software plays in consumer electronics
and has already successfully spearheaded the adoption of various
open standards across Sony.
The Manufacturing, Logistics, Procurement and CS Platform will
provide the most efficient supply chain solutions for the two
new business groups. For the first time in Sony’s history, all
electronics business groups and Sony Computer Entertain-
ment are relying on centralized manufacturing, procurement and
logistics. The platform is fully leveraging the Sony Group’s scale in
procurement, promoting component standardization, and optimizing
the allocation of in-house and out-
sourced manufacturing in order to
achieve further cost reductions, as
well as to enhance product quality
and green management. Yutaka Na-
kagawa, who initiated Sony’s “Asset
Light” strategy in the semiconductor
business, has been chosen to sim-
plify and streamline our operations
by running this important new group.
Under this strong, new generation of Sony leadership, this
reorganization wil l steer the Sony Group in an even more
dynamic and innovative direction while transforming it into a more
integrated and nimble global company. The new management
team in place is digital ly savvy, globally experienced and
determined to connect to customers who are reinventing their
futures and their personal aspirations every day in the digital,
networked world.
Yutaka NakagawaCorporate Executive Officer,Executive Deputy President
Keiichiro ShimadaCorporate Executive,Senior Vice President

13
Mission and Action Plan
As I mentioned in my letter to you last year, our mission is to
become a leading global provider of networked consumer electronics,
entertainment and services. To do this, we must strengthen each
of the pillars of our core businesses and be coordinated in our
efforts to innovate for further growth.
Innovation has always been one of Sony’s celebrated strengths,
and it is through innovation that we will continue to develop the
unique products, content and services that deliver rich user
experiences and inspiration to our customers.
This innovation is what has driven Sony’s success in the
past, and this in turn has driven our brand—one of the stron-
gest weapons in our arsenal—to what it is today. In a survey
conducted by Harris Interactive, Sony is ranked as the third
most admired company, ahead of al l of our competitors,
number three in the Business Superbrands survey of U.K. business
professionals and number four in the Brand Japan Survey.
To let this innovation drive Sony to new heights, we need to
challenge our engineers, designers and producers to enhance our
exciting hardware with a new focus on the software and content
that will help establish our differentiation going forward, nurture an
“Asset Light” corporate structure and efficiently use our capital so
that it will generate sufficient returns on our investments.
Strengthening Networked Software and Content
I have always been enthusiastic about hardware. Sony, as you all
know, has a long and proud history of developing groundbreaking
hardware that has excited customers and first created and then
enhanced our brand. However, customers now expect product
interconnectivity and the convenience that networking can pro-
vide, and we believe that we are uniquely positioned to make
great, innovative hardware with these capabilities. As a result, I am
now equally as enthusiastic about networks as I am about hardware.
Our networked products and services will differentiate us and
make Sony products more valuable to the consumer, and will also
provide more reasons for consumers to buy and use many Sony
products together, with an interoperable Sony solution.
The switch from making pure hardware to making networked
products where the software and user experience are as important
asthehardwareitselfisnotashort-termeffort.Weareconnecting
more and more of our product groups to the network and to each
other, and developing networked content, as well as the software
that ties everything together.
A notable example is the Sony-created PlayStation®Network,
which has been operational since the November 2006 launch of
PS3™ and is used by 24 million customers. And this is only the
beginning. Going forward, we will expand these network services
to a variety of Sony consumer electronics products.

14
By uniting our Electronics and Game business groups and by
establishing a common software development platform, we are
in a better position than ever to innovate and connect seamlessly
through network services. Also, with the enormous library of
pictures, music and game content possessed by the Sony
Group, we are one of the largest entertainment companies in the
world. This gives us the ability to explore innovative entertainment
initiatives with great speed, flexibility and creativity.
Our diverse content libraries and redoubled focus on the
development of software and user interfaces will bring differentiation
and additional value to our products, and will help make our
vision of a networked world a reality.
Becoming “Asset Light”
The time has come for us to adopt a more horizontal business
model—i.e., an “Asset Light” model that works with third
parties—formanyof our businesses.With certain businesses,
minimizing our fixed assets in order to maximize business flexibil-
ity, while maintaining our differentiating technology through con-
tinued research and development, is an idea that has become a
priority over the past few years, and is the most appropriate busi-
ness model for today.
The first major step in this process was the March 2008 sale
of the production equipment that manufactures Cell and RSX
processors used in PS3™. Since then we have continued to
explore additional opportunities to engage third parties to conduct
some of our manufacturing and other operations. This will make
us leaner, stronger, quicker, more adaptable and better able to
flexibly innovate and enter and exit businesses with greater ease.
Improving Our Financial Position
The immediate and lasting improvement of our operating
performance is crucial to achieving our mission. The restructuring
measures and other cost reductions I described above are
expected to reduce our costs by more than ¥300 billion.
In addition, Mr. Nakagawa has already announced initiatives
that will substantially reduce our procurement costs by consolidating
our procurement activities across product lines, reducing the
number of component suppliers and optimizing pricing schemes.
Furthermore, we are continuing efforts to reduce costs and
rationalize operations across all divisions of the company.
Additional points of focus include the streamlining of our sales and
marketing organizations, improving our inventory planning and
supply chain management, reducing our level of inventory, and
returning the TV business, which has struggled to make money
despite achieving a very strong market share, back to profitability.
By further standardizing the design of our TVs worldwide, optimizing
our LCD panel procurement and shifting assembly to third-party

15
partners, we can increase our cost competitiveness while
maintaining the technological and design edge for which Sony is
known worldwide.
These initiatives and others will improve our profitability and
cash flow, but this is just the beginning. Going forward, we must
also be focused on how we use our capital and make sure that
our investments generate sufficient returns on capital. The more
efficient we become, the more resources we will have to incubate
new businesses and to invest in the R&D and acquisitions that will
drive our innovation.
Closing
Our transformation will not be a one-time restructuring, but rather
an ongoing process of driving growth, efficiency and innovation
acrossour businesses.With improvedoperatingperformance
and cash flow, a lighter asset base and a stronger software and
network infrastructure, we will be in a solid position to strengthen
our core businesses while offering new alluring products that will
beckon to our customers.
Weareall firmlycommitted to leadingSonywith the innova-
tive spirit that is embedded in its DNA. It is a privilege to fight for
a great company like Sony, and with the seriousness of purpose
that this management team possesses, I know we can succeed
in making Sony greater than ever.
So, I encourage you to get excited about what Sony is doing
because it is still the most powerful technology and entertain-
mentbrand in theworld.Wearecommitted to transforming this
company and are determined to prevail. On behalf of the management
and all of the employees at Sony, I thank you for your continued
support.
June 19, 2009
Howard Stringer
Chairman, CEO and President
Representative Corporate Executive Officer

Review of Operations: Electronics and Game Businesses
Electronics and Game
18

17
Review of Operations in the Electronics Business
In fiscal year 2008—the year ended March 31, 2009—Sony’s
Electronics business faced a harsh operating environment,
owing to a slump in demand brought on by the global economic
downturn, as well as intensified price competition and the
continued appreciation of the yen. Under these circumstances,
Sony sought to heighten the appeal of products in each
category while also striving to improve profits and strengthen
competitiveness through ongoing efforts to reduce costs and
reassess operations.
Overview of Key Businesses
Despite waning demand attributable to the economic slowdown,
the global market for LCD televisions in fiscal year 2008 reached
approximately 107 million units, an increase of 24% from the
previous fiscal year. During the period, Sony launched a wide
range of new models that highlight our emphasis on technology
and design. These included a slim-profile 40-inch model that is a
mere 9.9mm at its thinnest point; models with Motionflow 240Hz
technology, which quadruples the frame rate to deliver smooth,
sharp reproduction of high-speed sports footage; a model with
a proprietary energy-saving motion sensor that detects the
presence or absence of people in the room and automatically turns
the television on or off accordingly; and models incorporating a
newly developed backlight that achieves industry-leading energy
efficiency. Sales of Sony LCD televisions for the fiscal year were
about 15.2 million units, an increase of 43% from the preceding
period, giving us the second-largest share of the global market (Sony
estimate, as of May 2009).
While anticipating that the harsh business environment for LCD
televisions will continue as a consequence of falling unit selling
prices and the deterioration of economic conditions, Sony will
continue working to further enhance product innovation and
competitiveness, as well as to improve the speed and efficiency of
operations.
BRAVIA™ LCD televisionKDL-46V
Unit sales of LCD televisions and market share
6.3
10.6
15.2
(Millions of units)
2007 2008 2009
12% 12% 14%
*Years ended March 31
Cyber-shot™ Digital Camera DSC-HX1

18
The compact digital camera market saw a lull in replacement
demand—particularly in Europe and the United States—while
the impact of the economic slowdown dulled growth in emerging
markets. As a consequence, worldwide unit sales in the period
were level with those of the previous fiscal year. Sales of Sony
compact digital cameras decreased 6% from the previous fiscal
year to approximately 22 million units. Nevertheless, Sony retained
its position as a global industry leader, with a market share of 21%
(Sony estimate, as of May 2009).
During the period under review, Sony released a number of
new models designed to respond to a variety of customer needs.
These include models in the Cyber-shot™ W series, aimed at price-
conscious consumers; the Cyber-shot T series, which includes slim
(13.9mm)-profile cameras loaded with high-performance features
that are uniquely suited to shooting high-definition movies; and
the Cyber-shot G series, featuring cameras with built-in wireless
Internet connectivity that enables users to upload images to photo
sharing sites with ease. Fiscal year 2008 also saw the launch of
the first model in the Cyber-shot HX series, which is the first ever
compact digital camera to be equipped with a complementary
metal oxide semiconductor (CMOS) image sensor, and allows for
high-speed and panorama shooting.
Sony is a relative newcomer to digital single lens reflex (SLR)
cameras, having entered this market in fiscal year 2006. Fiscal year
2008 saw the launch of the α900—a high-end model mounted
with a 24.6-megapixel, 35mm full-frame Exmor™ CMOS image
sensor—in the α (“alpha”) series, which now encompasses a
complete lineup of models, from entry-level to high-end. Sales of
Sony digital SLR cameras during the period amounted to 1.15
million units, approximately triple the result for the previous fiscal
year, giving Sony a market share of more than 10% (Sony estimate,
as of May 2009). Highlighting our pursuit of synergies among
businesses, Sony began using G lenses, which are prominent in
our digital SLR cameras, in the Cyber-shot HX series of compact
digital cameras.
The global market for v ideo cameras decl ined 17% to
approximately 15 million units in the fiscal year ended March 31,
2009, evidence of its approaching maturity. Sales of Sony video
Cyber-shot™ Digital Camera DSC-T77
Unit sales of video cameras and market share
7.45 7.7
6.2
2007 2008 2009
41% 43%41%
(Millions of units)
Unit sales of compact digital cameras and market share
17.0
23.5 22.0
2007 2008 2009
22% 23%21%
(Millions of units)
*In June 2008, cumulative shipments of Cyber-shot cameras
(including Digital Mavica) surpassed 100 million units.
*Years ended March 31
*Years ended March 31

19
cameras slipped 19% to about 6.2 million units, resulting in a
market share of 41% (Sony estimate, as of May 2009), maintaining
the lead position in the video camera industry.
In February 2009, Sony launched a new model of digital high-
definition Handycam® video camera—mounted with Exmor R, a
newly developed back-illuminated CMOS image sensor—that is
playing a crucial role in Sony’s “HD World” initiative. The Exmor
R CMOS image sensor achieves unprecedented light sensitivity
through illumination of the silicon substrate from the back. This
enables the sensor to deliver outstanding clarity in low-light
situations. In January 2009, Sony released two new versions of
Webbie HD™, a pocket-sized video camera, in the North American
market. Moving forward, Sony will further expand its video camera
lineup to include a broad range of models, from high-spec and
value-added to affordably priced, in an effort to bring the joy of
easy-to-shoot high-definition video to individuals as well as families.
Sony has steadily expanded its Blu-ray Disc™ recorder and player
business since first launching Blu-ray Disc players in North America
and Blu-ray Disc recorders in Japan in fiscal year 2006. In fiscal year
2008, sales of Blu-ray Disc players amounted to 2.2 million units,
earning Sony the top position in North America—the key market
for Blu-ray Disc players—with a market share of over 40% (Sony
estimate, as of May 2009). Sales of Blu-ray Disc recorders totaled
500,000 units. Looking ahead, in addition to anticipating significant
growth in the market for Blu-ray Disc players and recorders, Sony
expects each of its Blu-ray Disc-related businesses—including PCs,
components and filmed content—to grow and yield considerable
synergies within the Sony Group.
Sales of Sony’s digital music players in fiscal year 2008 were
approximately 7 million units, an increase of 21% from the previous
fiscal year. In the Japanese market, Sony achieved a high market
share as the Walkman® S series of players with stand-alone
speakers included—commercialized with young users in mind—
proved a major hit. In April 2009, Sony launched the flagship X
series. Featuring the S-Master fully digital amplifier—which is used
in Sony AV amplifiers and home theater-related products—as
well as digital noise cancellation, X series players also boast a
3.0-inch wide-screen organic light-emitting diode (OLED) display.
High Definition Handycam®
HDR-XR520V
Digital music player Walkman® X series
Unit sales of digital music players and market share
4.5
5.8
7.0
2007 2008 2009
6% 7% 9%
(Millions of units)
*Years ended March 31

20
This unique combination of features enables the X series to deliver
the best sound and image quality to this point in Walkman® history.
Steady growth in the global market for digital music players
supported robust sales of Sony headphones, which secured the
top position in the North American and Japanese headphone
markets (Sony estimate, as of May 2009). During the period under
review, Sony released the world’s first noise-cancelling headphones
with built-in digital noise cancellation. These headphones boast
high-precision digital filtering properties not possible with analog
technology, which greatly improves the effectiveness of the noise
cancellation and ensures superb sound reproduction amid soothing
silence.
Sales of VAIO™ PCs in the period under review rose 12%
to approximately 5.8 million units. The global market for PCs
continued to expand during the period, owing to a sharp increase in
the popularity of low-priced PCs, although sales price competition
intensified. In July 2008, Sony redefined the meaning behind the
name “VAIO”—originally an acronym for “Video Audio Integrated
Operation” when the brand was launched in 1996—to “Visual
Audio Intelligent Organizer.” By adding “intelligent” features, Sony
will create new value and will continuously strive to provide value-
added products to the customer.
In January 2009, Sony launched the “pocket style” VAIO
P series, a lightweight and compact portable PC that can be
held in one hand and fits in a pocket. With an elegant exterior,
communications capabilities, an easy-to-use keyboard and an
ultra-bright widescreen display, this new offering earned high praise
from the market. Delivering a whole new spin on the concept of
mobile computing, the VAIO P series is a clear embodiment of the
redefined VAIO concept.
Sony Ericsson Mobile Communications AB (Sony Ericsson)—a joint
venture between Sony Corporation and LM Ericsson—reported
operating and net losses for the fiscal year ended December 31,
2008. This was primarily a result of a less favorable product mix,
price pressure and a decrease in unit sales due to the global
economic slowdown. In response to persistently weak consumer
confidence and an increasingly intense and competitive operating
environment, Sony Ericsson is implementing measures to reassess
its global operations and the allocation of its management
resources, as well as cost saving programs targeted at reducing
operating expenses, in order to restore its financial health and
facilitate profitable growth.
The 2008 calendar year saw the release of a number of new
phones; these included Xperia™ X1, a Windows Mobile®-based
multimedia handset, and C905 Cyber-shot™, an eight-megapixel
Unit sales of PCs
4.0
5.25.8
2007 2008 2009
(Millions of units)
*Years ended March 31
VAIO P series

21
camera phone. In February 2009, Sony Ericsson announced its
Communication Entertainment strategy, which aims to broaden and
unite best-in-class entertainment experiences into a single offering
that fuses communication with entertainment. PlayNow™, Sony
Ericsson’s content delivery platform, has recently been expanded
to offer not only music and game downloads, but also movies and
an application store. The Aino, Satio and Yari handsets, which Sony
Ericsson plans to launch early in the 2009 fourth quarter, will be the
first to embody the concept of “Communication Entertainment.”
PLAySTATIOn®3
Review of Operations in the Game Business
Sony Computer Enter ta inment Inc. (SCE) cu l t ivated
st rong growth for PLAYSTATION®3 (PS3 ™) and PSP ®
(PlayStation®Portable) platforms by expanding its lineup of
software titles and implementing a variety of marketing initiatives
despite operating in a difficult business environment. Efforts
also focused on building up network services—one of several
important themes. PS3™ and PSP® offer new ways to have fun
through network connectivity and are playing an increasingly
important role in Sony’s growth. Going forward, Sony will
continue to offer services that are unique to PlayStation®,
creating a whole new world of entertainment.
PS3™ Sees Increased Market Penetration
The consummate entertainment system, PS3™ boasts an
abundance of cutting-edge technologies, including the high-
performance Cell Broadband Engine™ (Cell/B.E.) semiconductor,
which imparts formidable computing power; RSX™, a graphics
processor that facilitates processing of highly detailed images; and
a high-capacity Blu-ray Disc drive.

22
In fiscal year 2008, SCE introduced a wealth of game titles
designed to realize the performance potential of PS3™ while at the
same time implementing a variety of marketing initiatives aimed at
cultivating broader market acceptance. On the hardware front, SCE
launched a new 80GB model equipped with a DUALSHOCK®3
wireless controller that boasts all of the performance features of the
40GB model and twice the hard disc drive (HDD) capacity, all for
the same price as its predecessor. In North America and Europe,
SCE responded to user demand for high-capacity HDDs—spurred
by the launch of a video distribution service in the United States
and the introduction of a television recording peripheral, PlayTV™,
in Europe—by launching a limited edition model mounted with a
160GB HDD in time for the year-end holiday sales season. As a
result of these and other measures, sales of PS3™ in fiscal year
2008 reached 10.06 million units, boosting cumulative sales of the
platform since its launch in 2006 to more than 22.7 million units.
Regarding the reduction of hardware costs, efforts to shrink
the Cell/B.E. progressed according to plan as the original 90nm
generation gave way to 65nm and then 45nm devices. Through
this, as well as through ongoing efforts to reduce the number
of components used, Sony will endeavor to further improve
profitability.
An Increasingly networked World
PlayStat ion®Network is a network serv ice that del ivers
entertainment to PS3™ and PSP® owners through the Internet.
In addition to games and game demos, users can download
animated television programming, movies and a wide range of
other content. PlayStation®Network currently offers services in more
than 55 countries and regions and, as of June 2009, had more
than 24 million registered accounts worldwide. Sony also continues
to enhance network services to enable users to download and
enjoy games, videos and other content from PlayStation®Store.
In fiscal year 2008, the expansion of various services helped
boost cumulative network business sales since the launch of this
business to approximately ¥25 billion. In July 2008, SCE launched
PlayStation®Store’s video delivery service in the United States that
PlayStation® hardware sales
14.11
9.60
7.9114.78
10.063.55
13.81
13.66
9.12
20092007 2008
(Millions of units)
PS3™ PSP® PS2
PS3™ PSP® PS2
*Years ended March 31
*Years ended March 31
PlayStation® software sales
50.3
54.7
83.5
193.5
103.7
13.3
55.5
154.0
57.9
20092007 2008
(Millions of units)

23
distributes movies, television programming and other content.
At present, customers are able to choose from more than 1,900
movie titles and over 9,400 television programs. In September,
SCE launched Life with PlayStation®, a service that offers users
access to news and weather information from 60 cities around the
world, while in December it launched PlayStation®Home, an online
community that enables PS3™ users to meet, play games and
communicate with each other.
The World of PSP®: Expanding Ways to Have Fun
October 2008 saw the release of PSP-3000, a new model for the
PSP® handheld entertainment system that enables users to enjoy
games and other entertainment content with greater detail and also
features a built-in microphone. In January 2009, SCE unveiled a
series of vibrant, glossy-finish color options for customers in Japan
and elsewhere in Asia called “carnival colors,” likening the PSP-
3000’s glittery and fun-filled mystique to that of a carnival. Together
with the three popular original colors, this brings the total number of
color options available for PSP® to seven.
Capitalizing on the launch of PSP-3000, SCE further enhanced
its online services for PSP®. In addition, SCE established a service
available to users on PlayStation®Network whereby PSP® users
can access the Internet directly, rather than having to go through
a PS3™ or a PC, enabling PSP® users to download games from
PlayStation®Store. As a consequence, PSP® users can now access
PlayStation®Network whether they are at home or on the go,
allowing them to more easily enjoy the world of PlayStation®.
Worldwide sales of PSP® surpassed 14 million units in fiscal
year 2008, while cumulative global sales have exceeded 51.6
million units, underscoring the expanding presence of PSP®. Going
forward, we will continue to expand software titles while at the
same time promoting PSP® by enhancing linkage with PS3™. In this
way, we will expand options for utilizing the platform, from playing
games to browsing the Internet and enjoying music and video
content.
PSP® (PlayStation®Portable)
Life with PlayStation®
PlayStation®Home

24
PlayStation®2 (PS2)
Calendar year 2009 marks the 10th year since the launch of PS2.
Despite the impact of the economic slowdown, global sales of
PS2 in fiscal year 2008 totaled approximately 8 million units as
the platform continued to perform well and contribute to profits
in Sony’s Game business. Demand remains particularly firm in
the Middle East and Asia. Going forward, Sony will continue this
business, while enhancing its lineup of titles, which includes its own
and those released by third-party software developers.
©2009 Sony Computer Entertainment Inc. Manufacturers, cars, names, brands and associated imagery featured in this game in some cases include trademarks and/or copyrighted materials of their respective owners. All rights reserved.Any depiction or recreation of real world locations, entities, businesses, or organizations is not intended to be or imply any sponsorship or endorsement of this game by such party or parties. Produced under license of Ferrari Spa. FER-RARI, the PRANCING HORSE device, all associated logos and distinctive designs are trademarks of Ferrari Spa. The body designs of the Ferrari cars are protected as Ferrari property under design, trademark and trade dress regulations. LittleBigPlanet©2008 Sony Computer Entertainment Europe. All Rights Reserved. Published by Sony Computer Entertainment Inc. Developed by Media Molecule. LittleBigPlanet is a trademark of Sony Computer Entertainment Europe. Created by LEVEL-5 Inc. ©2008 Sony Computer Entertainment Inc. ©2009 Sony Computer Entertainment Inc. MotorStorm® 2 ©2008 Sony Computer Entertainment Europe. All rights reserved.Published by Sony Computer Entertainment Inc. Developed by Evolution Studios Ltd. ©Sony Computer Entertainment Inc. ©2008 Sony Computer Entertainment Inc. ©2008 Rolito/Interlink. ©2009 Sony Computer Entertainment Inc. Manufacturers, cars, names, brands and associ-ated imagery featured in this game in some cases include trademarks and/or copyrighted materials of their respective owners. All rights reserved. Any depiction or recreation of real world locations, entities, businesses, or organizations is not intended to be or imply any sponsorship or endorsement of this game by such party or parties. Produced under license of Ferrari Spa. FERRARI, the PRANCING HORSE device, all associated logos and distinctive designs are trade-marks of Ferrari Spa. The body designs of the Ferrari cars are protected as Ferrari property under design, trademark and trade dress regulations.“GRAN TURISMO” is a registered trademark of Sony Computer Entertainment Inc.
A Steady Stream of new Software Titles
Bolstering its lineup of software titles is crucial to SCE’s efforts to
promote the PS3™, PSP® and PS2 platforms. In fiscal year 2008,
SCE and third-party software developers released an extensive
range of hit titles. PS3™ titles including Metal Gear Solid 4 Guns
of the Patriots (Konami Digital Entertainment Co., Ltd.) and SCE
offerings GRAN TURISMO 5 Prologue™, Killzone®2, LittleBigPlanet™
and Resistance 2™ sold well in Japan, the United States, Europe
and Asia. Additionally, sales of PSP® titles including Monster Hunter
Portable 2nd G (Capcom Co., Ltd.), DISSIDIA FINAL FANTASY
(SQUARE ENIX CO., LTD.) and SCE’s God of War®: Chains
of Olympus contributed to the growth of that platform. While
reinforcing in-house software development, SCE is also supporting
the capabilities of third-party software developers producing titles
for PlayStation® by expanding and reinforcing software development
tools, thereby increasing the efficiency of development efforts. To
further enhance the development environment for PS3™ titles, in
March 2008 SCE introduced a moderately priced new reference
tool that will contribute to the efforts of software developers to
reduce costs, as well as attract a wider range of developers.
An exciting collection of new titles developed by SCE and by
third-party developers is expected in fiscal year 2009. Going
forward, Sony will continue to enhance the PS3™, PSP® and PS2
platforms and at the same time offer new user experiences that
integrate network services and a variety of content.
PlayStation®2

PlayStation® Software Titles
25
GRAN TURISMO 5
MotorStorm™ 2
PATAPON 2 DonChaka♪
White Knight Chronicles
LittleBigPlanet™
Trash Panic™
GRAN TURISMO
The Last Guy
PLAySTATIOn®3 software titles*
PSP® (PlayStation®Portable) software titles*
*Some titles are yet to be released.
*Some titles are yet to be released.

Review of Operations: Entertainment Business
Entertainment
28

27
Review of Operations in the Entertainment Business
Sony Pictures Entertainment (SPE) had a successful year on
many fronts in the fiscal year ended March 31, 2009 despite
facing challenges brought on by the current global economy.
Whi le the studio remains mindfu l o f the economic
circumstances, people worldwide continue to show an interest
in such entertainment products as motion pictures, television
programs, and online, mobile and other content. In particular,
theater attendance is greater than in past years*1 as consumers
continue to find value in the movie-going experience, even in
the midst of a difficult financial climate.
Motion Pictures
SPE’s Motion Picture Group achieved more than $2.7 billion in
receipts at the worldwide box office in calendar year 2008, making
it the third biggest year on record for the studio. Hancock, SPE’s
2008 summer blockbuster starring Will Smith, was a major hit,
taking in more than $600 million in global box office receipts. The
latest James Bond film, Quantum of Solace, surpassed Casino
Royale—the previous title in the series—with the biggest North
American box office opening in the franchise’s history.*2
You Don’t Mess With the Zohan, Paul Blart: Mall Cop, Step
Brothers and Pineapple Express, as well as Screen Gems’
Quarantine and Lakeview Terrace are among the other titles that
also performed well at the box office. Sony Pictures Classics
enjoyed critical success with multiple Academy Award®, Golden
Globe®, Film Independent Spirit Award and Cannes Palme D’Or
nominations and five wins for films including Rachel Getting
Married, Waltz with Bashir, The Class and Frozen River.
A number of major titles have been released or are slated for
the 2009 calendar year including Angels & Demons, The Taking
of Pelham 1 2 3, Julie & Julia and an epic Roland Emmerich film,
2012.
Sony Pictures’ International Motion Picture Production Group,
SPE’s local-language production arm, achieved box office
success in Russia and India with the releases of The Very Best
Movie 2 and Raaz 2 debuting at number one in their respective
markets.
Sony Pictures Worldwide Acquisit ions Group acquired
distribution rights to Terminator Salvation in a majority of
international territories. In addition, The Take received a Film
Independent Spirit Award nomination.
*1 Daily Finance, April 15, 2009, citing the National Association of Theater Owners (NATO)
*2 The New York Times, November 16, 2008
Home Entertainment
Sony Pictures Home Entertainment (SPHE) achieved the second
highest catalog (other than new release) market share of the U.S.
DVD market in calendar year 2008*3 and earned several awards
from retailers for its excellent quality of service.
Internationally, SPHE continues to have success with respect to
Blu-ray Disc products, maintaining the number two overall market
share position for the year. Total industry Blu-ray Disc software
sales quadrupled to 37.4 million units in 2008,*4 demonstrating
the enduring global demand for high-quality home entertainment. (2008年X月XX日現在)
Sony Pictures
13.0%Lions Gate4.5%
Other15.0%
Paramount16.4%
Warner Bros.18.3%
Fox10.7%
Universal11.5%
Disney10.6%
north American Theatrical Box Office Revenue Market Share (Calendar year 2008)
Quantum of Solace © 2008 Danjaq, LLC, United Artists Corporation and Columbia Pictures Industries, Inc. All Rights Reserved. Hancock © 2008 Columbia Pictures Industries, Inc. and GH Three LLC. All Rights Reserved.

28
The home entertainment market, and DVD sales in particular,
was impacted by the economic downturn in calendar year 2008,
affecting all the major studios. However, strong adoption rates
of the Blu-ray Disc format by consumers continue, with disc unit
sales double those of last year for the first quarter of calendar year
2009.*5
*3 Nielsen VideoScan retail channel POS January 1 through December 28, 2008*4 Richard Cooper, Senior Analyst, Video, Screen Digest, March 9, 2009*5 Video Business, April 15, 2009
Television
In March 2009, SPE announced that its U.S. and international
television divisions were uniting as Sony Pictures Television (SPT)
to take strategic advantage of the globalization of the television
market.
SPT had a strong year in the U.S. market with the critical
success of productions like Damages, Rescue Me, Breaking
Bad and A Raisin in the Sun. SPT productions received 29
Primetime Emmy® nominations—the most in SPE’s history—and
went on to win six awards. SPT productions also received 28
Daytime Emmy® nominations and won five awards. Last summer,
SPT announced an agreement with Oprah Winfrey’s television
production company, Harpo Productions, to produce and
distribute a syndicated show that will feature Dr. Mehmet Oz, the
renowned heart surgeon and author. The show debuts in the U.S.
in September 2009.
SPT continues to have success in the development of new
television shows for the U.S. broadcast and cable networks. For
the 2008–2009 television season, the FOX and ABC networks
ordered SPT shows Sit Down, Shut Up and The Unusuals, and
the Turner and Lifetime cable networks ordered HawthoRNe
and Drop Dead Diva. In the popular unscripted (“reality” or “light
entertainment”) format, SPT had three pilots ordered for cable and
broadcast network series including The Newlywed Game on GSN.
In addition, the studio produced pilots for the 2009–2010 season
that resulted in two new scripted series for broadcast networks:
Community on NBC and Brothers on FOX.
Internationally, SPT and its distribution arm had continued
growth and success due to the popularity of SPE’s motion
pictures and TV series around the world. The studio’s global
channel network includes 114 channel feeds in 130 countries
reaching approximately 400 million viewers worldwide. The
group bolstered production of the unscripted format through the
acquisition of the Dutch production company 2waytraffic and
an investment in the Colombian television production company
Teleset.
March 2009 saw significant developments for SPT in India.
Multi Screen Media Private Limited, SPE’s joint venture television
networks business in India, signed an agreement to air the
popular IPL cricket tournament on its SET MAX television channel
for up to eight years, with an option for a ninth. SPT also entered
the Bengal region with the acquisition of Channel 8, India’s only
Bengali language film channel.
Digital Production
Sony Pictures Digital Productions (SPDP) continued its production
of Cloudy With a Chance of Meatballs, the next animated feature
from SPE, which will be released in 3-D in September 2009.
The unit also announced development deals with the Gotham
Group, a leading production firm, and with Platinum Studios,
which controls an international library of comic and graphic novel
content, to produce animated films.
Sony Picture’s Academy Award®-winning digital production
studio Imageworks delivered visual effects and digital character
animation to a number of films by Sony Pictures and other
studios, including Hancock for Sony Pictures and the character of
Dr. Manhattan in Watchmen for Warner Bros., and continues to
be a leader in 3-D stereoscopic production.

29
Titles from Sony Pictures
© 2009 Sony Pictures Television Inc. and Bluebush Productions, LLC. All Rights Reserved.
Damages
© 2008 Columbia Pictures Industries, Inc. All Rights Reserved.
Seven Pounds
© 2007 Columbia Pictures Industries, Inc. All Rights Reserved.
Hancock
© 2008 Danjaq, LLC, United Artists Corporation and Columbia Pictures Industries, Inc. All Rights Reserved.
Quantum of Solace
© 2007 Columbia Pictures Industries, Inc. All Rights Reserved.
You Don’t Mess With the Zohan
© 2009 Harpo, Inc. All rights reserved.
The Dr. Oz Show
© 2009 Sony Pictures Television Inc. All Rights Reserved.
HawthoRNe
© 2009 Columbia Pictures Industries, Inc. and Beverly Blvd LLC. All Rights Reserved.
Paul Blart: Mall Cop
© 2008 Columbia Pictures Industries, Inc. All Rights Reserved.
Pineapple Express

30
MUSIC
Sony’s music entertainment business consists primarily of Sony
Music Entertainment (SME), which operates worldwide outside
of Japan, and Sony Music Entertainment (Japan) Inc. (SMEJ),
which operates in the Japanese market, as well as our music
publishing joint venture, Sony/ATV Music Publishing (Sony/ATV).
Individually they operate as market-leading businesses, and
together they comprise the core of Sony’s music entertainment
assets.
Sony Music Entertainment
http://www.sonymusic.com/
Pr ior to October 1, 2008, Sony’s non-Japanese music
entertainment business was conducted by SONY BMG MUSIC
ENTERTAINMENT (SONY BMG), a 50% joint venture with
Bertelsmann AG. On that date, Sony acquired Bertelsmann AG’s
50% stake in the company, and SONY BMG became a wholly
owned subsidiary. From January 1, 2009, the company changed
its name to Sony Music Entertainment. In addition to being able to
further lower its cost base through increased efficiencies, having
SME entirely within the Sony Group will allow the company to
work more effectively with our Electronics, Game and Pictures
businesses.
During the fiscal year ended March 31, 2009, SME marked
its full re-entry into the Sony Corporation family by focusing on
generating hits for both well-known and emerging recording
artists, while also creating new and innovative business models
for a music market in transition.
SME’s continuing dedication to great artistry yielded hits from
established stars including AC/DC, Beyoncé, P!nk and Britney
Spears, and blossoming ones such as Leona Lewis, Kings of
Leon, Adele, Sara Bareilles and Jordin Sparks. As a result, SME’s
market share for the fiscal year increased over that of the previous
year, with its share of music from “breakout” artists (artists who
recently made their major label debut) topping the industry.
As a company, SME continued its ongoing evaluation of how
it manages its bottom line and continued to work to transform its
business to include significant and growing digital sales, as well
as developing other revenue streams such as live concerts, artist
management and sponsorships.
On the digital front, SME signed important licensing deals with
Sony Ericsson, Apple, Nokia, Vodafone, MySpace and Amazon,
among others. This further expanded the number of service
providers offering music from our artists and diversified the ways
consumers can acquire music to include a variety of buy-to-own,
subscription and ad-supported models.
SME also played an active role in the ongoing Sony United
initiative, integrating its music into a wide range of Sony products
and related services, including Sony Ericsson’s PlayNow plus,
as well as X series and other Walkman® pre-loaded with a variety
of songs and videos from hot, new artists. SME released over
a dozen new titles in the Blu-ray Disc format, and collaborated
with Sony Pictures Entertainment on music components from the
latest James Bond movie, Quantum of Solace.
Sony Music Entertainment (Japan)
http://www.sonymusic.co.jp
SMEJ’s business portfolio, in addition to music production, also
includes artist management, and video and media production.
Concurrent with the acquisition of Bertelsmann AG’s 50% stake
in SONY BMG, BMG Japan (BMJ, the BMG Label Group’s
Japanese operations), formerly part of SONY BMG, became a
subsidiary of SMEJ.
(2008年X月XX日現在)
SME
25.7%EMI9.0%
Other12.5%
Universal31.2%
Warner Bros.21.6%
U.S. Market Share (April 2008 - March 2009)

31
AC/DC
Kings of Leon
YUI ikimono-gakari
Britney Spears
Beyoncé
JUJU
Jordin Sparks
P!nk
Artists from SME & SMEJ

32
SMEJ also recorded a number of hits in fiscal year 2008, led
by albums from established artists including YUI, ikimono-gakari,
Mika Nakashima and Miliyah Kato. In addition, a number of young
SMEJ artists, including JUJU, Miho Fukuhara and Lil’B, launched
their debut albums and recorded hits for SMEJ. As a result, SMEJ
(including BMJ) increased its market share and took the number
one position in the Japanese market.
SMEJ continues to focus heavily on digital distribution, with
the Chaku-Uta® and Chaku-Uta Full® master ringtone download
services continuing to perform well and contribute significantly to
earnings.
Chaku-Uta® and Chaku-Uta Full® are registered trademarks of Sony Music Entertainment (Japan)
Sony/ATV Music Publishing
http://www.sonyatv.com
Sony/ATV owns or administers more than 750,000 music
copyrights, including those by classic artists such as The Beatles,
Bob Dylan, Willie Nelson, Roy Orbison and Joni Mitchell, as well
as its growing roster of current artists including Akon, the Jonas
Brothers, Lady Gaga, Shakira and Taylor Swift.
By focusing on signing artists and acquiring catalogs—two
recent purchases include the music publishing company Famous
Music and the Leiber–Stoller catalog—Sony/ATV significantly
increased its U.S. market share position of new releases, from the
number five position just a few years ago to second place for the
(2008年X月XX日現在)
Other43.1%
Universal13.6%
avex15.1%
EMI5.6%
Warner5.7%
SMEJ
16.9%
SMEJ13.8%
BMJ3.1%
Japan Market Share (April 2008 - March 2009)
last two quarters of the fiscal year ended March 2009.
This remains a challenging time for the music industry, which
must manage its ongoing evolution from a physical product
business to one which capitalizes on multiple formats and rights
and a host of new digital and mobile business models, and do so
at a time when the worldwide economic downturn is impacting all
industries around the globe.
SME remains positioned for success with a rich catalog and
roster of talented artists, several promising digital initiatives,
dedicated employees, and supportive ownership that believes
in the power and potential of music. Together with SMEJ and
Sony/ATV, which are also positioned for further growth despite
the harsh market environment, Sony’s music entertainment assets
are set to continue to contribute to both the Sony brand and its
bottom line.
* BMJ was integrated into SMEJ as of October 2, 2008.* SoundScan, Audio total from April 2008 through March 2009

Chairman of the Board: yotaro Kobayashi* Vice Chairman of the Board: yoshihiko Miyauchi*Sir Howard Stringer Sony Corporation Chairman, Chief Executive
Officer and PresidentRyoji Chubachi Sony Corporation Vice Chairman, Officer in charge
of Product Quality & Safety and Environmental Affairs
nobuyuki Oneda Sony Corporation Executive Deputy President and Chief Financial Officer
yotaro Kobayashi* Chief Corporate Advisor, Former Chairman of the Board, Fuji Xerox Co., Ltd.
Sakie T. Fukushima* Representative Director & Chairman, Korn/Ferry International-Japan
yoshihiko Miyauchi* Director, Representative Executive Officer, Chairman and Chief Executive Officer, ORIX Corporation
yoshiaki yamauchi* Director, Sumitomo Mitsui Financial Group, Inc.Sir Peter Bonfield* Chairman of the Supervisory Board, NXP B.V.Fueo Sumita* Chief of Sumita Accounting OfficeFujio Cho* Chairman, Toyota Motor CorporationRyuji yasuda* Professor, Graduate School of International
Corporate Strategy, Hitotsubashi Universityyukako Uchinaga* Director and Vice Chairman, Benesse Corporation
Chairman of the Board, Chief Executive Officer and President, Berlitz International, Inc.
Mitsuaki yahagi* Chairman of the Board, The Japan Research Institute, Limited
Tsun-yan Hsieh* Senior Advisor, McKinsey & CompanyRoland A. Hernandez* Retired Chairman and CEO,
Telemundo Group, Inc.
SupervisionBoard of Directors• Determines the fundamental management policies of the Sony Group.• Oversees the management of Sony Group’s business operations.• Appoints and dismisses the statutory committee members.• Appoints and dismisses Corporate Executive Officers.
ExecutionCorporate Executive Officers• Make decisions regarding the execution of Sony Group business activities within the scope of the authority delegated to them by the Board
of Directors.
Sir Howard Stringer** Chairman, Chief Executive Officer and PresidentRyoji Chubachi** Vice Chairman, Officer in charge of Product
Quality & Safety and Environmental Affairsnobuyuki Oneda** Executive Deputy President and Chief Financial
Officeryutaka nakagawa Executive Deputy President, Officer in charge of
Manufacturing, Logistics, Procurement and CS Platform
Hiroshi yoshioka Executive Deputy President, Officer in charge of Consumer Products & Devices Group (CPDG)
Keiji Kimura Executive Vice President, Officer in charge of Intellectual Property, Information Systems, B2B Solutions Business and the Disc Manufacturing Business
nicole Seligman Executive Vice President and General CounselKazuo Hirai Executive Vice President, Officer in charge of
Networked Products & Services Group (NPSG)** Representative Corporate Executive Officer concurrently serving as Director
Compensation Committee
• Sets policy on the contents of individual compensation for Directors, Corporate Executive Officers, Corporate Executives and Group Executives and determines the amount and content of individual compensation of Directors and Corporate Executive Officers in accordance with the policy.
Sakie T. Fukushima* (Chairman)Mitsuaki yahagi*Tsun-yan Hsieh*
Audit Committee
•MonitorstheperformanceofdutiesbyDirectorsandCorporate Executive Officers (with respect to structure to ensure the adequacy of the financial reporting process, to enable management to ensure the effectiveness of internal control over financial reporting, to ensure timely and appropriate disclosure and to ensure compliance with any applicable law, Articles of Incorporation and internal policies and rules and status of any other items described in the “Internal Control and Governance Framework” determined or reaffirmed by the Board of Directors in accordance with the Companies Act).
•Overseesandevaluatestheworkofindependentauditor(including to evaluate the adequacy of its independence and its qualification, to propose its appointment/dismissal or non-reappointment, to approve its compensation, to evaluate the appropriateness of its audit regarding the financial results and internal control over financial reporting, and to pre-approve its engagement for any other services than audit services to be provided).
yoshiaki yamauchi* (Chairman)Fueo Sumita* Ryuji yasuda*
nominating Committee
• Determines the content of proposals regarding the appointment/dismissal of Directors.
yotaro Kobayashi* (Chairman)yoshihiko Miyauchi*Sir Peter Bonfield*Fujio Cho*yukako Uchinaga*Roland A. Hernandez*Sir Howard StringerRyoji Chubachi
Corporate Executives• Carry out business operations within designated areas, including business units, research and development, and/or headquarters functions, in
accordance with the fundamental policies determined by the Board of Directors and the Corporate Executive Officers.
(Names and positions of new Directors and Corporate Executive Officers as of June 19, 2009)33
Board of Directors and Corporate Executive Officers
* An outside director who satisfies the requirements under Item 15, Article 2 of the Japanese Companies Act
34
Five-Year Summary of Selected Financial DataSony Corporation and Consolidated Subsidiaries—Years ended March 31
Yen in millions (Yen per share amounts)
2005 2006 2007 2008 2009
FOR THE YEAR
Sales and operating revenue . . . . . . . . . . . . . . . . . 7,191,325 7,510,597 8,295,695 8,871,414 7,729,993
Equity in net income (loss) of affiliated companies* . . 29,039 13,176 78,654 100,817 (25,109)
Operating income (loss) . . . . . . . . . . . . . . . . . . . . . 174,667 239,592 150,404 475,299 (227,783)
Income (loss) before income taxes . . . . . . . . . . . . . 186,246 299,506 180,691 567,134 (174,955)
Income taxes . . . . . . . . . . . . . . . . . . . . . . . . . . . . . 16,044 176,515 53,888 203,478 (72,741)
Net income (loss) . . . . . . . . . . . . . . . . . . . . . . . . . . 163,838 123,616 126,328 369,435 (98,938)
Per share data of common stock:
Net income (loss)
—Basic . . . . . . . . . . . . . . . . . . . . . . . . . . . . 175 .90 122 .58 126 .15 368 .33 (98.59)
—Diluted . . . . . . . . . . . . . . . . . . . . . . . . . . . 158 .07 116 .88 120 .29 351 .10 (98.59)
Cash dividends . . . . . . . . . . . . . . . . . . . . . . . . 25 .00 25 .00 25 .00 25 .00 42.50
Depreciation and amortization** . . . . . . . . . . . . . . . . 372,865 381,843 400,009 428,010 405,443
Capital expenditures (addition to fixed assets) . . . . 356,818 384,347 414,138 335,726 332,068
Research and development costs . . . . . . . . . . . . . 502,008 531,795 543,937 520,568 497,297
AT YEAR-END
Net working capital . . . . . . . . . . . . . . . . . . . . . . . . . 746,803 569,296 994,871 986,296 (190,265)
Long-term debt . . . . . . . . . . . . . . . . . . . . . . . . . . . 678,992 764,898 1,001,005 729,059 660,147
Stockholders’ equity . . . . . . . . . . . . . . . . . . . . . . . . 2,870,338 3,203,852 3,370,704 3,465,089 2,964,653
Total assets . . . . . . . . . . . . . . . . . . . . . . . . . . . . . . 9,499,100 10,607,753 11,716,362 12,552,739 12,013,511
Number of shares issued at year-end
(thousands of shares of common stock) . . . . . . . 997,211 1,001,680 1,002,897 1,004,443 1,004,535
Stockholders’ equity per share of
common stock . . . . . . . . . . . . . . . . . . . . . . . . . . 2,872 .21 3,200 .85 3,363 .77 3,453 .25 2,954.25
* Effective from the fiscal year ended March 31, 2009, Sony revised the presentation of its financial information to ensure that it is consistent with the way management views its consolidated operations . Since Sony considers Sony Ericsson Mobile Communications AB and S-LCD Corporation to be integral to Sony’s operations, Sony determined that the most appropriate method to report equity in net income (loss) of all affiliated companies was as a component of operating income (loss) . In connection with this reclassification, consolidated operating income (loss) and consolidated income (loss) before income taxes for all prior periods have been reclassified to conform with the current year presentation .
** Depreciation and amortization includes amortization expenses for intangible assets and deferred insurance acquisition costs .

35
Quarterly Financial and Stock InformationSony Corporation and Consolidated Subsidiaries—Years ended March 31
Yen in billions (Yen per share amounts)
1st quarter 2nd quarter 3rd quarter 4th quarter
2008 2009 2008 2009 2008 2009 2008 2009
Sales and operating revenue . . . . . . . 1,976 .5 1,979.0 2,083 .0 2,072.3 2,859 .0 2,154.6 1,952 .8 1,524.1Equity in net income (loss) of affiliated companies . . . . . . . . . . . . . . . . . . . . 22 .0 2.2 21 .1 1.1 46 .9 (10.8) 10 .8 (17.7)Operating income (loss) . . . . . . . . . . . 121 .3 73.4 111 .6 11.0 236 .2 (18.0) 6 .2 (294.3)Income (loss) before income taxes . . . 105 .7 62.9 109 .1 7.3 335 .3 66.5 17 .0 (311.6)Income taxes . . . . . . . . . . . . . . . . . . . 39 .7 19.0 34 .9 (8.9) 135 .2 64.4 (6 .3) (147.2)Net income (loss) . . . . . . . . . . . . . . . . 66 .5 35.0 73 .7 20.8 200 .2 10.4 29 .0 (165.1)
Per share data of common stock Net income (loss) —Basic . . . . . . . . . . . . . . . . . . . . 66 .29 34.86 73 .50 20.74 199 .60 10.37 28 .95 (164.56) —Diluted . . . . . . . . . . . . . . . . . . . 63 .14 33.28 70 .09 19.83 190 .29 9.98 27 .63 (164.56)
Depreciation and amortization* . . . . . . 104 .0 91.7 100 .6 103.4 109 .7 105.6 113 .8 104.9Capital expenditures (addition to property, plant and equipment) . . . . . . . . . . . . . . . . 95 .0 77.7 75 .8 107.1 67 .1 73.6 97 .9 73.7R&D expenses . . . . . . . . . . . . . . . . . . 126 .0 124.3 131 .7 132.3 125 .5 117.1 137 .4 123.6
Tokyo Stock Exchange price per share of common stock: High . . . . . . . . . . . . . . . . . . . . . . . . 7,190 5,560 6,580 4,710 6,410 3,280 6,300 2,335 Low . . . . . . . . . . . . . . . . . . . . . . . . 5,860 4,000 5,050 3,120 5,100 1,717 3,910 1,491
New York Stock Exchange price per American Depositary Share: High . . . . . . . . . . . . . . . . . . . . . . . . $ 59 .84 $ 52.36 $ 54 .12 $ 43.65 $ 56 .75 $ 30.64 $ 57 .19 $ 24.32 Low . . . . . . . . . . . . . . . . . . . . . . . . 49 .77 39.52 43 .86 29.71 44 .57 18.09 39 .91 15.64
* Including amortization expenses for intangible assets and for deferred insurance acquisition costs

36
SaleS and Operating revenue by buSineSS Segment*
Yen in millions
Years ended March 31 2007 2008 2009
Electronics
Customers . . . . . . . . . . . . . . . . . . . . . . . . . . . . . . . . . . . . . . . . . . . . . . . . . . . . . . 5,443,336 5,931,708 5,032,920
Intersegment . . . . . . . . . . . . . . . . . . . . . . . . . . . . . . . . . . . . . . . . . . . . . . . . . . . . . 629,042 682,102 455,035
Total . . . . . . . . . . . . . . . . . . . . . . . . . . . . . . . . . . . . . . . . . . . . . . . . . . . . . . . . . . . 6,072,378 6,613,810 5,487,955
Game
Customers . . . . . . . . . . . . . . . . . . . . . . . . . . . . . . . . . . . . . . . . . . . . . . . . . . . . . . 974,218 1,219,004 984,855
Intersegment . . . . . . . . . . . . . . . . . . . . . . . . . . . . . . . . . . . . . . . . . . . . . . . . . . . . . 42,571 65,239 68,291
Total . . . . . . . . . . . . . . . . . . . . . . . . . . . . . . . . . . . . . . . . . . . . . . . . . . . . . . . . . . . 1,016,789 1,284,243 1,053,146
Pictures
Customers . . . . . . . . . . . . . . . . . . . . . . . . . . . . . . . . . . . . . . . . . . . . . . . . . . . . . . 966,260 855,482 717,513
Intersegment . . . . . . . . . . . . . . . . . . . . . . . . . . . . . . . . . . . . . . . . . . . . . . . . . . . . . — 2,452 —
Total . . . . . . . . . . . . . . . . . . . . . . . . . . . . . . . . . . . . . . . . . . . . . . . . . . . . . . . . . . . 966,260 857,934 717,513
Financial Services
Customers . . . . . . . . . . . . . . . . . . . . . . . . . . . . . . . . . . . . . . . . . . . . . . . . . . . . . . 624,282 553,216 523,307
Intersegment . . . . . . . . . . . . . . . . . . . . . . . . . . . . . . . . . . . . . . . . . . . . . . . . . . . . . 25,059 27,905 14,899
Total . . . . . . . . . . . . . . . . . . . . . . . . . . . . . . . . . . . . . . . . . . . . . . . . . . . . . . . . . . . 649,341 581,121 538,206
All Other
Customers . . . . . . . . . . . . . . . . . . . . . . . . . . . . . . . . . . . . . . . . . . . . . . . . . . . . . . 287,599 312,004 471,398
Intersegment . . . . . . . . . . . . . . . . . . . . . . . . . . . . . . . . . . . . . . . . . . . . . . . . . . . . . 67,525 70,194 68,205
Total . . . . . . . . . . . . . . . . . . . . . . . . . . . . . . . . . . . . . . . . . . . . . . . . . . . . . . . . . . . 355,124 382,198 539,603
Elimination . . . . . . . . . . . . . . . . . . . . . . . . . . . . . . . . . . . . . . . . . . . . . . . . . . . . . . . . (764,197) (847,892) (606,430)
Consolidated total . . . . . . . . . . . . . . . . . . . . . . . . . . . . . . . . . . . . . . . . . . . . . . . . . . 8,295,695 8,871,414 7,729,993
* Electronics intersegment amounts primarily consist of transactions with the Game segment, Pictures segment and All Other . Game intersegment amounts primarily consist of transactions with the Electronics segment . All Other intersegment amounts primarily consist of transactions with the Electronics, Game and Picture segments .
Segment InformationSony Corporation and Consolidated Subsidiaries—Years ended March 31
Operating incOme (lOSS) by buSineSS Segment*
Yen in millions
Years ended March 31 2007 2008 2009
Electronics . . . . . . . . . . . . . . . . . . . . . . . . . . . . . . . . . . . . . . . . . . . . . . . . . . . . . . . . 251,256 441,787 (168,084)
Game . . . . . . . . . . . . . . . . . . . . . . . . . . . . . . . . . . . . . . . . . . . . . . . . . . . . . . . . . . . . (232,325) (124,526) (58,476)
Pictures . . . . . . . . . . . . . . . . . . . . . . . . . . . . . . . . . . . . . . . . . . . . . . . . . . . . . . . . . . 26,705 58,524 29,916
Financial Services . . . . . . . . . . . . . . . . . . . . . . . . . . . . . . . . . . . . . . . . . . . . . . . . . . . 84,142 22,633 (31,157)
All Other . . . . . . . . . . . . . . . . . . . . . . . . . . . . . . . . . . . . . . . . . . . . . . . . . . . . . . . . . . 32,808 60,800 30,367
Total . . . . . . . . . . . . . . . . . . . . . . . . . . . . . . . . . . . . . . . . . . . . . . . . . . . . . . . . . . . . . 162,586 459,218 (197,434)
Corporate and elimination . . . . . . . . . . . . . . . . . . . . . . . . . . . . . . . . . . . . . . . . . . . . (12,182) 16,081 (30,349)
Consolidated total . . . . . . . . . . . . . . . . . . . . . . . . . . . . . . . . . . . . . . . . . . . . . . . . . . 150,404 475,299 (227,783)
* Operating income (loss) is sales and operating revenue less costs and expenses, and includes equity in net income (loss) of affiliated companies .

37
electrOnicS SaleS and Operating revenue tO cuStOmerS by prOduct categOry
Yen in millions
Years ended March 31 2007 2008 2009
Audio . . . . . . . . . . . . . . . . . . . . . . . . . . . . . . . . . . . . . . . . . . . . . . . . . . . . . . . . . . . . 522,879 558,624 453,976
Video . . . . . . . . . . . . . . . . . . . . . . . . . . . . . . . . . . . . . . . . . . . . . . . . . . . . . . . . . . . . 1,143,120 1,279,225 1,042,014
Televisions . . . . . . . . . . . . . . . . . . . . . . . . . . . . . . . . . . . . . . . . . . . . . . . . . . . . . . . . 1,226,971 1,367,078 1,275,810
Information and Communications . . . . . . . . . . . . . . . . . . . . . . . . . . . . . . . . . . . . . . . 954,163 1,103,212 942,517
Semiconductors . . . . . . . . . . . . . . . . . . . . . . . . . . . . . . . . . . . . . . . . . . . . . . . . . . . . 219,546 237,870 205,062
Components . . . . . . . . . . . . . . . . . . . . . . . . . . . . . . . . . . . . . . . . . . . . . . . . . . . . . . 835,490 833,334 662,453
Other . . . . . . . . . . . . . . . . . . . . . . . . . . . . . . . . . . . . . . . . . . . . . . . . . . . . . . . . . . . . 541,167 552,365 451,088
Total . . . . . . . . . . . . . . . . . . . . . . . . . . . . . . . . . . . . . . . . . . . . . . . . . . . . . . . . . . . . . 5,443,336 5,931,708 5,032,920
Note: The above table is a breakdown of Electronics sales and operating revenue to external customers by product category .
SaleS and Operating revenue by geOgraphic infOrmatiOn
Yen in millions
Years ended March 31 2007 2008 2009
Japan . . . . . . . . . . . . . . . . . . . . . . . . . . . . . . . . . . . . . . . . . . . . . . . . . . . . . . . . . . . . 2,127,841 2,056,374 1,873,219
. . . . . . . . . . . . . . . . . . . . . . . . . . . . . . . . . . . . . . . . . . . . . . . . . . . . . . . . . . . . . . . . . . . . . . . . 25 .6% 23 .2% 24.2%
U .S .A . . . . . . . . . . . . . . . . . . . . . . . . . . . . . . . . . . . . . . . . . . . . . . . . . . . . . . . . . . . . 2,232,453 2,221,862 1,827,812
. . . . . . . . . . . . . . . . . . . . . . . . . . . . . . . . . . . . . . . . . . . . . . . . . . . . . . . . . . . . . . . . . . . . . . . . 26 .9 25 .1 23.6
Europe . . . . . . . . . . . . . . . . . . . . . . . . . . . . . . . . . . . . . . . . . . . . . . . . . . . . . . . . . . . 2,037,658 2,328,233 1,987,692
. . . . . . . . . . . . . . . . . . . . . . . . . . . . . . . . . . . . . . . . . . . . . . . . . . . . . . . . . . . . . . . . . . . . . . . . 24 .6 26 .2 25.7
Other . . . . . . . . . . . . . . . . . . . . . . . . . . . . . . . . . . . . . . . . . . . . . . . . . . . . . . . . . . . . 1,897,743 2,264,945 2,041,270
. . . . . . . . . . . . . . . . . . . . . . . . . . . . . . . . . . . . . . . . . . . . . . . . . . . . . . . . . . . . . . . . . . . . . . . . 22 .9 25 .5 26.5
Total . . . . . . . . . . . . . . . . . . . . . . . . . . . . . . . . . . . . . . . . . . . . . . . . . . . . . . . . . . . . . 8,295,695 8,871,414 7,729,993
Note: Classification of geographic segment information shows sales and operating revenue recognized by location of customers .

38
Yen in millions
2008 2009
ASSETS
Current assets:
Cash and cash equivalents . . . . . . . . . . . . . . . . . . . . . . . . . . . . . . . . . . . . . . . . . . . . . . . . . . . . . . . . 1,086,431 660,789
Call loan in the banking business . . . . . . . . . . . . . . . . . . . . . . . . . . . . . . . . . . . . . . . . . . . . . . . . . . . 352,569 49,909
Marketable securities . . . . . . . . . . . . . . . . . . . . . . . . . . . . . . . . . . . . . . . . . . . . . . . . . . . . . . . . . . . . 427,709 466,912
Notes and accounts receivable, trade . . . . . . . . . . . . . . . . . . . . . . . . . . . . . . . . . . . . . . . . . . . . . . . . 1,183,620 963,837
Allowance for doubtful accounts and sales returns . . . . . . . . . . . . . . . . . . . . . . . . . . . . . . . . . . . . . . (93,335) (110,383)
Inventories . . . . . . . . . . . . . . . . . . . . . . . . . . . . . . . . . . . . . . . . . . . . . . . . . . . . . . . . . . . . . . . . . . . . 1,021,595 813,068
Deferred income taxes . . . . . . . . . . . . . . . . . . . . . . . . . . . . . . . . . . . . . . . . . . . . . . . . . . . . . . . . . . . 237,073 189,703
Prepaid expenses and other current assets . . . . . . . . . . . . . . . . . . . . . . . . . . . . . . . . . . . . . . . . . . . 794,001 586,800
Total current assets . . . . . . . . . . . . . . . . . . . . . . . . . . . . . . . . . . . . . . . . . . . . . . . . . . . . . . . . . . . . 5,009,663 3,620,635
Film costs . . . . . . . . . . . . . . . . . . . . . . . . . . . . . . . . . . . . . . . . . . . . . . . . . . . . . . . . . . . . . . . . . . . . . 304,243 306,877
Investments and advances:
Affiliated companies . . . . . . . . . . . . . . . . . . . . . . . . . . . . . . . . . . . . . . . . . . . . . . . . . . . . . . . . . . . . . 381,188 236,779
Securities investments and other . . . . . . . . . . . . . . . . . . . . . . . . . . . . . . . . . . . . . . . . . . . . . . . . . . . 3,954,460 4,561,651
. . . . . . . . . . . . . . . . . . . . . . . . . . . . . . . . . . . . . . . . . . . . . . . . . . . . . . . . . . . . . . . . . . . . . . . . . 4,335,648 4,798,430
Property, plant and equipment:
Land . . . . . . . . . . . . . . . . . . . . . . . . . . . . . . . . . . . . . . . . . . . . . . . . . . . . . . . . . . . . . . . . . . . . . . . . 158,289 155,665
Buildings . . . . . . . . . . . . . . . . . . . . . . . . . . . . . . . . . . . . . . . . . . . . . . . . . . . . . . . . . . . . . . . . . . . . . 903,116 911,269
Machinery and equipment . . . . . . . . . . . . . . . . . . . . . . . . . . . . . . . . . . . . . . . . . . . . . . . . . . . . . . . . 2,483,016 2,343,839
Construction in progress . . . . . . . . . . . . . . . . . . . . . . . . . . . . . . . . . . . . . . . . . . . . . . . . . . . . . . . . . 55,740 100,027
. . . . . . . . . . . . . . . . . . . . . . . . . . . . . . . . . . . . . . . . . . . . . . . . . . . . . . . . . . . . . . . . . . . . . . . . . 3,600,161 3,510,800
Less—Accumulated depreciation . . . . . . . . . . . . . . . . . . . . . . . . . . . . . . . . . . . . . . . . . . . . . . . . . . . 2,356,812 2,334,937
. . . . . . . . . . . . . . . . . . . . . . . . . . . . . . . . . . . . . . . . . . . . . . . . . . . . . . . . . . . . . . . . . . . . . . . . . 1,243,349 1,175,863
Other assets:
Intangibles, net . . . . . . . . . . . . . . . . . . . . . . . . . . . . . . . . . . . . . . . . . . . . . . . . . . . . . . . . . . . . . . . . . 263,490 396,348
Goodwill . . . . . . . . . . . . . . . . . . . . . . . . . . . . . . . . . . . . . . . . . . . . . . . . . . . . . . . . . . . . . . . . . . . . . . 304,423 443,958
Deferred insurance acquisition costs . . . . . . . . . . . . . . . . . . . . . . . . . . . . . . . . . . . . . . . . . . . . . . . . 396,819 400,412
Deferred income taxes . . . . . . . . . . . . . . . . . . . . . . . . . . . . . . . . . . . . . . . . . . . . . . . . . . . . . . . . . . . 198,666 359,050
Other . . . . . . . . . . . . . . . . . . . . . . . . . . . . . . . . . . . . . . . . . . . . . . . . . . . . . . . . . . . . . . . . . . . . . . . . 496,438 511,938
. . . . . . . . . . . . . . . . . . . . . . . . . . . . . . . . . . . . . . . . . . . . . . . . . . . . . . . . . . . . . . . . . . . . . . . . . 1,659,836 2,111,706
Total assets . . . . . . . . . . . . . . . . . . . . . . . . . . . . . . . . . . . . . . . . . . . . . . . . . . . . . . . . . . . . . . . . . . . 12,552,739 12,013,511
(Continued on following page)
Consolidated Balance SheetsSony Corporation and Consolidated Subsidiaries—As of March 31

39
Yen in millions
2008 2009
LIABILITIES AND STOCKHOLDERS’ EQUITY
Current liabilities:
Short-term borrowings . . . . . . . . . . . . . . . . . . . . . . . . . . . . . . . . . . . . . . . . . . . . . . . . . . . . . . . . . . . 63,224 303,615
Current portion of long-term debt . . . . . . . . . . . . . . . . . . . . . . . . . . . . . . . . . . . . . . . . . . . . . . . . . . . 291,879 147,540
Notes and accounts payable, trade . . . . . . . . . . . . . . . . . . . . . . . . . . . . . . . . . . . . . . . . . . . . . . . . . 920,920 560,795
Accounts payable, other and accrued expenses . . . . . . . . . . . . . . . . . . . . . . . . . . . . . . . . . . . . . . . 896,598 1,036,830
Accrued income and other taxes . . . . . . . . . . . . . . . . . . . . . . . . . . . . . . . . . . . . . . . . . . . . . . . . . . . 200,803 46,683
Deposits from customers in the banking business . . . . . . . . . . . . . . . . . . . . . . . . . . . . . . . . . . . . . . 1,144,399 1,326,360
Other . . . . . . . . . . . . . . . . . . . . . . . . . . . . . . . . . . . . . . . . . . . . . . . . . . . . . . . . . . . . . . . . . . . . . . . . 505,544 389,077
Total current liabilities . . . . . . . . . . . . . . . . . . . . . . . . . . . . . . . . . . . . . . . . . . . . . . . . . . . . . . . . . . 4,023,367 3,810,900
Long-term liabilities:
Long-term debt . . . . . . . . . . . . . . . . . . . . . . . . . . . . . . . . . . . . . . . . . . . . . . . . . . . . . . . . . . . . . . . . 729,059 660,147
Accrued pension and severance costs . . . . . . . . . . . . . . . . . . . . . . . . . . . . . . . . . . . . . . . . . . . . . . 231,237 365,706
Deferred income taxes . . . . . . . . . . . . . . . . . . . . . . . . . . . . . . . . . . . . . . . . . . . . . . . . . . . . . . . . . . 268,600 188,359
Future insurance policy benefits and other . . . . . . . . . . . . . . . . . . . . . . . . . . . . . . . . . . . . . . . . . . . . 3,298,506 3,521,060
Other . . . . . . . . . . . . . . . . . . . . . . . . . . . . . . . . . . . . . . . . . . . . . . . . . . . . . . . . . . . . . . . . . . . . . . . . 260,032 250,737
Total long-term liabilities . . . . . . . . . . . . . . . . . . . . . . . . . . . . . . . . . . . . . . . . . . . . . . . . . . . . . . . . 4,787,434 4,986,009
Total liabilities . . . . . . . . . . . . . . . . . . . . . . . . . . . . . . . . . . . . . . . . . . . . . . . . . . . . . . . . . . . . . . . . 8,810,801 8,796,909
Minority interest in consolidated subsidiaries . . . . . . . . . . . . . . . . . . . . . . . . . . . . . . . . . . . . . . . 276,849 251,949
Stockholders’ equity:
Common stock, no par value—
2008—Shares authorized 3,600,000,000, shares issued 1,004,443,364 . . . . . . . . . . . . . . . . . . . 630,576
2009—Shares authorized 3,600,000,000, shares issued 1,004,535,364 . . . . . . . . . . . . . . . . . . . 630,765
Additional paid-in capital . . . . . . . . . . . . . . . . . . . . . . . . . . . . . . . . . . . . . . . . . . . . . . . . . . . . . . . . . 1,151,447 1,155,034
Retained earnings . . . . . . . . . . . . . . . . . . . . . . . . . . . . . . . . . . . . . . . . . . . . . . . . . . . . . . . . . . . . . . 2,059,361 1,916,951
Accumulated other comprehensive income—
Unrealized gains on securities, net . . . . . . . . . . . . . . . . . . . . . . . . . . . . . . . . . . . . . . . . . . . . . . . . 70,929 30,070
Unrealized losses on derivative instruments, net . . . . . . . . . . . . . . . . . . . . . . . . . . . . . . . . . . . . . . (3,371) (1,584)
Pension liability adjustment . . . . . . . . . . . . . . . . . . . . . . . . . . . . . . . . . . . . . . . . . . . . . . . . . . . . . . (97,562) (172,709)
Foreign currency translation adjustments . . . . . . . . . . . . . . . . . . . . . . . . . . . . . . . . . . . . . . . . . . . (341,523) (589,220)
. . . . . . . . . . . . . . . . . . . . . . . . . . . . . . . . . . . . . . . . . . . . . . . . . . . . . . . . . . . . . . . . . . . . . . . . . (371,527) (733,443)
Treasury stock, at cost
Common stock (2008—1,015,596 shares) . . . . . . . . . . . . . . . . . . . . . . . . . . . . . . . . . . . . . . . . . . (4,768)
Common stock (2009—1,013,287 shares) . . . . . . . . . . . . . . . . . . . . . . . . . . . . . . . . . . . . . . . . . . (4,654)
. . . . . . . . . . . . . . . . . . . . . . . . . . . . . . . . . . . . . . . . . . . . . . . . . . . . . . . . . . . . . . . . . . . . . . . . . 3,465,089 2,964,653
Total liabilities and stockholders’ equity . . . . . . . . . . . . . . . . . . . . . . . . . . . . . . . . . . . . . . . . . . . 12,552,739 12,013,511
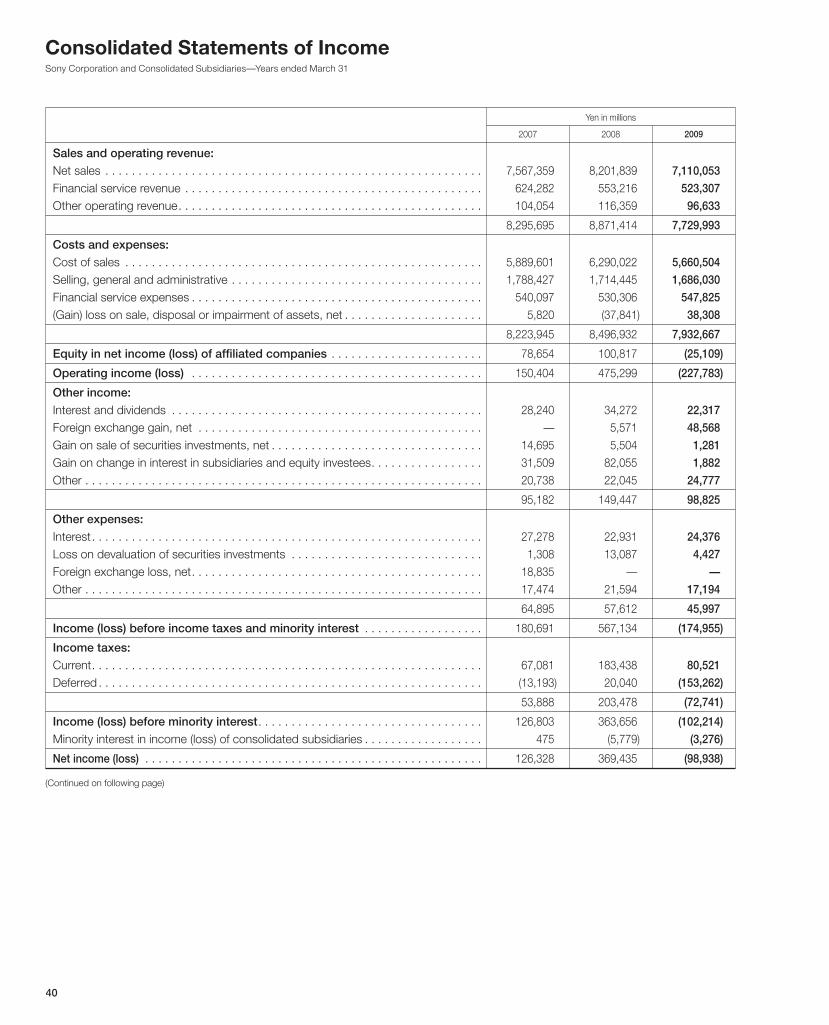
40
Yen in millions
2007 2008 2009
Sales and operating revenue:
Net sales . . . . . . . . . . . . . . . . . . . . . . . . . . . . . . . . . . . . . . . . . . . . . . . . . . . . . . . . . 7,567,359 8,201,839 7,110,053
Financial service revenue . . . . . . . . . . . . . . . . . . . . . . . . . . . . . . . . . . . . . . . . . . . . . 624,282 553,216 523,307
Other operating revenue . . . . . . . . . . . . . . . . . . . . . . . . . . . . . . . . . . . . . . . . . . . . . . 104,054 116,359 96,633
. . . . . . . . . . . . . . . . . . . . . . . . . . . . . . . . . . . . . . . . . . . . . . . . . . . . . . . . . . . . . . . 8,295,695 8,871,414 7,729,993
Costs and expenses:
Cost of sales . . . . . . . . . . . . . . . . . . . . . . . . . . . . . . . . . . . . . . . . . . . . . . . . . . . . . . 5,889,601 6,290,022 5,660,504
Selling, general and administrative . . . . . . . . . . . . . . . . . . . . . . . . . . . . . . . . . . . . . . 1,788,427 1,714,445 1,686,030
Financial service expenses . . . . . . . . . . . . . . . . . . . . . . . . . . . . . . . . . . . . . . . . . . . . 540,097 530,306 547,825
(Gain) loss on sale, disposal or impairment of assets, net . . . . . . . . . . . . . . . . . . . . . 5,820 (37,841) 38,308
. . . . . . . . . . . . . . . . . . . . . . . . . . . . . . . . . . . . . . . . . . . . . . . . . . . . . . . . . . . . . . . 8,223,945 8,496,932 7,932,667
Equity in net income (loss) of affiliated companies . . . . . . . . . . . . . . . . . . . . . . . 78,654 100,817 (25,109)
Operating income (loss) . . . . . . . . . . . . . . . . . . . . . . . . . . . . . . . . . . . . . . . . . . . . 150,404 475,299 (227,783)
Other income:
Interest and dividends . . . . . . . . . . . . . . . . . . . . . . . . . . . . . . . . . . . . . . . . . . . . . . . 28,240 34,272 22,317
Foreign exchange gain, net . . . . . . . . . . . . . . . . . . . . . . . . . . . . . . . . . . . . . . . . . . . — 5,571 48,568
Gain on sale of securities investments, net . . . . . . . . . . . . . . . . . . . . . . . . . . . . . . . . 14,695 5,504 1,281
Gain on change in interest in subsidiaries and equity investees . . . . . . . . . . . . . . . . . 31,509 82,055 1,882
Other . . . . . . . . . . . . . . . . . . . . . . . . . . . . . . . . . . . . . . . . . . . . . . . . . . . . . . . . . . . . 20,738 22,045 24,777
. . . . . . . . . . . . . . . . . . . . . . . . . . . . . . . . . . . . . . . . . . . . . . . . . . . . . . . . . . . . . . . 95,182 149,447 98,825
Other expenses:
Interest . . . . . . . . . . . . . . . . . . . . . . . . . . . . . . . . . . . . . . . . . . . . . . . . . . . . . . . . . . . 27,278 22,931 24,376
Loss on devaluation of securities investments . . . . . . . . . . . . . . . . . . . . . . . . . . . . . 1,308 13,087 4,427
Foreign exchange loss, net . . . . . . . . . . . . . . . . . . . . . . . . . . . . . . . . . . . . . . . . . . . . 18,835 — —
Other . . . . . . . . . . . . . . . . . . . . . . . . . . . . . . . . . . . . . . . . . . . . . . . . . . . . . . . . . . . . 17,474 21,594 17,194
. . . . . . . . . . . . . . . . . . . . . . . . . . . . . . . . . . . . . . . . . . . . . . . . . . . . . . . . . . . . . . . 64,895 57,612 45,997
Income (loss) before income taxes and minority interest . . . . . . . . . . . . . . . . . . 180,691 567,134 (174,955)
Income taxes: Current . . . . . . . . . . . . . . . . . . . . . . . . . . . . . . . . . . . . . . . . . . . . . . . . . . . . . . . . . . . 67,081 183,438 80,521
Deferred . . . . . . . . . . . . . . . . . . . . . . . . . . . . . . . . . . . . . . . . . . . . . . . . . . . . . . . . . . (13,193) 20,040 (153,262)
. . . . . . . . . . . . . . . . . . . . . . . . . . . . . . . . . . . . . . . . . . . . . . . . . . . . . . . . . . . . . . . 53,888 203,478 (72,741)
Income (loss) before minority interest . . . . . . . . . . . . . . . . . . . . . . . . . . . . . . . . . . 126,803 363,656 (102,214)
Minority interest in income (loss) of consolidated subsidiaries . . . . . . . . . . . . . . . . . . 475 (5,779) (3,276)
Net income (loss) . . . . . . . . . . . . . . . . . . . . . . . . . . . . . . . . . . . . . . . . . . . . . . . . . . . 126,328 369,435 (98,938)
(Continued on following page)
Consolidated Statements of IncomeSony Corporation and Consolidated Subsidiaries—Years ended March 31

41
Yen
2007 2008 2009
Per share data:
Common stock Net income (loss) —Basic . . . . . . . . . . . . . . . . . . . . . . . . . . . . . . . . . . . . . . . . . . . . . . . . . . . . . . . 126 .15 368 .33 (98.59)
—Diluted . . . . . . . . . . . . . . . . . . . . . . . . . . . . . . . . . . . . . . . . . . . . . . . . . . . . . . 120 .29 351 .10 (98.59)
Cash dividends . . . . . . . . . . . . . . . . . . . . . . . . . . . . . . . . . . . . . . . . . . . . . . . . . . . 25 .00 25 .00 42.50

42
Yen in millions
2007 2008 2009
Cash flows from operating activities:
Net income (loss) . . . . . . . . . . . . . . . . . . . . . . . . . . . . . . . . . . . . . . . . . . . . . . . . . 126,328 369,435 (98,938)
Adjustments to reconcile net income (loss) to net cash provided
by operating activities—
Depreciation and amortization, including amortization of deferred insurance
acquisition costs . . . . . . . . . . . . . . . . . . . . . . . . . . . . . . . . . . . . . . . . . . . . . . . 400,009 428,010 405,443
Amortization of film costs . . . . . . . . . . . . . . . . . . . . . . . . . . . . . . . . . . . . . . . . . . 368,382 305,468 255,713
Stock-based compensation expense . . . . . . . . . . . . . . . . . . . . . . . . . . . . . . . . 3,838 4,130 3,446
Accrual for pension and severance costs, less payments . . . . . . . . . . . . . . . . . (22,759) (17,589) 16,654
(Gain) loss on sale, disposal or impairment of assets, net . . . . . . . . . . . . . . . . . 5,820 (37,841) 38,308
(Gain) loss on sale or devaluation of securities investments, net . . . . . . . . . . . . (13,387) 7,583 3,146
(Gain) loss on revaluation of marketable securities held in the financial service
business for trading purpose, net . . . . . . . . . . . . . . . . . . . . . . . . . . . . . . . . . . (11,857) 56,543 77,952
Loss on revaluation or impairment of securities investments held
in the financial service business, net . . . . . . . . . . . . . . . . . . . . . . . . . . . . . . . . 208 60,107 101,114
Gain on change in interest in subsidiaries and equity investees . . . . . . . . . . . . . (31,509) (82,055) (1,882)
Deferred income taxes . . . . . . . . . . . . . . . . . . . . . . . . . . . . . . . . . . . . . . . . . . . . (13,193) 20,040 (153,262)
Equity in net (income) losses of affiliated companies, net of dividends . . . . . . . . (68,179) (13,527) 65,470
Changes in assets and liabilities:
(Increase) decrease in notes and accounts receivable, trade . . . . . . . . . . . . . (357,891) 185,651 218,168
(Increase) decrease in inventories . . . . . . . . . . . . . . . . . . . . . . . . . . . . . . . . . . (119,202) (140,725) 160,432
Increase in film costs . . . . . . . . . . . . . . . . . . . . . . . . . . . . . . . . . . . . . . . . . . . (320,079) (353,343) (264,412)
Increase (decrease) in notes and accounts payable, trade . . . . . . . . . . . . . . . 362,079 (235,459) (375,842)
Increase (decrease) in accrued income and other taxes . . . . . . . . . . . . . . . . . (14,396) 138,872 (163,200)
Increase in future insurance policy benefits and other . . . . . . . . . . . . . . . . . . . 172,498 166,356 174,549
Increase in deferred insurance acquisition costs . . . . . . . . . . . . . . . . . . . . . . . (61,563) (62,951) (68,666)
(Increase) decrease in marketable securities held in the financial service
business for trading purpose . . . . . . . . . . . . . . . . . . . . . . . . . . . . . . . . . . . . 31,732 (57,271) (26,088)
(Increase) decrease in other current assets . . . . . . . . . . . . . . . . . . . . . . . . . . . (35,133) (24,312) 134,175
Increase (decrease) in other current liabilities . . . . . . . . . . . . . . . . . . . . . . . . . 73,222 51,838 (105,155)
Other . . . . . . . . . . . . . . . . . . . . . . . . . . . . . . . . . . . . . . . . . . . . . . . . . . . . . . . . . 86,060 (11,276) 10,028
Net cash provided by operating activities . . . . . . . . . . . . . . . . . . . . . . . . . 561,028 757,684 407,153
(Continued on following page)
Consolidated Statements of Cash FlowsSony Corporation and Consolidated Subsidiaries—Years ended March 31

43
Yen in millions
2007 2008 2009
Cash flows from investing activities:
Payments for purchases of long-lived assets . . . . . . . . . . . . . . . . . . . . . . . . . . . . . (527,515) (474,552) (496,125)
Proceeds from sales of long-lived assets . . . . . . . . . . . . . . . . . . . . . . . . . . . . . . . . 87,319 144,741 153,439
Payments for investments and advances by financial service business . . . . . . . . . (914,754) (2,283,491) (2,496,783)
Payments for investments and advances (other than financial service business) . . . (100,152) (103,082) (178,335)
Proceeds from maturities of marketable securities, sales of securities
investments and collections of advances by financial service business . . . . . . . . . . 679,772 1,441,496 1,923,264
Proceeds from maturities of marketable securities, sales of securities
investments and collections of advances (other than financial service business) . . . 22,828 51,947 11,569
Proceeds from sales of subsidiaries’ and equity investees’ stocks . . . . . . . . . . . . . 43,157 307,133 2,234
Other . . . . . . . . . . . . . . . . . . . . . . . . . . . . . . . . . . . . . . . . . . . . . . . . . . . . . . . . . . (6,085) 5,366 (605)
Net cash used in investing activities . . . . . . . . . . . . . . . . . . . . . . . . . . . . . (715,430) (910,442) (1,081,342)
Cash flows from financing activities:
Proceeds from issuance of long-term debt . . . . . . . . . . . . . . . . . . . . . . . . . . . . . . 270,780 31,093 72,188
Payments of long-term debt . . . . . . . . . . . . . . . . . . . . . . . . . . . . . . . . . . . . . . . . . (182,374) (34,701) (264,467)
Increase in short-term borrowings, net . . . . . . . . . . . . . . . . . . . . . . . . . . . . . . . . . 6,096 15,838 244,584
Increase in deposits from customers in the financial service business, net . . . . . . . 273,435 485,965 261,619
Decrease in call money and bills sold in the banking business, net . . . . . . . . . . . . (100,700) — —
Dividends paid . . . . . . . . . . . . . . . . . . . . . . . . . . . . . . . . . . . . . . . . . . . . . . . . . . . (25,052) (25,098) (42,594)
Proceeds from the issuance of shares under stock-based compensation plans . . 5,566 7,484 378
Proceeds from the issuance of shares by subsidiaries . . . . . . . . . . . . . . . . . . . . . . 2,217 28,943 —
Other . . . . . . . . . . . . . . . . . . . . . . . . . . . . . . . . . . . . . . . . . . . . . . . . . . . . . . . . . (2,065) (4,006) (4,250)
Net cash provided by financing activities . . . . . . . . . . . . . . . . . . . . . . . . . 247,903 505,518 267,458
Effect of exchange rate changes on cash and cash equivalents . . . . . . . . . . . . . . . . 3,300 (66,228) (18,911)
Net increase (decrease) in cash and cash equivalents . . . . . . . . . . . . . . . . . . . . . . . 96,801 286,532 (425,642)
Cash and cash equivalents at beginning of the fiscal year . . . . . . . . . . . . . . . . . . . . 703,098 799,899 1,086,431
Cash and cash equivalents at end of the fiscal year . . . . . . . . . . . . . . . . . . . . . . . . . 799,899 1,086,431 660,789
Supplemental data:
Cash paid during the fiscal year for—
Income taxes . . . . . . . . . . . . . . . . . . . . . . . . . . . . . . . . . . . . . . . . . . . . . . . . . . . . 104,822 126,339 242,528
Interest . . . . . . . . . . . . . . . . . . . . . . . . . . . . . . . . . . . . . . . . . . . . . . . . . . . . . . . . 23,000 18,817 22,729
Non-cash investing and financing activities—
Obtaining assets by entering into capital lease . . . . . . . . . . . . . . . . . . . . . . . . . . . 13,784 7,017 5,831
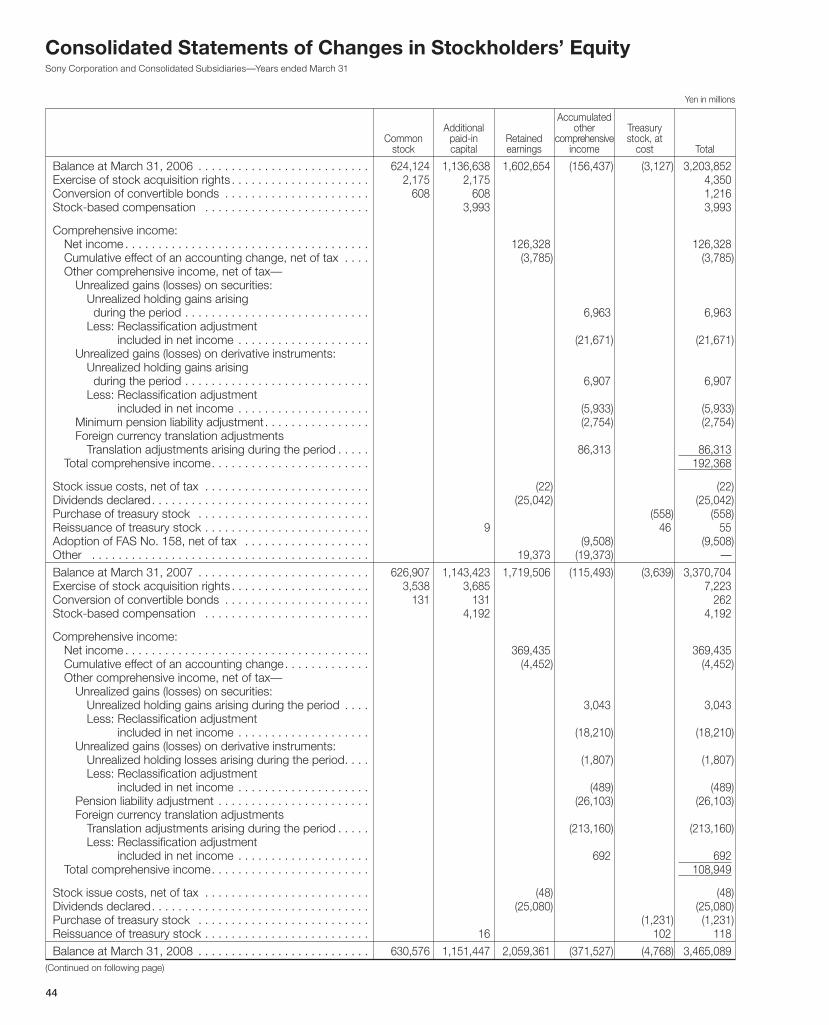
44
Yen in millions
Accumulated Additional other Treasury Common paid-in Retained comprehensive stock, at stock capital earnings income cost Total
Balance at March 31, 2006 . . . . . . . . . . . . . . . . . . . . . . . . . . 624,124 1,136,638 1,602,654 (156,437) (3,127) 3,203,852Exercise of stock acquisition rights . . . . . . . . . . . . . . . . . . . . . 2,175 2,175 4,350Conversion of convertible bonds . . . . . . . . . . . . . . . . . . . . . . 608 608 1,216Stock-based compensation . . . . . . . . . . . . . . . . . . . . . . . . . 3,993 3,993
Comprehensive income: Net income . . . . . . . . . . . . . . . . . . . . . . . . . . . . . . . . . . . . . 126,328 126,328 Cumulative effect of an accounting change, net of tax . . . . (3,785) (3,785) Other comprehensive income, net of tax— Unrealized gains (losses) on securities: Unrealized holding gains arising during the period . . . . . . . . . . . . . . . . . . . . . . . . . . . . 6,963 6,963 Less: Reclassification adjustment Less: included in net income . . . . . . . . . . . . . . . . . . . . (21,671) (21,671) Unrealized gains (losses) on derivative instruments: Unrealized holding gains arising during the period . . . . . . . . . . . . . . . . . . . . . . . . . . . . 6,907 6,907 Less: Reclassification adjustment Less: included in net income . . . . . . . . . . . . . . . . . . . . (5,933) (5,933) Minimum pension liability adjustment . . . . . . . . . . . . . . . . (2,754) (2,754) Foreign currency translation adjustments Translation adjustments arising during the period . . . . . 86,313 86,313 Total comprehensive income . . . . . . . . . . . . . . . . . . . . . . . . 192,368
Stock issue costs, net of tax . . . . . . . . . . . . . . . . . . . . . . . . . (22) (22)Dividends declared . . . . . . . . . . . . . . . . . . . . . . . . . . . . . . . . . (25,042) (25,042)Purchase of treasury stock . . . . . . . . . . . . . . . . . . . . . . . . . . (558) (558)Reissuance of treasury stock . . . . . . . . . . . . . . . . . . . . . . . . . 9 46 55Adoption of FAS No . 158, net of tax . . . . . . . . . . . . . . . . . . . (9,508) (9,508)Other . . . . . . . . . . . . . . . . . . . . . . . . . . . . . . . . . . . . . . . . . . 19,373 (19,373) —Balance at March 31, 2007 . . . . . . . . . . . . . . . . . . . . . . . . . . 626,907 1,143,423 1,719,506 (115,493) (3,639) 3,370,704Exercise of stock acquisition rights . . . . . . . . . . . . . . . . . . . . . 3,538 3,685 7,223Conversion of convertible bonds . . . . . . . . . . . . . . . . . . . . . . 131 131 262Stock-based compensation . . . . . . . . . . . . . . . . . . . . . . . . . 4,192 4,192
Comprehensive income: Net income . . . . . . . . . . . . . . . . . . . . . . . . . . . . . . . . . . . . . 369,435 369,435 Cumulative effect of an accounting change . . . . . . . . . . . . . (4,452) (4,452) Other comprehensive income, net of tax— Unrealized gains (losses) on securities: Unrealized holding gains arising during the period . . . . 3,043 3,043 Less: Reclassification adjustment Less: included in net income . . . . . . . . . . . . . . . . . . . . (18,210) (18,210) Unrealized gains (losses) on derivative instruments: Unrealized holding losses arising during the period . . . . (1,807) (1,807) Less: Reclassification adjustment Less: included in net income . . . . . . . . . . . . . . . . . . . . (489) (489) Pension liability adjustment . . . . . . . . . . . . . . . . . . . . . . . (26,103) (26,103) Foreign currency translation adjustments Translation adjustments arising during the period . . . . . (213,160) (213,160) Less: Reclassification adjustment Less: included in net income . . . . . . . . . . . . . . . . . . . . 692 692 Total comprehensive income . . . . . . . . . . . . . . . . . . . . . . . . 108,949
Stock issue costs, net of tax . . . . . . . . . . . . . . . . . . . . . . . . . (48) (48)Dividends declared . . . . . . . . . . . . . . . . . . . . . . . . . . . . . . . . . (25,080) (25,080)Purchase of treasury stock . . . . . . . . . . . . . . . . . . . . . . . . . . (1,231) (1,231)Reissuance of treasury stock . . . . . . . . . . . . . . . . . . . . . . . . . 16 102 118Balance at March 31, 2008 . . . . . . . . . . . . . . . . . . . . . . . . . . 630,576 1,151,447 2,059,361 (371,527) (4,768) 3,465,089
(Continued on following page)
Consolidated Statements of Changes in Stockholders’ EquitySony Corporation and Consolidated Subsidiaries—Years ended March 31
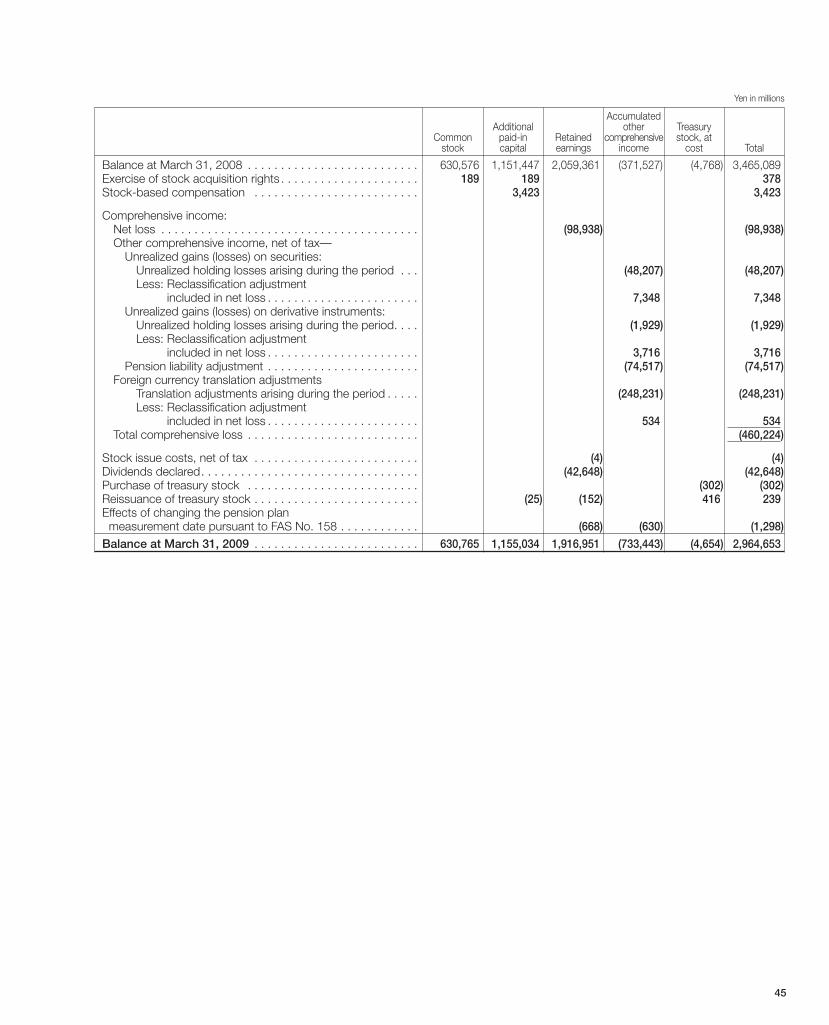
45
Yen in millions
Accumulated Additional other Treasury Common paid-in Retained comprehensive stock, at stock capital earnings income cost Total
Balance at March 31, 2008 . . . . . . . . . . . . . . . . . . . . . . . . . . 630,576 1,151,447 2,059,361 (371,527) (4,768) 3,465,089Exercise of stock acquisition rights . . . . . . . . . . . . . . . . . . . . . 189 189 378Stock-based compensation . . . . . . . . . . . . . . . . . . . . . . . . . 3,423 3,423
Comprehensive income: Net loss . . . . . . . . . . . . . . . . . . . . . . . . . . . . . . . . . . . . . . . (98,938) (98,938) Other comprehensive income, net of tax— Unrealized gains (losses) on securities: Unrealized holding losses arising during the period . . . (48,207) (48,207) Less: Reclassification adjustment Less: included in net loss . . . . . . . . . . . . . . . . . . . . . . . 7,348 7,348 Unrealized gains (losses) on derivative instruments: Unrealized holding losses arising during the period . . . . (1,929) (1,929) Less: Reclassification adjustment Less: included in net loss . . . . . . . . . . . . . . . . . . . . . . . 3,716 3,716 Pension liability adjustment . . . . . . . . . . . . . . . . . . . . . . . (74,517) (74,517) Foreign currency translation adjustments Translation adjustments arising during the period . . . . . (248,231) (248,231) Less: Reclassification adjustment Less: included in net loss . . . . . . . . . . . . . . . . . . . . . . . 534 534 Total comprehensive loss . . . . . . . . . . . . . . . . . . . . . . . . . . (460,224)
Stock issue costs, net of tax . . . . . . . . . . . . . . . . . . . . . . . . . (4) (4)Dividends declared . . . . . . . . . . . . . . . . . . . . . . . . . . . . . . . . . (42,648) (42,648)Purchase of treasury stock . . . . . . . . . . . . . . . . . . . . . . . . . . (302) (302)Reissuance of treasury stock . . . . . . . . . . . . . . . . . . . . . . . . . (25) (152) 416 239Effects of changing the pension plan measurement date pursuant to FAS No . 158 . . . . . . . . . . . . (668) (630) (1,298)Balance at March 31, 2009 . . . . . . . . . . . . . . . . . . . . . . . . . 630,765 1,155,034 1,916,951 (733,443) (4,654) 2,964,653

46
Stock Price Range and Trading Volume on the Tokyo Stock ExchangeYears ended March 31
20062005 2007 2008 2009
400
300
200
100
0
20,000
15,000
10,000
5,000
0
Notes: 1 . This trading volume shows the monthly volume of trade on the Tokyo Stock Exchange . Each fiscal year starts in April and ends in March . 2 . Stock prices and the Nikkei stock average is based on a simple average of daily closing prices for each day of every month on the Tokyo Stock Exchange .
Trading volume(Million shares)
Stock price andNikkei stock average(Yen)
Nikkei stock average Closing price of Sony Corporation stock
Ownership and Distribution of Shares 2007 2008 2009
Number of Number of Number of Number of Number of Number of Years ended March 31 shares held shareholders shares held shareholders shares held shareholders
Foreign institutions and individuals . . . . . . . . . 528,218,332 1,380 508,166,485 1,371 391,610,510 1,394Japanese financial institutions . . . . . . . . . . . . 198,775,896 269 216,107,606 297 254,990,242 269Japanese individuals and others . . . . . . . . . . . 231,442,469 624,770 234,246,294 633,045 311,694,942 775,092Other Japanese corporations . . . . . . . . . . . . . 33,163,266 4,054 31,101,417 4,108 35,954,100 4,419Japanese securities firms . . . . . . . . . . . . . . . . 11,297,301 81 14,821,562 124 10,285,570 68
Total . . . . . . . . . . . . . . . . . . . . . . . . . . . . . . . . 1,002,897,264 630,554 1,004,443,364 638,945 1,004,535,364 761,242
Stock Information
Years ended March 31 2005 2006 2007 2008 2009
Stock price (Yen) At year-end . . . . . . . . . . . . . . . . . . . . . . . . . . . . . . . . . . . . . . . . . . . 4,270 5,450 5,990 3,970 1,998 High . . . . . . . . . . . . . . . . . . . . . . . . . . . . . . . . . . . . . . . . . . . . . . . . 4,710 6,040 6,540 7,190 5,560 Low . . . . . . . . . . . . . . . . . . . . . . . . . . . . . . . . . . . . . . . . . . . . . . . . 3,550 3,660 4,340 3,910 1,491 Annual increase/decrease . . . . . . . . . . . . . . . . . . . . . . . . . . . . . . . . –2 .1% +27 .6% +9 .9% –33 .7% –49.7%
Number of shares outstanding at year-end (Thousands of shares) . . . 997,211 1,001,680 1,002,897 1,004,443 1,004,535
Market capitalization at year-end (Yen in trillions) . . . . . . . . . . . . . . . . . 4 .26 5 .46 6 .01 3 .99 2.01
Per share of common stock data (Yen) Cash dividends applicable to the year . . . . . . . . . . . . . . . . . . . . . . . 25 .0 25 .0 25 .0 25 .0 42.5 Net income (loss) (diluted) . . . . . . . . . . . . . . . . . . . . . . . . . . . . . . . . 158 .07 116 .88 120 .29 351 .10 (98.59) Stockholders’ equity . . . . . . . . . . . . . . . . . . . . . . . . . . . . . . . . . . . . 2,872 .21 3,200 .85 3,363 .77 3,453 .25 2,954.25
2007
2008
2009 39.0% 25.4% 31.0% 3.6% 1.0%
52.7% 19.8% 23.1% 3.3% 1.1%
50.6% 21.5% 23.3% 3.1% 1.5%
Japanese individuals and others Japanese financial institutionsForeign institutions and individuals
Other Japanesecorporations
Japanesesecurities firms

47
Investor Information
SONY CORPORATION7-1, Konan 1-chome, Minato-ku,Tokyo 108-0075, Japan
INVESTOR RELATIONS OFFICESIf you have any questions or would like a copy of our Form 20-F, filed with the U .S . Securities and Exchange Commission, or our Annual Report to shareholders, please direct your request to:
■JapanSONY CORPORATIONIR Department7-1, Konan 1-chome, Minato-ku,
Tokyo 108-0075Phone: 81-(0)3-6748-2111Facsimile: 81-(0)3-6748-2244
■U.S.A.SONY CORPORATION OF AMERICAInvestor Relations550 Madison Avenue, 27th Floor,New York, NY 10022-3211Phone: 1-212-833-6849
■U.K.SONY GLOBAL TREASURY SERVICES PLC.Investor Relations Europe15th Floor, Aviva Tower, St . Helens, 1 Undershaft, London EC3A 8NPPhone: 44-(0)20-7426-8696Facsimile: 44-(0)20-7426-8666
SONY ON THE INTERNETSony’s Investor Relations Home Pages on the World Wide Web offer a wealth of corporate information, including the latest annual report and financial results .http://www .sony .net/IR/
ORDINARY GENERAL MEETING OF SHAREHOLDERSThe Ordinary General Meeting of Shareholders is held in June .
INDEPENDENT REGISTERED PUBLIC ACCOUNTING FIRMPricewaterhouseCoopers Aarata Tokyo, Japan
DEPOSITARY, TRANSFER AGENT AND REGISTRARFOR AMERICAN DEPOSITARY RECEIPTSJPMorgan Chase Bank N .A .4 New York Plaza, New York, NY 10004, U .S .A
■Contact Address:JPMorgan Service CenterP .O . Box 64504St . Paul, MN 55164-0504U .S .A .Phone: U .S . 1-800-990-1135 International 1-651-453-2128
CO-TRANSFER AND CO-REGISTRAR AGENTCIBC Mellon Trust Company2001 University Street, 16th Floor,Montreal, Quebec, H3A 2A6, CanadaPhone: 1-514-285-3600
TRANSFER AGENTMitsubishi UFJ Trust and Banking Corporation4-5, Marunouchi 1-chome, Chiyoda-ku, Tokyo 137-8081, JapanPhone: 81-(0)3-3212-1211
OVERSEAS STOCK EXCHANGE LISTINGSNew York and London stock exchanges
JAPANESE STOCK EXCHANGE LISTINGSTokyo and Osaka stock exchanges
NUMBER OF SHAREHOLDERS(As of March 31, 2009)761,242
INFORMATION REGARDING CSR(Corporate Social Responsibility)Sony’s CSR Report and information about Sony CSR and environmental activities can be accessed at the following website .http://www .sony .net/csr/
Inquiries concerning the aforementioned activities can be directed to:Sony CorporationCorporate Social Responsibility DepartmentPhone: 81-(0)3-6748-2111Facsimile: 81-(0)3-6748-2244

Cautionary StatementStatements made in this annual report with respect to Sony’s current plans, estimates, strategies and beliefs and other statements that are not historical facts are forward-looking statements about the future performance of Sony . Forward-looking statements include, but are not limited to, those statements using words such as “believe,” “expect,” “plans,” “strategy,” “prospects,” “forecast,” “estimate,” “project,” “anticipate,” “aim,” “intend,” “seek,” “may,” “might,” “could” or “should,” and words of similar meaning in connection with a discussion of future operations, financial performance, events or conditions . From time to time, oral or written forward-looking statements may also be included in other materials released to the public . These statements are based on management’s assumptions and beliefs in light of the information currently available to it . Sony cautions you that a number of important risks and uncertainties could cause actual results to differ materially from those discussed in the forward-looking statements, and therefore you should not place undue reliance on them . You also should not rely on any obligation of Sony to update or revise any forward-looking statements, whether as a result of new information, future events or otherwise . Sony disclaims any such obligation . Risks and uncertainties that might affect Sony include, but are not limited to (i) the global economic environment in which Sony operates and the economic conditions in Sony’s markets, particularly levels of consumer spending as well as the recent worldwide crisis in the financial markets and housing sectors; (ii) exchange rates, particularly between the yen and the U .S . dollar, the euro and other currencies in which Sony makes significant sales and incurs production costs, or in which Sony’s assets and liabilities are denominated; (iii) Sony’s ability to continue to design and develop and win acceptance of, as well as achieve sufficient cost reductions for, its products and services, including platforms within the game business, which are offered in highly competitive markets characterized by continual new product introductions, rapid development in technology and subjective and changing consumer preferences . (iv) Sony’s ability and timing to recoup large-scale investments required for technology development and increasing production capacity; (v) Sony’s ability to implement successfully business restructuring and transformation efforts; (vi) Sony’s ability to implement successfully its hardware, software, and content integration strategy and to develop and implement successful sales and distribution strategies in light of the Internet and other technological developments; (vii) Sony’s continued ability to devote sufficient resources to research and development and, with respect to capital expenditures, to correctly prioritize investments; (viii) Sony’s ability to maintain product quality; (ix) Sony’s ability to secure adequate funding to finance restructuring activities and capital investments given the current state of global capital markets; (x) the success of Sony’s joint ventures and alliances; (xi) the outcome of pending legal and/or regulatory proceedings; (xii) shifts in customer demand for financial services such as life insurance and Sony’s ability to conduct successful asset liability management in the Financial Services segment; and (xiii) the impact of unfavorable conditions or developments (including market fluctuations or volatility) in the Japanese equity markets on the revenue and operating income of the Financial Services segment . Risks and uncertainties also include the impact of any future events with material adverse impacts .

Printed with volatile organic chemical (VOC)-free vegetable oil-based ink.
SGS-COC-004300
