cover sw 2018 cover.ai size: 210mm(w) x …42 beverages division 52 marine services division 62...
TRANSCRIPT

C M Y K PMS 7562U
SW_2018_Cover.ai size: 210mm(W) x 285mm(H)paper: Savile Row Tweed Extra White 300gsm
spine: 16mm Cover
www.swirepaci f ic .com Stock Codes: ‘A’ Shares 00019 ‘B’ Shares 00087
AN
NU
AL
RE
PO
RT
20
18
A N N U A L R E P O R T 2 0 1 8
1 Corporate Statement
3 2018 Performance Highlights
4 Chairman’s Statement
6 Finance Director’s Statement
MANAGEMENT DISCUSSION AND ANALYSIS
10 2018 Performance Review and Outlook
10 Property Division
26 Aviation Division
42 Beverages Division
52 Marine Services Division
62 Trading & Industrial Division
70 Financial Review
79 Financing
CORPORATE GOVERNANCE & SUSTAINABILITY
86 Corporate Governance Report
98 Risk Management
101 Directors and Officers
102 Directors’ Report
109 Sustainable Development Review
FINANCIAL STATEMENTS
117 Independent Auditor’s Report
124 Consolidated Statement of Profit or Loss
125 Consolidated Statement of Other Comprehensive Income
126 Consolidated Statement of Financial Position
127 Consolidated Statement of Cash Flows
128 Consolidated Statement of Changes in Equity
129 Notes to the Financial Statements
203 Principal Accounting Policies
206 Principal Subsidiary, Joint Venture and Associated Companies and Investments
218 Cathay Pacific Airways Limited – Abridged Financial Statements
SUPPLEMENTARY INFORMATION
220 Summary of Past Performance
222 Schedule of Principal Group Properties
232 Group Structure Chart
234 Glossary
236 Financial Calendar and Information for Investors
236 Disclaimer
C O N T E N T S
Note: Definitions of the terms and ratios used in this report can be found in the Glossary.

1SWIRE PACIFIC 2018 ANNUAL REPORT
Our aims are to deliver sustainable growth in shareholder value, achieved through sound returns on equity over the long term, and to return value to shareholders through sustainable growth in ordinary dividends.
Our Values
Integrity, endeavour, excellence, humility, teamwork, continuity.
Our Core Principles
– We focus on Asia, principally Greater China, because of its strong growth potential and because it is where the Group has long experience, deep knowledge and strong relationships.
– We mobilise capital, talent and ideas across the Group. Our scale and diversity increase our access to investment opportunities.
– We are prudent financial managers. This enables us to execute long-term investment plans irrespective of short-term financial market volatility.
– We recruit the best people and invest heavily in their training and development. The welfare of our people is critical to our long-term success.
– We build strong and lasting relationships, based on mutual benefit, with those with whom we do business.
– We invest in sustainable development, because it is the right thing to do and because it supports long-term growth through innovation and improved efficiency.
– We are committed to the highest standards of corporate governance and to the preservation and development of the Swire brand and reputation.
Our Investment Principles
– We aim to build a portfolio of businesses that collectively deliver a steady dividend stream over time.
– We are long term investors. We prefer to have controlling interests in our businesses and to manage them for long term growth.
– We concentrate on businesses where we can contribute expertise, and where our expertise can add value.
– We invest in businesses that provide high-quality products and services and that are leaders in their markets.
– We divest from businesses which have reached their full potential under our ownership, and recycle the capital released into existing or new businesses.
C O R P O R A T E S T A T E M E N T
Swire Pacific is a Hong Kong based international conglomerate with a diversified portfolio of market leading businesses. The Company has a long history in Greater China, where the name Swire or 太古 has been established for over 150 years.
S U S TA I N A B L E G R O W T H

CORPORATE STATEMENT2
Swire Properties’ shopping malls are home to more than 1,700 retail outlets. Its offices house a working population estimated to exceed 78,000. In Hong Kong, Swire Properties is one of the largest commercial landlords and operators of retail space, principally through the ownership and management of its core centres at Pacific Place and Taikoo Place. In Mainland China, it has developed five retail led mixed-use projects, in Beijing, Shanghai, Guangzhou and Chengdu. In the USA, it has a mixed-use development in Miami.
Cathay Pacific, with its subsidiaries Cathay Dragon and Air Hong Kong, operated 212 aircraft at the end of 2018, connecting Hong Kong to 109 destinations worldwide, including 26 in Mainland China. The Cathay Pacific group is the world’s 9th largest carrier of international passengers, and the 2nd largest carrier of international air cargo. Cathay Pacific has an interest of 18.13% in Air China.
HAECO is a leading provider of international aircraft maintenance and repair services. In 2018, the HAECO group, operating from bases in Hong Kong, Mainland China and the USA, performed work for more than 300 airline and other customers.
Our Beverages Division sold the products of The Coca-Cola Company to a franchise population of 728 million people in Greater China and the USA at the end of 2018. These products comprised 16 carbonated and 45 non-carbonated brands.
At the end of 2018, the Swire Pacific Offshore group operated a fleet of 77 specialist vessels supporting the offshore energy industry in every major offshore production and exploration region outside the USA.
Swire Resources operated 201 footwear and apparel retail outlets in Hong Kong, Macau and Mainland China at the end of 2018. Taikoo Motors sells passenger cars, commercial vehicles, motorcycles and scooters, principally in Taiwan. Taikoo Sugar operates a branded sugar distribution business in Hong Kong and Mainland China. Our bakery business in south west China operated 651 stores at the end of 2018.
Swire Pacific is one of Hong Kong’s largest and oldest employers, where we have over 41,000 employees. In Mainland China, we have approximately 33,000 employees. Globally, we employ approximately 93,000 staff.
Operating within five divisions (Property, Aviation, Beverages, Marine Services and Trading & Industrial), Swire Pacific undertakes a wide range of commercial activities.
O U R B U S I N E S S E S

3SWIRE PACIFIC 2018 ANNUAL REPORT
2018 PERFORMANCE HIGHLIGHTSNote 2018 2017 Change
Return on equity 9.0% 10.9% -1.9%pts
Dividend per ‘A’ share (HK$) 3.00 2.10 +43%
HK$M HK$M Change
Revenue 84,606 80,289 +5%
Operating profit 30,888 35,864 -14%
Profit attributable to the Company’s shareholders 23,629 26,070 -9%
Cash generated from operations 18,328 19,605 -7%
Net cash inflow/(outflow) before financing 17,919 (2,149) N/A
Total equity (including non-controlling interests) 325,115 306,094 +6%
Net debt 62,667 72,514 -14%
Gearing ratio 19.3% 23.7% -4.4%pts
HK$ HK$
Earnings per share (a)
‘A’ share 15.74 17.34-9%
‘B’ share 3.15 3.47
Dividends per share
‘A’ share 3.00 2.10+43%
‘B’ share 0.60 0.42
Equity attributable to the Company’s shareholders per share (b)
‘A’ share 180.09 168.58+7%
‘B’ share 36.02 33.72
UNDERLYING PROFITHK$M HK$M Change
Underlying profit attributable to the Company’s shareholders (c) 8,523 4,742 +80%
HK$ HK$
Underlying earnings per share (a)
‘A’ share 5.68 3.15+80%
‘B’ share 1.14 0.63
2018 SUSTAINABLE DEVELOPMENT PERFORMANCE (d)2018 2017 Change
GHG emissions (Million tonnes of CO2e) 19.3 19.1 +1%
Energy consumed (GJ Million) 264.2 255.8 +3%
Water consumed (cbm Million) 17.1 11.0 +55%
LTIR (Number of injuries per 100 full-time equivalent employees) 1.79 1.73 +3%
Employee fatalities (Number of fatalities) 2 4 -50%
Notes:(a) Refer to note 13 in the financial statements for the daily weighted average number of shares in issue throughout the year. (b) Refer to note 33 in the financial statements for the number of shares at the year end. (c) A reconciliation between the reported and underlying profit attributable to the Company’s shareholders is provided on page 70. (d) Including Cathay Pacific group.
2 0 18 P E R F O R M A N C E H I G H L I G H T S

4
09 10 11 12 13 14 15 16 17 180
4
3
2
1
HK$
09 10 11 12 13 14 15 16 17 18-5
25
20
15
10
5
0
%
Recurring underlying profit
Exceptionals Net property valuation adjustments
Return on equity
Return on Equity Ordinary Dividends per ‘A’ Share
5-year average 7.1%
5-year CAGR -3.0%
Year In Review
2018 was a year of consolidation and recovery for Swire Pacific.
There were improved operating results, particularly in our Aviation and Beverages divisions, and we saw solid increases in the value of our property portfolio, helped by positive rental reversions in Hong Kong and Mainland China. Return on equity was 9.0%, as compared to 10.9% in 2017 and the average over the last five years of 7.1%.
At the half way point in its three year transformation programme, Cathay Pacific returned to profitability as planned. Swire Pacific Offshore, however, sustained losses beyond those expected in its plan and we took a further significant impairment charge.
We privatised HAECO by acquiring the 25% of its shares that we did not already own, having concluded that its listing no longer served a useful purpose. We believe this was a fair outcome for HAECO’s public shareholders, while providing Swire Pacific with the opportunity to create further value over the long term.
During the year, we completed or agreed terms for the disposal of a number of non-core assets and businesses at attractive valuations. The total proceeds in 2018 and 2019 are expected to be around HK$30 billion, contributing to a significant strengthening of our balance sheet.
Dividends
The Directors have declared dividends for the full year totalling HK$3.0 per A share and HK$0.6 per B share. This represents a 43% increase on the dividends for 2017, as compared to growth in underlying profit of 80%. The payout ratio is 53% as compared to 67% for 2017.
Our aim is to deliver sustainable growth in ordinary dividends. Poor results in our Aviation and Marine Services divisions have meant that we have not achieved this aim over the last five years. Our intention is to do so in the coming years.
Our People
The talent and dedication of our 93,000 employees are central to our success. I would like to thank them for their hard work, determination and commitment to our values.
In 2018, we appointed a Head of Diversity and Inclusion Development, to co-ordinate and strengthen the important work in this area already being done around the Group. This underlines our commitment to creating an inclusive and supportive working environment where all our people feel able to realise their full potential.
We are particularly conscious of the need to ensure a healthy and safe working environment for all our people.
C H A I R M A N ’ S S TAT E M E N T
C H A I R M A N ’ S S T A T E M E N T

5SWIRE PACIFIC 2018 ANNUAL REPORT
09 10 11 12 13 14 15 16 17 180
400,000
350,000
300,000
250,000
200,000
150,000
100,000
50,000
Total equity Net debt
HK$M
Total Equity and Net Debt
09 151413121110 16 17 180
16,000
12,000
14,000
8,000
10,000
6,000
2,000
4,000
HK$M
Net Cash Generated from Operating Activities
We make and will continue to make every effort to reduce workplace accidents.
Sustainability
SwireTHRIVE focuses on six priorities for our businesses: to minimise our carbon footprint, to reduce waste, to use water more responsibly, to increase the use of sustainable materials, to protect biodiversity and to build climate resilience. We will report progress in these areas later in the year in our annual sustainability report.
Board
During the year, John Slosar retired from the board after four years as chairman, 12 years as a director and 38 years as a Swire group employee. He has made an enormous contribution to the Swire group, particularly as chairman of Swire Pacific during a challenging period. I am delighted that he continues as chairman of Cathay Pacific.
Martin Cubbon, the former corporate development and finance director of Swire Pacific, has rejoined the board as a non-executive Director after a 12-month sabbatical. His experience and insights will be most valuable.
I would like to thank all of my fellow Directors for their wise counsel.
Outlook
We are well positioned financially to execute the strategic investment plans for our core businesses, and are cautiously
optimistic that the positive momentum in the performance of many of our businesses will continue in 2019. The current environment of heightened macro-economic and geopolitical uncertainty may create near term challenges to be navigated. We believe, however, that the success of Swire Pacific will be underpinned over the long term by growth in consumer spending in Mainland China, and by the continued strength of Hong Kong as a vibrant business and financial centre servicing Mainland China and the wider region.
Merlin Swire Chairman Hong Kong, 14th March 2019

FINANCE DIRECTOR’S STATEMENT6
09 10 11 12 13 14 15 16 17 18-40
-20
100
60
40
20
80
0
%
Beverages
Property
Marine Services Trading & Industrial
HAECOgroup
Cathay Pacific group
09 10 11 12 13 14 15 16 17 180
300,000
250,000
200,000
150,000
100,000
50,000
Equity attributable to the Company’s shareholders
Market capitalisation
HK$M
09 10 11 12 13 14 15 16 17 1850
100
150
250
200
Swire Pacific ‘A’ Swire Pacific ‘B’ Hang Seng Index
Equity Attributable to the Company’s Shareholders and Market Capitalisation at Year-end
Return on Capital Employed
Swire Pacific Share Price Relative to Hang Seng Index
09 10 11 12 13 14 15 16 17 18-10,000
-5,000
40,000
35,000
30,000
25,000
20,000
15,000
10,000
5,000
0
Property
Marine Services
Aviation
Trading & Industrial
Beverages
Head Office
Attributable profit
Underlying profit
HK$M
Profit Attributable to the Company’s Shareholders
F I N A N C E D I R E C T O R ’ S S T A T E M E N T

7SWIRE PACIFIC 2018 ANNUAL REPORT
Results Summary
The consolidated profit attributable to shareholders for 2018 was HK$23,629 million, a 9% decrease compared to 2017. Underlying profit attributable to shareholders, which principally adjusts for changes in the value of investment properties, increased by 80% to HK$8,523 million. Disregarding significant non-recurring items in both years, the 2018 recurring underlying profit was HK$7,489 million, compared with HK$4,762 million in 2017. The principal contributor to the increase was the Aviation Division.
The Property Division is the largest contributor to the Group’s profit. The recurring underlying profit from the Property Division in 2018 (which excludes gains from the disposal of investment properties aggregating HK$2,155 million) was HK$6,177 million, compared with HK$6,386 million in 2017. Demand for office properties in Hong Kong was generally strong. Retail sales grew strongly in Hong Kong for much of 2018. In Mainland China in 2018, office rents increased in Guangzhou and in Beijing. Retail sales grew satisfactorily in Beijing, Chengdu, and Guangzhou and modestly in Shanghai. In Miami in the USA, demand for office space was firm and retail sales increased steadily. Demand for residential properties in Hong Kong weakened in the second half of 2018. Demand for residential properties was subdued throughout the year in Miami. 2018 losses from hotels were slightly lower than in 2017.
The Aviation Division recorded a profit in 2018, compared to a loss in 2017. This reflected improved operating results at Cathay Pacific and HAECO. Swire Pacific’s attributable share of Cathay Pacific’s 2018 profit was HK$1,056 million, compared with a loss of HK$567 million in 2017. The operating environment for Cathay Pacific was little changed in 2018. Overcapacity in passenger markets resulted in intense competition with other airlines. Fuel prices increased. The strength of the US dollar adversely affected net income. But the passenger business improved. Capacity increased. Load factors were sustained. Yield improved despite competitive pressures. The cargo business was strong. Capacity, yield and load factors increased.
Following its privatisation, HAECO became a wholly-owned subsidiary from December 2018. The recurring profit of the HAECO group in 2018 was HK$728 million, compared with HK$255 million in 2017. The higher profit primarily reflected reduced losses at HAECO Americas and more workload at HAECO Xiamen and HAESL.
The recurring profit of Swire Beverages was HK$1,354 million in 2018, compared with HK$962 million in 2017. Revenue increased by 21% to HK$41,190 million. Volume increased by 16% to 1,755 million unit cases. Revenue and volume grew in Mainland China and the USA, mainly due to the inclusion of sales in the franchise territories acquired in 2017. Revenue and volume also grew in Hong Kong and Taiwan.
The recurring loss of the Marine Services Division was HK$1,122 million in 2018, compared to HK$1,217 million in 2017. These figures exclude impairment charges and related write-off of HK$3,911 million in 2018 and HK$1,015 million in 2017 at Swire Pacific Offshore. Offshore industry conditions remained difficult. There was some improvement in vessel utilisation rates. However, the oversupply of offshore support vessels continued to put pressure on charter hire rates.
The recurring profit of the Trading & Industrial Division in 2018 (which excludes non-recurring items of HK$2,740 million) was HK$164 million in 2018, compared with HK$163 million in 2017. The result principally reflected a reduced contribution from Akzo Nobel Swire Paints and losses from Swire Foods, largely offset by better results from Swire Retail, Taikoo Motors and the absence of a loss from the cold storage business (following its disposal) in the second half of 2018.
Dividends
The Directors have declared second interim dividends of HK$1.80 per A share and HK$0.36 per B share which, together with the first interim dividends paid in October 2018 amount to full year dividends of HK$3.00 per A share and HK$0.60 per B share.
Implementing Our Aims
Our aims are to deliver sustainable growth in shareholder value, achieved through sound returns on equity over the long term, and to return value to shareholders through sustainable growth in ordinary dividends. Capital allocation, achieved by way both of investment and divestment, is central to the achievement of our aims.
Swire Properties is investing HK$15 billion in the redevelopment of Taikoo Place in Hong Kong. The first phase of this redevelopment was completed in 2018. The second phase will be completed in 2021 or 2022. Swire Properties also has a 50% interest in a 1.25 million square feet retail development in Shanghai, which is expected to be completed in 2020. In 2018, Swire Properties completed the sale of its interest in an office
F I N A N C E D I R E C T O R ’ S S TAT E M E N T

FINANCE DIRECTOR’S STATEMENT8
building in Kowloon Bay, Hong Kong and conditionally agreed to sell its interests in the Cityplaza Three and Cityplaza Four properties in Quarry Bay, Hong Kong.
Cathay Pacific’s three-year transformation programme is on track. In 2017, Cathay Pacific built the foundations for the programme. In 2018, it restructured its operations outside Hong Kong, benefited from productivity improvements, increased its digital capabilities and concentrated on global business services. Swire Pacific remains supportive of the prospects and long term investment plans of Cathay Pacific.
The HAECO group continues to invest in order to increase the scale of its operations and technical capabilities and to improve and widen the range of services it can offer to customers.
In 2018, Swire Beverages completed the integration of the Coca-Cola franchise territories which it acquired in Mainland China and the USA in 2017. It is expanding its product and package portfolio and is investing in production assets, logistics infrastructure, merchandising equipment and digital capabilities.
In the Marine Services Division, SPO completed its new build programme in 2018 and disposed of five older vessels.
In 2018, the Trading & Industrial Division disposed of its interests in cold storage and paints businesses. It continued to invest in its motor and foods businesses.
To summarise our capital allocation in 2018, we generated HK$18.3 billion from operations (compared with HK$19.6 billion in 2017) and HK$14.0 billion from disposals (compared with HK$1.0 billion in 2017) and we made total capital investments of HK$14.6 billion (compared with HK$20.0 billion in 2017). Our net debt at the end of 2018 was HK$62.7 billion, a reduction of 14% from its amount (HK$72.5 billion) at the end of 2017. Our gearing ratio at the end of 2018 was 19.3%, reduced from 23.7% at the end of 2017.
Outlook By Division
In the Property Division, high occupancy is expected to result in office rents in our Pacific Place and Taikoo Place developments in Hong Kong in 2019 being resilient. We expect retail sales to be stable in Hong Kong. In Mainland China, office rents are expected to increase slightly in Guangzhou, to come under pressure in Beijing and to be resilient in Shanghai. Retail sales are expected to grow steadily in Guangzhou, Beijing and Shanghai, and moderately in Chengdu. In Miami in the USA, demand for office space is firm at the Brickell City Centre and retail sales are increasing steadily. Trading profits are expected to be recognised in 2019 from sales of units at the Reach and
Rise developments in Miami. Trading conditions for our existing hotels are expected to be stable in 2019.
The business environment is expected to remain challenging for Cathay Pacific in 2019, with the forecast strength of the US dollar and uncertainty due to geopolitical discord and global trade tensions dampening passenger and cargo demand. Competition will remain intense, especially in economy class on long haul routes. Operational constraints will impose additional costs. These factors will affect both the passenger and the cargo business. Cathay Pacific remains confident in the ability of its transformation programme to enable it to deliver sustainable long-term performance. In 2019, Cathay Pacific will continue to reorganise its business processes, to benefit from associated underlying structural initiatives and to build a culture of continuous improvement. The airlines will compete hard by extending their route network to destinations not currently served from Hong Kong, by increasing frequencies on their most popular routes and by operating more fuel-efficient aircraft. They will focus upon, and continue to invest in, customer service and productivity.
The prospects for the HAECO group’s different businesses in 2019 are mixed. Demand for airframe services in America is expected to rise and to be stable in Hong Kong and Xiamen. Demand for line services is expected to be firm. Demand for engine services is expected to increase. Fewer seats are expected to be sold in 2019 than in 2018.
In the Beverages Division, revenue in Mainland China, Hong Kong and Taiwan is expected to continue to grow in 2019, with revenue growing faster than volume. The beverages market in the USA is expected to grow modestly in 2019. In all regions, increased costs are expected to put pressure on profits.
In the Marine Services Division, industry conditions remain difficult. Too many vessels are chasing the growing but still limited amount of work. Charter hire rates remain depressed. SPO remains vigilant in controlling costs.
The overall recurring profits of the Trading & Industrial Division are expected to increase in 2019.
Michelle Low Finance Director Hong Kong, 14th March 2019


2018 Performance Review and Outlook – P R O P E R T Y D I V I S I O N
The Taikoo Place redevelopment includes landscaped gardens and elevated walkways that connect the office towers in Taikoo Place.

P R O P E R T Y D I V I S I O NTransforming Urban Areas
Swire Properties’ growing portfolio of offices, retail space
and hotels is continuing to transform urban areas.

1814 1715 160
2,000
4,000
6,000
8,000
12,000
10,000
HK$M
1814 1715 160
5,000
10,000
15,000
20,000
30,000
25,000
HK$M
Underlying profit
Net property valuationadjustments
1814 1715 160
5
10
15
%
Underlying return on capital employed(historic cost)
Return on capital employed
1814 1715 160
100,000
50,000
150,000
200,000
250,000
350,000
300,000
HK$M
Statutory and Underlying Profit Attributable to the Company’s Shareholders
Capital EmployedNet Cash Generated from Operating Activities
P R O P E R T Y D I V I S I O N
Swire Properties is a leading developer, owner and operator of mixed-use, principally commercial, properties in Hong Kong and Mainland China, with a record of creating long-term value by transforming urban areas.
O V E R V I E W O F T H E B U S I N E S S
Return on Capital Employed
13SWIRE PACIFIC 2018 ANNUAL REPORT
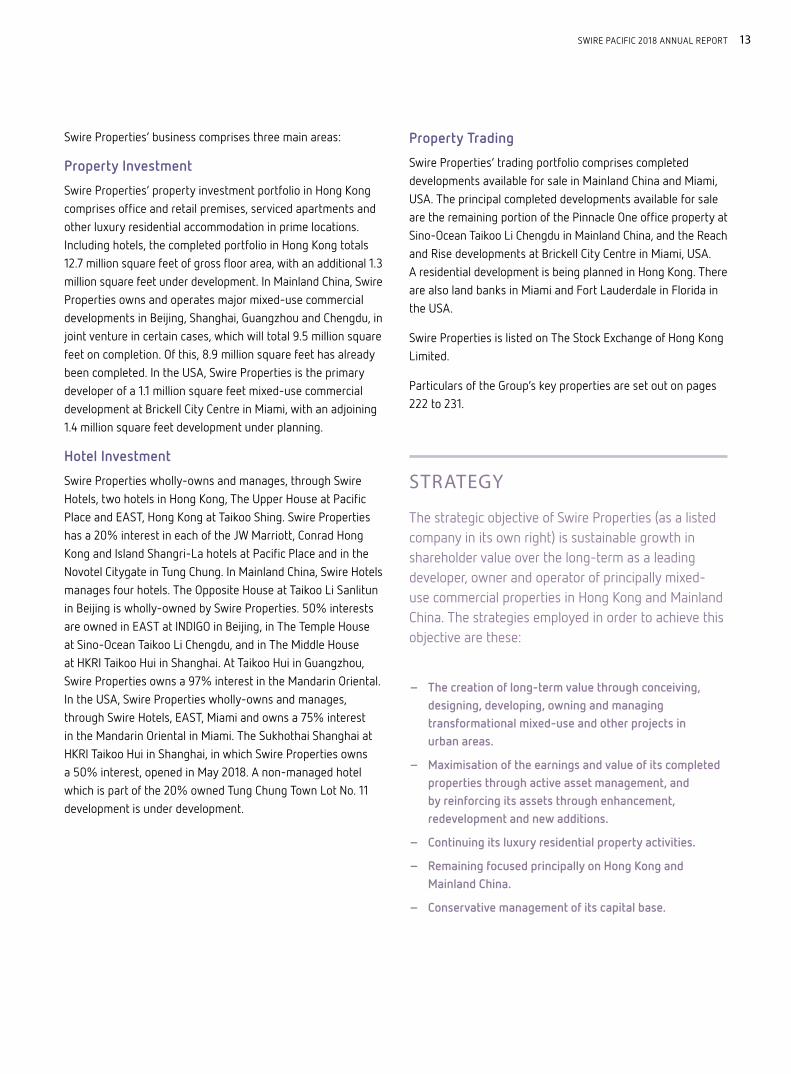
Swire Properties’ business comprises three main areas:
Property Investment
Swire Properties’ property investment portfolio in Hong Kong comprises office and retail premises, serviced apartments and other luxury residential accommodation in prime locations. Including hotels, the completed portfolio in Hong Kong totals 12.7 million square feet of gross floor area, with an additional 1.3 million square feet under development. In Mainland China, Swire Properties owns and operates major mixed-use commercial developments in Beijing, Shanghai, Guangzhou and Chengdu, in joint venture in certain cases, which will total 9.5 million square feet on completion. Of this, 8.9 million square feet has already been completed. In the USA, Swire Properties is the primary developer of a 1.1 million square feet mixed-use commercial development at Brickell City Centre in Miami, with an adjoining 1.4 million square feet development under planning.
Hotel Investment
Swire Properties wholly-owns and manages, through Swire Hotels, two hotels in Hong Kong, The Upper House at Pacific Place and EAST, Hong Kong at Taikoo Shing. Swire Properties has a 20% interest in each of the JW Marriott, Conrad Hong Kong and Island Shangri-La hotels at Pacific Place and in the Novotel Citygate in Tung Chung. In Mainland China, Swire Hotels manages four hotels. The Opposite House at Taikoo Li Sanlitun in Beijing is wholly-owned by Swire Properties. 50% interests are owned in EAST at INDIGO in Beijing, in The Temple House at Sino-Ocean Taikoo Li Chengdu, and in The Middle House at HKRI Taikoo Hui in Shanghai. At Taikoo Hui in Guangzhou, Swire Properties owns a 97% interest in the Mandarin Oriental. In the USA, Swire Properties wholly-owns and manages, through Swire Hotels, EAST, Miami and owns a 75% interest in the Mandarin Oriental in Miami. The Sukhothai Shanghai at HKRI Taikoo Hui in Shanghai, in which Swire Properties owns a 50% interest, opened in May 2018. A non-managed hotel which is part of the 20% owned Tung Chung Town Lot No. 11 development is under development.
STRATEGY
The strategic objective of Swire Properties (as a listed company in its own right) is sustainable growth in shareholder value over the long-term as a leading developer, owner and operator of principally mixed-use commercial properties in Hong Kong and Mainland China. The strategies employed in order to achieve this objective are these:
– The creation of long-term value through conceiving, designing, developing, owning and managing transformational mixed-use and other projects in urban areas.
– Maximisation of the earnings and value of its completed properties through active asset management, and by reinforcing its assets through enhancement, redevelopment and new additions.
– Continuing its luxury residential property activities.
– Remaining focused principally on Hong Kong and Mainland China.
– Conservative management of its capital base.
Property Trading
Swire Properties’ trading portfolio comprises completed developments available for sale in Mainland China and Miami, USA. The principal completed developments available for sale are the remaining portion of the Pinnacle One office property at Sino-Ocean Taikoo Li Chengdu in Mainland China, and the Reach and Rise developments at Brickell City Centre in Miami, USA. A residential development is being planned in Hong Kong. There are also land banks in Miami and Fort Lauderdale in Florida in the USA.
Swire Properties is listed on The Stock Exchange of Hong Kong Limited.
Particulars of the Group’s key properties are set out on pages 222 to 231.

2018 PERFORMANCE REVIEW AND OUTLOOKPROPERTY DIVISION
14
Principal Property Investment Portfolio – Gross Floor Area(‘000 Square Feet)
At 31st December 2018At 31st
December 2017
Location Office Retail Hotels Residential Under Planning Total Total
Completed Pacific Place 2,186 711 496 443 – 3,836 3,836
Taikoo Place 5,571 12 – 63 – 5,646 4,633
Cityplaza* 629 1,105 200 – – 1,934 2,703
Others 601 596 47 78 – 1,322 1,140
– Hong Kong 8,987 2,424 743 584 – 12,738 12,312
Taikoo Li Sanlitun – 1,296 169 – – 1,465 1,465
Taikoo Hui 1,732 1,473 584 52 – 3,841 3,841
INDIGO 294 470 179 – – 943 947
Sino-Ocean Taikoo Li Chengdu – 657 98 55 – 810 795
HKRI Taikoo Hui 914 553 194 73 – 1,734 1,465
Others – 91 – – – 91 91
– Mainland China 2,940 4,540 1,224 180 – 8,884 8,604
– USA 263 497 477 109 – 1,346 1,346
Total completed 12,190 7,461 2,444 873 – 22,968 22,262
Under and pending development– Hong Kong^ 1,218 72 26 – – 1,316 2,310
– Mainland China – 623 – – – 623 269
– USA – – – – 1,444 1,444 1,444
Total 13,408 8,156 2,470 873 1,444 26,351 26,285
Gross floor area represents 100% of space owned by Group companies and the division’s attributable share of space owned by joint venture and associated companies.
* The office portfolio includes only Cityplaza One. The remainder of Cityplaza Three and the whole of Cityplaza Four (the immediate holding company of a wholly-owned property holding subsidiary owning such remainder and such whole having been conditionally agreed to be sold in June 2018) are excluded.
^ The office portfolio principally comprises Two Taikoo Place.

15SWIRE PACIFIC 2018 ANNUAL REPORT
2018 PERFORMANCE
Financial Highlights2018
HK$M2017
HK$M
Revenue Gross rental income derived from Office 6,375 6,124
Retail 5,205 4,616
Residential 537 512
Other revenue* 137 128
Property investment 12,254 11,380
Property trading 1,061 5,833
Hotels 1,404 1,345
Total revenue 14,719 18,558
Operating profit/(loss) derived from Property investment
From operations 8,585 8,154
Sale of interests in investment properties 1,276 9
Valuation gains on investment properties 19,378 25,331
Property trading 65 1,397
Hotels (25) (102)
Total operating profit 29,279 34,789
Share of post-tax profits from joint venture and associated companies 1,978 1,792
Attributable profit 28,583 33,818
Swire Pacific share of attributable profit 23,437 27,731
* Other revenue is mainly estate management fees.
Underlying Profit/(Loss) by Segment2018
HK$M2017
HK$M
Property Investment 10,102 6,698
Property Trading 99 1,154
Hotels (41) (43)
Total underlying attributable profit 10,160 7,809

2018 PERFORMANCE REVIEW AND OUTLOOKPROPERTY DIVISION
16
2018 PERFORMANCE (continued)
Reconciliation of Attributable to Underlying ProfitAdditional information is provided below to reconcile reported and underlying profit attributable to shareholders. These reconciling items principally adjust for net revaluation movements on investment properties and the associated deferred tax in Mainland China and the USA, and for other deferred tax provisions in relation to investment properties.
Note2018
HK$M2017
HK$M
Reported attributable profit 28,583 33,818
Adjustments in respect of investment properties:
Revaluation of investment properties (a) (20,722) (26,714)
Deferred tax on investment properties (b) 935 573
Valuation gains realised on sale of interests in investment properties (c) 1,351 50
Depreciation of investment properties occupied by the Group (d) 28 28
Non-controlling interests’ share of revaluation movements less deferred tax (15) 54
Underlying attributable profit 10,160 7,809
Profit on sale of interests in investment properties (2,627) (21)
Recurring underlying attributable profit 7,533 7,788
Swire Pacific share of underlying attributable profit 8,331 6,403
Swire Pacific share of recurring underlying attributable profit 6,177 6,386
Notes:(a) This represents the Group’s net revaluation movements and the Group’s share of net revaluation movements of joint venture companies. (b) This represents deferred tax movements on the Group’s investment properties and the Group’s share of deferred tax movements on investment properties held by joint venture companies.
These comprise deferred tax on revaluation movements on investment properties in Mainland China and the USA, and deferred tax provisions made in respect of investment properties held for the long-term where it is considered that the liability will not reverse for some considerable time.
(c) Prior to the implementation of HKAS 40, changes in the fair value of investment properties were recorded in the revaluation reserve rather than the statement of profit or loss. On sale, the revaluation gains were transferred from the revaluation reserve to the statement of profit or loss.
(d) Prior to the implementation of HKAS 40, no depreciation was charged on investment properties occupied by the Group.
2018 PROPERTY INDUSTRY REVIEWOffice and Retail
Hong Kong
OFFICE | Demand for office space was generally strong in 2018 and occupancy levels were high. Some weakness in demand for properties in the central district emerged towards the end of the year.
RETAIL | Retail sales grew strongly for much of 2018. Growth has since slowed, reflecting global trade uncertainties and the adverse effect of the weakening Renminbi on spending by Mainland Chinese visitors.
Mainland China
RETAIL | Retail sales grew satisfactorily in Beijing, Chengdu and Guangzhou and modestly in Shanghai in 2018. Demand for retail space from retailers of luxury goods was solid in Beijing and robust in Guangzhou and Chengdu. Demand for retail space from retailers of international and lifestyle brands and food and beverage operators was solid.
OFFICE | In Guangzhou and Beijing, office rents rose in the absence of significant new supply and stable demand in 2018. In Shanghai in 2018, the main sources of demand were from those engaged in financial and professional services and retailing.
USA
OFFICE | In Miami, supply of new Grade-A office space in the central business district and in the Brickell area was low and demand was firm.
RETAIL | In Miami, retail sales increased steadily. Demand for retail space in the metropolitan area was correspondingly steady.
Property Sales Markets
In Hong Kong, demand for residential accommodation weakened somewhat in the latter part of 2018, but is likely to remain resilient in the long term.
In Miami, most demand for condominiums is from South American buyers. Demand was subdued in 2018. Few new projects were started or became available for sale.

17SWIRE PACIFIC 2018 ANNUAL REPORT
09 10 11 12 13 14 15 16 17 180
280,000
240,000
200,000
160,000
120,000
40,000
80,000
Completed Under development
HK$M
09 10 11 12 13 14 15 16 17 180
15,000
12,000
9,000
3,000
6,000
Hong Kong office
Mainland China
Hong Kong retail
USA and others
Hong Kong residential
HK$M
Valuation of Investment Properties Gross Rental Income
2018 RESULTS SUMMARYAttributable profit from the Property Division for the year was HK$23,437 million compared to HK$27,731 million in 2017. These figures include net property valuation gains, before deferred tax and non-controlling interests, of HK$20,722 million and HK$26,714 million in 2018 and 2017 respectively. Attributable underlying profit increased to HK$8,331 million in 2018 from HK$6,403 million in 2017. The increase principally reflected the profit arising from the sale of a subsidiary which owned an office building in Kowloon Bay and of our interests in other investment properties in Hong Kong. This was partly offset by a decrease in profit from property trading. Recurring underlying profit (which excludes the profit on sale of interests in investment properties) was HK$6,177 million in 2018, compared with HK$6,386 million in 2017. The decrease principally reflected a decrease in profit from property trading. Recurring underlying profit from property investment increased by 12%. Hotel losses decreased.
In Hong Kong, office rental income increased due to positive rental reversions, firm occupancy and the opening of One Taikoo Place in the last quarter of 2018. Retail rental income in Hong Kong improved in 2018. In Mainland China, gross rental income increased by 12%, mainly due to positive rental reversions and improved occupancy. In the USA, gross rental income almost doubled, mainly because more shops were open at the shopping centre at Brickell City Centre.
Underlying profit from property trading in 2018 arose mainly from the sale of houses at the WHITESANDS development and carparks at the AZURA development in Hong Kong, and from the share of profit from the sale of offices and carparks at Sino-Ocean Taikoo Li Chengdu in Mainland China.
The performance of the hotels continued to improve in 2018, with those in Hong Kong and in the USA doing better. This was offset in part by pre-opening costs at hotels in Shanghai in Mainland China.
KEY DEVELOPMENTSIn March 2018, Swire Properties completed the acquisition of a 50% interest in Shanghai Qianxiu Company Limited (Shanghai Qianxiu) from a subsidiary of Shanghai Lujiazui Finance & Trade Zone Development Co., Ltd. (LJZ). Swire Properties and LJZ each hold a 50% interest in Shanghai Qianxiu. Shanghai Qianxiu is developing a retail project with an aggregate gross floor area of approximately 1,250,000 square feet in Qiantan, Pudong New District in Shanghai. The development (now called Taikoo Li Qiantan) is expected to be completed in 2020.
In May 2018, The Middle House, Swire Hotels’ fourth hotel in The House Collective (which is managed by Swire Properties), and a non-managed hotel, The Sukhothai Shanghai, officially opened in Shanghai.
In May 2018, the extension to Citygate Outlets, with an aggregate gross floor area of approximately 474,000 square feet, was topped out. The extension is expected to open in the summer of 2019. Swire Properties has a 20% interest in the development.
In June 2018, the agreement for the sale of the subsidiary of Swire Properties which developed an office building in Kowloon Bay, Hong Kong became unconditional and the sale was completed.

2018 PERFORMANCE REVIEW AND OUTLOOKPROPERTY DIVISION
18
In June 2018, Swire Properties conditionally agreed to sell its 100% interest in a subsidiary which owns the Cityplaza Three and Cityplaza Four properties in Quarry Bay, Hong Kong. The consideration for the sale is HK$15,000 million, subject to adjustments. Completion of the sale is expected to take place in or before April 2019. Swire Properties intends to reinvest the proceeds of the sale in new developments and does not intend to pay a special dividend.
In August 2018, South Island Place, our first Grade-A office building in Wong Chuk Hang, Hong Kong, was completed. The 28-storey building, which was jointly developed with China Motor Bus Company, Limited, has a gross floor area of approximately 382,500 square feet.
In November 2018, One Taikoo Place, the first of two premium Grade-A office buildings in the Taikoo Place redevelopment, became fully let. One Taikoo Place has an aggregate gross floor area of approximately 1,013,400 square feet. The building was topped out in January 2018 and received its occupation permit in September 2018.
INVESTMENT PROPERTIESHong Kong
OFFICE | Gross rental income from the Hong Kong office portfolio in 2018 was HK$5,876 million, a 4% increase from 2017. There were positive rental reversions and occupancy was firm. The increase also reflected in part rental income from One Taikoo Place as it opened in the last quarter of 2018. At 31st
09 10 11 12 13 14 15 16 17 180
15,000
12,500
10,000
7,500
2,500
5,000
Property investment
Sales of investmentproperties
Property trading Hotels
HK$M
09 10 11 12 13 14 15 16 17 25180
30,000
25,000
20,000
15,000
10,000
5,000
Gross floor area (’000 sq.ft.)
Office
Hotels
Retail
Under planning
Residential
Completion
Underlying Operating Profit Completed Investment Property Portfolio by Type
December 2018, the office portfolio was 99% let (including by way of letters of intent). Demand for the Group’s office space in Hong Kong was strong in all districts.
Pacific Place
The offices at One, Two and Three Pacific Place performed well in 2018. Occupancy and rental rates were robust, as vacant space was quickly relet. Demand from Mainland China entities was strong. The occupancy rate was almost 100% at 31st December 2018.
Cityplaza
The occupancy rate at Cityplaza One was 99% at 31st December 2018.
Taikoo Place
The occupancy rate at Taikoo Place was 99% at 31st December 2018. One Taikoo Place was completed in September 2018 and is 100% leased.
South Island Place
The development of an office building at 8-10 Wong Chuk Hang Road, Hong Kong was completed in August 2018. Commitments (including by way of letters of intent) to lease more than 73% of the space in the building have been obtained.
RETAIL | The Hong Kong retail portfolio’s gross rental income was HK$2,755 million in 2018, a 6% increase from 2017. The Group’s malls were almost fully let throughout the year.

19SWIRE PACIFIC 2018 ANNUAL REPORT
Retail sales in 2018 increased by 12% at The Mall, Pacific Place, by 6% at Cityplaza and by 4% at Citygate, the growth reflecting improved market conditions and previous changes to the trade mix.
RESIDENTIAL | The completed residential portfolio comprises Pacific Place Apartments at Pacific Place, Taikoo Place Apartments in Quarry Bay, STAR STUDIOS in Wanchai and a small number of luxury houses and apartments on Hong Kong Island. The occupancy rate at the residential portfolio was approximately 85% at 31st December 2018.
2019 2020 20210
80
60
40
20
% of the total rental income attributable to the Group for the month ended 31st December 2018
Office Retail
and beyond
Hong Kong Lease Expiry Profile – at 31st December 2018
INVESTMENT PROPERTIES UNDER DEVELOPMENT | The development of the first phase of the Taikoo Place redevelopment (One Taikoo Place) was completed in September 2018.
The second phase of the Taikoo Place redevelopment (the redevelopment of Cornwall House and Warwick House) is the construction of an office building with an aggregate gross floor area of approximately 1,000,000 square feet, to be called Two Taikoo Place. Demolition of Warwick House and Cornwall House has been completed and foundation works are in progress. Completion of the redevelopment is expected in 2021 or 2022.
265.7 -1.4+4.7 -2.3
+0.2 -15+17
+2.4
271.3
220
280
270
260
250
240
230
1st January 2018
Transfer from properties under development and for sale
Disposals
Net valuation gains in Hong Kong, USA and Singapore
Net valuationgains in Mainland China
AdditionsTranslation differences
Transfers to assets classified as held for sale
At 31st December 2018
HK$bn
Movement in Investment Properties
Completed in September 2018,
One Taikoo Place is the first of the
two premium Grade-A office buildings
in the Taikoo Place redevelopment.

2018 PERFORMANCE REVIEW AND OUTLOOKPROPERTY DIVISION
20
The commercial site (Tung Chung Town Lot No. 11) next to Citygate Outlets is being developed into a commercial building with an aggregate retail and hotel gross floor area of approximately 474,000 square feet. Superstructure works have been completed and fitting out works are in progress. The development is expected to be completed in the summer of 2019. Swire Properties has a 20% interest in the development.
Planning permission to develop the site at Po Wah Building, 1-11 Landale Street and 2-12 Anton Street for office use was obtained in November 2018. The site area is approximately 14,400 square feet. The proposed development has an aggregate gross floor area of approximately 218,000 square feet. Completion is expected in 2023.
OTHERS | In February 2018, Swire Properties submitted compulsory sale applications in respect of two sites (Wah Ha Factory Building, No. 8 Shipyard Lane and Zung Fu Industrial Building, No. 1067 King’s Road) in Hong Kong. Subject to Swire Properties having successfully bid in the compulsory sale of the sites, the sites are intended to be redeveloped for office and other commercial uses with an aggregate gross floor area of approximately 779,000 square feet.
In October 2018, a joint venture company in which Swire Properties holds a 50% interest submitted a compulsory sale application in respect of a site at 983-987A King’s Road and 16-94 Pan Hoi Street, Quarry Bay, Hong Kong. Subject to the joint venture company having successfully bid in the compulsory sale and in accordance with applicable town planning controls,
it is expected that the site can be redeveloped for residential and retail uses with a gross floor area of approximately 400,000 square feet.
In August and October 2018, a joint venture company held as to 80% by Swire Properties and as to 20% by China Motor Bus Company, Limited received general building approvals for a residential development in Chai Wan, Hong Kong. The joint venture company was formed in 2015 to acquire, subject to conditions (including the agreement of a land premium with the Hong Kong government), the relevant land. The joint venture company is negotiating land exchange terms with the Hong Kong government. Subject to agreement with the Hong Kong government, the proposed development is expected to have an aggregate gross floor area of approximately 694,000 square feet.
Mainland China
RETAIL | The Mainland China retail portfolio’s gross rental income for 2018 increased by 13% compared with 2017, to HK$2,163 million.
Gross rental income at Taikoo Li Sanlitun recorded satisfactory growth in 2018, reflecting positive growth in reversionary rents. Retail sales grew by 11%. The occupancy rate was 100% at 31st December 2018. Demand for retail space at Taikoo Li Sanlitun is solid as it reinforces its position as a fashionable retail destination in Beijing. Improvement works are being carried out and are expected to have a positive impact on occupancy and rents.
The Middle House in Shanghai is
the latest addition to Swire Hotels.

21SWIRE PACIFIC 2018 ANNUAL REPORT
The refurbishment of Taikoo Li Sanlitun West (formerly known as the Beijing Sanlitun Yashow Building) as an extension to Taikoo Li Sanlitun (with an aggregate gross floor area of approximately 296,000 square feet) is expected to be completed later in 2019.
Gross rental income at Taikoo Hui in Guangzhou grew satisfactorily in 2018. Retail sales increased by 11%, reflecting in part improvements to the tenant mix. The occupancy rate at Taikoo Hui was 100% at 31st December 2018.
Occupancy at the shopping mall at INDIGO, Beijing was 99% at 31st December 2018. Retail sales increased by 0.3% in 2018.
Retail sales at Sino-Ocean Taikoo Li Chengdu increased by 22% in 2018. The development is gaining popularity as a shopping destination in Chengdu. At 31st December 2018, the occupancy rate at the retail complex was 99%.
At 31st December 2018, tenants at HKRI Taikoo Hui had committed (including by way of letters of intent) to take 97% of the retail space. 92% of the retail space was open.
OFFICE | The Mainland China office portfolio’s gross rental income for 2018 increased by 6% compared with 2017, to HK$391 million.
At 31st December 2018, the occupancy rates at the office towers at Taikoo Hui, Guangzhou and at ONE INDIGO, Beijing were 99% and 97% respectively.
The occupancy rate at the two office towers at HKRI Taikoo Hui in Shanghai was 98% at 31st December 2018.
INVESTMENT PROPERTIES UNDER DEVELOPMENT | In March 2018, a 50:50 joint venture was formed with a subsidiary of Shanghai Lujiazui Finance & Trade Zone Development Co., Ltd. for the development of Taikoo Li Qiantan, a low-rise retail development with an aggregate gross floor area of approximately 1,250,000 square feet in Qiantan, Pudong New District in Shanghai. Construction is in progress. The development is expected to be completed in 2020.
USA
The first phase of the Brickell City Centre development consists of a shopping centre, two office buildings (Two Brickell City Centre and Three Brickell City Centre), a hotel and serviced apartments (EAST, Miami) managed by Swire Hotels and two residential towers (Reach and Rise). The residential towers have been developed for sale.
The first phase of the Brickell City Centre development was completed in 2016. Its components opened in 2016 and 2017. Gross rental income increased in 2018, mainly because more shops were open at the shopping centre. At 31st December 2018, Two and Three Brickell City Centre were fully leased and the shopping centre was 89% let (including by way of letters of intent).
At 31st December 2018, Swire Properties owned 100% of the office, hotel and unsold residential portions and 62.93% of the shopping centre at the Brickell City Centre development. The remaining interest in the shopping centre was owned by Simon Property Group (25%) and Bal Harbour Shops (12.07%). Bal Harbour Shops has an option, exercisable from 2020, to sell its interest to Swire Properties.
One Brickell City Centre is planned to be a mixed-use development comprising retail, office, hotel and residential space in an 80-storey tower. It will incorporate the site at 700 Brickell Avenue acquired by Swire Properties in 2013. Development of this site will connect the Brickell City Centre development with Brickell Avenue. Swire Properties owns 100% of One Brickell City Centre.
VALUATION OF INVESTMENT PROPERTIESThe portfolio of investment properties was valued at 31st December 2018 on the basis of market value (95% by value having been valued by Cushman & Wakefield Limited and 2% by value having been valued by another independent valuer). The amount of this valuation was HK$271,256 million, compared to HK$265,705 million at 31st December 2017 and HK$268,802 million at 30th June 2018.
The increase in the valuation of the investment property portfolio is mainly due to an increase in the valuation of the office properties in Hong Kong following rental increases and a reduction of 12.5 basis points in the capitalisation rate applicable to office properties in Hong Kong. This was partially offset by the removal from the valuation of our interests in the Cityplaza Three and Cityplaza Four properties as a result of their transfer to “assets classified as held for sale” in the financial statements at 31st December 2018.
Under HKAS 40, hotel properties are not accounted for as investment properties but are included within property, plant and equipment at cost less accumulated depreciation and any provision for impairment.

2018 PERFORMANCE REVIEW AND OUTLOOKPROPERTY DIVISION
Quarry BayStation
Westlands Road
Tai Koo Station
King’s Road
Tai Koo Shing Road
Pan Hoi Street
Island Eastern Corridor
Shipaiqiao Station
Tianhe Road
Tianhe East Road
Sanli
tun Roa
d
Jiangtai Station
Jiuxianqiao Road
West NanjingRoad Station
West Nanjing Road Station
Shimenyi Road
Weihai R
oad
West Nan
jing
Road
Dacisi Road
Hongxing Road
Dongda Street
SW 8th Street
SE 7th Street
SW 1st Avenue
South Miami Avenue
Brickell Plaza
SW 9th Street
MiamiRiver Miami
River
SE 6th Street
SE 5th Street
MetromoverEighth StreetStation
Chunxi Road Station
MetrorailBrickell Station
Devon House 803,452 sf
Cambridge House268,795 sf
Two Taikoo Place(Under Development)~1,000,000 sf
Cityplaza One628,785 sf
One Island East1,537,011 sf
Oxford House501,253 sf
BerkshireHouse388,838 sf
Dorset House609,540 sf
Lincoln House333,529 sf
Cityplaza(Shopping Mall)1,105,227 sf
EAST, Hong Kong199,633 sf Taikoo Hui
(Shopping Mall)1,472,730 sf
Taikoo Hui Towers 1 & 21,731,766 sf
Mandarin Oriental,Guangzhou584,184 sf
Serviced Apartments51,517 sf
The Opposite House169,463 sf
Taikoo LiSanlitun North519,399 sf
Taikoo LiSanlitun South776,909 sf
One Citygate160,522 sf
Novotel Citygate Hong Kong236,758 sf
ONE INDIGO589,071 sf
EAST, Beijing358,301 sf
INDIGO(Shopping Mall) 939,493 sf
HKRI Centre 2699,046 sf
HKRI Centre 11,129,014 sf
Shopping Mall1,105,646 sf
The Temple House306,365 sf
Sino-Ocean Taikoo LiChengdu(Shopping Centre)1,314,973 sf
Pinnacle One*471,003 sf
EAST, Miami327,000 sf
FutureDevelopment1,444,000 sf
FutureDevelopment523,000 sf
Brickell City Centre(Shopping Mall)496,508 sf
Three Brickell City Centre134,542 sf
Two BrickellCity Centre128,842 sf
Rise 228,814 sf*
Reach 62,140 sf*
PCCW Tower620,148 sf
One Taikoo Place1,013,368 sf
Taikoo Place Apartments75,068 sf
North Lantau Highway
Tat Tung Road
Tung Chung Station
Hennessy Road Queensway
Pacific Place(Shopping Mall)711,182 sf
Pacific PlaceApartments443,075 sf
TwoPacific Place695,510 sf
Citygate Outlets462,428 sf(of which ~126,000 sfis under renovation)
JW MarriottHong Kong525,904 sf
Generali Tower81,346 sf
Three Pacific Place627,657 sf
The Upper House158,738 sf
One Pacific Place863,266 sf
Conrad Hong Kong555,590 sf
Island Shangri-LaHong Kong 605,728 sf
28 HennessyRoad145,390 sf
Three Pacific PlaceLink
Tung ChungTown Lot No. 11(Under Development)~474,000 sf
Mei Tung StreetAdmiralty Station
STAR STUDIOS52,273 sf
The Sukhothai Shanghai246,646 sf
The MiddleHouse141,181 sf
The Middle HouseResidences147,273 sf
Po Wah Building,1-11 Landale Streetand 2-12 Anton Street(Under Planning)~218,000 sf
Taikoo LiSanlitun West(Under Refurbishment)255,731 sf
21-31 Wing Fung Street(Under Development)~34,000 sf
Oriental Sports Centre Station
Yangsi West RoadDongy
u Roa
d
Haiyang West Road
Shopping Mall(Under Development)1,246,913 sf
22
USA
Brickell City CentreMiami, Florida
* Rise and Reach are developed for trading purpose. Floor area shown represents the unclosed portion.
Hong Kong
Taikoo Place
Pacific PlaceCitygate
Cityplaza

Quarry BayStation
Westlands Road
Tai Koo Station
King’s Road
Tai Koo Shing Road
Pan Hoi Street
Island Eastern Corridor
Shipaiqiao Station
Tianhe Road
Tianhe East Road
Sanli
tun Roa
d
Jiangtai Station
Jiuxianqiao Road
West NanjingRoad Station
West Nanjing Road Station
Shimenyi Road
Weihai R
oad
West Nan
jing
Road
Dacisi Road
Hongxing Road
Dongda Street
SW 8th Street
SE 7th Street
SW 1st Avenue
South Miami Avenue
Brickell Plaza
SW 9th Street
MiamiRiver Miami
River
SE 6th Street
SE 5th Street
MetromoverEighth StreetStation
Chunxi Road Station
MetrorailBrickell Station
Devon House 803,452 sf
Cambridge House268,795 sf
Two Taikoo Place(Under Development)~1,000,000 sf
Cityplaza One628,785 sf
One Island East1,537,011 sf
Oxford House501,253 sf
BerkshireHouse388,838 sf
Dorset House609,540 sf
Lincoln House333,529 sf
Cityplaza(Shopping Mall)1,105,227 sf
EAST, Hong Kong199,633 sf Taikoo Hui
(Shopping Mall)1,472,730 sf
Taikoo Hui Towers 1 & 21,731,766 sf
Mandarin Oriental,Guangzhou584,184 sf
Serviced Apartments51,517 sf
The Opposite House169,463 sf
Taikoo LiSanlitun North519,399 sf
Taikoo LiSanlitun South776,909 sf
One Citygate160,522 sf
Novotel Citygate Hong Kong236,758 sf
ONE INDIGO589,071 sf
EAST, Beijing358,301 sf
INDIGO(Shopping Mall) 939,493 sf
HKRI Centre 2699,046 sf
HKRI Centre 11,129,014 sf
Shopping Mall1,105,646 sf
The Temple House306,365 sf
Sino-Ocean Taikoo LiChengdu(Shopping Centre)1,314,973 sf
Pinnacle One*471,003 sf
EAST, Miami327,000 sf
FutureDevelopment1,444,000 sf
FutureDevelopment523,000 sf
Brickell City Centre(Shopping Mall)496,508 sf
Three Brickell City Centre134,542 sf
Two BrickellCity Centre128,842 sf
Rise 228,814 sf*
Reach 62,140 sf*
PCCW Tower620,148 sf
One Taikoo Place1,013,368 sf
Taikoo Place Apartments75,068 sf
North Lantau Highway
Tat Tung Road
Tung Chung Station
Hennessy Road Queensway
Pacific Place(Shopping Mall)711,182 sf
Pacific PlaceApartments443,075 sf
TwoPacific Place695,510 sf
Citygate Outlets462,428 sf(of which ~126,000 sfis under renovation)
JW MarriottHong Kong525,904 sf
Generali Tower81,346 sf
Three Pacific Place627,657 sf
The Upper House158,738 sf
One Pacific Place863,266 sf
Conrad Hong Kong555,590 sf
Island Shangri-LaHong Kong 605,728 sf
28 HennessyRoad145,390 sf
Three Pacific PlaceLink
Tung ChungTown Lot No. 11(Under Development)~474,000 sf
Mei Tung StreetAdmiralty Station
STAR STUDIOS52,273 sf
The Sukhothai Shanghai246,646 sf
The MiddleHouse141,181 sf
The Middle HouseResidences147,273 sf
Po Wah Building,1-11 Landale Streetand 2-12 Anton Street(Under Planning)~218,000 sf
Taikoo LiSanlitun West(Under Refurbishment)255,731 sf
21-31 Wing Fung Street(Under Development)~34,000 sf
Oriental Sports Centre Station
Yangsi West RoadDongy
u Roa
d
Haiyang West Road
Shopping Mall(Under Development)1,246,913 sf
23SWIRE PACIFIC 2018 ANNUAL REPORT
Mainland China
Taikoo HuiGuangzhou
Note: – These diagrams are not to scale and are for illustration purpose only.– These diagrams illustrate the major developments of Swire Properties. For details of other developments, please refer to the Schedule of Principal Group Properties on pages 222 to 231.
* Pinnacle One is developed for trading purpose. Floor area shown represents the remaining unsold portion.
INDIGOBeijing
Taikoo Li SanlitunBeijing
HKRI Taikoo HuiShanghai
Sino-Ocean Taikoo Li ChengduChengdu
Taikoo Li QiantanShanghai

2018 PERFORMANCE REVIEW AND OUTLOOKPROPERTY DIVISION
24
HOTELSThe operating profit before depreciation for managed hotels increased by 15% to HK$200 million in 2018, mainly due to improved results in Hong Kong and in the USA. The performance of the non-managed hotels in Hong Kong was stable. Occupancy at the Mandarin Oriental, Guangzhou improved in 2018 and its performance was good. The operating results of the Mandarin Oriental, Miami in 2018 were better than last year.
A managed hotel (The Middle House) and a non-managed hotel (The Sukhothai Shanghai) at HKRI Taikoo Hui in Shanghai opened in May 2018. Occupancy at both hotels was being built up in 2018. The performance of the food and beverage outlets was satisfactory.
PROPERTY TRADING Hong Kong
All 28 houses at the WHITESANDS development at 160 South Lantau Road had been sold at 31st December 2018. The profit from the sale of 12 houses was recognised in 2018.
In 2017, Swire Properties completed the acquisition of a 100% interest in a property at 21-31 Wing Fung Street, Wan Chai, Hong Kong. The property has the potential to be redeveloped into a 34,000 square feet residential block with a retail podium. Vacant possession of the site was obtained in May 2018. The development is expected to be completed in 2022.
Mainland China
At Sino-Ocean Taikoo Li Chengdu, 89% of the office’s total gross floor area (approximately 1.15 million square feet) and 350 carparking spaces were pre-sold in 2013 and the profit from the sales of approximately 52% of the pre-sold gross floor area was recognised in 2015. Application was made to the court to cancel the sale of the remaining pre-sold gross floor area and 350 carparking spaces as part of the consideration was not received on time. The application succeeded (after an unsuccessful appeal by the buyer). The profit from the sale of approximately 122,136 square feet of the gross floor area and 44 carparking spaces was recognised in 2018.
USA
The residential portion of the first phase of the Brickell City Centre development was developed for trading purposes. There are 780 units in two towers (Reach and Rise).
Profile of Capital Commitments for Investment Properties and Hotels
Expenditure Forecast expenditureTotal
Commitments
Commitments relating to
joint venture companies*
2018HK$M
2019HK$M
2020HK$M
2021HK$M
2022and later
HK$M
At 31st December 2018
HK$M
At 31st December 2018
HK$M
Hong Kong 5,479 1,734 3,924 2,908 6,647 15,213 251Mainland China 2,463 1,440 406 90 145 2,081 1,500USA and others 168 266 18 44 – 328 –
Total 8,110 3,440 4,348 3,042 6,792 17,622 1,751
Note: The capital commitments represent 100% of the capital commitments of subsidiaries and the Group’s share of the capital commitments of joint venture companies.* The Group is committed to funding HK$64 million and HK$400 million of the capital commitments of joint venture companies in Hong Kong and Mainland China respectively.
13 14 15 16 17 18 19 20 21 22 2524230
30,000
25,000
20,000
15,000
10,000
5,000
Gross floor area (‘000 sq.ft.)
Hong Kong Mainland China USA and Others
Completed Property Investment Portfolio by Location
25SWIRE PACIFIC 2018 ANNUAL REPORT
The Reach and Rise developments were completed, and handover to purchasers commenced, in 2016. 363 units (out of 390 units) at Reach and 258 units (out of 390 units) at Rise had been sold at 12th March 2019. The profits from the sales of two units at Reach and 35 units at Rise were recognised in 2018.
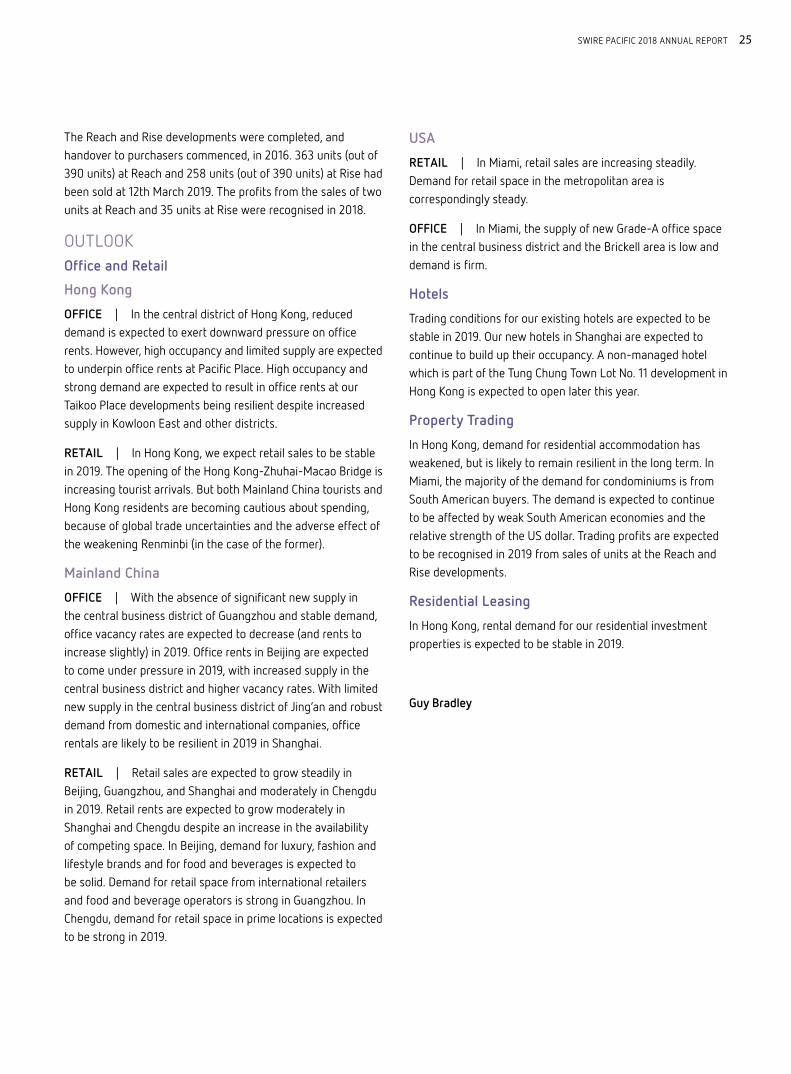
OUTLOOKOffice and Retail
Hong Kong
OFFICE | In the central district of Hong Kong, reduced demand is expected to exert downward pressure on office rents. However, high occupancy and limited supply are expected to underpin office rents at Pacific Place. High occupancy and strong demand are expected to result in office rents at our Taikoo Place developments being resilient despite increased supply in Kowloon East and other districts.
RETAIL | In Hong Kong, we expect retail sales to be stable in 2019. The opening of the Hong Kong-Zhuhai-Macao Bridge is increasing tourist arrivals. But both Mainland China tourists and Hong Kong residents are becoming cautious about spending, because of global trade uncertainties and the adverse effect of the weakening Renminbi (in the case of the former).
Mainland China
OFFICE | With the absence of significant new supply in the central business district of Guangzhou and stable demand, office vacancy rates are expected to decrease (and rents to increase slightly) in 2019. Office rents in Beijing are expected to come under pressure in 2019, with increased supply in the central business district and higher vacancy rates. With limited new supply in the central business district of Jing’an and robust demand from domestic and international companies, office rentals are likely to be resilient in 2019 in Shanghai.
RETAIL | Retail sales are expected to grow steadily in Beijing, Guangzhou, and Shanghai and moderately in Chengdu in 2019. Retail rents are expected to grow moderately in Shanghai and Chengdu despite an increase in the availability of competing space. In Beijing, demand for luxury, fashion and lifestyle brands and for food and beverages is expected to be solid. Demand for retail space from international retailers and food and beverage operators is strong in Guangzhou. In Chengdu, demand for retail space in prime locations is expected to be strong in 2019.
USA
RETAIL | In Miami, retail sales are increasing steadily. Demand for retail space in the metropolitan area is correspondingly steady.
OFFICE | In Miami, the supply of new Grade-A office space in the central business district and the Brickell area is low and demand is firm.
Hotels
Trading conditions for our existing hotels are expected to be stable in 2019. Our new hotels in Shanghai are expected to continue to build up their occupancy. A non-managed hotel which is part of the Tung Chung Town Lot No. 11 development in Hong Kong is expected to open later this year.
Property Trading
In Hong Kong, demand for residential accommodation has weakened, but is likely to remain resilient in the long term. In Miami, the majority of the demand for condominiums is from South American buyers. The demand is expected to continue to be affected by weak South American economies and the relative strength of the US dollar. Trading profits are expected to be recognised in 2019 from sales of units at the Reach and Rise developments.
Residential Leasing
In Hong Kong, rental demand for our residential investment properties is expected to be stable in 2019.
Guy Bradley

2018 Performance Review and Outlook – A V I A T I O N D I V I S I O N
A Cathay Pacific Airbus A350-1000 flying over Hong Kong.

AV I AT I O N D I V I S I O NAdvancing World-Class Service
We aim to continue to improve our products and services on
the ground and in the air, to expand our fleet by acquiring
fuel efficient aircraft and to strengthen our aircraft
engineering business.

Profit/(Loss) Attributable to the Shareholders of Cathay Pacific
O V E R V I E W O F T H E B U S I N E S S
AV I AT I O N D I V I S I O N
The Aviation Division comprises a significant investment in the Cathay Pacific group and the HAECO group.
1814 1715 16-2,000
-1,000
2,000
0
1,000
3,000
4,000
5,000
6,000
HK$M
1814 1715 160
5,000
20,000
15,000
10,000
HK$M
1814 1715 16
2
0
4
6
8
%
1814 1715 160
30,000
60,000
90,000
120,000
150,000
HK$M
Net Cash Generated from Operating Activities
Capital Employed
Return on Capital Employed
Cathay Pacific group (100% Basis)

29SWIRE PACIFIC 2018 ANNUAL REPORT
1814 1715 16-600
-400
-200
200
0
400
600
800
1,000
HK$M
1814 1715 160
500
2,000
1,500
1,000
HK$M
1814 1715 16-3
0
9
6
3
12
15
%
1814 1715 160
2,000
4,000
6,000
8,000
10,000
HK$M
Profit/(Loss) Attributable to the Shareholders of HAECO
Net Cash Generated from Operating Activities
Capital Employed
Return on Capital Employed
HAECO group (100% Basis)

2018 PERFORMANCE REVIEW AND OUTLOOKAVIATION DIVISION
30
STRATEGY
The strategic objective of Cathay Pacific (as a listed company in its own right) is sustainable growth in shareholder value over the long-term. The strategies employed by Cathay Pacific in order to achieve this objective (and the strategic objectives of HAECO) are these:
– The development and strengthening of Hong Kong as a centre for aviation services, including passenger, cargo and aircraft engineering services.
– The development and strengthening of the airline (Cathay Pacific and Cathay Dragon) and aircraft engineering (HAECO) brands.
– Developing the fleets of Cathay Pacific and Cathay Dragon (by investing in modern fuel efficient aircraft) with a view to their becoming two of the youngest, most fuel efficient fleets in the world.
– Maintaining and enhancing high standards of service to passenger, cargo and aircraft engineering customers.
– Strengthening the airlines’ passenger and cargo networks and improving what they do on the ground and in the air.
– Continuing to build the strategic relationship with Air China.
– Increasing the range and depth of aircraft engineering services offered by HAECO.
– Endeavouring to minimise the impact of the airlines and of HAECO on the environment.
The Cathay Pacific group
The Cathay Pacific group includes Cathay Pacific, its wholly-owned subsidiaries Cathay Dragon and Air Hong Kong and an associate interest in Air China and Air China Cargo. Cathay Pacific also has interests in companies providing flight catering and passenger and ramp handling services, and owns and operates a cargo terminal at Hong Kong International Airport. It is listed on The Stock Exchange of Hong Kong Limited.
Cathay Pacific offers scheduled passenger and cargo services to 76 destinations in 33 countries and territories (225 and 53 respectively including code share agreements). At 31st December 2018, it operated 154 aircraft and had 39 new aircraft due for delivery up to 2024.
Cathay Dragon is a regional airline registered and based in Hong Kong and offers scheduled services to 49 destinations in Mainland China and elsewhere in Asia (57 including code share agreements). At 31st December 2018, it operated 48 aircraft and had 32 new aircraft due for delivery up to 2024.
Cathay Pacific owns 18.13% of Air China, the national flag carrier and a leading provider of passenger, cargo and other airline-related services in Mainland China. Cathay Pacific has a cargo joint venture in Mainland China, Air China Cargo, which operated 15 freighters at 31st December 2018 and also carries cargo in the bellies of Air China’s passenger aircraft.
Air Hong Kong operates express cargo services for DHL Express to 12 Asian cities. At 31st December 2018, Air Hong Kong operated 10 freighters.
Cathay Pacific and its subsidiaries employ more than 32,400 people worldwide (around 26,200 of them in Hong Kong).
The HAECO group
The HAECO group provides aviation maintenance and repair services. Its primary activities are aircraft maintenance and modification work in Hong Kong (by HAECO Hong Kong), in Xiamen (by HAECO Xiamen) and in the USA (by HAECO Americas).
Engine overhaul work is performed by HAECO’s 50% joint venture company Hong Kong Aero Engine Services Limited and by HAECO’s subsidiary Taikoo Engine Services (Xiamen) Company Limited. The HAECO group has other subsidiaries and joint venture companies in Mainland China, which offer a range of aircraft engineering services and has a 70% interest in HAECO ITM Limited, an inventory technical management joint venture with Cathay Pacific in Hong Kong.
HAECO is a wholly-owned subsidiary of Swire Pacific.

31SWIRE PACIFIC 2018 ANNUAL REPORT
2018 PERFORMANCE
Financial Highlights2018
HK$M2017
HK$M
HAECO group Revenue 14,892 14,546
Operating profit/(loss) 1,140 (90)
Swire Pacific share of attributable profit/(loss) 760 (406)
Cathay Pacific group Share of post-tax profits/(losses) from associated companies 1,056 (567)
Swire Pacific share of attributable profit/(loss) 1,781 (1,002)
Accounting for the Aviation DivisionThe Group accounts for its associate interest in the Cathay Pacific group using the equity method of accounting. The Group recognises its share of net profit or loss as a single line-item in the consolidated statement of profit or loss. For more information on the results and financial position of the Cathay Pacific group, please refer to the abridged financial statements on pages 218 and 219. The figures above do not include consolidation adjustments.
CATHAY PACIFIC GROUPCathay Pacific and Cathay Dragon – 2018 Performance
2018 2017 Change
Available tonne kilometres (ATK) Million 32,387 31,439 +3.0%
Available seat kilometres (ASK) Million 155,362 150,138 +3.5%
Available cargo and mail tonne kilometres (AFTK) Million 17,616 17,163 +2.6%
Passenger revenue HK$M 73,119 66,408 +10.1%
Passenger revenue per ASK HK¢ 47.1 44.2 +6.6%
Revenue passenger kilometres (RPK) Million 130,630 126,663 +3.1%
Revenue passengers carried ‘000 35,468 34,820 +1.9%
Passenger load factor % 84.1 84.4 -0.3%pt
Passenger yield HK¢ 55.8 52.3 +6.7%
Cargo revenue – group HK$M 28,316 23,903 +18.5%
Cargo revenue – Cathay Pacific and Cathay Dragon HK$M 24,663 20,553 +20.0%
Cargo and mail revenue per AFTK HK$ 1.40 1.20 +16.7%
Cargo and mail carried Tonnes '000 2,152 2,056 +4.7%
Cargo and mail load factor % 68.8 67.8 +1.0%pt
Cargo and mail yield HK$ 2.03 1.77 +14.7%
Cost per ATK (with fuel) HK$ 3.27 3.12 +4.8%
Cost per ATK (without fuel) HK$ 2.25 2.14 +5.1%
Aircraft utilisation Hours per day 12.3 12.3 –
On-time performance % 72.7 71.2 +1.5%pts
Average age of fleet Years 9.9 9.3 +6.5%
Fuel consumption – group Barrels (million) 45.8 45.1 +1.6%
Fuel consumption per million RTK Barrels 1,830 1,866 -1.9%
Fuel consumption per million ATK Barrels 1,387 1,405 -1.3%

2018 PERFORMANCE REVIEW AND OUTLOOKAVIATION DIVISION
Cathay Pacific
Cathay Pacific Freighter
Cathay Dragon
Air Hong Kong
32
Cathay Pacific group – Network Coverage

Cathay Pacific
Cathay Pacific Freighter
Cathay Dragon
Air Hong Kong
33SWIRE PACIFIC 2018 ANNUAL REPORT
Cathay Pacific group – Network Coverage

2018 PERFORMANCE REVIEW AND OUTLOOKAVIATION DIVISION
34
2018 AIRLINE INDUSTRY REVIEWDespite broadly benign economic conditions, the environment in which Cathay Pacific’s airlines operate was as ever difficult in 2018. Competition was intense, fuel prices increased and the US dollar strengthened.
2018 RESULTS SUMMARYThe Cathay Pacific group’s attributable profit on a 100% basis was HK$2,345 million in 2018, compared with a loss of HK$1,259 million in 2017. The airlines’ profit after tax was HK$241 million (2017: loss of HK$4,303 million), and the share of profits from subsidiaries and associates was HK$2,104 million (2017: HK$3,044 million).
Overcapacity in passenger markets resulted in intense competition with other airlines, particularly those from Mainland China. This put pressure on market yields on key routes, particularly in the second half of the year. But the passenger business benefited from capacity growth, a focus on customer service and improved revenue management. Load factors were sustained and yield improved despite competitive pressures. The cargo business was strong. Capacity, yield and load factors increased.
Fuel prices increased for 10 months, before falling somewhat in the last two months of the year. The strength of the US dollar adversely affected net income in the latter half of the year.
In 2017, Cathay Pacific built the foundations for its transformation programme. In 2018, it restructured its operations outside Hong Kong, benefited from a series of productivity improvements, increased its digital capabilities and concentrated on global business services. It improved inflight dining, passenger comfort, the way in which it contacts passengers and its loyalty programmes. It extended its network and improved its service delivery training.
But for the adverse effect of a weaker Renminbi, the contribution from subsidiary and associated companies was satisfactory.
At the end of 2018, Cathay Pacific acquired from DHL International the 40% shareholding in Air Hong Kong that it did not already own, with the result that Air Hong Kong became a wholly-owned subsidiary. At the same time, a new 15-year block space agreement between Air Hong Kong and DHL International commenced.
Passenger Services
Passenger revenue in 2018 was HK$73,119 million, an increase of 10% compared to 2017. 35.5 million passengers were carried, an increase of 2% compared to the previous year.
Capacity increased by 4%, reflecting the introduction of 10 new routes (including to Brussels, Dublin, Davao City and Washington D.C.) and increased frequencies on other routes. The load factor decreased marginally, to 84.1%. Yield increased by 7%, to HK55.8 cents.
The Deck, at Hong Kong International Airport,
is Cathay Pacific’s latest lounge.

35SWIRE PACIFIC 2018 ANNUAL REPORT
Increased competition with other airlines, increased fuel costs and a progressive strengthening of the US dollar adversely affected passenger performance. Premium class demand was robust. Economy class demand was adversely affected by intense competition. But yields increased, reflecting in part fuel surcharges. Overall, the passenger business benefited from capacity growth, a focus on customer service and sound revenue management. Load factors were sustained.
Cargo Services
Cathay Pacific and Cathay Dragon
The cargo revenue of Cathay Pacific and Cathay Dragon in 2018 was HK$24,663 million, an increase of 20% compared to 2017. The tonnage carried in 2018 increased by 5% (to 2.2 million tonnes) compared to 2017. The market was robust throughout the year.
The cargo capacity of Cathay Pacific and Cathay Dragon increased by 3% in 2018. The cargo load factor increased by 1.0 percentage point to 68.8%. Cargo yield increased by 15% to HK$2.03, reflecting an increase in high-value specialist cargo shipments and higher fuel surcharges.
Air Hong Kong
Air Hong Kong experienced a marginal increase in profit for 2018 compared with 2017. Capacity (in terms of available tonne kilometres) decreased by 4% to 730 million. The load factor decreased by 0.8 percentage point to 66.1%.
Operating Costs
Total fuel costs for Cathay Pacific and Cathay Dragon (before the effect of fuel hedging) increased by HK$7,545 million (or 31%) compared with 2017. Prices rose and the airlines flew more.
09 10 11 12 13 14 15 16 17 1880,000
170,000 34,00032,00030,00028,00026,00024,00022,00020,00018,00016,00014,000
160,000
150,000
140,000
130,000
120,000
110,000
100,000
90,000
ASK (million) ATK (million)
ASK (million) ATK (million)
09 10 11 12 13 14 15 16 17 1866
86 85
80
75
70
65
60
55
50
45
40
848280787674727068
%
Passenger load factor (%) Passenger yield (HK¢)
HK¢
09 10 11 12 13 14 15 16 17 1856
76 280
260
240
220
200
180
160
140
747270686664626058
%
Cargo load factor (%) Cargo yield (HK¢)
HK¢
09 10 11 12 13 14 15 16 17 180
160 50
40
30
20
10
0
140
120
100
80
60
40
20
Fuel price before hedging(US$ per barrel of jet fuel)
Fuel price after hedging(US$ per barrel of jet fuel)
US$ Barrels (million)
Fuel consumption(barrels in millions)
Capacity – Available Seat Kilometres and Available Tonne Kilometres
Passenger Services Load Factor and Yield
Cargo Services Load Factor and Yield Fuel Price and Consumption

2018 PERFORMANCE REVIEW AND OUTLOOKAVIATION DIVISION
36
Fuel hedging losses were reduced. After taking hedging losses into account, the Cathay Pacific group’s fuel costs increased by HK$2,757 million (or 9%) compared to 2017. The net cost of fuel is the Cathay Pacific group’s most significant cost, accounting for 30.9% of operating costs in 2018 (compared to 30.7% in 2017). Underlying costs per ATK (without fuel) only increased slightly. This reflected a focus on productivity and efficiency.
Congestion at Hong Kong International Airport and air traffic constraints in Greater China imposed costs on the Cathay Pacific group. Cathay Pacific is doing more to improve the reliability of its operations.
Cathay Pacific remains the subject of antitrust proceedings in various jurisdictions. The outcomes are subject to uncertainties. Cathay Pacific is not in a position to assess the full potential liabilities but makes provisions based on relevant facts and circumstances.
Data Incident
In October 2018, Cathay Pacific announced that it had discovered unauthorised access to some of its passenger data and that of Cathay Dragon. Upon discovery, immediate action was taken to contain the event and to commence a thorough investigation. To date no evidence has been found that any personal information has been misused. The information systems affected were separate from flight operations systems. There was no impact on flight safety. Affected passengers were contacted and Hong Kong police and relevant authorities were notified.
Fleet Profile
At 31st December 2018, the total number of aircraft in the Cathay Pacific and Cathay Dragon fleets was 202, an increase of six since 31st December 2017.
Fleet profile*
Aircraft type
Number at 31st December 2018
Total
Firm orders
Total
Expiry of operating leases
Owned
Leased
Finance Operating ‘19 ‘20‘21 andbeyond ‘19 ‘20 ‘21 ‘22 ‘23 ‘24
‘25 andbeyond
Aircraft operated by Cathay Pacific:A330-300 20 10 3 33 1 2A350-900 16 4 2 22 2 4 6 2A350-1000 6 2 8 4(a) 3 5 12747-400BCF 1 1747-400ERF 6 6747-8F 3 11 14777-200 4 4777-300 14 14 3 3(b)
777-300ER 20 10 22 52 1 6 4 2 3 6777-9 21 21Total 84 43 27 154 9 7 26 42 2 2 6 4 2 3 8Aircraft operated by Cathay Dragon:A320-200 5 10 15 4 3 3A321-200 2 6 8 1 2 2 1A321-200neo 9 23 32A330-300 18(c) 7 25 3 1 2 1Total 25 23 48 9 23 32 3 6 7 5 1 1Aircraft operated by Air Hong Kong:A300-600F 10 10 1 1 5 3Total 10 10 1 1 5 3Grand total 109 43 60 212 9 16 49 74 6 9 13 14 6 3 9
* The table includes one parked Boeing 777-200 aircraft and does not reflect aircraft movements after 31st December 2018. The parked Boeing 777-200 aircraft was subsequently deregistered in March 2019.
(a) One aircraft has been delivered in February 2019 and a second aircraft delivered in March 2019.(b) Three used Boeing 777-300 aircraft will be delivered in 2019.(c) Eight of these aircraft are owned by Cathay Pacific and leased by Cathay Dragon.

37SWIRE PACIFIC 2018 ANNUAL REPORT
In 2018, Cathay Pacific took delivery of eight Airbus A350-1000 aircraft and expects to have 20 aircraft of this type in service by the end of 2021.
At 31st December 2018, the Cathay Pacific group had 71 new aircraft on order for delivery up to 2024. This includes an order for 32 Airbus A321-200neo aircraft. These aircraft are intended to replace and increase Cathay Dragon’s existing narrow-body fleet.
Three Airbus A330-300 aircraft, one Boeing 747-400BCF and one Boeing 777-300ER aircraft were returned to their lessors in 2018. One Boeing 777-200 aircraft was donated to the Pima Air and Space Museum in Arizona, USA.
Air China and Air China Cargo
The Cathay Pacific group’s share of Air China’s results is based on its financial statements drawn up three months in arrears. Consequently, the 2018 results include Air China’s results for the 12 months ended 30th September 2018, adjusted for any significant events or transactions for the period from 1st October 2018 to 31st December 2018.
For the 12 months ended 30th September 2018, Air China’s financial results declined compared to the 12 months ended 30th September 2017.
Air China Cargo’s 2018 financial results also declined from last year.
OUTLOOK The business environment is expected to remain challenging in 2019, with the forecast strength of the US dollar and uncertainty due to geopolitical discord and global trade tensions dampening passenger and cargo demand. Competition will remain intense, especially in economy class on long haul routes. Operational constraints will impose additional costs. These factors will affect both the passenger and the cargo business.
Cathay Pacific remains confident in the ability of its transformation programme to enable it to deliver sustainable long-term performance. In 2019, Cathay Pacific will continue to reorganise its business processes, to benefit from associated underlying structural initiatives and to build a culture of continuous improvement. The airlines will compete hard by extending their route network to destinations not currently served from Hong Kong, by increasing frequencies on their most popular routes and by operating more fuel-efficient aircraft. They will focus upon, and continue to invest in, customer service and productivity.
Rupert Hogg
Eight Airbus A350-1000 aircraft
were delivered in 2018. This technologically
advanced aircraft brings major advantages in fuel efficiency.

2018 PERFORMANCE REVIEW AND OUTLOOKAVIATION DIVISION
38
HONG KONG AIRCRAFT ENGINEERING COMPANY (HAECO) GROUPFinancial Highlights
2018 HK$M
2017 HK$M
Revenue HAECO Hong Kong 4,253 4,041
HAECO Americas 2,644 2,625
HAECO Xiamen 2,165 2,041
TEXL 4,893 5,162
Others 937 677
14,892 14,546
Net operating profit/(loss) 1,048 (210)
Attributable profit/(loss) HAECO Hong Kong 261 257
HAECO Americas (290) (602)
HAECO Xiamen 233 135
TEXL 182 209
Share of profits of: HAESL 374 244
Other subsidiary and joint venture companies 191 97
Attributable profit (excluding non-recurring items) 951 340
Impairment charges in respect of:
Goodwill – (625)*
Plant, machinery and tools – (7)*
Write-off of net deferred tax assets – (249)*
Gain on acquisition of additional interests in a joint venture company which became a subsidiary 42 –
Attributable profit/(loss) 993 (541)
Swire Pacific share of attributable profit/(loss) 760 (406)
* representing impairment charges and write-off relating to HAECO Americas
Operating Highlights2018 2017
Airframe services manhours sold HAECO Hong Kong Million 2.70 2.70
HAECO Americas Million 2.85 2.80
HAECO Xiamen Million 4.11 3.76
Line services movements handled HAECO Hong Kong Average per day 321 320
Engines overhauled TEXL 90 85
HAESL 212 140

39SWIRE PACIFIC 2018 ANNUAL REPORT
2018 AVIATION MAINTENANCE AND REPAIR INDUSTRY REVIEWOrders for new aircraft are firm. Aircraft manufacturers have record order books and are increasing production. More aircraft means in principle more demand for their maintenance and repair. But new aircraft need less maintenance and repair than older aircraft and original equipment manufacturers are doing more maintenance and repair than they used to. On balance, maintenance and repair demand is still expected to grow in the medium and longer term.
2018 RESULTS SUMMARYIn 2018, most HAECO businesses did well and the results of HAECO Americas, although its business still made a loss, improved significantly. The HAECO group overall reported an attributable profit of HK$993 million in 2018 on a 100% basis, including a gain of HK$42 million associated with the acquisition of additional interests in a joint venture company. This compares with a loss of HK$541 million in 2017, which included an impairment charge of HK$625 million in respect of the goodwill attributable to HAECO Americas and a write-off of HK$249 million in respect of HAECO Americas’ net deferred tax assets.
Disregarding the gain associated with the acquisition of additional interests in a joint venture company in 2018 and the impairment charges and the net deferred tax assets write-off in 2017, the HAECO group’s 2018 attributable profit was HK$951 million, compared with HK$340 million in 2017. The higher profit primarily reflected reduced losses at HAECO Americas and more workload at HAECO Xiamen and HAESL.
A total of 9.66 million airframe services manhours were sold by HAECO Hong Kong, HAECO Americas and HAECO Xiamen in 2018, 0.40 million more than in 2017. More airframe services work was performed at HAECO Americas and HAECO Xiamen in 2018. Similar levels of work were performed at HAECO Hong Kong.
09 10 11 12 13 14 15 16 17 180
10 340
320
300
280
260
240
220
200
180
8
6
4
2
Airframe servicesmanhours sold – HAECO Hong Kong
Airframe servicesmanhours sold – HAECO Xiamen
Airframe servicesmanhours sold – HAECO Americas
Movements handled(average per day)
Line services movements handled – HAECO Hong Kong
Manhours sold(million)
HAECO group – Key Operating Highlights
HAECO became a wholly-owned
subsidiary of Swire Pacific in December 2018.

2018 PERFORMANCE REVIEW AND OUTLOOKAVIATION DIVISION
40
HAECO Hong Kong
HAECO Hong Kong recorded a 2% increase in profit in 2018 to HK$261 million. This mainly reflects a better performance in airframe and line services, partly offset by increased operating costs in component repair. Manhours sold for airframe services remained at 2.70 million in 2018, with higher selling rates.
In line services, the average number of aircraft movements handled per day in 2018 was similar to that in 2017. Line services manhours sold increased, reflecting an increase in work per aircraft.
Component repair manhours sold in 2018, including those sold by HAECO Component Overhaul (Xiamen), were 0.22 million, an increase of 2% compared to 2017. The growth reflected increased demand and new capabilities.
HAECO Americas
HAECO Americas recorded a loss of HK$290 million in 2018, HK$312 million lower than the loss of HK$602 million in 2017 (the latter figure excluding impairment charges and the write-off of net deferred tax assets). The improved result reflected an increased proportion of higher margin airframe services work and gains in efficiency, in addition to more seat and spares sales.
Demand for HAECO Americas’ airframe services was stable. 2.85 million manhours were sold in 2018 compared with 2.80 million in 2017. The significant work from a major customer lost in August 2017 was replaced with additional work following the opening of a fifth hangar at Greensboro in 2018 and higher margin work. The results in 2017 were also adversely affected by non-recurring expenses.
Less interior reconfiguration work was done and fewer Panasonic communication equipment installation kits were delivered in 2018. Despite this, the results of the cabin solutions business improved. This was because more seats (8,900 compared with 7,300 in 2017) and seating spares were sold, and at higher margins.
HAECO Xiamen
HAECO Xiamen recorded a 73% increase in attributable profit compared with 2017, to HK$233 million. This reflected an increase in airframe services work and a significant favourable foreign exchange rate movement.
Manhours sold for airframe services reached a record high in 2018 at 4.11 million. The 9% growth in volume reflected higher demand and generated an 8% increase in revenue.
In line services, an average of 58 aircraft movements were handled per day in 2018, 7% more than in 2017.
TEXL
TEXL recorded a 13% decrease in attributable profit to HK$182 million in 2018 compared to 2017. In 2018, TEXL performed 52 performance restoration workscopes and 38 quick turn workscopes on GE90 aircraft engines (compared with 52 performance restoration workscopes and 33 quick turn workscopes in 2017). The reduction in profit in 2018 principally reflected a change in the terms on which TEXL contracts with its key customer.
HAESL
HAESL recorded a 53% increase in attributable profit in 2018 compared to 2017. The increase in profit reflected an increase in engine volume and a heavier work mix. 212 engines were overhauled in 2018, compared with 140 in 2017. HAESL has invested heavily in new facilities and tooling (and continues to recruit additional manpower) in order to accommodate further growth.
Other Principal Subsidiary and Joint Venture Companies
HAECO ITM provided inventory technical management services for 299 aircraft in 2018, 10% more than in 2017. However, its profit in 2018 was lower than in 2017. Staff costs and repair charges were higher.
HAECO Landing Gear Services made a profit in 2018, compared to a loss in 2017. It did more work.

41SWIRE PACIFIC 2018 ANNUAL REPORT
OUTLOOKThe prospects for the HAECO group’s different businesses in 2019 are mixed. Demand for airframe services in America is expected to rise and to be stable in Hong Kong and Xiamen. Demand for line services is expected to be firm. Demand for engines services is expected to increase. The component overhaul business is expected to improve gradually, with the development of new capabilities. The cabin solutions business in America expects fewer seats to be sold in 2019 than in 2018. Forward bookings for cabin integration work are low. More Panasonic communication equipment work is expected.
The relocation proposed by the Xiamen municipal government of the Gaoqi airport to a new airport in the Xiang’an district remains subject to central government approval. Management maintains regular communications with the local authorities about the new airport and its opening, which will be material to the operations of the HAECO group in Xiamen.
Augustus Tang

2018 Performance Review and Outlook – B E V E R A G E S D I V I S I O N
Coca-Cola beverages bring refreshing taste to consumers.

B E V E R A G E S D I V I S I O NDelivering Refreshing Soft Drinks
Swire Beverages manufactures, markets and distributes
refreshing soft drinks to consumers in Hong Kong, Taiwan,
Mainland China and the USA.
Phot
o co
urte
sy: T
he C
oca-
Cola
Com
pany
.

1814 1715 160
500
1,000
1,500
3,500
2,500
3,000
2,000
HK$M
1814 1715 160
10,000
5,000
20,000
15,000
HK$M
1814 1715 160
5
10
15
25
20
%
1814 1715 160
500
1,000
1,500
2,000
2,500
HK$M
B E V E R A G E S D I V I S I O N
Swire Beverages has the exclusive right to manufacture, market and distribute products of The Coca-Cola Company (TCCC) in 11 provinces and the Shanghai Municipality in Mainland China and in Hong Kong, Taiwan and an extensive area of the western USA.
Profit Attributable to the Company’s Shareholders
Capital Employed
Return on Capital Employed
O V E R V I E W O F T H E B U S I N E S S
Net Cash Generated from Operating Activities

45SWIRE PACIFIC 2018 ANNUAL REPORT
STRATEGY
Swire Beverages has nine wholly-owned franchise businesses (in Hong Kong, Taiwan and the USA, and in Fujian, Anhui, Guangxi, Jiangxi and Hainan provinces and the cities of Zhanjiang and Maoming in Guangdong province in Mainland China) and six majority-owned franchise businesses (in Zhejiang, Jiangsu, Guangdong (excluding the cities of Zhanjiang and Maoming), Henan, Yunnan and Hubei provinces in Mainland China). It has a joint venture interest in a franchise in the
Shanghai Municipality in Mainland China and an associate interest in Coca-Cola Bottlers Manufacturing Holdings Limited (CCBMH), which supplies still beverages to all Coca-Cola franchises in Mainland China.
At the end of 2018, Swire Beverages manufactured 61 beverage brands and distributed them to a franchise population of 728 million people.
The strategic objective of Swire Beverages is to build a world-class bottling system which is recognised as a first class employer, a first class entity with which to do business and a first class corporate citizen in all territories where it does business. The strategies employed in order to achieve this objective are:
– An uncompromising commitment to safety and quality.
– A commitment to work with TCCC to improve our understanding of our customers’ businesses, and to use that understanding to create value for our customers and consumers.
– A focus on route to market and market execution in sales outlets, recognising that our business depends critically on selling to millions of consumers through such outlets in our franchise territories.
– Effective revenue growth management, through optimisation of pricing, product and channel mix, product premiumisation and innovation.
– Effective management of costs, through improvements in productivity and efficiency in our supply chain and in sales and distribution.
– A commitment to sustainability, by seeking to reduce the environmental impact of our operations, with a particular focus on water conservation and waste reduction and by engaging with the communities in which we operate.

2018 PERFORMANCE REVIEW AND OUTLOOKBEVERAGES DIVISION
Idaho
Arizona
Henan Jiangsu
Anhui
Zhejiang
Fujian
Guangdong
Washington
Oregon
California
NevadaUtah
Wyoming
SouthDakota
Colorado
New Mexico
Nebraska
Kansas
Taiwan
Hong Kong> 100
51 to 100
25 to 50
Bottling plant
2018 per capita consumption of Coca-Cola beverages (8oz servings)
Hubei
YunnanGuangxi
Jiangxi
Shanghai
Hainan
46
Franchise Territories
GREATER CHINA USA
Franchisepopulation
(millions)(end 2018)
GDP percapita(US$)
Sales volume(million unit cases)
2018 2008 Per capita consumption of Coca-Cola beverages (8oz servings)
Mainland China 668.2 10,547 1,334 600
Hong Kong 7.4 47,426 66 57
Taiwan 23.6 25,048 56 58
USA 28.8 46,763 299 86
Note 1: A unit case comprises 24 8-ounce servings.
Per Capita Consumption in Franchise Territories
20182008
0 50 100 150 200 250 300 350

47SWIRE PACIFIC 2018 ANNUAL REPORT
2018 PERFORMANCE
Financial Highlights2018
HK$M2017
HK$M
Revenue 41,190 34,067EBITDA 3,915 4,689Operating profit derived from: Operating activities 2,034 1,719 Non-recurring items 255 1,606 Total operating profit 2,289 3,325Share of post-tax profits from joint venture and associated companies 151 112Attributable profit (excluding non-recurring items) 1,354 962Non-recurring items: Gain on remeasurement of previously held interests in joint venture companies in Mainland China – 975 Gain on disposal of a subsidiary company in Mainland China – 247 Gain from the acquisition of new franchise territories and assets in the USA 132 289 Gain/(loss) on disposal of Kaohsiung plant in Taiwan 144 (32)Attributable profit 1,630 2,441
Segment Financial HighlightsRevenue EBITDA Attributable Profit
2018 HK$M
2017 HK$M
2018 HK$M
2017 HK$M
2018 HK$M
2017 HK$M
Mainland China Operating activities 21,358 16,256 1,974 1,454 634 243 Non-recurring items – – – 1,356 – 1,222
21,358 16,256 1,974 2,810 634 1,465Hong Kong 2,343 2,255 323 310 230 220Taiwan Operating activities 1,551 1,343 129 115 67 43 Non-recurring items – – 148 (39) 144 (32)
1,551 1,343 277 76 211 11USA Operating activities 15,938 14,213 1,300 1,239 491 494 Non-recurring items – – 107 289 132 289
15,938 14,213 1,407 1,528 623 783Central costs – – (66) (35) (68) (38)Beverages Division 41,190 34,067 3,915 4,689 1,630 2,441
Accounting for the Beverages DivisionThe non-recurring gains included under attributable profit are after the deduction of tax and non-controlling interests.
Before 1st April 2017The seven wholly-owned and majority-owned franchise businesses (in Hong Kong, Taiwan and the USA and in Fujian, Henan, Anhui and Shaanxi provinces in Mainland China) were accounted for as subsidiaries in the financial statements of Swire Pacific. Revenue and operating profit from these franchise businesses are included in the revenue and operating profit shown above. The division’s joint venture interests in three other franchises in Mainland China (Guangdong, Zhejiang and Jiangsu) and its associate interest in CCBMH were accounted for using the equity method of accounting. Swire Pacific recognised its share of net profit or loss from each of these interests as a single line-item in the consolidated statement of profit or loss.
On and after 1st April 2017After completion of the majority of the realignment of the Coca-Cola bottling system in Mainland China on 1st April 2017, the division’s joint venture interests in three franchise businesses in Mainland China (Guangdong, Zhejiang and Jiangsu) became subsidiary companies. These three franchise businesses were accordingly accounted for as subsidiaries in the financial statements of Swire Pacific from 1st April 2017. Revenue and operating profit from these three franchise businesses were included in the revenue and operating profit from 1st April 2017. The division’s associate interest in CCBMH continued to be accounted for using the equity method of accounting.
On and after 1st July 2017The transfer of interests in the Coca-Cola bottling unit of Shanghai Shen-Mei Beverage and Food Co., Ltd. was completed by 1st July 2017. The division’s joint venture interest in this company is accounted for using the equity method of accounting.
2017 central costs are arrived at after crediting gains on disposal of available-for-sale investments of HK$1 million.

2018 PERFORMANCE REVIEW AND OUTLOOKBEVERAGES DIVISION
48
Segment Performance
Note
Percentage Change in 2018
MainlandChina Hong Kong Taiwan USA
Swire Beverages
Active Outlets 0.9% 0.4% 1.0% -1.2% 0.7%
Revenue 1 23.4% 3.6% 7.9% 11.4% 19.9%Sales Volume 2 19.9% 1.1% 5.1% 6.2% 16.0%
Gross Profit* 3.2% 1.0% 1.8% 6.4% 3.6%
Water Use Ratio^ -2.0% – -7.0% -3.0% -2.0%Energy Use Ratio^ -7.0% – -21.0% 21.0% -9.0%
LTIR +38% +84% +112% -4% +6%
NoteMainland
China Hong Kong Taiwan USASwire
Beverages
EBITDA Margin 3
2018 8.5% 14.0% 8.6% 9.1% 9.0% 2017 8.2% 14.5% 8.2% 9.8% 9.2%
EBIT Margin 3
2018 5.0% 11.2% 5.2% 5.1% 5.4% 2017 4.5% 11.4% 4.4% 6.0% 5.5%
* Per unit case. ^ Refer to the Glossary on page 234. Note 1: Revenue for the Beverages Division including that of joint venture companies and excluding sales to other bottlers was HK$42,659 million (2017: HK$35,582 million). Note 2: The sales volume for Mainland China shown in the table above represents sales in seven franchise territories from 1st January 2017 to 31st March 2017, sales in 12 franchises territories
from 1st April 2017 to 30th June 2017 and sales in 13 franchises territories starting from 1st July 2017, in each case including products supplied by CCBMH. Note 3: (i) EBITDA and EBIT for the Beverages Division including that of joint venture companies and excluding non-recurring gains and central costs were HK$3,840 million (2017: HK$3,261
million) and HK$2,299 million (2017: HK$1,942 million) respectively. (ii) EBITDA margin and EBIT margin represent EBITDA and EBIT expressed as percentages of revenue.
2018 RESULTS SUMMARYSwire Beverages made an attributable profit of HK$1,630 million in 2018. This included a non-recurring gain of HK$144 million arising from the disposal of the Kaohsiung plant in Taiwan and a non-recurring gain in relation to the acquisition of production assets in the USA of HK$132 million. This compares with an attributable profit of HK$2,441 million in 2017. The 2017 figure included non-recurring gains of HK$1,222 million arising from the realignment of the Coca-Cola bottling system in Mainland China, non-recurring gains in the USA aggregating HK$289 million arising from changes to the division’s franchise terms and production and distribution assets acquired, and a loss on disposal of the Kaohsiung plant in Taiwan of HK$32 million.
Disregarding the non-recurring gains in both years, Swire Beverages made an attributable profit of HK$1,354 million in 2018, a 41% increase compared with an attributable profit of HK$962 million in 2017.
Total revenue (including that of joint venture companies and excluding sales to other bottlers) increased by 20% to HK$42,659 million. Overall sales volume increased by 16% to 1,755 million unit cases. Revenue and volume grew in Mainland China and the USA, mainly due to the inclusion of sales in the territories acquired in 2017. Revenue and volume also grew in Hong Kong and Taiwan.
EBITDA (including that of joint venture companies and excluding non-recurring gains and central costs) increased by 18% to HK$3,840 million. Revenue growth was reflected in improved EBITDA margins in Mainland China and Taiwan. In the USA and Hong Kong, the positive effect of revenue growth on EBITDA margins was more than offset by increases in raw material and operating costs.
Swire Beverages will continue to make significant investments in production assets, logistics infrastructure, merchandising equipment and digital capabilities. Capital commitments at 31st December 2018 were HK$931 million.

49SWIRE PACIFIC 2018 ANNUAL REPORT
2018
Sparkling 65%Juice 12%Water 8%
Tea 3%
Other still (excluding water) 7%Energy drinks 5%
09 10 11 12 13 14 15 16 17 180
2,000
1,500
1,000
500
Mainland China Hong Kong Taiwan USA
Million unit cases
09 10 11 12 13 14 15 16 17 180
45,000
40,000
35,000
30,000
25,000
20,000
15,000
10,000
5,000
Mainland China Hong Kong Taiwan USA
HK$M
2017
Sparkling 64%Juice 12%
Tea 3%
Water 8%Other still (excluding water) 7%Energy drinks 6%
0
25,000
20,000
15,000
10,000
5,000
2018 2017 2018 2017 2018 2017 2018 2017
Sparkling
Juice
Energy drinks
Tea
Water
Other still (excluding water)
Mainland China Hong Kong USATaiwan
HK$M
Breakdown of Total Revenue by Category#
Breakdown of Revenue by Region and Category#
Sales Volume#Sales Revenue#
Mainland China Hong Kong Taiwan USA
Revenue Volume Revenue Volume Revenue Volume Revenue Volume
Sparkling 27% 23% 5% 3% 4% 1% 11% 5%Juice 13% 14% 4% 2% 4% 4% 8% -2%Water 24% 19% -6% -3% 54% 33% 7% 7%Other still (excluding water) 4% -14% 3% 2% 16% 33% 11% 5%Energy drinks 9% 7% 16% 4% 208% 212% 22% 27%Tea 409% 188% 6% 4% 6% 9% -1% -4%
# Revenue and volume includes joint venture companies and excludes sales to other bottlers.## Revenue (in local currency terms) and volume includes joint venture companies and excludes sales to other bottlers.
Growth in Revenue and Volume in 2018 by Category##

2018 PERFORMANCE REVIEW AND OUTLOOKBEVERAGES DIVISION
50
09 10 11 12 13 14 15 16 17 180
2,500
2,000
1,500
1,000
500
Mainland China Hong Kong Taiwan USA
HK$M
Mainland China
Attributable profit from Mainland China was HK$634 million in 2018. Disregarding non-recurring gains in 2017, the attributable profit in 2018 increased by 161% from 2017.
Revenue (including that of joint venture companies and excluding sales to other bottlers) grew by 23% in local currency terms. This principally reflected the acquisition of new franchise territories in 2017 and a 8% increase in revenue in existing territories. Revenue grew faster than volume. This reflected improvements in product and package mixes and price increases.
Sparkling revenue increased by 27%. Still revenue increased by 15%. Juice and water revenue increased by 13% and 24% respectively.
Total sales volume increased by 20%. Sales volume in existing territories increased by 7%.
The increase in revenue was partly offset by higher raw material and operating costs.
EBITDA and EBIT (including those of joint venture companies and excluding non-recurring gains and central costs) increased by 28% and 39% in local currency terms respectively. The EBITDA margin increased from 8.2% in 2017 to 8.5% in 2018. The EBIT margin increased from 4.5% to 5.0%.
Capital Expenditure
Hong Kong
Attributable profit from Hong Kong in 2018 was HK$230 million, a 5% increase from 2017. The increase included the additional share of profits in Hong Kong resulting from the acquisition in 2017 of the 12.5% of Swire Beverages Limited previously owned by TCCC. The operating profit increased by 2%.
Revenue (excluding sales to other bottlers) increased by 4%, representing a higher growth rate than that of volume. This reflected the introduction of new products, an improved product mix and price increases.
Sparkling revenue increased by 5%. Still revenue increased by 2%. Tea and juice revenue increased by 6% and 4% respectively. Water revenue decreased by 6%.
Total sales volume increased by 1%.
The increase in revenue was partly offset by higher raw material and operating costs.
EBITDA and EBIT (excluding the impact of the acquisition of additional shares in Swire Beverages Limited in 2017) increased by 0.3% and 2% respectively. The EBITDA margin decreased from 14.5% in 2017 to 14% in 2018. The EBIT margin decreased from 11.4% to 11.2%.
Swire Beverages is setting up a joint venture to establish Hong Kong’s first dedicated PET and HDPE recycling facility.
Taiwan
Attributable profit from Taiwan in 2018 was HK$211 million. Disregarding the non-recurring gain/(loss) on disposal of the Kaohsiung plant, the attributable profit was HK$67 million, a 56% increase from 2017.
Revenue in local currency terms increased by 8%, representing a higher growth rate than that of volume. This reflected price increases and an improved product mix.
Sparkling revenue increased by 4%, reflecting improved market execution and sales promotion. Still revenue increased by 12%. Tea revenue increased by 6%, reflecting the introduction of new products. Water revenue increased by 54%.
Total sales volume increased by 5%.
Profits were adversely affected by higher raw material costs but benefited from a slower increase in operating expenses (4%) and favourable exchange rate movements.

51SWIRE PACIFIC 2018 ANNUAL REPORT
EBITDA and EBIT (excluding non-recurring gains and central costs) increased by 13% and 27% in local currency terms respectively. The EBITDA margin increased from 8.2% in 2017 to 8.6% in 2018. The EBIT margin increased from 4.4% to 5.2%.
USA
Attributable profit from the USA was HK$623 million in 2018. Disregarding non-recurring gains, the attributable profit was HK$491 million in 2018, a 0.6% decrease from the corresponding figure in 2017.
Revenue in local currency terms (excluding sales to other bottlers) grew by 11%. This principally reflected the inclusion of sales in the states of Washington and Idaho from March 2017 and Oregon from May 2017. Revenue grew faster than volume. This reflected price increases.
Sparkling revenue increased by 11%. Still revenue increased by 13%. The latter increase principally reflected a 22% increase in revenue from energy drinks.
Total sales volume increased by 6%. The revenue from existing territories increased by 1%.
Gross profits increased, principally as a result of higher selling prices and sales volume, but the beneficial effect of this was more than offset by higher finance charges and higher raw material and operating costs.
EBITDA (excluding non-recurring gains and central costs) increased by 3% in local currency terms. EBIT decreased by 6%. The EBITDA margin decreased from 9.8% in 2017 to 9.1% in 2018. The EBIT margin decreased from 6% to 5.1%.
OUTLOOKRevenue in Mainland China is expected to continue to grow in 2019. Revenue is expected to grow faster than volume, reflecting better product and package mix, and improved market execution. However, increased operating costs particularly staff costs will put pressure on profits.
Continued growth in revenue is expected in Hong Kong in 2019, with revenue growing faster than volume. Operating costs are expected to increase. Increased capital expenditure will put pressure on profits in the short term.
Revenue is expected to continue to grow in Taiwan, reflecting improvements in product and package mix and in the management of sales channels.
In the USA, the beverages market is expected to grow moderately in 2019. Sales of energy drinks are expected to continue to grow. However, increased costs will put pressure on profits.
Patrick Healy
Swire Beverages expanded its product and package portfolio after the successful
integration of new franchises
in Mainland China.

2018 Performance Review and Outlook – M A R I N E S E R V I C E S D I V I S I O N
Pacific Gull, one of Swire Pacific Offshore’s G-class vessels.

M A R I N E S E R V I C E S D I V I S I O NProviding Excellent Offshore Support
We aim to provide outstanding specialised offshore support
to the global oil and gas industry.

1814 1715 160
500
1,000
2,000
1,500
2,500
3,000
HK$M
1814 1715 16-6,000
-5,000
-4,000
-2,000
-3,000
-1,000
0
1,000
2,000
HK$M
1814 1715 16-35
-20
-5
5
10
0
-10
-15
-25
-30
%
1814 1715 160
5,000
10,000
15,000
20,000
25,000
HK$M
M A R I N E S E R V I C E S D I V I S I O N
The Marine Services Division, through Swire Pacific Offshore, owns and operates offshore support vessels servicing the energy industry in every major offshore production and exploration region outside the USA. SPO also has a windfarm installation business and a subsea business.
Profit/(Loss) Attributable to the Company’s Shareholders
Capital Employed
Return on Capital Employed
Net Cash Generated from Operating Activities
O V E R V I E W O F T H E B U S I N E S S

55SWIRE PACIFIC 2018 ANNUAL REPORT
STRATEGY
The principal strategic objective of the Marine Services Division is to maintain and strengthen SPO’s position as a leading supplier of marine services, focusing primarily on the offshore energy industry. The strategies employed in order to achieve this objective are:
– Ensuring safety always comes first in every aspect of the business.
– Delivering a consistently high level of reliability and quality.
– Efficient and productive fleet operations.
– Developing complementary value added services.
– Managing the business sustainably.
– Developing an Industry leading team recognised for quality and professionalism.
– Operating to the highest standards of corporate governance.
SPO supports offshore drilling, production, exploration, platform construction, subsea IMR and light construction work and high speed crew changes. SPO also carries out seismic survey support, marine salvage, oil spill preparedness and response, offshore wind farm construction and servicing, oil rig decommissioning and subsea remotely operated vehicle support.
HUD, a joint venture between CK Hutchison and Swire Pacific, provides engineering, harbour towage and salvage services from its facilities on Tsing Yi Island in Hong Kong. It is the largest towage operator in Hong Kong, operating 13 tugs and six container vessels, providing a 24-hour service.
SPOSPO’s Fleet
At 31st December 2018, SPO operated a fleet of 77 offshore support vessels. The fleet consists of anchor handling tug supply vessels (AHTSs), platform supply vessels (PSVs) and construction and specialist vessels (CSVs). The CSVs consist of inspection, maintenance and repair vessels (IMR), seismic survey vessels, wind farm installation vessels (WIVs), accommodation barges, a light construction subsea vessel and a high speed catamaran crew boat.
Except for those committed to long-term charters, SPO’s vessels can be relocated from one operating region to another to take advantage of the most favourable employment opportunities.
SPO’s Geographical Distribution
SPO is headquartered in Singapore, with shore support for its vessels provided by outport offices in Angola, Australia, Brazil, Brunei, Cameroon, Canada, Cyprus, Denmark, Equatorial Guinea, Ghana, India, Indonesia, Kenya, Malaysia, New Zealand, Norway, Qatar, the Philippines, Scotland, Trinidad & Tobago and the United Arab Emirates.
SPO – Fleet Size
Additions Disposals Year-endVessels expected to be
received/(disposed of) in
Vessel class 2017 2018 2019 2020
Anchor Handling Tug Supply Vessels 49 – 5 44 (2) (1)
Platform Supply Vessels 18 4 – 22 – –
Construction and Specialist Vessels 10 1 – 11 (3) 1
77 5 5 77 (5) –
Note: One CSV was chartered from an external party in 2018 and is included as an addition above. The CSV received in 2018 is, and the CSV expected to be received in 2020 will be, on operating leases.

2018 PERFORMANCE REVIEW AND OUTLOOKMARINE SERVICES DIVISION
SPO Group Office
Number of Vesselsat 31st December 2018
Anchor Handling Tug Supply Vessels 44Platform Supply Vessels 22Inspection, Maintenance and Repair Vessels 4Seismic Survey Vessels 2Accommodation Barges 2Wind Farm Installation Vessels 2Fast Catamaran 1
MIDDLE EAST
EUROPE
NORTH AMERICA
WEST AFRICA
SOUTH AMERICA
SOUTH & EAST AFRICA
ASIA
PACIFIC
INDIA
RUSSIA
SPO – Global Footprint
56

SPO Group Office
Number of Vesselsat 31st December 2018
Anchor Handling Tug Supply Vessels 44Platform Supply Vessels 22Inspection, Maintenance and Repair Vessels 4Seismic Survey Vessels 2Accommodation Barges 2Wind Farm Installation Vessels 2Fast Catamaran 1
MIDDLE EAST
EUROPE
NORTH AMERICA
WEST AFRICA
SOUTH AMERICA
SOUTH & EAST AFRICA
ASIA
PACIFIC
INDIA
RUSSIA
SPO – Global Footprint
57SWIRE PACIFIC 2018 ANNUAL REPORT

2018 PERFORMANCE REVIEW AND OUTLOOKMARINE SERVICES DIVISION
58
2018 PERFORMANCE
Financial Highlights2018
HK$M2017
HK$M
Swire Pacific Offshore group Revenue 3,019 3,067
Operating (loss)/gain derived from:
Operating activities (915) (779)
Impairment charges (3,872) (1,015)
Gain on disposal of a subsidiary – 3
Total operating loss (4,787) (1,791)
Attributable loss (5,070) (2,255)
HUD group Share of post-tax profits from joint venture companies 37 23
Attributable loss (5,033) (2,232)
Non-recurring items: Impairment charges on vessels and goodwill (3,872) (1,015)
Associated write-off of deferred tax asset (39) –
(3,911) (1,015)
Recurring loss (1,122) (1,217)
Fleet Size2018 2017
Number of vessels operated: Swire Pacific Offshore group 77 77
HUD group 19 19
Total 96 96
SPO’s fleet of specialised vessels is capable of supporting drilling,
exploration, pipe-laying, subsea construction, seabed survey and windfarm installation offshore services.

59SWIRE PACIFIC 2018 ANNUAL REPORT
2018
Anchor Handling Tug Supply Vessels34%Platform Supply Vessels22%Construction and Specialist Vessels44%
09 10 11 12 13 14 15 16 17 1855
60
70
65
95
90
85
80
75
%
SWIRE PACIFIC OFFSHORE GROUP 2018 OFFSHORE EXPLORATION AND PRODUCTION INDUSTRY REVIEWIndustry conditions remain difficult although the market does appear to have bottomed out. Offshore oil and gas spending increased modestly in 2018, which was reflected in higher utilisation. However, the oversupply of offshore support vessels continued to put pressure on charter hire rates.
2018 RESULTS SUMMARYSPO reported an attributable loss of HK$5,070 million in 2018, compared to a loss of HK$2,255 million in 2017. The loss for 2018 included impairment charges in respect of the carrying value of vessels and goodwill, and an associated write-off of deferred tax asset, aggregating HK$3,911 million.
SPO – Average Utilisation Rates
SPO – Charter Hire Revenue by Vessel Class
2017
Anchor Handling Tug Supply Vessels42%Platform Supply Vessels15%Construction and Specialist Vessels43%
Significant impairment charges were made by SPO in 2016 and 2017. These impairment charges reflected reviews of the carrying value of SPO’s fleet, as required by applicable accounting standards. A significant influence on the value of the fleet is the outlook for the offshore industry in which SPO operates. The 2016 and 2017 reviews reflected that outlook at the times when they were made.
A further review of the carrying value of SPO’s fleet was undertaken in 2018. The previous reviews took into account an expectation that a recovery in the oil price would result in increased offshore exploration and therefore increased utilisation of SPO’s fleet and an increase in the charter hire rates which SPO could secure. The oil price has recovered, from a low in 2016 of US$28 per barrel, to its price at the end of February 2019 of US$57 per barrel. There has been a modest increase in offshore exploration and some increase in utilisation of SPO’s core fleet but charter hire rates have not increased. Too many vessels, including some being brought out of cold stack, are competing for the available work.
Against this background, the 2018 review of the carrying value of SPO’s fleet took into account significantly less optimistic assumptions about future charter hire rates than the previous reviews. The expected useful life of the relevant SPO vessels was also reduced, from 25 to 20 years.

2018 PERFORMANCE REVIEW AND OUTLOOKMARINE SERVICES DIVISION
60
Excluding impairment charges (and associated write-offs) in both years, SPO reported an attributable loss of HK$1,159 million in 2018 (compared to a loss of HK$1,240 million in 2017). These results reflect the difficult market conditions in the offshore energy industry.
SPO’s net cash inflow from operating activities was HK$52 million in 2018, compared to HK$389 million in 2017.
Charter Hire
Charter hire revenue decreased by 2% to HK$2,640 million in 2018, principally reflecting reduced charter hire rates.
SPO had a fleet utilisation rate of 69.9% in 2018, an increase (of 7.4 percentage points) from 2017. Average charter hire rates declined by 9% to US$17,200 per day.
Core Fleet (AHTSs and PSVs)
The utilisation rate of SPO’s AHTSs and PSVs increased by 9.8 percentage points to 74.1% in 2018. Charter hire rates for the core fleet decreased by 15%, to US$10,600 per day.
Two AHTSs were in warm stack and one AHTS was in cold stack at 31st December 2018.
Specialist Fleet
The utilisation rate of SPO’s CSVs decreased by 6.5 percentage points, to 44.7% in 2018. Charter hire rates for the CSVs increased by 17%, to US$83,400 per day.
In August 2018, a wind farm installation vessel was involved in an accident in which the box section of the crane boom collapsed onto the bridge. This accident resulted in the vessel being off-hire for the rest of 2018, contributing to the lower utilisation rate of the specialist fleet.
One accommodation barge and one seismic survey vessel were in cold stack at 31st December 2018.
One accommodation barge and one catamaran crew boat were in warm stack at 31st December 2018.
Non-charter Hire
Non-charter hire income was HK$379 million in 2018, a decrease of 1% compared to 2017. Non-charter hire income is mainly derived from consultancy and engineering services provided by subsea vessels.
Operating Costs
Total operating costs in 2018 increased by HK$73 million (or 2%) to HK$3,906 million. This increase principally reflected the cost of chartering a light construction vessel and a provision for claims related to the accident on a wind farm installation vessel referred to above. The increase was offset in part by savings in manning and other costs.
FLEETThe fleet size at 31st December 2018 was 77, the same as at 31st December 2017.
SPO disposed of five older AHTSs in 2018. SPO expects to dispose of more older vessels in 2019.
Four PSVs were delivered to SPO during the year. A two year bareboat charter was entered into for a survey and light construction vessel, with an option to take the vessel for a third year. SPO is expecting to take two more survey and light construction vessels on bareboat charters in 2020 and 2021.
Total capital expenditure on new vessels and other fixed assets in 2018 was HK$1,103 million, compared to HK$818 million in 2017.
At 31st December 2018, SPO had total capital expenditure commitments of HK$473 million (31st December 2017: HK$1,647 million).
SPO – Profile of Capital CommitmentsExpenditure Commitments
2018HK$M
at 31st December 2018HK$M
Anchor Handling Tug Supply Vessels and Platform Supply Vessels 933 268Construction and Specialist Vessels 160 142Other fixed assets 10 63
Total 1,103 473

61SWIRE PACIFIC 2018 ANNUAL REPORT
09 10 11 12 13 14 15 16 17 180
0.05
0.30
0.25
0.20
0.15
0.10
No. of injuries per 100 full-time equivalent employees
SPO LTIR ISOA* LTIR (2018 data not available)
09 10 11 12 13 14 15 16 2017 18 190
100 15
10
5
0
80
60
40
20
21
Number of vessels
Number of vessels
Average age (years)
Average age (years)
SPO – LTIR
SPO – Fleet Size and Average Age of Vessels*
* Including vessels chartered from external parties.
* ISOA – International Support Vessel Owners’ Association
HONGKONG UNITED DOCKYARDS GROUP 2018 INDUSTRY REVIEWThe shipping industry has benefited from a number of alliances and mergers since 2017. But the result is fewer and larger ships visiting Hong Kong. This is putting pressure on towage tariffs.
There were fewer relevant engineering contracts awarded in 2018, but the margins were better.
2018 RESULTS SUMMARYThe attributable profit of the HUD group for 2018 was HK$37 million compared to HK$23 million in 2017.
The salvage and towage division’s profit (before tax and interest and on a 100% basis) was HK$135 million (2017: HK$127 million).
The engineering division recorded a loss (before tax and interest and on a 100% basis) of HK$53 million compared to a loss of HK$69 million in 2017. Fewer non-marine engineering projects were obtained, but margins were better.
The salvage and towage division has 19 vessels, including six container vessels. Two new tugs will replace two old tugs in the first half of 2019.
OUTLOOKThe results of the salvage and towage division are expected to be affected by pressure on towage tariffs.
The engineering division is winning fewer tenders because of increased competition.
Peter Langslow Derrick Chan
OUTLOOKThe number of mobile offshore drilling units is little changed, but higher exploration expenditure and more rig activity are generally expected in 2019. This should increase utilisation of offshore supply vessels in 2019. More vessels were scrapped in 2018, but not nearly enough. Vessels are being brought out of cold stack, increasing the number of vessels chasing the growing but still limited amount of work. Full recovery is unlikely for at least two years.
SPO’s new build programme was completed with the delivery of Pacific Gull in June 2018. SPO disposed of five vessels in 2018. It evaluates its fleet with a view to being well positioned to take advantage of market opportunities. It remains vigilant in its control of costs.

2018 Performance Review and Outlook – T R A D I N G & I N D U S T R I A L D I V I S I O N
Taikoo Motors sells passenger cars, commercial vehicles, motorcycles and scooters.

T R A D I N G & I N D U S T R I A L D I V I S I O NDeveloping Core Businesses
We aim to develop our core businesses.

1814 1715 160
1,000
2,000
3,000
4,000
5,000
6,000
HK$M
1814 1715 16-500
0
500
1,000
1,500
HK$M
1814 1715 160
1,000
2,000
2,500
500
1,500
3,000
HK$M
1814 1715 160
40
30
20
10
60
50
70
80
%
T R A D I N G & I N D U S T R I A L D I V I S I O N
The Trading & Industrial Division has interests in the following companies: Swire Retail group, Taikoo Motors group, Swire Foods group and Swire Environmental Services group.
Profit Attributable to the Company’s Shareholders
Capital Employed
Return on Capital Employed
Net Cash Generated from/ (used in) Operating Activities
O V E R V I E W O F T H E B U S I N E S S

65SWIRE PACIFIC 2018 ANNUAL REPORT
SWIRE RETAIL GROUPSwire Resources retails and distributes footwear, apparel and related accessories. At 31st December 2018, it operated 193 retail outlets in Hong Kong and Macau and eight retail outlets in Mainland China.
TAIKOO MOTORS GROUPTaikoo Motors sells passenger cars, commercial vehicles, motorcycles and scooters. Almost all of Taikoo Motors’ business is in Taiwan, where it sells Volkswagen, Mercedes-Benz and Mazda cars, Volkswagen light commercial vehicles, Volvo trucks and buses, Harley-Davidson motorcycles and Vespa scooters.
SWIRE FOODS GROUPChongqing New Qinyuan Bakery
Qinyuan Bakery is a leading bakery chain in southwest China, with over 650 stores in Chongqing, Guiyang and Chengdu.
Taikoo Sugar
Taikoo Sugar packages and sells sugar in Hong Kong and Mainland China under the Taikoo Sugar brand.
SWIRE ENVIRONMENTAL SERVICES GROUPSwire Waste Management
Swire Waste Management is a 50:50 joint venture with a subsidiary of Waste Management Inc. The joint venture seeks waste management contracts in Hong Kong. It has contracts to provide waste management services to seven outlying islands and to the north west New Territories.
Swire sustainability fund
The Swire sustainability fund has an associate interest in Green Biologics and minority equity interests in NanoSpun Technologies and Avantium. Green Biologics is a biotechnology company which is developing renewable chemical and biofuel technology. NanoSpun Technologies is a company which is developing a water treatment process using nanotechnology. Avantium is a biotechnology company that develops and commercialises bioplastics and chemicals.

2018 PERFORMANCE REVIEW AND OUTLOOKTRADING & INDUSTRIAL DIVISION
66
2018 PERFORMANCE
Financial Highlights2018
HK$M2017
HK$M
Revenue Swire Retail group 3,338 3,074 Taikoo Motors group (TMG) 5,810 5,306 Swire Foods group (SFG) 1,748 1,761 Swire Pacific Cold Storage group 82 105
10,978 10,246Operating profits/(losses) Swire Retail group 69 (69) Taikoo Motors group 155 91 Swire Foods group (30) 65 Swire Pacific Cold Storage group 24 (136) Swire Environmental Services group (24) (9) Others, including central costs 3,061 (22)
3,255 (80)Attributable profits/(losses) Swire Retail group 102 (14) Taikoo Motors group 123 77 Swire Foods group (91) 42 Swire Pacific Cold Storage group (45) (171) Swire Environmental Services group (54) (50) Akzo Nobel Swire Paints 2,894 215 Others, including central costs (25) (30)Attributable profit 2,904 69Non-recurring items Gain/(loss) on disposal of businesses 2,792 (94) Termination cost of Malaysia business of TMG (14) – Impairment provision in respect of sugar refinery business of SFG (38) – 2,740 (94)Recurring profit 164 163
STRATEGY – Strengthening the capability of Taikoo Motors in the import and distribution of motor vehicles, including by selective additions to brands represented.
– Using Taikoo Motors’ existing capability in order to expand into other motor-related businesses.
– Expanding the distribution network of Taikoo Sugar in Mainland China.
– Strengthening Qinyuan Bakery by increasing the range of its products and the number of its stores.
– Increasing the number of waste management contracts awarded to Swire Waste Management.
The strategic objective of the Trading & Industrial Division is (after a period of divestment) to develop its core businesses. The strategies employed in order to achieve this objective are these:
– Strengthening the capability of Swire Resources in branded footwear, apparel and related accessories by expanding the range and quality of those branded goods.
– Opening new stores for key brands sold by Swire Resources in Hong Kong and Macau.

67SWIRE PACIFIC 2018 ANNUAL REPORT
2018 INDUSTRY REVIEWFootwear and apparel business in Hong Kong and Mainland China
Footwear and apparel sales in Hong Kong and Mainland China grew by 10%.
Car sales in Taiwan
Car registrations in Taiwan decreased by 2% to 435,114 units in 2018.
Sugar sales in Mainland China
The volume of sugar sold in Mainland China was little changed at 33,590 million pounds in 2018.
Bakery sales in Mainland China
Retail sales of bakery products sold in Mainland China increased by 9% compared to 2017.
2018 RESULTS SUMMARYAttributable profit from the Trading & Industrial Division in 2018 was HK$2,904 million compared to HK$69 million in 2017. The 2018 results included non-recurring gains of HK$2,792 million on the disposal of the Akzo Nobel paints business and the cold storage business. The 2017 results included a loss of HK$94 million on the disposal of the interest in Rebecca Minkoff. Disregarding these items and other non-recurring items, the Division’s attributable profit in 2018 was HK$164 million, similar
to that in 2017. The result reflected a reduced contribution from Akzo Nobel Swire Paints and losses from Swire Foods, largely offset by better results from Swire Retail and Taikoo Motors and the absence of a loss from the cold storage business in the second half of 2018.
Swire Retail group
The attributable profit of the Swire Retail group in 2018 was HK$102 million, compared to loss of HK$14 million in 2017, an increase of HK$116 million. Disregarding the loss on disposal of Rebecca Minkoff of HK$94 million in 2017, profit increased by HK$22 million. This principally reflected higher profits in Hong Kong and reduced losses in Mainland China. The share of profit of the Columbia associated company decreased.
The revenue of Swire Resources in Hong Kong and Macau was 10% higher than in 2017. Existing and new brands contributed to the increase. Gross margins improved. This reflected less discounting and higher margins on new footwear brands. Occupancy and staff costs increased.
193 retail outlets were operated in Hong Kong and Macau at the end of 2018, 13 more than at the end of 2017. Eight retail outlets were operated in Mainland China at the end of 2018, one more than at the end of 2017.
The 40% interest in the Columbia associated company was disposed of at the beginning of 2019.

2018 PERFORMANCE REVIEW AND OUTLOOKTRADING & INDUSTRIAL DIVISION
68
Taikoo Motors group
The attributable profit of the Taikoo Motors group increased to HK$123 million in 2018 from HK$77 million in 2017. The 2018 results included HK$14 million termination costs from the closure of loss making businesses in Malaysia.
19,250 cars, commercial vehicles and motorcycles were sold in 2018, 4% more than in 2017. 96% of these units were sold in Taiwan. The gross profit margin was in line with that in 2017. Operating costs as a percentage of revenue were lower than in 2017.
Swire Foods group
Swire Foods reported an attributable loss of HK$91 million in 2018, compared with an attributable profit of HK$42 million in 2017.
Qinyuan Bakery recorded an attributable loss of HK$66 million in 2018, compared with an attributable profit of HK$33 million in 2017. The 2018 results included store and other business rationalisation costs of HK$69 million.
The revenue and gross profit of Qinyuan Bakery increased by 8% and 9% respectively in 2018 compared with 2017. This reflected growth in sales per store. Operating costs increased, reflecting higher staff and rental costs. Qinyuan Bakery operated 651 stores at the end of 2018, similar to the number at the end of 2017.
Volumes of sugar sold rose by 4% and 13% in Hong Kong and Mainland China respectively. Margins improved because of more sales and lower sugar costs.
The share of the loss at the 34% owned sugar refinery business in Guangdong was HK$52 million in 2018. This included an impairment provision of HK$38 million arising from the suspension of refinery operations to prevent further operating losses.
Swire Environmental Services group
Swire Environmental Services reported an attributable loss of HK$54 million in 2018, compared with an attributable loss of HK$50 million in 2017.
Go Wild sells outdoor travel
branded goods.

69SWIRE PACIFIC 2018 ANNUAL REPORT
OUTLOOKThe retail market for footwear and apparel in Hong Kong is expected to be highly competitive in 2019. Slower economic growth in Mainland China and global trade uncertainties make the 2019 outlook for Swire Resources uncertain. Higher staff and occupancy costs are expected to put pressure on profit margins.
Taikoo Motors will spend more on developing motor related businesses.
Qinyuan Bakery is opening new stores in Chongqing, Chengdu and Guiyang and is upgrading its existing stores. The range and quality of its products are improving. Its supply chain is becoming more agile and efficient.
Taikoo Sugar is expanding its distribution network in Mainland China and is improving its supply chain capability.
The overall recurring profits of the Trading & Industrial Division are expected to increase in 2019.
David Cogman / Ivan Chu

70
Financial Review
Recurring underlying profit is provided below to show the effect of significant non-recurring items.2018
HK$M 2017
HK$M
Underlying profit attributable to the Company's shareholders 8,523 4,742
Significant non-recurring items:
Profit on sale of interests in investment properties (2,155) (12)
Profit on acquisition/sale of businesses in HAECO group (35) –
(Profit)/loss on sale of businesses in Trading & Industrial Division (2,792) 94
Profit on sale of property, plant and equipment and other investments (105) (294)
Gain by Swire Beverages from territory and business changes in Mainland China and the USA (132) (1,511)
Impairment of property, plant and equipment and intangible assets and write-off of deferred tax assets 4,185 1,743
Recurring underlying profit* 7,489 4,762
* A more detailed definition is provided in the Glossary on page 234.
Commentary on and Analysis of Major Balances and Year on Year Variances in the Financial Statements
Consolidated Statement of Profit or LossNotes to the
FinancialStatements
2018HK$M
2017HK$M
Increase/(Decrease)
HK$M %
Revenue 4 84,606 80,289 4,317 5%
Cost of sales 6 (53,739) (51,991) 1,748 3%
Expenses 6 (20,815) (18,010) 2,805 16%
Other net gains 5 1,458 245 1,213 495%
Change in fair value of investment properties 19,378 25,331 (5,953) -24%
Operating profit 30,888 35,864 (4,976) -14%
Net finance charges 9 (2,324) (2,239) 85 4%
Share of profits less losses of joint venture companies 19(a) 2,458 2,209 249 11%
Share of profits less losses of associated companies 19(b) 1,324 (328) 1,652 N/A
Taxation 10 (2,926) (3,124) (198) -6%
Profit for the year 29,420 32,382 (2,962) -9%
Profit attributable to the Company's shareholders 34 23,629 26,070 (2,441) -9%
Underlying profit attributable to the Company’s shareholders 11 8,523 4,742 3,781 80%
Audited Financial Information
Underlying profit Note2018
HK$M 2017
HK$M
Profit attributable to the Company's shareholders 23,629 26,070
Adjustments in respect of investment properties:
Revaluation of investment properties (a) (20,722) (26,714)
Deferred tax on investment properties (b) 935 573
Valuation gains realised on sale of interests in investment properties (c) 1,351 50
Depreciation of investment properties occupied by the Group (d) 28 28
Non-controlling interests' share of adjustments 3,302 4,735
Underlying profit attributable to the Company's shareholders 8,523 4,742
Notes: (a) This represents the net revaluation movements as shown in the consolidated statement of profit or loss plus the Group’s share of net revaluation movements of joint venture companies. (b) This represents deferred tax movements on the Group’s investment properties and the Group’s share of deferred tax movements on investment properties held by joint venture companies. These
comprise deferred tax on revaluation movements on investment properties in Mainland China and the USA, and deferred tax provisions made in respect of investment properties held for the long-term where it is considered that the liability will not reverse for some considerable time.
(c) Prior to the implementation of HKAS 40, changes in the fair value of investment properties were recorded in the revaluation reserve rather than the consolidated statement of profit or loss. On sale, the revaluation gains were transferred from the revaluation reserve to the consolidated statement of profit or loss.
(d) Prior to the implementation of HKAS 40, no depreciation was charged on investment properties occupied by the Group.
Additional information is provided below to reconcile reported and underlying profit attributable to the Company’s shareholders. The reconciling items principally adjust for net revaluation movements on investment properties and the associated deferred tax in Mainland China and the USA, and for other deferred tax provisions in relation to investment properties.

SWIRE PACIFIC 2018 ANNUAL REPORT 71
Revenue
The increase in revenue of HK$4,317 million compared to 2017 reflected higher revenue from the Beverages Division (HK$7,123 million), the Trading & Industrial Division (HK$733 million) and the Aviation Division (HK$346 million). These improvements were partially offset by decreases in revenue from the Property Division (HK$3,839 million) and the Marine Services Division (HK$48 million).
In the Property Division, revenue from property trading decreased by HK$4,772 million compared to 2017. The property trading revenue in 2018 represented the proceeds of sales of 12 WHITESANDS houses and a number of carparks at AZURA in Hong Kong and from two Reach units and 35 Rise units at Brickell City Centre development in the USA. The property trading revenue in 2017 represented the proceeds of sales of 197 ALASSIO units and 14 WHITESANDS houses in Hong Kong and from 40 Reach and Rise units in the USA. Gross rental income from property investment increased by HK$864 million in 2018. In Hong Kong, gross rental income increased slightly, principally reflecting positive rental reversions in the office portfolio, the opening of One Taikoo Place in the last quarter of 2018 and higher retail rents. In Mainland China, there was higher rental income, reflecting higher retail rents. In the USA, there was higher rental income because more shops were open at the shopping centre at Brickell City Centre. Revenue from hotels increased by HK$60 million in 2018, largely due to improved
2018
Gross rental income from investment properties 12,002 Property trading 1,061Hotels 1,404
Sales of goods 52,878Charter hire 2,640Rendering of other services 1,490
Aircraft and engine maintenance services 13,131
HK$M
2017
Gross rental income from investment properties 11,138 Property trading 5,833Hotels 1,344
Sales of goods 45,008Charter hire 2,684Rendering of other services 1,390
Aircraft and engine maintenance services 12,892
HK$M
Revenue by Category
occupancy at the Mandarin Oriental, Guangzhou and better performances at EAST, Miami and at the hotels in Hong Kong.
In the Aviation Division, the increase in revenue from the HAECO group was principally due to increases in line services revenue at HAECO Hong Kong, airframe services revenue at HAECO Xiamen and landing gear and composite revenue, partially offset by the effect of changes in work scope and material usage at TEXL.
In the Beverages Division, the increase in revenue was principally due to increased sales volumes in all areas, but particularly in Mainland China and the USA. The increase reflected the inclusion of a full year’s revenue from franchise territories acquired in 2017 in Mainland China and the USA and increased revenue in existing territories in Mainland China. Revenue was slightly higher in Hong Kong and much higher in Taiwan, reflecting in each case higher sales volume, improved product mix and price increases.
In the Marine Services Division, the decrease in revenue at SPO was principally due to lower charter hire rates for the core fleet and lower utilisation of the construction and specialist vessels.
In the Trading & Industrial Division, there were increases in revenue at Taikoo Motors and Swire Retail, partly offset by a decrease in revenue at Swire Pacific Cold Storage following its sale in July 2018.

FINANCIAL REVIEW72
trading decreased by HK$1,332 million, principally reflecting the absence in 2018 of profit on sales at the ALASSIO development in Hong Kong. The operating loss from hotels decreased by HK$77 million, principally due to better performances at EAST, Miami in the USA and at the hotels in Hong Kong.
In the Aviation Division, the HAECO group’s 2017 operating loss included non-recurring impairment charges aggregating HK$632 million. Disregarding these non-recurring items, the HAECO group recorded an improved operating profit in 2018. This reflected a higher profit at HAECO Hong Kong and HAECO Xiamen and a reduced loss at HAECO Americas.
In the Beverages Division, the 2018 operating profit included the following non-recurring items (pre-tax basis): (a) a HK$148 million gain arising from the disposal of Kaohsiung plant in Taiwan and (b) a HK$107 million gain arising from production and distribution assets acquired in the USA in 2017. Disregarding these non-recurring gains (which aggregated HK$255 million) and non-recurring gains aggregating HK$1,607 million in 2017 (mainly arising from the acquisition of franchise territories in Mainland China and the USA and from changes in franchise terms in the USA), the 2018 operating profits of the Beverages Division increased. Profits were higher in Mainland China and the USA. This reflected the inclusion of a full year of sales from franchise territories acquired in 2017 and a better product and packaging mix in Mainland China, partially offset by higher raw material and operating costs.
In the Marine Services Division, the increased operating loss at SPO principally reflected a higher impairment charge (HK$3,872 million compared with HK$1,015 million in 2017) in respect of vessels and associated goodwill. Disregarding impairment charges and the impact of vessel disposals in both years, operating losses of SPO increased from HK$760 million in 2017 to HK$912 million in 2018. This principally reflected lower charter hire rates for the core fleet and a reduction in utilisation of construction and specialist vessels.
In the Trading & Industrial Division, the 2018 operating profit included the non-recurring gains on disposals of Akzo Nobel Swire Paints and Swire Pacific Cold Storage. Disregarding these non-recurring gains (which aggregated HK$3,173 million) and the non-recurring loss in 2017 of HK$94 million on disposal of Swire Retail’s interest in Rebecca Minkoff, the Division reported an operating gain of HK$82 million in 2018 compared to an operating gain of HK$14 million in 2017. There were higher operating profits at Taikoo Motors and Swire Retail. There was no operating loss at Swire Pacific Cold Storage for the remainder of the year following its disposal in July 2018. Swire Foods moved from profits to losses.
9,458
25,331
3,325
(235)(80)(1,791)(144)
9,901
19,378
2,289
(234)
3,255
(4,787)
1,086
2018 2017-4,000
0
40,000
20,00024,00028,00032,00036,000
16,000
8,00012,000
4,000
HK$M
Property – exclude revaluationgains
Marine Services
Aviation
Trading & Industrial
Beverages
Head Office
Net valuation gains on investment properties
Operating Profit
Operating Profit/(Loss) by Division
The operating profits in 2018 and 2017 included net valuation gains on investment properties of HK$19,378 million and HK$25,331 million, respectively. The net revaluation gains on investment properties in 2018 principally reflected an increase in the valuation of the office properties in Hong Kong following rental increases and a reduction of 12.5 basis points in the capitalisation rate applicable to office properties in Hong Kong. Investment properties in Mainland China recorded a valuation gain due to higher rents at Taikoo Hui and Taikoo Li Sanlitun and a reduction of 25 basis points in the capitalisation rate applicable to Taikoo Li Sanlitun North and Taikoo Hui offices. Investment properties in the USA recorded a revaluation loss in respect of the retail properties at Brickell City Centre in Miami, USA due to an increase in the discount rate applicable to the retail portfolio. Excluding net revaluation gains, operating profit increased by HK$977 million. This reflected a movement from operating loss to operating profit in the Aviation Division and increases in operating profit in the Property and Trading & Industrial Divisions, partially offset by lower operating profit in the Beverages Division and higher vessel impairments in the Marine Services Division.
The Property Division’s operating profit (excluding net valuation gains) increased by HK$443 million. Profit from property investment increased by HK$1,698 million. This reflected a profit on the sale of investment properties of HK$1,277 million and higher rental income in Hong Kong and from the retail properties in Mainland China and the USA. Profit from property

SWIRE PACIFIC 2018 ANNUAL REPORT 73
In the Property Division, profits from the three associate hotels at Pacific Place in Hong Kong increased marginally.
In the Beverages Division, there was an increase in the contribution from Coca-Cola Bottlers Manufacturing Holdings Limited in Mainland China. This was principally due to higher sales volume and savings in manufacturing overheads and interest expenses.
Taxation
The decrease in taxation mainly reflected the absence of 2017’s HK$249 million write-off of net deferred tax assets at HAECO Americas.
Profit and Underlying Profit Attributable to the Company’s Shareholders
Net Finance Charges
The increase in net finance charges mainly reflected the cessation of interest capitalisation in respect of an office building in Kowloon Bay which was completed at the end of 2017. This was partially offset by a decrease in the amount of borrowings in Hong Kong and Mainland China and fair value gains (instead of 2017’s fair value losses) on put options in respect of non-controlling interests in subsidiary companies.
Share of Profits Less Losses of Joint Venture Companies
In the Property Division, the increase of HK$179 million principally reflected a higher operating profit from HKRI Taikoo Hui (which enjoyed its first full year of rental income in 2018) and Sino-Ocean Taikoo Li (where retail sales were higher and a profit was made on the sale of offices at Pinnacle One) in Mainland China, partially offset by lower net revaluation gains of HK$138 million. The increased hotel losses in 2018 reflected pre-opening expenses at the two new hotels at HKRI Taikoo Hui.
In the Aviation Division, profits from joint venture companies in the HAECO group increased by HK$137 million, principally reflecting an increase in engine volume and a heavier work mix at HAESL.
In the Beverages Division, the increase in profits from joint venture companies in 2018 arose from a full year’s contribution from a joint venture company in Shanghai which was acquired in July 2017.
In the Trading & Industrial Division, the contribution from Akzo Nobel Swire Paints decreased by HK$73 million. This reflected lower sales volume and higher material costs in Mainland China and an unfavourable product mix. The increased share of loss at Swire Foods mainly reflected a HK$38 million impairment provision in respect of the termination of sugar refinery operations.
Share of Profits Less Losses of Associated Companies
The Cathay Pacific group contributed a profit of HK$1,056 million in 2018 compared to a loss of HK$567 million in 2017. The operating environment for Cathay Pacific was little changed in 2018. Overcapacity in passenger markets resulted in intense competition with other airlines. Fuel prices increased. The strength of the US dollar adversely affected net income. But the passenger business improved. Capacity increased. Load factors were sustained. Yield improved despite competitive pressures. The cargo business was strong. Capacity, yield and load factors increased.
The decrease in profit attributable to the Company’s shareholders reflects a reduction in net revaluation gains on investment properties from HK$21,328 million in 2017 to HK$15,106 million in 2018. Excluding net investment property adjustments, underlying profit increased by HK$3,781 million. The increase principally reflected better results from the Property, Aviation and Trading & Industrial Divisions. This was partially offset by lower profit from the Beverages Division and a higher impairment charge at SPO.
8,523
15,106
4,742
21,328
2018 20170
30,000
15,000
20,000
25,000
10,000
5,000
Net propertyvaluation adjustments
Underlying profit
HK$M

FINANCIAL REVIEW74
Property, plant and equipment 9%Investment properties 62%Intangible assets 3%
Associated companies 7%Other non-current assets 1%Current assets 10%
Joint venture companies 8%
Total Assets by Category Total Assets by Division
Property 77%Aviation 12%Beverages 7%Marine Services 3%Trading & Industrial 1%Head Office 0%
Total Assets
Consolidated Statement of Financial PositionNotes to the
FinancialStatements
2018HK$M
2017HK$M
Increase/(Decrease)
HK$M %
Property, plant and equipment 14 39,644 45,619 (5,975) -13%
Investment properties 15 271,515 265,944 5,571 2%
Intangible assets 17 12,918 13,486 (568) -4%
Joint venture companies 19(a) 34,340 29,449 4,891 17%
Associated companies 19(b) 31,700 30,404 1,296 4%
Properties under development and for sale 23 1,469 2,300 (831) -36%
Stocks and work in progress 24 5,242 6,229 (987) -16%
Trade and other receivables 25 10,012 11,029 (1,017) -9%
Bank balances and short-term deposits 26 9,112 6,072 3,040 50%
Assets classified as held for sale 27 15,526 – 15,526 100%
Other current assets 32 – 6,262 (6,262) -100%
Other assets 4,927 4,305 622 14%
Total Assets 436,405 421,099 15,306 4%
Trade and other payables 28 26,781 24,782 1,999 8%
Loans and bonds 29 71,779 78,586 (6,807) -9%
Deferred tax liabilities 30 10,034 9,881 153 2%
Liabilities classified as held for sale 27 207 – 207 100%
Other liabilities 2,489 1,756 733 42%
Total Liabilities 111,290 115,005 (3,715) -3%
Net Assets 325,115 306,094 19,021 6%
Equity attributable to the Company's shareholders 33, 34 270,424 253,163 17,261 7%
Non-controlling interests 35 54,691 52,931 1,760 3%
Total Equity 325,115 306,094 19,021 6%

SWIRE PACIFIC 2018 ANNUAL REPORT 75
Property, Plant and Equipment
The decrease in property, plant and equipment principally reflected an impairment charge at SPO and the disposal of subsidiary companies (which included Swire Pacific Cold Storage), partly offset by capital expenditure (net of depreciation).
Investment Properties
The increase in investment properties principally reflected net revaluation gains, construction costs incurred on new investment properties and renovation costs incurred on existing investment properties. The increase also reflected transfers from properties under development and for sale and the reclassification of some previously owner-occupied properties from property, plant and equipment to investment properties. The increases were partly offset by foreign exchange translation losses on investment properties in Mainland China, the transfer out of investment properties on disposal of property holding subsidiary companies and the transfer of the Cityplaza Three and Four office buildings to assets classified as held for sale.
Intangible Assets
The decrease in intangible assets in 2018 includes an impairment charge in respect of goodwill at SPO (HK$86 million) and net negative adjustments in respect of the recognition of beverages goodwill and franchise rights in the USA during 2017 (HK$265 million).
Joint Venture Companies and Loans Due from Joint Venture Companies
The increase principally reflected (a) equity funding of joint venture projects in Mainland China and (b) debt funding of joint venture property projects in Hong Kong and Mainland China. There were also increases in retained profits in the Property Division (principally as a result of valuation gains on investment properties held by joint venture companies), and at HAESL. Major additions during 2018 were the acquisition of a 50% equity interest in Taikoo Li Qiantan in Shanghai, Mainland China (HK$1,670 million) and further loans advanced (including reclassification adjustments) to a 50% owned company which is undertaking a property development project in Hong Kong (HK$2,792 million). These increases were partly offset by dividends paid, foreign exchange translation losses from joint venture companies in Mainland China, disposal of the interest in Akzo Nobel Swire Paints and the consolidation of what was previously a joint venture company in the HAECO group as a subsidiary company following the acquisition of an additional 31.5% interest in the company.
Associated Companies and Loans Due from Associated Companies
The increase principally reflected an increase in the share of net assets of the Cathay Pacific group. The increase in net assets of the Cathay Pacific group principally reflects retained profit during the year and a reduction in unrealised losses from fuel hedging contracts in the cash flow hedge reserve.
Properties Under Development and for Sale
The decrease in properties under development and for sale principally reflected sales of houses at the WHITESANDS development and carparks at the AZURA development in Hong Kong and of units at the Reach and Rise developments at Brickell City Centre in the USA.
Stocks and Work in Progress
The decrease in stocks and work in progress was principally due to the reallocation of work in progress at HAECO group to contract assets as defined in HKFRS 15 “Revenue from Contracts with Customers”, which was effective from 1st January 2018.
Trade and Other Receivables
The decrease in trade and other receivables is mainly due to settlement of trade debtors related to the WHITESANDS development.
Assets Classified as Held for Sale
Assets classified as held for sale mainly comprised interests in properties which were conditionally agreed to be sold to a third party in June 2018.
Other Current Assets
The decrease reflected completion of the sale of the subsidiary owning the Kowloon Bay development in June 2018.
Trade and Other Payables
The increase in trade and other payables principally reflected a HK$421 million increase in accrued capital expenditure and a HK$1,932 million increase in the deposits received in respect of the sale of subsidiary companies.

FINANCIAL REVIEW76
Consolidated Statement of Cash FlowsNotes to the
Financial Statements
2018HK$M
2017HK$M
Increase/(Decrease)
HK$M
Cash generated from operations 42(a) 18,328 19,605 (1,277)Net interest paid (2,428) (2,390) 38Tax paid (2,180) (2,172) 8Dividends received 1,716 557 1,159Investing activities Purchase of property, plant and equipment 42(b) (4,103) (3,777) 326 Additions of investment properties (3,917) (5,179) (1,262) Additions of other current assets (88) (623) (535) Additions of assets classified as held for sale (364) – 364 Proceeds from disposals of property, plant and equipment 450 263 187 Proceeds from disposals of investment properties 350 40 310 Proceeds from disposals of subsidiary companies, net of cash disposed of 42(d) 9,584 614 8,970 Proceeds from disposals of joint venture companies 3,594 – 3,594 Proceeds from disposals of available-for-sale assets – 71 (71) Purchase of shares in new subsidiary companies (14) (4,163) (4,149) Purchase of shares in joint venture companies (1,670) (1,046) 624 Purchase of new businesses – (2,347) (2,347) Adjustment for previous year's purchase of new businesses 187 – (187) Purchase of equity investments at fair value through other comprehensive income (4) – 4 Purchase of available-for-sale assets – (11) (11) Net loans to joint venture companies (1,272) (1,407) (135) Others (250) (184) 66
Net cash generated from/(used in) businesses and investments 17,919 (2,149) 20,068
Dividends paid 34, 42(c) (4,582) (4,335) 247Loans drawn and refinancing 10,624 20,312 (9,688)Repayment of loans and bonds (17,571) (13,049) 4,522Repurchase of the Company's shares 33 (21) (153) (132)Purchase of shares in existing subsidiary companies (3,018) (1,384) 1,634
Cash paid to shareholders and net funding by external debt (14,568) 1,391 15,959
Increase/(decrease) in cash and cash equivalents 3,351 (758) (4,109)
Bank Balances and Short-Term Deposits/ Loans and Bonds
The decrease in net borrowings reflected the proceeds received from sale of the Group’s interests in Akzo Nobel Swire Paints, Swire Pacific Cold Storage, a development in Kowloon Bay and other properties in Hong Kong. These proceeds exceeded the funds used to finance the Group’s property developments and the purchase of new vessels and other fixed assets and investments.
Deferred Tax Liabilities
The increase in deferred tax liabilities was principally attributable to higher deferred tax relating to depreciation allowances on investment properties and on revaluation gains on investment properties held by the Group in Mainland China and the USA.
Equity Attributable to the Company’s Shareholders
In each year, the movement in equity attributable to the Company’s shareholders mainly represents the total comprehensive income for the year attributable to the Company’s shareholders (HK$20,973 million in 2018) less dividends paid to shareholders (HK$3,454 million in 2018). In 2018, the movement in equity attributable to the Company’s shareholders also reflected a charge of HK$580 million relating to the privatisation of HAECO.
Non-controlling Interests
The non-controlling interests principally reflect the 18% non-controlling interest in Swire Properties. The 25% non-controlling interest in HAECO was acquired by the Company on HAECO’s privatisation.

SWIRE PACIFIC 2018 ANNUAL REPORT 77
3,764
58
11,994
2,228
(201)
485
4,194
535
13,586
1,092
(69)
267
2018 20170
20,000
15,000
10,000
5,000
Property
Marine Services
Aviation
Trading & Industrial
Beverages
Head Office
HK$M
Cash Generated from/(used in) Operations by Division
Dividends Received
Dividends received in 2018 principally comprised dividends from HAESL, Akzo Nobel Swire Paints and Columbia Sportswear Commercial (Shanghai) and from the Property Division’s associated hotel companies and joint venture investment property companies in Hong Kong.
Purchase of Property, Plant and Equipment
Purchase of property, plant and equipment in 2018 principally reflected the purchase of new production and marketing equipment in the Beverages Division, the construction of a new hangar at HAECO Americas and the acquisition of new vessels by SPO.
Additions of Investment Properties
The additions of investment properties in 2018 principally reflected capital expenditure on the Taikoo Place office redevelopment and other projects in Hong Kong, the USA and Singapore.
Additions of Other Current Assets/ Assets Classified as Held for Sale
The additions represented additional capital expenditure on assets classified as held for sale since reclassification during 2018 and development costs incurred on a property in Kowloon Bay, Hong Kong, the sale of the subsidiary owning which was completed in June 2018.
Proceeds from Disposals of Property, Plant and Equipment
The proceeds from disposals of property, plant and equipment included proceeds from the disposal of five vessels by SPO and of other fixed assets elsewhere in the Group.
Proceeds from Disposals of Subsidiary Companies
The proceeds from disposals of subsidiary companies principally comprised the proceeds received from the disposal of the subsidiary owning Swire Pacific Cold Storage and of property-owning subsidiary companies in the Property Division.
Proceeds from Disposals of Joint Venture Companies
In 2018, the proceeds of HK$3,594 million (net of transaction costs) represented the sale of interests in joint venture companies in the Trading & Industrial Division.
Purchase of Shares in Joint Venture Companies
In 2018, the Property Division acquired a 50% interest in the company which is undertaking the Taikoo Li Qiantan retail development in Shanghai, Mainland China.
Net Loans to Joint Venture Companies
Loans to joint venture companies in 2018 principally reflected funding made available to joint venture property projects in Hong Kong and Mainland China. HK$1,005 million was lent to a 50% owned joint venture company in order to fund a property development in Hong Kong.
Loans Drawn and Refinancing
In 2018, loans drawn and refinancing comprised new financing under the Group’s medium term note programmes and new loans and drawdowns of existing financing from banks.
Purchase of Shares in Existing Subsidiary Companies
The 25% non-controlling interest in HAECO was acquired by the Company on HAECO’s privatisation.
Cash Generated from Operations

FINANCIAL REVIEW78
Investment Appraisal and Performance Review Capital employed Capital commitments*
2018HK$M
2017HK$M
2018HK$M
2017HK$M
Property investment 299,126 282,662 17,407 13,940
Property trading 4,143 3,942 – –
Hotels 7,394 7,738 215 260
Property – overall 310,663 294,342 17,622 14,200
Aviation 45,449 44,798 622 954
Beverages 16,657 17,274 931 767
Marine Services 13,014 16,755 543 1,731
Trading & Industrial 2,252 5,631 71 141
Head Office (253) (192) – –
Total capital employed 387,782 378,608 19,789 17,793
Less: net debt (62,667) (72,514)
Less: non-controlling interests (54,691) (52,931)
Equity attributable to the Company's shareholders 270,424 253,163
Equity attributable to the Company’s shareholders Return on equity
2018HK$M
2017HK$M
2018 2017
Property investment 221,214 203,630 11.0% 14.1%
Property trading 2,141 1,519 4.4% 56.8%
Hotels 5,213 5,531 -0.6% -0.6%
Property – overall 228,568 210,680 10.7% 14.0%
Aviation 42,326 38,187 4.4% -2.7%
Beverages 11,976 11,337 14.0% 30.7%
Marine Services 8,681 8,350 -59.1% -24.1%
Trading & Industrial 3,210 5,738 64.9% 1.2%
Head Office (24,337) (21,129)
Total 270,424 253,163 9.0% 10.9%
* The capital commitments represent the Group’s capital commitments plus the Group’s share of the capital commitments of joint venture companies.

SWIRE PACIFIC 2018 ANNUAL REPORT 79
Financing
Capital Structure
The Group aims to maintain a capital structure that is appropriate for long-term credit ratings of A1 to A3 on Moody’s scale, A+ to A- on Standard & Poor’s scale and A+ to A- on Fitch’s scale. Actual credit ratings may depart from these levels from time to time due to macro-economic or other circumstances. At 31st December 2018 the Company’s long-term credit ratings were A3 from Moody’s, A- from Standard & Poor’s and A- from Fitch, and Swire Properties’ long-term credit ratings were A2 from Moody’s and A from Fitch.
Changes in Financing
Analysis of Changes in Financing during the Year
Audited Financial Information
At 31st December 2018, committed loan facilities and debt securities amounted to HK$97,520 million, of which HK$25,676 million (26%) were undrawn. In addition, the Group had undrawn uncommitted facilities totalling HK$8,450 million. Sources of funds at 31st December 2018 comprised:
AvailableHK$M
DrawnHK$M
Undrawnexpiring within
one yearHK$M
Undrawnexpiring beyond
one yearHK$M
Committed facilities
Loans and bonds
Fixed/floating rate bonds 49,435 49,435 – –
Bank loans, overdrafts and other loans 48,085 22,409 2,648 23,028
Total committed facilities 97,520 71,844 2,648 23,028
Uncommitted facilities
Bank loans, overdrafts and other loans 8,707 257 8,450 –
Total 106,227 72,101 11,098 23,028
Note: The figures above are stated before unamortised loan fees of HK$322 million.
Sources of Finance
Audited Financial Information
Loans and bonds
Total 2018
HK$M 2017
HK$M
due within one year
HK$M
due after one year
HK$M
Loans, bonds and perpetual capital securities
At 1st January 9,412 69,174 78,586 70,570
Loans drawn and refinancing 4,387 6,237 10,624 20,312
Repayment of loans and bonds (11,426) (6,145) (17,571) (13,049)
Change in composition of Group 45 – 45 –
Reclassification 9,123 (9,123) – –
Currency adjustment (38) 9 (29) 629
Other non-cash movements 25 99 124 124
At 31st December 11,528 60,251 71,779 78,586

FINANCING80
Audited Financial Information
For accounting purposes, the loans and bonds are classified as follows:
2018 2017
Drawn, before
unamortised loan fees
HK$M
Unamortised loan fees
HK$M
Carrying value HK$M
Drawn, before
unamortised loan fees
HK$M
Unamortisedloan fees
HK$M
Carrying value
HK$M
Short-term loans – unsecured 3,227 – 3,227 671 – 671
Long-term loans and bonds at amortised cost – unsecured 68,874 (322) 68,552 78,332 (417) 77,915
Less: amount due within one year included under current liabilities (8,310) 9 (8,301) (8,747) 6 (8,741)
60,564 (313) 60,251 69,585 (411) 69,174
The maturity of long-term loans and bonds is as follows:
2018HK$M
2017HK$M
Bank loans (unsecured)
Repayable within one year 4,086 3,539
Repayable between one and two years 5,844 5,313
Repayable between two and five years 9,345 18,555
Repayable after five years 3 3
Other borrowings (unsecured)
Repayable within one year 4,215 5,202
Repayable between one and two years 3,911 4,203
Repayable between two and five years 19,715 15,858
Repayable after five years 21,433 25,242
68,552 77,915
Amount due within one year included under current liabilities (8,301) (8,741)
60,251 69,174
i) Loans and Bonds

SWIRE PACIFIC 2018 ANNUAL REPORT 81
2019 2020 2021 2022 2023 2024 2025–2027
2028–2030
0
25,000
20,000
15,000
10,000
5,000
HK$M
Bonds Loans
Total Available Committed Facilities by Maturity (at 31st December 2018)
ii) Bank Balances and Short-Term Deposits
The Group had bank balances and short-term deposits of HK$9,112 million at 31st December 2018 compared to HK$6,072 million at 31st December 2017.
Maturity Profile and Refinancing
Bank loans and other borrowings are repayable on various dates up to 2030 for the year ended 2018 and 2017.
The weighted average term and cost of the Group’s debt is:
2018 2017
Weighted average term of debt 3.5 years 3.9 years
Weighted average cost of debt 3.5% 3.5%
(The weighted average cost of debt is stated on a gross debt basis. It was stated on a net debt basis in prior years.)
The maturity profile of the Group’s available committed facilities is set out below:

FINANCING82
Audited Financial Information
At 31st December 2018, 74% of the Group’s gross borrowings were on a fixed rate basis and 26% were on a floating rate basis (2017: 71% and 29%).
The exposure of the Group’s loans and bonds to interest rate changes (after interest rate swaps) can be illustrated as follows:
Fixed interest rate maturing in:
Floatinginterest rate
HK$M
1 yearor lessHK$M
1 to 5yearsHK$M
Over 5yearsHK$M
TotalHK$M
At 31st December 2018 18,638 4,527 27,178 21,436 71,779
At 31st December 2017 22,701 5,986 24,653 25,246 78,586
Finance Charges
Audited Financial Information
2018 2017
HK$M HK$M
Currency
Hong Kong dollar 49,653 69% 55,025 70%
United States dollar 20,566 29% 20,640 26%
Renminbi 1,079 1% 2,480 3%
Others 481 1% 441 1%
Total 71,779 100% 78,586 100%
Currency Profile
An analysis of the carrying amounts of gross borrowings by currency (after cross-currency swaps) is shown below:

SWIRE PACIFIC 2018 ANNUAL REPORT 83
Audited Financial Information
Interest charged and earned during the year was as follows:
2018HK$M
2017HK$M
Interest charged
Bank loans and overdrafts 639 520
Other loans, bonds and perpetual capital securities 1,970 2,041
Fair value (gain)/loss on derivative instruments
Interest rate swaps: cash flow hedges, transferred from other comprehensive income (77) (74)
Interest rate swaps not qualifying as hedges 2 (1)
Amortised loan fees – loans at amortised cost 124 114
2,658 2,600
Fair value (gain)/loss on put options over non-controlling interests in subsidiary companies (23) 34
Fair value loss on put options over other partners' interests in a joint venture company 15 30
Other financing costs 145 124
Capitalised on
Investment properties (265) (212)
Properties under development and for sale (2) –
Hotel and other properties and equipment – (167)
Vessels (3) (10)
2,525 2,399
Less: interest income
Short-term deposits and bank balances 115 70
Other loans 86 90
201 160
Net finance charges 2,324 2,239
The capitalised interest charges on funds borrowed for the development of investment properties, properties under development and for sale, hotel and other properties and vessels were between 2.10% and 3.90% per annum (2017: 1.40% and 4.00% per annum).
The amount transferred from other comprehensive income in respect of cash flow hedges in 2018 included HK$2 million relating to currency basis.
The total interest charged on borrowings held at amortised cost (after interest rate swaps) was HK$2,658 million (2017: HK$2,600 million).
The interest rates per annum, before swaps, at the year-end date were as follows:
2018 2017
HK$ %
US$ %
RMB %
Others %
HK$ %
US$ %
RMB %
Others %
Short-term loans 2.35-2.75 – 4.35 0.80-2.45 1.77 3.40 4.13-4.35 0.83-1.81
Long-term loans and bonds 1.80-4.00 1.94-5.50 3.90-4.41 2.41 1.29-5.05 2.03-6.25 3.90-4.41 1.72-1.98

FINANCING84
Capital Management
Audited Financial Information
The Group’s primary objectives when managing capital are to safeguard the Group’s ability to operate as a going concern, so that it can continue to provide returns for shareholders, and to secure access to finance at a reasonable cost.
The Group considers a number of factors in monitoring its capital structure, principally the gearing ratio, cash interest cover and the return cycle of its investments. For the purpose of the gearing ratio, the Group defines net debt as total borrowings (comprising borrowings net of security deposits plus perpetual capital securities issued by the Group) less short-term deposits and bank balances and certain available-for-sale investments. Capital comprises total equity, as shown in the consolidated statement of financial position.
In order to maintain or adjust the gearing ratio, the Group may adjust the amount of dividends paid to shareholders, repurchase shares, raise new debt financing or sell assets to reduce debt. The gearing ratios at 31st December 2018 and 31st December 2017 were as follows:
2018HK$M
2017HK$M
Total borrowings 71,779 78,586
Less: Short-term deposits, bank balances and certain available-for-sale investments (9,112) (6,072)
Net debt 62,667 72,514
Total equity 325,115 306,094
Gearing ratio 19.3% 23.7%
Interest cover – times 13.3 16.0
Cash interest cover – times 11.9 13.6
Underlying cash interest cover – times 5.0 4.0
Return on equity 9.0% 10.9%
Audited Financial Information
There are no specific covenants given by the Group for its debt facilities which would require debt repayment or termination of a facility should its credit rating be revised by the credit rating agencies.
The Company has given financial covenants in respect of gearing limits and maintenance of minimum consolidated net worth, to secure funding for itself and its subsidiaries. These covenants are set out below:
Covenant requirements 2018 2017
Gearing
Consolidated borrowed money/consolidated net worth ≤200% 19.3% 23.7%
HK$M HK$M HK$M
Maintenance of minimum consolidated tangible net worth
Consolidated tangible net worth ≥20,000 312,197 292,608
These financial covenants, together with the long-term credit rating objective, establish the framework within which the capital structure of the Group is determined.
To date, none of the covenants have been breached.
Covenants and Credit Triggers

SWIRE PACIFIC 2018 ANNUAL REPORT 85
14 15 16 1817
400,000
350,000
25
20
15
10
5
0
300,000
250,000
200,000
150,000
100,000
50,000
0
HK$M Ratio (%)
Total equity Net debt Gearing ratio
14 15 16 1817
15,000 16
12
8
4
0
9,000
12,000
6,000
3,000
0
HK$M Times
Underlying operating profit
Net finance charges
Capitalised interest Underlying cash interest cover
Recurring underlying cash interest cover*
Underlying interest cover
Recurring underlying interest cover*
Underlying Interest Cover Gearing Ratio
* Calculated using recurring underlying operating profit.
Debt in Joint Venture and Associated Companies
In accordance with Hong Kong Financial Reporting Standards, the net debt of Swire Pacific reported in the consolidated statement of financial position does not include the net debt of its joint venture and associated companies. These companies had the following net debt positions at the end of 2018 and 2017:
Total net debt/(cash) of joint venture and
associated companiesPortion of net debt/(cash) attributable to the Group
Debt guaranteed by Swire Pacific or its subsidiaries
2018HK$M
2017HK$M
2018HK$M
2017HK$M
2018HK$M
2017HK$M
Property Division 17,024 17,334 6,765 7,058 1,771 1,483
Aviation Division
Cathay Pacific group 58,580 59,300 26,361 26,685 – –
HAECO group 105 527 118 240 – –
Others – 1 – 1 – –
Beverages Division (747) (392) (343) (221) – –
Marine Services Division 775 841 388 420 500 500
Trading & Industrial Division (245) (3,221) (99) (1,086) 14 29
75,492 74,390 33,190 33,097 2,285 2,012
If the attributable portion of the net debt in joint venture and associated companies were to be added to the Group’s net debt, gearing would rise to 29.5%.
The following graphs illustrate the underlying interest cover and the gearing ratios for each of the last five years:

86
Governance Culture
Swire Pacific is committed to ensuring that its affairs are conducted in accordance with high ethical standards. This reflects its belief that, in the achievement of its long-term objectives, it is imperative to act with probity, transparency and accountability. By so acting, Swire Pacific believes that shareholder wealth will be maximised in the long term and that its employees, those with whom it does business and the communities in which it operates will all benefit.
Corporate governance is the process by which the Board instructs management of the Group to conduct its affairs with a view to ensuring that its objectives are met. The Board is committed to maintaining and developing robust corporate governance practices that are intended to ensure:
– satisfactory and sustainable returns to shareholders– that the interests of those who deal with the Company are
safeguarded– that overall business risk is understood and managed
appropriately– the delivery of high-quality products and services to the
satisfaction of customers and– that high standards of ethics are maintained.
Corporate Governance Statement
The Corporate Governance Code (the “CG Code”) as published by The Stock Exchange of Hong Kong Limited sets out the principles of good corporate governance and provides two levels of recommendation:
– code provisions, with which issuers are expected to comply, but with which they may choose not to comply, provided they give considered reasons for non-compliance
– recommended best practices, with which issuers are encouraged to comply, but which are provided for guidance only
The Company supports the principles-based approach of the CG Code and the flexibility this provides for the adoption of corporate policies and procedures which recognise the individuality of companies. Swire Pacific has adopted its own corporate governance code which is available on its website www.swirepacific.com. Corporate governance does not stand still; it evolves with each business and operating environment. The Company is always ready to learn and adopt best practices. As part of its commitment to enhance corporate governance standards within the region, Swire Pacific is a member of the Asian Corporate Governance Association.
The Company complied with all the code provisions set out in the CG Code contained in Appendix 14 to the Rules Governing the Listing of Securities on The Stock Exchange of Hong Kong Limited (the “Listing Rules”) throughout the year covered by the annual report with the following exceptions which it believes do not benefit shareholders:
– Sections A.5.1 to A.5.4 of the CG Code in respect of the establishment, terms of reference and resources of a nomination committee. The Board has considered the merits of establishing a nomination committee but has concluded that it is in the best interests of the Company and potential new appointees that the Board collectively reviews and approves the appointment of any new Director as this allows a more informed and balanced decision to be made by the Board as to suitability for the role.
Corporate Governance Report

SWIRE PACIFIC 2018 ANNUAL REPORT 87
RemunerationCommittee
(Pages 91 and 92)
THE BOARD
Internal Audit(Page 95)
Audit Committee(Pages 94 and 95)
Finance Committee(Page 98)
Group Risk Management Committee
(Page 98)
Shareholders (Page 96)
ExternalManagement Board Committee
External Auditors (Pages 95 and 96)
Divisional Management(Page 91)
Governance Structure
The Board of Directors
Role of the BoardThe Company is governed by a Board of Directors, which has responsibility for strategic leadership and control of the Group designed to maximise shareholder value, while taking due account of the interests of those with whom the Group does business and others.
Responsibility for achieving the Company’s objectives and running the business on a day-to-day basis is delegated to divisional management. The Board exercises a number of reserved powers which include:
– maintaining and promoting the culture of the Company– formulation of long-term strategy– approving public announcements, including financial
statements– committing to major acquisitions, divestments and capital
projects – authorising significant changes to the capital structure and
material borrowings– any issue, or buy-back, of equity securities under the relevant
general mandates– approving treasury policy– setting dividend policy
– approving appointments to the Board– reviewing the board diversity policy with a view to the
Board having a balance of skills, experience and diversity of perspectives appropriate to the Company’s businesses
– ensuring that appropriate management development and succession plans are in place
– setting the Group remuneration policy – approving annual budgets and forecasts– reviewing operational and financial performance– reviewing the effectiveness of the Group’s risk management
and internal control systems– ensuring the adequacy of the resources, staff qualifications
and experience, training programmes and budget of the Company’s accounting, internal audit and financial reporting functions.
To assist it in fulfilling its duties, the Board has established two primary committees, the Audit Committee (see pages 94 and 95) and the Remuneration Committee (see pages 91 and 92).
Chairman and Chief ExecutiveThe CG Code requires that the roles of Chairman and Chief Executive be separate and not performed by the same individual to ensure there is a clear division of responsibilities between the running of the Board and the executives who run the business.
Note: The Group Risk Management Committee reports to the Board through the Audit Committee. The Finance Committee reports to be Board through the Finance Director.

CORPORATE GOVERNANCE REPORT88
M B Swire, the Chairman, is responsible for:
– leadership of the Board– setting its agenda and taking into account any matters
proposed by other Directors for inclusion in the agenda– facilitating effective contributions from and dialogue with all
Directors and constructive relations between them– ensuring that all Directors are properly briefed on issues
arising at Board meetings and that they receive accurate, timely and clear information
– obtaining consensus amongst the Directors– ensuring, through the Board, that good corporate governance
practices and procedures are followed.
Each division of the Group has one or more executive directors who are responsible for implementing the policies and strategies set by the Board in order to ensure the successful day-to-day management of the Group’s individual businesses (see page 91).
Throughout the year, there was a clear division of responsibilities between the Chairman and the management executives responsible for the divisions of the Group.
Board CompositionThe Board is structured with a view to ensuring it is of a high calibre and has a balance of key skills and knowledge so that it works effectively as a team and individuals or groups do not dominate decision-making.
The Board comprises the Chairman, three other Executive Directors and seven Non-Executive Directors. Their biographical details are set out in the section of this annual report headed Directors and Officers and are posted on the Company’s website.
I K L Chu, D P Cogman, M Cubbon and M M S Low are directors and/or employees of the John Swire & Sons Limited (“Swire”) group. M B Swire and S C Swire are shareholders, directors and employees of Swire. Before he ceased to be a director of the Company, J R Slosar was a director and an employee of the Swire group.
The Non-Executive Directors bring independent advice, judgement and, through constructive challenge, scrutiny of executives and review of performance and risks. The Audit and Remuneration Committees of the Board comprise only Non-Executive Directors.
The Board considers that five of the seven Non-Executive Directors are independent in character and judgement and fulfil the independence guidelines set out in Rule 3.13 of the Listing Rules. T G Freshwater and C Lee have served as Non-Executive Directors for more than nine years. The Directors are of the opinion that they remain independent, notwithstanding their length of tenure. T G Freshwater and C Lee continue to demonstrate the attributes of an Independent Non-Executive Director noted above and there is no evidence that their tenure has had any impact on their independence. The Board believes that their detailed knowledge and experience of the Group’s business and their external experience continue to be of significant benefit to the Company, and that they maintain an independent view of its affairs.
Confirmation has been received from all Independent Non-Executive Directors that they are independent as set out in Rule 3.13 of the Listing Rules. None of the Independent Non-Executive Directors holds cross-directorships or has significant links with other Directors through involvements in other companies or bodies.
The Independent Non-Executive Directors:
– provide open and objective challenge to management and other Board members
– raise intelligent questions and challenge constructively and with vigour
– bring outside knowledge of the businesses and markets in which the Group operates, providing informed insight and responses to management.
The number of Independent Non-Executive Directors represents at least one-third of the Board of Directors.
Appointment and Re-electionPotential new Directors are identified and considered for appointment by the Board. A Director appointed by the Board is subject to election by shareholders at the first annual general meeting after his or her appointment, and all Executive and Non-Executive Directors are subject to re-election by shareholders every three years.
Potential new Board members are identified on the basis of skills and experience which, in the opinion of the Directors, will enable them to make a positive contribution to the performance of the Board.

SWIRE PACIFIC 2018 ANNUAL REPORT 89
On 14th March 2019, the Board, having reviewed the Board’s composition, nominated M Cubbon, R W M Lee and G R H Orr for recommendation to shareholders for election/re-election at the 2019 Annual General Meeting. The nominations were made in accordance with objective criteria (including gender, age, cultural and educational background, ethnicity, professional experience, skills, knowledge, length of service and the legitimate interests of the Company’s principal shareholders), with due regard for the benefits of diversity, as set out in the board diversity policy. The Board also took into account the respective contributions of M Cubbon, R W M Lee and G R H Orr to the Board and their firm commitment to their roles. The Board is satisfied with the independence of R W M Lee and G R H Orr having regard to the criteria laid down in the Listing Rules. The particulars of the Directors standing for election/re-election are set out in the section of this annual report headed Directors and Officers and will also be set out in the circular to shareholders to be distributed with this annual report and posted on the Company’s website.
Full details of changes in the Board during the year and to the date of this report are provided in the section of this annual report headed Directors’ Report.
Board DiversityThe Board has adopted a board diversity policy, which is available on the Company’s website. The Board’s composition reflects an appropriate mix of skills, experience and diversity among its members that are relevant to the Company’s strategy, governance and business and contribute to the Board’s effectiveness. A summary is set out in the table below:
Age Gender Ethnicity Years of service as Director Skills, expertise and experience
39-50 years (27%)Male (82%)
Female (18%)
American (9%) 1-5 years (55%) company executive (55%)
51-62 years (36%) British (64%) 6-10 years (18%) accounting, banking and finance (27%)
63-74 years (36%) Chinese (27%) over 10 years (27%) management consultancy (18%)
In order to achieve a diversity of perspectives among members of the Board, it is the policy of the Company to consider a number of factors when deciding on appointments to the Board and the continuation of those appointments. Such factors include gender, age, cultural and educational background, ethnicity, professional experience, skills, knowledge, length of service and the legitimate interests of the Company’s principal shareholders.
Responsibilities of DirectorsOn appointment, the Directors receive information about the Group including:
– the role of the Board and the matters reserved for its attention
– the role and terms of reference of Board Committees– the Group’s corporate governance practices and procedures– the powers delegated to management and– the latest financial information.
Directors update their skills, knowledge and familiarity with the Group through their participation at meetings of the Board and its committees and through regular meetings with management at the head office and in the divisions. Directors are regularly updated by the Company Secretary on their legal and other duties as Directors of a listed company.
Through the Company Secretary, Directors are able to obtain appropriate professional training and advice.
Each Director ensures that he/she can give sufficient time and attention to the affairs of the Group. All Directors disclose to the Board on their first appointment their interests as a Director or otherwise in other companies or organisations and such declarations of interests are updated regularly.
Details of Directors’ other appointments are shown in their biographies in the section of this annual report headed Directors and Officers.
Board ProcessesAll committees of the Board follow the same processes as the full Board.
The dates of the 2018 Board meetings were determined in 2017 and any amendments to this schedule were notified to Directors at least 14 days before regular meetings. Suitable arrangements are in place to allow Directors to include items in the agenda for regular Board meetings.
The Board met six times in 2018. The attendance of individual Directors at meetings of the Board and its committees is set out in the table on page 90. Average attendance at Board meetings was 95%. All Directors attended Board meetings in person or through electronic means of communication during the year.
Agendas and accompanying Board papers are circulated with sufficient time to allow the Directors to prepare before meetings.

CORPORATE GOVERNANCE REPORT90
The Chairman takes the lead to ensure that the Board acts in the best interests of the Company, that there is effective communication with the shareholders and that their views are communicated to the Board as a whole.
Board decisions are made by vote at Board meetings and supplemented by the circulation of written resolutions between Board meetings.
Minutes of Board meetings are taken by the Company Secretary and, together with any supporting papers, are made available to all Directors. The minutes record the matters considered by the Board, the decisions reached, and any concerns raised or dissenting views expressed by Directors. Draft and final versions of the minutes are sent to all Directors for their comment and records respectively.
Board meetings are structured so as to encourage open discussion, frank debate and active participation by Directors in meetings.
A typical Board meeting would consist of:
– review by the Finance Director of quarterly and annual financial results, the operating environment for the businesses and the budget outlook for their performance
– review and discussion of longer-term financial plans for the Group, including discussion of capital allocation and portfolio investment plans over a ten-year horizon
– discussion of group strategy, including major investments, divestments and strategic initiatives within the businesses
– the presentation of papers to support decisions requiring Board approval
– an update of legal and compliance matters for the Board’s consideration
– any declarations of interest.
The executive management provides the Board with such information and explanations as are necessary to enable Directors to make an informed assessment of the financial and other information put before the Board. Queries raised by Directors are answered fully and promptly.
When necessary, the Independent Non-Executive Directors meet privately to discuss matters which are their specific responsibility. One such meeting was held in 2018.
The Chairman meets at least annually with the Independent Non-Executive Directors without the presence of other Directors.
Directors
Meetings Attended/Held
Continuous Professional
Development
BoardAudit
CommitteeRemuneration
Committee
2018Annual General
MeetingType of Training
(Note)
Executive Directors
M B Swire – Chairman (elected on 1st July 2018) 5/6 1/1 √ A
J R Slosar – Chairman (retired on 30th June 2018) 4/4 √ A
I K L Chu 6/6 √ A
D P Cogman 6/6 √ A
M M S Low 6/6 √ A
Non-Executive Directors
M Cubbon (appointed on 1st November 2018) 1/1 N/A A
S C Swire 5/6 1/1 √ A
Independent Non-Executive Directors
P K Etchells 6/6 3/3 √ A
T G Freshwater 6/6 √ A
C Lee 6/6 3/3 2/2 √ A
R W M Lee 5/6 2/2 x A
G R H Orr 6/6 3/3 √ A
Average attendance 95% 100% 100% 91%
Note:A: All the Directors received training materials, including from the Company’s external legal advisor, about matters relevant to their duties as directors. They also kept abreast of matters relevant to their role
as directors by such means as attendance at seminars and conferences and reading and viewing materials about financial, commercial, economic, legal, regulatory and business affairs.

SWIRE PACIFIC 2018 ANNUAL REPORT 91
Continuous Professional DevelopmentAll Directors named above have received the training referred to above and have been provided with “A Guide on Directors’ Duties” issued by the Companies Registry and “Guidelines for Directors” and “Guide for Independent Non-Executive Directors” issued by the Hong Kong Institute of Directors. The Company makes available continuous professional development for all Directors at the expense of the Company so as to develop and refresh their knowledge and skills.
Directors’ and Officers’ InsuranceThe Company has arranged appropriate insurance cover in respect of potential legal actions against its Directors and Officers.
Conflicts of InterestIf a Director has a material conflict of interest in relation to a transaction or proposal to be considered by the Board, the individual is required to declare such interest and abstains from voting. The matter is considered at a Board meeting and voted on by Directors who have no material interest in the transaction.
Delegation by the BoardResponsibility for delivering the Company’s strategies and objectives, as established by the Board, and responsibility for day-to-day management is delegated to the head of each business unit. These individuals have been given clear guidelines and directions as to their powers and, in particular, the circumstances under which they should report back to, and obtain prior approval from, the Board before making commitments on behalf of the Company.
The Board monitors management’s performance against the achievement of financial and non-financial measures, the principal items monitored being:
– detailed monthly management accounts consisting of statements of profit or loss, financial position and cash flows compared to budget, together with forecasts
– internal and external audit reports– feedback from external parties such as customers, others
with whom the Group does business, trade associations and service providers.
Securities TransactionsThe Company has adopted a code of conduct (the “Securities Code”) regarding securities transactions by Directors and officers on terms no less exacting than the required standard set out in the Model Code for Securities Transactions by Directors of Listed Issuers contained in Appendix 10 to the Listing Rules. These rules are available on the Company’s website.
A copy of the Securities Code has been sent to each Director of the Company and will be sent to each Director twice annually, immediately before the two financial period ends, with a reminder that the Director cannot deal in the securities and derivatives of the Company during the blackout period before the Group’s interim and annual results have been published, and that all their dealings must be conducted in accordance with the Securities Code.
Under the Securities Code, Directors and senior executives of the Company are required to notify the Chairman and receive a dated written acknowledgement before dealing in the securities and derivatives of the Company and, in the case of the Chairman himself, he must notify the Chairman of the Audit Committee and receive a dated written acknowledgement before any dealing.
On specific enquiries made, all the Directors of the Company have confirmed that they have complied with the required standard set out in the Securities Code.
Directors’ interests at 31st December 2018 in the shares of the Company and its associated corporations (within the meaning of Part XV of the Securities and Futures Ordinance) are set out in the section of this annual report headed Directors’ Report.
Remuneration Committee
Full details of the remuneration of the Directors are provided in note 8 to the financial statements.
The Remuneration Committee comprises three Non-Executive Directors, C Lee, R W M Lee and S C Swire. Two of the Committee members are Independent Non-Executive Directors, one of whom, C Lee is Chairman. S C Swire succeeded M B Swire as a member of the Remuneration Committee with effect from 18th May 2018. All the other members served for the whole of 2018.

CORPORATE GOVERNANCE REPORT92
The Remuneration Committee reviews and approves the management’s remuneration proposals with reference to the Board’s corporate goals and objectives.
The Remuneration Committee exercises the powers of the Board to determine the remuneration packages of individual Executive Directors (including salaries, bonuses, benefits in kind and the terms on which they participate in any provident fund or other retirement benefit scheme), taking into consideration salaries paid by comparable companies, time commitments and responsibilities and employment conditions elsewhere in the Group.
The terms of reference of the Remuneration Committee have been reviewed with reference to the CG Code and are posted on the Company’s website.
In order to be able to attract and retain staff of suitable calibre, the Swire group provides a competitive remuneration package designed to be commensurate, overall, with those of its peer group. This typically comprises salary, housing, retirement benefits, leave-passage and education allowances and, after three years’ service, a bonus related to the overall profit of the Swire Pacific Group. Although the remuneration of executives is not entirely linked to the profits of the businesses in which they are working, it is considered that, given the different profitability profiles of businesses within the Group, these arrangements have contributed considerably to the maintenance of a flexible, motivated and high-calibre management team within the Group.
The Remuneration Committee reviewed the structure and levels of remuneration paid to Executive Directors at its meeting in October 2018. At this meeting the Committee considered a report prepared for it by Mercer Limited, an independent firm of consultants, which confirmed that the remuneration of the Company’s Executive Directors, as disclosed in note 8 to the financial statements, was comparable with that paid to equivalent executives in peer group companies.
No Director takes part in any discussion about his or her own remuneration.
The following fee levels have been approved by the Board:
Fee2018HK$
2019HK$
Director’s Fee 690,000 690,000
Fee for Audit Committee Chairman 268,000 268,000
Fee for Audit Committee Member 186,000 186,000
Fee for Remuneration Committee Chairman 83,000 83,000
Fee for Remuneration Committee Member 60,000 60,000
Accountability and Audit
Financial ReportingThe Board acknowledges its responsibility for:
– the proper stewardship of the Company’s affairs, to ensure the integrity of financial information
– preparing annual and interim financial statements and other related information that give a true and fair view of the Group’s affairs and of its results and cash flows for the relevant periods, in accordance with Hong Kong Financial Reporting Standards and the Hong Kong Companies Ordinance
– selecting appropriate accounting policies and ensuring that these are consistently applied
– making judgements and estimates that are prudent and reasonable; and
– ensuring that the application of the going concern assumption is appropriate.
Risk Management and Internal ControlThe Board acknowledges its responsibility to establish, maintain and review the effectiveness of the Group’s risk management and internal control systems. This responsibility is primarily fulfilled on its behalf by the Audit Committee as discussed on pages 94 and 95.
The foundation of strong risk management and internal control systems is dependent on the ethics and culture of the organisation, the quality and competence of its personnel, the direction provided by the Board, and the effectiveness of management.
Since profits are, in part, the reward for successful risk taking in business, the risk management and internal control systems are designed to manage rather than eliminate the risk of failure to achieve business objectives, and can only provide reasonable and not absolute assurance against material misstatement or loss.
The key components of the Group’s control structure are as follows:
Culture: The Board believes that good governance reflects the culture of an organisation. This is more significant than any written procedures.
The Company aims at all times to act ethically and with integrity, and to instil this behaviour in all its employees by example from the Board down. The Company has a Code of Conduct, which is posted on its internal intranet site.

SWIRE PACIFIC 2018 ANNUAL REPORT 93
The Company is committed to developing and maintaining high professional and ethical standards. These are reflected in the rigorous selection process and career development plans for all employees. The organisation prides itself on being a long-term employer which instils in individuals, as they progress through the Group, a thorough understanding of the Company’s ways of thinking and acting.
Channels of communication are clearly established, allowing employees a means of communicating their views upwards with a willingness on the part of more senior personnel to listen. Employees are aware that, whenever the unexpected occurs, attention should be given not only to the event itself, but also to determining the cause.
Through the Company’s Code of Conduct, employees are encouraged (and instructed as to how) to report control deficiencies or suspicions of impropriety to those who are in a position to take necessary action.
Risk assessment: The Board of Directors and the management each have a responsibility to identify and analyse the risks underlying the achievement of business objectives, and to determine how such risks should be managed and mitigated.
There are two key management committees which monitor risk processes throughout the Group; the Group Risk Management Committee (GRMC) and the Finance Committee. These primarily comprise senior management and both are chaired by the Finance Director, who reports to the Board on matters of significance that arise.
The GRMC, discussed further in the section of this annual report headed Risk Management, focuses on business, operational, safety, security, legal and reputational risks. The Finance Committee, discussed further in the section of this annual report headed Risk Management, focuses on broad financial and treasury risks.
Management structure: The Group has a clear organisational structure that, to the extent required, delegates the day-to-day responsibility for the design, documentation and implementation of procedures and monitoring of risk. Individuals appreciate where they will be held accountable in this process.
A control self-assessment process requires the management in each material business unit to assess, through the use of detailed questionnaires, the adequacy and effectiveness of risk management and internal controls over the reliability
of financial reporting, the effectiveness and efficiency of operations and compliance with applicable laws and regulations. This process and its results are reviewed by internal auditors and form part of the Audit Committee’s annual assessment of control effectiveness.
Controls and review: The control environment comprises policies and procedures intended to ensure that relevant management directives are carried out and actions that may be needed to address risks are taken. These may include approvals and verifications, reviews, safeguarding of assets and segregation of duties. Control activities can be divided into operations, financial reporting and compliance, although there may, on occasion, be some overlap between them. The typical control activities adopted by Group companies include:
– analytical reviews: for example, conducting reviews of actual performance versus budgets, forecasts, prior periods and competitors
– direct functional or activity management: reviews of performance reports, conducted by managers in charge of functions or activities
– information-processing: performing controls intended to check the authorisation of transactions and the accuracy and completeness of their reporting, for example, exception reports
– physical controls: ensuring equipment, inventories, securities and other assets are safeguarded and subjected to periodic checks
– performance indicators: carrying out analyses of different sets of data, operational and financial, examining the relationships between them, and taking corrective action where necessary
– segregation of duties: dividing and segregating duties among different people, with a view to strengthening checks and minimising the risk of errors and abuse.
The Company has in place effective processes and systems for the identification, capture and reporting of operational, financial and compliance-related information in a form and time-frame intended to ensure that staff carry out their designated responsibilities.
Internal audit: Independent of management, the Internal Audit department reports directly to the Audit Committee and performs regular reviews of key risk areas and monitors compliance with Group accounting, financial and operational procedures. The role of Internal Audit is discussed further on page 95.

CORPORATE GOVERNANCE REPORT94
Audit Committee
The Audit Committee, consisting of three Independent Non-Executive Directors, P K Etchells, C Lee and G R H Orr, assists the Board in discharging its responsibilities for corporate governance and financial reporting. P K Etchells is the Chairman of the Audit Committee. All the members served for the whole of 2018.
The terms of reference of the Audit Committee follow the guidelines set out by the Hong Kong Institute of Certified Public Accountants and comply with the CG Code. They are available on the Company’s website.
The Audit Committee met three times in 2018. Regular attendees at the meetings are the Finance Director, the Head of Internal Audit and the external auditors. The Audit Committee meets at least twice a year with the external auditors, and at least once a year with the Head of Internal Audit, without the presence of management. Each meeting receives written reports from the GRMC, the external auditors and Internal Audit. Other attendees during the year included the Group Finance Manager and the Head of Group Risk Management.
The work of the Committee during 2018 included reviews of the following matters:
– the completeness, accuracy and integrity of formal announcements relating to the Group’s performance including the 2017 annual and 2018 interim reports and announcements, with recommendations to the Board for approval
– the Group’s compliance with regulatory and statutory requirements
– the Group’s risk management and internal control systems– the Group’s risk management processes– the approval of the 2019 annual Internal Audit programme
and review of progress on the 2018 programme– periodic reports from Internal Audit and progress in resolving
any matters identified in them– significant accounting and audit issues– the Company’s policy regarding connected transactions and
the nature of such transactions– the relationship with the external auditors as discussed on
page 95– the Company’s compliance with the CG Code.
In 2019, the Committee has reviewed, and recommended to the Board for approval, the 2018 financial statements.
Assessing the Effectiveness of Risk Management and Internal Control SystemsOn behalf of the Board, the Audit Committee reviews annually the continued effectiveness of the Group’s risk management and internal control systems dealing with risk and financial accounting and reporting, the effectiveness and efficiency of operations, compliance with laws and regulations, and risk management functions.
This assessment considers:
– the scope and quality of management’s ongoing monitoring of risks and of the risk management and internal control systems, the work and effectiveness of Internal Audit and the assurances provided by the Finance Director
– the changes in the nature and extent of significant risks since the previous review and the Group’s ability to respond to changes in its business and the external environment
– the extent and frequency with which the results of monitoring are communicated, enabling the Committee to build up a cumulative assessment of the state of control in the Group and the effectiveness with which risk is being managed
– the incidence of any significant control failings or weaknesses that have been identified at any time during the period and the extent to which they have resulted in unforeseen outcomes or contingencies that have had, could have had, or may in the future have, a material impact on the Company’s financial performance or condition
– the effectiveness of the Company’s processes in relation to financial reporting and statutory and regulatory compliance
– areas of risk identified by management– significant risks reported by Internal Audit and the Group Risk
Management Committee– work programmes proposed by both Internal Audit and the
external auditors– significant issues arising from internal and external audit
reports– the results of management’s control self assessment exercise.
As a result of the above review, the Board confirms, and management has also confirmed to the Board, that the Group’s risk management and internal control systems are effective and adequate and have complied with the CG Code provisions on risk management and internal control throughout the year and up to the date of this annual report.
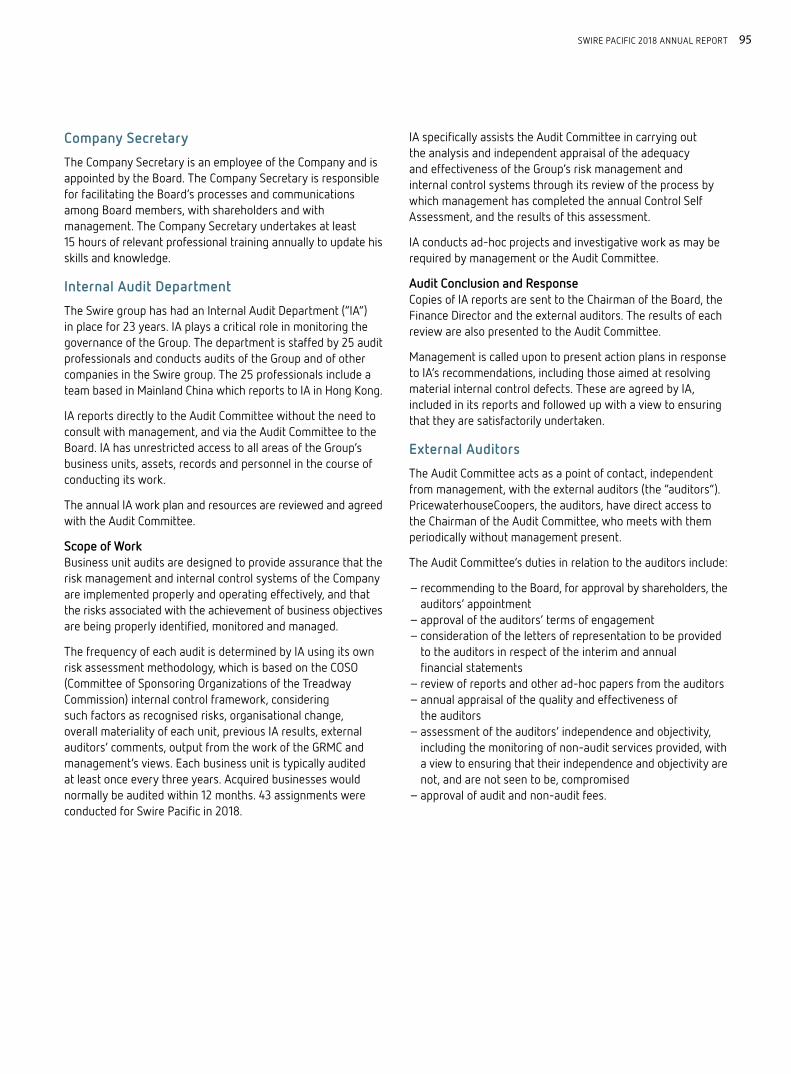
SWIRE PACIFIC 2018 ANNUAL REPORT 95
Company Secretary
The Company Secretary is an employee of the Company and is appointed by the Board. The Company Secretary is responsible for facilitating the Board’s processes and communications among Board members, with shareholders and with management. The Company Secretary undertakes at least 15 hours of relevant professional training annually to update his skills and knowledge.
Internal Audit Department
The Swire group has had an Internal Audit Department (“IA”) in place for 23 years. IA plays a critical role in monitoring the governance of the Group. The department is staffed by 25 audit professionals and conducts audits of the Group and of other companies in the Swire group. The 25 professionals include a team based in Mainland China which reports to IA in Hong Kong.
IA reports directly to the Audit Committee without the need to consult with management, and via the Audit Committee to the Board. IA has unrestricted access to all areas of the Group’s business units, assets, records and personnel in the course of conducting its work.
The annual IA work plan and resources are reviewed and agreed with the Audit Committee.
Scope of WorkBusiness unit audits are designed to provide assurance that the risk management and internal control systems of the Company are implemented properly and operating effectively, and that the risks associated with the achievement of business objectives are being properly identified, monitored and managed.
The frequency of each audit is determined by IA using its own risk assessment methodology, which is based on the COSO (Committee of Sponsoring Organizations of the Treadway Commission) internal control framework, considering such factors as recognised risks, organisational change, overall materiality of each unit, previous IA results, external auditors’ comments, output from the work of the GRMC and management’s views. Each business unit is typically audited at least once every three years. Acquired businesses would normally be audited within 12 months. 43 assignments were conducted for Swire Pacific in 2018.
IA specifically assists the Audit Committee in carrying out the analysis and independent appraisal of the adequacy and effectiveness of the Group’s risk management and internal control systems through its review of the process by which management has completed the annual Control Self Assessment, and the results of this assessment.
IA conducts ad-hoc projects and investigative work as may be required by management or the Audit Committee.
Audit Conclusion and ResponseCopies of IA reports are sent to the Chairman of the Board, the Finance Director and the external auditors. The results of each review are also presented to the Audit Committee.
Management is called upon to present action plans in response to IA’s recommendations, including those aimed at resolving material internal control defects. These are agreed by IA, included in its reports and followed up with a view to ensuring that they are satisfactorily undertaken.
External Auditors
The Audit Committee acts as a point of contact, independent from management, with the external auditors (the “auditors”). PricewaterhouseCoopers, the auditors, have direct access to the Chairman of the Audit Committee, who meets with them periodically without management present.
The Audit Committee’s duties in relation to the auditors include:
– recommending to the Board, for approval by shareholders, the auditors’ appointment
– approval of the auditors’ terms of engagement– consideration of the letters of representation to be provided
to the auditors in respect of the interim and annual financial statements
– review of reports and other ad-hoc papers from the auditors– annual appraisal of the quality and effectiveness of
the auditors– assessment of the auditors’ independence and objectivity,
including the monitoring of non-audit services provided, with a view to ensuring that their independence and objectivity are not, and are not seen to be, compromised
– approval of audit and non-audit fees.

CORPORATE GOVERNANCE REPORT96
Auditors’ IndependenceIndependence of the auditors is of critical importance to the Audit Committee, the Board and shareholders. The auditors write annually to the members of the Audit Committee confirming that they are independent accountants within the meaning of Section 290 of the Code of Ethics for Professional Accountants of the Hong Kong Institute of Certified Public Accountants and that they are not aware of any matters which may reasonably be thought to bear on their independence. The Audit Committee assesses the independence of the auditors by considering and discussing each such letter (and having regard to the fees payable to the auditors for audit and non-audit work and the nature of the non-audit work) at a meeting of the Audit Committee.
Provision of Non-audit ServicesIn deciding whether the auditors should provide non-audit services the following key principles are considered:
– the auditors should not audit their own firm’s work– the auditors should not make management decisions– the auditors’ independence should not be impaired– quality of service.
In addition, any services which may be considered to be in conflict with the role of the auditors must be submitted to the Audit Committee for approval prior to engagement, regardless of the amounts involved.
The fees in respect of audit and non-audit services provided to the Group by the auditors for 2018 amounted to approximately HK$53 million and HK$17 million respectively. Fees paid to the auditors are disclosed in note 6 to the financial statements.
Inside Information
With respect to procedures and internal controls for the handling and dissemination of inside information, the Company:
– is required to disclose inside information as soon as reasonably practicable in accordance with the Securities and Futures Ordinance and the Listing Rules
– conducts its affairs with close regard to the “Guidelines on Disclosure of Inside Information” issued by the Securities and Futures Commission
– has included in its Corporate Code of Conduct a strict prohibition on the unauthorised use of confidential or inside information
– ensures, through its own internal reporting processes and the consideration of their outcome by senior management, the appropriate handling and dissemination of inside information.
Shareholders
Communication with Shareholders and InvestorsThe Board and senior management recognise their responsibility to represent the interests of all shareholders and to maximise shareholder value. Communication with shareholders and accountability to shareholders is a high priority of the Company.
The methods used to communicate with shareholders include the following:
– The Finance Director is available for meetings with major shareholders, investors and analysts over two-month periods immediately after the announcement of the interim and annual results and at certain other times during the year. In 2018 the Finance Director held meetings or calls with analysts and investors, conducted analyst briefings and overseas roadshows and spoke at investor conferences
– through the Company’s website. This includes electronic copies of financial reports, audio webcasts of analyst presentations given at the time of the interim and annual results announcements, slides of presentations given at investor conferences, latest news, public announcements and general information about the Group’s businesses
– through publication of interim and annual reports– through the annual general meeting as discussed below.
Shareholders may send their enquiries and concerns to the Board by post or email at [email protected]. The relevant contact details are set out in the Financial Calendar and Information for Investors section of this Annual Report.

SWIRE PACIFIC 2018 ANNUAL REPORT 97
The Annual General MeetingThe annual general meeting is an important forum in which to engage with shareholders. The most recent annual general meeting was held on 10th May 2018. The meeting was open to all shareholders and to the press. The Directors who attended the meeting are shown in the table on page 90.
At the annual general meeting, separate resolutions were proposed for each issue and were voted on by poll. The procedures for conducting a poll were explained at the meeting prior to the polls being taken. The agenda items were:
– receiving the report of the Directors and the audited financial statements for the year ended 31st December 2017
– electing/re-electing Directors– re-appointing the auditors and authorising the Directors to
set their remuneration– a general mandate authorising the Directors to make on-
market share buy-backs– a general mandate authorising the Directors to allot and issue
shares up to 20% of the number of shares of any class then in issue, provided that the aggregate number of the shares of any class so allotted wholly for cash would not exceed 5% of the number of the shares of that class then in issue.
Minutes of the meeting together with voting results are available on the Company’s website.
Dividend PolicyThe Company has a policy on the payment of dividends, which is set out in the section of this annual report headed Directors’ Report.
Shareholder EngagementPursuant to Article 95 of the Company’s Articles of Association, if a shareholder wishes to propose a person other than a retiring Director for election as a Director at a general meeting, he or she should deposit a written notice of nomination at the registered office of the Company within the 7-day period commencing on and including the day after the despatch of the notice of the meeting. The procedures for nominating candidates to stand for election as Directors at general meetings are set out in the Corporate Governance Section of the Company’s website.
If they wish to propose a resolution relating to other matters to be considered at a general meeting, shareholders are requested to follow the requirements and procedures set out in the Corporate Governance Section of the Company’s website.
Shareholder(s) representing at least 5% of the total voting rights of all members may request the Board to convene a general meeting. The objects of the meeting must be stated in the related requisition deposited at the Company’s registered office. Detailed requirements and procedures are set out in the Corporate Governance Section of the Company’s website.
Other Information for ShareholdersKey shareholder dates for 2019 are set out in the section of this annual report headed Financial Calendar and Information for Investors and in the Financial Calendar on the Company’s website.
No amendment has been made to the Company’s Articles of Association during the year.
From information publicly available to the Company and within the knowledge of its Directors, at least 25% of the Company’s total issued share capital is held by the public. Details of substantial shareholders’ and other interests are included in the section of this annual report headed Directors’ Report.

98
FinanceCommittee
GRMC – Working Committee
Group Risk Management Committee(GRMC)
Swire Pacific Board
Committee Working Group
Risk &Insurance
Insurance
HumanResources
Health& Safety
Legal SustainabilityInformationTechnology
Enterprise RiskManagement
US RiskManagement
China Health& Safety
CyberSecurity
WaterCarbon Waste
ClimateResilience
SustainableMaterials
Biodiversity
Group Internal Audit
Risk Management
The Board of Directors and the management of each division are responsible for identifying and analysing the risks underlying the achievement of business objectives, and for determining how such risks should be managed and mitigated.
There are two key management committees which seek to monitor the risks to which the Group is subject; the Group Risk Management Committee (GRMC) and the Finance Committee. These are made up of members of senior management and both are chaired by the Finance Director, who reports to the Board on matters of significance that arise.
Group Risk Management Committee
The GRMC provides oversight of all the risks to which the Group is subject (except for those expressly covered by the Finance Committee) including setting risk management policies and strategies. The GRMC reports via the Audit Committee to the Board. It comprises the Finance Director, two Executive Directors and four heads of operating businesses.
The GRMC oversees a number of committees and working groups. These cover the following areas: Risk & Insurance, Human Resources, Health and Safety, Legal, Information Technology, Cyber Security, Sustainability and the six SwireTHRIVE key issue areas, Enterprise Risk Management and US Risk Management. The GRMC’s oversight role includes those areas which can be collectively categorised as sustainable development.
Risk Governance Structure
In 2018, the GRMC met three times and its functional Group committees and working groups met a total of 26 times.
The members of the functional Group committees and working groups are specialists in their respective areas and each committee is chaired by an individual with relevant experience. The role of the functional Group committees and working groups is to identify risks and opportunities which fall within their respective functional areas and to draw up policy recommendations for GRMC review and approval. The policies approved by the GRMC apply to all companies in which Swire Pacific has a controlling interest. The boards of these operating companies are required to adopt these policies and to establish procedures to ensure compliance with them. Joint venture and associated companies are encouraged to adopt Group policies.
The management of risks is subject to audit by the Group’s Internal Audit department, with support from specialist external consultants where necessary.
Finance Committee
The role of the Finance Committee is to provide oversight of the Group’s financial risks, including setting the Group’s financial risk management policies and procedures. These are implemented within both the Group’s central financial reporting function and the divisional finance functions.
The Finance Committee consists of the Finance Director, Divisional Finance Directors and other senior finance executives.

SWIRE PACIFIC 2018 ANNUAL REPORT 99
The Group’s approach to financial risk management is discussed below.
Financial Risk Management
Audited Financial Information
Structure and PoliciesIn the normal course of business the Group is exposed to financial risks attributable to interest rates, currencies, credit and liquidity.
The Finance Committee maintains and develops the Group’s financial risk management policies and procedures. These policies and procedures are implemented by the head office treasury department, within an agreed framework authorised by the Board.
The treasury department manages the funding needs of the Group’s non-listed subsidiaries, as well as resulting interest rate, currency, credit and liquidity risks. Operating subsidiaries manage currency and credit exposures that are specific to their trading transactions.
It is the Group’s policy not to enter into derivative transactions for speculative purposes. Derivatives are used solely for management of an underlying risk and the Group minimises its exposure to market risk by applying hedge accounting for derivative instruments. By applying hedge accounting, gains and losses on derivatives offset the losses and gains on the assets, liabilities or transactions being hedged. Accounting for derivative financial instruments and hedging activities is discussed on pages 174 to 176.
The Group’s listed subsidiary (Swire Properties Limited) and the Group’s joint venture and associated companies arrange their financial and treasury affairs on a stand-alone basis. The Company may provide financial support by way of guarantees to its non-listed joint venture and associated companies in cases where significant cost savings are available and risks are acceptable.
Interest Rate Exposure The Group’s interest rate risk arises primarily from borrowings. Borrowings at variable rates expose the Group to cash flow interest rate risk. Borrowings at fixed rates expose the Group to fair value interest rate risk. The Group earns interest income on cash deposits.
The Group maintains a significant proportion of debt on a fixed rate basis with a view to increasing certainty of funding costs. The level of fixed rate debt for the Group is decided after taking into consideration the potential impact of higher interest rates on profit, interest cover and the expected cash flows of the Group’s businesses and investments. The Group uses interest rate swaps to manage its long-term interest rate exposure. The Finance Director approves all interest rate hedges prior to implementation.
On a quarterly basis, the treasury department calculates the effect of the Group’s exposure to interest rate fluctuations on forecast earnings and cash flows by performing sensitivity testing with varying forecast interest rates. The treasury department reports the results of this testing to the Finance Committee. Refer to page 133 for details of the sensitivity testing performed at 31st December 2018.
Currency Exposure The Group operates internationally and is exposed to foreign exchange risk arising from various currency exposures, primarily with respect to US dollars and Chinese Renminbi. Foreign exchange risk arises from the foreign currency denomination of commercial transactions, assets and liabilities, and net investments in foreign operations.
The Group’s policy is to hedge in full all highly probable transactions in each major currency where their value or time to execution gives rise to a significant currency exposure, provided that the cost of the foreign exchange forward or other derivative contract is not prohibitively expensive having regard to the underlying exposure.
Exposure to movements in exchange rates on transactions is minimised by using appropriate hedging instruments where active markets for the relevant currencies exist. At 31st December 2018, the Group had hedged its significant foreign currency funding exposures, by fixing the foreign exchange rates with forward contracts.
Exposure arising from the Group’s investments in operating subsidiaries with net assets denominated in foreign currencies is reduced, where practical, by providing funding in the same currency.

RISK MANAGEMENT100
Audited Financial Information (continued)
Foreign currency funding and deposit exposure is monitored by the treasury department on a continuous basis and hedging proposals are presented to the Finance Committee.
Refer to pages 133 and 134 for a sensitivity analysis of the Group’s exposure to currency risk arising from recognised financial assets or financial liabilities denominated in a currency other than the functional currency at 31st December 2018.
Credit Exposure The Group’s credit risk is primarily attributable to trade and other receivables with wholesale customers, derivative financial instruments, receivables from joint venture companies and associated companies and cash and deposits with banks and financial institutions. Individual operating entities are responsible for setting credit terms appropriate to their industry and assessing the credit profile of individual customers.
Standard settlement terms within the HAECO group, the Beverages Division and SPO are 30 days from the date of invoice. In accordance with the provisions of Swire Properties’ standard tenancy agreements, rentals and other charges are due on the first day of each calendar month. Typically sales to retail customers within Swire Resources are made by cash or major credit cards. The Group has no significant credit risk with any one customer.
When depositing surplus funds or entering into derivative contracts, the Group controls its exposure to non-performance by counterparties by dealing with investment grade counterparties, setting approved counterparty limits and applying monitoring procedures. Counterparty credit exposure limits for financial institutions are proposed by the treasury department and approved by the Finance Director. The treasury department monitors the counterparties’ credit ratings and issues an approved list of counterparties with their limits on a quarterly basis to all subsidiaries. Group companies require prior approval from the Group’s treasurer to deal with banks not on the approved list. In addition, the Group and the Company monitor the exposure to credit risk in respect of the financial assistance provided to subsidiaries, joint venture companies and associated companies through exercising control or significant influence over their financial and operating policy decisions and reviewing their financial positions on a regular basis.
The Group is not required by its counterparties to provide collateral or any other form of security against any change in the market value of derivatives. There are no specific conditions that would require the termination of derivative contracts should the credit rating of Swire Pacific be downgraded.
The maximum credit risk in respect of contingencies is disclosed in note 39 to the financial statements.
Liquidity RiskThe Group takes liquidity risk into consideration when deciding its sources of funds and their tenors, so as to avoid over reliance on funds from any one source and to prevent substantial refinancing in any one period. The Group maintains significant undrawn committed revolving credit facilities and cash deposits in order to reduce liquidity risk further and to allow for flexibility in meeting funding requirements.
The Group aims to maintain immediate access to committed funds to meet its refinancing and capital commitments for the following 12 months on a rolling basis, excluding its onshore Renminbi debt funding, where forward commitments are not readily available. The Group does not have significant offshore Renminbi debt funding.
The treasury departments of Swire Pacific and its listed subsidiary (Swire Properties Limited) produce a forecast funding plan for the Group on a quarterly basis and a summary forecast on a monthly basis, in order to assess committed and probable funding requirements. The plan includes an analysis of debt refinancing by year and by source of funds. The Group’s treasurer presents the forecast funding plan together with funding proposals to the Finance Director on a regular basis, and to the Finance Committee. Refer to page 135 for details of the Group’s contractual obligations at 31st December 2018.
Price RiskThe Group is exposed to price risk in relation to listed equity securities held as available-for-sale investments. Management regularly reviews the expected returns from holding such investments, on an individual basis.
Financial Risk Management (continued)

SWIRE PACIFIC 2018 ANNUAL REPORT 101
Executive Directors
SWIRE, Merlin Bingham, aged 45, has been a Director of the Company since January 2009 and its Chairman since July 2018. He is also Chairman of John Swire & Sons (H.K.) Limited and Swire Properties Limited. He is also Deputy Chairman and a shareholder of John Swire & Sons Limited and a Director of Cathay Pacific Airways Limited. He joined the Swire group in 1997 and has worked with the group in Hong Kong, Australia, Mainland China and London. He is brother to S C Swire, a Non-Executive Director of the Company.
CHU, Kwok Leung Ivan, aged 57, has been a Director of the Company since March 2014. He is also Chairman of John Swire & Sons (China) Limited and a Director of John Swire & Sons (H.K.) Limited and Cathay Pacific Airways Limited. He is a member of the Chinese People’s Political Consultative Conference Shanghai Committee. He joined the Swire group in 1984 and has worked with the group in Hong Kong, Mainland China, Taiwan, Thailand and Australia.
COGMAN, David Peter, aged 45, has been a Director of the Company since August 2017. He is also a Director of John Swire & Sons (H.K.) Limited. He joined McKinsey & Company in 1997 and was a Partner in McKinsey’s Hong Kong office. He joined the Swire group in 2017.
LOW, Mei Shuen Michelle, aged 58, has been a Director of the Company since July 2017. She is the Finance Director of the Company. She is also a Director of John Swire & Sons (H.K.) Limited, Swire Properties Limited and Cathay Pacific Airways Limited. She joined the Swire group in 1987.
Non-Executive Directors
CUBBON, Martin, aged 61, has been a Director of the Company since November 2018. He is also a Director of John Swire & Sons Limited. He was employed by the Swire group in Hong Kong from 1986 to 2017 and was a Director of the Company from September 1998 to September 2017.
SWIRE, Samuel Compton, aged 39, has been a Director of the Company since January 2015. He is also Chairman of The China Navigation Company Pte. Ltd. He is also a Director and shareholder of John Swire & Sons Limited and a Director of Cathay Pacific Airways Limited. He joined the Swire group in 2003 and has worked with the group in Hong Kong, Singapore, Mainland China, Sri Lanka and London. He is brother to M B Swire, the Chairman of the Company.
Independent Non-Executive Directors
ETCHELLS, Paul Kenneth, aged 68, has been a Director of the Company since May 2017. He is also an Independent Non-Executive Director of Samsonite International S.A. and an adviser to Cassia Investments Limited. He was employed by the Swire group in Hong Kong from 1976 to 1998. He was employed by The Coca-Cola Company from July 1998 to June 2010 and worked in the USA, Mainland China and Hong Kong.
FRESHWATER, Timothy George, aged 74, has been a Director of the Company since January 2008. He is a Non-Executive Director of Savills plc.
LEE, Chien, aged 65, has been a Director of the Company since January 1993. He is a Non-Executive Director of Hysan Development Company Limited. He is a Council member of the Chinese University of Hong Kong and St. Paul’s Co-educational College and also a Trustee Emeritus of Stanford University and Director of Stanford Health Care.
LEE, Wai Mun Rose, JP, aged 66, has been a Director of the Company since July 2012. She is an Independent Non-Executive Director of CK Hutchison Holdings Limited and MTR Corporation Limited. She is also a Fellow of The Hong Kong Institute of Bankers. She is also a Board member and Deputy Chairman of the Executive Committee of the Community Chest of Hong Kong and a Board Member of the West Kowloon Cultural District Authority.
ORR, Gordon Robert Halyburton, aged 56, has been a Director of the Company since August 2015. He joined McKinsey & Company in 1986 and retired in 2015. He was a member of McKinsey’s global shareholder board from 2003 to 2015. He is an Independent Non-Executive Director of Lenovo Group Limited and Meituan Dianping and a Board member of the China-Britain Business Council.
Company Secretary
FU, Yat Hung David, aged 55, has been Company Secretary since January 2006. He joined the Swire group in 1988. He is a member of the Takeovers and Mergers Panel and the Takeovers Appeal Committee of the Securities and Futures Commission of Hong Kong. He is also a member of the Standing Committee on Company Law Reform and President of The Hong Kong Institute of Chartered Secretaries.
Notes:1. The Audit Committee comprises P K Etchells (committee chairman), C Lee and G R H Orr.2. The Remuneration Committee comprises C Lee (committee chairman), R W M Lee and S C Swire.3. All the Executive Directors, M Cubbon and S C Swire are employees of the John Swire & Sons
Limited group.
Directors and Officers

102
The Directors submit their report together with the audited financial statements for the year ended 31st December 2018, which are set out on pages 124 to 219.
Principal Activities
The principal activity of Swire Pacific Limited (the “Company”) is that of a holding company, and the principal activities of its principal subsidiary, joint venture and associated companies are shown on pages 206 to 217. An analysis of the Group’s performance for the year by reportable business segment and geographical area is set out in note 7 to the financial statements.
Consolidated Financial Statements
The consolidated Financial Statements incorporate the financial statements of the Company and its subsidiaries (collectively referred to as the “Group”) together with the Group’s interests in joint venture and associated companies. Details of the joint venture and associated companies are provided under note 19 to the financial statements.
Dividends
The Directors have declared second interim dividends of HK$1.80 per ‘A’ share and HK$0.36 per ‘B’ share which, together with the first interim dividends of HK$1.20 per ‘A’ share and HK$0.24 per ‘B’ share paid in October 2018, amount to full year dividends of HK$3.00 per ‘A’ share and HK$0.60 per ‘B’ share, compared to full year dividends of HK$2.10 per ‘A’ share and HK$0.42 per ‘B’ share in respect of 2017. The second interim dividends will be paid on 10th May 2019 to shareholders registered at the close of business on the record date, being Friday, 12th April 2019. Shares of the Company will be traded ex-dividend from Wednesday, 10th April 2019.
The Company’s dividend policy is to deliver sustainable growth in dividends and to pay out approximately half of our underlying profits in ordinary dividend over time.
Closure of Register of Members
The register of members will be closed on Friday, 12th April 2019, during which day no transfer of shares will be effected. In order to qualify for entitlement to the second interim dividends, all transfer forms accompanied by the relevant
Directors’ Report
share certificates must be lodged with the Company’s share registrars, Computershare Hong Kong Investor Services Limited, 17th Floor, Hopewell Centre, 183 Queen’s Road East, Hong Kong, for registration not later than 4:30 p.m. on Thursday, 11th April 2019.
To facilitate the processing of proxy voting for the annual general meeting to be held on 16th May 2019, the register of members will be closed from 14th May 2019 to 16th May 2019, both days inclusive, during which period no transfer of shares will be effected. In order to be entitled to attend and vote at the annual general meeting, all transfer forms accompanied by the relevant share certificates must be lodged with the Company’s share registrars, Computershare Hong Kong Investor Services Limited, 17th Floor, Hopewell Centre, 183 Queen’s Road East, Hong Kong, for registration not later than 4:30 p.m. on Friday, 10th May 2019.
Business Review
A fair review of the Group’s business, a description of the principal risks and uncertainties facing the Group, particulars of important events affecting the Group that have occurred since the end of the financial year and an indication of the likely future development of the Group’s business (including, in each case to the extent necessary for an understanding of the development, performance or position of the Group’s business, key performance indicators) are provided in the sections of this annual report headed Chairman’s Statement, 2018 Performance Review and Outlook, Financial Review, Financing and Risk Management and in the Notes to the Financial Statements. To the extent necessary for an understanding of the development, performance or position of the Group’s business, a discussion of the Group’s environmental policies and performance and an account of the Group’s key relationships with its employees, customers and suppliers and others that have a significant impact on the Group and on which the Group’s success depends are provided in the section of this annual report headed Sustainable Development Review. To the extent necessary for an understanding of the development, performance or position of the Group’s business, a discussion of the Group’s compliance with the relevant laws and regulations that have a significant impact on the Group is provided in the sections of this annual report headed Sustainable Development Review, Corporate Governance Report, Risk Management and Directors’ Report.

SWIRE PACIFIC 2018 ANNUAL REPORT 103
Reserves
Movements in the reserves of the Group and the Company during the year are set out in notes 34 and 36(b) respectively, to the financial statements.
Share Capital
During the year under review, the Company bought back no ‘A’ shares and 700,000 ‘B’ shares on The Stock Exchange of Hong Kong Limited (the “Stock Exchange”) at an aggregate cost of HK$8,642,510. The buy-back of these ‘B’ shares was made for the benefit of the Company and shareholders taking into account relevant factors and circumstances at the time. All the ‘B’ shares bought back were cancelled. Particulars of this share buy-back and details of the Company’s share capital are set out in note 33 to the financial statements.
Other than as stated above, there was no purchase, sale or redemption by the Company, or any of its subsidiaries, of the Company’s shares during the year and the Group has not adopted any share option scheme.
Accounting Policies
The principal accounting policies of the Group are set out in the relevant Notes to the Financial Statements (if they relate to a particular item) and in the section of this annual report headed Principal Accounting Policies.
Auditors
PricewaterhouseCoopers retire and, being eligible, offer themselves for re-appointment. A resolution for the re-appointment of PricewaterhouseCoopers as auditors of the Company is to be proposed at the forthcoming annual general meeting.
Financial Review
A review of the consolidated results, financial position and cash flows of the Group is shown in the section of this annual report headed Financial Review. A ten-year summary of the financial performance of the Group is shown in the section of this annual report headed Summary of Past Performance.
Corporate Governance
The Company complied with all the code provisions set out in the Corporate Governance Code (“CG Code”) contained in Appendix 14 to the Listing Rules throughout the year covered by the annual report with the following exceptions which it believes do not benefit shareholders:
– Sections A.5.1 to A.5.4 of the CG Code in respect of the establishment, terms of reference and resources of a nomination committee. The Board has considered the merits of establishing a nomination committee but has concluded that it is in the best interests of the Company and potential new appointees that the Board collectively reviews and approves the appointment of any new Director as this allows a more informed and balanced decision to be made by the Board as to suitability for the role.
Details of the Company’s corporate governance practices are set out in the section of this annual report headed Corporate Governance Report.
Environmental, Social and Governance
The Company has complied or will comply with all the applicable provisions set out in the Environmental, Social and Governance Reporting Guide contained in Appendix 27 to the Listing Rules for the year covered by the annual report.
Donations
During the year, the Group made donations for charitable purposes of HK$30 million and donations towards various scholarships of HK$2 million.
Fixed Assets
For details of movements in fixed assets refer to notes 14 and 15 to the financial statements.
The annual valuation of the Group’s investment property portfolio, whether completed or in the course of development, was carried out by professionally qualified valuers (95% by value having been valued by Cushman & Wakefield Limited and 2% by value having been valued by another independent valuer) on the basis of market value at 31st December 2018. This valuation resulted in an increase of HK$19,378 million in the carrying value of the investment property portfolio.
A schedule of the principal properties of the Group and its joint venture and associated companies is given in the section of this annual report headed Schedule of Principal Group Properties.

DIRECTORS’ REPORT104
Borrowings
For details of the Group’s borrowings refer to the section of this annual report headed Financing.
Interest
For details of the amount of interest capitalised by the Group refer to page 83.
Major Customers and Suppliers
During the year, less than 30% of the Group’s sales and less than 30% of the Group’s purchases were attributable to the Group’s five largest customers and suppliers respectively.
Directors
M Cubbon was appointed as a Director with effect from 1st November 2018. All the other present Directors of the Company whose names are listed in the section of this annual report headed Directors and Officers served throughout the calendar year 2018. With effect from 1st July 2018, J R Slosar retired as Chairman and an Executive Director and M B Swire was elected as Chairman and re-designated from a Non-Executive Director to an Executive Director.
Independence ConfirmationThe Company has received from all of its Independent Non-Executive Directors (listed in the section of this annual report headed Directors and Officers) confirmation of their independence pursuant to Listing Rule 3.13 and considers all of them to be independent.
Term of AppointmentArticle 93 of the Company’s Articles of Association provides for all Directors to retire at the third annual general meeting following their election by ordinary resolution. In accordance therewith, R W M Lee and G R H Orr retire this year and, being eligible, offer themselves for re-election. M Cubbon, having been appointed to the Board under Article 91 since the last annual general meeting, also retires this year and offers himself for election.
Each of the Directors has entered into a letter of appointment, which constitutes a service contract, with the Company for a term of up to three years until retirement under Article 91 or Article 93 of the Articles of Association of the Company, which will be renewed for a term of three years upon each election or re-election. No Director has a service contract with the Company which is not determinable by the employer within one year without payment of compensation (other than statutory compensation).
Fees and EmolumentsFull details of Directors’ fees and emoluments are set out in note 8 to the financial statements.
Directors’ fees paid to the Independent Non-Executive Directors during the year totalled HK$4.8 million. They received no other emoluments from the Group.
Directors’ Interests
At 31st December 2018, the register maintained under Section 352 of the Securities and Futures Ordinance (“SFO”) showed that Directors held the following interests in the shares of Swire Pacific Limited and its associated corporations (within the meaning of Part XV of the SFO), John Swire & Sons Limited, Swire Properties Limited and Cathay Pacific Airways Limited:
Capacity
Total no.of shares
Percentage of voting shares
(comprised in the class)
(%) Note
Beneficial interest TrustinterestPersonal Family
Swire Pacific Limited
‘A’ shares
P K Etchells – 12,000 – 12,000 0.0013
T G Freshwater 41,000 – – 41,000 0.0045
G R H Orr 9,000 – – 9,000 0.0010
‘B’ shares
M Cubbon 100,000 – – 100,000 0.0034
C Lee 1,300,000 – 21,605,000 22,905,000 0.7681 1
M B Swire – – 1,353,585 1,353,585 0.0454 2
S C Swire – – 1,353,585 1,353,585 0.0454 2

SWIRE PACIFIC 2018 ANNUAL REPORT 105
Capacity
Total no.of shares
Percentage of issued share
capital (comprised in the class)
(%) Note
Beneficial interest TrustinterestPersonal Family
John Swire & Sons Limited
Ordinary Shares of £1
M B Swire 2,077,523 130,000 18,734,220 20,941,743 20.94 2
S C Swire 1,354,305 – 22,324,144 23,678,449 23.68 2
8% Cum. Preference Shares of £1
M B Swire 2,769,489 – 16,010,222 18,779,711 20.87 2
S C Swire 1,102,323 – 19,490,173 20,592,496 22.88 2
Capacity
Total no.of shares
Percentage of voting shares
(%) Note
Beneficial interest TrustinterestPersonal Family
Swire Properties Limited
Ordinary Shares
P K Etchells – 8,400 – 8,400 0.00014
T G Freshwater 28,700 – – 28,700 0.00049
C Lee 200,000 – 3,024,700 3,224,700 0.05512 1
Capacity
Total no.of shares
Percentage of voting shares
(%) Note
Beneficial interest TrustinterestPersonal Family
Cathay Pacific Airways Limited
Ordinary Shares
M M S Low 1,000 – – 1,000 0.00003
Notes:1. All the shares held by C Lee under “Trust interest” are held by him as beneficiary of trusts.2. M B Swire and S C Swire are trustees and/or potential beneficiaries of trusts which held 7,410,884 ordinary shares and 11,000,808 ordinary shares respectively and 5,797,820 preference shares and
9,277,771 preference shares respectively in John Swire & Sons Limited and 1,353,585 ‘B’ shares in Swire Pacific Limited included under “Trust interest” and do not have any beneficial interest in those shares.
Other than as stated above, no Director or Chief Executive of the Company had any interest or short position, whether beneficial or non-beneficial, in the shares or underlying shares and debentures of the Company or any of its associated corporations (within the meaning of Part XV of the SFO).
Neither during nor prior to the year under review has any right been granted to, or exercised by, any Director of the Company, or to or by the spouse or minor child of any Director, to subscribe for shares, warrants or debentures of the Company.
Other than as stated in this report, no transaction, arrangement or contract of significance to which the Group was a party and in which a Director or an entity connected with a Director is or was materially interested, either directly or indirectly, subsisted during or at the end of the year.
At no time during the year was the Company, or any of its associated corporations, a party to any arrangements to enable
the Directors of the Company to acquire benefits by means of the acquisition of shares in or debentures of the Company or any other body corporate.
Directors’ Interests in Competing Businesses
None of the Directors or their respective close associates has any competing interests which need to be disclosed pursuant to Rule 8.10 of the Listing Rules.
Directors of Subsidiaries
The names of all directors who have served on the boards of the subsidiaries of the Company during the year ended 31st December 2018 or during the period from 1st January 2019 to the date of this Report are kept at the Company’s registered office and made available for inspection by the members of the Company in accordance with Section 390(6) of the Companies Ordinance (Cap. 622 of the Laws of Hong Kong).

DIRECTORS’ REPORT106
Permitted Indemnity
Subject to the Companies Ordinance (Cap. 622 of the Laws of Hong Kong), every Director is entitled under the Company’s Articles of Association to be indemnified out of the assets of the Company against all costs, charges, expenses, losses and liabilities which he or she may sustain or incur in or about the execution or discharge of his or her duties and/or the exercise of his or her powers and/or otherwise in relation to or in connection with his or her duties, powers or office. To the extent permitted by such Ordinance, the Company has taken out insurance against the liability and costs associated with defending any proceedings which may be brought against directors of companies in the Group.
Substantial Shareholders’ and Other Interests
The register of interests in shares and short positions maintained under Section 336 of the SFO shows that at 31st December 2018 the Company had been notified of the following interests in the shares of the Company held by substantial shareholders and other persons:
Long position ‘A’ shares
Percentage of voting shares
(comprised in the class)
(%) ‘B’ shares
Percentage of voting shares
(comprised in the class)
(%) Note
John Swire & Sons Limited 412,558,720 45.58 2,074,008,782 69.55 1
Note:1. John Swire & Sons Limited is deemed to be interested in a total of 412,558,720 ‘A’ shares and 2,074,008,782 ‘B’ shares of the Company at 31st December 2018, comprising:
(a) 885,861 ‘A’ shares and 13,367,962 ‘B’ shares held directly;(b) 12,632,302 ‘A’ shares and 37,597,019 ‘B’ shares held directly by its wholly-owned subsidiary Taikoo Limited;(c) 39,580,357 ‘A’ shares and 1,482,779,222 ‘B’ shares held directly by its wholly-owned subsidiary John Swire & Sons (H.K.) Limited; and(d) the following shares held directly by wholly-owned subsidiaries of John Swire & Sons (H.K.) Limited: 322,603,700 ‘A’ shares and 117,747,500 ‘B’ shares held by Elham Limited, 2,055,000 ‘B’ shares held
by Canterbury Holdings Limited, 9,140,000 ‘A’ shares and 321,240,444 ‘B’ shares held by Shrewsbury Holdings Limited, 99,221,635 ‘B’ shares held by Tai-Koo Limited and 27,716,500 ‘A’ shares held by Waltham Limited.
At 31st December 2018, the Swire group was interested in 55.10% of the equity of the Company and controlled 63.97% of the voting rights attached to shares in the Company.
Public Float
Listing Rule 8.08(1) of the Listing Rules requires that at least 25% of an issuer’s total number of issued shares must at all times be held by the public. The Company has been granted by the Stock Exchange a waiver from strict compliance with Listing Rule 8.08(1) such that the Company’s public float percentage continues to be calculated based on its issued share capital as if its shares still had nominal values. From information that is publicly available to the Company and within the knowledge of its Directors at the date of this report, at least 25% of the Company’s total issued share capital (calculated as described in the previous sentence) is held by the public.
Continuing Connected Transactions
There are agreements for services (“Services Agreements”), in respect of which John Swire & Sons (H.K.) Limited (“JSSHK”), a wholly-owned subsidiary of John Swire & Sons Limited (“Swire”), provided to the Company and some of its subsidiary and associated companies advice and expertise of the directors and senior officers of the Swire group, full or part time services of members of the staff of the Swire group, other administrative and similar services and such other services as may be agreed from time to time, and procured for the Company and its subsidiary, joint venture and associated companies the use of relevant trademarks owned by Swire.
In return for these services, JSSHK receives annual service fees calculated (A) in the case of the Company, as 2.5% of the dividends receivable from associates and joint ventures of the Company, where there are no agreements for services with such companies, and (B) in the case of its subsidiaries and associates

SWIRE PACIFIC 2018 ANNUAL REPORT 107
with such agreements, as 2.5% of their relevant consolidated profits before taxation and non-controlling interests after certain adjustments. The fees for each year are payable in cash in arrear in two instalments, an interim payment by the end of October and a final payment by the end of April of the following year, adjusted to take account of the interim payment. The Company also reimburses the Swire group at cost for all the expenses incurred in the provision of the services.
The Services Agreements, which took effect from 1st January 2005 and were renewed on 1st October 2007, 1st October 2010 and 14th November 2013, were renewed again on 1st October 2016 for a term of three years from 1st January 2017 to 31st December 2019. They are renewable for successive periods of three years thereafter unless either party to them gives to the other notice of termination of not less than three months expiring on any 31st December.
Under the Services Agreement between JSSHK and the Company, JSSHK is obliged to procure for the Company and its subsidiaries, associates and joint ventures the use of relevant trademarks owned by Swire. No fee is payable in consideration of such procuration obligation or such use. This procuration obligation would fall away if the Services Agreement between JSSHK and the Company were terminated or not renewed.
Particulars of the fees paid and the expenses reimbursed for the year ended 31st December 2018 are given in note 41 to the financial statements.
The Company, JSSHK and Swire Properties Limited (“Swire Properties”) entered into a Tenancy Framework Agreement (“Tenancy Framework Agreement”) on 14th August 2014 to govern existing and future tenancy agreements between members of the Group, members of the JSSHK group and members of the Swire Properties group. The Tenancy Framework Agreement, which took effect from 1st January 2014 and was renewed on 1st October 2015, was renewed again on 1st October 2018 for a term of three years from 1st January 2019 to 31st December 2021. It is renewable for successive periods of three years thereafter unless any party to it gives to the other parties notice of termination of not less than three months expiring on any 31st December. Pursuant to the Tenancy Framework Agreement, members of the Group, members of the JSSHK group and members of the Swire Properties group will enter into tenancy agreements from time to time on normal commercial terms based on prevailing market rentals.
Particulars of the aggregate rentals payable to the Group under tenancies subject to the Tenancy Framework Agreement for the year ended 31st December 2018 are given in note 41 to the financial statements.
The Swire group was interested in 55.10% of the equity of the Company and controlled 63.97% of the voting rights attached to shares in the Company at 31st December 2018. JSSHK, as a wholly-owned subsidiary of Swire, is therefore a connected person of the Company under the Listing Rules. The transactions under the Services Agreements and the Tenancy Framework Agreement are continuing connected transactions in respect of which announcements dated 19th August 2016 and 10th May 2018 respectively were published.
As directors and/or employees of the Swire group, I K L Chu, D P Cogman, M Cubbon and M M S Low are interested in the Services Agreements and the Tenancy Framework Agreement. Before he ceased to be a director of the Company, J R Slosar was so interested as a director and an employee of the Swire group. M B Swire and S C Swire are so interested as shareholders, directors and employees of Swire.
The Independent Non-Executive Directors of the Company, who are not interested in any connected transactions with the Group, have reviewed and confirmed that the continuing connected transactions as set out above have been entered into by the Group in the ordinary and usual course of business of the Group, on normal commercial terms or better, and according to the agreements governing them on terms that are fair and reasonable and in the interests of the shareholders of the Company as a whole.
The auditors of the Company have also reviewed these transactions and confirmed to the Board that nothing has come to their attention that causes them to believe that they have not been approved by the Board of the Company; that they were not, in all material respects, in accordance with the pricing policies of the Group if the transactions involve the provision of goods or services by the Group; that they were not entered into, in all material respects, in accordance with the relevant agreements governing the transactions; and that the relevant annual caps have been exceeded.

DIRECTORS’ REPORT108
Discloseable Transaction
Swire Properties (as the seller’s guarantor), Improve Fame Limited (as the seller), Henglilong Investments Limited (as the purchaser) and Mr. Chen Chang Wei (as the purchaser’s guarantor) entered into a sale and purchase agreement on 15th June 2018 for the sale of the seller’s 100% interest in Thrive Power Limited to the purchaser for a total cash consideration of HK$15,000 million, subject to certain adjustments at completion. Thrive Power Limited is the immediate holding company of a wholly-owned property holding subsidiary of Swire Properties which is the owner of its interests in the buildings known as Cityplaza Three and Cityplaza Four located at Taikoo Shing, Hong Kong. The transaction was a discloseable transaction under the Listing Rules, in respect of which announcements dated 15th June 2018 and 2nd November 2018 were published. The transaction is expected to be completed on or before 11th April 2019.
Connected Transaction
On 8th April 2018, Redhill Properties Limited, a subsidiary of the Company, and J R Slosar, who was the Chairman of the Board and an Executive Director of the Company, entered into a provisional agreement for the sale by Redhill Properties Limited and the purchase by J R Slosar of a residential unit at Flat B on the 1st Floor, Eredine, No. 38, Mount Kellett Road, Hong Kong (together with car park 1B and certain private outdoor space) for a cash consideration of HK$120,000,000. As J R Slosar was a Director of the Company, the entry into the provisional agreement for sale and purchase constituted a connected transaction of the Company, in respect of which an announcement dated 9th April 2018 was published.
Privatisation of Hong Kong Aircraft Engineering Company Limited
On 10th June 2018, Swire Pacific and HAECO jointly announced that on 8th June 2018, Swire Pacific requested the board of directors of HAECO to put forward to the holders of HAECO shares other than those held by Swire Pacific and its subsidiaries (“Scheme Shares”) a proposal for the privatisation of HAECO by Swire Pacific by way of a scheme of arrangement (the “Scheme”) under section 673 of the Companies Ordinance (Cap. 622). The cancellation price was HK$71.81 per Scheme Share. The composite scheme document of Swire Pacific and HAECO in relation to the Scheme was despatched on 14th September 2018 to the shareholders of HAECO. On 10th October 2018, a
resolution to approve the Scheme was approved by the holders of Scheme Shares at a meeting convened by the court and a special resolution to give effect to the Scheme, including the reduction of the share capital of HAECO, was approved by the shareholders of HAECO at a general meeting. On 28th November 2018, the Scheme was sanctioned without modification by the High Court and the reduction of the share capital of HAECO effected by the Scheme was also confirmed by the High Court. The Scheme became effective on 29th November 2018 and the listing of HAECO shares (stock code: 44) on the Hong Kong Stock Exchange was withdrawn at 9:00 a.m. on 29th November 2018.
The total amount payable by Swire Pacific to the holders of the Scheme Shares for the cancellation of a total of 41,601,213 Scheme Shares at HK$71.81 per Scheme Share was approximately HK$2,987 million. HAECO applied the credit arising in its books of account as a result of the reduction of share capital in paying up in full 41,601,213 new HAECO shares which were allotted and issued, credited as fully paid, to Swire Pacific on 29th November 2018, increasing Swire Pacific’s shareholding from 124,723,637 HAECO shares (representing a 74.99% equity interest) to 166,324,850 HAECO shares (representing a 100% equity interest). HAECO became a wholly-owned subsidiary of Swire Pacific with effect from 29th November 2018.
On 31st December 2018, the issued share capital of HAECO totalling HK$185,193,750.00 divided into 166,324,850 ordinary shares was converted into HK$185,193,750.00 divided into 1,000,000 ordinary shares (which are wholly-owned by the Company) pursuant to Section 170(2)(e) of the Companies Ordinance and HAECO became a private company instead of a public company.
On behalf of the Board
Merlin SwireChairmanHong Kong, 14th March 2019

SWIRE PACIFIC 2018 ANNUAL REPORT 109
Sustainable Development Review
At Swire Pacific, we believe that business has an important role to play in creating a better, and more prosperous future. We view sustainability as a key strategic imperative for the Group and not as a cost or just a set of good intentions. Sustainability helps to fulfil our aim to create long-term value for our shareholders as it represents an opportunity for innovation, improved efficiency and a foundation for building sustained growth.
We look for ways to make our businesses more sustainable and to work with others who share our sustainability values. Our aim is to integrate economic, environmental and social sustainability into our business and management practices.
Governance
Our Board, led by its Chairman, is ultimately accountable for sustainability matters. The Group Risk Management Committee (GRMC), which has eight members and is chaired by the Finance Director, oversees all the risks to which the Group is subject and reports to the Board via the Audit Committee. Information on sustainability risks and performance is reported to the GRMC by the Swire Group Sustainability Committee (SGSC) and by its working groups. Division heads meet twice a year on sustainability matters under the chairmanship of the Chairman of the Board.
The Sustainable Development Office (which reports, through the Head of Sustainable Development, to a member of the Board) is responsible for setting sustainable development policy, for monitoring the implementation of policy and for implementing SwireTHRIVE, the Group’s sustainability strategy. Policies are intended to reflect key sustainability trends and to address major risks and opportunities in sustainability. The Sustainable Development Office coordinates the SGSC and its working groups. The SGSC and the working groups enable operating companies to exchange information and best practices with a view to developing specific policy recommendations, improving efficiency, reducing costs and engaging with staff.
Risk Management
Effective risk management is key to ensuring the continued long-term viability of the Group.
Swire Pacific and its operating companies have an Enterprise Risk Management (ERM) system, which is intended to identify, assess, monitor and manage risks. The Board of Directors and the management of each division are responsible for identifying and analysing risks (including those relating to climate change and to sustainability more generally) underlying the achievement of business objectives and for determining how such risks should be managed and mitigated.
Environment
If our business is to thrive in the long-term, we need to take an active role in protecting the environment upon which we
Property 215 (1.1%)
Aviation 18,587 (96.2%)
Beverages 356 (1.8%)
Marine Services 124 (0.7%)
Trading & Industrial 43 (0.2%)
Thousand tonnes of CO2e
Total GHG Emissions by Division
Notes: 1. Swire Pacific tracks its energy consumption and GHG emissions through utility bills and
purchase or service records. When such records are not yet available, consumption is captured through direct measurements (e.g. readings of submeters). These figures are updated upon availability of the above records. The figures for 2017 have been updated to reflect such availability.
2. Totals may not be the exact sum of numbers shown here due to rounding.
depend. In 2016, the 200th anniversary of Swire’s foundation, we formulated SwireTHRIVE, our group sustainability strategy, with a view to securing long-term business success in an era of major change.
SwireTHRIVE focuses on carbon, waste, water, sustainable materials, biodiversity and climate resilience. It concentrates on these environmental matters because our success (and that of the communities in which we operate) depends on a thriving natural environment. But we intend to extend SwireTHRIVE so that it incorporates appropriate social elements of sustainability.
The Swire Pacific sustainable development fund offers financial support to operating companies for projects which can deliver long term sustainability benefits, but which cannot be justified by reference to our cost of capital targets.
Greenhouse Gas EmissionsWe aim to reduce our emissions in line with international carbon reduction goals. In 2017, operating companies set targets for reducing carbon intensity. These are intended to reduce the Group’s carbon intensity up to 2020 by 8-10% by comparison with a 2015 frozen efficiency baseline (a frozen efficiency baseline being one from which performance is projected with the assumption of no improvement in current efficiencies). Achieving these improvements in performance will depend on innovation and new technologies. In 2018, our greenhouse gas emissions were 19.3 million tonnes of CO2e, compared with 19.09 million tonnes of CO2e in 2017 (revised basis). Cathay Pacific used more fuel because it operated more flights. In the Beverages Division, 11 additional bottling plants were included during the reporting period.

SUSTAINABLE DEVELOPMENT REVIEW110
0
700
600
500
400
300
200
100
2014 20172015 20182016
Property
Marine Services
Aviation
Trading & Industrial
Beverages
Thousand tonnes of CO2e
The Aviation Division accounted for 96.2% of our total emissions in 2018. Cathay Pacific has set a target of improving its fuel efficiency on average by 2% per annum up to 2020 and achieving carbon neutral growth thereafter. This exceeds the agreed industry target of 1.5%. Its strategy for achieving this follows IATA’s four pillar strategy (see: https://www.iata.org/policy/environment/pages/climate-change.aspx). In 2018, Cathay Pacific increased fuel efficiency as measured by tonnes of CO2 per revenue tonne kilometre by 1.99%, principally by using more fuel-efficient aircraft. Eight Airbus A350-1000 aircraft were delivered in 2018. These aircraft are 25% more fuel efficient than the existing wide-body fleet.
Cathay Pacific is a member of the Round Table on Sustainable Biomaterials and of the Sustainable Aviation Fuel Users Group Asia. Cathay Pacific has a minority stake in Fulcrum BioEnergy Inc., a company which converts municipal solid waste into sustainable aviation fuel. Cathay Pacific encourages the use of biofuels in the engines of its aircraft, vehicles and vessels. All of Cathay Pacific’s Airbus A350 delivery flights used jet fuel that contains a blend of biofuel. A total of 30 Airbus A350 aircraft had been delivered by 31st December 2018.
Carbon offsets are purchased by Cathay Pacific. Cathay Pacific’s FLY greener programme offset 15,466 tonnes of CO2 (tCO2), by investing in offsets generated by Gold Standard certified offset projects, including biogas digesters in Vietnam and efficient cook stoves in India.
EnergyElectricity consumption represents our second largest source of greenhouse gas emissions. In 2018, our indirect emissions (which are primarily derived from using electricity) were 667.8 thousand tonnes of CO2e, a 7.25% increase from 2017 (revised basis). In the Beverages Division, 11 additional bottling plants were included during the reporting period.
Making our buildings and operations more energy efficient is a priority. Our sustainable building design policy requires new and substantially renovated buildings to obtain the highest or, as a minimum, the second highest international or local building environmental certification.
Swire Properties designs, constructs and operates properties with a view to reducing energy use. At the end of 2018, buildings accounting for 92.2% of its total property portfolio had been certified or provisionally certified as green buildings under BEAM, BEAM Plus, LEED, China Three Star and Green Mark independent rating systems.
Operating companies are encouraged to reduce energy use and to set energy efficiency targets. Since 2008, Swire Properties has reduced its annual energy consumption in its Hong Kong portfolio by 56.9 million kWh, which is in line with its 2020 target. In its Mainland China portfolio it has reduced its annual
energy consumption by 17.5 million kWh from the consumption which would have occurred if no changes had been made, putting it on track to meet its 2020 target.
Swire Properties offers free energy audits to tenants. Since 2008, free energy audits have covered 566,700 m2 of commercial space, identifying potential annual energy savings of 7.8 million kWh.
We encourage the use of renewable energy in our operations. 12.87 million kWh of electricity was generated from renewable energy sources at Swire Properties, Swire Beverages and HAECO Xiamen in 2018. The Swire Pacific sustainable development fund is available to support suitable renewable projects.
Each of our divisions has operations covered by the ISO 14001 environmental management system.
Swire Beverages, HAECO and Swire Properties explore energy efficiency and management under a contractual arrangement with Tsinghua University.
Water Our businesses depend on water. Some of them use it extensively. Water stress can affect our suppliers as well as the communities and biodiversity of the areas in which we operate. We aim to use water responsibly and sustainably, and to protect our water sources. We abide by all local wastewater treatment laws, and in many cases exceed them. By doing this, we protect our own resources and help the communities in which we operate to have access to safe, good quality water.
Indirect GHG Emissions by Division
Notes: 1. Swire Pacific tracks its energy consumption and GHG emissions through utility bills and
purchase or service records. When such records are not yet available, consumption is captured through direct measurements (e.g. readings of submeters). These figures are updated upon availability of the above records. The figures for 2017 have been updated to reflect such availability.
2. Totals may not be the exact sum of numbers shown here due to rounding.

SWIRE PACIFIC 2018 ANNUAL REPORT 111
0
2.5
2.0
1.5
1.0
0.5
2014 20172015 20182016
No. of injuries per 100 full-time equivalent employees
0
18,000
15,000
12,000
9,000
6,000
3,000
2014 20172015 20182016
Property
Marine Services
Aviation
Trading & Industrial
Beverages
Thousand cubic metres
In 2018, we consumed 17.13 million cubic metres of water, an increase from 12.45 million cubic metres in 2017 (revised basis). In the Beverages Division, 11 additional bottling plants were included during the reporting period. We set water intensity targets and encourage operating companies to use water more efficiently. We aim to reduce our water consumption by 3-4% from its 2015 baseline.
Using water to make beverages and maintain hygiene, the Beverages Division accounts for 78.5% of our water use. Swire Beverages has increased its water efficiency by 4% since 2010. In 2018, water intensity at the Beverages Division, which reflects the amount of water needed to produce a litre of beverage product, decreased by 2% to 1.74. This was due to clean-in-place activities at the Hong Kong bottling plant, water metering and the replacement and repair of water piping in Mainland China bottling plants.
As part of The Coca-Cola system, Swire Beverages aims to return to the environment water in amounts equivalent to those which it uses in its products by 2020. In 2017, the entire Coca-Cola System successfully replenished 155% (257 billion litres) of the water used in all beverages sold globally.
Health and Safety
Protecting the health and safety of our workforce is fundamental to our businesses achieving long-term success and to upholding our commitment to sustainability. Recognising our responsibility to identify and mitigate health and safety risks,
we aim to conduct our operations in a manner that safeguards the health and safety of our employees, contractors, suppliers, customers, and visitors to our business premises and the communities in which we operate. We aim to improve our health and safety management systems continuously with a view to causing zero harm.
Our PerformanceIn 2018, the number of injuries per 100 full-time equivalent employees (lost time injury rate or LTIR) increased to 1.79 from 1.73 in 2017. This represents a 3.5% increase from 2017. This is mainly due to increased LTIR at the Cathay Pacific group and at Swire Beverages. Total LTIR has reduced by 12% over the last five years.
Regrettably there were two fatalities from among our employees in 2018. These occurred in Hong Kong when a commuter bus contracted by the Cathay Pacific group collided with a stationary vehicle.
Towards Zero HarmWe aim through training, learning and transparent reporting continually to improve our health and safety performance and culture. In 2018:
– Swire Properties migrated its safety management systems in Hong Kong to the ISO 45001:2018 standard (being one of the first companies in Hong Kong to achieve this standard).
– Cathay Pacific, HAECO and Swire Coca-Cola USA undertook manual handling campaigns intended to reduce injuries through training and the use of proper lifting techniques.
– HAECO adopted improved safety risk analysis techniques and provided relevant training to health and safety representatives.
– Swire Beverages provided defensive driving training and promoted safe driving behaviour in Mainland China.
– SPO published get home safe rules and communicated them to all staff.
Lost Time Injury RateWater Consumption by Division
Notes: 1. Swire Pacific tracks its water consumption through utility bills and purchase or service
records. When such records are not yet available, consumption is captured through direct measurements (e.g. readings of submeters). These figures are updated upon availability of the above records. The figures for 2017 have been updated to reflect such availability.
2. Totals may not be the exact sum of numbers shown here due to rounding.

SUSTAINABLE DEVELOPMENT REVIEW112
34,79357,954
Hong Kong & Macau 41,055 (44.27%)
Mainland China 32,567 (35.11%)
Taiwan 2,781 (3.00%)
USA 10,409 (11.22%)
Others 5,935 (6.40%)
Employee Numbers by Region
Staff RetentionWe offer competitive remuneration and benefits. Decisions on remuneration are made with regard to roles and responsibilities, individual and business performance, and conditions in the job markets and economies in which we operate. We communicate with staff through our intranet, newsletters, surveys and staff forums. The staff turnover rate (which was 18.5% in 2018) is monitored with a view to identifying and managing problems as they arise. A 24-hour counselling and consultation service is available for employees.
Training and EducationWe need an agile and well-trained workforce in order to respond to changes in the business environment and increased competition. Through our training and development programmes, we aim to attract and retain outstanding people and to enable them to realise their career goals. We develop our people by on-the-job learning, mentoring or coaching, classroom training and online learning.
Ethos International, Swire’s in-house leadership development company, provides learning and development programmes for staff. Managers attend business management and executive programmes at INSEAD and Stanford. Ethos’ training programmes emphasise sustainability and contribute to the development of a strong corporate culture and a style of leadership that is consistent with Swire values.
The annual Swire Pacific health and safety conference took place in November 2018. It was attended by 80 representatives of Group companies from Hong Kong, Mainland China, Taiwan, Singapore and the USA. Presentations and discussion topics included health and wellbeing, big data analysis, risk perception and safe behaviour.
Staff
Swire Pacific places significant emphasis on its people. Our success depends critically on our employees. By providing an environment in which all employees are treated fairly and with respect, we aim to be an employer of choice that attracts the most talented employees. We aim to recruit the best people, to offer competitive remuneration and benefits, to have a diverse workforce that represents the diversity of the communities in which we operate and to provide training to enable staff to realise their potential.
Employee ProfileAt the end of 2018, the Swire Pacific Group (including joint venture and associated companies) employed approximately 93,000 staff, an increase of 0.8% from the end of 2017. Most staff are based in Hong Kong and Mainland China.
Diversity and InclusionWe are committed to creating an inclusive and supportive working environment for all our people regardless of their age, gender, gender identity, sexual orientation, relationship, family status, disability, race, ethnicity, nationality, religious or political beliefs. We believe in creating an environment where people feel comfortable at work and able to realise their full potential.
Our Diversity and Inclusion Steering Committee and our Swire Women’s Network help us to accomplish our aim of creating a diverse and inclusive workforce. Our Diversity and Inclusion Policy can be viewed at https://www.swirepacific.com/en/sd/policy/diversity_inclusion.pdf. In 2018 the percentage of women on the Swire Pacific Board was 18.2%.
Consistently with our Code of Conduct, we do not tolerate unlawful discrimination or harassment in the workplace. Employees are required to be fully compliant with applicable employment and other laws. We provide training in order to assist staff to understand their rights and obligations under Hong Kong anti-discrimination legislation.
Code of ConductOur corporate code of conduct, is publicly available and can be viewed at https://www.swirepacific.com/en/governance/ code.php.
Employee Breakdown by Gender
* Employee numbers are ascertained by reference to the relevant GRI reporting requirement.

SWIRE PACIFIC 2018 ANNUAL REPORT 113
Managing for the FutureThe Swire Leadership Programme accepts high-calibre graduates every year with a view to developing their professionalism for a long-term career with the Group. Over the following 12 years we coach and mentor them, send them on courses and plan the steps in their careers.
Our summer internship programme gives exceptional students the opportunity to gain experience of working at Swire. Interns first learn about what we do and our values. They are then posted to work on business projects at our operating companies.
Working with Others
We aim to promote inclusive, ethical and sustainable procurement practices. By using our substantial purchasing power to this effect, we expect – by creating long term value for those with whom we do business and the communities in which we operate – to create long-term value for our shareholders.
We have over one thousand suppliers. They supply goods and services which include ships, aircraft, fuel, sugarcane, auditing, office supplies and uniforms. We seek to work with suppliers which have high standards. We share information and best practices with suppliers and encourage them to adopt appropriate sustainability and other standards.
We use our purchasing power and our close relationships with suppliers in ways designed best to meet the needs of our businesses and customers.
Our operating companies are responsible for their own supply chain management. Support is provided by our supply chain sustainability working group.
Sustainable procurement helps to manage risks, improve efficiencies and reduce costs. Our sustainable procurement policy commits operating companies where possible to purchasing products which do not adversely affect the environment. Our guidelines on doing so are in accordance with international standards.
We aim to procure services from those who are accountable for their workplace practices.
It is our policy to comply with all applicable laws and regulations relating to procurement. Our Supplier Corporate Social Responsibility Code of Conduct deals with regulatory compliance, forced labour, child labour, health and safety, environmental issues, compensation and working hours, human rights, subcontractor management, ethics and reporting. Suppliers’ compliance with the code is assessed.
Operating companies use a risk matrix based on the above supplier code of conduct, with a view to managing and mitigating risks. The results determine which suppliers need to be audited in order to ensure compliance.
Community Involvement
At Swire Pacific we understand the importance to our businesses of the economic, social and environmental health of the communities in which we operate. We believe that, when the communities in which we operate prosper, so do our businesses. We concentrate on doing things where we believe we can make a difference.
We support the communities in which we operate directly through the community programmes of our businesses and through the Swire Group Charitable Trust (the Trust). The Trust focuses on education, marine conservation and the arts in Hong Kong. At the end of 2018, the Trust had 18 programmes in operation. During 2018, the Trust distributed over HK$36 million.
More information on the activities of the Trust and on the community activities of our operating companies can be found at https://www.swirepacific.com/en/sd/community.php.
Reporting and Recognition
We will report in detail on our sustainability performance in a separate sustainability report which will be published in July 2019. Our sustainability report will be prepared with reference to the Global Reporting Initiative’s (GRI) standards core option and will follow the ESG Reporting Guide for listed companies issued by Hong Kong Exchanges and Clearing Limited. This report together with separate reports from our major operating companies will be available at https://www.swirepacific.com/en/sd/sd_reports.php.
Deloitte Touche Tohmatsu have been engaged to provide a limited assurance report in respect of selected sustainability information of Swire Pacific Limited for the year ended 31st December 2018. Further information on the scope and boundaries of the sustainability data in this report can be found along with the full text of the limited assurance report from Deloitte Touche Tohmatsu at https://www.swirepacific.com/en/sd/sd_reports.php.
We report to the Carbon Disclosure Project (CDP). In 2018 Swire Pacific and the HAECO group received a CDP climate change programme score of C. Cathay Pacific received a score of B.
Swire Pacific Limited is included in the Dow Jones Sustainability Asia Pacific Index, the FTSE4Good Index and the Hang Seng Corporate Sustainability Index and in the MSCI ESG Leaders, ESG Universal and SRI Indices. Swire Properties and Cathay Pacific are included in the FTSE4Good Index. In 2018, Swire Properties was the only listed company from Hong Kong and Mainland China to be included in the Dow Jones Sustainability World Index.

SUSTAINABLE DEVELOPMENT REVIEW114
Notes: 1. Totals may not be the exact sum of numbers shown here due to rounding.2. For the Cathay Pacific group, only CO₂ emissions for aviation turbine fuel are reported as there is no scientific consensus on the global warming effect of other emissions. Cathay Pacific monitors
developments in these areas of atmospheric science, including studies from the UKs OMEGA aviation and environment project and the Institute of Atmospheric Physics at the German Aerospace Centre.3. Virtually all water consumption by the Swire Pacific Group is withdrawn from municipal water supplies provided by local water supply authorities. Swire Properties’ buildings have installed rainwater
catching facilities but the amount of rainwater caught is insignificant in relation to the Group’s total water consumption.4. This figure excludes on-hire vessel fuel consumption as this belongs to scope 3 as defined by the Greenhouse Gas Protocol.R. Denotes sustainability data that has been reported on by Deloitte Touche Tohmatsu. Please refer to the independent limited assurance report for further details.
Statistics – Health & Safety
Property Cathay Pacific group HAECO group Beverages Swire Pacific Offshore HUD group Trading & IndustrialSwire Pacific (Head Office) Total (Note 1)
2018 2017 2018 2017 2018 2017 2018 2017 2018 2017 2018 2017 2018 2017 2018 2017 2018 2017
Thousand hours worked 12,406 11,614 66,886 67,712 33,914 34,029 64,092 46,245 11,961 11,647 2,271 2,332 16,256 17,608 76 82 207,862 191,269
Total lost time injuries 91 83 1,288 1,112 222 249 173 118 9 4 5 10 75 81 0 0 1,863 1,657
Lost time injury rate (LTIR) 1.47 1.43 3.85 3.28 1.31 1.46 0.54 0.51 0.15 0.07 0.44 0.86 0.92 0.92 0 0 1.79R 1.73
% Change year-on-year (LTIR) 3% 17% -10% 6% 114% -49% – – 3%
Total fatalities (employee) – – 2 1 – – – 1 – – – – – 2 – – 2R 4
Sustainable Development Statistics
Statistics – Environmental
Note
Property Cathay Pacific group HAECO group Beverages Swire Pacific Offshore (Note 4) HUD group Trading & Industrial Total (Note 1)
2018 2017 2018 2017 2018 2017 2018 2017 2018 2017 2018 2017 2018 2017 2018 2017
Total Energy Consumption (thousand GJ)
Direct energy consumption 166 143 256,677 249,292 423 384 1,130 767 1,260 1,417 345 341 84 67 260,085 252,412
Indirect energy consumption 1,035 959 500 504 490 470 1,807 1,125 5 5 15 17 207 265 4,059 3,345
Total 1 1,201 1,102 257,177 249,796 913 854 2,937 1,892 1,265 1,422 360 358 291 332 264,144R 255,756
% Change year-on-year 9% 3% 7% 55% -11% 0.6% -12% 3%
Total Greenhouse Gas Emissions by Weight (thousand tonnes CO2e)
Direct (Scope 1) 2 10 11 18,406 18,221 33 29 81 52 93 106 28 28 6 7 18,657 18,454
Indirect (Scope 2) 205 204 75 80 73 77 275 193 0.5 1 2.3 3 37 50 667.8 608
Total 1 215 215 18,481 18,301 106 106 356 245 94 107 30 31 43 57 19,325R 19,062
% Change year-on-year – 1% – 45% -13% -2.3% -25% 1%
Total Water Used (thousands cbm)
Water Used 3 1,599 1,390 975 950 633 651 13,439 7,493 – – 85 115 400 455 17,131R 11,054
% Change year-on-year 15% 3% -3% 79% – -26% -12% 55%

SWIRE PACIFIC 2018 ANNUAL REPORT 115
Statistics – Health & Safety
Property Cathay Pacific group HAECO group Beverages Swire Pacific Offshore HUD group Trading & IndustrialSwire Pacific (Head Office) Total (Note 1)
2018 2017 2018 2017 2018 2017 2018 2017 2018 2017 2018 2017 2018 2017 2018 2017 2018 2017
Thousand hours worked 12,406 11,614 66,886 67,712 33,914 34,029 64,092 46,245 11,961 11,647 2,271 2,332 16,256 17,608 76 82 207,862 191,269
Total lost time injuries 91 83 1,288 1,112 222 249 173 118 9 4 5 10 75 81 0 0 1,863 1,657
Lost time injury rate (LTIR) 1.47 1.43 3.85 3.28 1.31 1.46 0.54 0.51 0.15 0.07 0.44 0.86 0.92 0.92 0 0 1.79R 1.73
% Change year-on-year (LTIR) 3% 17% -10% 6% 114% -49% – – 3%
Total fatalities (employee) – – 2 1 – – – 1 – – – – – 2 – – 2R 4
Statistics – Environmental
Note
Property Cathay Pacific group HAECO group Beverages Swire Pacific Offshore (Note 4) HUD group Trading & Industrial Total (Note 1)
2018 2017 2018 2017 2018 2017 2018 2017 2018 2017 2018 2017 2018 2017 2018 2017
Total Energy Consumption (thousand GJ)
Direct energy consumption 166 143 256,677 249,292 423 384 1,130 767 1,260 1,417 345 341 84 67 260,085 252,412
Indirect energy consumption 1,035 959 500 504 490 470 1,807 1,125 5 5 15 17 207 265 4,059 3,345
Total 1 1,201 1,102 257,177 249,796 913 854 2,937 1,892 1,265 1,422 360 358 291 332 264,144R 255,756
% Change year-on-year 9% 3% 7% 55% -11% 0.6% -12% 3%
Total Greenhouse Gas Emissions by Weight (thousand tonnes CO2e)
Direct (Scope 1) 2 10 11 18,406 18,221 33 29 81 52 93 106 28 28 6 7 18,657 18,454
Indirect (Scope 2) 205 204 75 80 73 77 275 193 0.5 1 2.3 3 37 50 667.8 608
Total 1 215 215 18,481 18,301 106 106 356 245 94 107 30 31 43 57 19,325R 19,062
% Change year-on-year – 1% – 45% -13% -2.3% -25% 1%
Total Water Used (thousands cbm)
Water Used 3 1,599 1,390 975 950 633 651 13,439 7,493 – – 85 115 400 455 17,131R 11,054
% Change year-on-year 15% 3% -3% 79% – -26% -12% 55%

FINANCIAL STATEMENTS
117 Independent Auditor’s Report
124 Consolidated Statement of Profit or Loss
125 Consolidated Statement of Other Comprehensive Income
126 Consolidated Statement of Financial Position
127 Consolidated Statement of Cash Flows
128 Consolidated Statement of Changes in Equity
129 Notes to the Financial Statements
203 Principal Accounting Policies
206 Principal Subsidiary, Joint Venture and Associated Companies and Investments
218 Cathay Pacific Airways Limited – Abridged Financial Statements
SUPPLEMENTARY INFORMATION
220 Summary of Past Performance
222 Schedule of Principal Group Properties
232 Group Structure Chart
234 Glossary
236 Financial Calendar and Information for Investors
236 Disclaimer
F I N A N C I A L C O N T E N T S

117SWIRE PACIFIC 2018 ANNUAL REPORT
Independent Auditor’s Report
To the Shareholders of Swire Pacific Limited(incorporated in Hong Kong with limited liability)
Opinion
What we have audited
The consolidated financial statements of Swire Pacific Limited (“the consolidated financial statements”) and its subsidiaries (“the Group”) set out on pages 124 to 219, which comprise:
– The consolidated statement of financial position as at 31st December 2018;– The consolidated statement of profit or loss for the year then ended;– The consolidated statement of other comprehensive income for the year then ended;– The consolidated statement of changes in equity for the year then ended;– The consolidated statement of cash flows for the year then ended; and– The notes to the financial statements, which include a summary of significant accounting policies.
Our opinion
In our opinion, the consolidated financial statements give a true and fair view of the consolidated financial position of the Group as at 31st December 2018, and of its consolidated financial performance and its consolidated cash flows for the year then ended in accordance with Hong Kong Financial Reporting Standards (“HKFRSs”) issued by the Hong Kong Institute of Certified Public Accountants (“HKICPA”) and have been properly prepared in compliance with the Hong Kong Companies Ordinance.
Basis for Opinion
We conducted our audit in accordance with Hong Kong Standards on Auditing (“HKSAs”) issued by the HKICPA. Our responsibilities under those standards are further described in the Auditor’s Responsibilities for the Audit of the Consolidated Financial Statements section of our report.
We believe that the audit evidence we have obtained is sufficient and appropriate to provide a basis for our opinion.
Independence
We are independent of the Group in accordance with the HKICPA’s Code of Ethics for Professional Accountants (“the Code”), and we have fulfilled our other ethical responsibilities in accordance with the Code.
Key Audit Matters
Key Audit Matters are those matters that, in our professional judgement, were of most significance in our audit of the consolidated financial statements of the current period. These matters were addressed in the context of our audit of the consolidated financial statements as a whole, and in forming our opinion thereon, and we do not provide a separate opinion on these matters.

118 INDEPENDENT AUDITOR’S REPORT
Key Audit Matter How our audit addressed the Key Audit Matter
Valuation and impairment of property, plant and equipmentRefer to note 14 in the consolidated financial statements.
Swire Pacific Offshore (“SPO”) recognised an impairment provision of HK$3,786 million to reduce the aggregate carrying values of vessels to HK$12,856 million as at 31st December 2018.
The provision was made following a review of the business outlook and SPO’s operating plans to reduce the carrying values of certain vessels to their estimated recoverable values, which is the higher of fair value less cost to sell and value in use. For the remaining vessels, management concluded that the recoverable amount was higher than their carrying values such that no impairment provision was required. These conclusions are dependent upon significant management judgement, including in respect of:
– Estimated utilisation, charter hire rates, disposal values and discount rates applied to future cash flows; and
– Estimated resale values, provided by an external valuer.
Our procedures in relation to management’s impairment assessment of vessels included:
– Assessing the key assumptions and input data used by management to estimate values in use based on our knowledge of the business and industry;
– Considering the potential impact of reasonably possible downside changes in these key assumptions;
– Assessing the appropriateness of the disclosures in the financial statements;
– Understanding the methodologies used by the external valuer to estimate resale values and by management to estimate values in use;
– Evaluating the external valuer’s competence, capabilities and objectivity;
– Checking, on a sample basis, the accuracy and appropriateness of the input data provided by management to the external valuer such as vessel information and historical performance; and
– Considering the appropriateness of the resale values estimated by the external valuer based on our knowledge of the business and industry and values obtained by the Group in respect of vessels that have been disposed of during the year.
Based on the available evidence we found management’s assumptions in relation to the impairment assessment to be reasonable. We found the disclosures to be appropriate.

119SWIRE PACIFIC 2018 ANNUAL REPORT
Key Audit Matter How our audit addressed the Key Audit Matter
Valuation of investment propertiesRefer to note 15 in the consolidated financial statements.
The fair value of the Group’s investment properties amounted to HK$271,515 million at 31st December 2018, with a revaluation gain of HK$19,378 million recorded in the consolidated statement of profit or loss for the year.
On 15th June 2018, the Group entered into a sale and purchase agreement for the disposal of subsidiary holding its interests in the Cityplaza Three and Cityplaza Four office buildings (CP3 and CP4) for a total cash consideration of HK$15,000 million, subject to adjustments. These investment properties were revalued to the agreed disposal price and a corresponding gain in the fair value of these investment properties of HK$5,389 million has been recorded in the consolidated statement of profit or loss. Given the sale had not been completed at 31st December 2018, these subsidiaries are classified as held for sale in the Group’s statement of financial position and their carrying value is the agreed disposal price. Management expects this transaction to be completed on or before 11th April 2019.
Valuations were obtained from third party valuers (the ‘valuers’) in respect of 97% of the remaining investment properties as at 31st December 2018. The valuations are dependent on certain key assumptions that require significant management judgement, including capitalisation rates and market rents. The valuations of investment properties under development are also dependent upon the estimated costs to complete and expected developer’s profit margin.
Our procedures in relation to management’s valuation of investment properties focused on the highest value properties and included:
– Evaluation of the valuers’ competence, capabilities and objectivity;
– Attendance at meetings with the valuers to discuss the valuations and key assumptions used;
– Review of the external valuation reports to assess the appropriateness of methodologies used;
– Comparison of the capitalisation rates and market rents used by the valuers to an estimated range, determined by reference to publicly available information by our in-house valuation experts; and
– Checking the accuracy of the rental data provided by management to the valuers by agreeing them on a sample basis to the Group’s records.
Our procedures in relation to the carrying value of CP3 and CP4 included:
– Obtaining and reviewing the sale and purchase agreement to determine the key contract terms, conditions of sale and accounting implications;
– Agreeing the deposit and part payments of HK$3,700 million received from the purchaser to bank statements; and
– Enquiring of management the status of this transaction to re-confirm that, based on the latest information, they continue to expect it to be completed at the disposal price on or before 11th April 2019.
We found the key assumptions were supported by the available evidence. We found the disclosures in note 15 to be appropriate.
120 INDEPENDENT AUDITOR’S REPORT
Key Audit Matter How our audit addressed the Key Audit Matter
Key Audit Matters in relation to Cathay Pacific Airways Limited, (“Cathay Pacific”)
Refer to note 19 in the consolidated financial statements and the abridged financial statements of Cathay Pacific on pages 218 and 219.
The Group’s 45% interest in Cathay Pacific is accounted for under the equity method. The Group’s share of the profit after tax from Cathay Pacific for the year ended 31st December 2018 was HK$1,056 million and the Group’s share of Cathay Pacific’s net assets was HK$29,225 million as at 31st December 2018. The amounts noted below are those in the Cathay Pacific financial statements (i.e. on a 100% basis). In the context of our audit of the Group’s financial statements, the key audit matters relating to the Group’s share of the profit and net assets of Cathay Pacific are summarised below.
Cathay Pacific is a significant associate of the Group and is audited by a non-PwC auditor (“the CX Auditor”). We have met with the CX Auditor and have: discussed their identified audit risks and audit approach, results of their work and key audit matters identified; and have reviewed their working papers.
Together with their reporting to us in accordance with our instructions we have determined that the audit work performed and evidence obtained were sufficient for our purpose. We discussed the key audit matters relating to Cathay Pacific with Swire Pacific management and evaluated the impact on our audit of the consolidated financial statements. The procedures performed on the respective key audit matters are summarised below.
Revenue recognition – Cathay Pacific’s revenue amounted to HK$111,060 million for the year ended 31st December 2018. Revenue from passenger and cargo sales is recorded when the related transportation service is provided, using sophisticated information technology systems to track the point of service delivery and, where necessary, estimates of fair values for the services provided that involve a significant degree of management judgement.
– Assessing IT controls and key manual and application controls over Cathay Pacific’s revenue systems;
– Performing analytical procedures on revenue; and
– Inspecting underlying documentation for journal entries related to revenue to assess the timing and fair values of revenues recorded.
Hedge accounting – Cathay Pacific enters into derivative financial instrument contracts to manage its exposure to fuel price risk, foreign currency risk and interest rate risk. These contracts gave rise to derivative financial assets of HK$2,359 million and liabilities of HK$2,059 million as at 31st December 2018. These contracts are recorded at fair value and for the majority of them hedge accounting is applied, such that gains and losses arising from fair value changes are deferred in equity and recognised in the consolidated statement of profit or loss when hedges mature. The large number of contracts necessitates a sophisticated system to record and track each contract and calculate the related valuations at each financial reporting date. The valuation of hedging instruments and consideration of hedge effectiveness can involve a significant degree of both complexity and management judgement and are subject to an inherent risk of error.
– Assessing Cathay Pacific’s key internal controls over derivative financial instruments and hedge accounting;
– Inspecting, on a sample basis, Cathay Pacific’s hedge documentation and contracts;
– Re-performing, on a sample basis, the year end valuations of derivative financial instruments and calculations of hedge effectiveness; and
– Obtaining confirmation of year end derivative financial instruments from counterparties on a sample basis.
121SWIRE PACIFIC 2018 ANNUAL REPORT
Key Audit Matter How our audit addressed the Key Audit Matter
Key Audit Matters in relation to Cathay Pacific Airways Limited, (“Cathay Pacific”) (continued)
Refer to note 19 in the consolidated financial statements and the abridged financial statements of Cathay Pacific on pages 218 and 219.
Assessment of provisions for taxation, litigation and claims – As at 31st December 2018, Cathay Pacific had provisions in respect of possible or actual taxation disputes, litigation and claims amounting to HK$1,973 million. These provisions are estimated using a significant degree of management judgement in interpreting the various relevant rules, regulations and practices and in considering precedents in the various jurisdictions.
– Assessing the adequacy of Cathay Pacific’s tax provisions by reviewing correspondence with tax authorities;
– Discussing significant litigation, claims and regulatory enquiries with Cathay Pacific’s internal legal counsel;
– Obtaining letters from Cathay Pacific’s external legal advisors including their views regarding the likely outcome and magnitude of and exposure to the relevant litigation or claims;
– Considering opinions given by Cathay Pacific’s third party advisers; and
– Assessing the reliability of Cathay Pacific’s management’s past estimates.
Assessing the carrying value of aircraft and related equipment – The carrying value of Cathay Pacific’s aircraft and related equipment as at 31st December 2018 was HK$105,598 million and the related depreciation charge for the year ended 31st December 2018 was HK$8,164 million. The carrying value, estimated useful lives and residual values are reviewed annually by management with reference to fleet composition, current and forecast market values and relevant technical factors. This involves a significant degree of management judgement.
– Assessing estimated useful lives and residual values using the policies of other comparable airlines and Cathay Pacific’s historical experience and future operating plans;
– Discussing indicators of possible impairment with Cathay Pacific‘s management and, where identified, assessing Cathay Pacific’s management’s impairment testing; and
– Challenging the assumptions and critical judgements used by Cathay Pacific’s management and assessing the reliability of past estimates and taking into account recent industry developments and market conditions.
Assessing aircraft maintenance provisions – Cathay Pacific is contractually committed to return 60 aircraft held under operating leases to the lessors in a physical condition agreed at the inception of each lease. Management estimates the maintenance costs and the costs associated with the restitution of life-limited parts and accrues such costs over the lease term. Provisions of HK$3,666 million were held as at 31st December 2018 in respect of this. Determining the provisions requires significant management judgement and complex estimates, including the utilisation of the aircraft, the cost of maintenance and the lifespans of life-limited parts.
– Assessing Cathay Pacific’s internal controls over accounting for maintenance provisions for aircraft held under operating leases;
– Evaluating the provisioning model and key assumptions adopted by Cathay Pacific’s management through reviewing the terms of the operating leases, information from lessors and Cathay Pacific’s maintenance cost experience; and
– Assessing the reliability of Cathay Pacific’s management’s past assumptions.
We found that, in the context of our audit of the consolidated financial statements of Swire Pacific Limited, Cathay Pacific’s management judgements and estimates associated with the key audit matters noted in respect of the Group’s share of the profit and net assets of Cathay Pacific were supported by the available evidence.

122 INDEPENDENT AUDITOR’S REPORT
Other Information
The directors of the Company are responsible for the other information. The other information comprises all the information in the Swire Pacific 2018 annual report other than the consolidated financial statements and our auditor’s report thereon (“the Other Information”).
Our opinion on the consolidated financial statements does not cover the Other Information and we do not express any form of assurance conclusion thereon.
In connection with our audit of the consolidated financial statements, our responsibility is to read the Other Information and, in doing so, consider whether the Other Information is materially inconsistent with the consolidated financial statements or our knowledge obtained in the audit or otherwise appears to be materially misstated.
If, based on the work we have performed, we conclude that there is a material misstatement of the Other Information, we are required to report that fact. We have nothing to report in this regard.
Responsibilities of the Directors for the Consolidated Financial Statements
The directors of the Company are responsible for the preparation of the consolidated financial statements that give a true and fair view in accordance with HKFRSs issued by the HKICPA and the Hong Kong Companies Ordinance, and for such internal control as the directors determine is necessary to enable the preparation of consolidated financial statements that are free from material misstatement, whether due to fraud or error.
In preparing the consolidated financial statements, the directors are responsible for assessing the Group’s ability to continue as a going concern, disclosing, as applicable, matters related to going concern and using the going concern basis of accounting unless the directors either intend to liquidate the Group or to cease operations, or have no realistic alternative but to do so.
The Audit Committee assists the directors in discharging their responsibilities for overseeing the Group’s financial reporting process.
Auditor’s Responsibilities for the Audit of the Consolidated Financial Statements
Our objectives are to obtain reasonable assurance about whether the consolidated financial statements as a whole are free from material misstatement, whether due to fraud or error, and to issue an auditor’s report that includes our opinion. We report our opinion solely to you, as a body, in accordance with section 405 of the Hong Kong Companies Ordinance and for no other purpose. We do not assume responsibility towards or accept liability to any other person for the contents of this report. Reasonable assurance is a high level of assurance, but is not a guarantee that an audit conducted in accordance with HKSAs will always detect a material misstatement when it exists. Misstatements can arise from fraud or error and are considered material if, individually or in the aggregate, they could reasonably be expected to influence the economic decisions of users taken on the basis of these consolidated financial statements.
As part of an audit in accordance with HKSAs, we exercise professional judgement and maintain professional scepticism throughout the audit. We also:
– Identify and assess the risks of material misstatement of the consolidated financial statements, whether due to fraud or error, design and perform audit procedures responsive to those risks, and obtain audit evidence that is sufficient and appropriate to provide a basis for our opinion. The risk of not detecting a material misstatement resulting from fraud is higher than for one resulting from error, as fraud may involve collusion, forgery, intentional omissions, misrepresentations or the override of internal control.
– Obtain an understanding of internal control relevant to the audit in order to design audit procedures that are appropriate in the circumstances, but not for the purpose of expressing an opinion on the effectiveness of the Group’s internal control.
– Evaluate the appropriateness of accounting policies used and the reasonableness of accounting estimates and related disclosures made by the directors.
– Conclude on the appropriateness of the directors’ use of the going concern basis of accounting and, based on the audit evidence obtained, whether a material uncertainty exists related to events or conditions that may cast significant doubt on the Group’s ability to continue as a going concern. If we conclude that a material uncertainty exists, we are required to draw attention in our auditor’s report to the related disclosures in the consolidated financial statements or, if such disclosures are inadequate, to modify our opinion. Our conclusions are based on the audit evidence obtained up to the date of our auditor’s report. However, future events or conditions may cause the Group to cease to continue as a going concern.
123SWIRE PACIFIC 2018 ANNUAL REPORT
– Evaluate the overall presentation, structure and content of the consolidated financial statements, including the disclosures, and whether the consolidated financial statements represent the underlying transactions and events in a manner that achieves fair presentation.
– Obtain sufficient appropriate audit evidence regarding the financial information of the entities or business activities within the Group to express an opinion on the consolidated financial statements. We are responsible for the direction, supervision and performance of the group audit. We remain solely responsible for our audit opinion.
We communicate with the Audit Committee regarding, among other matters, the planned scope and timing of the audit and significant audit findings, including any significant deficiencies in internal control that we identify during our audit.
We also provide the Audit Committee with a statement that we have complied with relevant ethical requirements regarding independence, and communicate with them all relationships and other matters that may reasonably be thought to bear on our independence, and where applicable, related safeguards.
From the matters communicated with the Audit Committee, we determine those matters that were of most significance in the audit of the consolidated financial statements of the current period and are therefore the key audit matters. We describe these matters in our auditor’s report unless law or regulation precludes public disclosure about the matter or when, in extremely rare circumstances, we determine that a matter should not be communicated in our report because the adverse consequences of doing so would reasonably be expected to outweigh the public interest benefits of such communication.
The engagement partner on the audit resulting in this independent auditor’s report is John J. Ryan.
PricewaterhouseCoopersCertified Public AccountantsHong Kong, 14th March 2019

124
Consolidated Statement of Profit or LossFor the year ended 31st December 2018
The notes on pages 129 to 219 form part of these financial statements.
Note2018
HK$M2017
HK$M
Revenue 4 84,606 80,289
Cost of sales (53,739) (51,991)
Gross profit 30,867 28,298
Distribution costs (14,086) (11,684)
Administrative expenses (6,331) (6,027)
Other operating expenses (398) (299)
Other net gains 5 1,458 245
Change in fair value of investment properties 19,378 25,331
Operating profit 30,888 35,864
Finance charges (2,525) (2,399)
Finance income 201 160
Net finance charges 9 (2,324) (2,239)
Share of profits less losses of joint venture companies 19(a) 2,458 2,209
Share of profits less losses of associated companies 19(b) 1,324 (328)
Profit before taxation 32,346 35,506
Taxation 10 (2,926) (3,124)
Profit for the year 29,420 32,382
Profit for the year attributable to:
The Company’s shareholders 34 23,629 26,070
Non-controlling interests 35 5,791 6,312
29,420 32,382
Underlying profit attributable to the Company’s shareholders 11 8,523 4,742
HK$ HK$
Earnings per share from profit attributable to the Company’s shareholders
(basic and diluted) 13
‘A’ share 15.74 17.34
‘B’ share 3.15 3.47

125SWIRE PACIFIC 2018 ANNUAL REPORT
Consolidated Statement of Other Comprehensive IncomeFor the year ended 31st December 2018
The notes on pages 129 to 219 form part of these financial statements.
2018HK$M
2017HK$M
Profit for the year 29,420 32,382
Other comprehensive income
Items that will not be reclassified to profit or loss
Revaluation of property previously occupied by the Group
gains recognised during the year 19 125
deferred tax (1) (3)
Defined benefit plans
remeasurement losses recognised during the year (204) (17)
deferred tax 38 (29)
Changes in the fair value of equity investments at fair value through other comprehensive income (135) –
Share of other comprehensive income of joint venture and associated companies (120) 353
(403) 429
Items that can be reclassified subsequently to profit or loss
Cash flow hedges
losses recognised during the year (139) (349)
transferred to net finance charges (77) (74)
transferred to operating profit (14) (88)
deferred tax 36 88
Net fair value changes on available-for-sale assets
gains recognised during the year – 69
transferred to profit or loss on disposal – (1)
Share of other comprehensive income of joint venture and associated companies (540) 3,666
Net translation differences on foreign operations
(losses)/gains recognised during the year (2,081) 3,051
reclassified to profit or loss on disposal 35 6
(2,780) 6,368
Other comprehensive income for the year, net of tax (3,183) 6,797
Total comprehensive income for the year 26,237 39,179
Total comprehensive income attributable to:
The Company’s shareholders 20,973 32,218
Non-controlling interests 5,264 6,961
26,237 39,179

126
Consolidated Statement of Financial PositionAt 31st December 2018
The notes on pages 129 to 219 form part of these financial statements.
Note2018
HK$M2017
HK$MASSETS AND LIABILITIESNon-current assets Property, plant and equipment 14 39,644 45,619 Investment properties 15 271,515 265,944 Leasehold land and land use rights 16 1,415 1,663 Intangible assets 17 12,918 13,486 Properties held for development 23 1,360 1,342 Joint venture companies 19(a) 18,870 14,858 Loans due from joint venture companies 19(a) 15,470 14,591 Associated companies 19(b) 31,533 30,243 Loans due from associated companies 19(b) 167 161 Equity investments at fair value through other comprehensive income 21(a) 244 – Available-for-sale assets 21(b) – 375 Other receivables 25 67 50 Derivative financial instruments 22 80 174 Deferred tax assets 30 454 603 Retirement benefit assets 31 89 93
393,826 389,202Current assets Properties under development and for sale 23 1,469 2,300 Stocks and work in progress 24 5,242 6,229 Contract assets 1,176 – Trade and other receivables 25 9,945 10,979 Derivative financial instruments 22 109 55 Bank balances and short-term deposits 26 9,112 6,072 Other current assets 32 – 6,262
27,053 31,897 Assets classified as held for sale 27 15,526 –
42,579 31,897Current liabilities Trade and other payables 28 25,102 22,439 Contract liabilities 438 – Taxation payable 636 624 Derivative financial instruments 22 28 11 Short-term loans 29 3,227 671 Long-term loans and bonds due within one year 29 8,301 8,741
37,732 32,486 Liabilities directly associated with assets classified as held for sale 27 207 –
37,939 32,486Net current assets/(liabilities) 4,640 (589)Total assets less current liabilities 398,466 388,613Non-current liabilities Long-term loans and bonds 29 60,251 69,174 Derivative financial instruments 22 170 89 Other payables 28 1,679 2,343 Deferred tax liabilities 30 10,034 9,881 Retirement benefit liabilities 31 1,217 1,032
73,351 82,519NET ASSETS 325,115 306,094EQUITY Share capital 33 1,294 1,294 Reserves 34 269,130 251,869Equity attributable to the Company’s shareholders 270,424 253,163Non-controlling interests 35 54,691 52,931TOTAL EQUITY 325,115 306,094
Merlin SwireMichelle LowPaul Kenneth EtchellsDirectorsHong Kong, 14th March 2019

127SWIRE PACIFIC 2018 ANNUAL REPORT
Consolidated Statement of Cash FlowsFor the year ended 31st December 2018
The notes on pages 129 to 219 form part of these financial statements.
Note2018
HK$M2017
HK$M
Operating activities Cash generated from operations 42(a) 18,328 19,605 Interest paid (2,629) (2,553) Interest received 201 163 Tax paid (2,180) (2,172)
13,720 15,043 Dividends received from joint venture and associated companies (2017: including available-for-sale assets) 1,716 557 Net cash generated from operating activities 15,436 15,600Investing activities Purchase of property, plant and equipment 42(b) (4,103) (3,777) Additions of investment properties (3,917) (5,179) Additions of other current assets (88) (623) Additions of assets classified as held for sale (364) – Purchase of intangible assets (126) (103) Proceeds from disposals of property, plant and equipment 450 263 Proceeds from disposals of investment properties 350 40 Proceeds from disposals of subsidiary companies, net of cash disposed of 42(d) 9,584 614 Proceeds from disposals of joint venture companies 3,594 – Proceeds from disposals of available-for-sale assets – 71 Purchase of shares in new subsidiary companies (14) (4,163) Purchase of shares in joint venture companies (1,670) (1,046) Purchase of new businesses – (2,347) Adjustment for previous year’s purchase of new businesses 187 – Purchase of equity investments at fair value through other comprehensive income (4) – Purchase of available-for-sale assets – (11) Loans to joint venture companies (1,635) (1,535) Loans to associated companies (176) (87) Repayment of loans by joint venture companies 363 128 Repayment of loan by associated companies 2 115 Decrease/(increase) in deposits maturing after more than three months 110 (85) Initial leasing costs incurred (60) (24) Net cash generated from/(used in) investing activities 2,483 (17,749)Net cash inflow/(outflow) before financing activities 17,919 (2,149)Financing activities Loans drawn and refinancing 10,624 20,312 Repayment of loans and bonds (17,571) (13,049)
42(c) (6,947) 7,263 Repurchase of the Company’s shares 33 (21) (153) Purchase of shares in existing subsidiary companies (3,018) (1,384) Dividends paid to the Company’s shareholders 34 (3,454) (3,158) Dividends paid to non-controlling interests 42(c) (1,128) (1,177) Net cash (used in)/generated from financing activities (14,568) 1,391Increase/(decrease) in cash and cash equivalents 3,351 (758) Cash and cash equivalents at 1st January 5,951 6,450 Currency adjustment (200) 259Cash and cash equivalents at 31st December 9,102 5,951Represented by:Bank balances and short-term deposits maturing within three months 26 9,102 5,951

128
Consolidated Statement of Changes in EquityFor the year ended 31st December 2018
The notes on pages 129 to 219 form part of these financial statements.
Note
Attributable to the Company’s shareholders Non-controlling
interestsHK$M
TotalequityHK$M
SharecapitalHK$M
Revenuereserve
HK$M
Otherreserves
HK$MTotal
HK$M
At 1st January 2018
as originally stated 1,294 246,881 4,988 253,163 52,931 306,094
adjustment on adoption of HKFRS 9 – 326 (326) – – –
adjustment on adoption of HKFRS 15 – 331 – 331 32 363
as restated 1,294 247,538 4,662 253,494 52,963 306,457
Profit for the year – 23,629 – 23,629 5,791 29,420
Other comprehensive income – (282) (2,374) (2,656) (527) (3,183)
Total comprehensive income for the year – 23,347 (2,374) 20,973 5,264 26,237
Dividends paid – (3,454) – (3,454) (1,128) (4,582)
Repurchase of the Company’s shares 33 – (9) – (9) – (9)
Capital contribution from non-controlling interests accrued – – – – 8 8
Acquisition of non-controlling interests – (580) – (580) (2,438) (3,018)
Change in composition of the Group – – – – 22 22
At 31st December 2018 1,294 266,842 2,288 270,424 54,691 325,115
Note
Attributable to the Company’s shareholders Non-controlling
interestsHK$M
TotalequityHK$M
SharecapitalHK$M
Revenuereserve
HK$M
Otherreserves
HK$MTotal
HK$M
At 1st January 2017 1,294 224,464 (879) 224,879 47,289 272,168
Profit for the year – 26,070 – 26,070 6,312 32,382
Other comprehensive income – 281 5,867 6,148 649 6,797
Total comprehensive income for the year – 26,351 5,867 32,218 6,961 39,179
Dividends paid – (3,158) – (3,158) (1,152) (4,310)
Repurchase of the Company’s shares 33 – (165) – (165) – (165)
Capital contribution from non-controlling interests accrued – – – – 241 241
Acquisition of non-controlling interests – (611) – (611) (774) (1,385)
Change in composition of the Group – – – – 366 366
At 31st December 2017 1,294 246,881 4,988 253,163 52,931 306,094

129SWIRE PACIFIC 2018 ANNUAL REPORT
Notes to the Financial Statements
General Information
The Company is a limited liability company incorporated in Hong Kong and its shares are listed on The Stock Exchange of Hong Kong Limited. The principal activity of the Company is that of a holding company. The principal activities of its major subsidiary, joint venture and associated companies are shown on pages 206 to 217.
The audited financial statements are set out on pages 124 to 219 and also include the “Audited Financial Information” under Financial Review on page 70 and Financing on pages 79 to 85.
1. Changes in Accounting Policies and Disclosures
(a) The following new and revised standards and new interpretation were required to be adopted by the Group effective from 1st January 2018:
HKFRSs (Amendment) Annual Improvements to HKFRSs 2014-2016 Cycle
HKFRS 9 Financial Instruments
HKFRS 15 Revenue from Contracts with Customers
Amendments to HKAS 40 Transfers of Investment Property
Amendments to HKFRS 2 Classification and Measurement of Share-Based Payment Transactions
Amendments to HKFRS 4 Applying HKFRS 9 Financial Instruments with HKFRS 4 Insurance Contracts
Amendments to HKFRS 15 Clarification of HKFRS 15
HK(IFRIC)-Int 22 Foreign Currency Transactions and Advance Consideration
None of these new and revised standards and new interpretation had a significant effect on the Group’s financial statements or accounting policies, except the following set out below:
HKFRS 15 Revenue from Contracts with Customers – Impact of adoption HKFRS 15 deals with revenue recognition and establishes principles for reporting information to users of financial statements
about the nature, amount, timing and uncertainty of revenue and cash flows arising from an entity’s contracts with customers. Revenue is recognised when a customer obtains control of a good or service and thus has the ability to direct the use and obtain the benefits from the good or service. The Group has used the practical expedient for completed contracts under the modified retrospective approach by adjusting opening retained earnings when it adopted HKFRS 15 effective 1st January 2018 without restatement of prior periods. The effects of HKFRS 15 on the recognition of the Group’s main revenue streams are as follows:
(i) Rental income from lease agreements is specifically excluded from the scope of HKFRS 15;
(ii) The nature of the Group’s current trading property sales in its primary markets in Hong Kong and the USA, the terms of the relevant contracts and the associated laws mean that revenue from these sales continues to be recognised at the point in time of transfer of effective ownership. The transfer of control in future property sales may occur over time or at a point in time, and this will be assessed on a case by case and territory by territory basis. No significant changes to the Group’s accounting policies are required;
(iii) Revenue on certain engine maintenance contracts is recognised over time rather than at a point in time. A percentage of completion method is used to calculate the revenue to be recognised on these contracts and, as a result, some revenue on engine maintenance contracts which are in progress at period/year ends is recognised earlier under HKFRS 15. Other services are performed over short periods and therefore do not result in any significant change in the timing of revenue recognition;
(iv) Sales of goods in the Group’s beverages and retail operations happen at a point in time and do not include any significant separate performance obligations; and
(v) Typical vessel charter hire agreements generally include rental income and performance obligations being the provision of the vessel and crew concurrently for a specified period.

130 NOTES TO THE FINANCIAL STATEMENTS
1. Changes in Accounting Policies and Disclosures (continued)
As a result, the effects of adopting HKFRS 15 on the Group’s opening retained earnings at 1st January 2018 and on the financial statements for the year ended 31st December 2018 are as follows:
Effect on the Group’s opening reserve and non-controlling interests:
1st January 2018HK$M
Increase in joint venture companies 23
Increase in associated companies 285
Decrease in trade and other receivables (420)
Decrease in stocks and work in progress (1,383)
Increase in contract assets 1,599
Decrease in trade and other payables 850
Increase in contract liabilities (588)
Increase in deferred tax liabilities (3)
363
Increase in revenue reserve 331
Increase in non-controlling interests 32
363
Effect on Consolidated Statement of Profit or Loss:
Year ended31st December 2018
HK$M
Decrease in revenue (342)
Decrease in cost of sales 321
Increase in share of profit of joint venture companies 2
Increase in share of profit of associated companies 4
Decrease in taxation 4
Decrease in non-controlling interests 8
Decrease in profit attributable to the Company’s shareholders (3)
Decrease in earnings per share (basic and diluted)
‘A’ share (HK$) –
Effect on Consolidated Statement of Financial Position:
31st December 2018HK$M
Increase in joint venture companies 25
Increase in associated companies 289
Decrease in trade and other receivables (437)
Decrease in stocks and work in progress (840)
Increase in contract assets 1,176
Decrease in trade and other payables 579
Increase in contract liabilities (438)
Increase in deferred tax liabilities (2)
352
Increase in revenue reserve 328
Increase in non-controlling interests 24
352

131SWIRE PACIFIC 2018 ANNUAL REPORT
1. Changes in Accounting Policies and Disclosures (continued)
HKFRS 9 Financial Instruments The complete version of HKFRS 9 replaced HKAS 39.
(i) Classification and measurement
The Group has adopted the classification and measurement aspects of HKFRS 9 from 1st January 2018, without restatement of prior periods with any effects of implementation recognised as an adjustment to opening retained earnings. HKFRS 9 retains the mixed measurement model and establishes three primary measurement categories for financial assets: amortised cost, fair value through other comprehensive income and fair value through profit or loss. The basis of classification depends on the entity’s business model and the contractual cash flow characteristics of the financial asset.
The Group elected to present in “Other Comprehensive Income” changes in the fair values of all its equity investments previously classified as “Available-for-sale assets”, because these equity investments are held as long-term strategic investments. As a result, assets with a fair value of HK$375 million were reclassified from available-for-sale assets to equity investments at fair value through other comprehensive income on 1st January 2018.
Cathay Pacific Airways Limited, an associated company of the Group, elected to irrevocably designate at 1st January 2018 investments that are held for long-term strategic purpose as equity investments at fair value through other comprehensive income. Investments that are held for trading were reclassified to equity investments at fair value through profit or loss at 1st January 2018. As a result, net fair value gains of HK$326 million attributable to the Group relating to investments held for trading were transferred from investment revaluation reserve to revenue reserve on 1st January 2018.
Once designation as equity investments at fair value through other comprehensive income has taken place, all fair value gains or losses previously recognised in other comprehensive income will not be recycled to profit and loss on disposal of these investments.
Non-substantial modifications or exchange of financial liabilities that do not result in derecognition are required to be recognised in profit or loss. No retrospective adjustments were required in relation to this change as none of the borrowings outstanding on 1st January 2018 had been refinanced in prior periods.
(ii) Impairment of financial assets
The incurred loss impairment model used in HKAS 39 has been replaced by an expected credit loss model, with the result that a loss event will no longer need to occur before an impairment allowance is recognised. The Group applies the simplified approach permitted by HKFRS 9 to measure expected credit losses which uses an expected lifetime loss allowance for all trade receivables and contract assets. This has no significant impact on the Group’s financial statements.
(iii) Derivatives and hedging activities
Hedge accounting under HKFRS 9 requires an economic relationship between the hedged item and hedging instrument and for the hedged ratio to be the same as the one used by an entity’s management for risk management purposes. This replaces the hedge effectiveness test under HKAS 39. The Group adopted the hedge accounting aspects of HKFRS 9 prospectively from 1st January 2018 and adoption has not had a material impact on the financial position or the financial results of the Group.
HKAS 40 (Amendment) Transfers of Investment Property The amendment to HKAS 40 clarifies that a property is transferred to, or from, investment property when the property meets,
or ceases to meet, the definition of investment property and there is evidence of a change in use. The amendment does not have any impact on the Group’s financial statements.

132 NOTES TO THE FINANCIAL STATEMENTS
1. Changes in Accounting Policies and Disclosures (continued)
(b) The Group has not early adopted the following relevant new and revised standards and a new interpretation that have been issued but are effective for annual periods beginning on or after 1st January 2019 and such standards and interpretation have not been applied in preparing these consolidated financial statements.
HKFRSs (Amendment) Annual improvements to HKFRSs 2015-2017 Cycle1
HKFRS 16 Leases1
HK(IFRIC)-Int 23 Uncertainty over Income Tax Treatments1
Amendments to HKFRS 9 Prepayment Features with Negative Compensation1
Amendments to HKFRS 19 Plan Amendment, Curtailment or Settlement1
Amendments to HKFRS 10 Sale or Contribution of Assets between an Investor and its Associate or Joint Ventures1
and HKAS 28
Amendments to HKAS 28 Long-term interests in Associates and Joint Ventures1
Amendments to HKFRS 3 Definition of a Business2
Amendments to HKAS 1 Amendments to Definition of Material2
and HKAS 8
Conceptual Framework for Revised Conceptual Framework for Financial Reporting2
Financial Reporting 2018
1 To be applied by the Group from 1st January 2019.2 To be applied by the Group from 1st January 2020.
None of these new and revised standards and new interpretation is expected to have a significant effect on the Group’s financial statements, except the following set out below:
HKFRS 16 Leases HKFRS 16 replaces HKAS 17 and related interpretations and introduces a comprehensive model for the identification of lease
arrangements and accounting treatments for both lessors and lessees. The distinction between operating and finance leases is removed for lessee accounting, and is replaced by a model where a right-of-use asset and a corresponding liability have to be recognised on the balance sheet for all leases by lessees. HKFRS 16 also amends the definition of investment property under HKAS 40 to include property held by a lessee as a right-of-use asset to earn rentals or for capital appreciation or both, and the Group will be required to apply the fair value method under HKAS 40 for such right-of-use assets. The standard does not significantly change the accounting of lessors. Application of HKFRS 16 will result in the Group’s recognition of right-of-use assets and corresponding liabilities in respect of the Group’s operating lease arrangements. These assets and liabilities are currently not required to be recognised but certain relevant information is disclosed as commitments at year end in note 40. In the Group’s statement of profit or loss, operating lease rentals will be replaced with depreciation and interest expenses.
The Group will adopt HKFRS 16 retrospectively with the cumulative effect of initially applying the standard as an adjustment to the opening balance of retained earnings at 1st January 2019. The Group has a choice, on a lease-by-lease basis, to measure the right-of-use asset at either its carrying amount as if HKFRS 16 had been applied since the commencement of the lease, or an amount equal to the lease liability, adjusted for accruals or prepayments. In applying the Standard retrospectively in this way the Group will use one or more practical expedients, on a lease-by-lease basis, to leases previously classified as operating leases, including electing to not apply the retrospective treatment to leases for which the term ends within 12 months of initial application and excluding initial direct costs from the initial measurement of the right-of-use asset. Key judgements and estimates made in calculating the initial impact of adoption include assessing whether arrangements contain a lease, determining the lease term, and calculating the discount rate. The Group will apply HKFRS 16’s low-value and short-term exemptions prospectively. Based on information currently available, the Group expects to recognise (a) right of use assets in the range of HK$4,500 million to HK$5,500 million, (b) lease liabilities in the range of HK$5,100 million to HK$6,200 million, and (c) an adjustment to opening retained earnings in the range of HK$660 million to HK$1,100 million on 1st January 2019, which includes adjustments from associated companies (mainly Cathay Pacific group) in the range of HK$470 million to HK$790 million. The adoption of HKFRS 16 will have no impact on the Group’s cash flows except to present part of cash outflows as financing, instead of operating. There will be an immaterial benefit to Operating profit and a corresponding increase in Finance expense from the presentation of a portion of lease costs as interest costs. Profit before tax and Earnings per share are not expected to be significantly impacted.

133SWIRE PACIFIC 2018 ANNUAL REPORT
2. Financial Risk Management
The Group’s approach to financial risk management is discussed on pages 98 to 100 under the heading “Audited Financial Information”.
Interest rate exposure The impact on the Group’s profit or loss and other comprehensive income of a 100 basis-points increase or decrease in market interest rates from the rates applicable at 31st December, with all other variables held constant, would have been:
100 basis-pointsincrease in
interest ratesHK$M
100 basis-pointsdecrease in
interest ratesHK$M
At 31st December 2018
Impact on profit or loss: (loss)/gain (98) 98
Impact on other comprehensive income: gain/(loss) 116 (121)
At 31st December 2017
Impact on profit or loss: (loss)/gain (170) 170
Impact on other comprehensive income: gain/(loss) 74 (75)
This analysis is based on a hypothetical situation, as in practice market interest rates rarely change in isolation, and should not be considered a projection of likely future profits or losses. The analysis assumes the following:
– Changes in market interest rates affect the interest income or expense of floating rate financial instruments– Changes in market interest rates only affect interest income or expense in relation to fixed rate financial instruments if these
are recognised at fair value – Changes in market interest rates affect the fair value of derivative financial instruments– All other financial assets and liabilities are held constant
Currency exposure The following analysis details the Group’s exposure to currency risk from recognised financial assets or financial liabilities denominated in a currency other than the functional currency.
The impact on the Group’s profit or loss and other comprehensive income of a weakening or strengthening in the US dollar against the Hong Kong dollar from the year-end rate of 7.8336 (2017: 7.8157), with all other variables held constant, would have been:
Weakening inUSD to lower
peg limit (7.750)HK$M
Strengthening inUSD to upper
peg limit (7.850)HK$M
At 31st December 2018
Impact on profit or loss: gain/(loss) 95 (19)
Impact on other comprehensive income: (loss)/gain (9) 12
At 31st December 2017
Impact on profit or loss: gain/(loss) 90 (46)
Impact on other comprehensive income: (loss)/gain (11) 16
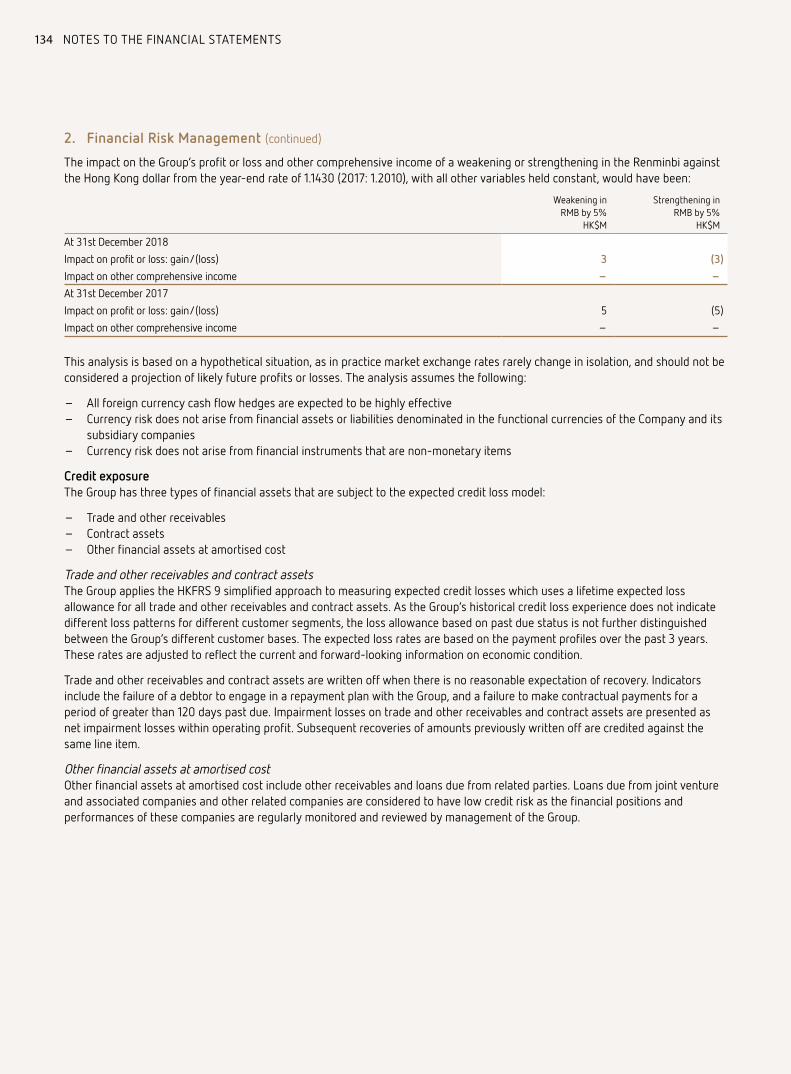
134 NOTES TO THE FINANCIAL STATEMENTS
2. Financial Risk Management (continued)
The impact on the Group’s profit or loss and other comprehensive income of a weakening or strengthening in the Renminbi against the Hong Kong dollar from the year-end rate of 1.1430 (2017: 1.2010), with all other variables held constant, would have been:
Weakening inRMB by 5%
HK$M
Strengthening inRMB by 5%
HK$M
At 31st December 2018
Impact on profit or loss: gain/(loss) 3 (3)
Impact on other comprehensive income – –
At 31st December 2017
Impact on profit or loss: gain/(loss) 5 (5)
Impact on other comprehensive income – –
This analysis is based on a hypothetical situation, as in practice market exchange rates rarely change in isolation, and should not be considered a projection of likely future profits or losses. The analysis assumes the following:
– All foreign currency cash flow hedges are expected to be highly effective– Currency risk does not arise from financial assets or liabilities denominated in the functional currencies of the Company and its
subsidiary companies – Currency risk does not arise from financial instruments that are non-monetary items
Credit exposureThe Group has three types of financial assets that are subject to the expected credit loss model:
– Trade and other receivables– Contract assets– Other financial assets at amortised cost
Trade and other receivables and contract assetsThe Group applies the HKFRS 9 simplified approach to measuring expected credit losses which uses a lifetime expected loss allowance for all trade and other receivables and contract assets. As the Group’s historical credit loss experience does not indicate different loss patterns for different customer segments, the loss allowance based on past due status is not further distinguished between the Group’s different customer bases. The expected loss rates are based on the payment profiles over the past 3 years. These rates are adjusted to reflect the current and forward-looking information on economic condition.
Trade and other receivables and contract assets are written off when there is no reasonable expectation of recovery. Indicators include the failure of a debtor to engage in a repayment plan with the Group, and a failure to make contractual payments for a period of greater than 120 days past due. Impairment losses on trade and other receivables and contract assets are presented as net impairment losses within operating profit. Subsequent recoveries of amounts previously written off are credited against the same line item.
Other financial assets at amortised costOther financial assets at amortised cost include other receivables and loans due from related parties. Loans due from joint venture and associated companies and other related companies are considered to have low credit risk as the financial positions and performances of these companies are regularly monitored and reviewed by management of the Group.

135SWIRE PACIFIC 2018 ANNUAL REPORT
2. Financial Risk Management (continued)
Liquidity riskThe tables below analyse the contractual undiscounted cash flows of the Group’s non-derivative financial liabilities and net-settled derivative financial liabilities by relevant maturity groupings based on the remaining period at the year-end date to the earliest contractual maturity date.
At 31st December 2018
Note
Carryingamount
HK$M
Total contractual
undiscountedcash flow
HK$M
Within 1 year or
on demandHK$M
More than 1 year but
less than2 yearsHK$M
More than 2 years but
less than5 yearsHK$M
Morethan
5 yearsHK$M
Trade and other payables 28 26,781 27,564 22,813 1,330 1,553 1,868
Contract liabilities 438 438 434 4 – –
Borrowings (including interest obligations) 29 71,779 81,405 13,777 11,665 32,910 23,053
Derivative financial instruments 22 198 198 28 7 106 57
Financial guarantee contracts 39 – 2,459 2,459 – – –
99,196 112,064 39,511 13,006 34,569 24,978
At 31st December 2017
Carryingamount
HK$M
Total contractual
undiscountedcash flow
HK$M
Within 1 year or
on demandHK$M
More than 1 year butless than
2 yearsHK$M
More than 2 years but
less than5 yearsHK$M
Morethan
5 yearsHK$M
Trade and other payables 28 24,782 26,177 20,766 695 2,192 2,524
Borrowings (including interest obligations) 29 78,586 89,032 11,756 11,467 38,646 27,163
Derivative financial instruments 22 100 100 11 – 55 34
Financial guarantee contracts 39 – 2,197 2,197 – – –
103,468 117,506 34,730 12,162 40,893 29,721
3. Critical Accounting Estimates and Judgement
Estimates and judgements used in preparing the financial statements are continually evaluated and are based on historical experience and other factors, including expectations of future events that are believed to be reasonable under the circumstances. The Group makes estimates and assumptions concerning the future. The resulting accounting estimates will, inevitably, seldom be equal to the related actual results. The estimates and assumptions that have a significant effect on the carrying amounts of assets and liabilities are discussed in the relevant notes as follows:
(a) Taxation (note 10)(b) Impairment of assets (notes 14 and 17)(c) Estimates of fair value of investment properties (note 15)(d) Accounting for Cathay Pacific Airways Limited (note 19(b))(e) Retirement benefits (note 31) (f) Provisions and contingencies for Cathay Pacific Airways Limited (note 39(b))

136 NOTES TO THE FINANCIAL STATEMENTS
4. Revenue
Accounting Policy
Revenue is recognised when a customer obtains control of a good or service and thus has ability to direct the use and obtain the benefits from the good or service. Provided the collectability of the related receivable is probable, revenue is recognised as follows:
(a) Rental income is recognised on a straight-line basis over the shortest of (i) the remaining lease term, (ii) the period to the next rent review date and (iii) the period from the commencement date of the lease to the first break option date (if any), exclusive of any turnover rent (if applicable) and other charges and reimbursements (if any). Where the lease includes a rent-free period, the rental income foregone is allocated evenly over the lease term. Turnover rent is recognised when the lessee’s revenue transaction is recognised.
(b) The Group develops and sells residential properties. Revenue is recognised when control over the property has been transferred to the buyers. Owing to contractual restrictions, the properties generally do not have alternative use to the Group after the signing of sales contracts with the buyers. However, an enforceable right to payment does not arise until legal title of the property has been transferred to the buyer. Therefore, revenue is recognised upon completion of the transfer of legal title to the buyer.
(c) Sales of services, including aircraft and engine maintenance services and services provided by hotel operations, are recognised when the services are rendered. For certain engine maintenance contracts, revenue is recognised over time rather than at a point in time.
(d) Sales of goods are recognised when the goods are delivered to the customer and the customer has accepted the related risks and rewards of ownership. Sales of goods in the Group’s beverages and retail operations happen at a point in time and do not include any significant separate performance obligations.
(e) Revenue from vessel charter hire services is recognised over the period of charter hire in accordance with the vessel charter hire agreements. Typical vessel charter hire agreements generally include rental income and performance obligations being the provision of the vessel and crew concurrently for a specified period.
(f) The Group does not expect to have any contracts where the period between the transfer of the promised goods or services to the customer and payment by the customer exceeds one year. As a consequence, the Group does not adjust any of the transaction prices for the time value of money.
Definition of termsContract asset: An entity’s right to consideration in exchange for goods or services that the entity has transferred to a customer when that right is conditioned on something other than the passage of time (for example, the entity’s future performance).
Contract liability: An entity’s obligation to transfer goods or services to a customer for which the entity has received consideration from the customer.
In the case of fixed-price contracts, the customer pays the fixed amount based on a payment schedule. If the services rendered by the Group exceed the payment received, a contract asset is recognised. If the payments received exceed the services rendered, a contract liability is recognised. If the contract includes an hourly fee, revenue is recognised in the amount which the Group has a right to invoice. Customers are invoiced on a monthly basis and consideration is payable when invoiced.
Contract asset and contract liability are defined in HKFRS 15 “Revenue from Contracts with Customers”. Therefore, these two terms do not apply to rental income from lease agreements which is specifically excluded from the scope of HKFRS 15.
Please refer to note 25 and note 28 for the accounting policy of contract assets and contract liabilities.

137SWIRE PACIFIC 2018 ANNUAL REPORT
4. Revenue (continued)
Revenue represents sales by the Company and its subsidiary companies to external customers and comprises:
2018HK$M
2017HK$M
Gross rental income from investment properties 12,002 11,138
Property trading 1,061 5,833
Hotels 1,404 1,344
Aircraft and engine maintenance services 13,131 12,892
Sales of goods 52,878 45,008
Charter hire* 2,640 2,684
Rendering of other services 1,490 1,390
Total 84,606 80,289
* Charter hire revenue included leasing of vessels amounting to HK$797 million for the year ended 31st December 2018. The remaining revenue of HK$1,843 million was related to ship management services for the provision of crew.
The following table shows how much of the revenue recognised in the current reporting period relates to carried-forward contract liabilities and how much relates to performance obligations that were satisfied in a prior year.
2018HK$M
Revenue recognised that was included in the contract liability balance at the beginning of the year 265
There is no revenue recognised during the year ended 31st December 2018 from performance obligations satisfied in previous years.
Of the contract liabilities HK$438 million outstanding at 31st December 2018, HK$434 million is expected to be recognised as revenue within one year and the remaining balance of HK$4 million over one year.
The following table shows unsatisfied performance obligations resulting from the contracts with customers.
2018HK$M
Aggregate amount of the transaction price allocated to revenue contracts that are partially or fully unsatisfied as at 31 December (note) 2,693
Note: As permitted under the transitional provisions in HKFRS 15, the transaction price allocated to unsatisfied performance obligations as of 31st December 2017 is not disclosed.
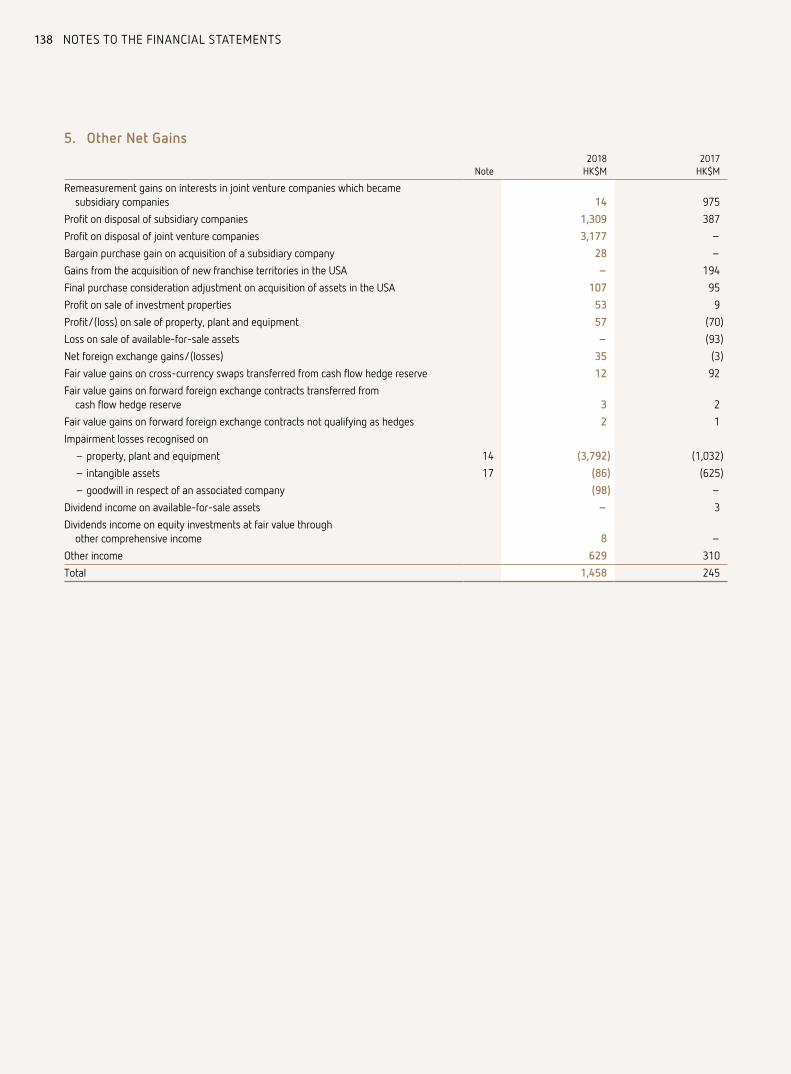
138 NOTES TO THE FINANCIAL STATEMENTS
5. Other Net Gains
Note2018
HK$M2017
HK$M
Remeasurement gains on interests in joint venture companies which became subsidiary companies 14 975
Profit on disposal of subsidiary companies 1,309 387
Profit on disposal of joint venture companies 3,177 –
Bargain purchase gain on acquisition of a subsidiary company 28 –
Gains from the acquisition of new franchise territories in the USA – 194
Final purchase consideration adjustment on acquisition of assets in the USA 107 95
Profit on sale of investment properties 53 9
Profit/(loss) on sale of property, plant and equipment 57 (70)
Loss on sale of available-for-sale assets – (93)
Net foreign exchange gains/(losses) 35 (3)
Fair value gains on cross-currency swaps transferred from cash flow hedge reserve 12 92
Fair value gains on forward foreign exchange contracts transferred from cash flow hedge reserve 3 2
Fair value gains on forward foreign exchange contracts not qualifying as hedges 2 1
Impairment losses recognised on
– property, plant and equipment 14 (3,792) (1,032)
– intangible assets 17 (86) (625)
– goodwill in respect of an associated company (98) –
Dividend income on available-for-sale assets – 3
Dividends income on equity investments at fair value through other comprehensive income 8 –
Other income 629 310
Total 1,458 245

139SWIRE PACIFIC 2018 ANNUAL REPORT
6. Expenses by Nature
Expenses included in cost of sales, distribution costs, administrative expenses and other operating expenses are analysed as follows:
Note2018
HK$M2017
HK$M
Direct rental outgoings of investment properties 2,389 2,267
Cost of goods sold 36,282 35,971
Write-down of stocks and work in progress 229 193
Impairment losses recognised on trade receivables 10 16
Depreciation of property, plant and equipment 14 3,559 3,361
Amortisation of
– leasehold land and land use rights 16 53 46
– intangible assets 17 190 190
– initial leasing costs on investment properties 39 51
– others 10 10
Staff costs 16,639 15,295
Operating lease rentals
– properties 1,200 1,203
– vessels 28 33
– plant and equipment 53 44
Auditors’ remuneration
– audit services 53 52
– tax services 12 8
– other services 5 11
Other expenses 13,803 11,250
Total cost of sales, distribution costs, administrative expenses and other operating expenses 74,554 70,001
7. Segment Information
The Group is organised on a divisional basis: Property, Aviation, Beverages, Marine Services and Trading & Industrial.
Accounting Policy
Segment information is reported in a manner consistent with the Group’s internal financial reporting provided to the executive directors for making strategic decisions. A reportable segment comprises either one or more operating segments which can be aggregated together because they share similar economic characteristics or single operating segments which are disclosable separately because they cannot be aggregated or because they exceed certain quantitative thresholds.
The reportable segments within each of the five divisions are classified according to the nature of the business. The Head Office is also considered to be a reportable segment as discrete financial information is available for the Head Office activities and regularly provided to the Board.

140 NOTES TO THE FINANCIAL STATEMENTS
7. Segment Information (continued)
(a) Information about reportable segments
Analysis of Consolidated Statement of Profit or Loss
Year ended 31st December 2018
External revenue
HK$M
Inter-segment revenue
HK$M
Operating profit/(loss)
HK$M
Finance charges
HK$M
Finance income
HK$M
Share of profits less
losses of joint
venture companies
HK$M
Share of profits
less losses of
associated companies
HK$M
Tax (charge)/
creditHK$M
Profit/(loss)
for the year
HK$M
Profit/(loss) attributable
to the Company’s
shareholdersHK$M
Underlying profit/(loss) attributable
to the Company’s
shareholdersHK$M
Depreciation and
amortisation charged to
operating profitHK$M
Property Property investment 12,139 115 9,861 (913) 112 772 – (1,049) 8,783 7,152 8,284 (172) Change in fair value of investment properties – – 19,378 – – 1,063 – (654) 19,787 16,238 – – Property trading 1,061 – 65 (40) 1 107 – (24) 109 81 81 – Hotels 1,404 – (25) (42) – (117) 153 (10) (41) (34) (34) (234)
14,604 115 29,279 (995) 113 1,825 153 (1,737) 28,638 23,437 8,331 (406)Aviation Cathay Pacific group – – – – – – 1,056 – 1,056 1,056 1,056 – HAECO group 14,892 – 1,140 (115) 23 451 – (233) 1,266 760 760 (654) Others – – (54) – – 3 (11) – (62) (35) (35) (54)
14,892 – 1,086 (115) 23 454 1,045 (233) 2,260 1,781 1,781 (708)Beverages Mainland China 21,358 – 1,059 (137) 35 48 103 (357) 751 634 634 (764) Hong Kong 2,342 1 255 – – – – (25) 230 230 230 (68) Taiwan 1,551 – 224 (2) – – – (11) 211 211 211 (53) USA 15,938 – 819 (121) 2 – – (77) 623 623 623 (588) Central costs – – (68) – – – – – (68) (68) (68) (2)
41,189 1 2,289 (260) 37 48 103 (470) 1,747 1,630 1,630 (1,475)Marine Services Swire Pacific Offshore group* 3,018 1 (4,787) (264) 4 – 2 (31) (5,076) (5,070) (5,070) (1,047) HUD group – – – – – 37 – – 37 37 37 –
3,018 1 (4,787) (264) 4 37 2 (31) (5,039) (5,033) (5,033) (1,047)Trading & Industrial Swire Retail group 3,338 – 69 (1) 8 1 57 (32) 102 102 102 (22) Taikoo Motors group 5,810 – 155 (1) 1 – – (32) 123 123 123 (73) Swire Foods group 1,666 82 (30) – 3 (52) – (12) (91) (91) (91) (92) Swire Pacific Cold Storage group# 82 – 24 (14) – (4) – (51) (45) (45) (45) (27) Akzo Nobel Swire Paints# – – 3,086 – – 143 – (335) 2,894 2,894 2,894 – Swire Environmental Services group – – (24) – – 6 (36) – (54) (54) (54) – Central costs – – (25) – – – – – (25) (25) (25) –
10,896 82 3,255 (16) 12 94 21 (462) 2,904 2,904 2,904 (214)Head Office Net income/(expenses) 7 32 (234) (1,409) 546 – – 7 (1,090) (1,090) (1,090) (1)
Inter-segment elimination – (231) – 534 (534) – – – – – – – Total 84,606 – 30,888 (2,525) 201 2,458 1,324 (2,926) 29,420 23,629 8,523 (3,851)
Notes: Sales between business segments are accounted for at competitive market prices charged to unaffiliated customers for similar goods and services. Interest charged by the Head Office to the business segments is based on market interest rates and the Group’s cost of debt.
* Impairment charge made by the Swire Pacific Offshore group included under operating profit/loss was HK$3,872 million.# Profits on disposals of Swire Pacific Cold Storage group and Akzo Nobel Swire Paints of the Trading & Industrial Division are included under operating profit/loss of the respective companies.

141SWIRE PACIFIC 2018 ANNUAL REPORT
7. Segment Information (continued)
(a) Information about reportable segments (continued)
Analysis of Consolidated Statement of Profit or Loss (continued)
Year ended 31st December 2017
External revenue
HK$M
Inter-segment revenue
HK$M
Operating profit/(loss)
HK$M
Finance charges
HK$M
Finance income
HK$M
Share of profits less
losses of joint
venture companies
HK$M
Share of profits
less losses of
associated companies
HK$M
Tax (charge)/
creditHK$M
Profit/(loss)
for the year
HK$M
Profit/(loss) attributable
to the Company’s
shareholdersHK$M
Underlying profit/(loss) attributable
to the Company’s
shareholdersHK$M
Depreciation and
amortisation charged to operating
profitHK$M
Property Property investment 11,266 114 8,163 (908) 82 500 – (1,169) 6,668 5,464 5,492 (176) Change in fair value of investment properties – – 25,331 – – 1,201 – (391) 26,141 21,391 – – Property trading 5,833 – 1,397 (36) 1 (11) – (240) 1,111 911 946 – Hotels 1,344 1 (102) (39) – (44) 146 (5) (44) (35) (35) (259)
18,443 115 34,789 (983) 83 1,646 146 (1,805) 33,876 27,731 6,403 (435)Aviation Cathay Pacific group – – – – – – (567) – (567) (567) (567) – HAECO group* 14,546 – (90) (131) 11 314 – (450) (346) (406) (406) (637) Others – – (54) – – 5 (7) – (56) (29) (29) (55)
14,546 – (144) (131) 11 319 (574) (450) (969) (1,002) (1,002) (692)Beverages Mainland China# 16,256 – 2,053 (166) 30 19 93 (443) 1,586 1,465 1,465 (645) Hong Kong 2,254 1 242 – – – – (15) 227 220 220 (68) Taiwan 1,343 – 20 (5) – – – (4) 11 11 11 (56) USA# 14,213 – 1,048 (70) 1 – – (196) 783 783 783 (480) Central costs – – (38) – – – – – (38) (38) (38) (3)
34,066 1 3,325 (241) 31 19 93 (658) 2,569 2,441 2,441 (1,252)Marine Services Swire Pacific Offshore group* 3,066 1 (1,791) (304) 5 – 1 (160) (2,249) (2,255) (2,255) (1,064) HUD group – – – – – 23 – – 23 23 23 –
3,066 1 (1,791) (304) 5 23 1 (160) (2,226) (2,232) (2,232) (1,064)Trading & Industrial Swire Retail group 3,074 – (69) (2) 10 2 56 (11) (14) (14) (14) (29) Taikoo Motors group 5,306 – 91 – 2 – – (16) 77 77 77 (77) Swire Foods group 1,678 83 65 – 4 (10) – (17) 42 42 42 (60) Swire Pacific Cold Storage group 105 – (136) (22) – (9) – (4) (171) (171) (171) (48) Akzo Nobel Swire Paints – – 8 – – 216 – (9) 215 215 215 – Swire Environmental Services group – – (9) – 6 3 (50) – (50) (50) (50) – Central costs – – (30) – – – – – (30) (30) (30) –
10,163 83 (80) (24) 22 202 6 (57) 69 69 69 (214)Head Office Net income/(expenses) 5 30 (235) (1,540) 832 – – 6 (937) (937) (937) (1)
Inter-segment elimination – (230) – 824 (824) – – – – – – – Total 80,289 – 35,864 (2,399) 160 2,209 (328) (3,124) 32,382 26,070 4,742 (3,658)
Notes: Sales between business segments are accounted for at competitive market prices charged to unaffiliated customers for similar goods and services. Interest charged by the Head Office to the business segments is based on market interest rates and the Group’s cost of debt.
* Impairment charges made by the HAECO group and the Swire Pacific Offshore group included under operating profit/loss were HK$632 million and HK$1,015 million respectively. # Gains on acquisition/disposal of territories and assets made by Swire Beverages included under operating profit/loss in Mainland China and the USA were HK$1,347 million and HK$289 million
respectively.

142 NOTES TO THE FINANCIAL STATEMENTS
7. Segment Information (continued)
(a) Information about reportable segments (continued)
Analysis of total assets of the Group
At 31st December 2018
Segment assets HK$M
Joint venture
companies# HK$M
Associated companies#
HK$M
Bank deposits
HK$M
Total assets HK$M
Additions to non-current
assets (note) HK$M
Property
Property investment 292,779 26,133 – 1,820 320,732 4,937
Property trading and development 3,034 1,411 – 118 4,563 52
Hotels 5,975 1,247 413 156 7,791 (19)*
301,788 28,791 413 2,094 333,086 4,970
Aviation
Cathay Pacific group – – 29,225 – 29,225 –
HAECO group 10,755 1,738 – 2,167 14,660 562
Others 4,407 2,820 – – 7,227 –
15,162 4,558 29,225 2,167 51,112 562
Beverages
Swire Beverages 25,609 955 1,552 2,397 30,513 1,988
Marine Services
Swire Pacific Offshore group 13,953 – 56 199 14,208 1,112
HUD group – (31) – – (31) –
13,953 (31) 56 199 14,177 1,112
Trading & Industrial
Swire Retail group 696 34 137 326 1,193 26
Taikoo Motors group 1,658 – – 275 1,933 173
Swire Foods group 1,454 3 – 247 1,704 140
Swire Environmental Services group 39 30 317 – 386 –
Other activities 522 – – 59 581 –
4,369 67 454 907 5,797 339
Head Office 372 – – 1,348 1,720 1
361,253 34,340 31,700 9,112 436,405 8,972
Note: In this analysis, additions to non-current assets during the year exclude joint venture and associated companies, financial instruments, deferred tax assets and retirement benefit assets and non-current assets acquired in business combinations.
# The assets of joint venture and associated companies included the respective loans due from these companies. * The negative figure for Hotels in the Property Division was due to the inclusion of a cost write-back of HK$64 million relating to over-statement of previous years’ additions.

143SWIRE PACIFIC 2018 ANNUAL REPORT
7. Segment Information (continued)
(a) Information about reportable segments (continued)
Analysis of total assets of the Group (continued)
At 31st December 2017
Segment assets HK$M
Joint venture
companies#
HK$M
Associated companies#
HK$M
Bank deposits
HK$M
Total assets HK$M
Additions to non-current
assets (note) HK$M
Property
Property investment 278,389 21,119 – 1,440 300,948 4,946
Property trading and development 3,976 670 – 103 4,749 53
Hotels 6,363 1,237 374 165 8,139 86
288,728 23,026 374 1,708 313,836 5,085
Aviation
Cathay Pacific group – – 27,959 – 27,959 –
HAECO group 11,317 1,727 – 991 14,035 983
Others 4,462 2,823 – – 7,285 –
15,779 4,550 27,959 991 49,279 983
Beverages
Swire Beverages 26,298 981 1,552 2,252 31,083 1,623
Marine Services
Swire Pacific Offshore group 17,644 – 56 267 17,967 838
HUD group – (66) – – (66) –
17,644 (66) 56 267 17,901 838
Trading & Industrial
Swire Retail group 673 32 243 159 1,107 13
Taikoo Motors group 1,826 – – 368 2,194 84
Swire Foods group 1,497 28 – 146 1,671 116
Swire Pacific Cold Storage group 1,862 333 – 50 2,245 146
Akzo Nobel Swire Paints – 515 – – 515 –
Swire Environmental Services group 101 50 220 – 371 –
Other activities 460 – – 1 461 –
6,419 958 463 724 8,564 359
Head Office 306 – – 130 436 1
355,174 29,449 30,404 6,072 421,099 8,889
Note: In this analysis, additions to non-current assets during the year exclude joint venture and associated companies, financial instruments, deferred tax assets and retirement benefit assets and non-current assets acquired in business combinations.
# The assets of joint venture and associated companies included the respective loans due from these companies.

144 NOTES TO THE FINANCIAL STATEMENTS
7. Segment Information (continued)
(a) Information about reportable segments (continued)
Analysis of total liabilities and non-controlling interests of the Group
At 31st December 2018
Segment liabilities
HK$M
Current and deferred tax
liabilities HK$M
Inter-segment
borrowings/ (advances)
HK$M
External borrowings
HK$M
Total liabilities
HK$M
Non-controlling interests
HK$M
Property
Property investment 10,736 9,050 (186) 29,461 49,061 50,457
Property trading and development 257 45 144 1,414 1,860 562
Hotels 241 – 42 1,124 1,407 1,171
11,234 9,095 – 31,999 52,328 52,190
Aviation
HAECO group 3,099 397 – 3,248 6,744 2,042
Beverages
Swire Beverages 10,810 649 4,280 2,350 18,089 448
Marine Services
Swire Pacific Offshore group 920 44 4,521 – 5,485 11
Trading & Industrial
Swire Retail group 855 54 (53) – 856 –
Taikoo Motors group 615 17 – – 632 –
Swire Foods group 427 10 (58) – 379 –
Other activities 279 381 60 – 720 –
2,176 462 (51) – 2,587 –
Head Office 602 23 (8,750) 34,182 26,057 –
28,841 10,670 – 71,779 111,290 54,691

145SWIRE PACIFIC 2018 ANNUAL REPORT
7. Segment Information (continued)
(a) Information about reportable segments (continued)
Analysis of total liabilities and non-controlling interests of the Group (continued)
At 31st December 2017
Segment liabilities
HK$M
Current and deferred tax
liabilities HK$M
Inter-segment
borrowings/ (advances)
HK$M
External borrowings
HK$M
Total liabilities
HK$M
Non-controlling interests
HK$M
Property
Property investment 8,023 8,823 4,615 29,268 50,729 46,589
Property trading and development 378 326 610 1,500 2,814 416
Hotels 236 – 23 1,110 1,369 1,239
8,637 9,149 5,248 31,878 54,912 48,244
Aviation
HAECO group 3,100 390 – 3,360 6,850 4,242
Beverages
Swire Beverages 10,778 779 5,303 2,459 19,319 427
Marine Services
Swire Pacific Offshore group 805 74 8,654 – 9,533 18
Trading & Industrial
Swire Retail group 803 39 (164) – 678 –
Taikoo Motors group 692 (4) – – 688 –
Swire Foods group 328 17 (135) – 210 –
Swire Pacific Cold Storage group 271 2 898 – 1,171 –
Other activities 32 29 18 – 79 –
2,126 83 617 – 2,826 –
Head Office 468 30 (19,822) 40,889 21,565 –
25,914 10,505 – 78,586 115,005 52,931
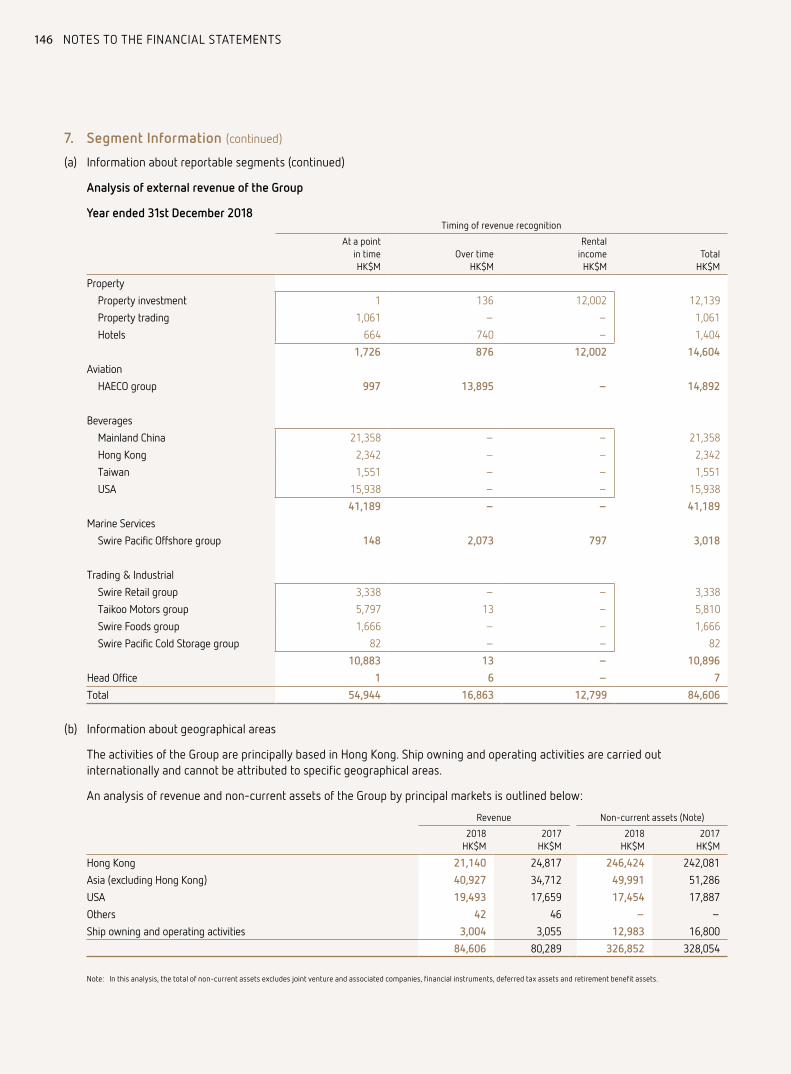
146 NOTES TO THE FINANCIAL STATEMENTS
7. Segment Information (continued)
(a) Information about reportable segments (continued)
Analysis of external revenue of the Group
Year ended 31st December 2018Timing of revenue recognition
At a pointin timeHK$M
Over timeHK$M
RentalincomeHK$M
TotalHK$M
Property
Property investment 1 136 12,002 12,139
Property trading 1,061 – – 1,061
Hotels 664 740 – 1,404
1,726 876 12,002 14,604
Aviation
HAECO group 997 13,895 – 14,892
Beverages
Mainland China 21,358 – – 21,358
Hong Kong 2,342 – – 2,342
Taiwan 1,551 – – 1,551
USA 15,938 – – 15,938
41,189 – – 41,189
Marine Services
Swire Pacific Offshore group 148 2,073 797 3,018
Trading & Industrial
Swire Retail group 3,338 – – 3,338
Taikoo Motors group 5,797 13 – 5,810
Swire Foods group 1,666 – – 1,666
Swire Pacific Cold Storage group 82 – – 82
10,883 13 – 10,896
Head Office 1 6 – 7
Total 54,944 16,863 12,799 84,606
(b) Information about geographical areas
The activities of the Group are principally based in Hong Kong. Ship owning and operating activities are carried out internationally and cannot be attributed to specific geographical areas.
An analysis of revenue and non-current assets of the Group by principal markets is outlined below:
Revenue Non-current assets (Note)
2018HK$M
2017HK$M
2018HK$M
2017HK$M
Hong Kong 21,140 24,817 246,424 242,081
Asia (excluding Hong Kong) 40,927 34,712 49,991 51,286
USA 19,493 17,659 17,454 17,887
Others 42 46 – –
Ship owning and operating activities 3,004 3,055 12,983 16,800
84,606 80,289 326,852 328,054
Note: In this analysis, the total of non-current assets excludes joint venture and associated companies, financial instruments, deferred tax assets and retirement benefit assets.
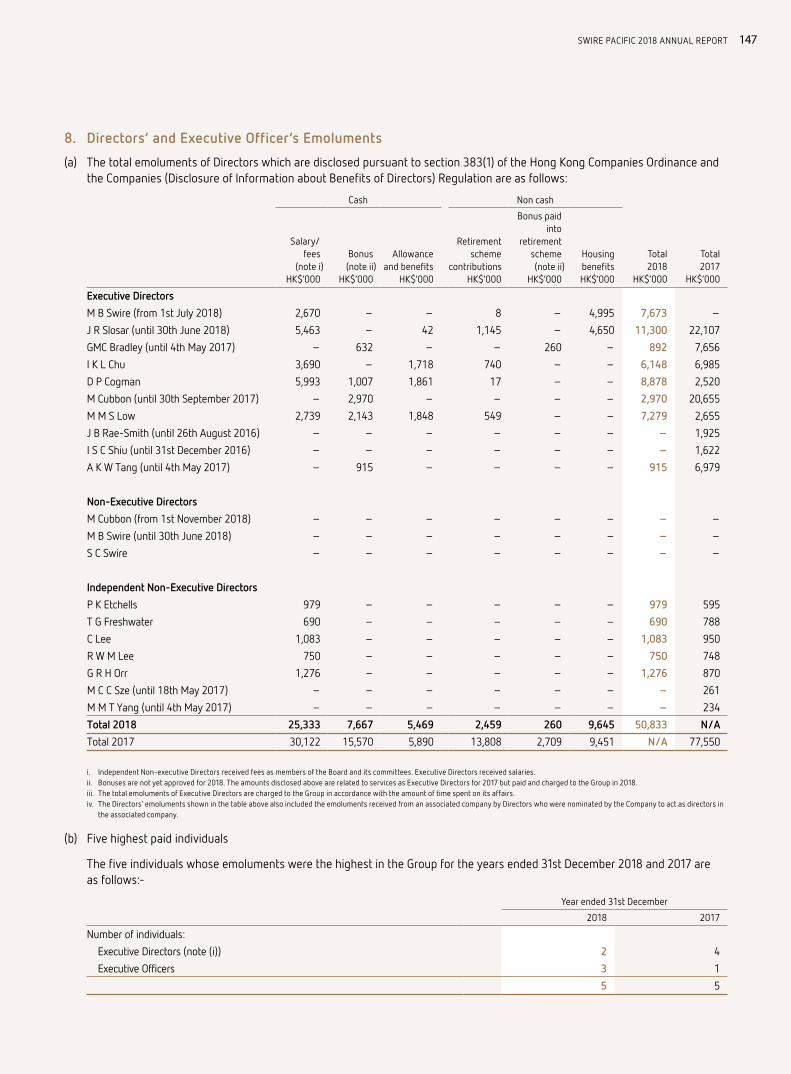
147SWIRE PACIFIC 2018 ANNUAL REPORT
8. Directors’ and Executive Officer’s Emoluments
(a) The total emoluments of Directors which are disclosed pursuant to section 383(1) of the Hong Kong Companies Ordinance and the Companies (Disclosure of Information about Benefits of Directors) Regulation are as follows:
Cash Non cash
Total2018
HK$’000
Total2017
HK$’000
Salary/fees
(note i)HK$’000
Bonus(note ii)
HK$’000
Allowanceand benefits
HK$’000
Retirementscheme
contributionsHK$’000
Bonus paidinto
retirementscheme(note ii)
HK$’000
HousingbenefitsHK$’000
Executive Directors
M B Swire (from 1st July 2018) 2,670 – – 8 – 4,995 7,673 –
J R Slosar (until 30th June 2018) 5,463 – 42 1,145 – 4,650 11,300 22,107
GMC Bradley (until 4th May 2017) – 632 – – 260 – 892 7,656
I K L Chu 3,690 – 1,718 740 – – 6,148 6,985
D P Cogman 5,993 1,007 1,861 17 – – 8,878 2,520
M Cubbon (until 30th September 2017) – 2,970 – – – – 2,970 20,655
M M S Low 2,739 2,143 1,848 549 – – 7,279 2,655
J B Rae-Smith (until 26th August 2016) – – – – – – – 1,925
I S C Shiu (until 31st December 2016) – – – – – – – 1,622
A K W Tang (until 4th May 2017) – 915 – – – – 915 6,979
Non-Executive Directors
M Cubbon (from 1st November 2018) – – – – – – – –
M B Swire (until 30th June 2018) – – – – – – – –
S C Swire – – – – – – – –
Independent Non-Executive Directors
P K Etchells 979 – – – – – 979 595
T G Freshwater 690 – – – – – 690 788
C Lee 1,083 – – – – – 1,083 950
R W M Lee 750 – – – – – 750 748
G R H Orr 1,276 – – – – – 1,276 870
M C C Sze (until 18th May 2017) – – – – – – – 261
M M T Yang (until 4th May 2017) – – – – – – – 234
Total 2018 25,333 7,667 5,469 2,459 260 9,645 50,833 N/A
Total 2017 30,122 15,570 5,890 13,808 2,709 9,451 N/A 77,550
i. Independent Non-executive Directors received fees as members of the Board and its committees. Executive Directors received salaries.ii. Bonuses are not yet approved for 2018. The amounts disclosed above are related to services as Executive Directors for 2017 but paid and charged to the Group in 2018.iii. The total emoluments of Executive Directors are charged to the Group in accordance with the amount of time spent on its affairs. iv. The Directors’ emoluments shown in the table above also included the emoluments received from an associated company by Directors who were nominated by the Company to act as directors in
the associated company.
(b) Five highest paid individuals
The five individuals whose emoluments were the highest in the Group for the years ended 31st December 2018 and 2017 are as follows:-
Year ended 31st December
2018 2017
Number of individuals:
Executive Directors (note (i)) 2 4
Executive Officers 3 1
5 5

148 NOTES TO THE FINANCIAL STATEMENTS
8. Directors’ and Executive Officer’s Emoluments (continued)
Emoluments paid to the Executive Officers are as follows:
Year ended 31st December
2018HK$’000
2017HK$’000
Cash:
Salary 12,709 3,527
Bonus (note (ii)) 6,289 2,222
Allowance and benefits 3,698 1,021
Non-cash:
Retirement scheme contributions 2,718 1,038
Bonus paid into retirement scheme 1,466 985
Housing benefits 6,431 3,839
33,311 12,632
Notes:(i) Details of the emoluments paid to these Directors were included in the disclosure as set out in note 8 (a) above.(ii) Bonuses are not yet approved for 2018. The amounts disclosed above are related to services as Executive Officers for 2017 but paid and charged to the Group in 2018.
The number of the above Executive Officers whose emoluments fell within the following bands:
Year ended 31st December
2018 2017
HK$13,000,000 – HK$12,500,000 – 1
HK$12,000,000 – HK$11,500,000 2 –
HK$10,000,000 – HK$9,500,000 1 –
3 1
9. Net Finance Charges
Accounting Policy
Interest costs incurred are charged to the statement of profit or loss except for those interest charges attributable to the acquisition, construction or production of qualifying assets (i.e. assets that necessarily take a substantial period of time to get ready for their intended use or sale) which are capitalised as part of the cost of those assets. Capitalisation of such borrowing costs ceases when the assets are substantially ready for their intended use or sale.
Interest income on financial assets at FVPL is included in the net fair value gains/(losses) on these assets. Interest income on financial assets at amortised cost and financial assets at FVOCI (2017: available-for-sale assets and loans and receivables) calculated using the effective interest method is recognised on a time proportion basis in the statement of profit or loss as part of finance income. Interest income is presented as finance income where it is earned from financial assets that are held for cash management purposes. Any other interest income is included in other income in Other net gains/(losses). Interest income is calculated by applying the effective interest rate to the gross carrying amount of a financial asset except for financial assets that subsequently become credit-impaired. For credit-impaired financial assets the effective interest rate is applied to the net carrying amount of the financial asset (after deduction of the loss allowance).
Refer to the table with the heading “Audited Financial Information” on page 83 for details of the Group’s net finance charges.

149SWIRE PACIFIC 2018 ANNUAL REPORT
10. Taxation
Accounting Policy
The tax charge comprises current and deferred tax. The tax charge is recognised in the statement of profit or loss, except to the extent that it relates to items recognised in other comprehensive income or directly to equity.
The current tax charge is calculated on the basis of the tax laws enacted or substantively enacted at the end of the reporting period in the countries where the Company and its subsidiaries operate and generate taxable income. Management periodically evaluates positions taken in tax returns with respect to situations in which applicable tax regulation is subject to interpretation. It establishes provisions where appropriate on the basis of amounts expected to be paid to the tax authorities.
Critical Accounting Estimates and Judgements
The Group is subject to income taxes in numerous jurisdictions. Significant judgement is required in determining the worldwide provision for income taxes. There are transactions and calculations relating to the Group’s ordinary business activities for which the ultimate tax determination is uncertain. The Group recognises liabilities for potential tax exposures based on estimates of whether additional taxes will be due. Where the final tax outcome of these matters is different from the amounts that were initially recorded, such differences will affect the income tax and deferred tax provisions in the year in which the outcomes become known.
Note2018
HK$M2017
HK$M
Current taxation
Hong Kong profits tax 1,042 1,178
Overseas taxation 1,272 1,152
(Over)/under-provisions in prior years (16) 32
2,298 2,362
Deferred taxation 30
Changes in fair value of investment properties 501 460
Origination and reversal of temporary differences 127 620
Effect of change in tax rate in the USA – (318)
628 762
2,926 3,124
Hong Kong profits tax is calculated at 16.5% (2017: 16.5%) on the estimated assessable profits for the year. Overseas tax is calculated at tax rates applicable in jurisdictions in which the Group is assessable for tax.
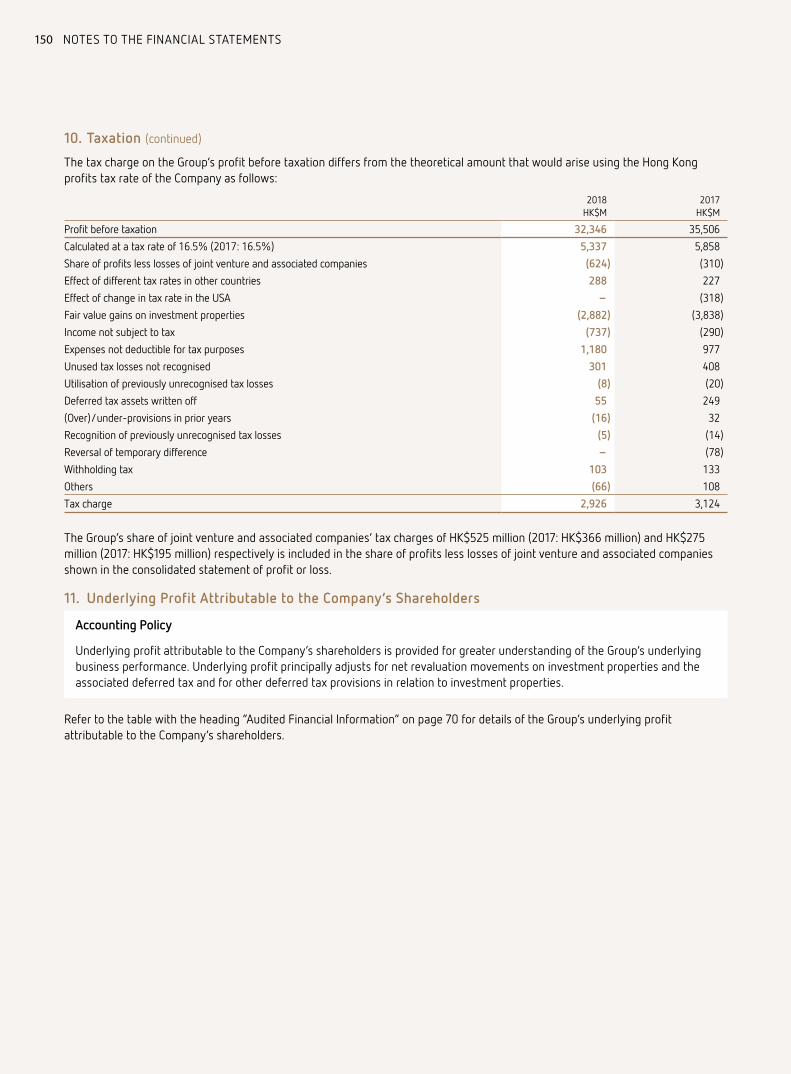
150 NOTES TO THE FINANCIAL STATEMENTS
10. Taxation (continued)
The tax charge on the Group’s profit before taxation differs from the theoretical amount that would arise using the Hong Kong profits tax rate of the Company as follows:
2018HK$M
2017HK$M
Profit before taxation 32,346 35,506
Calculated at a tax rate of 16.5% (2017: 16.5%) 5,337 5,858
Share of profits less losses of joint venture and associated companies (624) (310)
Effect of different tax rates in other countries 288 227
Effect of change in tax rate in the USA – (318)
Fair value gains on investment properties (2,882) (3,838)
Income not subject to tax (737) (290)
Expenses not deductible for tax purposes 1,180 977
Unused tax losses not recognised 301 408
Utilisation of previously unrecognised tax losses (8) (20)
Deferred tax assets written off 55 249
(Over)/under-provisions in prior years (16) 32
Recognition of previously unrecognised tax losses (5) (14)
Reversal of temporary difference – (78)
Withholding tax 103 133
Others (66) 108
Tax charge 2,926 3,124
The Group’s share of joint venture and associated companies’ tax charges of HK$525 million (2017: HK$366 million) and HK$275 million (2017: HK$195 million) respectively is included in the share of profits less losses of joint venture and associated companies shown in the consolidated statement of profit or loss.
11. Underlying Profit Attributable to the Company’s Shareholders
Accounting Policy
Underlying profit attributable to the Company’s shareholders is provided for greater understanding of the Group’s underlying business performance. Underlying profit principally adjusts for net revaluation movements on investment properties and the associated deferred tax and for other deferred tax provisions in relation to investment properties.
Refer to the table with the heading “Audited Financial Information” on page 70 for details of the Group’s underlying profit attributable to the Company’s shareholders.
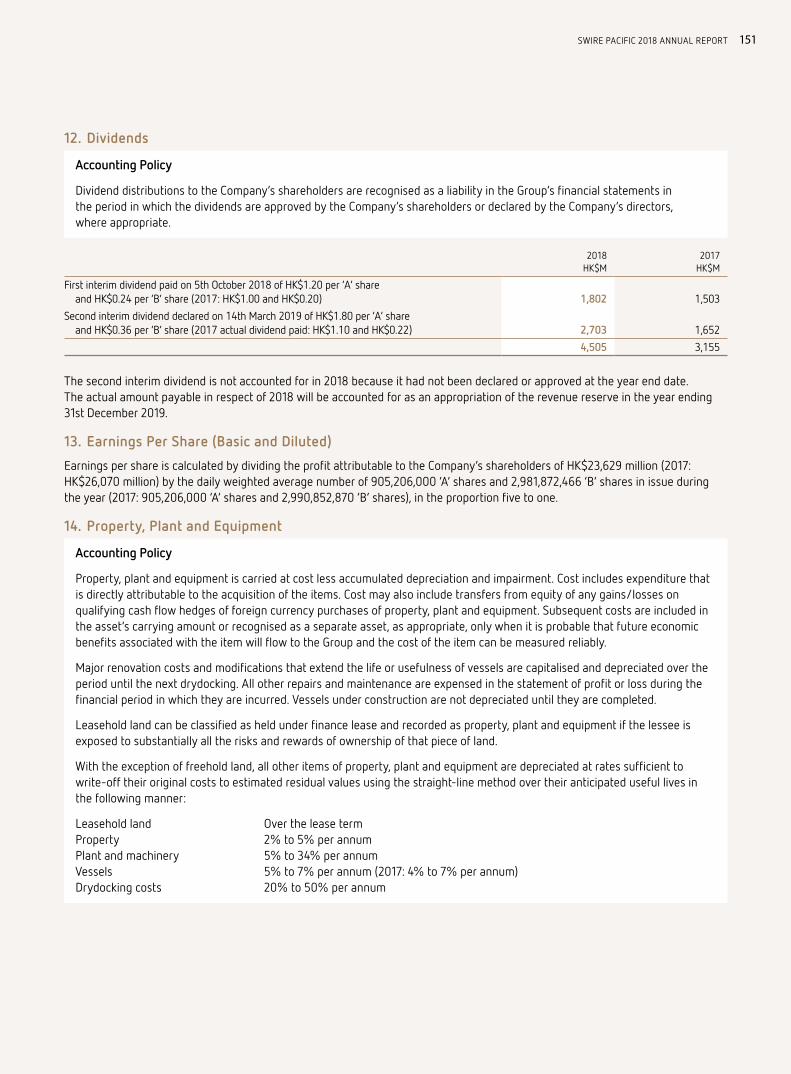
151SWIRE PACIFIC 2018 ANNUAL REPORT
12. Dividends
Accounting Policy
Dividend distributions to the Company’s shareholders are recognised as a liability in the Group’s financial statements in the period in which the dividends are approved by the Company’s shareholders or declared by the Company’s directors, where appropriate.
2018HK$M
2017HK$M
First interim dividend paid on 5th October 2018 of HK$1.20 per ‘A’ share and HK$0.24 per ‘B’ share (2017: HK$1.00 and HK$0.20) 1,802 1,503
Second interim dividend declared on 14th March 2019 of HK$1.80 per ‘A’ share and HK$0.36 per ‘B’ share (2017 actual dividend paid: HK$1.10 and HK$0.22) 2,703 1,652
4,505 3,155
The second interim dividend is not accounted for in 2018 because it had not been declared or approved at the year end date. The actual amount payable in respect of 2018 will be accounted for as an appropriation of the revenue reserve in the year ending 31st December 2019.
13. Earnings Per Share (Basic and Diluted)
Earnings per share is calculated by dividing the profit attributable to the Company’s shareholders of HK$23,629 million (2017: HK$26,070 million) by the daily weighted average number of 905,206,000 ‘A’ shares and 2,981,872,466 ‘B’ shares in issue during the year (2017: 905,206,000 ‘A’ shares and 2,990,852,870 ‘B’ shares), in the proportion five to one.
14. Property, Plant and Equipment
Accounting Policy
Property, plant and equipment is carried at cost less accumulated depreciation and impairment. Cost includes expenditure that is directly attributable to the acquisition of the items. Cost may also include transfers from equity of any gains/losses on qualifying cash flow hedges of foreign currency purchases of property, plant and equipment. Subsequent costs are included in the asset’s carrying amount or recognised as a separate asset, as appropriate, only when it is probable that future economic benefits associated with the item will flow to the Group and the cost of the item can be measured reliably.
Major renovation costs and modifications that extend the life or usefulness of vessels are capitalised and depreciated over the period until the next drydocking. All other repairs and maintenance are expensed in the statement of profit or loss during the financial period in which they are incurred. Vessels under construction are not depreciated until they are completed.
Leasehold land can be classified as held under finance lease and recorded as property, plant and equipment if the lessee is exposed to substantially all the risks and rewards of ownership of that piece of land.
With the exception of freehold land, all other items of property, plant and equipment are depreciated at rates sufficient to write-off their original costs to estimated residual values using the straight-line method over their anticipated useful lives in the following manner:
Leasehold land Over the lease termProperty 2% to 5% per annumPlant and machinery 5% to 34% per annumVessels 5% to 7% per annum (2017: 4% to 7% per annum)Drydocking costs 20% to 50% per annum

152 NOTES TO THE FINANCIAL STATEMENTS
14. Property, Plant and Equipment (continued)
Accounting Policy (continued)
The assets’ expected useful lives and residual values are regularly reviewed and adjusted, if appropriate, at the end of each reporting period to take into account operational experience and changing circumstances.
On the transfer of owner occupied property to investment property, increases in the carrying amount arising on revaluation of land and buildings are credited to other comprehensive income and shown as property revaluation reserve in shareholders’ equity. Decreases that offset previous increases of the same asset are charged in other comprehensive income and debited against property revaluation reserve directly in equity; all other decreases are charged to the statement of profit or loss.
Gains and losses on disposals are determined by comparing the proceeds with the carrying amounts and are recognised within ‘Other net gains/(losses)’ in the statement of profit or loss. When revalued assets are sold, the amounts included in the property revaluation reserve are transferred to revenue reserve.
Critical Accounting Estimates and Judgements
At each period-end date or whenever a change in circumstances occurs, both internal and external sources of information are considered to assess whether there is an indication that assets are impaired. If such an indication exists, the recoverable amount of the asset is estimated using fair value less costs of disposal and/or value in use calculations as appropriate. If the carrying amount of an asset exceeds its recoverable amount, an impairment loss is recognised to reduce the asset to its recoverable amount. Such impairment charges are recognised in the statement of profit or loss within other net gains/losses.
During the year, the carrying amounts of certain property, plant and equipment were written down by HK$3,792 million to their recoverable amount.
Swire Pacific Offshore (SPO) has vessels with aggregate carrying values of HK$12,856 million at 31st December 2018. During the year, management reviewed the outlook for the business and SPO’s operating plans and consequently reassessed the carrying values of the vessels at that point in time. An impairment provision of HK$3,786 million was recorded during the year to reduce the carrying value of certain vessels to their estimated recoverable value, which is the higher of fair value less cost to sell, and value in use. The recoverable amount of vessels subject to impairment provisions amounted to HK$9,364 million at the time of valuation. Fair value less costs to sell is based on management estimates having regard to estimated resale values provided by an external valuer. Fair value less costs to sell is a level 3 fair value measurement. Value in use is determined using cash flow projections based on financial budgets prepared by management. The key assumptions include utilisation, charter hire rates, disposal values and discount rates applied to future cash flows. The discount rate used in the 2018 impairment review was 8.5% (2017: 8.5%). Changes in any or all of the key assumptions could result in a material change in the carrying value of vessels.
The Group has property, plant and equipment and land use rights at Xiamen Airport with a net book value totalling HK$2,093 million at 31st December 2018 (2017: HK$2,234 million), some of which will be subject to relocation. The relocation proposed by the Xiamen municipal government of the Gaoqi airport to a new airport in the Xiang’an district remains subject to central government approval. The HAECO group engaged an independent consultant in 2017 to perform preliminary compensation assessments in order to evaluate the recoverable amounts of property, plant and equipment and land use rights at the existing Xiamen airport that might be affected by the proposal to develop a new airport and considering this valuation and management’s updates during the year has concluded that the carrying value remains appropriate at 31st December 2018. The HAECO group maintains regular communications with the local authorities about the new airport and its opening, which will be material to the operations of the HAECO group in Xiamen.

153SWIRE PACIFIC 2018 ANNUAL REPORT
14. Property, Plant and Equipment (continued)
Note
Leaseholdland held for
own use underfinance leases
HK$MProperty
HK$M
Plant andmachinery
HK$MVessels
HK$MTotal
HK$M
Cost
At 1st January 2018 4,597 20,695 20,173 26,424 71,889
Translation differences 1 (321) (337) 60 (597)
Acquisition of a subsidiary company – 48 62 – 110
Disposal of subsidiary companies (5) (1,601) (135) – (1,741)
Additions – 410 2,429 1,106 3,945
Disposals – (120) (1,454) (880) (2,454)
Net transfers to investment properties 15 (32) (6) – – (38)
Transfer to assets classified as held for sale (93) (32) – – (125)
Other net transfers – (62) 61 – (1)
Revaluation surplus 16 3 – – 19
At 31st December 2018 4,484 19,014 20,799 26,710 71,007
Accumulated depreciation and impairment
At 1st January 2018 214 6,023 10,165 9,868 26,270
Translation differences – (94) (87) 18 (163)
Disposal of subsidiary companies – (103) (47) – (150)
Depreciation for the year 6 32 694 1,811 1,022 3,559
Impairment charges 5 – – 6 3,786 3,792
Disposals – (97) (1,007) (840) (1,944)
Net transfers to investment properties 15 (1) (1) – – (2)
Transfer to assets classified as held for sale – (4) – – (4)
Other net transfers – 12 (7) – 5
At 31st December 2018 245 6,430 10,834 13,854 31,363
Net book value
At 31st December 2018 4,239 12,584 9,965 12,856 39,644

154 NOTES TO THE FINANCIAL STATEMENTS
14. Property, Plant and Equipment (continued)
Note
Leaseholdland held for
own use underfinance leases
HK$MProperty
HK$M
Plant andmachinery
HK$MVessels
HK$MTotal
HK$M
Cost
At 1st January 2017 4,718 17,918 15,311 26,049 63,996
Translation differences – 620 680 202 1,502
Acquisition of subsidiary companies and new businesses 37 – 1,634 3,417 – 5,051
Disposal of a subsidiary company – (94) (443) – (537)
Additions – 982 2,061 833 3,876
Disposals – (32) (998) (660) (1,690)
Net transfers to investment properties 15 (241) (187) – – (428)
Other net transfers – (151) 145 – (6)
Revaluation surplus 120 5 – – 125
At 31st December 2017 4,597 20,695 20,173 26,424 71,889
Accumulated depreciation and impairment
At 1st January 2017 183 5,280 9,279 8,332 23,074
Translation differences 1 165 286 65 517
Disposal of a subsidiary company – (65) (286) – (351)
Depreciation for the year 6 31 676 1,619 1,035 3,361
Impairment charges 5 – 5 12 1,015 1,032
Disposals – (24) (742) (579) (1,345)
Net transfers to investment properties 15 (1) (10) – – (11)
Other net transfers – (4) (3) – (7)
At 31st December 2017 214 6,023 10,165 9,868 26,270
Net book value
At 31st December 2017 4,383 14,672 10,008 16,556 45,619
Property, plant and machinery and vessels include costs of HK$36 million (2017: HK$580 million), HK$88 million (2017: HK$146 million) and nil (2017: HK$442 million) respectively, including advance payments and deposits under contracts with third parties, in respect of assets under construction.

155SWIRE PACIFIC 2018 ANNUAL REPORT
15. Investment Properties
Property that is held for long-term rental yields or for capital appreciation or both, and that is not occupied by the Group, is classified as investment property.
Accounting Policy
Investment property comprises freehold land, leasehold land and buildings. Land held under an operating lease and classified as an investment property is accounted for as if it was a finance lease. Any premium paid for a lease is treated as part of the minimum lease payments and is included in the cost of the asset, but is excluded from the liability.
Investment properties (including those under construction) are carried at fair value and are valued twice a year. The majority of investment properties are valued by independent valuers. The valuations are performed in accordance with HKIS Valuation Standards 2017 published by The Hong Kong Institute of Surveyors and are on the basis of market value, related to individual properties, and separate values are not attributed to land and buildings. These values represent their fair values in accordance with HKFRS 13. Land and buildings that are being developed for future use as investment properties and investment properties that are being redeveloped for continuing use as investment properties are measured at fair value and included as under development. Changes in fair values are recognised in the statement of profit or loss.
Subsequent expenditure is charged to an investment property’s carrying amount only when it is probable that future economic benefits associated with that expenditure will flow to the Group and the cost can be measured reliably. All other repair and maintenance costs in respect of an investment property are expensed in the statement of profit or loss during the financial period in which they are incurred.
If an investment property becomes owner-occupied, it is reclassified as property, plant and equipment, and its fair value at the date of reclassification becomes its cost for accounting purposes.
Expenditure incurred in leasing the Group’s investment property during development is deferred and amortised on a straight-line basis to the statement of profit or loss upon occupation of the property over a period not exceeding the terms of the lease.
Critical Accounting Estimates and Judgements
Cushman & Wakefield Limited, an independent property valuer, was engaged to carry out a valuation of the major portion of the Group’s investment property portfolio at 31st December 2018. This valuation was carried out in accordance with the HKIS Valuation Standards 2017 published by The Hong Kong Institute of Surveyors, which define market value as “the estimated amount for which an asset or liability should exchange on the valuation date between a willing buyer and a willing seller in an arm’s length transaction, after proper marketing and where the parties each acted knowledgeably, prudently and without compulsion”. The assumptions are principally in respect of market rents and yields.
Management has reviewed the independent property valuation and compared it with its own assumptions, with reference to comparable sales transaction data where such information is available, and has concluded that the independent property valuation of the Group’s investment property portfolio is reasonable.

156 NOTES TO THE FINANCIAL STATEMENTS
15. Investment Properties (continued)
NoteCompleted
HK$M
UnderDevelopment
HK$MTotal
HK$M
At 1st January 2018 229,831 35,874 265,705
Translation differences (1,440) (19) (1,459)
Disposal of subsidiary companies – (2,001) (2,001)
Additions 704 4,017 4,721
Disposals (285) – (285)
Transfer between categories 17,076 (17,076) –
Transfer from properties under development and for sale 142 – 142
Net transfers from/(to) property, plant and equipment 14 (36) 72 36
Transfer to assets classified as held for sale (14,546) (435) (14,981)
Net fair value gains 16,694 2,684 19,378
248,140 23,116 271,256
Add: Initial leasing costs 259 – 259
At 31st December 2018 248,399 23,116 271,515
At 1st January 2017 204,076 29,375 233,451
Translation differences 2,028 89 2,117
Additions 1,305 3,437 4,742
Disposals (8) (7) (15)
Transfer to properties under development and for sale – (338) (338)
Net transfers from property, plant and equipment 14 224 193 417
Net fair value gains 22,206 3,125 25,331
229,831 35,874 265,705
Add: Initial leasing costs 239 – 239
At 31st December 2017 230,070 35,874 265,944
Geographical Analysis of Investment Properties2018
HK$M2017
HK$M
Held in Hong Kong
On medium-term leases (10 to 50 years) 34,584 33,170
On long-term leases (over 50 years) 198,383 195,241
232,967 228,411
Held in Mainland China
On medium-term leases (10 to 50 years) 30,546 29,434
Held in USA and elsewhere
Freehold 7,743 7,860
271,256 265,705
Valuation processes and techniques underlying management’s estimate of fair valueThe Group’s investment properties were valued at their fair values at 31st December 2018. 95% by value were valued by Cushman & Wakefield Limited and 2% by value were valued by another independent valuer, in each case on the basis of market value. The independent professionally qualified valuers hold recognised relevant professional qualifications in the jurisdictions in which they valued the Group’s investment properties and have recent experience in the locations and types of investment properties valued. The remaining properties were valued by management. The current use of the investment properties equates to the highest and best use.
The valuation of the Group’s completed investment property portfolio is derived by capitalising the rental income derived from existing tenancies with due provision for reversionary income potential and by making reference to recent comparable sales transactions available in the relevant property market.

157SWIRE PACIFIC 2018 ANNUAL REPORT
15. Investment Properties (continued)
The valuation of the Group’s investment properties under development is derived by making reference to market capitalisation rates and recent comparable sales transactions in the relevant property market (on the assumption that the property had already been completed at the valuation date). It also takes into account the construction cost already incurred as well as the estimated cost to be incurred to complete the project plus the developer’s estimated profit and margin for risk.
The fair values of the Group’s investment properties are sensitive to changes in both observable and unobservable inputs. If capitalisation rates increase, the fair values decrease. If fair market rents increase, the fair values increase. If estimated costs to complete or the developer’s estimated profit and margin for risk increase, the fair values decrease. The opposite is true for decreases in these inputs.
There are inter-relationships between observable and unobservable inputs. Expected vacancy rates may have an impact on yields, with higher vacancy rates resulting in higher yields. For investment properties under development, increases in construction costs that enhance the properties’ features may result in an increase in future rental values. An increase in the future rental income may be linked with higher costs.
The Group reviews the valuations performed by the independent valuer for financial reporting purposes. Discussions of valuation processes and results are held between management and the independent valuer at least once every half year, in line with the Group’s half year reporting dates.
Fair value hierarchyThe Group’s investment properties are measured at fair value and categorised within the fair value hierarchy as follows:
Completed Under Development
2018Total
HK$M
HongKong
HK$M
MainlandChinaHK$M
USAHK$M
TotalHK$M
HongKong
HK$MOthersHK$M
TotalHK$M
Level 2 3,525 186 – 3,711 10,946 – 10,946 14,657
Level 3 207,476 30,359 6,594 244,429 11,021 1,149 12,170 256,599
Total 211,001 30,545 6,594 248,140 21,967 1,149 23,116 271,256
Add: initial leasing costs 259
At 31st December 271,515
Completed Under Development
2017Total
HK$M
HongKong
HK$M
MainlandChinaHK$M
USAHK$M
TotalHK$M
HongKong
HK$MOthersHK$M
TotalHK$M
Level 2 3,442 196 – 3,638 12,094 – 12,094 15,732
Level 3 190,188 29,238 6,767 226,193 22,687 1,093 23,780 249,973
Total 193,630 29,434 6,767 229,831 34,781 1,093 35,874 265,705
Add: initial leasing costs 239
At 31st December 265,944

158 NOTES TO THE FINANCIAL STATEMENTS
15. Investment Properties (continued)
The change in level 3 investment properties during the year is as follows:
Completed Under Development
TotalHK$M
HongKong
HK$M
MainlandChinaHK$M
USAHK$M
TotalHK$M
HongKong
HK$MOthersHK$M
TotalHK$M
At 1st January 2018 190,188 29,238 6,767 226,193 22,687 1,093 23,780 249,973
Translation differences – (1,444) 14 (1,430) – (19) (19) (1,449)
Additions 452 209 55 716 3,067 144 3,211 3,927
Transfer from properties under development and for sale – – 142 142 – – – 142
Transfer upon completion 17,076 – – 17,076 (17,076) – (17,076) –
Net transfers (to)/from property, plant and equipment (45) 9 – (36) – – – (36)
Transfer to assets classified as held of sale (14,546) – – (14,546) – – – (14,546)
Fair value gains/(losses) 14,351 2,347 (384) 16,314 2,343 (69) 2,274 18,588
At 31st December 2018 207,476 30,359 6,594 244,429 11,021 1,149 12,170 256,599
Completed Under Development
TotalHK$M
HongKong
HK$M
MainlandChinaHK$M
USAHK$M
TotalHK$M
HongKong
HK$MOthersHK$M
TotalHK$M
At 1st January 2017 169,494 25,184 6,098 200,776 15,396 956 16,352 217,128
Translation differences – 1,966 46 2,012 – 89 89 2,101
Additions 474 39 791 1,304 2,658 109 2,767 4,071
Transfer to properties under development and for sale – – – – (338) – (338) (338)
Transfer from Level 2 – – – – 1,380 – 1,380 1,380
Net transfers from property, plant and equipment 196 19 – 215 197 – 197 412
Fair value gains/(losses) 20,024 2,030 (168) 21,886 3,394 (61) 3,333 25,219
At 31st December 2017 190,188 29,238 6,767 226,193 22,687 1,093 23,780 249,973
Notes:The levels in the hierarchy represent the following:Level 2 – Investment properties measured at fair value using inputs other than quoted prices but where those inputs are based on observable market data.Level 3 – Investment properties measured at fair value using inputs not based on observable market data.
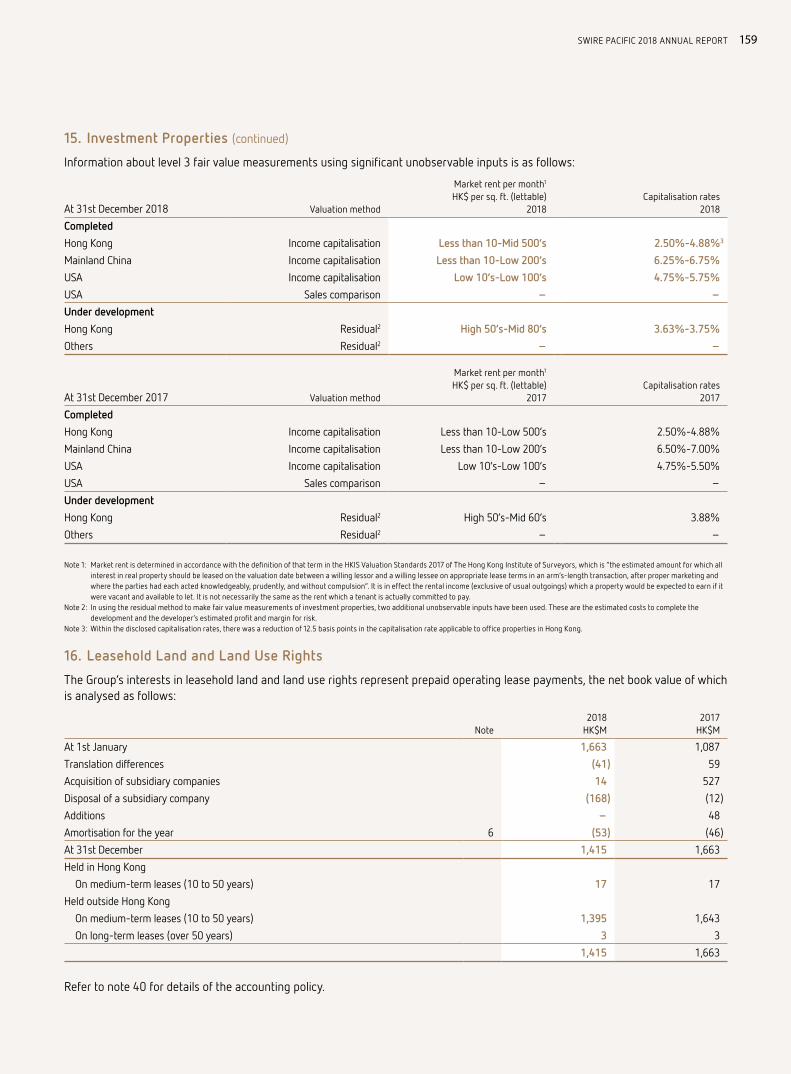
159SWIRE PACIFIC 2018 ANNUAL REPORT
15. Investment Properties (continued)
Information about level 3 fair value measurements using significant unobservable inputs is as follows:
At 31st December 2018 Valuation method
Market rent per month1
HK$ per sq. ft. (lettable)2018
Capitalisation rates2018
Completed
Hong Kong Income capitalisation Less than 10-Mid 500’s 2.50%-4.88%3
Mainland China Income capitalisation Less than 10-Low 200’s 6.25%-6.75%
USA Income capitalisation Low 10’s-Low 100’s 4.75%-5.75%
USA Sales comparison – –
Under development
Hong Kong Residual2 High 50’s-Mid 80’s 3.63%-3.75%
Others Residual2 – –
At 31st December 2017 Valuation method
Market rent per month1
HK$ per sq. ft. (lettable)2017
Capitalisation rates2017
Completed
Hong Kong Income capitalisation Less than 10-Low 500’s 2.50%-4.88%
Mainland China Income capitalisation Less than 10-Low 200’s 6.50%-7.00%
USA Income capitalisation Low 10’s-Low 100’s 4.75%-5.50%
USA Sales comparison – –
Under development
Hong Kong Residual2 High 50’s-Mid 60’s 3.88%
Others Residual2 – –
Note 1: Market rent is determined in accordance with the definition of that term in the HKIS Valuation Standards 2017 of The Hong Kong Institute of Surveyors, which is “the estimated amount for which all interest in real property should be leased on the valuation date between a willing lessor and a willing lessee on appropriate lease terms in an arm’s-length transaction, after proper marketing and where the parties had each acted knowledgeably, prudently, and without compulsion”. It is in effect the rental income (exclusive of usual outgoings) which a property would be expected to earn if it were vacant and available to let. It is not necessarily the same as the rent which a tenant is actually committed to pay.
Note 2: In using the residual method to make fair value measurements of investment properties, two additional unobservable inputs have been used. These are the estimated costs to complete the development and the developer’s estimated profit and margin for risk.
Note 3: Within the disclosed capitalisation rates, there was a reduction of 12.5 basis points in the capitalisation rate applicable to office properties in Hong Kong.
16. Leasehold Land and Land Use Rights
The Group’s interests in leasehold land and land use rights represent prepaid operating lease payments, the net book value of which is analysed as follows:
Note2018
HK$M2017
HK$M
At 1st January 1,663 1,087
Translation differences (41) 59
Acquisition of subsidiary companies 14 527
Disposal of a subsidiary company (168) (12)
Additions – 48
Amortisation for the year 6 (53) (46)
At 31st December 1,415 1,663
Held in Hong Kong
On medium-term leases (10 to 50 years) 17 17
Held outside Hong Kong
On medium-term leases (10 to 50 years) 1,395 1,643
On long-term leases (over 50 years) 3 3
1,415 1,663
Refer to note 40 for details of the accounting policy.

160 NOTES TO THE FINANCIAL STATEMENTS
17. Intangible Assets
Accounting Policy
(a) Goodwill Goodwill represents the excess of consideration transferred over the fair value of the Group’s share of the assets
transferred, the liabilities incurred to the former owners of the acquiree and the equity interests issued by the Group. Goodwill is treated as an asset of the entity acquired and where attributable to a foreign entity will be translated at the period-end closing rate.
Goodwill is stated at cost less accumulated impairment. Goodwill is allocated to cash-generating units for the purpose of impairment testing, which is performed annually, or more often if an impairment indicator exists. Impairment losses recognised on goodwill are not reversed.
Gains and losses on the disposal of an entity include the carrying amount of goodwill relating to the entity sold.
(b) Computer software Computer software licences acquired are capitalised on the basis of the costs incurred to acquire and bring to use the
specific software. These costs are amortised over their estimated useful lives (three to ten years).
Costs associated with maintaining computer software programmes are recognised as an expense as incurred. Costs that are directly associated with the development of identifiable and unique software products controlled by the Group, and that will probably generate economic benefits exceeding costs beyond one year, are recognised as intangible assets. Direct costs include the software development employee costs and an appropriate portion of relevant overheads. Computer software costs recognised as assets are amortised over their estimated useful lives (three to ten years).
(c) Service, franchise and operating rights Service, franchise and operating rights acquired are shown at historical cost. Service, franchise and operating rights
acquired in a business combination are recognised at fair value at the acquisition date.
Service, franchise and operating rights that have a finite useful life are carried at cost less accumulated amortisation. Amortisation is calculated using the straight-line method to allocate the cost of service, franchise and operating rights over their estimated useful lives of twenty years to forty years.
Service, franchise and operating rights that have an indefinite useful life are not subject to amortisation and are tested annually for impairment.
(d) Customer relationships Customer relationships acquired in a business combination are recognised at fair value at the acquisition date. Customer
relationships have a finite useful life and are subsequently carried at cost less accumulated amortisation. Customer relationships are amortised over their estimated useful lives of fifteen years.
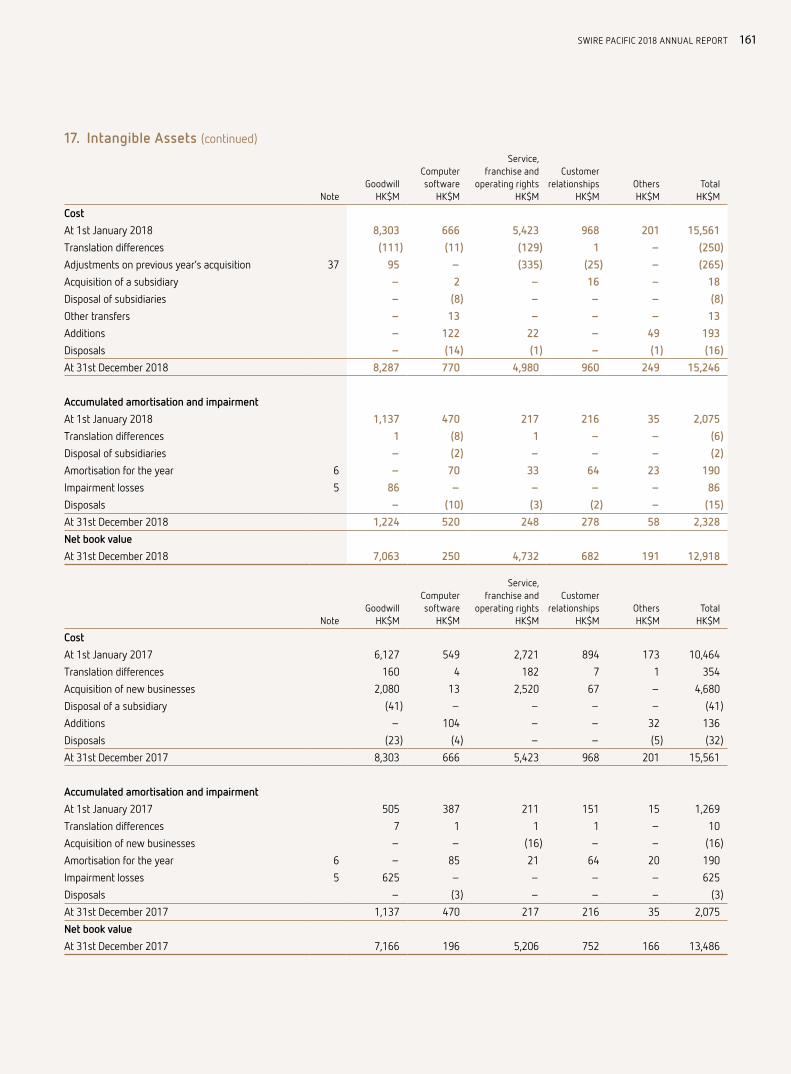
161SWIRE PACIFIC 2018 ANNUAL REPORT
17. Intangible Assets (continued)
NoteGoodwill
HK$M
Computersoftware
HK$M
Service,franchise and
operating rightsHK$M
Customerrelationships
HK$MOthersHK$M
TotalHK$M
Cost
At 1st January 2018 8,303 666 5,423 968 201 15,561
Translation differences (111) (11) (129) 1 – (250)
Adjustments on previous year’s acquisition 37 95 – (335) (25) – (265)
Acquisition of a subsidiary – 2 – 16 – 18
Disposal of subsidiaries – (8) – – – (8)
Other transfers – 13 – – – 13
Additions – 122 22 – 49 193
Disposals – (14) (1) – (1) (16)
At 31st December 2018 8,287 770 4,980 960 249 15,246
Accumulated amortisation and impairment
At 1st January 2018 1,137 470 217 216 35 2,075
Translation differences 1 (8) 1 – – (6)
Disposal of subsidiaries – (2) – – – (2)
Amortisation for the year 6 – 70 33 64 23 190
Impairment losses 5 86 – – – – 86
Disposals – (10) (3) (2) – (15)
At 31st December 2018 1,224 520 248 278 58 2,328
Net book value
At 31st December 2018 7,063 250 4,732 682 191 12,918
NoteGoodwill
HK$M
Computersoftware
HK$M
Service,franchise and
operating rightsHK$M
Customerrelationships
HK$MOthersHK$M
TotalHK$M
Cost
At 1st January 2017 6,127 549 2,721 894 173 10,464
Translation differences 160 4 182 7 1 354
Acquisition of new businesses 2,080 13 2,520 67 – 4,680
Disposal of a subsidiary (41) – – – – (41)
Additions – 104 – – 32 136
Disposals (23) (4) – – (5) (32)
At 31st December 2017 8,303 666 5,423 968 201 15,561
Accumulated amortisation and impairment
At 1st January 2017 505 387 211 151 15 1,269
Translation differences 7 1 1 1 – 10
Acquisition of new businesses – – (16) – – (16)
Amortisation for the year 6 – 85 21 64 20 190
Impairment losses 5 625 – – – – 625
Disposals – (3) – – – (3)
At 31st December 2017 1,137 470 217 216 35 2,075
Net book value
At 31st December 2017 7,166 196 5,206 752 166 13,486

162 NOTES TO THE FINANCIAL STATEMENTS
17. Intangible Assets (continued)
Amortisation of HK$190 million (2017: HK$190 million) is included in cost of sales and administrative expenses in the statement of profit or loss.
Impairment test of goodwill or indefinite-lived franchise
Critical Accounting Estimates and Judgements
The Group believes certain franchise agreements will continue to be renewed at each expiration date and they have therefore been assigned indefinite useful lives.
At each reporting date, an assessment is made as to whether there is any indication that goodwill or any indefinite-lived franchise may be impaired. These tests require the use of estimates to calculate recoverable amounts.
The recoverable amount of goodwill or any indefinite-lived franchise attributable to cash-generating units is determined based on value-in-use calculations. These calculations use financial budgets and plans covering five-year periods unless a longer period can be justified. Key assumptions used in the financial budgets and plans are revenue growth and margins. Cash flows beyond these periods are extrapolated using rates of growth and profitability not exceeding historic results. The discount rates used at 31st December 2018 were between 8.0% and 12.5% (2017: 7% and 12.5%). These discount rates are pre-tax and reflect the specific risks relating to the relevant cash-generating unit.
Goodwill is allocated to the Group’s cash-generating units (CGUs), after impairment, identified by divisional business segment and geographic location.
2018HK$M
2017HK$M
HAECO – Hong Kong and Mainland China 3,510 3,510
HAECO – USA 488 488
Beverages – Hong Kong and Mainland China 2,264 2,378
Beverages – USA 234 139
Marine Services – 84
Trading & Industrial 567 567
7,063 7,166
Goodwill attributable to HAECO’s businesses in Hong Kong and Mainland China relates to the transaction to acquire majority control of HAECO and arose from its highly skilled workforce in the aircraft engineering and maintenance business. It also represents the premium paid over the traded market price to obtain control of the business. The recoverable amount of HAECO’s businesses in Hong Kong and Mainland China has been determined using a value in use calculation. That calculation uses cash flow projections based on financial budgets prepared by management covering a five-year period and a weighted average pre-tax discount rate of 8.2% (2017: 8.7%). Cash flows beyond the five-year period are assumed not to grow by more than 2% per annum (2017: 2%).
Goodwill attributable to HAECO’s business in the USA relates to the acquisition of HAECO Americas, Inc (previously known as TIMCO Aviation Services, Inc.) and arose from its highly skilled workforce, management expertise and the synergies expected to be derived from improved services to a wider range of customers. The recoverable amount of HAECO’s business in the USA has been determined on a value-in-use basis. The key assumptions for the recoverable value of the CGUs are the underlying cash flow forecasts, revenue growth rate and discount rate used. The valuation uses cash flow forecasts based on detailed financial budgets prepared by management covering a five-year (2017: five-year) period for the airframe services CGU and a seven-year (2017: eight-year) period until 2025 for the cabin solutions CGU. A seven-year forecast (until 2025) is considered appropriate for cabin solutions to take into account the significant growth plans for the business which includes the ongoing development of new product models over the next three to five years whose market success the model is dependent upon. Revenue growth is based on past performance, current industry trends and management’s expectations of market development. Assumptions of no growth in cash flows after year five of the airframe services CGU and year seven of the cabin solutions CGU are made respectively. The discount rate is based on the Group’s weighted average cost of capital, adjusted for country specific risk relating to the CGUs. The calculation of the value-in-use of the airframe services CGU also assumes growth in the profitability arising from improved efficiency and work flow, which is based on management’s expectations of the outcome achieved by improvement plans in places.

163SWIRE PACIFIC 2018 ANNUAL REPORT
17. Intangible Assets (continued)
The key assumptions used in calculating the recoverable amount are as follows:
Airframe services Cabin solutions
2018 2017 2018 2017
Discount rate 8.5% 8.5% 8.5% 8.5%
Revenue growth – cumulative average growth rate per annum 8.1% 7.7% 12.6% 13.1%
In 2018, the airframe services CGU recoverable amount exceeded its carrying value by HK$192 million.
In 2017, the carrying amount of the airframe services CGU was reduced to its recoverable amount of HK$1,460 million through recognition of an impairment charge of HK$625 million against goodwill following a reduction in the expected profitability of the airframe services business (which took into account the prospects for the aircraft maintenance business). This loss has been included in “other net gains/losses” in the statement of profit or loss.
In 2018, the cabin solutions CGU recoverable amount exceeded its carrying value by HK$431 million (2017: HK$27 million).
18. Subsidiary Companies
Accounting Policy
Subsidiaries are all entities over which the Group has control. The Group controls an entity when the Group is exposed to, or has rights to, variable returns from its involvement with the entity and has the ability to affect those returns through its power over the entity. Subsidiaries are consolidated from the date on which control is transferred to the Group. They are deconsolidated from the date that control ceases.
The principal subsidiary companies of Swire Pacific Limited are shown on pages 206 to 217.
After the privatisation of HAECO by Swire Pacific on 29th November 2018, HAECO became a wholly-owned subsidiary company of the Group with the purchase of the remaining 25% non-controlling interests. Swire Pacific Limited has material non-controlling interests of 18% in one subsidiary company, Swire Properties Limited (Swire Properties). There are no significant differences between the summarised financial information presented in the table below and the amounts in the separate consolidated financial statements of Swire Properties.
Summarised Statement of Financial PositionSwire Properties
At 31st December
2018HK$M
2017HK$M
Current:
Assets 21,569 13,346
Liabilities 11,975 16,790
Total current net assets/(liabilities) 9,594 (3,444)
Non-current:
Assets 311,517 300,490
Liabilities 40,353 38,122
Total non-current net assets 271,164 262,368
Net assets 280,758 258,924
Net assets allocated to non-controlling interests 50,536 46,606

164 NOTES TO THE FINANCIAL STATEMENTS
18. Subsidiary Companies (continued)
Summarised Statement of Profit or LossSwire Properties
For the year ended31st December
2018HK$M
2017HK$M
Revenue 14,719 18,558
Profit for the year attributable to shareholders 28,582 33,818
Other comprehensive income (2,144) 2,323
Total comprehensive income attributable to shareholders 26,438 36,141
Total comprehensive income allocated to non-controlling interests 4,759 6,505
Dividends paid to non-controlling interests 832 769
Summarised Statement of Cash FlowsSwire Properties
For the year ended31st December
2018HK$M
2017HK$M
Net cash generated from operating activities 9,391 11,756
Net cash generated from/(used in) investing activities 753 (6,887)
Net cash used in financing activities (9,712) (4,904)
Net increase/(decrease) in cash and cash equivalents 432 (35)
Cash and cash equivalents at 1st January 1,708 1,681
Currency adjustment (47) 62
Cash and cash equivalents at 31st December 2,093 1,708
19. Investments in Joint Venture and Associated Companies
Accounting Policy
Joint venture companies are those companies held for the long-term, over which the Group is in a position to exercise joint control with other venturers in accordance with contractual arrangements, and where the Group has rights to the net assets of those companies.
Associated companies are those companies over which the Group has significant influence, but not control or joint control, over their management including participation in financial and operating policy decisions, generally accompanying a shareholding representing between 20% and 50% of the voting rights.
In the Group’s consolidated statement of financial position, its investments in joint venture and associated companies are accounted for using the equity method of accounting and are initially recognised at cost. The excess of the cost of investment in joint venture and associated companies over the fair value of the Group’s share of the identifiable net assets acquired at the date of acquisition represents goodwill. The Group’s investments in joint venture and associated companies include goodwill identified on acquisitions, net of any accumulated impairment loss.
The Group assesses at the end of each reporting period whether there is any objective evidence that its interests in joint venture and associated companies are impaired. Such objective evidence includes whether there have been any significant adverse changes in the technological, market, economic or legal environment in which the joint venture and associated companies operate or whether there has been a significant or prolonged decline in value below their cost. If there is an indication that an interest in a joint venture or associate is impaired, the Group assesses whether the entire carrying amount of the investment (including goodwill) is recoverable. An impairment loss is recognised in profit or loss for the amount by which the carrying amount is higher than the higher of the investment’s fair value less costs of disposal or value in use. Any reversal of such impairment loss in subsequent periods is credited to profit or loss.

165SWIRE PACIFIC 2018 ANNUAL REPORT
19. Investments in Joint Venture and Associated Companies (continued)
(a) Investments in joint venture companies
2018HK$M
2017HK$M
Share of net assets, unlisted 18,141 13,999
Goodwill 729 859
Joint venture companies 18,870 14,858
Loans due from joint venture companies less provisions
– Interest-free 13,934 13,117
– Interest-bearing at 1.7% to 7.5% (2017: 1.7% to 7.5%) 1,536 1,474
15,470 14,591
The loans due from joint venture companies are unsecured and have no fixed terms of repayment.
The principal joint venture companies of the Group are shown on pages 206 to 217. There are no joint venture companies that are considered individually material to the Group.
The Group’s share of assets and liabilities and results of joint venture companies is summarised below:
2018HK$M
2017HK$M
Non-current assets 43,726 40,068
Current assets 5,980 6,020
Current liabilities (4,114) (7,134)
Non-current liabilities (27,451) (24,955)
Net assets 18,141 13,999
Revenue 15,903 12,407
Expenses (12,920) (9,832)
Profit before taxation 2,983 2,575
Taxation (525) (366)
Profit for the year 2,458 2,209
Other comprehensive income (751) 785
Total comprehensive income for the year 1,707 2,994
Capital commitments and contingencies in respect to joint venture companies are disclosed in note 38(a) and 39(a), respectively.

166 NOTES TO THE FINANCIAL STATEMENTS
19. Investments in Joint Venture and Associated Companies (continued)
(b) Investments in associated companies
Critical Accounting Estimates and Judgements
Under HKFRS 10, the Company is required to consolidate as subsidiaries in its financial statements, companies which it controls. The Company controls another company if it has (i) power over the other company, (ii) exposure or rights to variable returns from its involvement with the other company and (iii) ability to use its power over the other company to affect the amount of the Company’s returns. All three of these requirements must be met. The Company has considered whether to consolidate Cathay Pacific as a subsidiary in its financial statements in the light of the provisions of HKFRS 10.
Under HKFRS 10, the Company will be taken to have power over Cathay Pacific if the Company has rights which give the Company the current ability to direct the activities of Cathay Pacific which significantly affect the Company’s returns from Cathay Pacific.
As the Company holds less than half (45%) of the voting rights in Cathay Pacific, the Company does not have power over Cathay Pacific by virtue of holding a majority of those voting rights. The Company has accordingly considered other relevant factors in order to determine whether it has such power. The Company is party to a shareholders agreement dated 8th June 2006 (the Shareholders Agreement) between itself, Air China Limited (Air China) and others in relation to the affairs of Cathay Pacific, as subsequently amended. The Shareholders Agreement contains provisions relating to the composition of the board of Cathay Pacific (including Air China being obliged to use its votes as a shareholder of Cathay Pacific to support the Company appointing a majority of the board of directors of Cathay Pacific). The Company is of the view, having considered the terms of the Shareholders Agreement, the terms of an operating agreement dated 8th June 2006 between Cathay Pacific and Air China and the way in which the board of Cathay Pacific governs the affairs of Cathay Pacific in practice, that the Company does not have power over Cathay Pacific for the purposes of HKFRS 10. It follows that, as one of the three requirements in HKFRS 10 for consolidation has not been met, the Company should not consolidate Cathay Pacific as a subsidiary in the Company’s financial statements and should account for its interest in Cathay Pacific as an associated company.
2018HK$M
2017HK$M
Share of net assets
– Listed in Hong Kong 28,468 27,203
– Unlisted 2,308 2,185
30,776 29,388
Goodwill 757 855
Associated companies 31,533 30,243
Loans due from associated companies
– Interest-bearing at 4.0%-6.0% (2017: 4.0%-6.0%) 167 161
The loans due from associated companies are unsecured and have no fixed terms of repayment.
The market value of the shares in the listed associated company, Cathay Pacific at 31st December 2018 was HK$19,720 million (2017: HK$21,455 million). The forecast cash flows of Cathay Pacific indicate that no impairment exists.

167SWIRE PACIFIC 2018 ANNUAL REPORT
19. Investments in Joint Venture and Associated Companies (continued)
(b) Investments in associated companies (continued)
The principal associated companies of the Group are shown on pages 206 to 217. In addition, Cathay Pacific is considered individually material to the Group and abridged financial statements are shown on pages 218 to 219.
The Group’s share of assets and liabilities and results of associated companies is summarised below:
2018HK$M
2017HK$M
Non-current assets 76,019 74,138
Current assets 12,536 13,403
Current liabilities (16,583) (15,382)
Non-current liabilities (41,195) (42,692)
Non-controlling interests (1) (79)
Net assets 30,776 29,388
Revenue 54,057 47,660
Expenses (52,458) (47,793)
Profit/(loss) before taxation 1,599 (133)
Taxation (275) (195)
Profit/(loss) for the year 1,324 (328)
Other comprehensive income 91 3,234
Total comprehensive income for the year 1,415 2,906
Contingencies in respect of Cathay Pacific are disclosed in note 39(b).
20. Financial Instruments by Category
Accounting Policy
Financial Assets
(a) Classification From 1st January 2018, the Group classifies its financial assets in the following measurement categories:
– those to be measured subsequently at fair value (either through other comprehensive income or through profit or loss), and
– those to be measured at amortised cost.
The classification depends on the entity’s business model for managing the financial assets and the contractual terms of the cash flows.
For assets measured at fair value, gains and losses will either be recorded in profit or loss or other comprehensive income (OCI). For investments in equity instruments that are not held for trading, this will depend on whether the Group has made an irrevocable election at the time of initial recognition to account for the equity investment at fair value through other comprehensive income (FVOCI).
The Group reclassifies debt investments when and only when its business model for managing those assets changes.
(b) Recognition and derecognition Purchases and sales of financial assets are recognised on their trade-date, the date on which the Group commits to
purchase or sell the asset. Financial assets are derecognised when the rights to receive cash flows from the financial assets have expired or have been transferred and the Group has transferred substantially all the risks and rewards of ownership.

168 NOTES TO THE FINANCIAL STATEMENTS
20. Financial Instruments by Category (continued)
Accounting Policy (continued)
Financial Assets (continued)
(c) Measurement At initial recognition, except for trade debtors, the Group measures a financial asset at its fair value plus, in the case of a
financial asset not at fair value through profit or loss, transaction costs that are directly attributable to the acquisition of the financial asset. Transaction costs of financial assets at fair value through profit or loss (FVPL) are expensed in profit or loss.
Financial assets with embedded derivatives are considered in their entirety when determining whether their cash flows are solely payment of principal and interest.
– Debt instruments: Subsequent measurement of debt instruments depends on the Group’s business model for managing the asset and
the cash flow characteristics of the asset. There are three measurement categories into which the Group classifies its debt instruments:
(i) Amortised cost: Assets that are held for collection of contractual cash flows where those cash flows represent solely payments of principal and interest are measured at amortised cost. Interest income from these financial assets is included in finance income using the effective interest rate method. Any gain or loss arising on derecognition is recognised directly in profit or loss and presented in other gains/(losses) together with foreign exchange gains and losses.
(ii) FVOCI: Assets that are held for collection of contractual cash flows and for selling the financial assets, where the assets’ cash flows represent solely payments of principal and interest, are measured at FVOCI. Movements in the carrying amount are taken through OCI, except for the recognition of impairment gains or losses, interest income and foreign exchange gains and losses which are recognised in profit or loss. When the financial asset is derecognised, the cumulative gain or loss previously recognised in OCI is reclassified from equity to profit or loss and recognised in other gains/(losses). Interest income from these financial assets is included in finance income using the effective interest rate method. Foreign exchange gains and losses are presented in other gains/(losses) and impairment expenses are presented as separate line item in the statement of profit or loss.
(iii) FVPL: Assets that do not meet the criteria for amortised cost or FVOCI are measured at FVPL. A gain or loss on a debt investment that is subsequently measured at FVPL is recognised in profit or loss and presented net within other gains/(losses) in the period in which it arises.
– Equity instruments: The Group subsequently measures all equity investments at fair value. Where the Group’s management has elected to
present fair value gains and losses on equity investments in OCI, there is no subsequent reclassification of fair value gains and losses to profit or loss following the derecognition of the investment. Dividends from such investments continue to be recognised in profit or loss as other gains/(losses) when the Group’s right to receive payments is established.
Changes in the fair value of equity investments at FVPL are recognised in other gains/(losses) in the statement of profit or loss as applicable. Impairment losses (and reversal of impairment losses) on equity investments measured at FVOCI are not reported separately from other changes in fair value.
(d) Impairment From 1st January 2018, the Group assesses on a forward looking basis the expected credit losses associated with its debt
instruments carried at amortised cost and FVOCI. The impairment methodology applied depends on whether there has been a significant increase in credit risk.
The Group applies the simplified approach permitted by HKFRS 9 to measuring expected credit losses which uses a lifetime expected loss allowance for all trade receivables and contract assets.

169SWIRE PACIFIC 2018 ANNUAL REPORT
20. Financial Instruments by Category (continued)
Accounting Policy (continued)
Financial Assets (continued)
(e) Accounting policies applied until 31st December 2017 The Group has applied HKFRS 9 retrospectively, but has elected not to restate comparative information. As a result,
the comparative information provided continues to be accounted for in accordance with the Group’s previous accounting policy.
Classification: Until 31st December 2017, the Group classified its financial assets in the following categories. The classification depended
on the purpose for which the investments were acquired. The Group determined the classification of its investments at initial recognition.
(i) At fair value through profit or loss A financial asset was classified within this category if it was designated as at fair value through profit or loss by
management. Derivatives were included within this category unless they were designated as hedges. Assets in this category were classified as current if they were either held for trading or were expected to be realised within 12 months of the period-end date.
(ii) Derivatives used for hedging Derivative instruments were classified within this category if they qualified for hedge accounting.
(iii) Available-for-sale Available-for-sale assets were non-derivative investments and other assets that were either designated in this
category or not classified in any of the other categories. Available-for sale assets were included in non-current assets unless management intended to dispose of them within 12 months of the period-end date.
(iv) Loans and receivables Loans and receivables were non-derivative financial assets with fixed or determinable payments that were not quoted
in an active market. They arose when the Group provided money, goods or services directly to a debtor with no intention of trading the receivable. They were included in current assets, except for maturities greater than 12 months after the period-end date where these were classified as non-current assets.
Recognition and measurement: Financial assets classified as at fair value through profit and loss were subsequently carried at fair value. Realised and
unrealised gains and losses arising from changes in fair value were included in the statement of profit or loss in the period in which they arose.
Derivatives were subsequently carried at fair value.
Financial assets classified as available-for-sale were subsequently carried at fair value. Unrealised gains and losses arising from changes in fair value were recognised in other comprehensive income. When available-for-sale assets were sold or impaired, the accumulated fair value adjustments were included in the statement of profit or loss as gains and losses from investments.
Financial instruments classified as loans and receivables were subsequently measured using the effective interest method.
The Group assessed at each period-end date whether there was objective evidence that a financial asset was impaired. A financial asset was impaired and impairment losses were recognised only if there was objective evidence of impairment as a result of one or more events that occurred after the initial recognition of the asset and that event had an impact on the estimated future cash flows of the financial asset that could be reliably measured.

170 NOTES TO THE FINANCIAL STATEMENTS
20. Financial Instruments by Category (continued)
Accounting Policy (continued)
Financial Liabilities
The Group classifies its financial liabilities in the following measurement categories:
(i) At fair value through profit or loss Derivatives are included within this category unless they are designated as hedges. Put options over non-controlling
interests in subsidiary companies and contingent consideration included in trade and other payables are measured at fair value through profit and loss.
(ii) Derivatives used for hedging Derivative instruments are classified within this category if they qualify for hedge accounting.
(iii) Amortised cost This category comprises non-derivative financial liabilities with fixed or determinable payments and fixed maturities.
Offsetting financial instruments
Financial assets and liabilities are offset and the net amount reported in the financial statement where the Group currently has a legally enforceable right to offset the recognised amounts, and there is an intention to settle on a net basis or realise the asset and settle the liability simultaneously. The Group has also entered into arrangements that do not meet the criteria for offsetting but still allow for the related amounts to be set off in certain circumstances, such as bankruptcy or the termination of a contract.

171SWIRE PACIFIC 2018 ANNUAL REPORT
20. Financial Instruments by Category (continued)
The accounting policies applied to financial instruments are shown below by line item:
Note
At fair value through
profit or lossHK$M
Derivatives used for hedging
HK$M
At fair valuethrough other
comprehensiveincomeHK$M
Amortised cost
HK$M
Total carryingamount
HK$M
Fairvalue
HK$M
Assets as per consolidated statement of financial position
At 31st December 2018
Loans due from joint venture companies 19a – – – 15,470 15,470 15,470
Loans due from associated companies 19b – – – 167 167 167
Equity investments at fair value through other comprehensive income 21a – – 244 – 244 244
Derivative financial assets 22 1 188 – – 189 189
Trade and other receivables excluding prepayments 25 – – – 9,030 9,030 9,030
Contract assets – – – 1,176 1,176 1,176
Bank balances and short-term deposits 26 – – – 9,112 9,112 9,112
Total 1 188 244 34,955 35,388 35,388
Note
At fair valuethrough
profit or lossHK$M
Derivativesused forhedging
HK$M
Available-for-sale
HK$M
Loans andreceivables
HK$M
Totalcarryingamount
HK$M
Fairvalue
HK$M
At 31st December 2017
Available-for-sale assets 21b – – 375 – 375 375
Derivative financial assets 22 2 227 – – 229 229
Trade and other receivables excluding prepayments 25 – – – 10,185 10,185 10,185
Bank balances and short-term deposits 26 – – – 6,072 6,072 6,072
Total 2 227 375 16,257 16,861 16,861
Note
At fair valuethrough
profit or lossHK$M
Derivativesused forhedging
HK$M
Amortisedcost
HK$M
Totalcarryingamount
HK$M
Fairvalue
HK$M
Liabilities as per consolidated statement of financial position
At 31st December 2018
Trade and other payables excluding non-financial liabilities 28 1,870 – 24,678 26,548 26,548
Contract liabilities – – 438 438 438
Derivative financial liabilities 22 39 159 – 198 198
Short-term loans 29 – – 3,227 3,227 3,227
Long-term loans and bonds due within one year 29 – – 8,301 8,301 8,379
Long-term loans and bonds due after one year 29 – – 60,251 60,251 60,354
Total 1,909 159 96,895 98,963 99,144
At 31st December 2017
Trade and other payables excluding non-financial liabilities 28 2,265 – 22,517 24,782 24,782
Derivative financial liabilities 22 6 94 – 100 100
Short-term loans 29 – – 671 671 671
Long-term loans and bonds due within one year 29 – – 8,741 8,741 8,741
Long-term loans and bonds due after one year 29 – – 69,174 69,174 70,770
Total 2,271 94 101,103 103,468 105,064

172 NOTES TO THE FINANCIAL STATEMENTS
20. Financial Instruments by Category (continued)
The fair values of financial instruments traded in active markets are based on quoted market prices at the year-end date. The quoted market prices used for financial assets held by the Group are the current bid prices.
The fair values of financial instruments that are not traded in active markets are determined by using valuation techniques such as estimated discounted cash flows or based on quotes from market makers, which use assumptions that are based on market conditions existing at each year-end date.
The book values of trade and other receivables, trade and other payables and provisions approximate their fair values.
The fair value of current borrowings equals their carrying value, as the impact of discounting is not significant. The fair value of non-current borrowings is not equal to their carrying value, but is based on cash flows discounted using assumptions sourced from the relevant financial institutions or quotes from market makers or alternative market participants supported by observable inputs, such as interest rates. Non-current borrowings would be categorised within level 2 of the fair value hierarchy if they were accounted for at fair value.
Financial instruments that are measured at fair value are included in the following fair value hierarchy:
NoteLevel 1HK$M
Level 2HK$M
Level 3HK$M
Total carryingamount
HK$M
Assets as per consolidated statement of financial position
At 31st December 2018
Equity investments at fair value through other comprehensive income 21a
– Listed investments 185 – – 185
– Unlisted investments – – 59 59
Derivative financial assets 22 – 189 – 189
Total 185 189 59 433
At 31st December 2017
Available-for-sale assets 21b
– Listed investments 319 – – 319
– Unlisted investments – – 56 56
Derivative financial assets 22 – 229 – 229
Total 319 229 56 604
Liabilities as per consolidated statement of financial position
At 31st December 2018
Derivative financial liabilities 22 – 198 – 198
Put option over non-controlling interest in Brickell City Centre 28 – – 601 601
Put option over a non-controlling interest in a subsidiary company 28 – – 99 99
Contingent consideration 28 – – 1,170 1,170
Total – 198 1,870 2,068
At 31st December 2017
Derivative financial liabilities 22 – 100 – 100
Put option over non-controlling interest in Brickell City Centre 28 – – 716 716
Put option over a non-controlling interest in a subsidiary company 28 – – 106 106
Contingent consideration 28 – – 1,443 1,443
Total – 100 2,265 2,365
Notes:The levels in the hierarchy represent the following:Level 1 – Financial instruments measured at fair value using quoted prices in active markets.Level 2 – Financial instruments measured at fair value using inputs other than quoted prices but where those inputs are based on observable market data. Level 3 – Financial instruments measured at fair value using inputs not based on observable market data.

173SWIRE PACIFIC 2018 ANNUAL REPORT
20. Financial Instruments by Category (continued)
The Group’s policy is to recognise any transfer into and out of fair value hierarchy levels as at the date of the event or change in circumstances that cause the transfer.
The change in level 3 financial instruments for the year is as follows:
Put options overnon-controlling
interestsHK$M
Unlistedinvestments
HK$M
Contingentconsideration
HK$M
At 1st January 2018 822 56 1,443
Translation differences 1 (1) 4
Additions 50 4 –
Adjustments on previous year’s acquisition – – (367)
Change in percentage of interest (150) – –
Change in fair value recognised in profit or loss during the year (23) – 165
Payment of consideration – – (75)
At 31st December 2018 700 59 1,170
Total gains/(losses) for the year included in profit or loss in respect of financial instruments held at 31st December 2018 23 – (165)
Change in unrealised gains/(losses) for the year included in profit or loss of financial instruments held at 31st December 2018 23 – (165)
Put options overnon-controlling
interestsHK$M
Unlistedinvestments
HK$M
Contingentconsideration
HK$M
At 1st January 2017 747 266 1,770
Translation differences 6 – 5
Additions 35 12 318
Disposals/adjustments on previous acquisitions – (116) (608)
Change in fair value recognised in profit or loss during the year 34 – 64
Transfer out of level 3 (note) – (106) –
Payment of consideration – – (106)
At 31st December 2017 822 56 1,443
Total losses for the year included in profit or loss in respect of financial instruments held at 31st December 2017 (34) – (64)
Change in unrealised losses for the year included in profit or loss of financial instruments held at 31st December 2017 (34) – (64)
Note: An unlisted investment has been transferred from level 3 to level 1 after it became a listed investment.
There has been no change in the valuation techniques for level 2 and level 3 fair value hierarchy classifications.
The fair value of derivatives used for hedging in level 2 has been based on quotes from market makers or discounted cash flow valuation techniques and is supported by observable inputs. The most significant observable inputs are market interest rates, exchange rates, yields and commodity prices.
The fair value estimate of the put option over a non-controlling interest in the retail portion of Brickell City Centre classified within level 3 is determined using a discounted cash flow valuation technique and contains a number of unobservable inputs, including the expected fair value of the investment property at the expected time of exercise, the expected time of exercise itself and the discount rate used. The expected time of exercise is in 2020 and the discount rate used is 6.3%. The investment property’s fair value at the expected time of exercise is itself subject to a number of unobservable inputs which are similar to the inputs for the Group’s other completed investment properties, including the expected fair market rent and the expected capitalisation rate. If the investment property’s expected fair value at the time of exercise is higher, the fair value of the put option would also be higher at 31st December 2018. If the expected time of exercise is later or if the discount rate is higher, then the fair value of the put option would be lower. The opposite is true for an earlier exercise time or a lower discount rate.

174 NOTES TO THE FINANCIAL STATEMENTS
Accounting Policy
Derivatives are initially recognised at fair value on the date a derivative contract is entered into and are subsequently remeasured at their fair value. The method of recognising the resulting gain or loss depends on whether the derivative is designated as a hedging instrument and, if so, the nature of the item being hedged. The Group designates certain derivatives as either: (a) hedges of the fair value of recognised assets or liabilities or a firm commitment (fair value hedges); (b) hedges of highly probable forecast transactions (cash flow hedges); or (c) hedges of net investments in foreign operations (net investment hedges).
The Group documents at the inception of transactions the economic relationship between hedging instruments and hedged items, including whether the derivatives that are used in hedging transactions are expected to offset changes in cash flows of hedged items. The Group also documents its risk management objective and strategy for undertaking various hedge transactions.
20. Financial Instruments by Category (continued)
The fair value of the put options over non-controlling interests in subsidiary companies (other than the subsidiary company holding a non-controlling interest in the retail portion of Brickell City Centre), unlisted investments and contingent consideration classified within level 3 are determined using a discounted cash flow valuation technique. The significant unobservable inputs used are expected future growth rates and discount rates. Changing these unobservable inputs to unobservable inputs based on reasonable alternative assumptions would not significantly change the valuation of the put options, unlisted investments and contingent consideration.
The Group’s finance departments perform the valuations of financial instruments required for reporting purposes, including level 3 fair values. The valuations are reviewed and approved by divisional finance directors.
21. (a) Equity investments at fair value through other comprehensive income2018
HK$M2017
HK$M
Non-current assets
Shares listed in Hong Kong 106 –
Shares listed overseas 79 –
Unlisted investments 59 –
244 –
(b) Available-for-sale Assets
Equity investments held by the Group were previously classified as available-for-sale assets up to year ended 31st December 2017.
2018HK$M
2017HK$M
Non-current assets
Shares listed in Hong Kong – 127
Shares listed overseas – 192
Unlisted investments – 56
– 375
22. Derivative Financial Instruments

175SWIRE PACIFIC 2018 ANNUAL REPORT
Accounting Policy (continued)
(a) Cash flow hedges that qualify for hedge accounting The effective portion of changes in the fair value of derivatives that are designated and qualify as cash flow hedges is
recognised in the cash flow hedge reserve within equity. The gain or loss relating to the ineffective portion is recognised immediately in the statement of profit or loss.
When option contracts are used to hedge forecast transactions, the Group designates only the intrinsic value of the options as the hedging instrument. Until 31st December 2017, the Group classified foreign currency options as held-for-trading derivatives and accounted for them at FVPL.
Gains or losses relating to the effective portion of the change in intrinsic value of the options are recognised in the cash flow hedge reserve within equity. The changes in the time value of the options that relate to the hedged item (‘aligned time value’) are recognised within OCI in the costs of hedging reserve within equity.
When forward contracts are used to hedge forecast transactions, the Group designates only the change in fair value of the forward contract related to the spot component as the hedging instrument. Gains or losses relating to the effective portion of the change in the spot component of the forward contracts are recognised in the cash flow hedge reserve within equity. The change in the forward element of the contract that relates to the hedged item (‘aligned forward element’) is recognised within OCI in the costs of hedging reserve within equity. In some cases, the Group may designate the full change in fair value of the forward contract (including forward points) as the hedging instrument. In such cases, the gains or losses relating to the effective portion of the change in fair value of the entire forward contract are recognised in the cash flow hedge reserve within equity.
When cross currency swap contracts are used to hedge future cash flows, the Group designates only the change in fair value of the swap contract after exclusion of the foreign currency basis spread component as the hedging instrument. Gains or losses relating to the effective portion of the swap contract after exclusion of foreign currency basis spread component are recognised in the cash flow hedge reserve within equity. The change in fair value of the foreign currency basis spread of the swap contract to the extent it relates to the hedged item is recognised separately as a cost of hedging on a systematic and rational basis over the period of the hedging relationship within OCI in equity. Hedge ineffectiveness is recognised in the statement of profit or loss within finance costs.
Amounts accumulated in equity are reclassified in the periods when the hedged item affects profit or loss, as follows:
(i) Where the hedged item subsequently results in the recognition of a non-financial asset (such as inventory), both the deferred hedging gains and losses and the deferred time value of the option contracts or deferred forward points, if any, are included within the initial cost of the asset. The deferred amounts are ultimately recognised in profit or loss as the hedged item affects profit or loss (for example through cost of sales).
(ii) The gains or losses relating to the effective portion of (a) the interest rate swaps hedging variable rate borrowings and (b) cross currency swap contracts hedging borrowings in foreign currency are recognised in profit or loss within finance cost at the same time as the interest expense on the hedged borrowings.
When a hedging instrument expires or is sold, or when a hedge no longer meets the criteria for hedge accounting, any cumulative gain or loss and deferred costs of hedging existing in equity at that time remains in equity and is recognised when the forecast transaction is ultimately recognised in the statement of profit or loss. When a forecast transaction is no longer expected to occur, the cumulative gain or loss and deferred costs of hedging that were reported in equity are immediately transferred to the statement of profit or loss.
22. Derivative Financial Instruments (continued)

176 NOTES TO THE FINANCIAL STATEMENTS
2018 2017
AssetsHK$M
LiabilitiesHK$M
AssetsHK$M
LiabilitiesHK$M
Cross-currency swaps
– cash flow hedges (a) 158 94 195 53
– not qualifying as hedges – 24 – 6
Interest rate swaps – cash flow hedges 24 6 11 5
Forward foreign exchange contracts
– cash flow hedges 6 14 21 6
– not qualifying as hedges 1 – 1 –
Commodity swaps – not qualifying as hedges – 15 1 –
Put options exercisable by joint venture partners for sale of their interests to Beverages Division – 45 – 30
Total 189 198 229 100
Analysed as:
– Current 109 28 55 11
– Non-current 80 170 174 89
189 198 229 100
(a) The cross-currency swaps principally hedge the foreign currency risk relating to US$ note issues. Gains and losses recognised in other comprehensive income on cross-currency swaps at 31st December 2018 are expected to affect the statement of profit or loss in the years to redemption of the notes (up to and including 2028). The total notional principal amount of the outstanding cross currency swap contracts at 31st December 2018 was HK$26,601 million (2017: HK$27,323 million). In most of the cases, the hedging instruments have a one-to-one hedge ratio with the hedged items.
(b) For the years ended 31st December 2018 and 31st December 2017 all cash flow hedges qualifying for hedge accounting were highly effective.
Accounting Policy (continued)
(b) Net investment hedges Hedges of net investments in foreign operations are accounted for similarly to cash flow hedges. Any gain or loss on the
hedging instrument relating to the effective portion of a hedge is recognised in equity; the gain or loss relating to the ineffective portion is recognised immediately in the statement of profit or loss.
Gains and losses accumulated in equity are transferred to the statement of profit or loss when the foreign operation is disposed of.
(c) Derivatives that do not qualify for hedge accounting Certain derivative instruments do not qualify for hedge accounting. Changes in the fair value of any derivative instruments
that do not qualify for hedge accounting are recognised immediately in the statement of profit or loss.
(d) Rebalancing of hedge relationships If the hedge ratio for risk management purpose is no longer optimal but the risk management objective remains
unchanged and the hedge continues to qualify for hedge accounting, the hedge relationship will be rebalanced by adjusting either the volume of the hedging instrument or the volume of the hedged item so that the hedge ratio aligns with the ratio used for risk management purposes. Any hedge ineffectiveness is calculated and accounted for in profit or loss at the time of the hedge relationship rebalancing.
22. Derivative Financial Instruments (continued)

177SWIRE PACIFIC 2018 ANNUAL REPORT
23. Properties Held for Development and Properties under Development and for Sale
Accounting Policy
Properties held for development comprise freehold land at cost, less provisions for possible losses. Properties held for development are not expected to be sold or developed within the Group’s normal operating cycle and are classified as non-current assets.
Properties under development and for sale comprise freehold and leasehold land at cost, construction costs and interest costs capitalised, less provisions for possible losses. Properties under development are active construction projects which are expected to be sold within the Group’s normal operating cycle and are classified as current assets. Properties for sale are available for immediate sale and are classified as current assets.
2018HK$M
2017HK$M
Properties held for development
Freehold land 1,141 1,126
Development cost 219 216
1,360 1,342
Properties under development and for sale
Completed properties – development costs 1,008 1,658
Completed properties – freehold land 92 120
Completed properties – leasehold land 1 167
Properties under development – development costs 30 17
Properties under development – leasehold land 338 338
1,469 2,300
24. Stocks and Work in Progress
Accounting Policy
Stocks and work in progress are stated at the lower of cost and net realisable value. Cost represents average unit cost and net realisable value is determined on the basis of anticipated sales proceeds less estimated selling expenses. The costs of finished goods and work in progress comprise direct material and labour costs and an appropriate proportion of production overhead expenses less provisions for foreseeable losses. Cost also includes the transfer from equity of any gains/losses on qualifying cash flow hedges relating to purchases of raw materials or stocks.
2018HK$M
2017HK$M
Goods for sale 2,980 2,785
Manufacturing materials 879 887
Production supplies 1,381 1,370
Work in progress 2 1,187
5,242 6,229
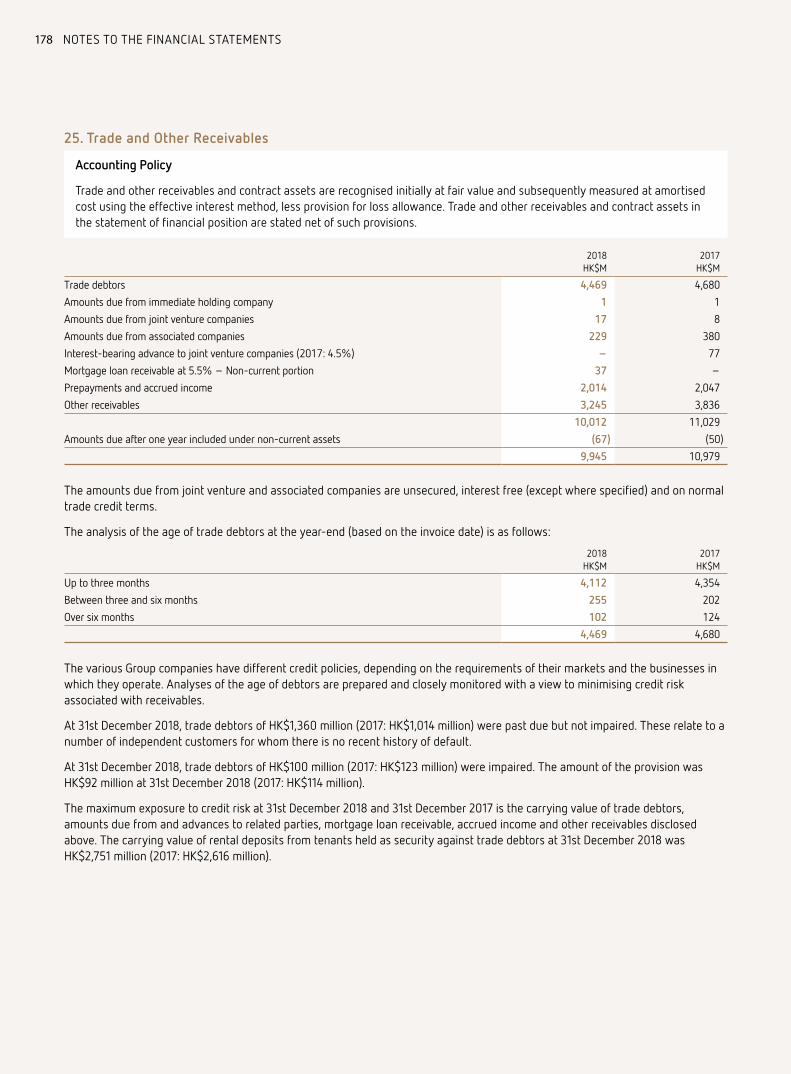
178 NOTES TO THE FINANCIAL STATEMENTS
25. Trade and Other Receivables
Accounting Policy
Trade and other receivables and contract assets are recognised initially at fair value and subsequently measured at amortised cost using the effective interest method, less provision for loss allowance. Trade and other receivables and contract assets in the statement of financial position are stated net of such provisions.
2018HK$M
2017HK$M
Trade debtors 4,469 4,680
Amounts due from immediate holding company 1 1
Amounts due from joint venture companies 17 8
Amounts due from associated companies 229 380
Interest-bearing advance to joint venture companies (2017: 4.5%) – 77
Mortgage loan receivable at 5.5% – Non-current portion 37 –
Prepayments and accrued income 2,014 2,047
Other receivables 3,245 3,836
10,012 11,029
Amounts due after one year included under non-current assets (67) (50)
9,945 10,979
The amounts due from joint venture and associated companies are unsecured, interest free (except where specified) and on normal trade credit terms.
The analysis of the age of trade debtors at the year-end (based on the invoice date) is as follows:
2018HK$M
2017HK$M
Up to three months 4,112 4,354
Between three and six months 255 202
Over six months 102 124
4,469 4,680
The various Group companies have different credit policies, depending on the requirements of their markets and the businesses in which they operate. Analyses of the age of debtors are prepared and closely monitored with a view to minimising credit risk associated with receivables.
At 31st December 2018, trade debtors of HK$1,360 million (2017: HK$1,014 million) were past due but not impaired. These relate to a number of independent customers for whom there is no recent history of default.
At 31st December 2018, trade debtors of HK$100 million (2017: HK$123 million) were impaired. The amount of the provision was HK$92 million at 31st December 2018 (2017: HK$114 million).
The maximum exposure to credit risk at 31st December 2018 and 31st December 2017 is the carrying value of trade debtors, amounts due from and advances to related parties, mortgage loan receivable, accrued income and other receivables disclosed above. The carrying value of rental deposits from tenants held as security against trade debtors at 31st December 2018 was HK$2,751 million (2017: HK$2,616 million).

179SWIRE PACIFIC 2018 ANNUAL REPORT
26. Bank Balances and Short-Term Deposits
Accounting Policy
Cash and cash equivalents comprise cash in hand, amounts repayable on demand from banks and financial institutions and short-term highly liquid investments which were within three months of maturity when acquired, less bank overdrafts.
2018HK$M
2017HK$M
Bank balances and short-term deposits maturing within three months 9,102 5,951
Short-term deposits maturing after more than three months 10 121
9,112 6,072
The effective interest rates on short-term deposits of the Group ranged from 0.01% to 4.00% (2017: 0.01% to 4.00%); these deposits have maturities from 2 to 365 days (2017: 2 to 365 days).
The maximum exposure to credit risk in respect of bank balances and short-term deposits at 31st December 2018 and 31st December 2017 is the carrying value of the bank balances and short-term deposits disclosed above.
27. Assets and Liabilities Directly Associated With Assets Classified As Held For Sale
Accounting Policy
Non-current assets (or disposal groups) are classified as held for sale if their carrying amount will be recovered principally through a sale transaction rather than through continuing use and a sale is considered highly probable. They are measured at the lower of their carrying amount and fair value less costs to sell, except for assets such as deferred tax assets, financial assets and investment property that are carried at fair value.
Assets classified as held for sale mainly relate to a sale and purchase agreement entered into by a subsidiary of Swire Properties Limited (SPL) with a third party on 15th June 2018 for the sale of a 100% interest in a subsidiary company which indirectly owns SPL’s interests in the Cityplaza Three and Cityplaza Four office buildings. The consideration for the sale is HK$15,000 million, subject to adjustments. The relevant subsidiaries were classified as held for sale at 31st December 2018. The fair value of the investment properties owned by the relevant subsidiaries was determined by reference to the consideration payable under the sale and purchase agreement.
Assets held for sale also include several wholly-owned subsidiaries of SPL holding investment properties in respect of which a sale and purchase agreement was entered into on 28th August 2018. The fair value of these investment properties is measured in accordance with the policies, processes and techniques described in note 15. The total consideration on the sale of HK$2,037 million resulted in a profit on sale of subsidiaries being recorded on 18th January 2019 when the transaction was completed.

180 NOTES TO THE FINANCIAL STATEMENTS
28. Trade and Other Payables
Accounting Policy
Trade and other payables (except put options over non-controlling interests in subsidiary companies and contingent consideration) and contract liabilities are recognised initially at fair value and subsequently measured at amortised cost using the effective interest method.
2018HK$M
2017HK$M
Trade creditors 3,969 4,572
Amounts due to immediate holding company 245 164
Amounts due to joint venture companies 30 7
Amounts due to associated companies 309 164
Interest-bearing advances from joint venture companies at 2.74% (2017: 0.73% to 3.05%) 53 353
Interest-bearing advances from an associated company at 4.12% (2017: 2.99%) 293 292
Advances from non-controlling interests 35 34
Rental deposits from tenants 2,751 2,616
Put options over non-controlling interests 700 822
Deposits received on the sale of subsidiary companies 3,238 1,306
Contingent consideration 1,170 1,443
Accrued capital expenditure 1,343 922
Other accruals 8,169 6,952
Other payables 4,476 5,135
26,781 24,782
Amounts due after one year included under non-current liabilities (1,679) (2,343)
25,102 22,439
The amounts due to and advances from immediate holding, joint venture and associated companies, and non-controlling interests are unsecured and have no fixed terms of repayment. The interest-bearing advance from an associated company is unsecured and repayable in 2021. Apart from certain amounts due to joint venture and associated companies, which are interest-bearing as specified above, the balances are interest free.
The analysis of the age of trade creditors at the year-end is as follows:
2018HK$M
2017HK$M
Up to three months 3,841 4,382
Between three and six months 70 126
Over six months 58 64
3,969 4,572

181SWIRE PACIFIC 2018 ANNUAL REPORT
29. Borrowings
Accounting Policy
Borrowings are recognised initially at fair value and subsequently measured at amortised cost. Transaction costs incurred are included for those not held at fair value through profit or loss. Borrowings are subsequently stated at amortised cost, with any difference between the proceeds (net of transaction costs) and the redemption value recognised in the statement of profit or loss over the period of the borrowings using the effective interest method.
Borrowings are classified as current liabilities unless the Group has an unconditional right to defer settlement of the liability for at least 12 months after the period-end date.
For disclosure purposes, the fair value of borrowings stated at amortised cost is estimated by discounting the future contractual cash flows at the current market interest rate that is available to the Group for similar financial instruments.
Refer to the tables with the heading “Audited Financial Information” on pages 79 to 85 for details of the Group’s borrowings.
30. Deferred Taxation
Accounting Policy
Deferred taxation is provided in full, using the liability method, on temporary differences arising between the tax bases of assets and liabilities and their carrying amounts in the financial statements. However, if the deferred tax arises from initial recognition of an asset or liability in a transaction other than a business combination that, at the time of the recognition, has no impact on taxable nor accounting profit or loss, it is not recognised. Tax rates enacted or substantially enacted by the period-end date are used to determine deferred taxation.
Deferred tax assets are recognised to the extent that it is probable that future taxable profit will be available against which the temporary differences can be utilised.
Deferred taxation is provided on temporary differences arising on investments in subsidiary, joint venture and associated companies, except where the timing of the reversal of the temporary difference is controlled by the Group and it is probable that the temporary difference will not reverse in the foreseeable future.
Deferred taxation relating to investment properties in Hong Kong and the USA is calculated having regard to the presumption that the value of these properties is capable of being recovered entirely through sale. This presumption is rebutted in relation to investment properties in Mainland China, because the business model applicable to them is to consume substantially all the economic benefits embodied in them over time rather than through sale. Accordingly, deferred tax relating to investment properties in Mainland China is determined on the basis of recovery through use.
Deferred tax assets and liabilities are netted off when the taxes relate to the same taxation authority and where offsetting is legally enforceable. The following amounts, determined after appropriate offsetting, are shown separately on the statement of financial position:
2018HK$M
2017HK$M
Deferred tax assets 454 603
Deferred tax liabilities (10,034) (9,881)
(9,580) (9,278)
Substantially all deferred tax balances are to be recovered or settled after more than 12 months.

182 NOTES TO THE FINANCIAL STATEMENTS
30. Deferred Taxation (continued)
The movement on the net deferred tax liabilities account is as follows:
Note2018
HK$M2017
HK$M
At 1st January
as originally stated 9,278 7,594
adjustment on adoption of HKFRS 15 3 –
as restated 9,281 7,594
Translation differences (270) 295
Adjustments on previous year’s acquisition of subsidiaries 2 –
Transfer to assets classified as held for sale 5 –
Acquisition of a subsidiary company (2017: and new businesses) 10 665
Disposal of subsidiary companies (3) 18
Charged to statement of profit or loss 10 628 762
Credited to other comprehensive income (73) (56)
At 31st December 9,580 9,278
The movement in deferred tax assets and liabilities (prior to offsetting balances within the same taxation jurisdiction) during the year is as follows:
Deferred tax liabilitiesAccelerated tax
depreciationValuation of
investment properties Others Total
2018HK$M
2017HK$M
2018HK$M
2017HK$M
2018HK$M
2017HK$M
2018HK$M
2017HK$M
At 1st January
as originally stated 4,341 4,159 4,534 4,032 2,251 1,664 11,126 9,855
adjustment on adoption of HKFRS 15 – – – – 3 – 3 –
as restated 4,341 4,159 4,534 4,032 2,254 1,664 11,129 9,855
Translation differences (34) 38 (204) 277 (49) 51 (287) 366
Adjustments on previous year’s acquisition of subsidiaries – – – – 2 – 2 –
Transfer to assets classified as held for sale 5 – – – – – 5 –
Acquisition of a subsidiary/new businesses – – – – 10 796 10 796
Disposal of a subsidiary (3) (23) – – – – (3) (23)
Charged/(credited) to statement of profit or loss 337 167 501 225 (214) (232) 624 160
Credited to other comprehensive income – – – – (8) (28) (8) (28)
At 31st December 4,646 4,341 4,831 4,534 1,995 2,251 11,472 11,126
Deferred tax assetsProvisions Tax losses Others Total
2018HK$M
2017HK$M
2018HK$M
2017HK$M
2018HK$M
2017HK$M
2018HK$M
2017HK$M
At 1st January 621 561 302 608 925 1,092 1,848 2,261
Translation differences (11) 14 – 7 (6) 50 (17) 71
Acquisition of new businesses – 68 – – – 63 – 131
Disposal of a subsidiary – (1) – – – (40) – (41)
(Charged)/credited to statement of profit or loss (134) (21) 128 (313) 2 (268) (4) (602)
Credited to other comprehensive income – – – – 65 28 65 28
At 31st December 476 621 430 302 986 925 1,892 1,848

183SWIRE PACIFIC 2018 ANNUAL REPORT
30. Deferred Taxation (continued)
Deferred tax assets are recognised in respect of tax losses carried forward to the extent that realisation of the related tax benefits through future taxable profits is probable. The Group has unrecognised tax losses of HK$3,703 million (2017: HK$4,276 million) to carry forward against future taxable income.
These amounts are analysed as follows:
Unrecognised Tax Losses
2018HK$M
2017HK$M
No expiry date 1,302 1,698
Expiring in 2018 – 231
Expiring in 2019 87 92
Expiring in 2020 116 121
Expiring in 2021 150 210
Expiring in 2022 (2017: 2022 or after) 273 1,924
Expiring in 2023 or after 1,775 –
3,703 4,276
31. Retirement Benefits
The Group operates a number of defined benefit and defined contribution retirement benefit schemes for its employees, the assets of which are generally held in separate trustee-administered funds.
A defined benefit scheme is a retirement plan that defines the benefit that an employee will receive on retirement, usually dependent on one or more factors such as age, years of service and compensation. The Group has an obligation to provide participating employees with these benefits.
A defined contribution scheme is a retirement plan under which the Group pays fixed contributions into a separate entity. The Group has no legal or constructive obligations to pay further contributions if the fund does not hold sufficient assets to pay all employees the benefits relating to employee service in the current and prior periods.
Accounting Policy
For defined benefit schemes, retirement benefit costs are assessed using the projected unit credit method. Under this method, the cost of providing retirement benefits is charged to the statement of profit or loss so as to spread the regular cost over the service lives of employees.
The asset or liability recognised on the statement of financial position is the present value of the cost of providing these benefits (the defined benefit obligation) less the fair value of the plan assets at the end of the reporting period. The defined benefit obligation is calculated annually by independent actuaries and is determined by discounting the estimated future cash flows using interest rates of high quality corporate bonds. The plan assets are valued on a bid price basis.
Actuarial gains and losses arising from experience adjustments and changes in actuarial assumptions are charged or credited to equity in other comprehensive income in the period in which they arise. Past-service costs are recognised immediately in the statement of profit or loss. Any differences between the implicit and actual return on assets are charged as remeasurements to other comprehensive income.
For defined contribution schemes, the Group’s contributions are charged to the statement of profit or loss in the periods to which the contributions relate.

184 NOTES TO THE FINANCIAL STATEMENTS
31. Retirement Benefits (continued)
Critical Accounting Estimates and Judgements
The Group’s obligations and expenses in respect of defined benefit schemes are dependent on a number of factors that are determined using a number of actuarial assumptions. The details of the actuarial assumptions used, including applicable sensitivities are disclosed in note 31(f).
For the year ended 31st December 2018, disclosures are based on valuations prepared by Mercer (Hong Kong) Limited at 31st December 2018. For the year ended 31st December 2017, disclosures are based on valuations prepared by Mercer (Hong Kong) Limited at 31st December 2015, which were updated to reflect the position at 31st December 2017 by Cannon Trustees Limited, the main administration manager of the Group’s defined benefit schemes. Schemes in the USA and Taiwan are valued by independent qualified actuaries. In addition, the Group operates a post-employment health care and life insurance benefit plan for certain retired employees in the USA. The plan is unfunded. The method of accounting and the frequency of valuations are similar to those used for defined benefit schemes.
The majority of the Group’s schemes are final salary guaranteed lump sum defined benefit plans.
Contributions to the defined benefit retirement schemes are made in accordance with the funding rates recommended by independent qualified actuaries to ensure that the plans will be able to meet their liabilities as they become due. The funding rates are subject to annual review and are determined by taking into consideration the difference between the market values of the plans’ assets and the present value of accrued past service liabilities, on an ongoing basis, as computed by reference to actuarial valuations. The principal schemes in Hong Kong are valued by qualified actuaries for funding purposes under the provision of Hong Kong’s Occupational Retirement Schemes Ordinance. The latest actuarial valuations indicate that the funding level was 109% (2017: 99%) of the accrued liabilities on an ongoing basis. The Group expects to make contributions of HK$218 million to its defined benefit schemes in 2019.
Most new employees in Hong Kong are offered the choice of joining the defined benefit retirement schemes or the mandatory provident fund (MPF) scheme. Where staff elect to join the MPF scheme, both the Company and the staff are required to contribute 5% of the employees’ relevant monthly income (capped at HK$30,000). Staff may elect to contribute more than the minimum as a voluntary contribution. Employees engaged outside Hong Kong are covered by appropriate local arrangements.
(a) The amounts recognised in the statement of financial position are as follows:
2018HK$M
2017HK$M
Present value of funded obligations 6,144 6,324
Fair value of plan assets (5,084) (5,461)
1,060 863
Present value of unfunded obligations 68 76
Net retirement benefit liabilities 1,128 939
Represented by:
Retirement benefit assets (89) (93)
Retirement benefit liabilities 1,217 1,032
1,128 939

185SWIRE PACIFIC 2018 ANNUAL REPORT
31. Retirement Benefits (continued)
(b) Changes in the present value of the defined benefit obligations are as follows:
2018HK$M
2017HK$M
At 1st January 6,400 5,776
Translation differences (8) 39
Transfer of members 4 (12)
Current service cost 308 330
Interest expense 187 207
Actuarial (gains)/losses from changes in:
demographic assumptions (6) (9)
financial assumptions (291) 440
Experience losses 115 97
Employee contributions 2 2
Benefits paid (477) (463)
Curtailments and settlements (22) (7)
At 31st December 6,212 6,400
The weighted average duration of the defined benefit obligations is 9.1 years (2017: 8.7 years).
(c) Changes in the fair value of plan assets are as follows:
2018HK$M
2017HK$M
At 1st January 5,461 4,716
Translation differences (3) 16
Transfer of members 4 (12)
Interest income 160 171
Return on plan assets, excluding interest income (386) 511
Contributions by employers 331 523
Employee contributions – 1
Benefits paid (468) (459)
Curtailments and settlements (15) (6)
At 31st December 5,084 5,461
There were no plan amendments during the year.
(d) Net expenses recognised in the statement of profit or loss are as follows:
2018HK$M
2017HK$M
Current service cost 308 330
Past service cost – curtailments 1 1
Net interest cost 27 36
336 367
The above net expenses were included in costs of sales, distribution costs and administrative expenses in the statement of profit or loss.
Total retirement benefit costs charged to the statement of profit or loss for the year ended 31st December 2018 amounted to HK$736 million (2017: HK$751 million), including HK$400 million (2017: HK$384 million) in respect of defined contribution schemes.
The actual return on defined benefit plan assets was a loss of HK$226 million (2017: gain of HK$682 million).

186 NOTES TO THE FINANCIAL STATEMENTS
31. Retirement Benefits (continued)
(e) The plan assets are invested in the Swire Group Unitised Trust (the Unitised Trust). The Unitised Trust has three sub-funds in which the assets may be invested in accordance with separate and distinct investment policies and objectives. The Unitised Trust and sub-funds are overseen by an investment committee, which meets four times a year.
The make-up of the Unitised Trust is the result of the asset allocation of each plan. The asset allocation of each plan targets a mix of equities, bonds and absolute return funds.
The management of the assets within the sub-funds is delegated by the investment committee to a number of reputable investment managers. The plan assets comprise:
2018HK$M
2017HK$M
Equities
Asia Pacific 316 627
Europe 304 367
North America 830 1,031
Emerging markets 716 632
Bonds
Global 2,262 2,409
Emerging markets 135 132
Absolute return funds 187 189
Cash 334 74
5,084 5,461
At 31st December 2018, the prices of 96% of equities and 39% of bonds were quoted on active markets (31st December 2017: 96% and 54% respectively). The remainder of the prices were not quoted on active markets.
The most significant risk facing the defined benefit schemes of the Group is market risk. This risk embodies the potential for losses and gains and includes price risk, interest rate risk and currency risk as well as factors specific to an individual investment or its issuer or risk specific to a certain market. Market risk is managed principally through diversification of investments by the appointed investment managers. Investment managers enter into agreements that stipulate the performance objective of the investments, which is referenced to a recognised benchmark. The investment committee monitors the overall market risk position on a quarterly basis.
(f) The significant actuarial assumptions used are as follows:
2018 2017
Hong Kong%
Others%
Hong Kong%
Others%
Discount rate 3.34 1.00-4.30 2.84 1.00-3.85
Expected rate of future salary increases 3.50-4.50 2.75-3.60 4.00 3.00-3.71
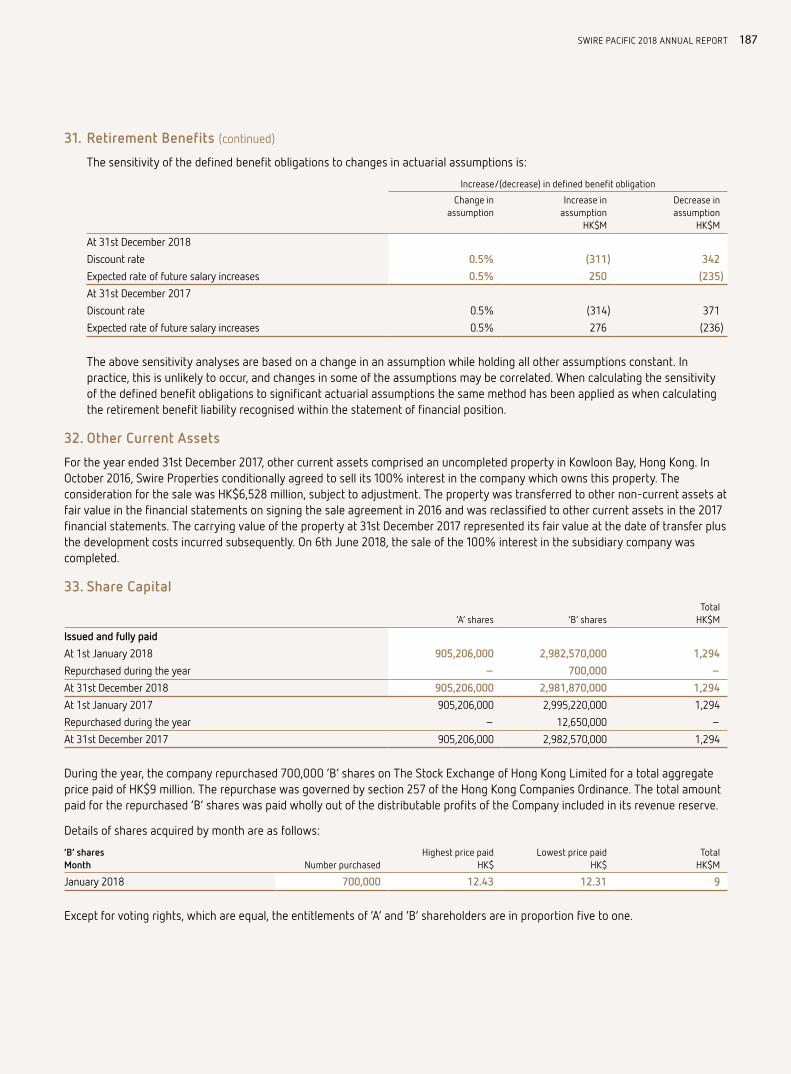
187SWIRE PACIFIC 2018 ANNUAL REPORT
31. Retirement Benefits (continued)
The sensitivity of the defined benefit obligations to changes in actuarial assumptions is:
Increase/(decrease) in defined benefit obligation
Change inassumption
Increase inassumption
HK$M
Decrease inassumption
HK$M
At 31st December 2018
Discount rate 0.5% (311) 342
Expected rate of future salary increases 0.5% 250 (235)
At 31st December 2017
Discount rate 0.5% (314) 371
Expected rate of future salary increases 0.5% 276 (236)
The above sensitivity analyses are based on a change in an assumption while holding all other assumptions constant. In practice, this is unlikely to occur, and changes in some of the assumptions may be correlated. When calculating the sensitivity of the defined benefit obligations to significant actuarial assumptions the same method has been applied as when calculating the retirement benefit liability recognised within the statement of financial position.
32. Other Current Assets
For the year ended 31st December 2017, other current assets comprised an uncompleted property in Kowloon Bay, Hong Kong. In October 2016, Swire Properties conditionally agreed to sell its 100% interest in the company which owns this property. The consideration for the sale was HK$6,528 million, subject to adjustment. The property was transferred to other non-current assets at fair value in the financial statements on signing the sale agreement in 2016 and was reclassified to other current assets in the 2017 financial statements. The carrying value of the property at 31st December 2017 represented its fair value at the date of transfer plus the development costs incurred subsequently. On 6th June 2018, the sale of the 100% interest in the subsidiary company was completed.
33. Share Capital
‘A’ shares ‘B’ sharesTotal
HK$M
Issued and fully paid
At 1st January 2018 905,206,000 2,982,570,000 1,294
Repurchased during the year – 700,000 –
At 31st December 2018 905,206,000 2,981,870,000 1,294
At 1st January 2017 905,206,000 2,995,220,000 1,294
Repurchased during the year – 12,650,000 –
At 31st December 2017 905,206,000 2,982,570,000 1,294
During the year, the company repurchased 700,000 ‘B’ shares on The Stock Exchange of Hong Kong Limited for a total aggregate price paid of HK$9 million. The repurchase was governed by section 257 of the Hong Kong Companies Ordinance. The total amount paid for the repurchased ‘B’ shares was paid wholly out of the distributable profits of the Company included in its revenue reserve.
Details of shares acquired by month are as follows:
‘B’ sharesMonth Number purchased
Highest price paidHK$
Lowest price paidHK$
TotalHK$M
January 2018 700,000 12.43 12.31 9
Except for voting rights, which are equal, the entitlements of ‘A’ and ‘B’ shareholders are in proportion five to one.

188 NOTES TO THE FINANCIAL STATEMENTS
34. Reserves
Note
Revenuereserve
HK$M
Propertyrevaluation
reserveHK$M
Investmentrevaluation
reserveHK$M
Cash flowhedge
reserveHK$M
Translationreserve
HK$MTotal
HK$M
At 1st January 2018
as originally stated 246,881 2,190 342 (762) 3,218 251,869
adjustment on adoption of HKFRS 9 326 – (326) – – –
adjustment on adoption of HKFRS 15 331 – – – – 331
as restated 247,538 2,190 16 (762) 3,218 252,200
Profit for the year 23,629 – – – – 23,629
Other comprehensive income
Defined benefit plans
– remeasurement losses recognised during the year (196) – – – – (196)
– deferred tax 37 – – – – 37
Cash flow hedges
– losses recognised during the year – – – (110) – (110)
– transferred to net finance charges – – – (72) – (72)
– transferred to operating profit – – – (14) – (14)
– deferred tax – – – 30 – 30
Changes in the fair value of equity investments at fair value through other comprehensive income – – (135) – – (135)
Revaluation of property previously occupied by the Group
– gains recognised during the year – 16 – – – 16
– deferred tax – (1) – – – (1)
Share of other comprehensive income of joint venture and associated companies (123) – 3 928 (1,344) (536)
Net translation differences on foreign operations
– losses recognised during the year – – – – (1,710) (1,710)
– reclassified to profit or loss on disposal – – – – 35 35
Total comprehensive income for the year 23,347 15 (132) 762 (3,019) 20,973
Acquisition of non-controlling interests (580) – – – – (580)
Repurchase of the Company’s shares (9) – – – – (9)
2017 second interim dividend 12 (1,652) – – – – (1,652)
2018 first interim dividend 12 (1,802) – – – – (1,802)
At 31st December 2018 266,842 2,205 (116) – 199 269,130

189SWIRE PACIFIC 2018 ANNUAL REPORT
34. Reserves (continued)
Revenuereserve
HK$M
Propertyrevaluation
reserveHK$M
Investmentrevaluation
reserveHK$M
Cash flowhedge
reserveHK$M
Translationreserve
HK$MTotal
HK$M
At 1st January 2017 224,464 2,090 469 (2,504) (934) 223,585
Profit for the year 26,070 – – – – 26,070
Other comprehensive income
Defined benefit plans
– remeasurement losses recognised during the year (46) – – – – (46)
– deferred tax (24) – – – – (24)
Cash flow hedges
– losses recognised during the year – – – (302) – (302)
– transferred to net finance charges – – – (75) – (75)
– transferred to operating profit – – – (88) – (88)
– deferred tax – – – 80 – 80
Net fair value changes on available-for-sale assets
– gains recognised during the year – – 69 – – 69
– transferred to profit or loss on disposal – – (1) – – (1)
Revaluation of property previously occupied by the Group
– gains recognised during the year – 103 – – – 103
– deferred tax – (3) – – – (3)
Share of other comprehensive income of joint venture and associated companies 351 – (195) 2,127 1,594 3,877
Net translation differences on foreign operations
– gains recognised during the year – – – – 2,554 2,554
– reclassified to profit or loss on disposal – – – – 4 4
Total comprehensive income for the year 26,351 100 (127) 1,742 4,152 32,218
Acquisition of non-controlling interests (611) – – – – (611)
Repurchase of the Company’s shares (165) – – – – (165)
2016 second interim dividend (1,655) – – – – (1,655)
2017 first interim dividend 12 (1,503) – – – – (1,503)
At 31st December 2017 246,881 2,190 342 (762) 3,218 251,869
(a) The Group revenue reserve includes retained revenue reserves from joint venture companies amounting to HK$10,178 million (2017: HK$6,548 million) and retained revenue reserves from associated companies amounting to HK$25,321 million (2017: HK$24,321 million).
(b) The Group revenue reserve includes HK$2,703 million (2017: HK$1,652 million) representing the declared second interim dividend for the year (note 12).
(c) As at 31st December 2018, the Group’s cash flow hedge reserve included HK$62 million (net of tax) relating to the currency basis element of the Group’s derivatives which is recognised separately as a cost of hedging.

190 NOTES TO THE FINANCIAL STATEMENTS
35. Non-controlling Interests
The movement of non-controlling interests during the year is as follows:
2018HK$M
2017HK$M
At 1st January
as originally stated 52,931 47,289
adjustment on adoption of HKFRS 15 32 –
as restated 52,963 47,289
Share of profits less losses for the year 5,791 6,312
Share of defined benefit plans
– remeasurement (losses)/gains recognised during the year (8) 29
– deferred tax 1 (5)
Share of cash flow hedges
– losses recognised during the year (29) (47)
– transferred to net finance charges (5) 1
– deferred tax 6 8
Share of revaluation of property previously occupied by the Group
– gains recognised during the year 3 22
Share of other comprehensive income of joint venture and associated companies (124) 142
Share of translation differences on foreign operations
– (losses)/gains recognised during the year (371) 497
– reclassified to profit or loss on disposal – 2
Share of total comprehensive income 5,264 6,961
Dividends paid and payable (1,128) (1,152)
Acquisition of non-controlling interests in subsidiary companies (2,438) (774)
Change in composition of the Group 22 366
Capital contribution from non-controlling interests accrued 8 241
At 31st December 54,691 52,931

191SWIRE PACIFIC 2018 ANNUAL REPORT
36. Company Statement of Financial Position and Reserves
(a) Company Statement of Financial Position
Note2018
HK$M2017
HK$M
ASSETS AND LIABILITIES
Non-current assets
Property, plant and equipment 10 12
Subsidiary companies 43,009 44,198
Joint venture companies 114 114
Associated companies 4,624 4,624
Equity investments at fair value through other comprehensive income 105 –
Available-for-sale assets – 127
Retirement benefit assets 29 37
47,891 49,112
Current assets
Trade and other receivables 78 53
Bank balances and short-term deposits 1,297 112
1,375 165
Current liabilities
Trade and other payables 34,491 39,427
Short-term bank loans 2,969 –
37,460 39,427
Net current liabilities (36,085) (39,262)
Total assets less current liabilities 11,806 9,850
Non-current liabilities
Deferred tax liabilities 4 5
NET ASSETS 11,802 9,845
EQUITY
Equity attributable to the Company’s shareholders
Share capital 33 1,294 1,294
Reserves 36(b) 10,508 8,551
TOTAL EQUITY 11,802 9,845
Merlin SwireMichelle LowPaul K EtchellsDirectorsHong Kong, 14th March 2019

192 NOTES TO THE FINANCIAL STATEMENTS
36. Company Statement of Financial Position and Reserves (continued)
(b) The movement of reserves during the year is as follows:
Note
Revenuereserve
HK$M
Investmentrevaluation
reserveHK$M
TotalHK$M
Company
At 1st January 2018 8,511 40 8,551
Profit for the year 5,440 – 5,440
Other comprehensive income
Defined benefit plans
– remeasurement gains recognised during the year 3 – 3
– deferred tax (1) – (1)
Changes in the fair value of equity investments at fair value through other comprehensive income – (22) (22)
Total comprehensive income for the year 5,442 (22) 5,420
Repurchase of the Company’s shares (9) – (9)
2017 second interim dividend 12 (1,652) – (1,652)
2018 first interim dividend 12 (1,802) – (1,802)
At 31st December 2018 10,490 18 10,508
Company
At 1st January 2017 5,517 5 5,522
Profit for the year 6,312 – 6,312
Other comprehensive income
Defined benefit plans
– remeasurement gains recognised during the year 6 – 6
– deferred tax (1) – (1)
Net fair value changes on available-for-sale assets – 35 35
Total comprehensive income for the year 6,317 35 6,352
Repurchase of the Company’s shares (165) – (165)
2016 second interim dividend (1,655) – (1,655)
2017 first interim dividend 12 (1,503) – (1,503)
At 31st December 2017 8,511 40 8,551
(i) Distributable reserves of the Company at 31st December 2018 amounted to HK$10,490 million (2017: HK$8,511 million).
(ii) The Company revenue reserve includes HK$2,703 million (2017: HK$1,652 million) representing the declared second interim dividend for the year (note 12).

193SWIRE PACIFIC 2018 ANNUAL REPORT
37. Current year’s adjustments on Business Combination and Other Related Transactions in 2017
(a) Acquisition of additional territory rights in the Pacific Northwest, USA and certain distribution and production assets
In February 2017 and April 2017, Swire Coca-Cola completed the acquisition from subsidiaries of The Coca-Cola Company (TCCC) of additional territory rights in the states of Washington, Oregon and Idaho in the Pacific Northwest, USA and the acquisition of certain distribution and production assets. The acquisition expanded the Group’s beverage business in the USA.
At 31st December 2017, the initial accounting for the acquisition of distribution and production assets in Pacific Northwest was incomplete and provisional amounts were reported pending the receipt of final valuations of the assets acquired. After finalisation of the completion financial statements and receipt of the final valuations of the assets acquired, the following measurement period adjustments were recognised in the current period:
Provisional amountsat 31st December 2017
HK$M
Final amountsat 31st December 2018
HK$M
Measurement periodadjustments recognised
in the current periodHK$M
Purchase consideration:
Cash paid 1,371 1,305 (66)
Contingent consideration 318 283 (35)
1,689 1,588 (101)
Property, plant and equipment 912 912 –
Intangible assets 495 450 (45)
Deferred tax assets 20 25 5
Stocks and work in progress 236 236 –
Other receivables 88 26 (62)
Trade and other payables (93) (99) (6)
Net identifiable assets acquired 1,658 1,550 (108)
Goodwill 31 38 7
1,689 1,588 (101)
Purchase consideration settled in cash and net cash outflow on acquisition 1,371 1,305 (66)

194 NOTES TO THE FINANCIAL STATEMENTS
37. Current year’s adjustments on Business Combination and Other Related Transactions in 2017 (continued)
(b) Acquisition of production assets in Tempe, Arizona, USA
In August 2017, Swire Coca-Cola completed the acquisition from subsidiaries of TCCC of certain production assets in Tempe, Arizona in the USA. This acquisition was a follow-up transaction linked to the acquisition of distribution assets in Arizona and New Mexico completed in July 2016.
At 31st December 2017, the initial accounting for the acquisition of production assets in Arizona was incomplete and provisional amounts were reported pending the receipt of final valuations of the assets acquired. After finalisation of the completion financial statements and receipt of the final valuations of the assets acquired, the following measurement period adjustments were recognised in the current period:
Provisional amountsat 31st December 2017
HK$M
Final amountsat 31st December 2018
HK$M
Measurement periodadjustments recognised
in the current periodHK$M
Purchase consideration:
Cash paid 582 464 (118)
Contingent consideration (353) (539) (186)
229 (75) (304)
Property, plant and equipment 547 547 –
Reduction in intangible assets previously recognised during acquisition of distribution assets (111) (424) (313)
Deferred tax liabilities (34) (3) 31
Stocks and work in progress 70 70 –
Other receivables 26 – (26)
Trade and other payables (269) (353) (84)
Net identifiable assets acquired 229 (163) (392)
Goodwill – 88 88
229 (75) (304)
Purchase consideration settled in cash and net cash outflow on acquisition 582 464 (118)

195SWIRE PACIFIC 2018 ANNUAL REPORT
37. Current year’s adjustments on Business Combination and Other Related Transactions in 2017 (continued)
(c) Acquisition of production assets in Denver, Colorado, USA
In October 2017, Swire Coca-Cola completed the acquisition from subsidiaries of TCCC of certain production assets in Denver, Colorado in the USA. This acquisition was a follow-up transaction linked to an acquisition of distribution assets in Denver and Colorado Springs completed in May 2014.
At 31st December 2017, the initial accounting for the acquisition of production assets in Colorado was incomplete and provisional amounts were reported pending the receipt of final valuations of the assets acquired. After finalisation of the completion financial statements and receipt of the final valuations of the assets acquired, the following measurement period adjustments were recognised in the current period:
Provisional amountsat 31st December 2017
HK$M
Final amountsat 31st December 2018
HK$M
Measurement periodadjustments recognised
in the current periodHK$M
Purchase consideration:
Cash paid 307 304 (3)
Gain arising from the acquisition 95 202 107
Contingent consideration (354) (500) (146)
48 6 (42)
Property, plant and equipment 290 290 –
Reduction in intangible assets previously recognised during acquisition of distribution assets (210) (212) (2)
Deferred tax liabilities (79) (117) (38)
Stocks and work in progress 95 95 –
Other receivables 5 3 (2)
Trade and other payables (23) (23) –
Net identifiable assets acquired 78 36 (42)
Reduction in goodwill previously recognised during acquisition of distribution assets (30) (30) –
48 6 (42)
Purchase consideration settled in cash and net cash outflow on acquisition 307 304 (3)

196 NOTES TO THE FINANCIAL STATEMENTS
38. Capital Commitments2018
HK$M2017
HK$M
(a) The Group’s outstanding capital commitments at the year-end in respect of:
Property, plant and equipment
Contracted for 524 1,010
Authorised by Directors but not contracted for 1,567 2,415
Investment properties
Contracted for 1,192 3,961
Authorised by Directors but not contracted for 14,586 8,807
17,869 16,193
The Group’s share of capital commitments of joint venture companies at the year-end*
Contracted for 497 880
Authorised by Directors but not contracted for 1,423 720
1,920 1,600
* of which the Group is committed to funding HK$464 million (2017: HK$355 million).
(b) At 31st December 2018, the Group had unprovided contractual obligations for future repairs and maintenance in respect of investment properties of HK$219 million (2017: HK$190 million).
39. Provisions and Contingencies
Accounting Policy
Provisions are recognised when the Group has a present legal or constructive obligation as a result of past events; it is more likely than not that an outflow of resources will be required to settle the obligation; and the amount has been reliably estimated. Provisions are not recognised for future operating losses.
Where there are a number of similar obligations, the likelihood that an outflow will be required in settlement is determined by considering the class of obligations as a whole. A provision is recognised even if the likelihood of an outflow with respect to any one item included in the same class of obligations may be small.
Contingent liabilities are possible obligations that arise from past events and the existence of which will only be confirmed by the occurrence or non-occurrence of one or more future events not wholly within the control of the Group. Where it is not probable that an outflow of economic benefits will be required, or the amount cannot be estimated reliably, the obligation is disclosed as a contingent liability, unless the probability of an outflow of economic benefits is remote.
Financial guarantee contracts are recognised as a financial liability at the time the guarantee is issued. The liability is initially measured at fair value and subsequently at the higher of:
– the amount determined in accordance with the expected credit loss model under HKFRS 9 “Financial Instruments” and
– the amount initially recognised less, where appropriate, the cumulative amount of income recognised in accordance with the principles of HKFRS 15 “Revenue from Contracts with Customers”.
The fair value of financial guarantees is determined based on the present value of the difference in cash flows between the contractual payments required under the debt instrument and the payments that would be required without the guarantee, or the estimated amount that would be payable to a third party for assuming the obligations. Where guarantees in relation to loans or other payables of associates are provided for no compensation, the fair values are accounted for as contributions and recognised as part of the cost of the investment.

197SWIRE PACIFIC 2018 ANNUAL REPORT
39. Provisions and Contingencies (continued)
2018HK$M
2017HK$M
(a) Guarantees provided in respect of bank loans and other liabilities of:
Joint venture companies 2,285 2,012
Bank guarantees given in lieu of utility deposits and others 174 185
2,459 2,197
The Group has assessed the fair value of the above guarantees and does not consider them to be material. They have therefore not been recognised in the consolidated statement of financial position.
(b) Cathay Pacific Airways
Critical Accounting Estimates and Judgements
Cathay Pacific remains the subject of antitrust proceedings in various jurisdictions except as otherwise noted below. The proceedings are focused on issues relating to pricing and competition. Cathay Pacific is represented by legal counsel in connection with these matters.
The proceedings and civil actions, except as otherwise stated below, are ongoing and the outcomes are subject to uncertainties. Cathay Pacific is not in a position to assess the full potential liabilities but makes provisions based on facts and circumstances in line with the accounting policy set out above in this note.
In November 2010, the European Commission issued a decision in its airfreight investigation finding that, amongst other things, Cathay Pacific and a number of other international cargo carriers agreed to cargo surcharge levels and that such agreements infringed European competition law. The European Commission imposed a fine of Euros 57.12 million on Cathay Pacific. However, the European Commission’s finding against Cathay Pacific, and the imposition of this fine, was annulled by the General Court in December 2015 and the fine of Euros 57.12 million was refunded to Cathay Pacific in February 2016. The European Commission issued a new decision against Cathay Pacific and the other airlines involved in the case in March 2017. Another fine of Euros 57.12 million was imposed on Cathay Pacific, which was paid by Cathay Pacific in June 2017. Cathay Pacific filed an appeal against this latest decision, to which the European Commission filed a defence. In December 2017, Cathay Pacific filed a Reply to this Defence. On 9th March 2018, the European Commission filed a rejoinder to Cathay Pacific’s Reply. No date has yet been fixed for an appeal hearing.
Cathay Pacific is a defendant in a number of civil claims, including class litigation and third party contribution claims, in a number of countries including Germany, the Netherlands, Norway and Korea alleging violations of applicable competition laws arising from Cathay Pacific’s alleged conduct relating to its air cargo operations. Cathay Pacific is represented by legal counsel and is defending these actions.

198 NOTES TO THE FINANCIAL STATEMENTS
40. Leases
Accounting Policy
Leases in which a significant portion of the risks and rewards of ownership are retained by the lessor are classified as operating leases. Receipts or payments made under operating leases (net of any incentives paid to lessees or received from the lessors) are recognised as income or expenses in the statement of profit or loss on a straight-line basis over the period of the lease.
Leases of property, plant and equipment where the Group has substantially all the risks and rewards of ownership are classified as finance leases. Finance leases are capitalised at the lease’s commencement at the lower of the fair value of the leased property and the present value of the minimum lease payments.
Each lease payment is allocated between the liability and finance charges so as to achieve a constant rate on the finance balance outstanding. The corresponding rental obligations, net of finance charges, are included in other payables. The interest element of the finance cost is charged to the statement of profit or loss over the lease period so as to produce a constant periodic rate of interest on the remaining balance of the liability for each period. The property, plant and equipment acquired under finance leases is depreciated over the shorter of the useful life of the asset and the lease term.
The Group acts as both lessor and lessee under operating leases. Details of the Group’s commitments under non-cancellable operating leases are set out as follows:
(a) Lessor
The Group leases out investment properties and vessels under operating leases. The leases for investment properties typically run for periods of three to six years. The retail turnover-related rental income received during the year amounted to HK$526 million (2017: HK$389 million). The leases for vessels typically run for an initial period of six months to five years with an option to renew them after that date, at which time all terms are renegotiated.
At 31st December, the future aggregate minimum lease receipts under non-cancellable operating leases receivable by the Group were as follows:
2018HK$M
2017HK$M
Investment properties
Not later than one year 9,241 8,557
Later than one year but not later than five years 22,536 18,449
Later than five years 8,337 5,987
40,114 32,993
Vessels
Not later than one year 264 1,400
Later than one year but not later than five years 56 516
320 1,916
40,434 34,909
Assets held for deployment on operating leases at 31st December were as follows:
2018 2017
Investmentproperties
HK$MVessels
HK$M
Investmentproperties
HK$MVessels
HK$M
Cost or fair value 248,140 26,710 229,831 25,981
Less: accumulated depreciation and impairment – (13,854) – (9,868)
248,140 12,856 229,831 16,113
Depreciation for the year – 1,022 – 1,035

199SWIRE PACIFIC 2018 ANNUAL REPORT
40. Leases (continued)
(b) Lessee
The Group leases land and buildings, vessels and equipment under operating leases. These leases typically run for an initial period of one to fifteen years with an option to renew them after that date, at which time all terms are renegotiated. The retail turnover-related rentals paid during the year amounted to HK$51 million (2017: HK$47 million).
At 31st December, the future aggregate minimum lease payments under non-cancellable operating leases payable by the Group were as follows:
2018HK$M
2017HK$M
Land and buildings
Not later than one year 1,032 953
Later than one year but not later than five years 2,261 1,956
Later than five years 2,868 2,976
6,161 5,885
Vessels
Not later than one year 29 25
Later than one year but not later than five years 6 35
35 60
Equipment
Not later than one year 38 40
Later than one year but not later than five years 88 20
126 60
6,322 6,005
41. Related Party Transactions
Accounting Policy
Related parties of the Group are individuals and companies, including subsidiary, fellow subsidiary, joint venture and associated companies and key management of the Group or the parent of the Group (including close members of their families), where the individual or company has the ability, directly or indirectly, to control the other party or exercise significant influence over the other party in making financial and operating decisions.
There are agreements for services (Services Agreements), in respect of which John Swire & Sons (H.K.) Limited (JSSHK) provides services to various companies in the Group and under which costs are reimbursed and fees payable. In return for these services, JSSHK receives annual fees calculated (A) in the case of the Company, as 2.5% of the dividends receivable from joint venture and associated companies of the Company, where there are no agreements for services with such companies, and (B) in the case of its subsidiary and associated companies with such agreements, as 2.5% of their relevant consolidated profits before taxation and non-controlling interests after certain adjustments. The current Services Agreements, which commenced on 1st January 2017 for a period of three years, will expire on 31st December 2019. For the year ended 31st December 2018, service fees payable amounted to HK$397 million (2017: HK$302 million). Expenses of HK$245 million (2017: HK$259 million) were reimbursed at cost; in addition, HK$345 million (2017: HK$320 million) in respect of shared administrative services was reimbursed.
Under a tenancy framework agreement (Tenancy Framework Agreement) between JSSHK, the Company and Swire Properties Limited dated 14th August 2014, members of the Group enter into tenancy agreements with members of the JSSHK group from time to time on normal commercial terms based on prevailing market rentals. The last Tenancy Framework Agreement commenced on 1st January 2016 for a period of three years expiring on 31st December 2018. The Tenancy Framework Agreement was renewed on 1st October 2018 for a further term of three years commencing on 1st January 2019. For the year ended 31st December 2018, the aggregate rentals payable to the Group by the JSSHK group under tenancies to which the JSSHK Tenancy Framework Agreement applies amounted to HK$105 million (2017: HK$100 million).

200 NOTES TO THE FINANCIAL STATEMENTS
41. Related Party Transactions (continued)
In addition, the following is a summary of significant transactions between the Group and related parties (including transactions under the JSSHK Tenancy Framework Agreement), which were carried out in the normal course of the Group’s business, in addition to those transactions disclosed elsewhere in the financial statements.
Notes
Joint venturecompanies
Associatedcompanies
Fellow subsidiarycompanies
Immediateholding company
2018HK$M
2017HK$M
2018HK$M
2017HK$M
2018HK$M
2017HK$M
2018HK$M
2017HK$M
Revenue from (a)
– Sales of beverage drinks 14 10 26 28 – – – –
– Rendering of services 1 1 5 4 14 11 – –
– Aircraft and engine maintenance 48 50 3,155 2,774 – – – –
Purchase of beverage drinks (a) 14 14 3,600 1,298 – – – –
Purchase of other goods (a) 3 3 18 14 – – – –
Purchase of services (a) 40 38 4 7 10 18 – –
Rental revenue (b) 2 2 4 4 1 1 104 99
Interest income (c) 82 75 2 12 – – – –
Interest charges (c) 9 10 11 8 – – – –
Notes: (a) Sales and purchases of goods and rendering of services to and from related parties were conducted in the normal course of business at prices and on terms no less favourable to the Group than those
charged to/by and contracted with other customers/suppliers of the Group. (b) The Swire Properties group has, in the normal course of its business, entered into lease agreements with related parties to lease premises for varying periods up to six years. The leases were entered
into on normal commercial terms.(c) Loans advanced to joint venture and associated companies at 31st December 2018 are disclosed in note 19. Advances to and from joint venture and associated companies are disclosed in notes 25 and 28.
Amounts due to the immediate holding company at 31st December 2018 are disclosed in note 28. These balances arise in the normal course of business, are non-interest-bearing and have no fixed settlement dates.
Remuneration of key management, which includes executive and non-executive directors and three executive officers, is disclosed in note 8.
42. Notes to the Consolidated Statement of Cash Flows
(a) Reconciliation of operating profit to cash generated from operations
2018HK$M
2017HK$M
Operating profit 30,888 35,864
Remeasurement gains on interests in joint venture companies which become subsidiary companies (14) (975)
Bargain purchase gain on acquisition of a subsidiary company (28) –
Final purchase consideration adjustment on acquisition of assets (107) (95)
Profit on disposal of subsidiary companies (1,309) (387)
Profit on disposal of joint venture companies (3,177) –
(Profit)/loss on sale of property, plant and equipment (57) 70
Profit on sale of investment properties (53) (9)
Loss on sale of available-for-sale assets – 93
Change in fair value of investment properties (19,378) (25,331)
Depreciation, amortisation and impairment losses 7,827 5,315
Other items (112) 39
Operating profit before working capital changes 14,480 14,584
Decrease in properties for sale 674 3,644
Increase in stocks and work in progress (489) (216)
Decrease in trade and other receivables and contract assets 604 467
Increase in trade and other payables and contract liabilities 3,059 1,126
Cash generated from operations 18,328 19,605

201SWIRE PACIFIC 2018 ANNUAL REPORT
42. Notes to the Consolidated Statement of Cash Flows (continued)
(b) Purchase of property, plant and equipment
2018HK$M
2017HK$M
Properties 574 835
Leasehold land and land use rights – 12
Plant and machinery 2,423 2,116
Vessels 1,106 814
Total 4,103 3,777
The above purchase amounts do not include interest capitalised on property, plant and equipment.
(c) Analysis of changes in financing during the year
Loans, bonds and perpetual capital securities
Non-controllinginterests
2018HK$M
2017HK$M
2018HK$M
2017HK$M
At 1st January
as originally stated 78,586 70,570 52,931 47,289
adjustment on adoption of HKFRS 15 – – 32 –
as restated 78,586 70,570 52,963 47,289
Net cash (outflow)/inflow from financing (6,947) 7,263 – –
Acquisition of interests in subsidiary companies – – (2,438) (774)
Change in composition of the Group 45 – 22 366
Non-controlling interests’ share of total comprehensive income – – 5,264 6,961
Dividends paid to non-controlling interests – – (1,128) (1,177)
Movement in dividends payable to non-controlling interests – – – 25
Currency adjustment (29) 629 – –
Other non-cash movements 124 124 8 241
At 31st December 71,779 78,586 54,691 52,931

202 NOTES TO THE FINANCIAL STATEMENTS
42. Notes to the Consolidated Statement of Cash Flows (continued)
(d) Disposal of subsidiary companies
Subsidiariesin Property
DivisionHK$M
Subsidiariesin Trading &
Industrial Division
HK$MOthersHK$M
TotalHK$M
Net assets disposed of:
Investment properties 2,001 – – 2,001
Property, plant and equipment 5 1,586 – 1,591
Leasehold land and land use rights – 168 – 168
Intangible assets – 6 – 6
Joint ventures companies – 327 – 327
Stocks and work in progress – – 11 11
Trade and other receivables 1 65 2 68
Other current assets 6,419 – – 6,419
Bank balances and deposits maturing within three months – 76 – 76
Trade and other payables (2) (242) (3) (247)
Deferred taxation liabilities (3) – – (3)
Exchange losses reclassified from translation reserve – 35 – 35
8,421 2,021 10 10,452
Gains on disposal 1,223 82 4 1,309
9,644 2,103 14 11,761
Satisfied by:
Cash received (net of transaction costs) 7,857 1,789 14 9,660
Amount receivable – 314 – 314
Other consideration received 1,787 – – 1,787
9,644 2,103 14 11,761
Analysis of the net inflow from disposal:
Net cash proceeds 7,857 1,789 14 9,660
Cash and cash equivalents disposed of – (76) – (76)
Net inflow of cash and cash equivalents 7,857 1,713 14 9,584
The disposal of subsidiary companies in the Property Division consists of the sale of interests in an office building in Kowloon Bay and in other investment properties in Hong Kong, and the contribution of investment properties in Hong Kong to a joint venture company.
43. Immediate and Ultimate Holding Company
The immediate holding company is John Swire & Sons (H.K.) Limited, a company incorporated in Hong Kong.
The ultimate holding company is John Swire & Sons Limited, a company incorporated in England.

203SWIRE PACIFIC 2018 ANNUAL REPORT
Principal Accounting Policies
Apart from the accounting policies presented within the corresponding notes to the financial statements, the other principal accounting policies applied in the preparation of these consolidated financial statements are set out below.
1. Basis of Preparation
The consolidated financial statements have been prepared in accordance with Hong Kong Financial Reporting Standards (HKFRS) issued by the Hong Kong Institute of Certified Public Accountants. The consolidated financial statements have been prepared under the historical cost convention as modified in relation to the revaluation of certain available-for-sale assets, financial assets and financial liabilities (including derivative instruments), investment properties and defined benefit assets/liabilities, each of which are carried at fair value.
2. Basis of Consolidation
The consolidated financial statements incorporate the financial statements of Swire Pacific Limited, its subsidiary companies (together referred to as the "Group") and the Group’s interests in joint venture and associated companies.
The Group uses the acquisition method of accounting to account for business combinations. The consideration transferred for the acquisition of a subsidiary company is the fair value of the assets transferred, the liabilities incurred and the equity interests issued by the Group. The consideration transferred includes the fair value of any asset or liability resulting from a contingent consideration arrangement. Acquisition-related costs are generally included in the cost of investment. Identifiable assets acquired and liabilities and contingent liabilities assumed in a business combination are measured initially at their fair values at the acquisition date. On an acquisition-by-acquisition basis, the Group recognises any non-controlling interest in the acquired subsidiary either at fair value or at the non-controlling interest’s proportionate share of the acquired subsidiary’s net assets.
The excess of the consideration transferred, the amount of any non-controlling interest in the acquired subsidiary and the acquisition-date fair value of any previous equity interest in the acquired subsidiary over the fair value of the Group’s share of the identifiable net assets acquired is recorded as goodwill. If this is less than the fair value of the net assets of the acquired subsidiary, the difference is recognised directly in the statement of profit or loss.
Intercompany transactions, balances and unrealised gains on transactions between Group companies are eliminated on consolidation. Unrealised losses are also eliminated unless the transaction provides evidence of impairment of the asset transferred. Accounting policies of subsidiary companies have been changed where necessary to ensure consistency with the policies adopted by the Group.
The Group treats transactions with non-controlling interests as transactions with equity owners of the Group. For purchases from non-controlling interests, the difference between any consideration paid and the relevant share acquired of the carrying value of net assets of the subsidiary company is recorded in equity. Gains or losses on disposals to non-controlling interests where control is not lost are also recorded in equity.
When the Group ceases to have control, any retained interest in the entity is remeasured to its fair value, with the change in carrying amount recognised in the statement of profit or loss. The fair value is the initial carrying amount for the purposes of subsequently accounting for the retained interest as an associated company, joint venture company or financial asset. In addition, any amounts previously recognised in other comprehensive income in respect of that entity are accounted for as if the Group had directly disposed of the related assets or liabilities. This may mean that amounts previously recognised in the statement of other comprehensive income are reclassified to the statement of profit or loss.
Where the Group enters into a contract that contains an obligation (for example a written put option exercisable by the contract counterparty) to acquire shares in a partly-owned subsidiary company from the owner of the non-controlling interest, which is not part of a business combination, the Group records a financial liability in respect of the present value of the redemption amount with a corresponding charge directly to equity. Changes to the value of the financial liability are recognised in the statement of profit or loss within net finance charges.

204 PRINCIPAL ACCOUNTING POLICIES
The Group’s share of its joint venture and associated companies’ post-acquisition profits or losses is recognised in the statement of profit or loss, and its share of post-acquisition movements in other comprehensive income is recognised in the statement of other comprehensive income. The cumulative post-acquisition movements are adjusted against the carrying amount of the investment. When the Group’s share of losses equals or exceeds its interest in the joint venture or associated company, including any other unsecured receivables, the Group does not recognise further losses, unless it has incurred obligations or made payments on behalf of the joint venture or associated company.
The Group recognises the disposal of an interest in a joint venture company when it ceases to have joint control and the risks and rewards of ownership have passed to the acquirer.
If the ownership interest in an associated company is reduced but significant influence is retained, only a proportionate share of the amounts previously recognised in other comprehensive income is reclassified to profit or loss where appropriate.
Unrealised gains on transactions between the Group and its joint venture and associated companies are eliminated to the extent of the Group’s interest in these companies. Unrealised losses on assets transferred between the Group and its joint venture and associated companies are also eliminated unless the transactions provide evidence of impairment of the assets transferred. Accounting policies of joint venture and associated companies have been changed where necessary to ensure consistency with the policies adopted by the Group.
Dilution gains and losses arising in respect of investments in associated companies are recognised in the consolidated statement of profit and loss.
3. Subsidiary Companies
Investment in subsidiary companies in the Company’s standalone financial statements are stated at cost less provision for any impairment losses. Income from subsidiary companies is accounted for on the basis of dividends received and receivable. Long-term loans to subsidiary companies are considered to be quasi-equity in nature where there are no defined repayment terms and no expectation of repayment.
4. Joint Venture and Associated Companies
In the Company’s statement of financial position, its investments in joint venture and associated companies are stated at cost less provision for any impairment losses. Income from joint venture and associated companies is recognised by the Company on the basis of dividends received and receivable. Long-term loans to joint venture and associated companies are considered to be quasi-equity in nature where there are no defined repayment terms and no historical repayment of the balances.
5. Foreign Currency Translation
(a) Functional and presentation currency
Items included in the financial statements of each of the Group’s entities are measured using the currency of the primary economic environment in which the entity operates (the "functional currency"). The consolidated financial statements are presented in Hong Kong dollars, which is the Company’s functional and presentation currency.
(b) Transactions and balances
Foreign currency transactions are translated into the functional currency using the exchange rates prevailing at the dates of the transactions. Foreign exchange gains and losses resulting from the settlement of such transactions and from the translation at year-end exchange rates of monetary assets and liabilities denominated in foreign currencies are recognised in the statement of profit or loss, except when deferred in other comprehensive income as qualifying cash flow hedges or qualifying net investment hedges.
When a gain or loss on a non-monetary item is recognised directly in other comprehensive income, any associated translation difference is also recognised directly in other comprehensive income. When a gain or loss on a non-monetary item is recognised in the statement of profit or loss, any associated translation difference is also recognised in the statement of profit or loss.
205SWIRE PACIFIC 2018 ANNUAL REPORT
(c) Group companies
The results and financial position of all the Group entities (none of which has the currency of a hyperinflationary economy) that have a functional currency different from the presentation currency are translated into the presentation currency as follows:
(i) Assets and liabilities for each statement of financial position presented are translated at the closing rate at the date of that statement of financial position;
(ii) Income and expenses for each statement of profit or loss are translated at average exchange rates (unless this average is not a reasonable approximation of the cumulative effect of the rates prevailing on the transaction dates, in which case income and expenses are translated at the dates of the transactions); and
(iii) All resulting exchange differences are recognised in other comprehensive income and accumulated in a separate component in equity.
On consolidation, exchange differences arising from the translation of the net investment in foreign operations, and of borrowings and other currency instruments designated as hedges of such investments, are taken to other comprehensive income. When a foreign operation is partially disposed of or sold, exchange differences that were recorded in equity are reclassified to the consolidated statement of profit or loss as part of the gain or loss on sale.
Goodwill and fair value adjustments arising on the acquisition of a foreign entity are treated as assets and liabilities of the foreign entity and translated at the closing rate.

206
Principal Subsidiary, Joint Venture and Associated Companies and InvestmentsShowing proportion of capital owned at 31st December 2018
Notes:1. This table lists the principal subsidiary, joint venture and associated companies of the Group including those which, in the opinion of the Directors, materially contribute to the net income of the Group or
hold a material portion of the assets or liabilities of the Group. To give full details of these companies would, in the opinion of the Directors, result in particulars of excessive length.2. Unless otherwise stated, the principal country of operation of each subsidiary is the same as its country of incorporation. The activities of ship owning and ship operating are international, and are not
attributable to a principal country of operation.3. * Group interest held through joint venture or associated companies.4. ● Companies not audited by PricewaterhouseCoopers. These companies accounted for approximately 11.5% of attributable net assets at 31st December 2018.5. ^ Translated name.
Attributableto the Group%
Owned directly%
Owned bysubsidiaries%
Issued and fully paid up share/Registered capital Principal activities
PROPERTY DIVISION
Subsidiary companies:
Incorporated in Hong Kong:
Cathay Limited 82 – 100 807 shares (HK$8,070) Property investment
Citiluck Development Limited 82 – 100 1,000 shares (HK$1,000) Property investment
Cityplaza Holdings Limited 82 – 100 100 shares (HK$1,000) Property investment
Coventry Estates Limited 82 – 100 4 shares (HK$40) Property investment
Joyful Sincere Limited 65.60 – 100 1 share (HK$1) Property trading
Keen Well Holdings Limited 65.60 – 100 1 share (HK$1) Property trading
One Queen’s Road East Limited 82 – 100 2 shares (HK$2) Property investment
Oriental Landscapes Limited 82 – 100 60,000 shares (HK$600,000) Landscaping services
Pacific Place Holdings Limited 82 – 100 2 shares (HK$2) Property investment
Panorama Properties Holdings Limited (previously known as One Island East Limited)
82 – 100 10,000 shares (HK$10,000) Property investment
Redhill Properties Limited 82 – 100 250,000 shares (HK$7,300,000) Property investment
Super Gear Investment Limited 82 – 100 2 shares (HK$2) Property investment
Swire Properties (Finance) Limited 82 – 100 1,000,000 shares (HK$1,000,000) Financial services
Swire Properties Limited 82 82 – 5,850,000,000 shares (HK$10,449,437,325.77)
Holding company
Swire Properties Management Limited 82 – 100 2 shares (HK$20) Property management
Swire Properties MTN Financing Limited 82 – 100 1 share (HK$1) Financial services
Swire Properties Real Estate Agency Limited 82 – 100 2 shares (HK$20) Real estate agency
Taikoo Place Holdings Limited 82 – 100 2 shares (HK$2) Property investment
Incorporated in Mainland China:
(Domestic company)
Beijing Tianlian Real Estate Company Limited ̂●
82 – 100 Registered capital of RMB865,000,000
Holding company
(Sino-foreign joint venture)
Taikoo Hui (Guangzhou) Development Company Limited ^
79.54 – 97 Registered capital of RMB3,050,000,000
Property investment
(Wholly foreign owned enterprises)
Beijing Sanlitun Hotel Management Company Limited ^
82 – 100 Registered capital of RMB800,000,000
Hotel investment
Beijing Sanlitun North Property Management Company Limited ^
82 – 100 Registered capital of RMB2,784,000,000
Property investment
Beijing Sanlitun South Property Management Company Limited ^
82 – 100 Registered capital of RMB1,598,000,000
Property investment
Sunshine Melody (Guangzhou) Properties Management Limited
82 – 100 Registered capital of RMB295,000,000
Property investment
Swire Properties (China) Investment Company Limited ^
82 – 100 Registered capital of US$30,000,000
Holding company

207SWIRE PACIFIC 2018 ANNUAL REPORT
Incorporated in the USA:
700 Brickell City Centre LLC 82 – 100 Limited Liability Company Property trading
Brickell City Centre Plaza LLC 82 – 100 Limited Liability Company Property investment
Brickell City Centre Project LLC 82 – 100 Limited Liability Company Property trading and investment
Brickell City Centre Retail LLC 51.60 – 87.93 Limited Liability Company Property investment
FTL/AD LTD 61.50 – 75 Florida Partnership Property trading
Swire Jadeco LLC 82 – 100 Limited Liability Company Property trading
Swire Pacific Holdings Asia LLC 82 – 100 Limited Liability Company Property trading
Swire Properties Inc 82 – 100 1,000 shares of US$0.01 each Holding company
Swire Properties One LLC 82 – 100 Limited Liability Company Property trading and investment
Swire Properties US Inc 82 – 100 1,000 shares of US$0.01 each Holding company
Swire Realty LLC 82 – 100 Limited Liability Company Real estate agency
Incorporated in the British Virgin Islands and operating in Hong Kong:
Bao Wei Enterprises Limited 82 – 100 1 share of US$1 Property trading
Boom View Holdings Limited 82 – 100 2 shares of US$1 each Property investment
Endeavour Technology Limited 71.75 – 87.50 1,000 shares of US$1 each Holding company
Excel Free Ltd. 82 – 100 1 share of US$1 Property trading
High Grade Ventures Limited 82 – 100 1 share of US$1 Property trading and investment
Novel Ray Limited 82 – 100 1 share of US$1 Property investment
Peragore Limited 65.60 – 80 1,000 shares of US$1 each Holding company
Sino Flagship Investments Limited 82 – 100 1 share of US$1 Property investment
Swire and Island Communication Developments Limited
49.20 – 60 100 shares of HK$10 each and 1 non-voting dividend share of HK$10
Property investment
Swire Properties China Holdings Limited 82 – 100 1 share of US$1 Holding company
Wonder Cruise Group Limited 82 – 100 1 share of US$1 Property trading
Joint venture companies:
Incorporated in Hong Kong:
Hareton Limited 41 – 50 100 shares (HK$1,000) Property investment
Pacific Grace Limited 41 – * 2 shares (HK$2) Property investment
Richly Leader Limited 41 – 50 1,000,000,000 shares (HK$700,000,000)
Property investment
Incorporated in the USA:
Swire Brickell Key Hotel, Ltd. 61.50 – 75 Florida Partnership Hotel investment
Incorporated in the British Virgin Islands:
Dazhongli Properties Limited (operates in Mainland China)
41 – 50 1,000 shares of US$1 each Holding company
Great City China Holdings Limited (operates in Mainland China)
41 – 50 100 shares of US$1 each Holding company
Honster Investment Limited 41 – 50 2 shares of US$1 each Holding company
Island Land Development Limited (operates in Hong Kong)
41 – 50 100 shares of HK$10 each Property investment
Newfoundworld Investment Holdings Limited (operates in Hong Kong)
16.40 – 20 5 shares of US$1 each Holding company
Attributableto the Group%
Owned directly%
Owned bysubsidiaries%
Issued and fully paid up share/Registered capital Principal activities
PROPERTY DIVISION (continued)
Subsidiary companies (continued):

208 PRINCIPAL SUBSIDIARY, JOINT VENTURE AND ASSOCIATED COMPANIES AND INVESTMENTSShowing proportion of capital owned at 31st December 2018
Attributableto the Group%
Owned directly%
Owned bysubsidiaries%
Issued and fully paid up share/Registered capital Principal activities
PROPERTY DIVISION (continued)
Joint venture companies (continued):
Incorporated in Mainland China:
(Domestic company)
Beijing Linlian Real Estate Company Limited ^ 41 – 50 Registered capital of RMB400,000,000
Property investment
(Sino-foreign owned enterprises)
Shanghai Qianxiu Company Limited ^ 41 – 50 Registered capital of RMB1,549,777,000
Property investment
(Wholly foreign owned enterprises)
Chengdu Qianhao Real Estate Company Limited
41 – * Registered capital of US$329,000,000
Property investment
Guan Feng (Shanghai) Real Estate Development Company Limited ^
41 – * Registered capital of US$1,136,530,000
Property investment
Associated companies:
Incorporated in Hong Kong:
Greenroll Limited ● 16.40 – 20 45,441,000 shares (HK$454,410,000) Hotel investment
Queensway Hotel Limited ● 16.40 – * 100,000 shares (HK$1,000,000) Hotel investment
Shangri-La International Hotels (Pacific Place) Limited
16.40 – 20 10,005,000 shares (HK$10,005,000) Hotel investment
AVIATION DIVISION
Subsidiary companies:
Incorporated in Hong Kong:
HAECO ITM Limited 83.50 – 70 & * 100 shares (HK$100) Aircraft inventory technical management
Hong Kong Aircraft Engineering Company Limited
100 100 – 1,000,000 shares (HK$185,193,750) Aircraft overhaul, modification and maintenance
Incorporated in Mainland China:
(Sino-foreign joint ventures)
HAECO Composite Structures (Jinjiang) Co., Ltd. (previously known as Taikoo Spirit AeroSystems (Jinjiang) Composite Company Limited)
82.53 – 84.10 & * Registered capital of US$11,663,163 Composite material aeronautic parts/ systems repair, manufacturing and sales
Shanghai Taikoo Aircraft Engineering Services Company Limited ● ^
69.40 – 75 Registered capital of US$3,700,000 Line services
Taikoo Engine Services (Xiamen) Company Limited
77.27 – 76.59 & * Registered capital of US$113,000,000 Commercial aero engine overhaul services
Taikoo (Xiamen) Aircraft Engineering Company Limited
62.64 – 58.55 & * Registered capital of US$41,500,000 Aircraft overhaul and maintenance
Taikoo (Xiamen) Landing Gear Services Company Limited
87.88 – 88.37 & * Registered capital of US$83,090,000 Landing gear repair and overhaul
(Wholly foreign owned enterprise)
HAECO Component Overhaul (Xiamen) Limited 100 – 100 Registered capital of US$18,600,000 Aircraft component overhaul

209SWIRE PACIFIC 2018 ANNUAL REPORT
Incorporated in Singapore:
Singapore HAECO Pte. Limited 100 – 100 Registered capital of S$1 Line services
Incorporated in the USA:
HAECO USA Holdings, Inc. 100 – 100 2,850 shares of US$0.01 each Aircraft overhaul and maintenance, cabin modification and interior products manufacturing
Joint venture companies:
Incorporated in Hong Kong:
Goodrich Asia-Pacific Limited 49 – 49 9,200,000 shares (HK$9,200,000) Carbon brake machining and wheel hub overhaul
Hong Kong Aero Engine Services Limited 50 – 50 20 shares (HK$200) Commercial aero engine overhaul services
Incorporated in Mainland China:
(Sino-foreign joint ventures)
Dunlop Taikoo (Jinjiang) Aircraft Tyres Company Limited
33.64 – 37 Registered capital of US$7,500,000 Tyre services for commercial aircraft
Goodrich TAECO Aeronautical Systems (Xiamen) Company Limited
21.92 – 35 Registered capital of US$5,000,000 Aircraft fuel control, flight control and electrical component repairs
Honeywell TAECO Aerospace (Xiamen) Company Limited ●
31.26 – 35 Registered capital of US$5,000,000 Aircraft hydraulic, pneumatic, avionic component and other aviation equipment repairs
Taikoo (Shandong) Aircraft Engineering Company Limited ●
36.26 – 40 Registered capital of RMB200,000,000
Airframe maintenance services for narrow-body aircraft
Associated companies:
Incorporated in Hong Kong:
AHK Air Hong Kong Limited ● 45 – * 54,402,000 ‘A’ shares (HK$54,402,000) and 36,268,000 ‘B’ shares (HK$36,268,000)
Cargo airline
Airline Property Limited ● 45 – * 2 shares (HK$20) Property investment
Airline Stores Property Limited ● 45 – * 2 shares (HK$20) Property investment
Airline Training Property Limited ● 45 – * 2 shares (HK$20) Property investment
Asia Miles Limited ● 45 – * 2 shares (HK$2) Travel reward programme
Cathay Holidays Limited ● 45 – * 40,000 shares (HK$4,000,000) Travel tour operator
Cathay Pacific Aero Limited ● 45 – * 1 share (HK$10) Financial services
Cathay Pacific Aircraft Lease Finance Limited ●
45 – * 1 share (HK$1) Aircraft leasing facilitator
Cathay Pacific Airways Limited ● 45 45 – 3,933,844,572 shares (HK$17,106,252,291)
Operation of scheduled airline services
Cathay Pacific Catering Services (H.K.) Limited ●
45 – * 600 shares (HK$600,000) Airline catering
Cathay Pacific Services Limited ● 45 – * 1 share (HK$1) Cargo terminal
Deli Fresh Limited ● 45 – * 20 shares (HK$200) Food processing and catering
Global Logistics System (HK) Company Limited ●
43.46 – * 100 shares (HK$1,000) Computer network for interchange of air cargo related information
Ground Support Engineering Limited 22.50 – * 2 shares (HK$2) Airport ground engineering support and equipment maintenance
Attributableto the Group%
Owned directly%
Owned bysubsidiaries%
Issued and fully paid up share/Registered capital Principal activities
AVIATION DIVISION (continued)
Subsidiary companies (continued):

210 PRINCIPAL SUBSIDIARY, JOINT VENTURE AND ASSOCIATED COMPANIES AND INVESTMENTSShowing proportion of capital owned at 31st December 2018
Attributableto the Group%
Owned directly%
Owned bysubsidiaries%
Issued and fully paid up share/Registered capital Principal activities
AVIATION DIVISION (continued)
Associated companies (continued):
Incorporated in Hong Kong (continued):
Hong Kong Airport Services Limited ● 45 – * 100 shares (HK$100) Aircraft ramp handling
Hong Kong Aviation and Airport Services Limited ●
45 – * 2 shares (HK$2) Property investment
Hong Kong Dragon Airlines Limited ● 45 – * 500,000,000 shares (HK$545,979,133)
Operation of scheduled airline services
LSG Lufthansa Service Hong Kong Limited 14.37 – * 501 shares (HK$501) Airline catering
Vehicle Engineering Services Limited 22.50 – * 2 shares (HK$2) Repair and maintenance services for transportation companies
Vogue Laundry Service Limited ● 45 – * 3,700 shares (HK$1,850,000) Laundry and dry cleaning
Incorporated in Mainland China:
Air China Cargo Co., Ltd. ● 11.25 – * Registered capital of RMB5,235,294,118
Cargo carriage service
Air China Limited ● 8.16 – * 4,562,683,364 ‘H’ shares of RMB1 each9,962,131,821 ‘A’ shares of RMB1 each
Operation of scheduled airline services
Shanghai International Airport Services Co., Limited ̂●
13.21 – * Registered capital of RMB360,000,000
Ground handling
(Wholly foreign owned enterprise)
Guangzhou Guo Tai Information Processing Company Limited ●
45 – * Registered capital of HK$8,000,000 Information processing
Incorporated in Cayman Islands:
Cathay Pacific MTN Financing Limited ● 45 – * 1 share of US$1 Financial services
Incorporated in Bermuda:
Troon Limited ● 45 – * 12,000 shares of US$1 each Financial services
Incorporated in the Isle of Man:
Cathay Pacific Aircraft Services Limited ● 45 – * 10,000 shares of US$1 each Aircraft acquisition facilitator
Incorporated in the Philippines:
Cebu Pacific Catering Services Inc. ● 18 – * 37,500,000 shares of PHP1 each Airline catering
Incorporated in Taiwan:
China Pacific Catering Services Limited ● 22.05 – * 86,100,000 shares of NT$10 each Airline catering

211SWIRE PACIFIC 2018 ANNUAL REPORT
Attributableto the Group%
Owned directly%
Owned bysubsidiaries%
Issued and fully paid up share/Registered capital Principal activities
BEVERAGES DIVISION
Subsidiary companies:
Incorporated in Hong Kong:
Mount Limited 100 – 100 1 share (HK$1) Holding company
Swire Beverages Holdings Limited 100 100 – 50,010,002 shares (HK$5,001,000,200)
Holding company
Swire Beverages Limited 100 – 100 14,600 shares (US$7,300,000) Holding company and sale of non-alcoholic beverages
Swire Coca-Cola HK Limited 100 – 100 2,400,000 shares (HK$24,000,000) Manufacture and sale of non-alcoholic beverages
Top Noble Limited 100 – 100 1 share (HK$1) Holding company
Incorporated in Mainland China:
(Domestic company)
Swire Coca-Cola Beverages Fuzhou Limited ^ 100 – 100 Registered capital of RMB48,000,000 Manufacture and sale of non-alcoholic beverages
(Sino-foreign joint ventures)
Swire Coca-Cola Beverages Hubei Limited 95.80 – 95.80 Registered capital of US$17,988,000 Manufacture and sale of non-alcoholic beverages
Swire Coca-Cola Beverages Jiangsu Limited 80 – 80 Registered capital of US$19,000,000 Manufacture and sale of non-alcoholic beverages
Swire Coca-Cola Beverages Wenzhou Limited 80 – 92.85 Registered capital of RMB71,300,000 Manufacture and sale of non-alcoholic beverages
Swire Coca-Cola Beverages Xiamen Ltd. 100 – 100 Registered capital of US$52,737,000 Manufacture and sale of non-alcoholic beverages
Swire Coca-Cola Beverages Zhejiang Limited 80 – 80 Registered capital of US$20,000,000 Manufacture and sale of non-alcoholic beverages
Swire Coca-Cola Beverages Zhengzhou Ltd. 94.44 – 94.44 Registered capital of US$18,000,000 Manufacture and sale of non-alcoholic beverages
Swire Guangdong Coca-Cola (Huizhou) Limited 70 – 88 Registered capital of US$5,000,000 Manufacture and sale of non-alcoholic beverages
Swire Guangdong Coca-Cola Limited 70 – 70 Registered capital of RMB510,669,000
Manufacture and sale of non-alcoholic beverages
(Wholly foreign owned enterprises)
Swire BCD Co., Ltd. 100 – 100 Registered capital of US$60,000,000 Holding company
Swire Coca-Cola Beverages Guangxi Limited 100 – 100 Registered capital of US$15,200,000 Manufacture and sale of non-alcoholic beverages
Swire Coca-Cola Beverages Hainan Limited 100 – 100 Registered capital of US$11,700,000 Manufacture and sale of non-alcoholic beverages
Swire Coca-Cola Beverages Hefei Ltd. 100 – 100 Registered capital of US$12,000,000 Manufacture and sale of non-alcoholic beverages
Swire Coca-Cola Beverages Jiangxi Limited 100 – 100 Registered capital of RMB40,000,000 Manufacture and sale of non-alcoholic beverages
Swire Coca-Cola Beverages Luohe Limited 94.44 – 100 Registered capital of RMB115,180,000 Manufacture and sale of non-alcoholic beverages
Swire Coca-Cola Beverages Yunnan Limited 95.10 – 95.10 Registered capital of US$8,800,000 Manufacture and sale of non-alcoholic beverages
Swire Guangdong Coca-Cola Zhanjiang Limited 100 – 100 Registered capital of RMB23,000,000 Manufacture and sale of non-alcoholic beverages
Xiamen Luquan Industries Company Limited 100 – 100 Registered capital of RMB63,370,000 Manufacture and sale of non-alcoholic beverages

212 PRINCIPAL SUBSIDIARY, JOINT VENTURE AND ASSOCIATED COMPANIES AND INVESTMENTSShowing proportion of capital owned at 31st December 2018
Incorporated in Bermuda:
Swire Pacific Industries Limited 100 – 100 12,000 shares of US$1 each Holding company
Incorporated in the British Virgin Islands:
SPHI Holdings Limited 100 – 100 2 shares of US$1 each Holding company
Swire Coca-Cola Beverages Limited (operates principally in Taiwan)
100 – 100 1,599,840,000 ‘A’ shares of US$0.01 each200,160,000 ‘B’ shares of US$0.01 each
Manufacture and sale of non-alcoholic beverages
Swire Coca-Cola (S&D) Limited (operates principally in Taiwan)
100 – 100 20,100 shares of US$1 each Sale of non-alcoholic beverages
Incorporated in the USA:
Swire Pacific Holdings Inc. 100 – 100 8,950.28 shares of US$1 each Manufacture and sale of non-alcoholic beverages
Joint venture companies:
Incorporated in Mainland China:
(Sino-foreign co-operative joint venture)
Shanghai Shen-Mei Beverage and Food Co., Ltd. ●
53.59 – 53.59 Registered capital of US$93,218,600 Manufacture and sale of non-alcoholic beverages and beverage base
Associated companies:
Incorporated in Hong Kong:
Coca-Cola Bottlers Manufacturing Holdings Limited
41 – 41 30,000 shares are issued and HK$2,093,950,029.67 were paid
Holding company
Incorporated in Mainland China:
(Sino-foreign joint venture)
Coca-Cola Bottlers Manufacturing (Wuhan) Company Limited
41 – * Registered capital of US$39,341,450 Manufacture and sale of non-carbonated beverages
(Wholly foreign owned enterprises)
Coca-Cola Bottlers Management Service (Shanghai) Company Limited ^
41 – * Registered capital of US$5,000,000 Management services
Coca-Cola Bottlers Manufacturing (Dongguan) Company Limited ^
41 – * Registered capital of US$141,218,820 Manufacture and sale of non-carbonated beverages
Coca-Cola Bottlers Manufacturing (Foshan) Company Limited ^
41 – * Registered capital of US$31,496,700 Manufacture and sale of non-carbonated beverages
Coca-Cola Bottlers Manufacturing (Hangzhou) Company Limited ^
41 – * Registered capital of US$14,272,000 Manufacture and sale of non-carbonated beverages
Coca-Cola Bottlers Manufacturing (Jinan) Company Limited
41 – * Registered capital of US$5,720,000 Manufacture and sale of non-carbonated beverages
Coca-Cola Bottlers Manufacturing (Nanning) Company Limited
41 – * Registered capital of US$9,600,000 Manufacture and sale of non-carbonated beverages
Coca-Cola Bottlers Manufacturing (Shijiazhuang) Company Limited
41 – * Registered capital of US$11,460,000 Manufacture and sale of non-carbonated beverages
Coca-Cola Bottlers Manufacturing (Suzhou) Company Limited
41 – * Registered capital of US$2,566,000 Manufacture and sale of non-carbonated beverages
Coca-Cola Bottlers Manufacturing (Yingkou) Company Limited
41 – * Registered capital of US$12,667,000 Manufacture and sale of non-carbonated beverages
Attributableto the Group%
Owned directly%
Owned bysubsidiaries%
Issued and fully paid up share/Registered capital Principal activities
BEVERAGES DIVISION (continued)
Subsidiary companies (continued):

213SWIRE PACIFIC 2018 ANNUAL REPORT
Attributableto the Group%
Owned directly%
Owned bysubsidiaries%
Issued and fully paid up share/Registered capital Principal activities
MARINE SERVICES DIVISION
Subsidiary companies:
Incorporated in Hong Kong:
Swire Pacific Ship Management Limited 100 – 100 1,000 shares (HK$100,000) Ship personnel management
Incorporated in Australia:
Swire Pacific Offshore Pty. Limited ● 100 – 100 40,000 shares of AUD1 each Ship chartering and operating
Swire Pacific Ship Management (Australia) Pty. Limited ●
100 – 100 20,000 shares of AUD1 each Ship personnel management
Incorporated in Bermuda:
Swire Pacific Offshore Holdings Limited ● 100 – 100 500,000 shares of US$100 each Holding company
Swire Pacific Offshore Limited ● 100 – 100 120 shares of US$100 each Management services
Incorporated in the United Kingdom:
Swire Pacific Offshore (North Sea) Limited 100 – 100 2 shares of GBP1 each Ship chartering and operating
Incorporated in Singapore:
Swire Emergency Response Services Pte. Ltd. 100 – 100 10,000 shares of S$1 each Emergency response services
Swire Pacific Offshore Operations (Pte) Ltd 100 – 100 500,000 shares of S$1 each and 2,000,000,000 preference shares of US$1 each
Ship owning and operating
Swire Pacific Offshore Services (Pte.) Limited 100 – 100 500,000 shares of S$1 each Ship operating
Swire Production Solutions Pte. Ltd. 100 – 100 100,000 shares of US$1 each and 2 shares of S$1 each
Owning, chartering and operating vessels servicing the offshore marine industry
Swire Salvage Pte. Ltd. 100 – 100 2 shares of S$1 each Salvage and maritime emergency response services
Incorporated in Norway:
Swire Seabed AS 100 – 100 100 shares of NOK1,000 each Ship operating
Swire Seabed Shipping AS 100 – 100 126,000 shares of NOK1,403 each Ship owning and operating
Incorporated in New Zealand:
Swire Pacific Offshore NZ Limited ● 100 – 100 1 share of NZD100 Supply services to offshore oil and gas exploration and development activities
Incorporated in Cameroon:
Swire Pacific Offshore Africa ● 100 – 100 1,000 shares of XAF10,000 each Ship operator
Incorporated in Denmark:
Swire Blue Ocean A/S ● 100 – 100 780,000 shares of DKK1 each Ship operator
Incorporated in Cyprus:
Swire Pacific Offshore (Cyprus) Limited ● 100 – 100 1,000 shares of EUR1.71 each Owning, chartering and operating vessels servicing the offshore marine industry

214 PRINCIPAL SUBSIDIARY, JOINT VENTURE AND ASSOCIATED COMPANIES AND INVESTMENTSShowing proportion of capital owned at 31st December 2018
Incorporated in Brazil:
Swire Pacific Navegação Offshore Ltda. 100 – 100 41,600,000 shares of R$1 each Ship management services
Incorporated in Dubai:
Swire Pacific Offshore (Dubai) (L.L.C) ● 49 – 49 300 shares of AED1,000 each Management services
Incorporated in Angola:
Swire Serviços Maritimos LDA ● 49 – 49 20,191,908 shares of AOA1 each Ship chartering and operating
Joint venture companies:
Incorporated in Hong Kong:
Hongkong United Dockyards Limited 50 50 – 7,600,000 shares (HK$76,000,000) Ship repairing, general engineering, marine towage, salvage, time/ bareboat chartering and management of container vessels for waste disposal
Hongkong United Reinforcement Engineering Limited
27.5 – * 1,000 shares (HK$10,000,000) Providing off-site rebar cutting, bending and prefabrication facilities/services
HUD General Engineering Services Limited 50 – * 4,120,000 shares (HK$41,200,000) General engineering services
TRADING & INDUSTRIAL DIVISION – INDUSTRIAL
Subsidiary companies:
Incorporated in Hong Kong:
Swire Bakery Limited 100 – 100 1 share (US$1) Holding company
Swire Environmental Services Limited 100 – 100 1 share (HK$1) Holding company
Swire Foods Holdings Limited 100 100 – 1 share (HK$1) Holding company
Swire Industrial Limited 100 100 – 2 shares (HK$2) Holding company
Swire MP Foods Limited 60 – 60 10,000,000 shares (HK$10,000,000) Marketing and trading of branded food products
Taikoo Sugar Limited 100 – 100 300,000 shares (HK$4,360,000) Packing and trading of branded food products
Incorporated in Mainland China:
(Wholly foreign owned enterprises)
Chongqing New Qinyuan Bakery Co., Ltd 100 – 100 Registered capital of RMB75,595,238 Bakery chain stores
Reservoir Management Services (Shanghai) Company Limited ̂●
100 – 100 Registered capital of RMB200,000 Provision of business consultancy services
Swire Foods Trading (China) Limited ̂● 100 – 100 Registered capital of HK$63,500,000 Trading of branded food products
Taikoo Sugar (China) Limited ̂● 100 – 100 Registered capital of HK$61,350,000 Packing and trading of branded food products
Attributableto the Group%
Owned directly%
Owned bysubsidiaries%
Issued and fully paid up share/Registered capital Principal activities
MARINE SERVICES DIVISION (continued)
Subsidiary companies (continued):

215SWIRE PACIFIC 2018 ANNUAL REPORT
Attributableto the Group%
Owned directly%
Owned bysubsidiaries%
Issued and fully paid up share/Registered capital Principal activities
TRADING & INDUSTRIAL DIVISION – INDUSTRIAL (continued)
Subsidiary companies (continued):
Incorporated in Mainland China (continued):
(Domestic companies)
Chengdu Xin Qinyuan Food Company Limited ^ 100 – 100 Registered capital of RMB10,000,000 Bakery chain stores
Chengdu Xin Qinyuan Trading Company Limited ^
100 – 100 Registered capital of RMB11,000,000 Bakery chain stores
Chongqing Qinyuan Catering Management Co., Ltd. ^
100 – 100 Registered capital of RMB100,000 Bakery chain stores
Chongqing Qinyuan Trading Company Limited ^
100 – 100 Registered capital of RMB100,000 Bakery chain stores
Guangzhou Mo Fan Catering Management Ltd ^ ●
100 – 100 Registered capital of RMB2,000,000 Catering services
Guiyang Qinyuan Catering Management Co., Ltd. ^
100 – 100 Registered capital of RMB13,000,000 Catering services
Guiyang Yuqinyuan Food Company Limited ^ 100 – 100 Registered capital of RMB20,000,000 Bakery chain stores
Swire Foods and Beverages (Shanghai) Limited ^ ●
100 – 100 Registered capital of RMB5,000,000 Packing and trading of branded food products
Taikoo Sugar Chengdu Limited ̂● 100 – 100 Registered capital of RMB5,000,000 Packing and trading of branded food products
Incorporated in the British Virgin Islands:
Sustainable Capital Holdings Limited 100 100 – 1 share of US$1 Holding company
Incorporated in the Cayman Islands:
Aqua Blue Limited 100 – 100 1 share of US$1 Sustainable development businesses investment
Cell Energy Limited 100 – 100 1 share of US$1 Sustainable development businesses investment
Joint venture companies:
Incorporated in Hong Kong:
Campbell Swire Equipment Leasing Limited 40 – 40 37,300,000 shares (HK$37,300,000) Production lines leasing
Campbell Swire (HK) Limited 40 – 40 30 shares (HK$746,699,024) Holding company
STS Sugar Company Limited 34 – 34 12,400,000 shares (US$12,400,000) Holding company
Swire Waste Management Limited ● 50 – 50 1 ‘A’ share (HK$1) and 1 ‘B’ share (HK$1)
Provision of waste management services
Incorporated in Mainland China:
(Wholly foreign owned enterprises)
Campbell Swire (Xiamen) Co., Limited 40 – * Registered capital of RMB593,800,000
Distribution of soup and broth products
STS Sugar (Foshan) Company Limited ̂● 34 – * Registered capital of RMB76,000,000 Operating sugar refinery
Associated company:
Incorporated in United Kingdom:
Green Biologics Limited 42.31 – 42.31 138,710,625 Ordinary shares of GBP1 each
Developing renewable chemical and biofuel technology

216 PRINCIPAL SUBSIDIARY, JOINT VENTURE AND ASSOCIATED COMPANIES AND INVESTMENTSShowing proportion of capital owned at 31st December 2018
Attributableto the Group%
Owned directly%
Owned bysubsidiaries%
Issued and fully paid up share/Registered capital Principal activities
TRADING & INDUSTRIAL DIVISION – TRADING
Subsidiary companies:
Incorporated in Hong Kong:
Bel Air Motors Limited 100 – 100 1 share (HK$1) Automobile distribution in Taiwan
Beldare Motors Limited 100 – 100 10,000 shares (HK$1,000,000) Automobile distribution in Taiwan
Chevon Holdings Limited 85 – 85 160,000,000 shares (HK$160,000,000)
Holding company
Chevon (Hong Kong) Limited 85 – 100 1,000,000 shares (HK$1,000,000) Marketing, distribution and retailing of branded casual apparel and accessories
Excel Marketing Limited 100 – 100 2 shares (HK$2) Marketing, distribution and retailing of branded casual apparel and accessories
International Automobiles Limited 100 – 100 10,000 shares (US$10,000) Automobile distribution in Hong Kong
Liberty Motors Limited 100 – 100 2 shares (HK$20) Automobile distribution in Taiwan
Nice Access Limited 100 – 100 1,000,000 shares (HK$1,000,000) Marketing, distribution and retailing of branded casual apparel and accessories
Swire Brands Limited 100 – 100 1 share (HK$1) Investment holding
Swire Resources Limited 100 – 100 4,010,000 shares (HK$40,100,000) Marketing, distribution and retailing of branded sports and casual footwear, apparel and accessories
Swire Trading Limited 100 100 – 2 shares (HK$20) Holding company
Taikoo Commercial Vehicles Limited 100 – 100 2,000 shares (HK$2,000) Automobile distribution in Taiwan
Yuntung Motors Limited 100 – 100 2 shares (HK$2) Automobile distribution in Taiwan
Incorporated in Macau:
Swire Resources (Macau) Limited ● 100 – 100 2 shares (MOP25,000) Marketing, distribution and retailing of branded sports and casual footwear, apparel and accessories
Incorporated in Mainland China:
(Wholly foreign owned enterprises)
Chevon (Shanghai) Trading Company Limited ^ 85 – 100 Registered capital of US$12,000,000 Marketing, distribution and retailing of branded casual apparel and accessories
Nice Access (Shanghai) Trading Company Limited ^
100 – 100 Registered capital of RMB5,000,000 Marketing, distribution and retailing of branded casual apparel and accessories
Swire Resources (Shanghai) Trading Company Limited ^
100 – 100 Registered capital of US$6,040,000 Marketing, distribution and retailing of branded sports and casual footwear, apparel and accessories
Incorporated in Malaysia:
Auto Commerz Sdn. Bhd. ● 100 – 100 10,000,000 shares (RM10,000,000) Automobile distribution in Malaysia
Swire Motors Sales and Services Sdn. Bhd. ● 100 – 100 25,000,000 shares (RM25,000,000) Automobile distribution in Malaysia

217SWIRE PACIFIC 2018 ANNUAL REPORT
Attributableto the Group%
Owned directly%
Owned bysubsidiaries%
Issued and fully paid up share/Registered capital Principal activities
TRADING & INDUSTRIAL DIVISION – TRADING (continued)
Subsidiary companies (continued):
Incorporated in Taiwan:
Biao Yi Limited ̂● 100 – 100 10,000,000 shares of NT$1 each Automobile distribution in Taiwan
Incorporated in the British Virgin Islands:
Biao Da Motors Limited 100 – 100 1 share of US$1 Automobile distribution in Taiwan
Supreme Motors Limited 100 – 100 1 share of US$1 Automobile distribution in Taiwan
Taikoo Motorcycle Limited 100 – 100 1 share of US$1 Automobile distribution in Taiwan
Taikoo Motors Limited 100 – 100 1 share of US$1 Automobile distribution in Taiwan
Joint venture company:
Incorporated in Hong Kong:
Intermarket Agencies (Far East) Limited 70 – 70 7 ‘A’ shares (HK$70) and 3 ‘B’ shares (HK$30)
Marketing, distribution and retailing of branded sports and casual footwear, apparel and accessories
Associated company:
Incorporated in Mainland China:
(Wholly foreign owned enterprise)
Columbia Sportswear Commercial (Shanghai) Co., Ltd. ̂●
40 – 40 Registered capital of US$20,000,000 Marketing, distribution and retailing of branded sports and casual footwear, apparel and accessories
OTHERS
Subsidiary companies:
Incorporated in Hong Kong:
Swire Finance Limited 100 100 – 1,000 shares (HK$10,000) Financial services
Incorporated in the Cayman Islands:
Swire Pacific MTN Financing Limited 100 100 – 1 share of US$1 Financial services

218
Cathay Pacific Airways Limited – Abridged Financial Statements
To provide shareholders with information on the results and financial position of the Group’s significant listed associated company, Cathay Pacific Airways Limited, the following is a summary of its audited consolidated statement of profit or loss and consolidated statement of other comprehensive income for the year ended 31st December 2018 and consolidated statement of financial position at 31st December 2018, modified to conform to the Group’s financial statements presentation.
Consolidated Statement of Profit or LossFor the year ended 31st December 2018
Note2018
HK$M2017
HK$M
Revenue 111,060 97,284 Operating expenses (107,465) (99,563)Operating loss before non-recurring items 3,595 (2,279)Gain on disposal of long-term investment – 586 Gain on deemed partial disposal of an associated company 1 – 244 Operating profit/(loss) 3,595 (1,449)Finance charges (2,457) (2,223)Finance income 343 462 Net finance charges (2,114) (1,761)Share of profits less losses of associated companies 1,762 2,630 Profit/(loss) before taxation 3,243 (580)Taxation (466) (308)Profit/(loss) for the year 2,777 (888)Profit/(loss) for the year attributable to: – Cathay Pacific’s shareholders 2,345 (1,259) – Non-controlling interests 432 371
2,777 (888)
HK¢ HK¢
Earnings/(loss) per share attributable to Cathay Pacific‘s shareholders (basic and diluted) 59.6 (32.0)
Note 1: Gain on deemed partial disposal of an associated company On 10th March 2017, Air China Limited (Air China) completed the issue of 1,440,064,181 A shares. As a consequence, Cathay Pacific’s shareholding in Air China was diluted from 20.13% to 18.13%. A gain on this deemed partial disposal of HK$244 million was recorded, principally reflecting the change in the Cathay Pacific group’s share of net assets in Air China immediately before and after the share issue.
Consolidated Statement of Other Comprehensive IncomeFor the year ended 31st December 2018
2018HK$M
2017HK$M
Profit/(loss) for the year 2,777 (888)Other comprehensive incomeItems that will not be reclassified to profit or loss Defined benefit plans (270) 702 Items that can be reclassified subsequently to profit or loss Cash flow hedges 1,586 4,352 Net fair value changes on available-for-sale assets – (403) Share of other comprehensive income of associated companies 628 470 Net translation differences on foreign operations (1,495) 1,874 Other comprehensive income for the year, net of tax 449 6,995 Total comprehensive income for the year 3,226 6,107 Total comprehensive income attributable to: Cathay Pacific’s shareholders 2,794 5,736 Non-controlling interests 432 371
3,226 6,107

219SWIRE PACIFIC 2018 ANNUAL REPORT
Consolidated Statement of Financial PositionAt 31st December 2018
2018HK$M
2017HK$M
ASSETS AND LIABILITIES
Non-current assets
Property, plant and equipment 117,124 111,182
Intangible assets 11,174 11,221
Investments in associated companies 27,570 28,144
Other long-term receivables and investments 4,015 4,068
Deferred tax assets 793 928
160,676 155,543
Current assets
Stock 1,828 1,515
Trade, other receivables and other assets 12,475 12,226
Liquid funds 15,315 19,094
29,618 32,835
Current liabilities
Current portion of long-term liabilities 13,694 8,888
Trade and other payables 19,408 17,057
Unearned transportation revenue 14,030 13,961
Bank overdrafts – unsecured 19 –
Taxation 1,193 1,372
Dividend payable to non-controlling interests 1 –
48,345 41,278
Net current liabilities (18,727) (8,443)
Total assets less current liabilities 141,949 147,100
Non-current liabilities
Long-term liabilities 60,183 69,506
Other long-term payables 4,649 3,502
Deferred taxation 13,178 12,820
78,010 85,828
NET ASSETS 63,939 61,272
EQUITY
Share capital 17,106 17,106
Reserves 46,830 43,995
Equity attributable to Cathay Pacific‘s shareholders 63,936 61,101
Non-controlling interests 3 171
TOTAL EQUITY 63,939 61,272

220
2009HK$M
2010HK$M
2011HK$M
2012HK$M
2013HK$M
2014HK$M
2015HK$M
2016HK$M
2017HK$M
2018HK$M
Ratios Return on equity 13.8% 20.4% 14.9% 8.0% 6.2% 5.0% 6.1% 4.4% 10.9% 9.0% Derived from: Recurring underlying profit 5.2% 5.9% 4.0% 3.6% 4.0% 4.2% 4.2% 2.3% 2.0% 2.8% Exceptionals 0.1% 2.7% 4.0% 0.2% 0.0% 0.2% 0.3% –0.9% 0.0% 0.4% Net property valuation adjustments 8.5% 11.8% 6.9% 4.2% 2.2% 0.6% 1.6% 3.0% 8.9% 5.8% 5-year average 16.5% 16.2% 14.7% 12.0% 12.7% 10.9% 8.1% 5.9% 6.5% 7.1%
Gearing ratio 18.5% 19.7% 15.4% 17.8% 19.2% 22.4% 22.6% 23.5% 23.7% 19.3%Statement of Profit or LossRevenue Property 8,288 8,809 9,518 13,988 12,856 15,297 16,351 16,691 18,443 14,604 Aviation – 2,574 5,171 5,830 7,387 11,927 12,095 13,760 14,546 14,892 Beverages 11,560 12,189 14,105 14,396 15,053 16,382 17,172 18,420 34,066 41,189 Marine Services 3,892 3,046 3,505 4,864 6,292 7,234 5,988 4,237 3,066 3,018 Trading & Industrial 4,320 6,212 8,862 9,956 9,836 10,430 9,245 9,276 10,163 10,896 Head Office 10 7 8 6 13 31 34 5 5 7
28,070 32,837 41,169 49,040 51,437 61,301 60,885 62,389 80,289 84,606Profit attributable to the Company’s shareholders Property 17,356 25,925 24,981 15,282 10,207 7,786 11,494 12,357 27,731 23,437 Aviation 1,772 8,767 2,869 984 1,627 1,822 3,017 441 (1,002) 1,781 Beverages 760 705 664 556 802 854 976 813 2,441 1,630 Marine Services 1,631 782 854 964 1,307 1,072 (1,255) (3,013) (2,232) (5,033) Trading & Industrial 350 1,197 416 247 237 423 155 114 69 2,904 Head Office (29) 719 2,269 (623) (889) (888) (958) (1,068) (937) (1,090)
21,840 38,095 32,053 17,410 13,291 11,069 13,429 9,644 26,070 23,629 Dividends for the year 4,213 5,266 9,780 5,266 5,266 5,868 5,867 3,159 3,155 4,505 Share repurchases – – – – – – 35 – 165 9 Retained profit less share repurchases 17,627 32,829 22,273 12,144 8,025 5,201 7,527 6,485 22,750 19,115 Statement of Financial PositionAssets employed Property – cost and working capital 68,444 75,491 71,868 76,907 84,035 88,491 89,009 90,797 95,846 92,805 – valuation surplus 96,807 119,072 131,609 144,176 151,019 154,116 162,217 171,591 198,496 217,858 Aviation 21,715 38,306 39,689 40,304 43,801 41,195 39,311 42,606 44,798 45,449 Beverages 4,605 5,205 5,662 6,200 6,032 6,048 5,833 7,845 17,274 16,657 Marine Services 7,862 8,872 11,233 17,631 21,412 23,537 22,293 18,170 16,755 13,014 Trading & Industrial 1,511 1,004 1,594 2,663 2,286 3,950 4,445 5,246 5,631 2,252 Head Office 363 2,657 5,631 4,755 4,428 3,417 462 (41) (192) (253)
201,307 250,607 267,286 292,636 313,013 320,754 323,570 336,214 378,608 387,782 Financed by Equity attributable to the Company’s shareholders 168,745 204,464 226,380 208,467 220,297 218,775 218,449 224,879 253,163 270,424 Non-controlling interests 1,098 4,922 5,138 39,915 42,211 43,355 45,537 47,289 52,931 54,691 Net debt 31,464 41,221 35,768 44,254 50,505 58,624 59,584 64,046 72,514 62,667
201,307 250,607 267,286 292,636 313,013 320,754 323,570 336,214 378,608 387,782
HK$ HK$ HK$ HK$ HK$ HK$ HK$ HK$ HK$ HK$‘A’ Shares Earnings per share 14.52 25.32 21.30 11.57 8.83 7.36 8.93 6.41 17.34 15.74 Dividends per share 2.80 3.50 6.50 3.50 3.50 3.90 3.90 2.10 2.10 3.00 Equity attributable to shareholders per share 112.15 135.89 150.46 138.55 146.41 145.40 145.22 149.50 168.58 180.09‘B’ Shares Earnings per share 2.90 5.06 4.26 2.31 1.77 1.47 1.79 1.28 3.47 3.15 Dividends per share 0.56 0.70 1.30 0.70 0.70 0.78 0.78 0.42 0.42 0.60 Equity attributable to shareholders per share 22.43 27.18 30.09 27.71 29.28 29.08 29.04 29.90 33.72 36.02 Underlying Profit (HK$M) 8,422 15,986 17,135 8,270 8,471 9,739 9,892 3,063 4,742 8,523 Return on equity (historic cost) 12.0% 19.9% 18.9% 8.9% 8.9% 10.1% 11.2% 3.6% 5.4% 9.3% Earnings per ‘A’ share (HK$) 5.6 10.6 11.4 5.5 5.6 6.5 6.6 2.0 3.2 5.7 Earnings per ‘B’ share (HK$) 1.1 2.1 2.3 1.1 1.1 1.3 1.3 0.4 0.6 1.1 Interest cover – times 8.3 10.3 10.4 6.7 5.5 6.1 5.4 3.0 4.7 5.6 Dividend payout ratio 50.0% 32.9% 57.1% 63.7% 62.2% 60.3% 59.3% 103.1% 66.5% 52.9%
Summary of Past Performance
221SWIRE PACIFIC 2018 ANNUAL REPORT
2009HK$M
2010HK$M
2011HK$M
2012HK$M
2013HK$M
2014HK$M
2015HK$M
2016HK$M
2017HK$M
2018HK$M
Ratios Return on equity 13.8% 20.4% 14.9% 8.0% 6.2% 5.0% 6.1% 4.4% 10.9% 9.0% Derived from: Recurring underlying profit 5.2% 5.9% 4.0% 3.6% 4.0% 4.2% 4.2% 2.3% 2.0% 2.8% Exceptionals 0.1% 2.7% 4.0% 0.2% 0.0% 0.2% 0.3% –0.9% 0.0% 0.4% Net property valuation adjustments 8.5% 11.8% 6.9% 4.2% 2.2% 0.6% 1.6% 3.0% 8.9% 5.8% 5-year average 16.5% 16.2% 14.7% 12.0% 12.7% 10.9% 8.1% 5.9% 6.5% 7.1%
Gearing ratio 18.5% 19.7% 15.4% 17.8% 19.2% 22.4% 22.6% 23.5% 23.7% 19.3%Statement of Profit or LossRevenue Property 8,288 8,809 9,518 13,988 12,856 15,297 16,351 16,691 18,443 14,604 Aviation – 2,574 5,171 5,830 7,387 11,927 12,095 13,760 14,546 14,892 Beverages 11,560 12,189 14,105 14,396 15,053 16,382 17,172 18,420 34,066 41,189 Marine Services 3,892 3,046 3,505 4,864 6,292 7,234 5,988 4,237 3,066 3,018 Trading & Industrial 4,320 6,212 8,862 9,956 9,836 10,430 9,245 9,276 10,163 10,896 Head Office 10 7 8 6 13 31 34 5 5 7
28,070 32,837 41,169 49,040 51,437 61,301 60,885 62,389 80,289 84,606Profit attributable to the Company’s shareholders Property 17,356 25,925 24,981 15,282 10,207 7,786 11,494 12,357 27,731 23,437 Aviation 1,772 8,767 2,869 984 1,627 1,822 3,017 441 (1,002) 1,781 Beverages 760 705 664 556 802 854 976 813 2,441 1,630 Marine Services 1,631 782 854 964 1,307 1,072 (1,255) (3,013) (2,232) (5,033) Trading & Industrial 350 1,197 416 247 237 423 155 114 69 2,904 Head Office (29) 719 2,269 (623) (889) (888) (958) (1,068) (937) (1,090)
21,840 38,095 32,053 17,410 13,291 11,069 13,429 9,644 26,070 23,629 Dividends for the year 4,213 5,266 9,780 5,266 5,266 5,868 5,867 3,159 3,155 4,505 Share repurchases – – – – – – 35 – 165 9 Retained profit less share repurchases 17,627 32,829 22,273 12,144 8,025 5,201 7,527 6,485 22,750 19,115 Statement of Financial PositionAssets employed Property – cost and working capital 68,444 75,491 71,868 76,907 84,035 88,491 89,009 90,797 95,846 92,805 – valuation surplus 96,807 119,072 131,609 144,176 151,019 154,116 162,217 171,591 198,496 217,858 Aviation 21,715 38,306 39,689 40,304 43,801 41,195 39,311 42,606 44,798 45,449 Beverages 4,605 5,205 5,662 6,200 6,032 6,048 5,833 7,845 17,274 16,657 Marine Services 7,862 8,872 11,233 17,631 21,412 23,537 22,293 18,170 16,755 13,014 Trading & Industrial 1,511 1,004 1,594 2,663 2,286 3,950 4,445 5,246 5,631 2,252 Head Office 363 2,657 5,631 4,755 4,428 3,417 462 (41) (192) (253)
201,307 250,607 267,286 292,636 313,013 320,754 323,570 336,214 378,608 387,782 Financed by Equity attributable to the Company’s shareholders 168,745 204,464 226,380 208,467 220,297 218,775 218,449 224,879 253,163 270,424 Non-controlling interests 1,098 4,922 5,138 39,915 42,211 43,355 45,537 47,289 52,931 54,691 Net debt 31,464 41,221 35,768 44,254 50,505 58,624 59,584 64,046 72,514 62,667
201,307 250,607 267,286 292,636 313,013 320,754 323,570 336,214 378,608 387,782
HK$ HK$ HK$ HK$ HK$ HK$ HK$ HK$ HK$ HK$‘A’ Shares Earnings per share 14.52 25.32 21.30 11.57 8.83 7.36 8.93 6.41 17.34 15.74 Dividends per share 2.80 3.50 6.50 3.50 3.50 3.90 3.90 2.10 2.10 3.00 Equity attributable to shareholders per share 112.15 135.89 150.46 138.55 146.41 145.40 145.22 149.50 168.58 180.09‘B’ Shares Earnings per share 2.90 5.06 4.26 2.31 1.77 1.47 1.79 1.28 3.47 3.15 Dividends per share 0.56 0.70 1.30 0.70 0.70 0.78 0.78 0.42 0.42 0.60 Equity attributable to shareholders per share 22.43 27.18 30.09 27.71 29.28 29.08 29.04 29.90 33.72 36.02 Underlying Profit (HK$M) 8,422 15,986 17,135 8,270 8,471 9,739 9,892 3,063 4,742 8,523 Return on equity (historic cost) 12.0% 19.9% 18.9% 8.9% 8.9% 10.1% 11.2% 3.6% 5.4% 9.3% Earnings per ‘A’ share (HK$) 5.6 10.6 11.4 5.5 5.6 6.5 6.6 2.0 3.2 5.7 Earnings per ‘B’ share (HK$) 1.1 2.1 2.3 1.1 1.1 1.3 1.3 0.4 0.6 1.1 Interest cover – times 8.3 10.3 10.4 6.7 5.5 6.1 5.4 3.0 4.7 5.6 Dividend payout ratio 50.0% 32.9% 57.1% 63.7% 62.2% 60.3% 59.3% 103.1% 66.5% 52.9%

222
Schedule of Principal Group PropertiesAt 31st December 2018
Gross floor areas in square feet
Hong Kong Mainland China USA Totals
Held through subsidiaries
Held through other
companiesHeld through subsidiaries
Held through other
companiesHeld through subsidiaries
Held through other
companiesHeld through subsidiaries
Held through subsidiaries
and other companies
Completed properties for investment
Retail 2,323,135 99,696 2,859,885 1,680,056 496,508 – 5,679,528 7,459,280
Office 8,108,902 878,379 1,731,766 1,208,566 263,384 – 10,104,052 12,190,997
Residential/serviced apartment 583,590 – 51,517 128,565 109,000 – 744,107 872,672
Hotels 358,371 384,796 753,647 471,318 218,000 258,750 1,330,018 2,444,882
11,373,998 1,362,871 5,396,815 3,488,505 1,086,892 258,750 17,857,705 22,967,831
Property developments for investment
Retail 3,281 68,514 – 623,457 – – 3,281 695,252
Office 1,218,000 – – – – – 1,218,000 1,218,000
Residential/serviced apartment – – – – – – – –
Hotels – 26,302 – – – – – 26,302
Under planning – – – – 1,444,000* – 1,444,000 1,444,000
1,221,281 94,816 – 623,457 1,444,000 – 2,665,281 3,383,554
Completed properties for sale
Retail – – – – – – – –
Residential – – – – 296,313 – 296,313 296,313
Office – – – 235,502 – – – 235,502
– – – 235,502 296,313 – 296,313 531,815
Property developments for sale
Office – – – – – – – –
Residential 30,511 – – – 1,073,000 – 1,103,511 1,103,511
Under planning – – – – 825,000 – 825,000 825,000
30,511 – – – 1,898,000 – 1,928,511 1,928,511
12,625,790 1,457,687 5,396,815 4,347,464 4,725,205 258,750 22,747,810 28,811,711
* One Brickell City Centre is currently under planning. The site is included under “Land held for development” in the financial statements.
Notes:1. All properties held through subsidiary companies are wholly-owned by Swire Properties group except for Island Place (60% owned), Taikoo Hui, Guangzhou (97% owned), Brickell City Centre (Retail:
62.93% owned), River Court and Fort Lauderdale (100% owned; 75% defined profits). The above summary table includes the floor areas of these five properties in 100%.2. “Other companies” comprise joint venture or associated companies. The floor areas of properties held through such companies are shown on an attributable basis.3. Gross floor areas in Hong Kong and Mainland China exclude carparking spaces; there are about 10,400 completed carparking spaces in Hong Kong and Mainland China, which are held by subsidiaries and
other companies for investment.4. When a Hong Kong property is held under a renewable lease, the expiry date of the renewal period is shown.5. All properties in the USA are freehold.6. Gross floor areas for all properties in the USA represent saleable/leasable areas for completed and nearly completed properties, which exclude carparking spaces; there are about 1,976 completed
carparking spaces held by subsidiaries and other companies for investment.7. Swire Properties Limited entered into a conditional sale and purchase agreement on 15th June 2018 for the sale of Swire Properties Limited’s 100% interest in a subsidiary which indirectly owns the
Cityplaza Three and Cityplaza Four properties. The relevant subsidiaries were classified as held for sale at 31st December 2018. Accordingly, they are not included in the summary above.

223SWIRE PACIFIC 2018 ANNUAL REPORT
Completed properties for investment in Hong Kong Lot number
Leasehold expiry
Site area in square feet
Gross floor area in
square feetNumber of
car parksYear of completion Remarks
Office
1. Pacific Place, 88 Queensway, Central
One Pacific Place IL 8571 (part) 2135 115,066 (part)
863,266 – 1988
Two Pacific Place IL 8582 & Ext. (part) 2047 203,223(part)
695,510 – 1990
2. Three Pacific Place, One Queen’s
Road East
IL 47A sA RPIL 47A sB RPIL 47A sC RPIL 47B sC RPIL 47A RPIL 47C sA ss1 RPIL 47C sA RPIL 47B sA RPIL 47B sB RPIL 47B RPIL 47A sB ss2IL 47A sDIL 47B sDIL 47C RP IL 47D RPIL 47D sA RPIL 47 sA ss1IL 47 sA RPIL 47 sB ss1 & RPIL 47 sC ss1 & ss2 sA & ss2 RP & ss3 sA & ss3 RP & ss4 & ss5 & ss6 sA & ss6 RP & ss7 RP & RPIL 47 sPIL 47 RPIL 47 sC ss5 Ext.IL 47 sC ss1 Ext.
2050-2852 40,236 627,657 111 2004/07 Linked to The Mall at Pacific Place and Admiralty MTR station.
3. Cityplaza One, Taikoo Shing
QBML 2 & Ext. sR RP (part)QBML 2 & Ext. sR ss1 sA (part)QBML 2 & Ext. sQ RP (part)QBML 2 & Ext. sQ ss7 sA (part)QBML 2 & Ext. sQ ss7 RP (part)QBML 2 & Ext. sQ ss2 sB (part)QBML 2 & Ext. sQ ss2 sA ss1 (part)QBML 2 & Ext. sQ ss2 sA RP (part)QBML 2 & Ext. sJ RP (part)
2899 146,184 (part)
628,785 – 1997 Above part of Cityplaza shopping centre.
4. Devon House, Taikoo Place
QBML 1 sE ss2 (part)QBML 1 sF ss1 (part)QBML 1 sF RP (part)ML 703 sN (part)
2881 70,414 (part)
803,452 311 1993 Linked to Dorset House and Cambridge House.
5. Dorset House, Taikoo Place
QBML 1 sQ (part)QBML 1 sR ss1 (part)QBML 1 sR RP (part)QBML 1 sS (part)QBML 1 sT ss1 (part)QBML 1 sT ss2 (part)QBML 1 sT RP (part)QBML 1 sU (part)QBML 1 sW (part)QBML 1 RP (part)
2881 238,582 (part)
609,540 215 1994 Linked to Devon House.
6. Lincoln House, Taikoo Place
QBML 1 sQ (part)QBML 1 sR ss1 (part)QBML 1 sR RP (part)QBML 1 sS (part)QBML 1 sT ss1 (part)QBML 1 sT ss2 (part)QBML 1 sT RP (part)QBML 1 sU (part)QBML 1 sW (part)QBML 1 RP (part)
2881 238,582 (part)
333,529 164 1998 Linked to PCCW Tower and One Taikoo Place.

224 SCHEDULE OF PRINCIPAL GROUP PROPERTIESAt 31st December 2018
Completed properties for investment in Hong Kong Lot number
Leasehold expiry
Site area in square feet
Gross floor area in
square feetNumber of
car parksYear of completion Remarks
Office (continued)
7. Oxford House, Taikoo Place
QBML 1 sC ss4QBML 1 sC ss7 (part)QBML 2 & Ext. sD
2881/2899
33,434 501,253 182 1999
8. Cambridge House, Taikoo Place
QBML 1 sE ss2 (part)QBML 1 sF ss1 (part)QBML 1 sF RP (part)ML 703 sN (part)
2881 70,414 (part)
268,795 – 2003 Linked to Devon House.
9. One Island East, Taikoo Place
QBML 1 sC ss5QBML 1 sC ss6QBML 2 & Ext. sFQBML 2 & Ext. sGQBML 2 & Ext. sH ss6 sB RPQBML 2 & Ext. sH RPQBML 2 & Ext. RPQBIL 15 sD
2881/2899
109,929 1,537,011 – 2008
10. One Taikoo Place, Taikoo Place
QBML 1 sQ (part)QBML 1 sR ss1 (part)QBML 1 sR RP (part)QBML 1 sS (part)QBML 1 sT ss1 (part)QBML 1 sT ss2 (part)QBML 1 sT RP (part)QBML 1 sU (part)QBML 1 sW (part)QBML 1 RP (part)
2881 238,582 (part)
1,013,368 82 2018 Linked to Lincoln House.
11. Generali Tower, Wanchai
IL 5250IL 7948IL 7950
2089/ 2103/2113
4,612 81,346 – 2013 (Refurbishment)
With ground floor retail.
12. 28 Hennessy Road, Wanchai
ML 23IL 2244 RPIL 2245 RP
2843 9,622 145,390 – 2012
Total held through subsidiaries 8,108,902 1,065
13. PCCW Tower, Taikoo Place
QBML 1 sQ (part)QBML 1 sR ss1 (part)QBML 1 sR RP (part)QBML 1 sS (part)QBML 1 sT ss1 (part)QBML 1 sT ss2 (part)QBML 1 sT RP (part)QBML 1 sU (part)QBML 1 sW (part)QBML 1 RP (part)
2881 238,582 (part)
620,148 217 1994 Linked to Dorset House. Floor area shown represents the whole development, in which the Swire Properties group owns a 50% interest.
14. Berkshire House, Taikoo Place
IL 8854 2047 25,926 388,838 84 1998 Floor area shown represents the whole development, in which the Swire Properties group owns a 50% interest.
15. 625 King’s Road, North Point
IL 7550 2108 20,000 301,065 84 1998 Floor area shown represents the whole development, in which the Swire Properties group owns a 50% interest.
16. Citygate, Tung Chung, Lantau
TCTL 2 (part) 2047 358,557 (part)
160,522 63 1999/ 2000
Above Citygate shopping centre. Floor area shown represents the whole of the office area of the development, in which the Swire Properties group owns a 20% interest. Citygate also comprises a hotel, details of which are given in the Hotel Category below.
17. South Island Place, Wong Chuk Hang
AIL 461 2064 25,500 382,499 137 2018 Floor area shown represents the whole development, in which the Swire Properties group owns a 50% interest.
Total held through joint venture companies 1,853,072 585
– of which attributable to the Swire Properties group 878,379

225SWIRE PACIFIC 2018 ANNUAL REPORT
Completed properties for investment in Hong Kong Lot number
Leasehold expiry
Site area in square feet
Gross floor area in square feet
Number of car parks
Year of completion Remarks
Retail
1. Pacific Place, 88 Queensway, Central
The Mall at Pacific Place
IL 8571 (part) IL 8582 & Ext. (part)
2135/2047 318,289 (part)
711,182 426 1988/90 Shopping centre with restaurants and a cinema. Access to Admiralty MTR station. Pacific Place also comprises serviced apartments and hotels, details of which are given in the Residential and Hotel categories below.
2. Cityplaza, Taikoo Shing
QBML 2 & Ext. sK ss5 QBML 2 & Ext. sR RP (part)QBML 2 & Ext. sR ss1 sA (part)QBML 2 & Ext. sQ RP (part)QBML 2 & Ext. sQ ss7 sA (part)QBML 2 & Ext. sQ ss7 RP (part)QBML 2 & Ext. sQ ss2 sB (part)QBML 2 & Ext. sQ ss2 sA ss1 (part)QBML 2 & Ext. sQ ss2 sA RP (part)QBML 2 & Ext. sJ RP (part)
2899 334,475 (part)
1,105,227 834 1983/87/ 97/2000
Shopping centre with restaurants, ice-skating rink, cinema and access to Tai Koo MTR station.
3. Commercial areas in Stages I - X of Taikoo Shing
SML 1 sA ss1, SML 1 sA RPSML 1 sB, SML 2 sC RPSML 2 sC ss2SML 2 sD, SML 2 RPQBML 2 & Ext. sJ ss1QBML 2 & Ext. sJ ss3QBML 2 & Ext. sLQBML 2 & Ext. sNQBML 2 & Ext. sQ ss4 & ss5QBML 2 & Ext. sQ ss2 sCQBML 2 & Ext. sS ss1QBML 2 & Ext. sH ss1QBML 2 & Ext. sH ss3 sA QBML 2 & Ext. sK ss3 sAQBML 2 & Ext. sU ss1QBML 2 & Ext. sK ss3 RPQBML 2 & Ext. sK ss4 sA & RPQBML 2 & Ext. sT ss1 & RPQBML 2 & Ext. sU RPQBML 2 & Ext. sK ss9 & ss10 & ss11 & ss13 & ss16 (part)
2081/ 2889/2899
– 331,079 3,826 1977-85 Neighbourhood shops, schools and carparking spaces.
4. Island Place 500 King’s Road, North Point
IL 8849 (part) 2047 106,498 (part)
150,223 288 1996 Floor area shown represents the whole shopping centre podium, in which the Swire Properties group owns a 60% interest.
5. StarCrest, 9 Star Street, Wanchai
IL 8853 (part) 2047 40,871 (part)
13,112 83 1999 Floor area shown represents the whole of the retail podium.
6. Taikoo Place Apartments, 23 Tong Chong Street, Taikoo Place
ML 703 sI (part) 2881 8,664 (part)
12,312 – 2014 Floor area shown represents the whole of a 3-storey retail podium (excluding serviced- suites above).
Total held through subsidiaries 2,323,135 5,457

226 SCHEDULE OF PRINCIPAL GROUP PROPERTIESAt 31st December 2018
Completed properties for investment in Hong Kong Lot number
Leasehold expiry
Site area in square feet
Gross floor area in
square feetNumber of
car parksYear of completion Remarks
Retail (continued)
7. Tung Chung Crescent, Tung Chung, Lantau
TCTL 1 (part) 2047 331,658 (part)
36,053 75 1998/ 1999
Floor area shown represents the retail space, in which the Swire Properties group owns a 20% interest.
8. Citygate, Tung Chung Lantau
TCTL 2 (part) 2047 358,557 (part)
462,428 1,093 1999/ 2000
Floor area shown represents the whole of the retail area of the development, in which the Swire Properties group owns a 20% interest. Approximately 126,000 square feet of the shopping centre is currently under major renovation.
Total held through joint venture companies 498,481 1,168
– of which attributable to the Swire Properties group 99,696
Residential
1. Pacific Place Apartments, 88 Queensway
IL 8582 & Ext. (part) 2047 203,223 (part)
443,075 – 1990 270 serviced suites within the Conrad Hong Kong Hotel tower.
2. Taikoo Place Apartments, 23 Tong Chong Street, Taikoo Place
ML 703 sI (part) 2881 8,664 (part)
62,756 – 2014 111 serviced suites above a 3-storey retail podium. Floor area shown excludes retail portion.
3. STAR STUDIOS I & II 8-10 & 18 Wing Fung Street
IL 47 sF (part)IL 47 sG (part)IL 47 sH (part)IL 47 sI (part)IL 8464 (part)
2056/2852 6,775 (part)
47,076 – 2016 (Refurbishment)
120 apartments above ground floor shops. Floor area shown excludes retail area (5,197 square feet).
4. Rocky Bank 6 Deep Water Bay Road
RBL 613 RP 2099 28,197 14,768 – 1981 Six semi-detached houses.
5. House B, 36 Island Road, Deep Water Bay
RBL 507 & Ext. (part) 2097 20,733 (part)
2,644 – 1980 One detached house.
6. Eredine, 38 Mount Kellett Road
RBL 587 & Ext. (part) 2038 51,440 (part)
13,271 4 1965 Four apartment units.
Total held through subsidiaries 583,590 4
Hotel
1. EAST, Hong Kong, Taikoo Shing
QBML 2 & Ext. sR RP (part)QBML 2 & Ext. sR ss1 sA (part)QBML 2 & Ext. sQ RP (part)QBML 2 & Ext. sQ ss7 sA (part)QBML 2 & Ext. sQ ss7 RP (part)QBML 2 & Ext. sQ ss2 sB (part)QBML 2 & Ext. sQ ss2 sA ss1 (part)QBML 2 & Ext. sQ ss2 sA RP (part)QBML 2 & Ext. sJ RP (part)
2899 146,184 (part)
199,633 – 2009 345-room hotel.
2. The Upper House, Pacific Place
IL 8571 (part) 2135 115,066 (part)
158,738 – 2009 (Refurbishment)
117-room hotel above the JW Marriott Hotel.
Total held through subsidiaries 358,371 –

227SWIRE PACIFIC 2018 ANNUAL REPORT
Completed properties for investment in Hong Kong Lot number
Leasehold expiry
Site area in square feet
Gross floor area in
square feetNumber of
car parksYear of completion Remarks
Hotel (continued)
3. JW Marriott Hotel, Pacific Place
IL 8571 (part) 2135 115,066 (part)
525,904 – 1988 602-room hotel, in which the Swire Properties group owns a 20% interest.
4. Conrad Hong Kong Hotel, Pacific Place
IL 8582 & Ext. (part) 2047 203,223 (part)
555,590 – 1990 513-room hotel, in which the Swire Properties group owns a 20% interest.
5. Island Shangri-La Hotel, Pacific Place
IL 8582 & Ext. (part) 2047 203,223 (part)
605,728 – 1991 565-room hotel, in which the Swire Properties group owns a 20% interest.
Total held through associated companies 1,687,222 –
– of which attributable to the Swire Properties group 337,444
6. Novotel Citygate Hong Kong Hotel, Citygate
TCTL 2 (part) 2047 358,557 (part)
236,758 7 2005 440-room hotel, in which the Swire Properties group owns a 20% interest.
Total held through joint venture companies 236,758 7
– of which attributable to the Swire Properties group 47,352
Completed properties for investment in Mainland China Address
Leasehold expiry
Site area in square feet
Gross floor area in
square feetNumber of
car parksYear of completion Remarks
Retail
1. Taikoo Li Sanlitun (Taikoo Li Sanlitun South)
19 Sanlitun Road, Chaoyang District, Beijing
2044 (2054 for Carpark)
566,332 (part)
776,909 417 2007 Shopping centre with restaurants and cinema.
2. Taikoo Li Sanlitun (Taikoo Li Sanlitun North)
11 Sanlitun Road, Chaoyang District, Beijing
2044 (2054 for Carpark)
566,332 (part)
519,399 340 2007 Shopping centre with restaurants.
3. Hui Fang 75 Tianhe East Road, Tianhe District, Guangzhou
2044 174,377 (part)
90,847 100 2008 Shopping centre with restaurants and carparking spaces.
4. Taikoo Hui 381-389 Tianhe Road (odd numbers), Tianhe District, Guangzhou
2051 526,941 (part)
1,472,730 718 2011 Shopping centre with restaurants. Floor area shown represents the retail portion, in which the Swire Properties group owns a 97% interest.
Total held through subsidiaries 2,859,885 1,575
5. INDIGO 18 Jiuxianqiao Road, Chaoyang District, Beijing
2044 (2054 for Carpark)
631,072 (part)
939,493 617 2012 Shopping centre with restaurants and cinema. Floor area shown represents the retail portion, in which the Swire Properties group owns a 50% interest.
6. Sino-Ocean Taikoo Li Chengdu
Daci Temple Area, 9 Dongda Street, Jinjiang District, Chengdu
2051 814,604 (part)
1,314,973 1,051 2014 Shopping centre with restaurants and cinema. Floor area shown represents the retail portion, in which the Swire Properties group owns a 50% interest.
7. HKRI Taikoo Hui South of West Nanjing Road and east of Shimenyi Road, Jingan District, Shanghai
2049 676,091 (part)
1,105,646 240 2016 Floor area shown represents the retail portion, in which the Swire Properties group owns a 50% interest.
Total held through joint venture companies 3,360,112 1,908
– of which attributable to the Swire Properties group 1,680,056
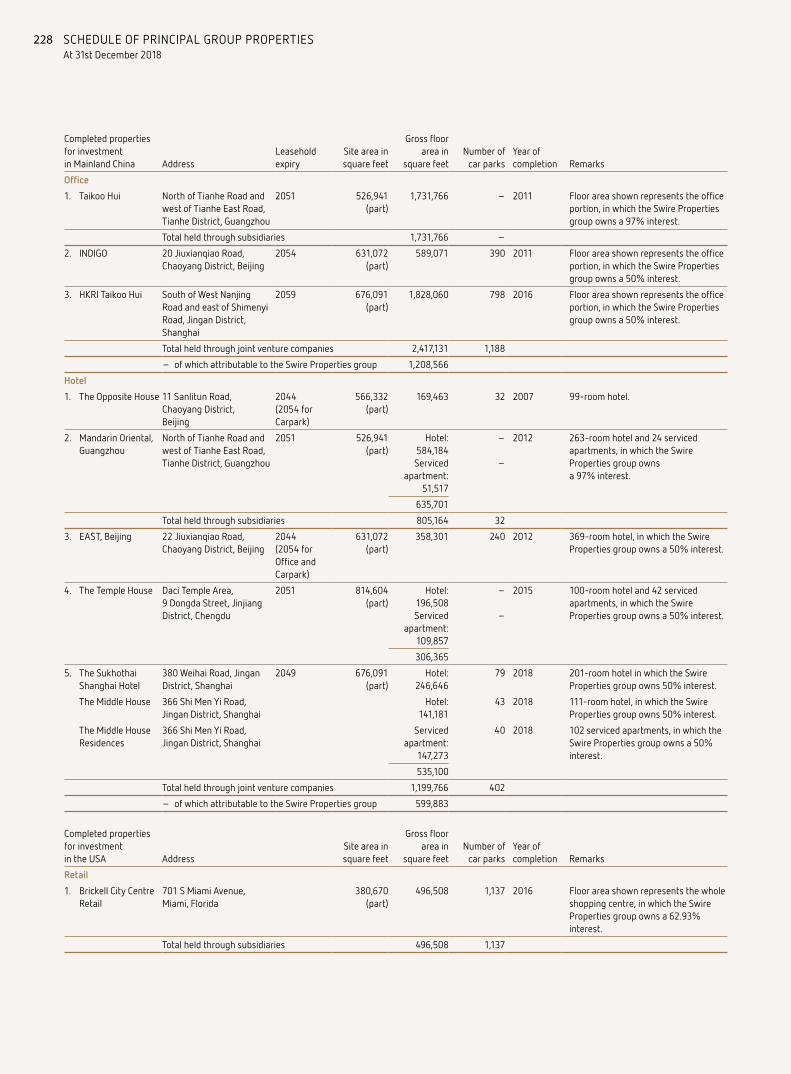
228 SCHEDULE OF PRINCIPAL GROUP PROPERTIESAt 31st December 2018
Completed properties for investment in Mainland China Address
Leasehold expiry
Site area in square feet
Gross floor area in
square feetNumber of
car parksYear of completion Remarks
Office
1. Taikoo Hui North of Tianhe Road and west of Tianhe East Road, Tianhe District, Guangzhou
2051 526,941 (part)
1,731,766 – 2011 Floor area shown represents the office portion, in which the Swire Properties group owns a 97% interest.
Total held through subsidiaries 1,731,766 –
2. INDIGO 20 Jiuxianqiao Road, Chaoyang District, Beijing
2054 631,072 (part)
589,071 390 2011 Floor area shown represents the office portion, in which the Swire Properties group owns a 50% interest.
3. HKRI Taikoo Hui South of West Nanjing Road and east of Shimenyi Road, Jingan District, Shanghai
2059 676,091 (part)
1,828,060 798 2016 Floor area shown represents the office portion, in which the Swire Properties group owns a 50% interest.
Total held through joint venture companies 2,417,131 1,188
– of which attributable to the Swire Properties group 1,208,566
Hotel
1. The Opposite House 11 Sanlitun Road, Chaoyang District, Beijing
2044 (2054 for Carpark)
566,332 (part)
169,463 32 2007 99-room hotel.
2. Mandarin Oriental, Guangzhou
North of Tianhe Road and west of Tianhe East Road, Tianhe District, Guangzhou
2051 526,941 (part)
Hotel: 584,184Serviced
apartment: 51,517
635,701
–
–
2012 263-room hotel and 24 serviced apartments, in which the Swire Properties group owns a 97% interest.
Total held through subsidiaries 805,164 32
3. EAST, Beijing 22 Jiuxianqiao Road, Chaoyang District, Beijing
2044 (2054 for Office and Carpark)
631,072 (part)
358,301 240 2012 369-room hotel, in which the Swire Properties group owns a 50% interest.
4. The Temple House Daci Temple Area, 9 Dongda Street, Jinjiang District, Chengdu
2051 814,604 (part)
Hotel: 196,508Serviced
apartment: 109,857
306,365
–
–
2015 100-room hotel and 42 serviced apartments, in which the Swire Properties group owns a 50% interest.
5. The Sukhothai Shanghai Hotel
380 Weihai Road, Jingan District, Shanghai
2049 676,091 (part)
Hotel:246,646
79 2018 201-room hotel in which the Swire Properties group owns 50% interest.
The Middle House 366 Shi Men Yi Road, Jingan District, Shanghai
Hotel:141,181
43 2018 111-room hotel, in which the Swire Properties group owns 50% interest.
The Middle House Residences
366 Shi Men Yi Road, Jingan District, Shanghai
Serviced apartment:
147,273
535,100
40 2018 102 serviced apartments, in which the Swire Properties group owns a 50% interest.
Total held through joint venture companies 1,199,766 402
– of which attributable to the Swire Properties group 599,883
Completed properties for investment in the USA Address
Site area in square feet
Gross floor area in
square feetNumber of
car parksYear of completion Remarks
Retail
1. Brickell City Centre Retail
701 S Miami Avenue, Miami, Florida
380,670 (part)
496,508 1,137 2016 Floor area shown represents the whole shopping centre, in which the Swire Properties group owns a 62.93% interest.
Total held through subsidiaries 496,508 1,137

229SWIRE PACIFIC 2018 ANNUAL REPORT
Completed properties for investment in the USA Address
Site area in square feet
Gross floor area in
square feetNumber of
car parksYear of completion Remarks
Office
1. Two Brickell City Centre
78 SW 7th Street, Miami, Florida
380,670 (part)
128,842 145 2016
2. Three Brickell City Centre
98 Southeast Seventh Street, Miami, Florida
380,670 (part)
134,542 144 2016
Total held through subsidiaries 263,384 289
Serviced apartments
1. EAST, Residences 788 Brickell Plaza, Miami, Florida
380,670 (part)
109,000 20 2016 89 serviced suites within the EAST, Miami Hotel tower.
Total held through subsidiaries 109,000 20
Hotel
1. Mandarin Oriental, Miami
South Brickell Key, Miami, Florida
120,233 345,000 600 2000 326-room luxury hotel in central Miami, in which the Swire Properties group owns a 75% interest.
Total held through joint venture companies 345,000 600
– of which attributable to the Swire Properties group 258,750
2. EAST, Miami 788 Brickell Plaza, Miami, Florida
380,670 (part)
218,000 80 2016 263-room hotel.
Total held through subsidiaries 218,000 80
Property developments for investment in Hong Kong Lot number
Leasehold expiry
Site area in square feet
Gross floor area in
square feetNumber of
car parksStage of completion
Expected completion date Remarks
Office
1. Two Taikoo Place, Taikoo Place
QBML 1 sQ (part)QBML 1 sR ss1 (part)QBML 1 sR RP (part)QBML 1 sS (part)QBML 1 sT ss1 (part)QBML 1 sT ss2 (part)QBML 1 sT RP (part)QBML 1 sU (part)QBML 1 sW (part)QBML 1 RP (part)
2881 238,582 (part)
1,000,000 351 Foundation works are in progress
2021/ 2022
Floor area shown is an approximation.
2. Po Wah Building, 1-11 Landale Street and 2-12 Anton Street
IL 2242IL 2244 sAIL 2244 sBIL 2244 sCIL 2245 sAIL 2245 sBIL 2245 sCIL 2245 sDIL 2245 sEIL 2245 sF
2843 14,433 218,000 88 Redevelopment under planning
2023 Proposed scheme is under planning.
Total held through subsidiaries 1,218,000 439

230 SCHEDULE OF PRINCIPAL GROUP PROPERTIESAt 31st December 2018
Property developments for investment in Mainland China Address
Leaseholdexpiry
Site area in square feet
Gross floor area in
square feetNumber of
car parksStage of completion
Expected completion date Remarks
1. Taikoo Li Qiantan East of Yangsi West Road, West of Dongyu Road, North of Haiyang West Road, Pudong New District, Shanghai
2053 319,063 (part)
1,246,913 (part)
982 (part)
Superstructure in progress
2020 Proposed scheme is under development. Swire Properties group owns a 50% interest.
Total held through joint venture companies 1,246,913 982
– of which attributable to the Swire Properties group 623,457
Property developments for investment in the USA Site area in square feet
Gross floor area in square feet
Number of car parks
Expected completion date Remarks
1. One Brickell City Centre, Miami, Florida
123,347 Under planning: 1,444,000
To be determined
To be determined
One Brickell City Centre is being planned as a future mixed-use development comprised of retail, Grade A office space, condominiums and a hotel. Located at the corner of Brickell Avenue and SW 8th Street, One Brickell City Centre (comprising approximately 1.4 million square feet) is planned as an 80-storey luxury high rise tower.
Total held through subsidiaries 1,444,000 –
Property developments for investment in Hong Kong Lot number
Leasehold expiry
Site area in square feet
Gross floor area in
square feetNumber of
car parksStage of completion
Expected completion date Remarks
Retail
1. 21-31 Wing Fung Street
IL 526 sA ss1 sCIL 526 sA ss1 sB RPIL 526 sA ss1 sB ss1IL 526 sA ss2IL 526 sA ss3IL 526 sA RP
2856 3,612 (part)
3,281 – Foundation works are in progress
2022 Residential block over retail podium is proposed. Floor area shown represents the retail portion of the development. The area shown is subject to change.
Total held through subsidiaries 3,281 –
2. Tung Chung Town Lot No. 11, Tung Chung, Lantau
TCTL 11 (part) 2063 107,919 (part)
342,569 122 Fitting out works in progress
2019 Proposed scheme is under development. Floor area shown represents the retail portion of the development, in which the Swire Properties group owns a 20% interest, and excludes the area of a public transport terminus. The area is an approximation and is subject to change. A public transport terminus of approximately 65,000 square feet is to be built and handed over to the Government upon completion.
Total held through joint venture companies 342,569 122
– of which attributable to the Swire Properties group 68,514
Hotel
1. Tung Chung Town Lot No. 11, Tung Chung, Lantau
TCTL 11 (part) 2063 107,919 (part)
131,510 5 Fitting out works in progress
2019 Proposed scheme is under development. Floor area shown represents the hotel portion of the development, in which the Swire Properties group owns a 20% interest, and excludes the area of a public transport terminus. The area is an approximation and is subject to change.
Total held through joint venture companies 131,510 5
– of which attributable to the Swire Properties group 26,302

231SWIRE PACIFIC 2018 ANNUAL REPORT
Completed properties for sale in Mainland China Address
Leasehold expiry
Site area in square feet
Gross floor area in
square feetNumber of
car parksYear of completion Remarks
Office
1. Pinnacle One Daci Temple Area, 9 Dongda Street, Jinjiang District, Chengdu
2051 702,243 (part)
471,003 403 2014 Floor area shown represents the remaining unsold portion, in which the Swire Properties group owns a 50% interest.
Total held through joint venture companies 471,003 403
– of which attributable to the Swire Properties group 235,502
Completed properties for sale in the USA Address
Site area in square feet
Gross floor area in
square feetNumber of
car parksYear of completion Remarks
Residential
1. ASIA 900 Brickell Key, Miami, Florida 173,531 5,359 4 2008 36-storey residential condominium tower comprising 123 units with 5-storey parking garage. At 31st December 2018, sales of 122 units had been closed.
2. Reach, Brickell City Centre, Miami, Florida
68 SE 6th Street, Miami, Florida 380,670 (part)
62,140 44 2016 43-storey residential condominium tower comprising 390 units. At 31st December 2018, sales of 361 units had been closed.
3. Rise, Brickell City Centre, Miami, Florida
1 SW 8 Street, Miami, Florida 380,670 (part)
228,814 225 2016 43-storey residential condominium tower comprising 390 units. At 31st December 2018, sales of 234 units had been closed.
Total held through subsidiaries 296,313 273
Property developments for sale in the USA Site area in square feet
Gross floor area in square feet
Number of car parks
Expected completion date Remarks
1. South Brickell Key, Miami, Florida
105,372 Residential: 550,000
395 – Development site in central Miami acquired in January 1997 along with Mandarin Oriental site. Plans for condominium tower currently on hold.
2. Development Site, Fort Lauderdale, Florida
203,941 Under planning: 825,000
1,050 – Development site in Fort Lauderdale acquired in October 2006, in which the Swire Properties group owns 100%, with 75% defined profits.
3. North Squared, Miami, Florida
380,670 (part)
Residential: 523,000
544 – The development on the North Squared site is currently on hold.
Total held through subsidiaries 1,898,000 1,989
Property developments for sale in Hong Kong Lot No
Leasehold expiry
Site area in square feet
Gross floor area in
square feetNumber of
car parks
Expected completion date Remarks
1. 21-31 Wing Fung Street
IL 526 sA ss1 sCIL 526 sA ss1 sB RPIL 526 sA ss1 sB ss1IL 526 sA ss2IL 526 sA ss3IL 526 sA RP
2856 3,612 (part)
Residential: 30,511
– 2022 Residential block over retail podium is proposed. Floor area shown represents the residential portion of the development. The area shown is subject to change.
Total held through subsidiaries 30,511 –

232
100
40
4.4
2.6
82
100
100
100
100
100
12.9
20
45
100
25#
18.1 100 100
100
100
50100
100
100
100
9.1
10
30
25
58.6
50
100
49
10
9
35
100
25
100
85
51
100
100
81.6
60
60
80
95.1
1
52.6
100
100
100
100
95.8
100
100
51
49
100
19
15
20
20
24 100
100
41
83.9
967.6
100
73.3
28
60
70
10.8
5.5
15
9
100
30
100
45
100
100
100
100
42.3
50
Hong KongDragon Airlines Ltd
Air China Cargo Co Ltd
Air China Ltd
Hong KongAirport Services Ltd
Shanghai InternationalAirport Services Co Ltd
Swire BeveragesHoldings Ltd
Swire Beverages Ltd
Swire Coca-ColaHK Ltd
Xiamen LuquanIndustries Co Ltd
Swire GuangdongCoca-Cola Ltd
Swire Coca-ColaBeverages Xiamen Ltd
Coca-ColaBottlers Manufacturing
Holdings Ltd
Swire BCDCo Ltd
BEVERAGESDIVISION
MARINE SERVICESDIVISION
TRADING & INDUSTRIALDIVISION
Trading
AHK AirHong Kong Ltd
Cathay PacificServices Ltd
Vogue LaundryService Ltd
Cathay PacificCatering Services
(HK) Ltd
Swire PropertiesChina Holdings Ltd
Publicly Quoted
Hong Kong
United Kingdom
Malaysia
China PacificLaundry Services Ltd
Swire PropertiesHotel Holdings Ltd
Hong Kong AircraftEngineering Co Ltd
Hong Kong AeroEngine Services Ltd
Taikoo (Xiamen)Aircraft Engineering
Co Ltd
Honeywell TAECOAerospace (Xiamen)
Co Ltd
Taikoo (Shandong) Aircraft Engineering
Co Ltd
Goodrich TAECOAeronautical Systems
(Xiamen) Co Ltd
Taikoo (Xiamen) Landing Gear Services
Co Ltd
Cathay PacificAirways Ltd
Dunlop Taikoo (Jinjiang) Aircraft
Tyres Co Ltd
Taikoo Engine Services(Xiamen) Co Ltd
HAECO ComponentOverhaul (Xiamen) Ltd
HAECO Composite Structures
(Jinjiang) Co Ltd
Shanghai TaikooAircraft Engineering
Services Co Ltd
HAECO ITM Ltd
HAECO USA Holdings, Inc
GoodrichAsia-Pacific Ltd
Singapore HAECOPte Ltd
Swire PropertiesUS Inc
Swire Resources(Shanghai) Trading
Co Ltd
Swire PacificOffshore
InternationalAutomobiles Ltd
Swire Motors Sales andServices Sdn Bhd
Swire Blue Ocean A/S
Swire Seabed AS
Hongkong UnitedDockyards Ltd
Industrial
Taikoo Motors Taiwan
Swire Brands Ltd
Columbia SportswearCommercial
(Shanghai) Co Ltd
Swire Resources Ltd
Swire Coca-Cola,USA
Swire Coca-ColaBeverages LtdTaiwan Branch
Swire Coca-ColaBeverages Hefei Ltd
Swire Coca-ColaBeverages
Zhengzhou Ltd
Swire Coca-ColaBeverages
Zhejiang Ltd
Swire Coca-ColaBeveragesJiangsu Ltd
Swire Coca-Cola Beverages Yunnan Ltd
Shanghai Shen-Mei Beverages
and Food Co Ltd
Swire Coca-Cola Beverages Hubei Ltd
Swire Coca-Cola Beverages Jiangxi Ltd
Swire Guangdong Coca-Cola
Zhanjiang Ltd
Swire Coca-Cola Beverages Hainan Ltd
Swire Coca-Cola Beverages Guangxi Ltd
SWIRE PACIFIC LIMITED
Taikoo Sugar Ltd
Taikoo Sugar (China) Ltd
Swire Foods Trading(China) Ltd
Chongqing New QinyuanBakery Co Ltd
Swire Waste Management Ltd
Swire Properties Ltd
AVIATIONDIVISION
PROPERTYDIVISION
Green Biologics Ltd
Denmark
Norway
United States of America
Taiwan
Singapore
Mainland China
Group Structure Chartat 31st December 2018

233SWIRE PACIFIC 2018 ANNUAL REPORT
100
40
4.4
2.6
82
100
100
100
100
100
12.9
20
45
100
25#
18.1 100 100
100
100
50100
100
100
100
9.1
10
30
25
58.6
50
100
49
10
9
35
100
25
100
85
51
100
100
81.6
60
60
80
95.1
1
52.6
100
100
100
100
95.8
100
100
51
49
100
19
15
20
20
24 100
100
41
83.9
967.6
100
73.3
28
60
70
10.8
5.5
15
9
100
30
100
45
100
100
100
100
42.3
50
Hong KongDragon Airlines Ltd
Air China Cargo Co Ltd
Air China Ltd
Hong KongAirport Services Ltd
Shanghai InternationalAirport Services Co Ltd
Swire BeveragesHoldings Ltd
Swire Beverages Ltd
Swire Coca-ColaHK Ltd
Xiamen LuquanIndustries Co Ltd
Swire GuangdongCoca-Cola Ltd
Swire Coca-ColaBeverages Xiamen Ltd
Coca-ColaBottlers Manufacturing
Holdings Ltd
Swire BCDCo Ltd
BEVERAGESDIVISION
MARINE SERVICESDIVISION
TRADING & INDUSTRIALDIVISION
Trading
AHK AirHong Kong Ltd
Cathay PacificServices Ltd
Vogue LaundryService Ltd
Cathay PacificCatering Services
(HK) Ltd
Swire PropertiesChina Holdings Ltd
Publicly Quoted
Hong Kong
United Kingdom
Malaysia
China PacificLaundry Services Ltd
Swire PropertiesHotel Holdings Ltd
Hong Kong AircraftEngineering Co Ltd
Hong Kong AeroEngine Services Ltd
Taikoo (Xiamen)Aircraft Engineering
Co Ltd
Honeywell TAECOAerospace (Xiamen)
Co Ltd
Taikoo (Shandong) Aircraft Engineering
Co Ltd
Goodrich TAECOAeronautical Systems
(Xiamen) Co Ltd
Taikoo (Xiamen) Landing Gear Services
Co Ltd
Cathay PacificAirways Ltd
Dunlop Taikoo (Jinjiang) Aircraft
Tyres Co Ltd
Taikoo Engine Services(Xiamen) Co Ltd
HAECO ComponentOverhaul (Xiamen) Ltd
HAECO Composite Structures
(Jinjiang) Co Ltd
Shanghai TaikooAircraft Engineering
Services Co Ltd
HAECO ITM Ltd
HAECO USA Holdings, Inc
GoodrichAsia-Pacific Ltd
Singapore HAECOPte Ltd
Swire PropertiesUS Inc
Swire Resources(Shanghai) Trading
Co Ltd
Swire PacificOffshore
InternationalAutomobiles Ltd
Swire Motors Sales andServices Sdn Bhd
Swire Blue Ocean A/S
Swire Seabed AS
Hongkong UnitedDockyards Ltd
Industrial
Taikoo Motors Taiwan
Swire Brands Ltd
Columbia SportswearCommercial
(Shanghai) Co Ltd
Swire Resources Ltd
Swire Coca-Cola,USA
Swire Coca-ColaBeverages LtdTaiwan Branch
Swire Coca-ColaBeverages Hefei Ltd
Swire Coca-ColaBeverages
Zhengzhou Ltd
Swire Coca-ColaBeverages
Zhejiang Ltd
Swire Coca-ColaBeveragesJiangsu Ltd
Swire Coca-Cola Beverages Yunnan Ltd
Shanghai Shen-Mei Beverages
and Food Co Ltd
Swire Coca-Cola Beverages Hubei Ltd
Swire Coca-Cola Beverages Jiangxi Ltd
Swire Guangdong Coca-Cola
Zhanjiang Ltd
Swire Coca-Cola Beverages Hainan Ltd
Swire Coca-Cola Beverages Guangxi Ltd
SWIRE PACIFIC LIMITED
Taikoo Sugar Ltd
Taikoo Sugar (China) Ltd
Swire Foods Trading(China) Ltd
Chongqing New QinyuanBakery Co Ltd
Swire Waste Management Ltd
Swire Properties Ltd
AVIATIONDIVISION
PROPERTYDIVISION
Green Biologics Ltd
Denmark
Norway
United States of America
Taiwan
Singapore
Mainland China
* This organisation chart is for illustrative purposes only and does not represent the legal structure of the Group.
# Shareholding held through subsidiary at 25%, another 24% held through an economic interest with total holding at 49%.

234
Glossary
TERMS
Financial
Underlying profit Reported profit adjusted principally for net revaluation movements on investment properties and the associated deferred tax in Mainland China and the USA, and for deferred tax provisions made in respect of investment properties held for the long-term where it is considered that the liability will not reverse for some considerable time.
Recurring profit or loss Recurring profit or loss is the attributable profit or loss adjusted for significant credits and charges of a non-recurring nature, including gain and losses on the sale of businesses and investment properties and non-cash impairments.
Recurring underlying profit or loss Recurring underlying profit or loss is the Recurring profit or loss adjusted principally for changes in the valuation of investment properties and the associated deferred tax impact.
EBIT Earnings before interest and tax.
EBITDA Earnings before interest, tax, depreciation and amortisation.
Capital employed Total equity plus net debt.
Consolidated net worth Total of share capital, reserves and non-controlling interests.
Consolidated tangible net worth Consolidated net worth less goodwill and other intangible assets.
Equity attributable to the Company's shareholders Equity before non-controlling interests.
Gross borrowings Total of loans, bonds and overdrafts.
Net debt or consolidated borrowed money Total of loans, bonds and overdrafts net of cash, bank deposits and bank balances.
Aviation
Available seat kilometres (ASK) Passenger seat capacity, measured in seats available for the carriage of passengers on each sector multiplied by the sector distance.
Available tonne kilometres (ATK) Overall capacity, measured in tonnes available for the carriage of airline passengers, excess baggage, cargo and mail on each sector multiplied by the sector distance.
Revenue passenger kilometres (RPK) Number of passengers carried on each sector multiplied by the sector distance.
On-time performance Departure within 15 minutes of scheduled departure time.
Beverages
General Trade Small, usually independent, grocery outlets.
Modern Trade Supermarkets and convenience stores, which are usually members of large retail chains.
Other Channels Includes wholesalers, restaurants and outlets at entertainment and educational establishments.
Production Quality Index An index used throughout the TCCC system for evaluating the quality during the production process over a 12 month period.
Water use ratio represents the litres of water used to produce a litre of production. It is calculated as total water used divided by total production volume. Production volume only includes volume produced by Swire Beverages and excludes volume that is purchased from third parties.
Energy use ratio represents the energy consumed (measured in Mega joules) used to produce a litre of production. Energy consumed consists of all energy consumed, except for fuel used in fleet operations. Production volume only includes volume produced by Swire Beverages and excludes volume that is purchased from third parties.
Sustainable Development
Carbon Dioxide Equivalent (CO2e) A measure of the global warming potential of releases of the six greenhouse gases specified by the Kyoto protocol. These are carbon dioxide (CO2), methane (CH4), nitrous oxide (N2O), hydrofluorocarbons (HFCs), perfluorocarbons (PFCs), and sulphur hexafluoride (SF6).
Greenhouse Gas (GHG) A gas in the atmosphere that absorbs and emits radiation within the thermal infrared range. This process is the fundamental cause of the greenhouse effect because part of the re-radiation is back towards the surface of the earth and the lower atmosphere, resulting in an elevation of the average surface temperature above what it would be in the absence of greenhouse gases.

235SWIRE PACIFIC 2018 ANNUAL REPORT
– Scope 1 emissions are direct GHG emissions from sources that are owned or controlled by the Group.
– Scope 2 emissions are indirect GHG emissions from consumption of purchased electricity, heat and steam as well as GHG emissions from the generation and transportation of Towngas in Hong Kong from the production plant to the users.
Cubic metres (cbm) A metric unit of volume or capacity equal to 1,000 litres or 1.0 metric tonne of water.
Global Reporting Initiative (GRI) (www.globalreporting.org) An institution which provides a generally accepted framework for sustainability reporting. The updated GRI G4 framework sets out the principles and indicators that entities can use to measure and report their economic, environmental and social performance.
Lost Day Rate represents the number of lost scheduled working days per 100 employees per year. It is calculated as the total days lost multiplied by 200,000 and then divided by total hours worked. The factor 200,000 is the annual hours worked by 100 employees, based on 40 hours per week for 50 weeks a year.
Lost Time Injury Rate (LTIR) represents the number of injuries per 100 employees per year. It is calculated as the total injuries multiplied by 200,000 and then divided by total hours worked. The factor 200,000 is the annual hours worked by 100 employees, based on 40 hours per week for 50 weeks a year. The definitions of an injury and the number of hours worked may vary slightly in different jurisdictions and in different industries. In such cases local legal definitions and industry norms will take precedence.
Total injuries are the number of injuries in the year which result in lost time of a minimum of one scheduled working day.
RATIOS
Financial
Earnings/(loss) per share =
Profit/(loss) attributable to the Company’s shareholders
Weighted average number of shares in issue during the year
Return on equity =
Profit/(loss) attributable to the Company’s shareholders
Average equity during the year attributable to the Company’s
shareholders
Return oncapital employed
=
Profit/(loss) before net interest after taxation
Average capital employed
Interest cover =Operating profit/(loss)Net finance charges
Cash interest cover =Operating profit/(loss)
Total of net finance charges and capitalised interest
Dividend payoutratio
=Dividends paid and proposed
Profit/(loss) attributable to the Company’s shareholders
Gearing ratio =Net debt
Total equity
Aviation
Passenger/Cargo and mail load factor
=
Revenue passenger kilometres/Cargo and mail
tonne kilometresAvailable seat kilometres/
Available cargo and mail tonne kilometres
Passenger/Cargo and mail yield
=
Passenger turnover/Cargo and mail turnover
Revenue passenger kilometres/Cargo and mail
tonne kilometres
Cost per ATK =Total operating expenses
ATK

236
Financial Calendar and Information for Investors
Financial Calendar 2019
‘A’ and ‘B’ shares trade ex-dividend 10th April
Annual Report available to shareholders 11th April
Share registers closed for second interim dividends entitlement 12th April
Payment of 2018 second interim dividends 10th May
Share registers closed for attending and voting at Annual General Meeting 14th – 16th May
Annual General Meeting 16th May
Interim results announcement August
First interim dividends payable October
Registered Office
Swire Pacific Limited33rd Floor, One Pacific Place88 Queensway Hong Kong
Registrars
Computershare Hong Kong Investor Services Limited17M Floor, Hopewell Centre183 Queen’s Road EastHong Kong
Website: www.computershare.com
Depositary
The Bank of New York MellonBNY Mellon Shareowner ServicesP.O. BOX 505000 Louisville, KY 40233-5000USA
Website: www.mybnymdr.come-mail: [email protected]: Calls within USA – toll free: 1-888-BNY-ADRS International callers: 1-201-680-6825
Stock Codes ‘A’ ‘B’
Hong Kong Stock Exchange 19 87ADR SWRAY SWRBY
Except for voting rights, which are equal, the entitlements of ‘A’ and ‘B’ shareholders are in the proportion 5 to 1.
Auditors
PricewaterhouseCoopers
Investor Relations
E-mail: [email protected]
Public Affairs
E-mail: [email protected]: (852) 2840-8093Fax: (852) 2526-9365Website: www.swirepacific.com
Request for Feedback
In order that we may improve our reporting, we would be grateful to receive your comments on our public announcements and disclosures via e-mail to [email protected]
Disclaimer
This document may contain certain forward-looking statements that reflect the Company’s beliefs, plans or expectations about the future or future events. These forward-looking statements are based on a number of assumptions, current estimates and projections, and are therefore subject to inherent risks, uncertainties and other factors beyond the Company’s control. The actual results or outcomes of events may differ materially and/or adversely due to a number of factors, including changes in the economies and industries in which the Group operates (in particular in Hong Kong and Mainland China), macro-economic and geopolitical uncertainties, changes in the competitive environment, foreign exchange rates, interest rates and commodity prices, and the Group’s ability to identify and manage risks to which it is subject. Nothing contained in these forward-looking statements is, or shall be, relied upon as any assurance or representation as to the future or as a representation or warranty otherwise. Neither the Company nor its directors, officers, employees, agents, affiliates, advisers or representatives assume any responsibility to update these forward-looking statements or to adapt them to future events or developments or to provide supplemental information in relation thereto or to correct any inaccuracies.
Disclaimer

Printed in Hong Kong
© Swire Pacific Limited
太古股份有限公司

C M Y K PMS 7562U
SW_2018_Cover.ai size: 210mm(W) x 285mm(H)paper: Savile Row Tweed Extra White 300gsm
spine: 16mm Cover
www.swirepaci f ic .com Stock Codes: ‘A’ Shares 00019 ‘B’ Shares 00087
AN
NU
AL
RE
PO
RT
20
18
A N N U A L R E P O R T 2 0 1 8