coverage prediction and modeling for lmr and lte
TRANSCRIPT

Coverage Prediction and Modeling for LMR and LTE
IWCE 2018Session M143 Presented by:
Adam NelsonSenior ConsultantFederal Engineering, Inc.
Luis CamarilloCertified Telecommunications EngineerFederal Engineering, Inc.
March 5, 2018

• COVERAGE FUNDAMENTALS
• PROPAGATION TOOLS
• LMR COVERAGE PROCESS AND DEMONSTRATION
• LTE COVERAGE PROCESS AND DEMONSTRATION
• COMPARISON
• Q & A
2
Workshop Agenda

Coverage Fundamentals
3

What is Coverage?
Wireless radio systems are composed of one or more “Antenna Sites” or “Tower Sites.”
Antennas mounted on these structures pump out wireless communications signals via electromagnetic waves.
Users receive the outbound signals from the antenna sites, and transmit their own signals (e.g. voice) back to the sites via radios.
Areas where this two-way communication can occur are said to be “covered.” Areas where either inbound or
outbound directions fail are considered “uncovered.”

Causes of Coverage Problems
• Terrain blocking
• Weak signals
• Aging technologies
• Outgrowing the system• Expanded boundaries
• Urban sprawl
Antenna Site
Green = Signals are strongNo green = Signals are weak or
gone altogether
Terrain Blocking

Propagation Tools
6

Good Coverage
Fair Coverage
Poor Coverage
No CoverageAntenna Sites
Determine Bad Areas

Good Coverage
Fair Coverage
Poor Coverage
No Coverage
Add Hypothetical Antenna Sites

Good Coverage
Fair Coverage
Poor Coverage
No Coverage
Model the Coverage from the Sites

Good Coverage
Fair Coverage
Poor Coverage
No Coverage
Assess the Potential Coverage

LMR Coverage
11

Initial Processes
• Develop basic system, site, and subscriber parameters• Frequency band and technology• Site locations (geographic coordinates)• Antenna characteristics (model, gain, mounting height)• Power limitations• Usage (trunk-mount mobile antenna, hip-mount portable antenna,
etc.)
• Input the parameters into the tool• Verify the locations (important when dealing with database
discrepancies)• Run the prediction studies

Subset of Parameters
• Geographic coordinates
• Elevation
• Frequencies
• Antenna models
• Antenna heights
• Antenna gains
• Antenna beamwidths
• Transmit power out
• Transmission lines
• Transmit combiners
• Receive multicouplers
• Tower-top amplifiers
• Jumpers/connectors
• Effective radiated power (ERP)
• Receive sensitivity
• Subscriber type (mobile, portable, MDT, handset)

Datasets
• Terrain• Clutter• Land use / land cover
• Buildings• High-resolution• Increases computation
time
Bare earth
Canopy
Buildings

Demonstration of LMR Coverage Prediction
15
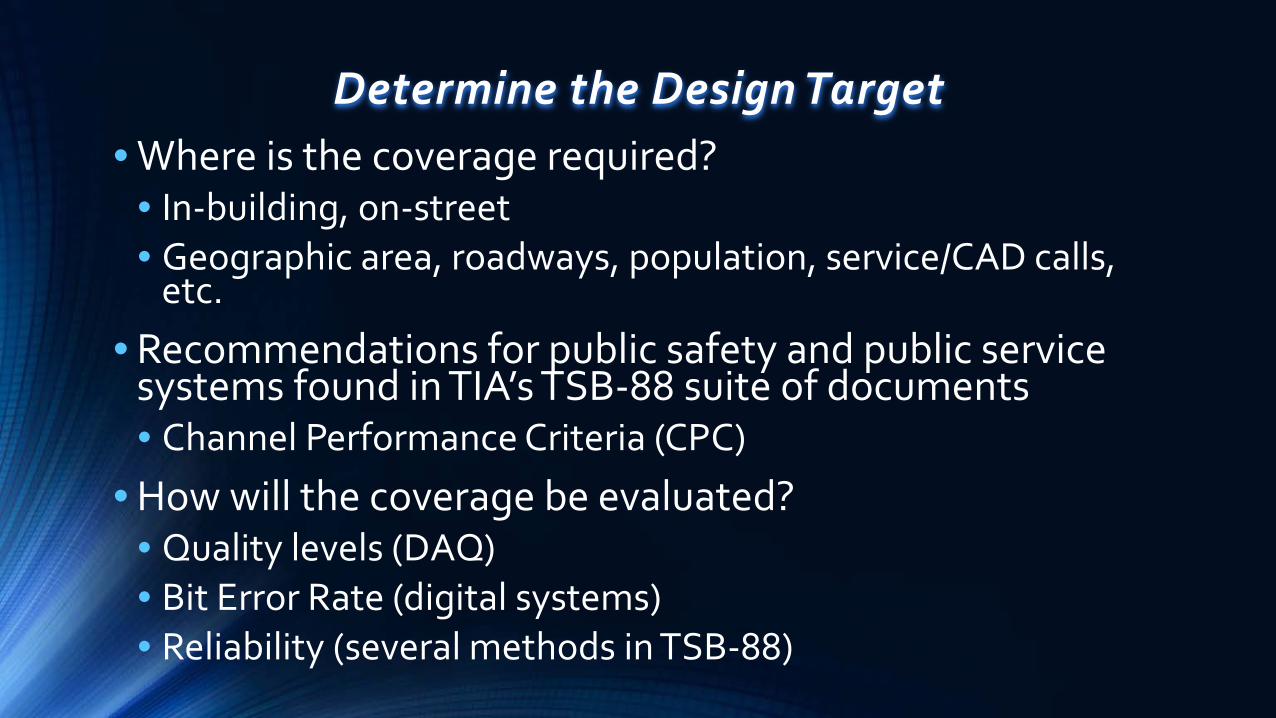
Determine the Design Target• Where is the coverage required?
• In-building, on-street• Geographic area, roadways, population, service/CAD calls,
etc.
• Recommendations for public safety and public service systems found in TIA’s TSB-88 suite of documents• Channel Performance Criteria (CPC)
• How will the coverage be evaluated?• Quality levels (DAQ)• Bit Error Rate (digital systems)• Reliability (several methods in TSB-88)

Channel Performance Criteria (CPC)
• Start with the reference sensitivity of the receiver
• Subtract the Cs / N (Static Carrier to Noise) to get the Inferred Noise Floor
• Add the Cf / N (Faded Carrier to Noise) to get the Faded Performance Threshold (FPT)
• Add other factors to obtain Design Target• Antenna Characteristics• Building Loss (if applicable)• Tile Reliability Margin
• Result = Design Target of -76.7 dBm
-118 dBm (5% BER from spec) -118
7.6 dB(C4FM from TSB88) -125.6
Cs / N
17.7 dB(C4FM for DAQ 3.4) -107.9
CF / N
10 dB (portable losses) -97.9
Sub. Antenna
12 dB (building penetration loss) -85.9
Buildings
9.2 dB (Tile Reliability 95%) -76.7
Tile Margin

Demonstration of LMR Coverage Evaluation
18

Next Steps
• Did the coverage meet the target?
• If not:• Modify existing sites and rerun coverage• Add new sites and evaluate their coverage• Repeat as necessary

Outputs / Deliverables
• Static• Image files• Hard copies
• Dynamic• GIS layers
• KML layers
• Interactive PDF

Other Factors that May Affect Your Design
• Interference• Co-channel / adjacent channel• Inter-system / intra-system
• Spectrum• Can channels be licensed, and can they be licensed at the
heights/power levels you modeled?
• Other system technology alternatives• Interoperability• Operational concerns

LTE Coverage
22

Broadband Data Considerations
• Application types
• Desired/required bit rates
• UE Types
• Amount of UEs
• How will traffic be modeled?• Noise Rise Method (quicker)• Monte Carlo analysis in propagation tool (more accurate)

Initial Processes
• Define system/project parameters• Propagation model• Frequency band / duplexing
• Channel Model• Urban, Vehicle, Pedestrian
• Develop RAN site (eNodeBs) and UE parameters• Equipment specifications• 3GPP standards• Power Classes • MIMO
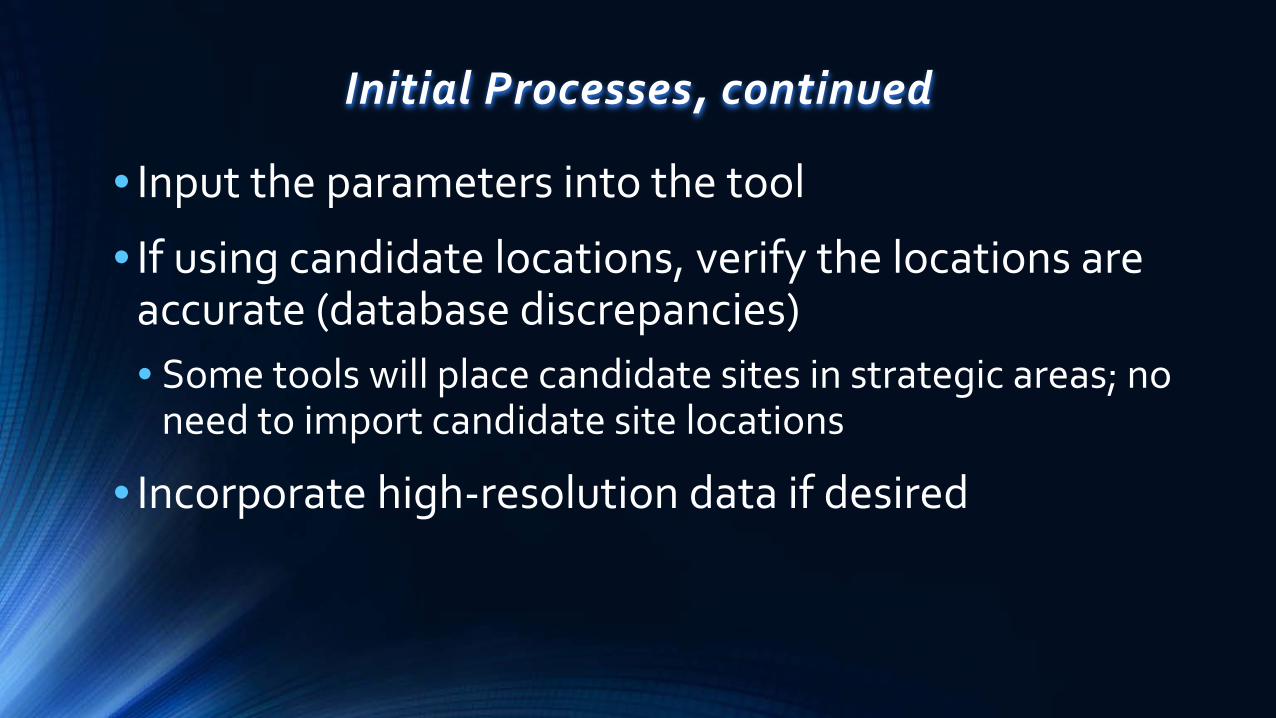
Initial Processes, continued
• Input the parameters into the tool
• If using candidate locations, verify the locations are accurate (database discrepancies)• Some tools will place candidate sites in strategic areas; no
need to import candidate site locations
• Incorporate high-resolution data if desired

Determine the Design Target• Define user requirements
• Who will use the system?• What will they do?
• Where is the coverage required?• In-building, on-street• Geographic area, roadways, population, service/CAD calls,
etc.
• Data Rate Requirement• Often expressed as a throughput level, or data rate (e.g. 768 kbps
downlink, 256 kbps uplink)

Determine the Design Target, continued• Determine the SINR to obtain your required throughput
• LTE is self-interfering (everyone using the same spectrum)• The interference (originated from other UEs and other cells’
activity) causes SINR to decrease, and therefore data rates to drop.
• Manufacturers have SINR to Throughput tables for their equipment (often in bits / Resource Block)
• Use link budgets to balance paths• Develop the Maximum Allowable Path Loss (MAPL) for both
directions• Modify eNodeB power to balance paths (if feasible)

Key Performance Indicators (KPIs) to Evaluate
• RSRP - Reference Signal Received Power (DL)
• RSRQ - Reference Signal Received Quality (DL)
• SINR – Signal to Interference plus Noise Ratio (DL / UL)
• Throughput (DL / UL); a.k.a. Data Rate
Demonstration of LTE Coverage Evaluation
29

Next Steps
• Did the coverage/throughput meet the target?
• If not:• Assess traffic as a factor in performance• Modify existing sites and rerun coverage• Add new sites and evaluate their coverage• Repeat as necessary

Next-level Design Steps
• Neighbor List Analysis• Determines what eNodeBs are within range of others
• Physical Cell ID (PCI) Planning• Helps the system coordinate traffic originating from
eNodeBs (to minimize interference)
• IRAT / Handover Analysis• Evaluating site-to-site switching, or system to system (e.g. to WiFi)

Outputs
• System performance reports• Optimized site locations• Neighbor list• Static Maps
• Image files• Hard copies
• Dynamic Maps• GIS layers• KML layers• Interactive PDF
Conclusion
• LMR and LTE coverage are developed, predicted, and analyzed very differently.• Inputs• Datasets• Operational areas• Application Types• Evaluation Criteria
• Voice quality – LMR• Data rate – LTE

Discussions

Contact Information
Adam Nelson, Senior Consultant
• Direct: 540-809-6096 • Email: [email protected]
Luis Camarillo, Certified Telecommunications Engineer
• Direct: 281-787-2515• Email: [email protected]