covered calls and their unintended reversal bet
TRANSCRIPT
8/12/2019 Covered Calls and Their Unintended Reversal Bet
http://slidepdf.com/reader/full/covered-calls-and-their-unintended-reversal-bet 1/11
Covered Calls and
Their Unintended Reversal Bet
June 2014
Roni Israelov, Ph.D.
Vice President, AQR Capital Management, LLC
Lars N. Nielsen
Principal, AQR Capital Management, LLC
The views and opinions expressed herein are those of the authors and do not necessarily reflect
the views of AQR Capital Management, its affiliates or employees and do not constitute an offer
or solicitation of an offer, or any advice or recommendation, to purchase any securities or other
financial instruments, and should not be construed as such.

8/12/2019 Covered Calls and Their Unintended Reversal Bet
http://slidepdf.com/reader/full/covered-calls-and-their-unintended-reversal-bet 2/11
Covered Calls and Their Unintended Reversal Bet – 2
Equity index covered calls have historically provided attractive risk-adjusted returns largely
because of their joint exposures to the equity and volatility risk premia. However, they also
embed exposure to an uncompensated risk, a naïve equity market reversal strategy. This paper
provides evidence that the reversal exposure is responsible for about one quarter of the covered
call’s risk, but provides very little reward.
Introduction
Equity index covered calls have historically realized returns not much less than their underlying
index with significantly less volatility. They have realized this performance by providing
exposure to the volatility risk premium in addition to the equity risk premium.1
Exhibit 1 ‒ Covered Call Payoff Diagram
However, another important characteristic of covered calls is nearly universally ignored.
Covered calls have a remnant exposure to equity market timing, a consequence of selling
options. While portfolio managers typically focus on a covered call’s exposure to volatility,equity timing may contribute more than three times the risk of the short volatility risk premium
exposure and nearly half the risk of its passive equity risk premium exposure. In fact, over a
quarter of a covered call’s risk may be attributed to equity timing. This paper seeks to further
1 Bakshi and Kapadia (2003) report evidence of the volatility risk premium by analyzing delta-hedgedindex option returns. Hill, Balasubramanian, Gregory, and Tierens (2006) show the impact on coveredcalls of selling options at implied volatility instead of at the volatility realized over the life of the option.
Long Half Equity + Long Half Cash Short Half Straddle
Covered Call
$0
$25
$50
$75
$100
$125
$150
$175
$200
$ 0 $ 25 $5 0 $ 75 $ 100 $ 125 $ 150 $ 175 $ 200
P a y o f f
Asset Price
-$100
-$75
-$50
-$25
$0
$25
$50
$75
$100
$ 0 $ 25 $ 50 $ 75 $1 00 $ 125 $ 150 $ 175 $ 200
P a y o f f
Asset Price
-$50
-$25
$0
$25
$50
$75
$100
$125
$150
$ 0 $ 25 $5 0 $ 75 $ 100 $ 125 $ 150 $ 175 $ 200
P a y o f f
Asset Price
8/12/2019 Covered Calls and Their Unintended Reversal Bet
http://slidepdf.com/reader/full/covered-calls-and-their-unintended-reversal-bet 3/11
Covered Calls and Their Unintended Reversal Bet – 3
the understanding of covered call strategies by shining a light on their embedded timing of the
equity market.
Covered Call Definition
A covered call is a combined long position in a security and a short position in a call option onthat security. The combined position caps the investor’s upside on the underlying security at the
option’s strike price in exchange for the option premium.
It is possible to construct an identical exposure to At-The-Money (ATM) covered calls by
investing half of the NAV in the underlying equity and selling short half of a straddle (a call
option and put option at the same strike and maturity). This representation of the covered call is
convenient because, unlike a short call option, the short straddle position is delta-neutral.
Exhibit 1 constructs the payoff diagram for the covered call strategy using this approach. The
long equity position provides the equity exposure and the short straddle position provides the
volatility exposure with no equity exposure on average. In this example, selling the half straddle
generates $25 in option premium.
Covered Calls Bet on Equity Reversals
When an ATM call option is written, it has an approximately 0.5 delta to its underlying security.
At the same time, the covered call strategy, which is long the equity and short the option, also
has a 0.5 delta to its underlying security. However, this equity exposure changes as soon as
the equity’s price moves.
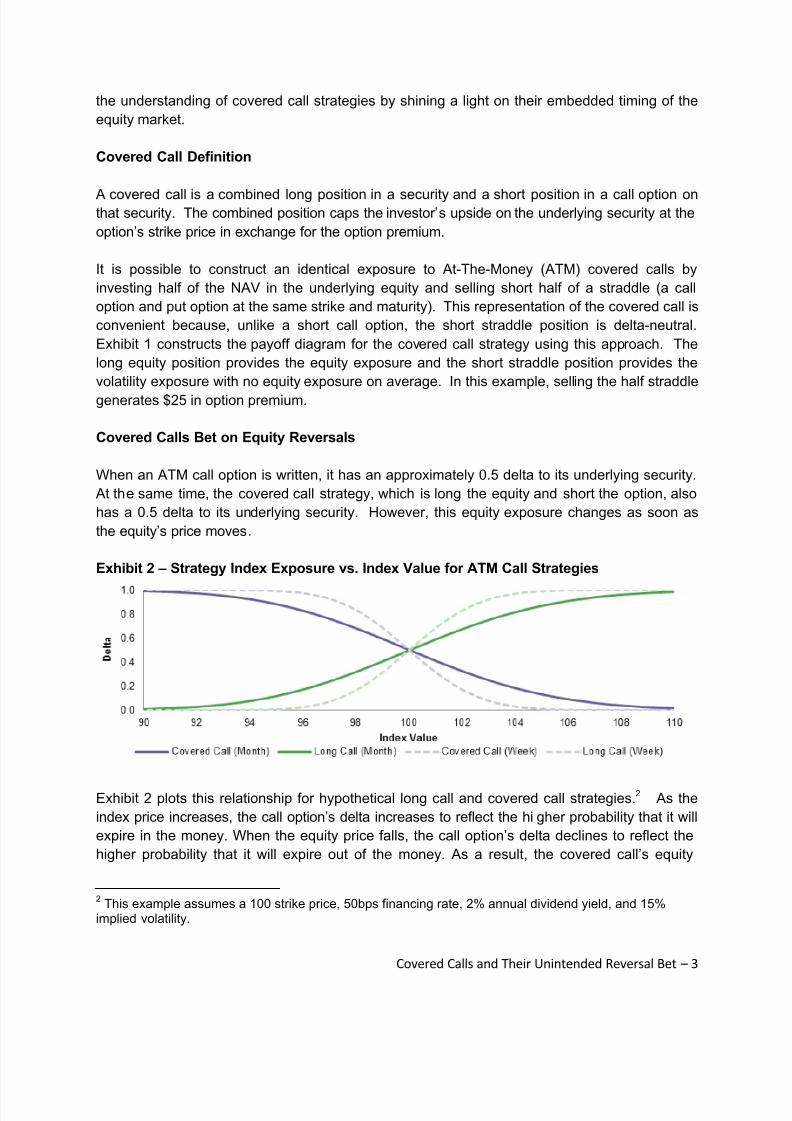
Exhibit 2 ‒ Strategy Index Exposure vs. Index Value for ATM Call Strategies
Exhibit 2 plots this relationship for hypothetical long call and covered call strategies.2 As the
index price increases, the call option’s delta increases to reflect the higher probability that it will
expire in the money. When the equity price falls, the call option’s delta declines to reflect the
higher probability that it will expire out of the money. As a result, the covered call’s equity
2 This example assumes a 100 strike price, 50bps financing rate, 2% annual dividend yield, and 15%implied volatility.

8/12/2019 Covered Calls and Their Unintended Reversal Bet
http://slidepdf.com/reader/full/covered-calls-and-their-unintended-reversal-bet 4/11
Covered Calls and Their Unintended Reversal Bet – 4
exposure is negatively related to the index price. A falling market leads to larger equity exposure
and a rising market leads to smaller, but still positive equity exposure. Thus, due to options’
changing delta, covered calls embed a reversal strategy.
This reversal strategy is path dependent because it is tied to the return since the date the option
was sold. The day after the call option is written, the covered call effectively bets on a one-dayreversal because of the short call option’s changing delta. Six days later, the covered call
strategy bets on a one-week reversal and the day prior to option expiration it bets on a one-
month reversal. When the option expires, the covered call starts afresh with no reversal
exposure.
For those who explicitly want to express a reversal view in their portfolio, covered calls may be
ineffective due to this path dependence. Selling a call option is unnecessary for betting on
equity reversals since the desired dynamic equity exposure may be obtained directly by trading
the underlying security. However, selling a call option provides short volatility exposure,
something that cannot be attained by trading the underlying security. For this reason, we view
the equity reversal exposure as unintended.
Exhibit 2 also shows that the relationship between moneyness and equity exposure is often
stronger for nearer-dated options. For example, if one month until option expiration the index
appreciates from 100 to 103, the covered call’s exposure will decline from 0.50 to 0.25. If the
same index move happened with one week until expiration, the exposure would have declined
to 0.08 instead. As expiration nears, so long as the index value remains above 100, the
covered call’s equity exposure will converge to zero. A covered call’s equity exposure must
converge to either zero or one on its expiration date.
Exhibit 3 ‒ CBOE S&P 500 BuyWrite Index’s Delta
Delta computed according to Black-Scholes model on the CBOE S&P 500 BuyWrite Index.
This convergence is observable in Exhibit 3, which shows the evolution of an ATM covered
call’s delta across four recent expiration cycles. The CBOE S&P 500 BuyWrite Index’s delta is
slightly above 0.5 on option initiation dates, which is when the options have been sold. The
covered call’s delta begins to fluctuate and by the time the call option expires, the strategy’s

8/12/2019 Covered Calls and Their Unintended Reversal Bet
http://slidepdf.com/reader/full/covered-calls-and-their-unintended-reversal-bet 5/11

8/12/2019 Covered Calls and Their Unintended Reversal Bet
http://slidepdf.com/reader/full/covered-calls-and-their-unintended-reversal-bet 6/11
Covered Calls and Their Unintended Reversal Bet – 6
Exhibit 4 ‒ Range of CBOE S&P 500 BuyWrite Index’s Deltas
Delta computed according to Black-Scholes model on the CBOE S&P 500 BuyWrite Index. Chart and statistics are based on the
period from March 25, 1996 to December 31, 2013.
The equity risk premium comes from the long equity position. The volatility risk premium and
equity timing exposures are supplied by the short call option position. The short call option alsoreduces the exposure to the equity risk premium provided by the long equity position.
Exhibit 5 ‒ CBOE S&P 500 BuyWrite Index’s Delta Distribution
Delta computed according to Black-Scholes model on the CBOE S&P 500 BuyWrite Index. Chart and statistics are based on the
period from March 25, 1996 to December 31, 2013.
We decompose a simple overwriting strategy, which mimics the industry standard covered call
benchmark – the CBOE BuyWrite Index – into these three components. Table 1 reports the
results. The equity risk premium realized approximately 8% annualized volatility, while the
volatility risk premium realized a modest 2.0% volatility. At 4.9% volatility, equity timing does
indeed realize about half the risk of the equity risk premium and is responsible for four times the
risk contribution of the volatility risk premium.4
4 Risk contribution is defined as the covariance of the component with the BuyWrite Index divided by thevariance of the BuyWrite Index.

8/12/2019 Covered Calls and Their Unintended Reversal Bet
http://slidepdf.com/reader/full/covered-calls-and-their-unintended-reversal-bet 7/11
Covered Calls and Their Unintended Reversal Bet – 7
Table 1: Simple Overwriting
Return Decomposition (Annualized)
Equity Risk Premium Volatility Risk Premium Equity TimingExcess Return 3.2% 1.9% 0.6%Volatility 8.3% 2.0% 4.9%Sharpe Ratio 0.39 0.95 0.12
Risk Contribution 64% 7% 28%Alpha to S&P 500 -- 1.7% 0.1%
Statistics are calculated over the period March 25, 1996 to December 31, 2013.
Based on our analysis, it is evident why adding volatility risk premium exposure to an equity
portfolio is desirable. It has 1.7% alpha to the S&P 500 and more than double its Sharpe ratio.
Shorting volatility provides one-third of the covered call’s average return even though it is only
responsible for less than 10% of its risk.
Although equity timing has also realized moderately positive returns over our sample, the 0.6%
annualized return is not statistically significant. More importantly, it is unclear why this method of
equity timing would be a compensated risk premium.
Hedged Overwriting
It is possible to invest in an S&P 500 index covered call strategy without equity timing. The call
option’s delta is known in advance and hedging away its active exposure by trading S&P 500
index futures or an index ETF is not particularly expensive. The resulting strategy, which we
denote Hedged Overwriting, provides purer exposure to the equity and volatility risk premia.
Table 2 reports performance statistics for the S&P 500 Index (SPX), the CBOE BuyWrite Index
(BXM), and a hedged overwriting strategy. By hedging the equity timing risk, which has nearly
5.0% annualized volatility, the hedged overwriting strategy has 2.6% lower annualized volatility
than BXM. Further, the hedged overwriting strategy has smaller drawdowns than BXM because
BXM’s equity timing component provides increasing equity exposure during S&P 500
drawdowns.
The difference in upside and downside betas for BXM provides additional evidence in favor of
its non-linear S&P 500 index exposure; it has nearly twice the exposure to negative S&P 500
returns. While the hedged overwriting strategy also has higher exposure to negative S&P 500
returns, hedging away the active equity timing component significantly reduces its downside
exposure to S&P 500 Index.

8/12/2019 Covered Calls and Their Unintended Reversal Bet
http://slidepdf.com/reader/full/covered-calls-and-their-unintended-reversal-bet 8/11
Covered Calls and Their Unintended Reversal Bet – 8
Table 2: Summary Statistics
SPX BXMHedged
OverwritingExcess Return (Geometric) 4.6% 4.9% 4.7%Volatility 16.8% 11.6% 9.0%Sharpe Ratio 0.28 0.42 0.51Worst Drawdown -62% -43% -34%Beta to S&P 500 Index 1.00 0.62 0.53
- Upside Beta 1.00 0.46 0.46- Downside Beta 1.00 0.85 0.59
Source: S&P 500 Total Return Index and CBOE S&P 500 BuyWrite Index reported over the period April 1, 1996 to December 31,
2013. Returns are excess of cash (US 3-Month LIBOR). Annualized volatility and Betas are computed using 21-day overlapping
returns.
Historical Evidence
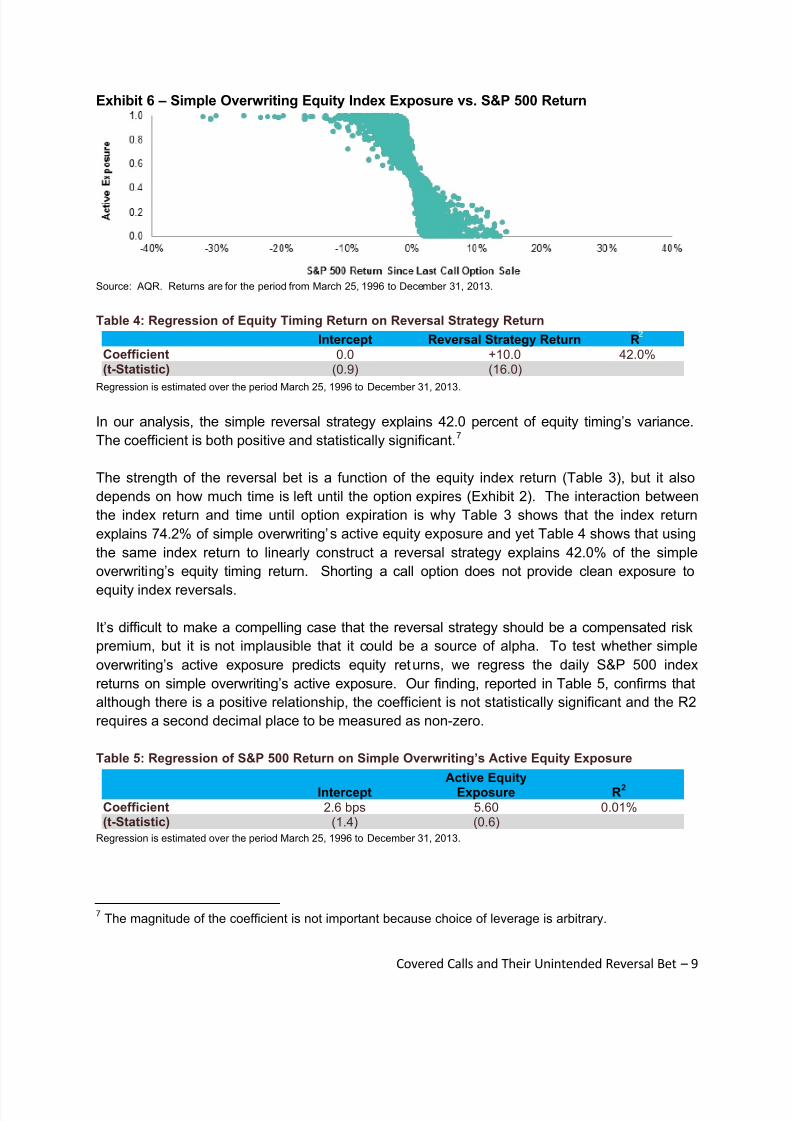
Exhibit 1 showed that a covered call embeds a reversal exposure in a hypothetical example.
Stepping away from the hypothetical, Exhibit 6 plots simple overwriting’s active exposure as it
relates to the S&P 500’s return since the date the call option was written. When the index return
has been positive, the active equity exposure tends to be negative and vice versa. The
relationship is non-linear, in part due to the fact that the active exposure is bounded by ±½.
Table 3 reports the relationship, as estimated via regression, between simple overwriting’s
equity exposure and the S&P 500 Index return since the last option trade. The regression
confirms the negative relationship, which is statistically significant with a 30.6 t-statistic.5 The
0.5 intercept represents the simple overwriting’s static exposure to the S&P 500 Index.
Table 3: Regression of Simple Overwriting Delta on S&P 500 Return Since Last Option Expiration
Intercept Index Return R
Coefficient 0.50 -6.68 74.2%(t-Statistic) (241.0) (-30.6)
Regression is estimated over the period March 25, 1996 to December 31, 2013.
Testing this from another angle, we form a simple reversal strategy in which the S&P 500
position is equal to the negative of the index’s return since the prior option’s expiration. 6 Table
4 reports the regression of simple overwriting’s equity timing component on our reversal
strategy’s return.
5Because of the unusual overlapping nature of the data, we use the bootstrap resampling techniques toestimate standard errors for the three regressions reported in this paper. Reported coefficients are theaverage regression coefficients from the bootstrapped samples.6 We winsorize returns at ±7.5% in order to cap and floor the strategy’s position in a manner similar to thecovered call which has absolute active positions no larger than ½.
8/12/2019 Covered Calls and Their Unintended Reversal Bet
http://slidepdf.com/reader/full/covered-calls-and-their-unintended-reversal-bet 9/11
Covered Calls and Their Unintended Reversal Bet – 9
Exhibit 6 ‒ Simple Overwriting Equity Index Exposure vs. S&P 500 Return
Source: AQR. Returns are for the period from March 25, 1996 to December 31, 2013.
Table 4: Regression of Equity Timing Return on Reversal Strategy Return
Intercept Reversal Strategy Return R
Coefficient 0.0 +10.0 42.0%(t-Statistic) (0.9) (16.0)
Regression is estimated over the period March 25, 1996 to December 31, 2013.
In our analysis, the simple reversal strategy explains 42.0 percent of equity timing’s variance.
The coefficient is both positive and statistically significant.7
The strength of the reversal bet is a function of the equity index return (Table 3), but it also
depends on how much time is left until the option expires (Exhibit 2). The interaction between
the index return and time until option expiration is why Table 3 shows that the index return
explains 74.2% of simple overwriting’s active equity exposure and yet Table 4 shows that using
the same index return to linearly construct a reversal strategy explains 42.0% of the simple
overwriting’s equity timing return. Shorting a call option does not provide clean exposure to
equity index reversals.
It’s difficult to make a compelling case that the reversal strategy should be a compensated risk
premium, but it is not implausible that it could be a source of alpha. To test whether simple
overwriting’s active exposure predicts equity returns, we regress the daily S&P 500 index
returns on simple overwriting’s active exposure. Our finding, reported in Table 5, confirms that
although there is a positive relationship, the coefficient is not statistically significant and the R2
requires a second decimal place to be measured as non-zero.
Table 5: Regression of S&P 500 Return on Simple Overwriting’s Active Equity Exposure
InterceptActive Equity
Exposure R2
Coefficient 2.6 bps 5.60 0.01%(t-Statistic) (1.4) (0.6)
Regression is estimated over the period March 25, 1996 to December 31, 2013.
7 The magnitude of the coefficient is not important because choice of leverage is arbitrary.

8/12/2019 Covered Calls and Their Unintended Reversal Bet
http://slidepdf.com/reader/full/covered-calls-and-their-unintended-reversal-bet 10/11
Covered Calls and Their Unintended Reversal Bet – 10
Conclusion
While many reasons are provided in support of equity index covered calls, Israelov and Nielsen
(2014) show that ultimately the strategy is attractive because of its exposure to the equity and
volatility risk premia. However, covered calls also provide exposure to equity timing via an
embedded reversal bet. Due to the complexity and opacity of the covered call strategy, thisequity timing exposure, which is typically responsible for over 25 percent of the covered call’s
risk, is hidden in plain sight.
It is important that investors and portfolio managers understand the risks they are taking when
writing a covered call. We believe the portfolio can and should be hedged against exposures to
market timing so that the limited risk budget may be allocated to compensated risk premia.

8/12/2019 Covered Calls and Their Unintended Reversal Bet
http://slidepdf.com/reader/full/covered-calls-and-their-unintended-reversal-bet 11/11
Covered Calls and Their Unintended Reversal Bet – 11
Related Studies
Bakshi, G. and N. Kapadia (2003), “Delta-Hedged Gains and the Negative Market Volatility Risk
Premium”
Hill, J.M., Gregory, K.B. and I. Tierens (2006), “Finding Alpha via Covered Index Writing,”Financial Analysts Journal 62(5), 29-46.
Israelov, R. and L.N. Nielsen (2014), “Eight Myths and One Fact about Covered Calls” AQR
Whitepaper.