coverpage observatory 19.12.2014, quarterly special issue · iafei quarterly special issue...
TRANSCRIPT

December 19, 2014, www.iafei.org
Copyright © iafei 2014. All Rights Reserved
SPECIAL ISSUE
MANAGEMENT CONTROL
INTERNATIONAL OBSERVATORY 2014
IAFEI QuarterlySpecial Issue Management Control
The electronic professional journal of IAFEI(International Association of Financial Executives Institutes)
IAFEIQuarterly
SpecialIssue
December2014

International Observatory
Of Management Control
2014 Results
Which activities? Which processes?
Which methods? Which systems?

© IOMC 2014 - Any total or partial reuse of the document
contents requires the citation of the source 2
FOREWORD
DFCG is proud to share with you the 4th edition of the International Observatory of Management
Control, in partnership with the consulting firm Decision Performance Conseil.
This observatory, published in French and in English, is now embracing 30 nationalities, continuously
enlarging. Supported by results and analysis, the international scope provides to our readers a
universal insight on management control best practices.
Beyond the basics of the profession to serve management and performance, the evolution highlighted
in this observatory reflects the acceleration of decision making processes and the constant need for
adaptability. In the current economical and geopolitical context with the more demanding time factor,
companies look for greater and renewed reactivity and agility.
An important learning, that deserves particular attention, is the wish to rationalize and simplify
reporting metrics, privileging more relevant indicators, where decision is based on quality. In the “Big
Data” era, facing the challenge of large volume of information, management control must stand its
ground and must take advantage of it. The massive inflow should translate into appropriate decision
supporting information thanks to extremely subtle analysis. Business Intelligence become business
analytics, management controllers become business analysts.
Finally, the observatory emphasizes this need for improvement in terms of methods and tools. These
assessments are opportunities for the management control profession, which must adapt and evolve,
like many other professions. The profession should avoid taking the risk of not being anymore at the
core of the management and business performance analysis. Management control isn’t only about
financials, but also about human resources, taxes and environment.
I wish to say a special word of thanks to the work-group and its Chairman, Frédéric DOCHE, co-
chairman of the DFCG “Management Control and Decision Support” commission, as well as to all
interviewed colleagues who contributed to this observatory.
Through this observatory, DFCG provides an important and valuable contribution to IAFEI in gathering
Finance and Administration managers all over the world.
Thanks again to all of you for this 4th edition. We hope it to be pleasant and instructive for all our
readers.
Truly yours,
Thierry LUTHI
DFCG Chairman

© IOMC 2014 - Any total or partial reuse of the document
contents requires the citation of the source 3
THE WORKING GROUP
LEADER
Frédéric DOCHE, Chairman and founder of Décision Performance Conseil
Chairman of DFCG Scientific Committee
Chairman of DFCG Management Control Committee
Chairman of IAFEI Management Control Committee
MEMBERS
Dominique Bastien, Chief Financial Officer, SIPLEC
Nadezhda BELKOVA, Project Financial Controller, ALSTOM
Katrien An DE BLOCK, Senior Finance Manager Europe, Boston Scientific International
Jean-Marc DEPRALON, Performance Manager, Groupe BPCE
Xavier DURAND, Head of Finance Department, ESSCA
Jean-Pierre GODBILLON, Costing process experts team leader, Solvay
Laurent GRECO, Management control director, Groupe Aldes
Isabelle HANUS HULIN, Controlling Director
Anne HEMMERLE, Chief Financial Officer, RSI VIDEO TECHNOLOGIES
Cyrille Kechavarzi, Senior Director Finance
Catherine KUSZLA, University professor, Angers University
Alexandre Mazurek, Senior Finance Manager International, Stryker Neurovasculaire
Laure Moussion, Senior Consultant, Décision Performance Conseil
Alain NGUYEN, Management Controller (internship), Sage
Elodie Warnod, FP&A Director, Sage
Nicolas ZANELLI, Chief Financial Officer, Mayence
Many thanks for their contribution and support to:
Décision Performance Conseil (www.conseil-dpc.com)
ESSCA, École de Management
Thierry LUTHI, Chairman, DFCG
Armand ANGELI, Chairman, DFCG International

© IOMC 2014 - Any total or partial reuse of the document
contents requires the citation of the source 4
TABLE OF CONTENT
1 International Observatory of Management Control ...................................................................................... 5
Presentation of international observatory of management control ..................................................................................... 5
Findings summary.................................................................................................................................................................. 6
2 Profile ............................................................................................................................................................. 8
A renewed international dynamics ........................................................................................................................................ 8
A panel of companies generally similar to 2013 .................................................................................................................... 8
An increasing impact of the economical crisis ....................................................................................................................... 9
A more experimented controllers’ panel including young people and women .................................................................... 9
Two main models of professional training appear linked to the geographical area and the recruitment is globalized ...... 10
3 Activities ....................................................................................................................................................... 11
Reporting, planning, budgeting and forecasting are still the main activities ...................................................................... 11
Coordination with business activities hardly improves: 23% of spent time ........................................................................ 12
More coordination with business functions in period of growth ........................................................................................ 13
A function close to top managers ........................................................................................................................................ 15
4 Processes ...................................................................................................................................................... 16
79% of the companies are using strategic and operational plans ....................................................................................... 16
Quick and steady increase of the use of rolling forecasts ................................................................................................... 17
Forecast processes are faster .............................................................................................................................................. 17
The deletion of indicators in the reporting has increased from 3% to 41% ........................................................................ 18
Over 60% of the companies are using WCR and Cash-Flow indicators ............................................................................... 19
5 Methodologies ............................................................................................................................................. 20
Increasing usage of our observed methodologies: from 68% in 2013 to 75% in 2014. ....................................................... 20
Benchmarking remains the most utilized and popular methodology ................................................................................. 21
The Balanced Scorecard (BSC) ............................................................................................................................................. 22
Activity Based Costing / Activity Based Management (ABC/ABM) ...................................................................................... 23
Beyond Budgeting = Delete your budget!! .......................................................................................................................... 24
Zero Based Budgeting (ZBB) ................................................................................................................................................ 24
6 Management Information System ............................................................................................................... 25
Excel remains the main tool for 56% of the respondents ................................................................................................... 25
The Corporate Headquarter chooses the MIS in 69% of the companies ............................................................................. 26
Dissatisfaction towards MIS is increasing and approaches 50% .......................................................................................... 26
Only 1 out of 2 companies has MIS projects scheduled ...................................................................................................... 27
7 Efficiency ...................................................................................................................................................... 28
2014 versus 2013: innovation is back and strategic vision is strengthening ....................................................................... 29
Efficiency Profiles per Geography ........................................................................................................................................ 29
Efficiency of controlling practices per industry sector ........................................................................................................ 30
8 Towards a typology of controlling practices ................................................................................................ 31
Class 1 – “the CONTROLLED FIRMS” (28%) .......................................................................................................................... 32
Class 2 – “the PROACTIVE FIRMS” (24%) ............................................................................................................................. 32
Class 3 – “the AGILE FIRMS” (25%) ...................................................................................................................................... 33
Class 4 – “the REGULATED FIRMS” (23%) ............................................................................................................................ 33
Focus on similar and diverging elements ............................................................................................................................ 34

© IOMC 2014 - Any total or partial reuse of the document
contents requires the citation of the source 5
1 INTERNATIONAL OBSERVATORY OF MANAGEMENT CONTROL
PRESENTATION OF INTERNATIONAL OBSERVATORY OF MANAGEMENT CONTROL
The International Observatory of Management Control has been launched at the end of 2010 by the
DFCG (Association Nationale des Directeurs Financiers et de Contrôle de Gestion, the French Financial
Association) in partnership with the consulting firm Décision Performance Conseil.
The purpose of this observatory is to get a better understanding of the activities, processes and
methods used by management controllers all over the world.
In the current crisis environment, management control is becoming more central in the company: it is
expected to make the link between operational management and the company’s performance, to
improve the company’s flexibility in an ever-changing environment, and to support innovation on fast-
moving markets.
Using an online survey of respondents of 31 different citizenships, relayed by partnering associations,
the 2014 Observatory workgroup has examined various management control practices. The workgroup
did assessments and compared them with prior year results. Finally, the workgroup prepared a
complete analysis of practices and trends in the Management Control profession across the world.
The results of prior year’s editions aroused great interest and were included in several presentations
and publications. The 2014 conclusions are presented as well, notably during the IAFEI worldwide
congress in Philippines and DFCG “Financium” congress.
The workgroup, chaired by Frederic DOCHE, co-chairman of the DFCG “Management Control and
Decision Support” commission and chairman and founder of Décision Performance Conseil, wished to
illustrate its analysis by testimonies of senior professionals in Management Controlling positions. We
would like to thank all those who accepted an interview for their time and their valuable contribution
to help us make this 2014 edition more dynamic and more meaningful.
INTERNATIONAL PARTNERS
ANDAF (Italy) CFO Club (Slovakia) COGEREF (Tunisia) FEI (USA) FINEX (Philippines) FINEXA (Poland) GEFIU (Germany) JACFO (Japan) IAFEI (International) IHM (Greece) IMA (USA) IMEF (Mexico) OPWZ (Austria) PAFE (Portugal) Russian Club of Financial Directors (Russia) SAIBA (South Africa) And obviously, DFCG in France.

© IOMC 2014 - Any total or partial reuse of the document
contents requires the citation of the source 6
FINDINGS SUMMARY
The DFCG’s International Observatory of Management Control (IOMC), in partnership with the
consulting firm Décision Performance Conseil and the management school ESSCA are presenting the
results of their study for the fourth year running
Representing 31 nationalities, the study confirms its international dimension. All categories of
companies are represented: respondents are working in small, intermediate and large firms and in all
industries. The 2013 findings regarding the enduring economic crisis is confirmed: the 2014 panel
includes twice as many companies facing stagnation or declining revenues compared to 2011. The
respondent’s profiles are quite similar to prior years, although proportionally the study shows a more
important participation of women and young professionals. This year, the profile description has been
completed with an analysis of differences in educational background across the geographical areas.
In a tense economical context for most of them, a majority of companies continues to work on
improving their performance management. We find a greater focus on the management control of
their core business, even if, for some of them, too much time is dedicated to reporting, planning and
budgeting while losing sometimes momentum with operational staff, which is considered to be the
key value adding activity. The process analysis highlights a significant number of companies that
simplified their indicators and fastened their forecast process, and expresses a clear need for
simplification and continuous efficiency improvements (cf. Process chapter). Discrepancies are still to
be noticed, depending on company size, industry and citizenship.
In terms of methodology, we notice this year again the preponderance of benchmarking, used by 72%
of the respondents. While this method is mostly used by growing businesses, companies facing
downfall privilege other methods, such as Zero Based Budgeting (ZBB, cf. Methodology chapter).
As far as performance management systems are concerned, the leading tools are easy to use and
require not a lot of investment, Microsoft Excel is ranking first. Projects aiming at system evolution or
re-engineering are not on the agenda of 50% of the companies which increases frustration. It seems
that the digital era and related powerful and flexible solutions are not yet as widely disseminated as
for other functions.
Nevertheless, the innovation plot is brighter on the radar-screen of efficiency profile in 2013 compared
to 2014. Where companies have managed to challenge the status-quo in management control
practices, it mostly happens through the implementation of new methodologies (ZBB) and
prioritization of daily activities but rarely through information systems improvement. It is noticed that
innovation is showing a high score particularly thanks to American companies but that there are
discrepancies again across geographical areas and industries (Cf. Efficiency chapter).
Whatever their profile is in the typological analysis (controlled, proactive, agile or regulated),
companies tend to align their practices: re-enforcement of control and the structuring of the
organization, opening up to transverse tools, involvement of all stakeholders in the performance
management. It appears that the best performing companies are using 3 levers: adaptability or
reactivity of the structure, involvement of stakeholders in the management processes and finally
strategic vision. (Cf. Typology chapter).

© IOMC 2014 - Any total or partial reuse of the document
contents requires the citation of the source 7
KEY FIGURES
72% of the companies are using Benchmarking
31 countries answered the survey
+38% points of respondents
using simplified indicators in reporting
48% of the companies are not
satisfied with their current MIS
+ 5% points in the use of
BSC (Balanced Scorecard) Twice as many companies publish their
reports within 5 days after closing date
60% use of cash flow indicators in
the budget and forecast
processesclosing date +9% points of respondents have
implemented Rolling Forecast

© IOMC 2014 - Any total or partial reuse of the document
contents requires the citation of the source 8
2 PROFILE
A RENEWED INTERNATIONAL DYNAMICS
The population of respondent companies diversified: 31 different nationalities in 2014 compared to
21 in 2011. We can notice that companies set up in the East and the South of Europe or in Arabic
countries did join the panel this year. The study keeps its international dynamics.
A PANEL OF COMPANIES GENERALLY SIMILAR TO 2013
Companies are issued from all business sectors but seem to be generally similar in terms of size of
turnover, of status (listed or not) and in terms of head counts. Small and middle sized companies
remain mainly represented: in 2014 like in 2013 71% of them are showing a turnover lower than 1
million euros.
The proportion of the small companies (turnover<50 million USD) is quite consistent: 28% of the panel
in 2014 compared to 29% in 2013.
0%
5%
10%
15%
20%
25%
30%
35%
< 50Million
from 50to 249Million
from 250to 999Million
from 1 to5 Billion
> 5 Billion
Sizes by turnover in EUR (2014)
A population of companies generally
similar to 2013
A renewed international dynamics:
31 nationalities in 2014 (compared to 27 in 2013)
An ever present economic crisis: twice as many companies
with stagnating or declining turnover between 2011 and 2014
2 major development models in function of the observed
geographic areas and a clear trend towards the
internationalization of recruitment
A population of more
experienced respondents, open
to young professionals & women
0%
5%
10%
15%
20%
25%
30%
35%
40%
< 100employees
from 100 to999
employees
from 1000to 4999
employees
from 5000to 24999
employees
> 25000employees
Sizes by head count (2014)

© IOMC 2014 - Any total or partial reuse of the document
contents requires the citation of the source 9
In terms of staff strength, 56% of the respondents,
in 2014 similar to 2013, are counting less than
1000 employees.
The representation of companies regarding their
staff strength remain consistent too. All sizes are
represented.
The panel of companies is also well represented in
all business sectors
AN INCREASING IMPACT OF THE ECONOMICAL CRISIS
Even if a majority of the respondents have still
been in a growing period, their percentage highly
decreased compared to the previous years. From
70% in 2012 decreasing to 56 % in 2014.
Moreover the part of declining companies is
increasing with about 10 points between 2012 and
2014 (from 22% to 32%).
A MORE EXPERIMENTED CONTROLLERS’ PANEL INCLUDING YOUNG PEOPLE AND WOMEN
The respondents are better experimented (64%of the panel have
got more than 10 years of experience in their job in 2014 compared
to 60% in 2011). The controllers population becomes nevertheless
younger ( 5% of less than 30 years old in 2011 compared to 9% in
2014). Women are better represented: + 8 points during the same
period (from 22% to 30% of the respondents).
8%
31%
5%4%8%
8%3%
6%
8%
19%
2014 Business sectors
Consumer Products Industrial Equipment
Energy, Utilities and Environment Engineering and Construction
Distribution and Trading Bank, Insurance and Financial Services
Public Sector Transport and Logistics
Media, Telecom and IT Other Services
0%
10%
20%
30%
40%
50%
Strongdecline (<-
10%)
Decline Zerogrowth
Weakgrowth(<+10%)
Stronggrowth(>+10%)
Turnover evolution
2012 2013 2014
A REPRESENTATIVE PART OF YOUNG
CONTROLLERS (LESS THAN 30 YEARS OLD)
+4 % POINTS BETWEEN 2011 AND
2014)
30% of respondents are WOMEN

© IOMC 2014 - Any total or partial reuse of the document
contents requires the citation of the source 10
TWO MAIN MODELS OF PROFESSIONAL TRAINING APPEAR LINKED TO THE GEOGRAPHICAL
AREA AND THE RECRUITMENT IS GLOBALIZED
The analysis of the first-degree training of the respondents shows that two main models exist
according their geographical area:
A western training model (Europe and America/Oceania) which is based upon a financial and
accounting training in a majority but which allows a true diversity of the first-degree diploma
(engineers can become controllers) and specialization (the role of a first-degree course
specialized in management control is particularly clear in Europe).
The model of the emerging countries which today allows the access to the management
control function only to the people who have a diploma in accounting/audit or
finance/economics.
A more detailed analysis of the recruitment flows at the international level (by crossing the
respondent’s nationality and his(her) firm nationality) allows to understand the strength of the
gobalization process for the Management Control Function.
European societies hire Europeans in 95% of the cases. Asian firms also mainly recruit Asian people
(75% of the cases), but are opened up to professionals from all other continents (among the remaining
25%, 10% come from Africa, 10% from Europe and 5% from America/Oceania). Firms from the
America/ Oceania and Africa areas have a deversified recruitment: 35% of their controllers come from
Asia – 6%- or Europe-29%. African firms hire the half of their controllers from Europe-17% or Asia –
33%.
Nevertherless Africa and America may be unsimilar: the variety of the controllers’ origins can be the
result of a strategy (international implementation with a local hiring) or the result of the scarcity of the
local competencies in both areas.
0%
10%
20%
30%
40%
50%
60%
70%
80%
Accounting/Audit Finance/Economy Managementcontrol
Engineer
Professional training and geographical area
AFRICA AMERICA/OCEANIA ASIA EUROPE

© IOMC 2014 - Any total or partial reuse of the document
contents requires the citation of the source 11
3 ACTIVITIES
Activities covered by our multi-national panel include: reporting, planning, budgeting, variance
analyses, forecasting, business reviews, coordination with operational functions, information systems
and internal control.
The international observatory of management control has also been analyzing whether the results
change between activity sectors, the profile of the controller or the size of the company.
In addition to the usual controller’s scope of activities, this panel explains the expectations in terms of
management, added value and support to the management.
REPORTING, PLANNING, BUDGETING AND FORECASTING ARE STILL THE MAIN ACTIVITIES
As in previous years, reporting, planning, budgeting,
forecasting and variance analysis are the core
business. They represent more than 60% of
controller’s working time.
After many years of evolution, the separation of
activities remains stable.
Time spent remains stable by activities compared to
previous years, with a slight increase in variance
analysis and reporting.
There are nevertheless differences by regions: more
time spent on operations coordination and reporting
in Europe, more business reviews in Asia.
Coordination of business activities hardly
increased: 23% of spent time
Reporting, planning, budgeting and forecasting
are still the main activities
Close coordination with the general manager
More coordination with business
functions in period of growth
7%
9%
11%
12%
13%
14%
16%
18%
0% 5% 10% 15% 20%
Internal control
Information system
Business reviews
Coordination with business
Forecasting
Variance analysis
Plan & budget
Reporting
Time spent on activities (2014)

© IOMC 2014 - Any total or partial reuse of the document
contents requires the citation of the source 12
COORDINATION WITH BUSINESS ACTIVITIES HARDLY IMPROVES: 23% OF SPENT TIME
At the top of added value, we find coordination with operations, thereby linking to business and
strategy.
However, time spent on coordination and business reviews hardly progresses (23% in 2014 compared
to 21% in 2013)…
Links between time spent and added value have been studied for each activity:
• Plan & budget, variance analysis and forecasting ratios are well balanced. A lot of time for
a high added value.
• Coordination with operations and to a lower extent business review have a high added
value for a shorter time spent.
• On the contrary, reporting is time consuming for a weak added value.
• Finally, internal control and information system are neglected by controllers.
Time has been better correlated to added value than in 2013, especially on business review and
reporting.
Controller’s activities are better balanced every year. Concentration on core business is developing
well even if too much time is spent on reporting, plan & budget.
Activities repartition is the same according to the experience level and area of activity of the controller.
Directors are concentrated on budget and forecasting, supporting strategy elaboration.
“We shift from a centralized controlling to an organization modeled on the group governance, meaning one team by
executive committee member, physically located by them: I want controllers to be their business partners”
Sébastien Martineau, CFO, Haulotte group
Coordination with business
Variance analysis
Plans, budget
Business review
Reporting
I.S.
Internal control5%
7%
9%
11%
13%
15%
17%
19%
5% 10% 15% 20%
Tim
e
Added value
Time /added value (2014)

© IOMC 2014 - Any total or partial reuse of the document
contents requires the citation of the source 13
MORE COORDINATION WITH BUSINESS FUNCTIONS IN PERIOD OF GROWTH
When studying respondents activities some differences arise with the growth of the business and
status (listed or not).
Controllers activities according to the growth
Important discrepancies appear when we compare activities against economic situations. In a period
of economic development, internal control and information system become significant roles in their
day to day tasks and vice versa when declining. Based on this evidence, we can wonder if the health
of a company is a good basis for internal control and information system, or if it is a source of
development.
Turnover development Turnover decrease
Internal control +42% Forecasting +27%
Information system + 26% Information system -26%
Reporting +14% as average Internal control -42%
Coordination with business + 5%
Forecasting -5%
“Controllers, who must be a good communicator, able to explain finance messages, is instrumental in helping
operational staff to adapt themselves” Sébastien Martineau, CFO, Haulotte group
Is internal control different from other functions? Even if the time spent on internal control is limited
in comparison to other tasks, the time still varies in relation with turnover trends. Are we looking to
better manage growth and trying to prepare the company’s future by understanding its fundamentals?
Controllers’ activities depend on the operating environment. We always request more than an
explanation from the controller within a context of decreasing margin and turnover.
To a smaller extent, reporting and coordination with operations appears to only concern companies
which show an increasing activity. We also understand the importance of reforecasting within a
difficult economic context to anticipate the results and correct management decisions.

© IOMC 2014 - Any total or partial reuse of the document
contents requires the citation of the source 14
“Our reporting is produced by our Consolidation Team. This allows us to only spend 10 to 15% of our time in Reporting and concentrate on increasing our performance in the company”
Caroline BLAISE, Group Controlling Director, Addisseo
These facts lead us to think that in addition to the main activities, controllers in periods of growth are
able to spend more time on coordination, internal control and information system. However, in
situations of decreasing turnover and margin, controllers prioritize reporting and forecasting to
support management business reviews.
Controllers activities against company status (listed or not)
Time spent on reporting is the same for all companies. But planning, budget, variance analysis
forecasting and business review are dominant.
These facts are explained by a legal mandatory reporting and financial communication.
Within listed companies, controllers spend less time on information system and internal control, often
assumed by dedicated services.
Within non listed companies, they work closer to the average panel. Only information system is more
important.
Time dedicated to coordination with operations is the same for all companies, increasing compared to
previous year.
80
100
120
140
Plans & budgets Forecasting Business review Information system Internal control
Activities and listed companies (2014)
all companies - index 100 listed companies non listed companies

© IOMC 2014 - Any total or partial reuse of the document
contents requires the citation of the source 15
A FUNCTION CLOSE TO TOP MANAGERS
One aim of the analysis is to observe which functions controller interacts.
First of all, the closest functions are general management, accounting and finance. Then come information system, commerce and production.
Interactions are less significant with logistics and marketing. Quality, security, environment, R&D and
legal department are far from controller’s scope.
Controller collaborates with all departments within finance and operations.
“The management controller must provide the board a representation of reality. Like a mirror, this representation of reality must be stable so that managers make it their own. In addition, he also have to check occasionally blind spots
where no one is looking" Edward PORTET, Head of Management Control, EURAZEO

© IOMC 2014 - Any total or partial reuse of the document
contents requires the citation of the source 16
4 PROCESSES
The analysis of processes highlights the evolution of how companies deal with their different forecast
processes (strategic and operational plans, budget, rolling forecast) using, amongst others, the
following criteria: frequency, allocated time, planning window, transparency, implication of the
operational staff. Moreover, it gives an analysis of the evolution of the indicators used by the
companies in their forecasting and reporting processes: income statement, working capital
requirement, cash-flow, HR, environmental and social...
There is a relative stability in 2014 regarding the use of strategic and operational plans with a relatively
high average utilization rate of 79%.
Nevertheless, this year’s edition confirms the increasing use of rolling forecasts which is much more
widespread in the United States (+20%) than in the European zone, with a higher frequency (monthly
rather than quarterly).
A striking point of this study is the observation of a certain commitment of the companies towards the
simplification of their forecast processes, through the reduction of indicators in their reporting for
example, showing a focus on enhanced performances.
Finally, there is a noteworthy inversion of trends compared to 2013 concerning the transparency of
processes with a better communication towards the operational teams, especially regarding strategic
and operational plan data.
79% OF THE COMPANIES ARE USING STRATEGIC AND OPERATIONAL PLANS
Concerning the use of Strategic and Operational plans, there is no major change, 81% of the companies
(88% in 2013) are producing a Strategic plan, of which 69% do it annually, and 78% are producing an
Operational Plan (84% in 2013) of which 90% annually.
79% of the companies are using
strategic and operational plans
Quick and steady increase of the use of rolling
forecasts (+19% compared to 2012)
Forecast processes are shortened and faster for all the companies
and more frequent in the USA compared to the European zone.
Over 60% of the companies are using Working Capital Requirement and
Cash-Flow indicators in their forecast processes (+20% compared to 2011)
The deletion of indicators in
the reporting has increased
from 3% to 41% in 2014

© IOMC 2014 - Any total or partial reuse of the document
contents requires the citation of the source 17
Strategic plans are used in the medium-term; in fact 60% of them cover a period of 3 to 5 years and
29% of less than 3 years. On the other hand, Operational Plans are used in the short-term, only 18% of
them covering a period of 3 to 5 years and 79% of less than 3 years. These plans are produced in
average in less than 3 months: 74% for the Strategic plans, 84% for the Operational Plans.
The budget becomes faster to produce: 73% of them in less than 3 months. We also notice that their
level of detail is decreasing. Additionally, 78% of them are integrated in long-term processes and the
decreasing number of monthly budgets (54%) is noteworthy.
QUICK AND STEADY INCREASE OF THE USE OF ROLLING FORECASTS
Since 2012, there is a steady increase of the
number of companies using a rolling forecast
(+19% compared to 2012).
This process is equally used by large companies
(Turnover>1 billion EUR) and small companies
(Turnover<250M EUR), even though small
companies are the most willing to use it when
they currently do not (67%). From a geographic
point of view, over 60% of the North American
companies use it against only 39% of the
European companies. From a business point of
view: banking and transportation sectors do not
use rolling forecasts as much as industrial and
services sectors
FORECAST PROCESSES ARE FASTER
For 64% of the respondents, the main quality
and added-value of a forecast is its capacity to
quickly generate alerts in order to implement a
corrective action plan.
The results of this 2014 study are finally rather
similar to those of the 2012 study. Compared to
2013, we notice a decrease of 17% of the
number of companies producing a monthly
reforecast, with a shift towards biannual
reforecasts (+14% compared to 2013)
From a geographic point of view, about 50 % of
North America companies are producing
A BUDGET PROCESS TAKES LESS THAN 3
MONTHS IN 73% OF THE CASES
0%
10%
20%
30%
40%
50%
No No butplanning to
Yes
Evolution of the use of rolling forecasts
2012 2013 2014
0%
10%
20%
30%
40%
50%
Monthly Quarterly Bi-annually
Forecasts frequency's evolution
2012 2013 2014
© IOMC 2014 - Any total or partial reuse of the document
contents requires the citation of the source 18
monthly reforecasts, while European companies rather reforecast on a quarterly (42%) or even
biannual frequency (29%).
In 70% of the cases, a forecast process takes no more than 2 weeks. The length of the process is not
related to the size of the company neither to its turnover’s evolution. Interestingly enough, North
American companies spend less time on a forecast (61% less than one week) than European companies
(only 38% less than one week).
"In fact, our system was over-detailed and we were losing the helicopter view"
Peter LLEWELLYN-DAVIES, CFO, Medigene
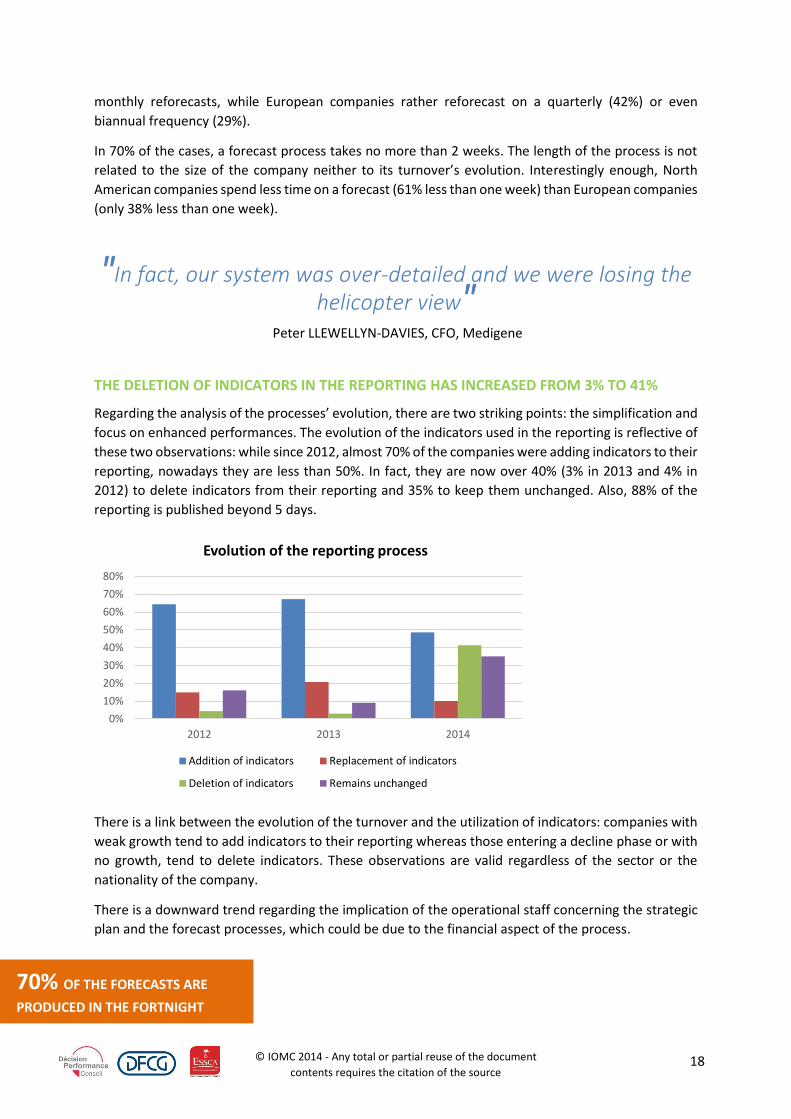
THE DELETION OF INDICATORS IN THE REPORTING HAS INCREASED FROM 3% TO 41%
Regarding the analysis of the processes’ evolution, there are two striking points: the simplification and
focus on enhanced performances. The evolution of the indicators used in the reporting is reflective of
these two observations: while since 2012, almost 70% of the companies were adding indicators to their
reporting, nowadays they are less than 50%. In fact, they are now over 40% (3% in 2013 and 4% in
2012) to delete indicators from their reporting and 35% to keep them unchanged. Also, 88% of the
reporting is published beyond 5 days.
There is a link between the evolution of the turnover and the utilization of indicators: companies with
weak growth tend to add indicators to their reporting whereas those entering a decline phase or with
no growth, tend to delete indicators. These observations are valid regardless of the sector or the
nationality of the company.
There is a downward trend regarding the implication of the operational staff concerning the strategic
plan and the forecast processes, which could be due to the financial aspect of the process.
0%
10%
20%
30%
40%
50%
60%
70%
80%
2012 2013 2014
Evolution of the reporting process
Addition of indicators Replacement of indicators
Deletion of indicators Remains unchanged
70% OF THE FORECASTS ARE
PRODUCED IN THE FORTNIGHT

© IOMC 2014 - Any total or partial reuse of the document
contents requires the citation of the source 19
In 2013, the trends as to the transparency were
downwards on the majority of the processes. In
2014 however, a better communication is
observed and reflected by the fact that 65% of
the respondents consider to have a clear
visibility of the Strategic plan and 70% on the
Operational Plan. The average perceived
transparency rate of forecast processes shows
at 70% (+5%).
The budget continues to be the most
transparent process for over 75% of the
companies compared to the forecast processes
(75% for the Operational Plan and 65% for the
Strategic plan).
The transparency gap between the operational plan and the budget, developed in the 2013 study, had
been associated to a decreasing implication of the operational staff in the monitoring of the company
performance. However, in this 2014 study, the decrease of this gap noticed illustrates a commitment
of the companies to better raise awareness among each operational team. The average operational
staff’s implication rate is at 83% (-6%).
OVER 60% OF THE COMPANIES ARE USING WCR AND CASH-FLOW INDICATORS
In 2014, the trends are stable: 91% of the companies are using the income statements (IS) for their
budget (90% in 2013). There is a really slight decrease of the use of WCR and CF indicators going down
from 68% in 2013 to 62%. This decrease is to be regarded compared to the overall increase of 14%
since 2011 (48%). The Strategic plan and Operational Plan show similar trends.
Regarding the frequency of publication of these indicators, 76% of the IS are monthly whereas 54% of
the CF and 34% of the WCR are published annually.
There is no relevant difference in the use of indicators between the reporting and the forecast. The
financial, operational and HR indicators remain the most used, in majority on a monthly basis. Strategic
and market indicators are less used, and at different frequencies. Sustainable development and social
indicators remain the less used indicators, with an annual frequency.
“Risk assessment is a key component of these planning exercises. External factors (environmental rules, political
stability, social regulations) are assessed and factored in the plans”
Lolot Manigsaca, Finance Director, Greenstone Resources Corporation – Phillipines
65%
70%
75%
80%
85%
90%
95%
100%
2011 2012 2013 2014
Evolution of the implication of the operational staff
Strategic Plan Operational Plan
Budget Forecast

© IOMC 2014 - Any total or partial reuse of the document
contents requires the citation of the source 20
5 METHODOLOGIES
Our usual dashboards, analytical methodologies or classical reporting principles, taking into consideration mainly financial or cost elements, are no longer adapted to the needs of our companies today. Companies need to be able to react quicker to competitors, keep a global and strategic vision and focus on efficient decision making tools. We offer a definition of the different types of methodologies used and an analysis of their usage in function of the sector, size and growth of the company. We observed that most companies increasingly use these methodologies, while Benchmarking remains the most frequently used by our respondents. Companies performing at a weak growth rate seem to have a preference for the methodologies Beyond Budgeting and Zero Based Budgeting (ZBB). In times of crisis and economic downturn, these methodologies effectively allow to forget the past and focus on value creating items.
INCREASING USAGE OF OUR OBSERVED METHODOLOGIES: FROM 68% IN 2013 TO 75% IN
2014.
2014 confirms the increasing usage of our observed methodologies. 75% in 2014 compared to 68% in 2013. Benchmarking remains the most utilized methodology, at a rate of 72%, in constant progress since 2011. The methodologies Balanced Scorecard (BSC) and Activity Based Costing / Activity Based Management (ABC/ABM) are at a comparable level: 33 and 35 %. The methodology Zero Base Budgeting (ZBB) is considered to be the most utilized methodology in times of economic crisis, and remains a stable usage level of 25% since 2012. However, Beyond Budgeting loses 5 points of usage compared to 2013 and now shows its lowest level at 9% of utilization.
Increasing usage of our observed methodologies :
from 68% in 2013 to 75% in 2014
Benchmarking remains the most
utilized and popular methodology
Zero Based Budgeting (ZBB) is greatly solicited by
companies without growth or in decline.
0%
10%
20%
30%
40%
50%
60%
70%
80%
Benchmarking BSC ABC / ABM Beyondbudgeting
ZBB
Utilisation trend of methodologies
2012 2013 2014

© IOMC 2014 - Any total or partial reuse of the document
contents requires the citation of the source 21
There is a certain level of homogeneity in the use of the different methodologies in function of the turnover level. Benchmarking is used by 40% of our respondents, regardless of the size of the company. The same applies to the methodologies BSC or ABC/ABM which average a 20% utilization rate. We observe however a slight disparity for Beyond Budgeting, which is the less utilized method by our respondents. Mainly the smaller companies of less than 50 million USD turnover seem to capitalize most on this methodology. Some differences are to be reported depending on the economic situation of the company. Growing companies have a clear preference for the methodologies Benchmarking, BSC and ABC/ABM. The methodologies Beyond Budgeting and ZBB are used more frequently by companies with a stagnating or declining evolution.
With regards to geographic utilization levels, the results remain quite comparable. It should be noted that the preferred methodology in Asia is Benchmarking, rated at 52%. The same applies to the Middle East (Other countries) for the utilization level of Benchmarking, and this region also has an important preference for ABC/ABM at a 50% usage level. The methodology Beyond Budgeting remains at a low utilization level. Europe and the USA are at a comparable level with regards to the utilization of the different methodologies.
BENCHMARKING REMAINS THE MOST UTILIZED AND POPULAR METHODOLOGY
Benchmarking is a method which consists of a relative measure of performance by comparison with a group of actors of the same economic sector (external benchmark) or with a functional or operational division that is either identical or similar (internal benchmark).
0%
10%
20%
30%
40%
50%
60%
Geographic utilization levels
Asia Europe USA Other countries
0%5%
10%15%20%25%30%35%40%45%
Utilization of the methodologies following the company's growth
pattern
Strong decline (<-10%) Decline
Zero growth Weak growth (<+10%)
Strong growth (>+10%)

© IOMC 2014 - Any total or partial reuse of the document
contents requires the citation of the source 22
It allows a company to compare itself to the “leaders” of the market, to build on their ideas, practices, operations and experience in such a way that the internal practices are improving.
“We are the apostles of benchmarking: we compare all stores per region, while correcting for seasonal or market
fluctuations” François Surbled, CFO of Jeff De Bruges
The use of benchmarking in general
(external, internal or mixed) is steadily
increasing: 53% in 2011, 66% in 2012, 66%
in 2013 and 72% in 2014. The utilization
rate remains high in all areas of activity
between 50 and 80%
Disparities in use by industry have increased. The difference between the minimum and maximum utilization rate is 40 points (90% Media-Telecom / Energy & Water 50%) while it was only 21 points in 2013 (Energy &Water 50% / Industry 71%)
The use of benchmarking remains mainly mixed, meaning a combination between internal and external benchmarking.
Internal benchmarking is clearly leading and showing a strong growth: 52% in 2014 against 44% in 2013. It is particularly used during the budget process (61%) and reporting (57%). Conversely, external benchmarking is widely used in the process of strategic plan or operational planning.
THE BALANCED SCORECARD (BSC)
The BSC method: “I do not use it in an orthodox manner: it is mainly a way to "demystify" the monthly financial
information” David Soulat, CFO of ORECA
The BSC methodology allows to measure the operational efficiency of the company in terms of its strategic goals set in 4 areas: Finance, Customer, internal processes, organizational learning. It is also
39% 47%61% 61% 57%
35%29%
21% 22% 24%
25% 24% 18% 17% 19%
0%
20%
40%
60%
80%
100%
StrategicPlan
OperationalPlan
Budget Forecast Reporting
Benchmarking type per process
Internal Benchmarking External BenchmarkingMixed Benchmarking

© IOMC 2014 - Any total or partial reuse of the document
contents requires the citation of the source 23
a control instrument. It is a suitable tool to improve change management within companies through the introduction of “physical indicators, indicators not produced by the company, environmental indicators or transverse indicators”. The utilization of the BSC methodology has increased compared to 2013 (+5 points), in the majority of the observed sectors. Its use appears to be predominant in the construction sector (40%). It decreases in the industry sector from 41% in 2013 to 32% in 2014.
The users of BSC in 2014 mostly opted for a simple version of the method with a limited number of indicators (1 through 5) (67% in 2014 against 57% in 2013). Users of over 20 indicators are rare (less than 5%). We see that the greatest number of indicators is used on the Finance axis.
“The indicators of our Balanced Scorecard are the outcome of our ISO certification process, led by the executive committee:
they cover a much wider scope than the financial performance"
Matthieu Givelet, CFO of Ensto Novexia
ACTIVITY BASED COSTING / ACTIVITY BASED MANAGEMENT (ABC/ABM)
The ABC/ABM method is a performance management methodology to understand the cost structure and the causes of their variations. It aims to improve the principle of cost allocation, in order to improve the definition and calculation of the cost of final products and services. A conventional analytical approach considers that a product or service is made up of components; in a systemic approach of the ABC method, the product or service is considered as the result of a process (aggregation of activities). The needs in terms of analysis and responsiveness, and therefore real time reporting, become strategic. This is why the new management methods, mainly the ABC/ABM method (Activity Based Costing/Activity Based Management), are fully adapted to those new approaches and as such allow an analysis of 4 components: process, cost control, identification of malfunctions, improvement of the overall efficiency. The ABC/ABM methodology loses 3 points and moves from 36% in 2013 to 33% in 2014. Howevern this method shows progress in the industry sector (+ 4 points), construction sector (9 points) and other services (22 points).
“We have developed an ABC model on the costs of our information systems. It is used for the rebilling of these costs to
user’s departments" Jean Sanlaville – FP&A Director - Air France – KLM

© IOMC 2014 - Any total or partial reuse of the document
contents requires the citation of the source 24
BEYOND BUDGETING = DELETE YOUR BUDGET!!
Since several years, the concept of a budget is quite widely criticized. Some view it as a brake on innovation, other consider it to be an uncorrelated tool or contrary to the company’s strategy... This concept of a budget has not completely disappeared though. Rather, it was reformulated "Beyond Budgeting - Beyond the Budget"! The resources that were initially allocated exclusively to the latter, were redistributed to the development of performance measurement tools and new dashboards: Balanced Scorecard, steering indicators based on management variables, "related" indicators (benchmark with the competition), strategic scoring of investments within a portfolio...
This complex method does not seem to find its followers. Its utilization rate continues to decline (- 5 points) and moves to 9% in total.
ZERO BASED BUDGETING (ZBB)
The procedure of the "Zero Based Budgeting" methodology is based on the principle that nothing is ever acquired. The renewal of a budget from one year to another is excluded in principle. Each expense must be justified. We cut out the different functions in decision-making units, each headed by a manager who should establish its own budget proposals, taking their forecasts into account. The projects can be alternative (choose in this case a project among several) or complementary (different projects that can all be put in place). The use of this method remains broadly stable at around 25%. Its evolution is very heterogeneous in terms of business sectors. It is a preferred methodology in
sectors that experience temporary difficulties. This methodology allows questioning the assumptions
of budget calculation that were previously chosen, and works on new bases that should improve the
value creation of each approached project.
The utilization of the ZBB methodology as a recurring method is clearly confirmed this year. In 2014, 56% of our respondents claim to use it, against only 28% in 2013.
The application scope of the method globally spreads to the overall business of the company (48%),
or specifically to a particular activity (40%). A small proportion of users of ZBB only apply it to the
corporate headquarters (12%).

© IOMC 2014 - Any total or partial reuse of the document
contents requires the citation of the source 25
6 MANAGEMENT INFORMATION SYSTEM
Management Information Systems play a key role in companies’ decision-making processes. Facing the
challenges of globalization, new technologies, more competitive business environments, Finance
Directors and Controllers need to be able to count on reliable predictive indicators and data, within
shorter terms.
Management information systems represent a real opportunity for value creation, to optimize
processes and organizations. Market players and new digital technologies provide companies with
more powerful, flexible and complexe solutions.
Today, in a sluggish economy, investments in this area are scarce. The Group and the operational
players fall back on more flexible and less expensive tools for simple activities; ERP is then preferred
for other more complex activities.
After automation of the main treatments, they manage with the tools available to them and, in 50%
of the cases, do not plan to change within the next two years.
EXCEL REMAINS THE MAIN TOOL FOR 56% OF THE RESPONDENTS
The distribution of the use of MIS tools doesn’t significantly move in 2014. Excel remains widely used by CFOs and Controllers, and even shows a slight progress.
“Finding a way to recover the data to aggregate and analyze in a spreadsheet has become an old habit around the
company” Philippe Saramito, CFO of HEXAGON, Swedish group of industrial metrology
Excel remains the main tool for 56% of
the respondents
The Corporate Headquarter chooses the MIS in
69% of the companies
Only 1 out of 2 companies has
MIS projects scheduled
48% of the respondents are unsatisfied
with their MIS (+4 points since 2013)

© IOMC 2014 - Any total or partial reuse of the document
contents requires the citation of the source 26
71% of the respondents used it for at least one of their activities; and 56% of the companies confirm
that they are using Excel in all activities. It seems that Excel remains THE tool for building plans, budgets
or forecasts. No geographic difference can be noted with regards of the usage of this tool
Although far behind Excel, ERP is second of the tools used by the management controllers and CFOs.
Businesses use ERP mainly for reporting, budgeting and forecasting.
THE CORPORATE HEADQUARTER CHOOSES THE MIS IN 69% OF THE COMPANIES
The choice of MIS remains the privilege of the group’s corporate headquarters, steady around 70% since 2012. North American countries are however more directive (92%) than European ones (66%), confirming a stronger corporate culture in these countries. Listed companies grant a higher importance to the
company’s choices in Information Systems.
DISSATISFACTION TOWARDS MIS IS INCREASING AND APPROACHES 50%
Beyond the economic environment which could have an influence on
MIS quality, companies are rather satisfied with the efficiency of their
tools, their investigation capabilities and their upstream
interconnections with other systems. One company out of 2 has automated at least 75% of the data
integration.
The past year’s trend has acknowledged a slight breakage, despite a strong improvement of North
American companies (75%) counterbalanced by a strong dissatisfaction in Asia (68%), especially in
Japan.
0% 20% 40% 60%
Excel
ERP
Consolidation tool
Budgeting tool
Multi-dimensional program
Integrated dashboard tool
Evolution of the tools' use
2014 2013
Corporate Headquarters 69%
Each entity 32%
0% 20% 40% 60% 80%
2014
Choice of MIS
48% of the respondents are unsatisfied
with their MIS (+4 points since 2013) .
© IOMC 2014 - Any total or partial reuse of the document
contents requires the citation of the source 27
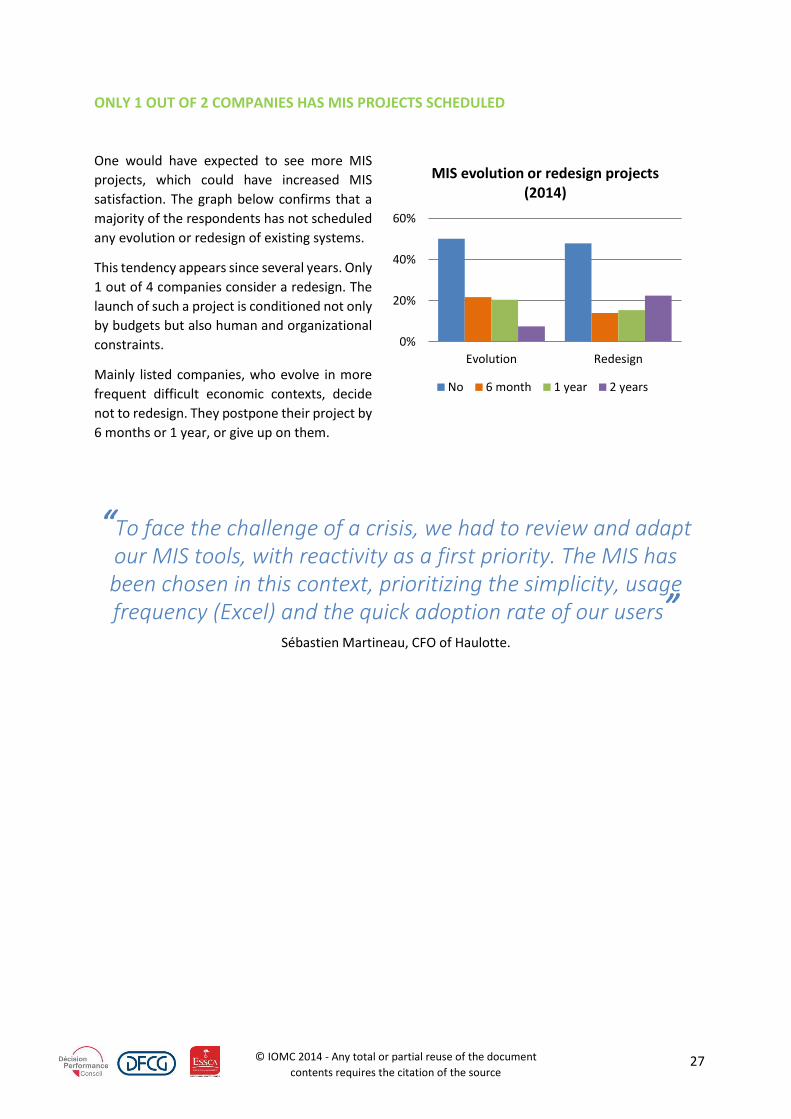
ONLY 1 OUT OF 2 COMPANIES HAS MIS PROJECTS SCHEDULED
One would have expected to see more MIS
projects, which could have increased MIS
satisfaction. The graph below confirms that a
majority of the respondents has not scheduled
any evolution or redesign of existing systems.
This tendency appears since several years. Only
1 out of 4 companies consider a redesign. The
launch of such a project is conditioned not only
by budgets but also human and organizational
constraints.
Mainly listed companies, who evolve in more
frequent difficult economic contexts, decide
not to redesign. They postpone their project by
6 months or 1 year, or give up on them.
“To face the challenge of a crisis, we had to review and adapt our MIS tools, with reactivity as a first priority. The MIS has been chosen in this context, prioritizing the simplicity, usage frequency (Excel) and the quick adoption rate of our users”
Sébastien Martineau, CFO of Haulotte.
0%
20%
40%
60%
Evolution Redesign
MIS evolution or redesign projects (2014)
No 6 month 1 year 2 years

© IOMC 2014 - Any total or partial reuse of the document
contents requires the citation of the source 28
7 EFFICIENCY
This year we found relevant to reduce to six the number of axes meant to assess the level of financial
organizations’ efficiency: agility/adaptability, innovation/strategic vision, transparency/participation.
- Agility: make the relevant information available in a timely manner. Looking at the duration of
the process, the frequency and the nature of the forecasting cycle, the reporting timelines and
the flexibility of the current information systems should allow us to measure the level of agility
of any organization.
- Adaptability: referring to controlling practices which, while limiting internal constraints, could
lead to optimal efficacy using appropriate tools. This is measured through the implementation
of a system of key performance indicators, the presence of an integrated management
controlling system and of a certain level of autonomy in the day-to-day management of
controlling tools.
- Innovation: challenging the status quo of existing controlling practices and tools. The level of
innovation is assessed by looking at the implementation of new methodologies (e.g. Zero
Based Budgeting) and the constant evaluation of existing and future information systems.
- Strategic vision: going beyond the budgeting exercise and proactively anticipating
safeguarding of the company’s future. This is measured through the level of intensity and the
frequency of the forecasting and strategic planning processes along with the nature of the
selected indicators.
- Transparency: guaranteeing a broader access to financial information within the company to
share more efficiently what is at stake. Ensuring increased visibility on both budgets and pairs’
forecasting assumptions is a key component when following that goal. The interaction of the
controlling function with other functional departments of the company is also creating more
transparency.
- Participation: walking away from centralized and hierarchical practices to include all
stakeholders contributing to the company’s performance. The strength of the participative
model is determined by the level of inclusion of operational teams in the forecasting process
as well as their involvement in the planning cycle.
These 6 axes are regrouped in 3 sub-groups allowing us to analyze controlling practices while
defining their efficiency profiles.
Innovation is back and strategic vision is
strengthening
Asia remains the geography of best
practices
Consumer goods represent the most
efficient industry sector.

© IOMC 2014 - Any total or partial reuse of the document
contents requires the citation of the source 29
2014 VERSUS 2013: INNOVATION IS BACK AND STRATEGIC VISION IS STRENGTHENING
Both strategic vision and innovation profiles are significantly growing compared to the 2013 inquiry
(respectively +30.7 % and +22.8 % vs. 2013). However, these two axes are still scoring below the other
ones (1.18 for Strategic Vision and 1.05 for Innovation vs. 1.29 on average in 2014). Controlling
practices remain as agile and participative but don’t evolve significantly. The adaptability criteria is the
only one showing a significant year-on-year
decrease (-11.8% vs.2013).
Compared to last year, efficiency profiles are
very similar across companies regardless of
their respective economic situation or their
equity structure (listed/non listed).
Nevertheless, in 2014 the efficiency profile of
middle-sized companies did strongly
converge with those of big companies. Could
this mean that middle-sized companies
assimilate big companies’ methods and tools
in order to drive change and growth?
EFFICIENCY PROFILES PER GEOGRAPHY
The most efficient practices are different across geographies/continents. Europe seems to lag behind
on the majority of the axes except on adaptability. Conversely, Asia is taking the lead on most of them.
The only weakness of Asia is innovation.
Asian companies are relatively more agile than others. The main drivers are shorter reporting
deadlines, more systematic use of ISR indicators and the willingness to deploy shared service centers
more systematically.
Also, their practices are more transparent because the controlling function is interacting with more
supporting functions (especially Legal) and is using more intensively benchmarking methodologies.
Finally, Asian companies are more participative as the operational teams are much more included in
the strategic planning process than in other
geographies.
Focusing on Europe and more particularly on
France and Germany, we notice that
efficiency profiles are very similar to each
other with the exception of the Innovation
criteria. In fact, German controllers are
working with more advanced tools than their
French counterparts. ERP systems are more
intensively used to develop budgets and
plans (more than 50% of the German
companies are equipped with advanced
budgeting tools vs. around 30% in France).
-
0,50
1,00
1,50
2,00Agility
Adaptability
Innovation
Strategic vision
Transparency
Participation
USA
Asia
EU
-
0,50
1,00
1,50
2,00Agility
Adaptability
Innovation
Strategic vision
Transparency
Participation
2013
2014

© IOMC 2014 - Any total or partial reuse of the document
contents requires the citation of the source 30
EFFICIENCY OF CONTROLLING PRACTICES PER INDUSTRY SECTOR
Two industry sectors have been chosen to highlight the extreme at both ends of the controlling
practices: Consumer goods for having the higher efficiency rating and Building & Engineering for
scoring at the lowest end. The average representing all industry sectors’ contribution is also shown on
the graph below.
The most significant differences appear on the Transparency, the Innovation and the Strategic Vision
profiles.
On the Transparency axis, the high rating of Consumer goods companies is driven by their participative
approach of the strategic plan process.
On the Strategic vision axis, more than 85% of the Consumer goods companies are using key strategic
indicators in order to develop their reforecasting assumptions. In the Building & Engineering sector
this is true for only 50% of the respondents. Furthermore, the first mentioned sector is mobilizing a
much greater number of key indicators during the strategic planning process, contributing greatly to
the high score on this axis.
When looking at the Innovation axis,
the Energy & Utilities sector is at its
best. Through the intense
implementation and extensive use of
decision-making tools this industry
sector is in a leading position compared
to others.
Finally, on the three other axes, there
are only slight and almost inexistent
variations between industry sectors.
-
0,50
1,00
1,50
2,00Agility
Adaptability
Innovation
Strategic vision
Transparency
Participation
Consumer goods
Building & Engineering
All sectors average

© IOMC 2014 - Any total or partial reuse of the document
contents requires the citation of the source 31
8 TOWARDS A TYPOLOGY OF CONTROLLING PRACTICES
As every year, we led a typological analysis on the surveyed population. This analysis allowed us to
highlight four typical organization profiles according to the characteristics of the companies we got in
touch with, the activities of finance – control function or the processes, methodologies and
management systems that are used.
We should note that the 2014 typology is close to previous classifications. Like in 2012 and 2013, the
differences do not come from the economic or financial health of the firm, its size, its nationality and
its international opening. They concern the practices such as the degree of control of the structure,
the level of managers’ involvement and the place of the finance – control function in the organization
and the propensity of the companies to use new tools. This year, four profiles are clearly identified:
“the Controlled firms” (28%), “the Proactive firms” (24%), “the Agile firms” (25%), “the Regulated
firms” (23%).
To be performant, companies are used to acting
on three key factors: organizational flexibility,
staff’s involvement in management process and
strategic vision.
Companies giving priority to
flexibility seem to be more dynamic
Companies tend to have the same practices all over the world:
they strengthen their controlling activities; they try hard to
structure their organization; they adopt transverse tools and
facilitate staff’s mobilization in management process.
© IOMC 2014 - Any total or partial reuse of the document
contents requires the citation of the source 32
CLASS 1 – “THE CONTROLLED FIRMS” (28%)
Main profile: medium-size and domestic companies …
Class 1 is mainly represented by small and medium-size firms that employ between 0 and 999 people and whose turn-over is lower than €249 million. Specialized in manufacturing equipment, media, telecom and IT, these organizations that are located in France or in the USA, are slightly growing even
if their turn-over abroad is weak.
Attributes of the finance function: priority to controlling activities…
It is in the class 1 that the finance department by focusing on reporting is the least involved in forecasts
and forecasts updates. In the future, the companies that belong to this family will give the priority to
internal control and risk management. The other activities in which our respondents are (or might soon
be) involved are calculation and updating of accruals in addition to cash forecasts. In this category
where control over operations is crucial (which characterizes the members of this class), with an
emphasis on cash reporting more than anywhere else, the finance function especially interacts with
top management and internal audit function.
Business practices of the class 1 may be considered as traditional and rather less “agile”: a strategic
plan whose frequency is generally greater than one year; a budget whose process time is three months
in average; forecast updates only twice a year; a very low managers’ mobilization in the strategic plan
but strong in operational plan and budget; a strong visibility on peers’ operational activity; a
predominance of financial indicators in the overall management process. The companies of this class
do use internal benchmarking, balanced scorecard and BBZ; as for the plan, budget, forecasts and
reporting, they mainly use the spreadsheet.
CLASS 2 – “THE PROACTIVE FIRMS” (24%)
Main profile: large and internationalized companies…
We find in class 2 very large firms (in comparison with the rest of the sample) with a turn-over topping
€5 billion and up to 25,000 employees. Less diversified than the other classes, this family is composed
of French or foreign entities specialized in industrial equipment and other services and that seem more
impacted by the economic crisis despite a stronger opening to the world.
Attributes of the finance function: priority to strategic planning…
This class 2 dedicates most of its time to budget. In the future, the companies that belong to this family
will give the priority to internal control and risk management which is not for the moment the main
activity. The other activities in which our respondents are involved in are HR reporting and
management control of project (in other terms innovation). In this category, in addition to top
management, the finance function especially interacts with sales management.
Business practices of the class 2 may be considered as proactive and forward-looking, which leads to
facilitate managers’ empowerment: an annual strategic plan; a budget whose process time is one year;
quarterly forecast updates; a medium managers’ involvement in the strategic planning but strong in
© IOMC 2014 - Any total or partial reuse of the document
contents requires the citation of the source 33
operational planning and very strong in budgeting; a strong visibility on peers’ strategic and
operational activity; a predominance of operational and financial indicators in the overall
management. The companies of this class do use internal and external benchmarking (sign of
openness) and balanced scorecard; as for the planning, budgeting, forecast updates and reporting,
they do not hesitate to use transverse and multidimensional tools.
CLASS 3 – “THE AGILE FIRMS” (25%)
Main profile: diverse companies, big and small and growing…
The class 3 is composed of medium-size to large-size companies whose revenue ranges from €50
million to less than €5 billion and staff between 100 and 24,999 employees. Specialized in industrial
equipment and consumer goods, these European firms, open or not very open to the world, are
growing.
Attributes of the finance function: flexibility and well-structured organization…
It is in the class 3 that the finance department, by focusing on reporting, is the least involved in
information systems (likely because information system managers, who are used to interacting with
finance function, have already implemented adapted tools leading to an automation of the tasks). In
the future, the companies that belong to this family will give the priority to internal control and risk
management (similar to class 1). The other activity in which our respondents are (or might soon be)
involved is calculation and updating of accruals. In this category where reactivity and agility
characterize the firms, the finance function especially interacts with top management (in addition to
the information system managers).
In the class 3, firms are “agile”: a strategic plan whose frequency is annual; a budget whose process
time is one month; forecast updates every month and that require one week; a strong mobilization of
managers in operational plan, budget and forecast updates; a strong visibility on peers’ strategic and
operational activity; many different types of indicators (financial, operational, HR). The companies of
this class do use both internal and external benchmarking and balanced scorecard; as for the planning,
budgeting, forecast updates and reporting, they use transverse and multidimensional tools.
CLASS 4 – “THE REGULATED FIRMS” (23%)
Main profile: large companies, diversified and successful…
The class 4 is composed of medium-size to large-size companies whose revenue ranges from €250
million to more than €5 billion and staff between 1,000 and more than 25,000 employees. Specialized
in industrial equipment, media, telecom, IT and other services, these firms, among which most come
from Asia, more or less open to the world and are showing a slight or a strong increase in business.
Attributes of the finance function: regulation and rules…
© IOMC 2014 - Any total or partial reuse of the document
contents requires the citation of the source 34
It is in the class 4 that the finance department, by focusing on planning and budgeting, is the least
involved in managers’ mobilization (likely because managers are already educated on management
process or are used to following strict procedures). In the future, the companies that belong to this
family will give the priority to planning and budgeting. The other activity in which our respondents are
(or might soon be) involved is management’s control of projects. In this category where rules and
procedures are essential, the financial function especially interacts with the internal audit function and
legal services.
In the class 4, firms are “transparent” (which likely damages reactivity): a strategic plan whose
frequency is annual or less frequent; a budget whose process time is one month; forecast updates
every quarter and that require several weeks; a strong mobilization of the managers in strategic and
operational plan, budget and forecast updates; a strong visibility in particular on peers’ strategic
activity; many different types of indicators. The companies of this class do use both internal and
external benchmarking; as for the plan, budget, forecast updates and reporting, they use the
spreadsheet.
FOCUS ON SIMILAR AND DIVERGING ELEMENTS
The 2014 typology shows common characteristics and diverging elements within the sample:
All the firms experienced different consequences to the economic downturn even if the gaps
tend to be reduced: while the firms from class 1, 3 and 4 (“the Controlled firms”, “the Agile
firms”, “the Regulated firms”) seem to resist (small to high revenue increase), big firms from
class 2 (“the Proactive firms”) tend to suffer more from the crisis. Indeed the latter cannot
profit from an increase in international operations. Here is something we had already pointed
out in 2012 and 2013: size and export activities are not necessarily synonymous of success.
If our cluster analysis does not allow to know if the nationality or the business sector, for
example, are factors of performance, let us precise that the most dynamic firms of the sample
are those whose approach is more proactive (frequency and time dedicated to forecast
updates, process time of budget). Furthermore, according to the class, managers’ involvement
in forecast updates is not the same: weak or medium in class 1 and class 2 (“the Controlled
firms” and “the Proactive firms”), this mobilization is strong in class 3 and in class 4 (“the Agile
firms” and “the Regulated firms”).
In addition to top management, the functions with which the finance function interacts most
vary according to the classes: internal audit function in class 1 and in class 4; sales management
in class 2; information systems management in class 3; legal services in class 4.
In terms of activities, all the firms do not have the same priorities: if some choose to attribute
importance to reporting (class 1 and class 3), others keep their focus on planning and
budgeting (class 2 and class 4). All the companies do not use the same indicators or the same
management tools: some use transverse and multidimensional tools for planning, budgeting,
forecasting updates and reporting when others use the spreadsheet.

© IOMC 2014 - Any total or partial reuse of the document
contents requires the citation of the source 35
As the previous years, the 2014 typology highlights families much more homogeneous and
discriminatory. Nevertheless, it is interesting to note similar elements regardless of the class, the firm
or the geographical area we are studying:
Overall, the activities in which the finance function-control devotes most of its time are similar
to four classes (plans and budgets and internal reporting). The first three families are also
heavily involved in internal control and risk management. Uncertainty in the markets likely
leads companies to implement or to strengthen their monitoring system and risk coverage.
Managers’ involvement in management process (planning, budgeting) is rather homogeneous
according the classes identified: if the managers’ mobilization in strategic and operational plan
remains medium or weak in most companies, it is medium to strong in budgeting. Visibility on
peers’ activity is strong in all the families.
Whatever the class, companies tend to use the same tools (benchmarking, balanced
scorecard) which confirm the phenomenon we have already observed during the previous
studies: a homogenization in the management practices.

© IOMC 2014 - Any total or partial reuse of the document
contents requires the citation of the source 36
Class #1 (28%)
"The CONTROLLED firms"
Class #2 (24%)
"The PROACTIVE firms"
Class #3 (25%)
"The AGILE firms"
Class #4 (23%)
"The REGULATED firms"
TurnoverFrom 0 to 249 million €
From small to medium-size companies
More than 5 billion €
Big firms
From 50 million € to less than 5 billion €
From medium-size companies to big firms
From 250 million € to more than 5 billion €
From medium-size companies to big firms
Turnover evolution Weak growth From weak decrease* to weak growth From weak growth to strong growth* From weak growth to strong growth
Staff From 0 to 999 employees From 5,000 to more than 25,000 employees From 100 to less than 24,999 employees From 1,000 to more than 25,000 employees
Activity sector
Industrial equipment
Media, telecom and IT
Other services
Industrial equipment
Other services
Industrial equipment*
Consumer goods
Industrial equipment
Media, telecom and IT*
Other services
Geographical areaFrance
United States
France*
United States*Europe Asia*
Turnover
evolution abroad (turn-over
achieved abroad)
Weak*
From 0% to 10%
Strong*
From 21% to 80%
From weak to rather strong
From 0% to 80%
From weak to rather strong
From 0% to 80%
Companies' profile
Class #1 (28%)
"The CONTROLLED firms"
Class #2 (24%)
"The PROACTIVE firms"
Class #3 (25%)
"The AGILE firms"
Class #4 (23%)
"The REGULATED firms"
Activities to which management
control function devotes most
time
Reporting (+)
Forecasts and forecast updates (-)
Information system (-)
Plan and budget (+)
Internal control and risk management (-)
Reporting (+)
Information system (-)
Plan and budget (+)
Managers' mobilization (-)
Future activitiesInternal control and risk management (+)
Information system (-)
Internal control and risk management (+)
Information system (-)
Internal control and risk management (+)
Information system (-)
Plan and budget (+)
Forecasts and forecast updates (-)
Information system (-)
Other activities in which
management control function is
or will be heavily involved
Calculation and updating of accruals
Cash forecasts
HR reporting
Management of control of projectCalculation and updating of accruals Management of control of project
Functions with which finance
function interacts
Top management
Internal audit function - internal control function
Top management
Sales management
Top management
Information system management
Internal audit function - internal control function
Legal services
Activities of finance and management control function
Class #1 (28%)
"The CONTROLLED firms"
Class #2 (24%)
"The PROACTIVE firms"
Class #3 (25%)
"The AGILE firms"
Class #4 (23%)
"The REGULATED firms"
Strategic plan: frequency Annual and less frequent Annual Annual Annual and less frequent
Strategic plan: process time One month From one month to three months One month Three months
Operational plan: frequency Annual Annual Annual Annual
Operational plan: process time One month Two months From one to two months From two months to three months
Budget: process time From one month to three months One month One month One month
Budget: granularity Month Month MonthMonth
Year
Forecast updates: frequency Twice a year Every quarter Every month Every quarter
Time devoted to forecast
updates
Less than one week
From one to two weeksFrom one to two weeks Less than one week
Between one and two weeks
More than two weeks
Strategic plan: managers'
mobilizationNo mobilization Average Average From average to strong
Operational plan: managers'
mobilizationFrom average to strong Rather strong Rather strong Rather strong
Budget: managers' mobilization Strong Very strong Strong Very strong
Forecast updates: managers'
mobilizationWeak Average Strong Strong
Processes - methodologies and management systems (1)

© IOMC 2014 - Any total or partial reuse of the document
contents requires the citation of the source 37
Visibility on peers' activities
Strategic plan: strong
Operational plan: very strong
Budget: very strong
Forecast updates: very strong
Strategic plan: strong
Operational plan: strong
Budget: strong
Forecast updates: strong
Strategic plan: strong
Operational plan: strong
Budget: strong
Forecast updates: strong
Strategic plan: very strong
Operational plan: strong
Budget: strong
Forecast updates: strong
Indicators used
(reporting and forecast updates)Financial indicators
Financial indicators
Operational indicators
Financial indicators
Operational indicators
HR indicators
Strategic / market / competitiveness indicators
Financial indicators
Operational indicators
HR indicators
BenchmarkingInternal benchmarking
(budget and reporting)
Internal benchmarking (plan, budget, forecast updates, reporting)
and external benchmarking (plan)
Internal benchmarking (plan, budget, forecast updates,
reporting) and external benchmarking (plan)
Internal benchmarking (plan, budget, forecast updates,
reporting) and external benchmarking (plan)
Management tools more usedBSC and BBZ
In the future: ABC
BSC
In the future: ABC
BSC
In the future: ABCOther tools
Using of management tools
. Plan: spreadsheet
. Budget: spreadsheet
. Forecast updates: spreadsheet
. Reporting: spreadsheet and consolidation tool
. Plan: spreadsheet and consolidation tool
. Budget: spreadsheet, budgeting tool, consolidation tool
. Forecast updates: spreadsheet and budgeting tool
. Reporting : outil multidimensionnel et ERP
. Plan: spreadsheet and consolidation tool
. Budget: spreadsheet and ERP
. Forecast updates: spreadsheet and ERP
. Reporting: spreadsheet, consolidation tool and ERP
. Plan: spreadsheet
. Budget: spreadsheet
. Forecast updates: spreadsheet
. Reporting: spreadsheet
Main profile Agility - flexibility (-) Innovation - strategic vision Agility - flexibility (+) Transparency - participation (+)
Processes - methodologies and management systems (2)
(*) Means that the item especially characterizes the class