covid-19 financial response
TRANSCRIPT
COVID-19 Financial Response
Revenue Loss Calculator:
Step-By-Step Guide
Revenue Reduction Overview
2**Reproduced from U.S. Treasury Coronavirus State and Local Fiscal Recovery Funds: Interim Final Rule. The Interim Final Rule is available
here and still subject to change: https://www.govinfo.gov/content/pkg/FR-2021-05-17/pdf/2021-10283.pdf
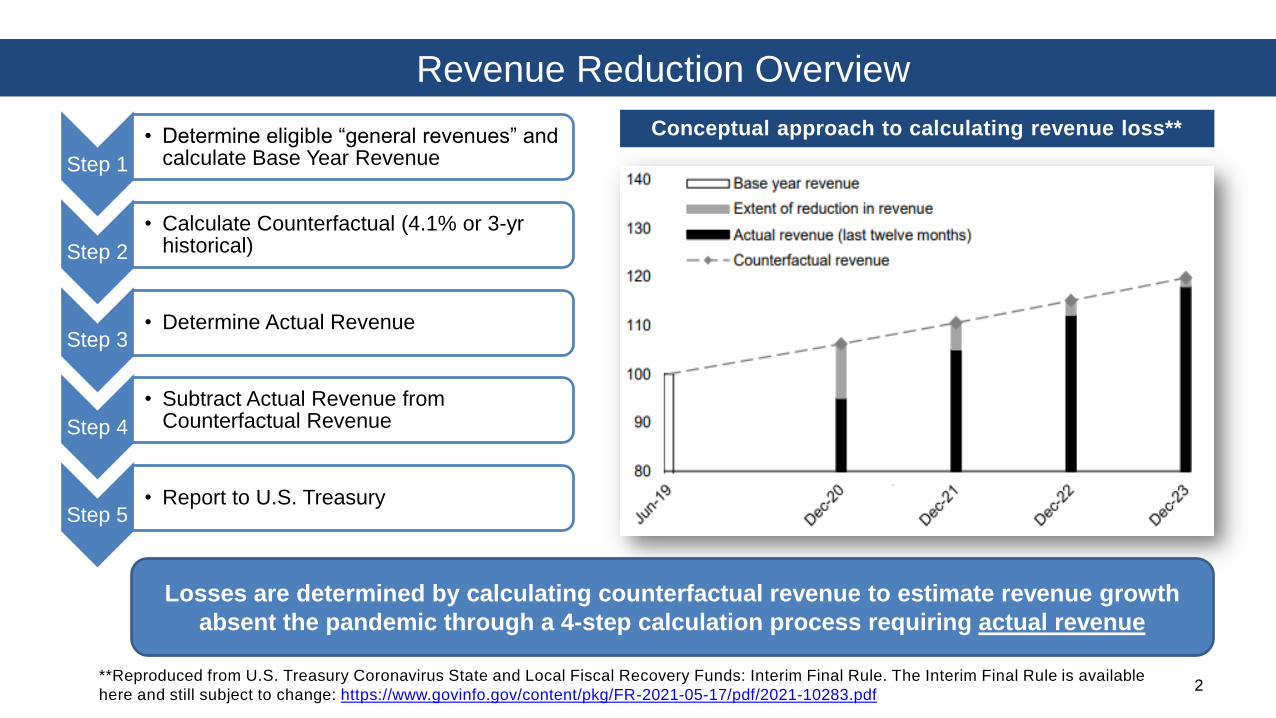
Conceptual approach to calculating revenue loss**
Step 1
• Determine eligible “general revenues” and calculate Base Year Revenue
Step 2
• Calculate Counterfactual (4.1% or 3-yr historical)
Step 3• Determine Actual Revenue
Step 4
• Subtract Actual Revenue from Counterfactual Revenue
Step 5• Report to U.S. Treasury
Losses are determined by calculating counterfactual revenue to estimate revenue growth
absent the pandemic through a 4-step calculation process requiring actual revenue
Revenue Reduction Calculation
3
Step 1
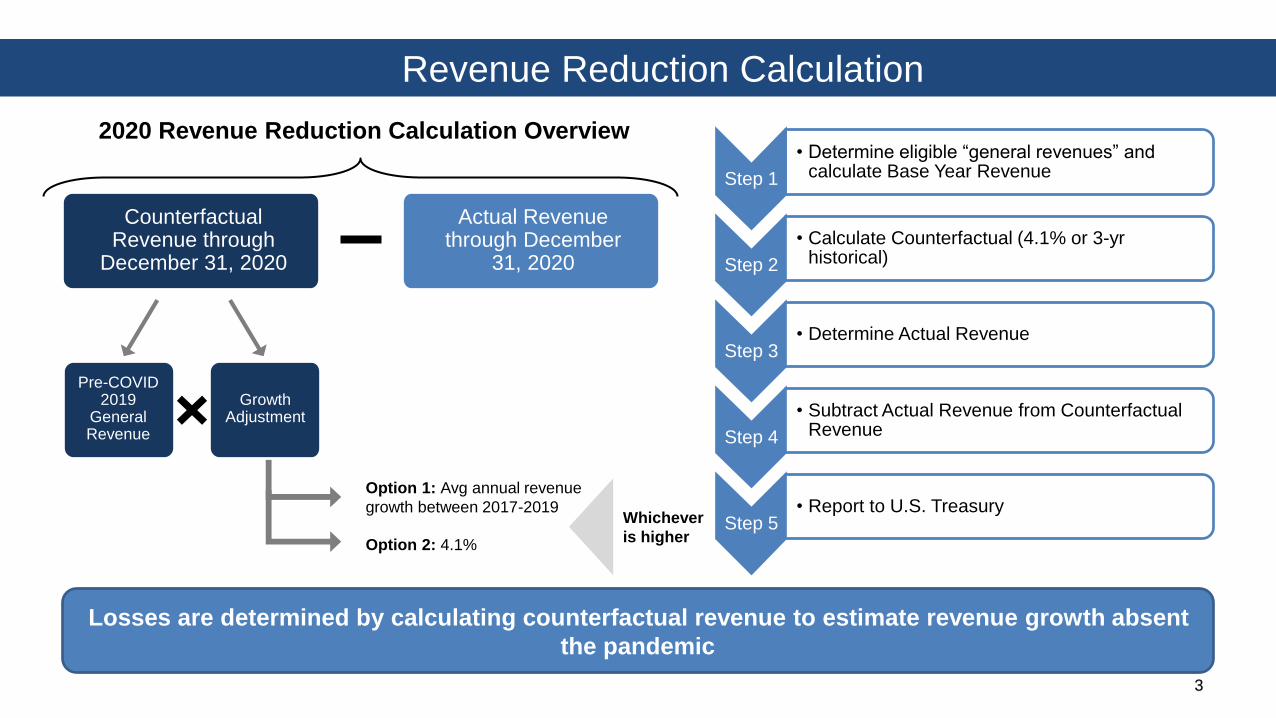
• Determine eligible “general revenues” and calculate Base Year Revenue
Step 2
• Calculate Counterfactual (4.1% or 3-yr historical)
Step 3• Determine Actual Revenue
Step 4
• Subtract Actual Revenue from Counterfactual Revenue
Step 5• Report to U.S. Treasury
Counterfactual Revenue through
December 31, 2020
Actual Revenue through December
31, 2020
2020 Revenue Reduction Calculation Overview
Option 1: Avg annual revenue
growth between 2017-2019
Option 2: 4.1%
Pre-COVID 2019
General Revenue
Growth Adjustment
Whichever
is higher
Losses are determined by calculating counterfactual revenue to estimate revenue growth absent
the pandemic
Revenue Loss Calculator
4
• Cook County is providing an Excel revenue loss
calculator as a resource for municipalities*
• Calculator allows municipalities to determine revenue loss
amounts, model forecasts, and visualize revenue
recovery scenarios through 2023
• Calculator only requires municipalities to input fiscal year
end date and eligible revenue data for 2016 – 2020
*This resource was developed by Cook County and is intended for planning purposes only. This tool is not an official Department of Treasury resource.
Final guidance from the Treasury Department is still pending and subject to change. US Treasury disallows the use of projections for revenue loss reporting.
4
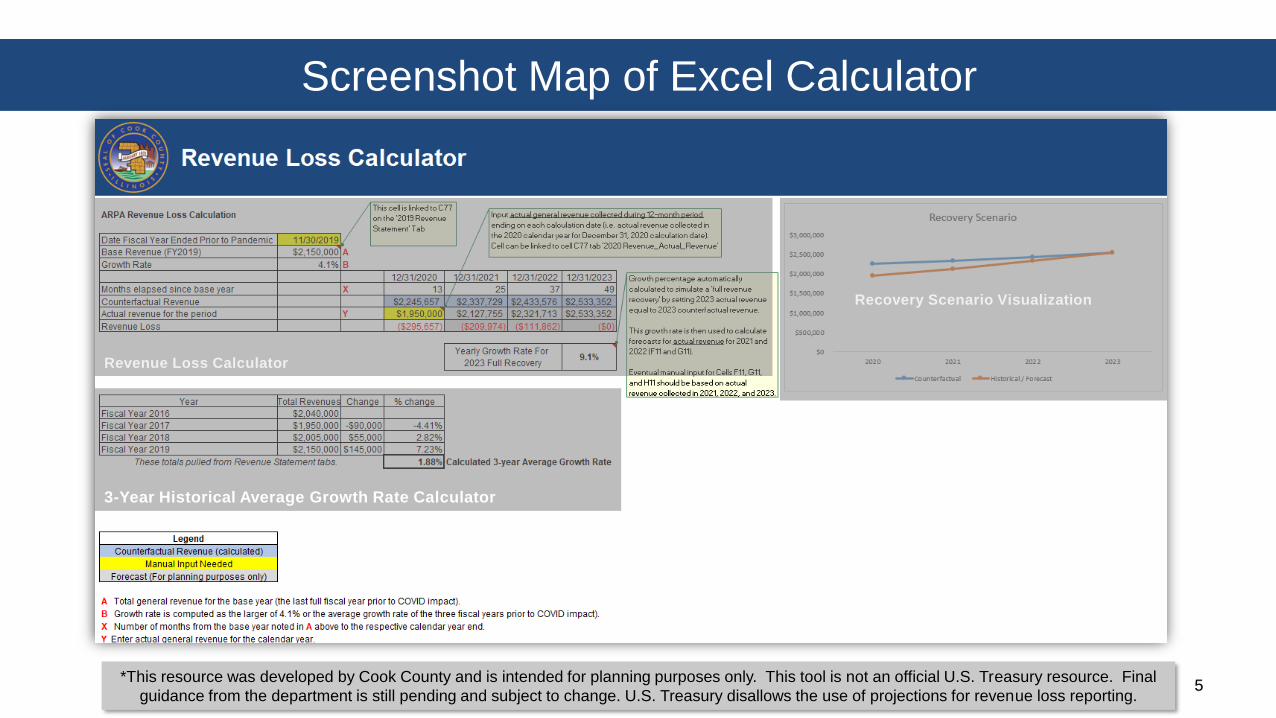
Screenshot Map of Excel Calculator
Recovery Scenario Visualization
Revenue Loss Calculator
3-Year Historical Average Growth Rate Calculator
Growth Rate Calculator
*This resource was developed by Cook County and is intended for planning purposes only. This tool is not an official U.S. Treasury resource. Final
guidance from the department is still pending and subject to change. U.S. Treasury disallows the use of projections for revenue loss reporting. 5
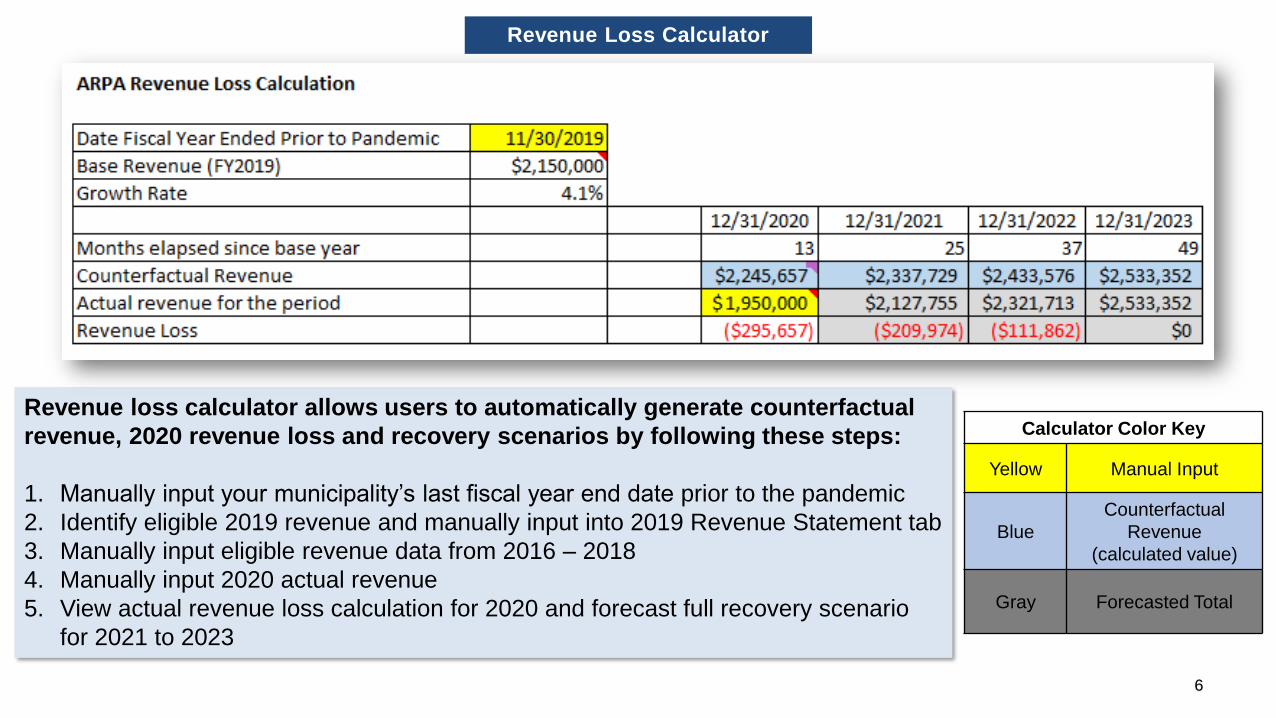
Revenue Loss Calculator
Revenue loss calculator allows users to automatically generate counterfactual
revenue, 2020 revenue loss and recovery scenarios by following these steps:
1. Manually input your municipality’s last fiscal year end date prior to the pandemic
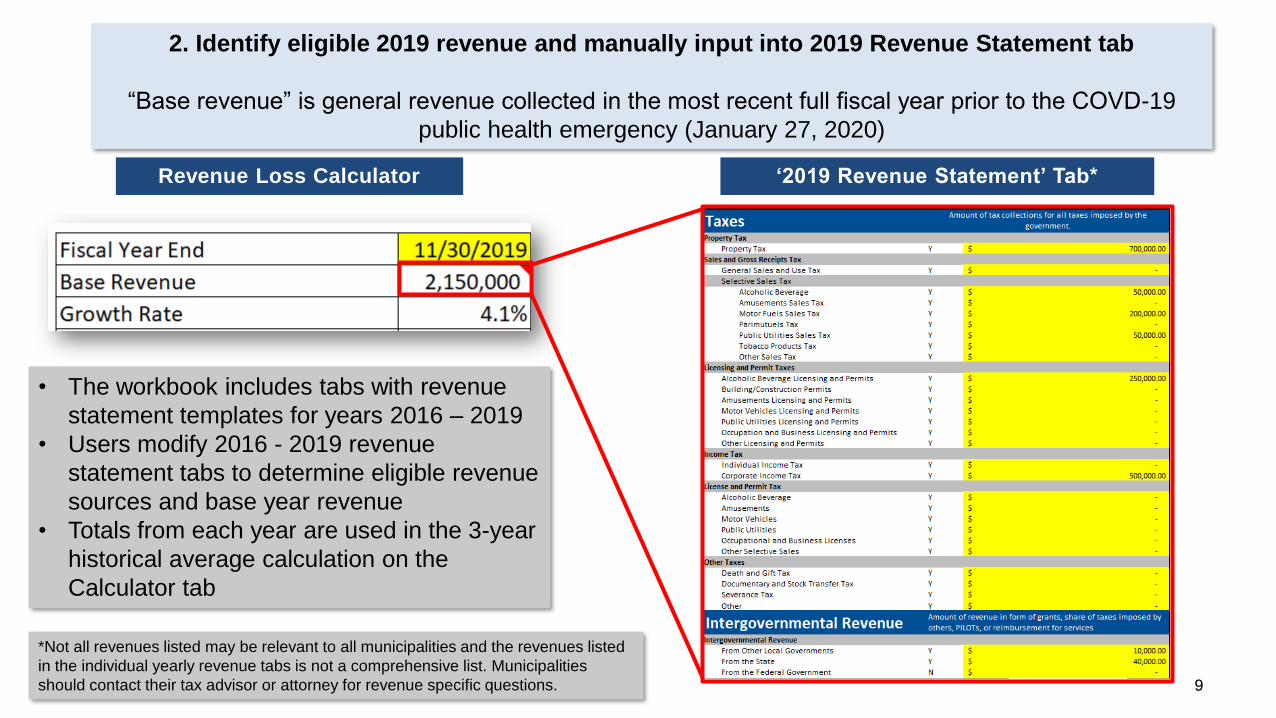
2. Identify eligible 2019 revenue and manually input into 2019 Revenue Statement tab
3. Manually input eligible revenue data from 2016 – 2018
4. Manually input 2020 actual revenue
5. View actual revenue loss calculation for 2020 and forecast full recovery scenario
for 2021 to 2023
Calculator Color Key
Yellow Manual Input
Blue
Counterfactual
Revenue
(calculated value)
Gray Forecasted Total
6
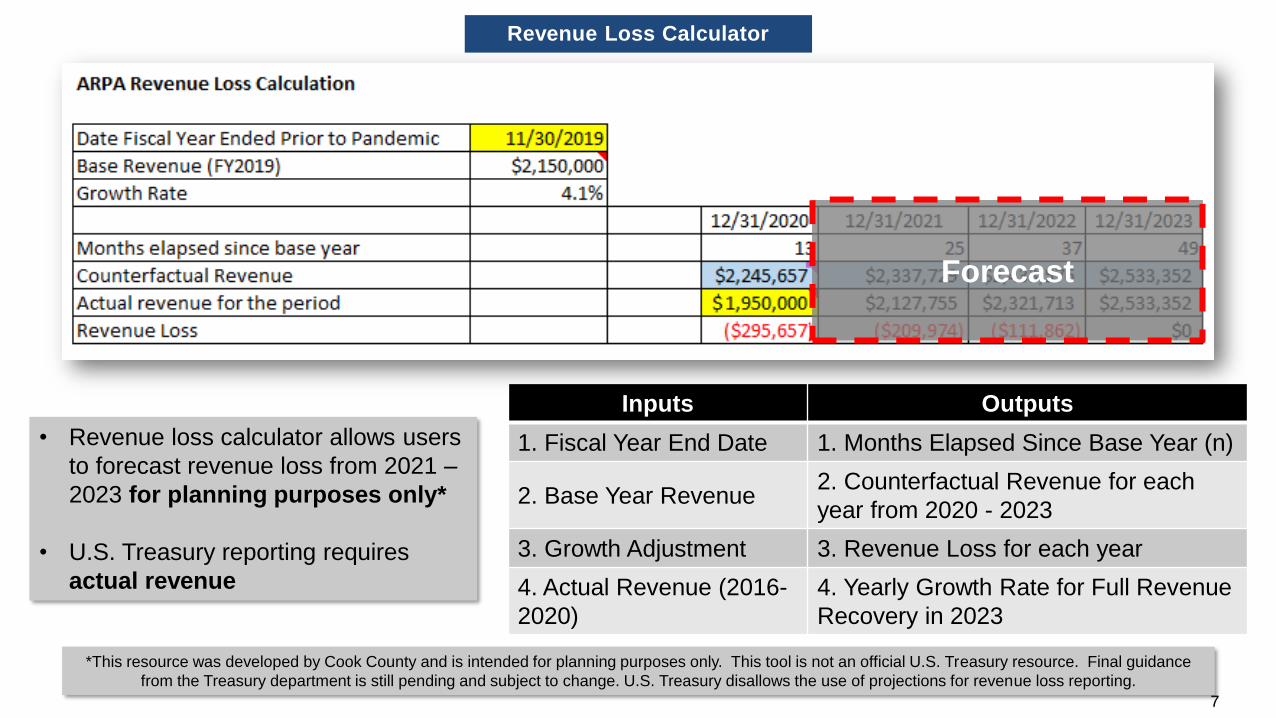
7
Inputs Outputs
1. Fiscal Year End Date 1. Months Elapsed Since Base Year (n)
2. Base Year Revenue2. Counterfactual Revenue for each
year from 2020 - 2023
3. Growth Adjustment 3. Revenue Loss for each year
4. Actual Revenue (2016-
2020)
4. Yearly Growth Rate for Full Revenue
Recovery in 2023
• Revenue loss calculator allows users
to forecast revenue loss from 2021 –
2023 for planning purposes only*
• U.S. Treasury reporting requires
actual revenue
Revenue Loss Calculator
*This resource was developed by Cook County and is intended for planning purposes only. This tool is not an official U.S. Treasury resource. Final guidance
from the Treasury department is still pending and subject to change. U.S. Treasury disallows the use of projections for revenue loss reporting.
Forecast
7
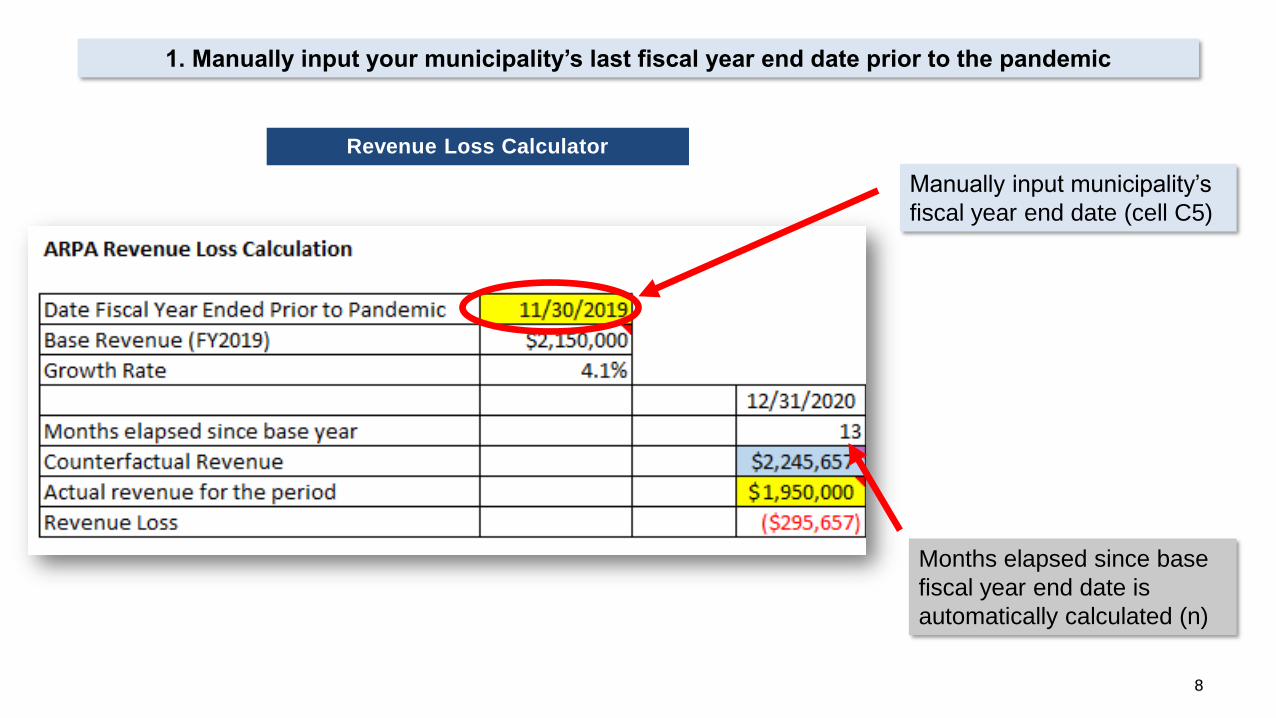
Revenue Loss Calculator
1. Manually input your municipality’s last fiscal year end date prior to the pandemic
Months elapsed since base
fiscal year end date is
automatically calculated (n)
Manually input municipality’s
fiscal year end date (cell C5)
8
9
‘2019 Revenue Statement’ Tab*
• The workbook includes tabs with revenue
statement templates for years 2016 – 2019
• Users modify 2016 - 2019 revenue
statement tabs to determine eligible revenue
sources and base year revenue
• Totals from each year are used in the 3-year
historical average calculation on the
Calculator tab
Revenue Loss Calculator
2. Identify eligible 2019 revenue and manually input into 2019 Revenue Statement tab
“Base revenue” is general revenue collected in the most recent full fiscal year prior to the COVD-19
public health emergency (January 27, 2020)
*Not all revenues listed may be relevant to all municipalities and the revenues listed
in the individual yearly revenue tabs is not a comprehensive list. Municipalities
should contact their tax advisor or attorney for revenue specific questions.
10
‘2019 Revenue Statement’ Tab
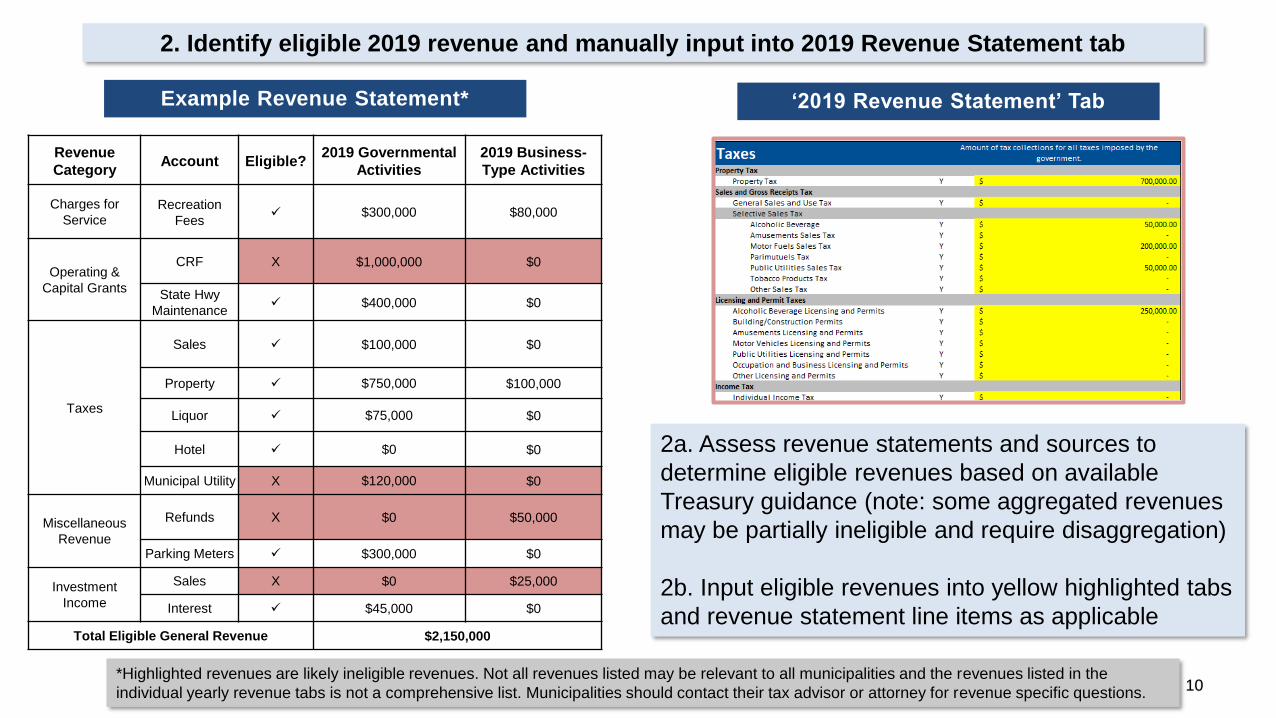
2. Identify eligible 2019 revenue and manually input into 2019 Revenue Statement tab
Example Revenue Statement*
2a. Assess revenue statements and sources to
determine eligible revenues based on available
Treasury guidance (note: some aggregated revenues
may be partially ineligible and require disaggregation)
2b. Input eligible revenues into yellow highlighted tabs
and revenue statement line items as applicable
Revenue
CategoryAccount Eligible?
2019 Governmental
Activities
2019 Business-
Type Activities
Charges for
ServiceRecreation
Fees✓ $300,000 $80,000
Operating &
Capital Grants
CRF X $1,000,000 $0
State Hwy
Maintenance✓ $400,000 $0
Taxes
Sales ✓ $100,000 $0
Property ✓ $750,000 $100,000
Liquor ✓ $75,000 $0
Hotel ✓ $0 $0
Municipal Utility X $120,000 $0
Miscellaneous
Revenue
Refunds X $0 $50,000
Parking Meters ✓ $300,000 $0
Investment
Income
Sales X $0 $25,000
Interest ✓ $45,000 $0
Total Eligible General Revenue $2,150,000
*Highlighted revenues are likely ineligible revenues. Not all revenues listed may be relevant to all municipalities and the revenues listed in the
individual yearly revenue tabs is not a comprehensive list. Municipalities should contact their tax advisor or attorney for revenue specific questions.

11
3. Manually input eligible revenue data from 2016 – 2018
Calculator includes templates for Fiscal Year 2016 – 2018 in separate tabs in the same format as those for 2019
Calculates 3-year historical
growth rate
3-Year Historical Average Growth Rate Calculator
Calculator automatically
selects higher growth rate
(4.1% or 3-year historical
average)
Revenue Loss Calculator
Automatically populated with
sum of all entered revenues
from ‘Revenue Statement’
tabs
12
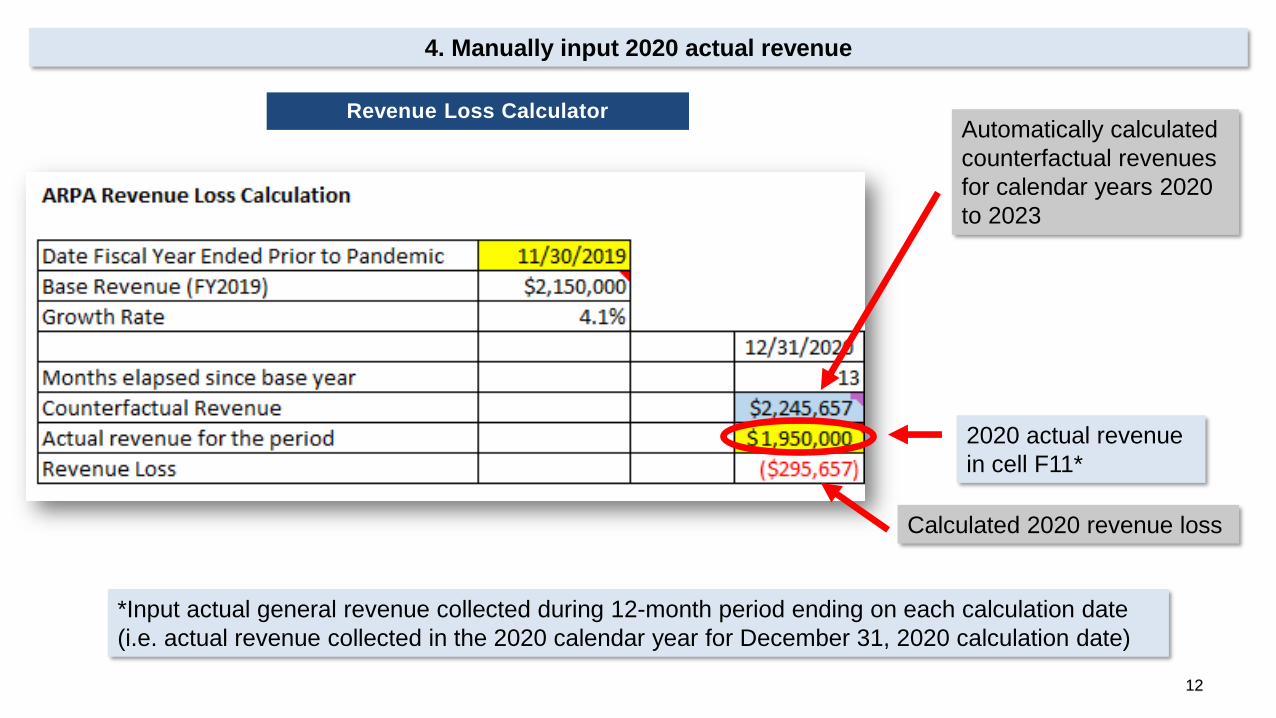
Automatically calculated
counterfactual revenues
for calendar years 2020
to 2023
Calculated 2020 revenue loss
2020 actual revenue
in cell F11*
Revenue Loss Calculator
4. Manually input 2020 actual revenue
*Input actual general revenue collected during 12-month period ending on each calculation date
(i.e. actual revenue collected in the 2020 calendar year for December 31, 2020 calculation date)
13
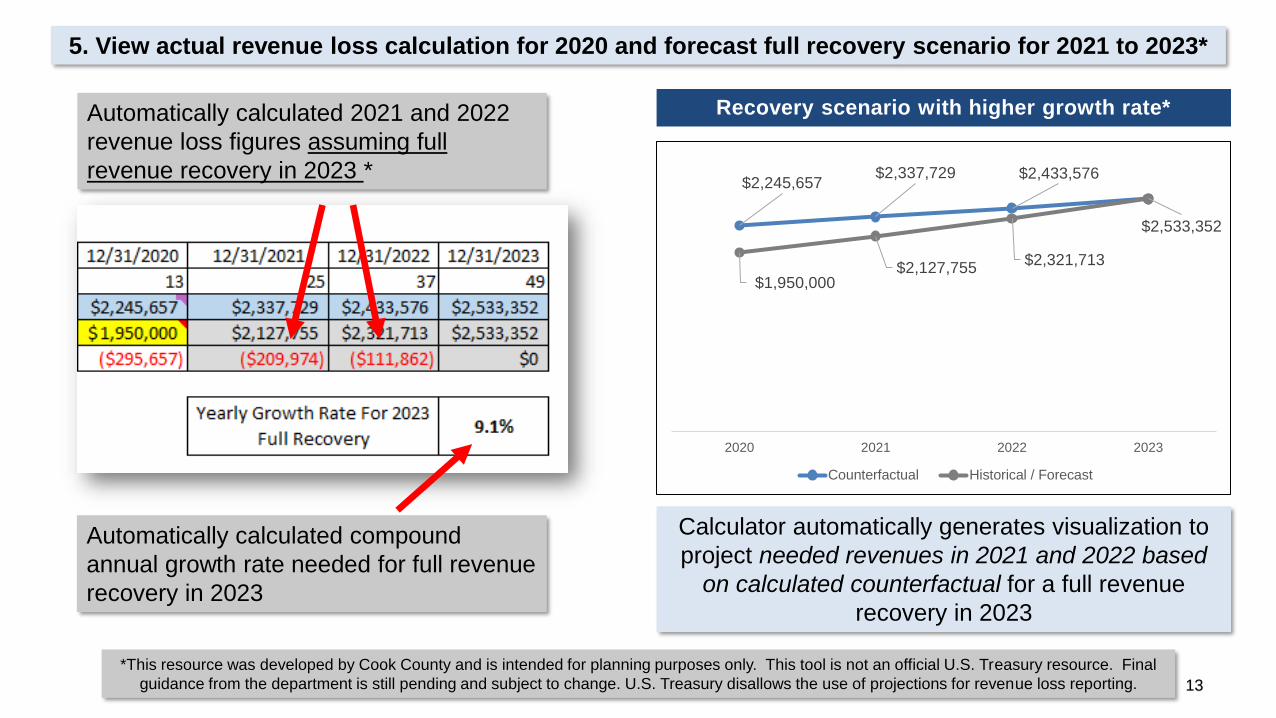
5. View actual revenue loss calculation for 2020 and forecast full recovery scenario for 2021 to 2023*
Automatically calculated compound
annual growth rate needed for full revenue
recovery in 2023
Automatically calculated 2021 and 2022
revenue loss figures assuming full
revenue recovery in 2023 *
Recovery scenario with higher growth rate*
*This resource was developed by Cook County and is intended for planning purposes only. This tool is not an official U.S. Treasury resource. Final
guidance from the department is still pending and subject to change. U.S. Treasury disallows the use of projections for revenue loss reporting.
$2,245,657 $2,337,729 $2,433,576
$2,533,352
$1,950,000 $2,127,755
$2,321,713
2020 2021 2022 2023
Counterfactual Historical / Forecast
Calculator automatically generates visualization to
project needed revenues in 2021 and 2022 based
on calculated counterfactual for a full revenue
recovery in 2023

14
Cell F12: 2020
revenue replacement
amount to report to
Treasury
Revenue Loss Calculator
Report 2020 revenue replacement in Interim Report (metro cities only)
Revenue Replacement Entry Screen (Interim Report)
Cell F12: $295,657
Cell F11: $1,950,000Cell C7: 4.1%
Cell C6: $2,150,000 Cell C5: 11/30/2019
Provide explanation for how revenue replacement funds were
allocated to government services in the rich text field
Cell C5 – C7
Cell F11
*This resource was developed by Cook County and is intended for planning purposes only. This tool is not an official U.S. Treasury resource. Final
guidance from the department is still pending and subject to change. U.S. Treasury disallows the use of projections for revenue loss reporting.