covid-19 future forecasting using supervised machine
TRANSCRIPT

This work is licensed under a Creative Commons Attribution 4.0 License. For more information, see https://creativecommons.org/licenses/by/4.0/.
This article has been accepted for publication in a future issue of this journal, but has not been fully edited. Content may change prior to final publication. Citation information: DOI10.1109/ACCESS.2020.2997311, IEEE Access
Date of publication xxxx 00, 0000, date of current version xxxx 00, 0000.
Digital Object Identifier 10.1109/ACCESS.2017.DOI
COVID-19 Future Forecasting UsingSupervised Machine Learning ModelsFURQAN RUSTAM1, AIJAZ AHMAD RESHI2, ARIF MEHMOOD3, SALEEM ULLAH1, BYUNG-WON ON4, WAQAR ASLAM3 AND GYU SANG CHOI51Department of Computer Science, Khwaja Fareed University of Engineering and Information Technology, Rahim Yar Khan, 64200, Pakistan2The College of Computer Science and Engineering, Department of Computer Science, Taibah University Al Madinah Al Munawarah Saudia Arabia3Department of Computer Science & IT, The Islamia University of Bahawalpur, Punjab 63100, Pakistan;4Department of Software Convergence Engineering, Kunsan National University, Gunsan 54150, Korea5Department of Information & Communication Engineering, Yeungnam University, Gyeongbuk 38541, Korea
Corresponding authors: Byung-Won On (email: [email protected]) and Arif Mehmood (email: [email protected])
This research was partially supported by National Research of Korea (NRF) grant funded by Korea government (MSIT) (No.NRF-2019R1F1A1060752).
ABSTRACT Machine learning (ML) based forecasting mechanisms have proved their significance toanticipate in perioperative outcomes to improve the decision making on the future course of actions. The MLmodels have long been used in many application domains which needed the identification and prioritizationof adverse factors for a threat. Several prediction methods are being popularly used to handle forecastingproblems. This study demonstrates the capability of ML models to forecast the number of upcoming patientsaffected by COVID-19 which is presently considered as a potential threat to mankind. In particular, fourstandard forecasting models, such as linear regression (LR), least absolute shrinkage and selection operator(LASSO), support vector machine (SVM), and exponential smoothing (ES) have been used in this study toforecast the threatening factors of COVID-19. Three types of predictions are made by each of the models,such as the number of newly infected cases, the number of deaths, and the number of recoveries in the next10 days. The results produced by the study proves it a promising mechanism to use these methods for thecurrent scenario of the COVID-19 pandemic. The results prove that the ES performs best among all the usedmodels followed by LR and LASSO which performs well in forecasting the new confirmed cases, death rateas well as recovery rate, while SVM performs poorly in all the prediction scenarios given the availabledataset.
INDEX TERMS COVID-19, exponential smoothing method, future forecasting, Adjusted R2 score,supervised machine learning
I. INTRODUCTION
MACHINE learning (ML) has proved itself as a promi-nent field of study over the last decade by solving
many very complex and sophisticated real-world problems.The application areas included almost all the real-world do-mains such as healthcare, autonomous vehicle (AV), businessapplications, natural language processing (NLP), intelligentrobots, gaming, climate modeling, voice, and image pro-cessing. ML algorithms’ learning is typically based on trialand error method quite opposite of conventional algorithms,which follows the programming instructions based on de-cision statements like if-else [1]. One of the most signifi-cant areas of ML is forecasting [2], numerous standard MLalgorithms have been used in this area to guide the futurecourse of actions needed in many application areas including
weather forecasting, disease forecasting, stock market fore-casting as well as disease prognosis. Various regression andneural network models have wide applicability in predictingthe conditions of patients in the future with a specific disease[3]. There are lots of studies performed for the prediction ofdifferent diseases using machine learning techniques such ascoronary artery disease [4], cardiovascular disease prediction[5], and breast cancer prediction [6]. In particular, the study[7] is focused on live forecasting of COVID-19 confirmedcases and study [8] is also focused on the forecast of COVID-19 outbreak and early response. These prediction systems canbe very helpful in decision making to handle the present sce-nario to guide early interventions to manage these diseasesvery effectively.
This study aims to provide an early forecast model for the
VOLUME 4, 2016 1
This work is licensed under a Creative Commons Attribution 4.0 License. For more information, see https://creativecommons.org/licenses/by/4.0/.
This article has been accepted for publication in a future issue of this journal, but has not been fully edited. Content may change prior to final publication. Citation information: DOI10.1109/ACCESS.2020.2997311, IEEE Access
Author et al.: Preparation of Papers for IEEE TRANSACTIONS and JOURNALS
spread of novel coronavirus, also known as SARS-CoV-2,officially named as COVID-19 by the World Health Orga-nization (WHO) [9]. COVID-19 is presently a very seriousthreat to human life all over the world. At the end of 2019,the virus was first identified in a city of China called Wuhan,when a large number of people developed symptoms likepneumonia [10]. It has a diverse effect on the human body,including severe acute respiratory syndrome and multi-organfailure which can ultimately lead to death in a very short du-ration [11]. Hundreds of thousands of people are affected bythis pandemic throughout the world with thousands of deathsevery coming day. Thousands of new people are reportedto be positive every day from countries across the world.The virus spreads primarily through close person to personphysical contacts, by respiratory droplets, or by touching thecontaminated surfaces. The most challenging aspect of itsspread is that a person can possess the virus for many dayswithout showing symptoms. The causes of its spread andconsidering its danger, almost all the countries have declaredeither partial or strict lockdowns throughout the affectedregions and cities. Medical researchers throughout the globeare currently involved to discover an appropriate vaccineand medications for the disease. Since there is no approvedmedication till now for killing the virus so the governmentsof all countries are focusing on the precautions which canstop the spread. Out of all precautions, "be informed" aboutall the aspects of COVID-19 is considered extremely impor-tant. To contribute to this aspect of information, numerousresearchers are studying the different dimensions of the pan-demic and produce the results to help humanity.
To contribute to the current human crisis our attempt in thisstudy is to develop a forecasting system for COVID-19. Theforecasting is done for the three important variables of thedisease for the coming 10 days: 1) the number 0f New con-firmed cases. 2) the number of death cases 3) the number ofrecoveries. This problem of forecasting has been consideredas a regression problem in this study, so the study is basedon some state-of-art supervised ML regression models suchas linear regression (LR), least absolute shrinkage and selec-tion operator (LASSO), support vector machine (SVM), andexponential smoothing (ES). The learning models have beentrained using the COVID-19 patient stats dataset provided byJohns Hopkins. The dataset has been preprocessed and di-vided into two subsets: training set (85% records) and testingset (15% records). The performance evaluation has been donein terms of important measures including R-squared score(R2 score), Adjusted R-squared Score (R2
adjusted), meansquare error (MSE), mean absolute error (MAE), and rootmean square error (RMSE).
This study has some key findings which are listed below:• ES performs best when the time-series dataset has very
limited entries.• Different ML algorithms seem to perform better in
different class predictions.• Most of the ML algorithms require an ample amount
of data to predict the future, as the size of the dataset
increases the model performances improve.• ML model based forecasting can be very useful for
decision-makers to contain pandemics like COVID-19.The rest of the paper consists of six sections. Section I
presents the introduction, section II contains the descriptionof the dataset and methods used in this study. Section IIIpresents the methodology, section IV presents the results, andsection V summarizes the paper and presents the conclusion.
II. MATERIALS & METHODSA. DATASETThe aim of this study is the future forecasting of COVID-19 spread focusing on the number of new positive cases,the number of deaths, and the number of recoveries. Thedataset used in the study has been obtained from the GitHubrepository provided by the Center for Systems Science andEngineering, Johns Hopkins University [12]. The repositorywas primarily made available for the visual dashboard of2019 Novel Coronavirus by the university and was sup-ported by the ESRI Living Atlas Team. Dataset files arecontained in the folder on the GitHub repository named(csse_covid_19_time_series). The folder contains daily timeseries summary tables, including the number of confirmedcases, deaths, and recoveries. All data are from the dailycase report and the update frequency of data is one day.Data samples from the files are shown in Tables 1, 2, 3respectively.
TABLE 1: COVID-19 patient death cases time-series world-wide
Province/State
Country/Region
Lat Long 1/22/20 1/23/20 . . . 1/27/20
NorthernTerritory
Australia -12.46 130.84 0 0 . . . 0
DiamondPrincess
Canada 0.000 0.000 0 0 . . . 1
NaN Algeria 28.03 1.65 0 0 . . . 19
TABLE 2: COVID-19 new confirmed cases time-seriesworldwide
Province/State
Country/Region
Lat Long 1/22/20 1/23/20 . . . 1/27/20
NaN Afghan 33.00 65.00 0 0 . . . 74Victoria Australia -37. 81 144. 96 0 0 . . . 411NaN Algeria 28.03 1.65 0 0 . . . 264
TABLE 3: COVID-19 recovery cases time-series worldwide
Province/State
Country/Region
Lat Long 1/22/20 1/23/20 . . . 1/27/20
Colombia Canada 49. 28 -123. 1 0 0 . . . 4Victoria Australia -37. 81 144. 96 0 0 . . . 70NaN Algeria 28.03 1.65 0 0 . . . 65
B. SUPERVISED MACHINE LEARNING MODELSA supervised learning model is built to make a predictionwhen it is provided with an unknown input instance. Thus
2 VOLUME 4, 2016
This work is licensed under a Creative Commons Attribution 4.0 License. For more information, see https://creativecommons.org/licenses/by/4.0/.
This article has been accepted for publication in a future issue of this journal, but has not been fully edited. Content may change prior to final publication. Citation information: DOI10.1109/ACCESS.2020.2997311, IEEE Access
Author et al.: Preparation of Papers for IEEE TRANSACTIONS and JOURNALS
in this learning technique, the learning algorithm takes adataset with input instances along with their correspondingregressor to train the regression model. The trained modelthen generates a prediction for the given unforeseen inputdata or test dataset [13]. This learning method may useregression techniques and classification algorithms for pre-dictive models’ development
Four regression models have been used in this study ofCOVID-19 future forecasting:• Linear Regression• LASSO Regression• Support Vector Machine• Exponential Smoothing
1) Linear RegressionIn regression modeling, a target class is predicated on theindependent features [14]. This method can be thus used tofind out the relationship between independent and dependentvariables and also for forecasting. Linear regression a type ofregression modeling is the most usable statistical techniquefor predictive analysis in machine learning. Each observationin linear regression depends on two values, one is the de-pendent variable and the second is the independent variable.Linear regression determines a linear relationship betweenthese dependent and independent variables. There are twofactors (x, y) that are involved in linear regression analysis.The equation below shows how y is related to x known asregression.
y = β0 + β1x+ ε (1)
or equivalently
E(y) = β0 + β1x (2)
Here, ε is the error term of linear regression. The error termhere uses to account the variability between both x and y, β0represents y-intercept, β1 represents slope.
To put the concept of linear regression in the machinelearning context, in order to train the model x is representedas input training dataset, y represents the class labels presentin the input dataset. The goal of the machine learning algo-rithm then is to find the best values for β0 (intercept) andβ1(coefficient) to get the best-fit regression line. To get thebest fit implies the difference between the actual values andpredicted values should be minimum, so this minimizationproblem can be represented as:
minimize1
n
n∑i=1
(predi − yi)2 (3)
g =1
n
n∑i=1
(predi − yi)2 (4)
Here, g is called a cost function, which is the root meansquare of the predicted value of y (predi) and actual y (yi),n is the total number of data points.
2) LASSO
LASSO is a regression model belongs to the linear regres-sion technique which uses shrinkage [15]. Shrinkage in thiscontext refers to the shrinking of extreme values of a datasample towards central values. The shrinkage process thusmakes LASSO better and more stable and also reduces theerror [16]. LASSO is considered as a more suitable modelfor multicollinearity scenarios. Since the model performs L1regularization and the penalty added in this case is equal tothe magnitude of coefficients. So LASSO makes the regres-sion simpler in terms of the number of features it is using.It uses a regularization method for automatically penalizingthe extra features. That is, the features that cannot help theregression results enough can be set to a very small valuepotentially zero.
An ordinary multivariate regression uses all the featuresavailable to it and will assign each one a coefficient ofregression. In contrast, the LASSO regression attempts to addthem one at a time and if the new feature does not improvethe fit enough to out-way the penalty term by including thatfeature then it could not be added meaning as zero. Thus thepower of regularization by applying the penalty term for theextra features is that it can automatically do the selection forus. Thus the models are made sparse with few coefficientsin this case of regularization since the process eliminates thecoefficients when their values are equal to zero. That meansLASSO regression works on an objective to minimize thefollowing:
n∑i=1
(yi −∑j
xijβj)2 + λ
p∑j=1
|βj | (5)
It sets the coefficient, which can be interpreted as min( sumof square residuals + λ |slope|), where, λ |slope| is penaltyterm.
3) Support Vector Machine
A support vector machine (SVM) is a type of supervised MLalgorithm used for both regression and classification [17],[18]. SVM regression being a non-parametric technique de-pends on a set of mathematical functions. The set of functionscalled kernel transforms the data inputs into the desired form.SVM solves the regression problems using a linear function,so while dealing with problems of non-linear regression,it maps the input vector(x) to n-dimensional space calleda feature space (z). This mapping is done by non-linearmapping techniques after that linear regression is applied tospace. Putting the concept in ML context with a multivariatetraining dataset (xn) with N number of observations with ynas a set of observed responses. The linear function can bedepicted as:
f(x) = x′β + b (6)
VOLUME 4, 2016 3

This work is licensed under a Creative Commons Attribution 4.0 License. For more information, see https://creativecommons.org/licenses/by/4.0/.
This article has been accepted for publication in a future issue of this journal, but has not been fully edited. Content may change prior to final publication. Citation information: DOI10.1109/ACCESS.2020.2997311, IEEE Access
Author et al.: Preparation of Papers for IEEE TRANSACTIONS and JOURNALS
The objective is to make it as flat as possible thus to findthe value of f(x) with (β′β) as minimal norm values. So theproblem fits in minimization function as:
J(β) =1
2β′β (7)
with a special condition of the values of all residuals not morethan ε, as in the following equation:
∀n : |yn − (x′nβ + b)| ≤ ε (8)
4) Exponential SmoothingIn exponential smoothing family methods, forecasting isdone based on previous periods’ data. The past data obser-vations’ influence is decaying exponentially as they becomeolder. Thus the weight assigned to different lag values isgeometrically declined. ES is a very simple powerful timeseries forecasting method specifically for univariate data [7],[19]. The forecast for the current time (Ft) in ES is given by:
Ft = αAt−1 + (1− α)Ft−1 (9)
Here, α smoothing cost where 0 ≤ α ≤ 1, At−1 is theactual value of the previous period in time series, Ft−1 is theforecast value of the previous forecast.
C. EVALUATION PARAMETERSIn this study, we evaluate the performance of each of thelearning models in terms of R-squared (R2) score, AdjustedR-Square (R2
adjusted), mean square error (MSE), mean abso-lute error (MAE), and root mean square error (RMSE).
1) R-squared ScoreR-squared (R2) score is a statistical measure used to evaluatethe performance of regression models [20], [21]. The statis-tic shows the dependent variable’s variance percentage thatcollectively determines the independent variable. It measuresthe relationship strength between the dependent variable andregression models on a convenient 0 – 100% scale. Aftertraining the regression model, we can check the goodness-of-fit of trained models by using theR2 score.R2 score finds thescatteredness of data points around the regression line whichcan also be referred to as the coefficient of determination.Its score always between 0 and 100%. 0% score impliesthe response variable has no variability around its meanexplained by the model, and 100% implies that the responsevariable has all the variability around its mean. The high R2
score shows the goodness of the trained model. R2 is a linearmodel that explains the percentage of variation independentvariable. It can be found as:
R2 =V arianceexplainedbymodel
Totalvariance(10)
2) Adjusted R-squared ScoreThe Adjusted R-squared (R2
adjusted) is a modified form ofR2, which also like R2 shows how well the data points fit the
curve. The primary difference between R2 and R2adjusted is
that the later adjusts for the number of features in a predictionmodel. In the case of R2
adjusted, the increase in new featurescan lead to its increase if the newly added features are usefulto the prediction model. However, if the newly added featuresare useless, its value will decrease. The R2
adjusted can bedefined as: :
R2adjusted = 1− (1−R2)
n− 1
n− (k + 1)(11)
Here, n is the sample size and k is the number of independentvariables in the regression equation.
3) Mean Absolute Error (MAE)The mean absolute error is the average magnitude of theerrors in the set of model predictions [22], [23]. This is anaverage on test data between the model predictions and actualdata where all individual differences have equal weight. Itsmatrix value range is from 0 to infinity and fewer score valuesshow the goodness of learning models that’s the reason it’salso called negatively-oriented scores [24].
MAE =1
n
n∑j=1
|yj − yj | (12)
4) Mean Square Error (MSE)Mean square error is another way to measure the perfor-mance of regression models [22]. MSE takes the distanceof data points from the regression line and squaring them.Squaring is necessary because it removes the negative signfrom the value and gives more weight to larger differences.The smaller mean squared error shows the closer you are tofinding the line of best fit. MSE can be calculated as:
MSE =1
n
n∑i=1
(yi − yi)2 (13)
5) Root Mean Square Error (RMSE)Root mean square error can be defined as the standard devi-ation of the prediction errors. Prediction errors also knownas residuals is the distance from the best fit line and actualdata points. RMSE is thus a measure of how concentrated theactual data points are around the best fit line. It is the errorrate given by the square root of MSE given as follows.
RMSE =
√√√√ 1
n
n∑i=1
(yi − yi)2 (14)
III. METHODOLOGYThe study is about novel coronavirus also known as COVID-19 predictions. The COVID-19 has proved a present potentialthreat to human life. It causes tens of thousands of deathsand the death rate is increasing day by day throughout theglobe. To contribute to this pandemic situation control, thisstudy attempts to perform future forecasting on the death
4 VOLUME 4, 2016
This work is licensed under a Creative Commons Attribution 4.0 License. For more information, see https://creativecommons.org/licenses/by/4.0/.
This article has been accepted for publication in a future issue of this journal, but has not been fully edited. Content may change prior to final publication. Citation information: DOI10.1109/ACCESS.2020.2997311, IEEE Access
Author et al.: Preparation of Papers for IEEE TRANSACTIONS and JOURNALS
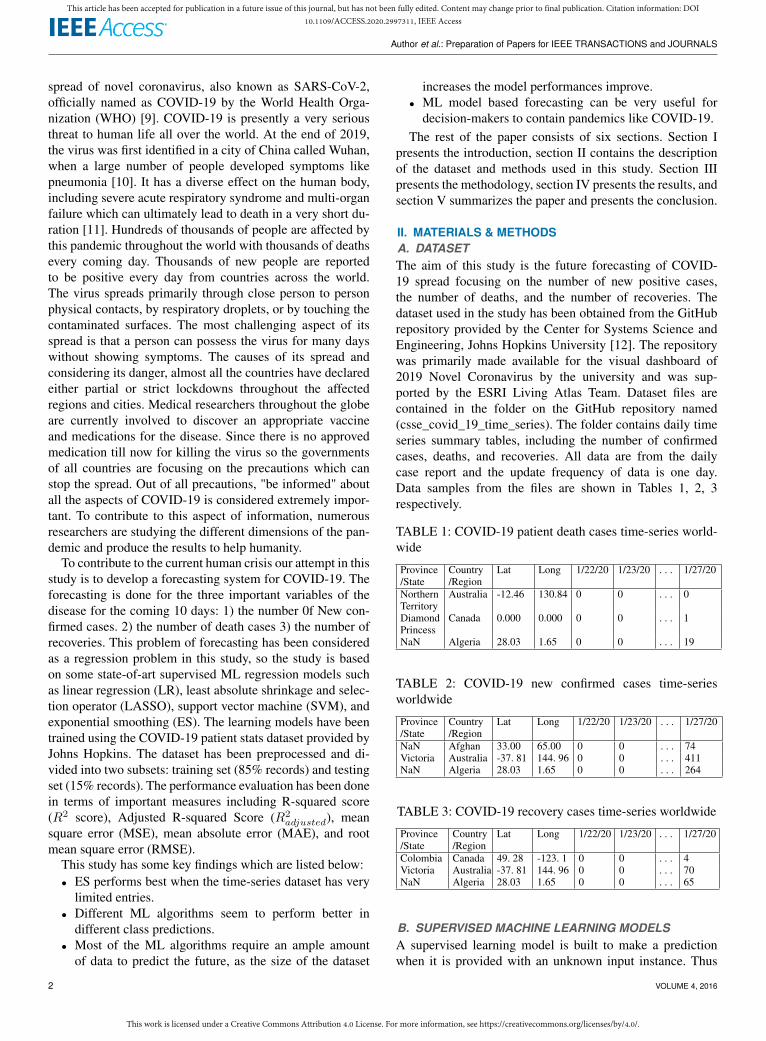
rate, the number of daily confirmed infected cases and thenumber of recovery cases in the upcoming 10 days. Theforecasting has been done by using four ML approachesthat are appropriate to this context. The dataset used in thestudy contains daily time series summary tables, includingthe number of confirmed cases, deaths, and recoveries inthe past number of days from which the pandemic started.Initially, the dataset has been preprocessed for this studyto find the global statistics of the daily number of deaths,confirmed cases, and recoveries. The resulred time-series hasbeen extracted from the reported data as shown in Table 4,the samples of the resulted dataset are shown in Tables 5, 6,7 respectively.
TABLE 4: Sample of data from worldwide cases time-series
Category Province/State
Country/Region
Lat Long 1/22/20 . . . 1/27/20
Death Victoria Australia -12.4 130.84 0 . . . 0Nan Canada 0.000 0.000 0 . . . 1NaN Algeria 28.03 1.65 0 . . . 19
Recovery Colombia Canada 49. 28 -123. 1 0 . . . 4Victoria Australia -37. 8 144. 96 0 . . . 70NaN Algeria 28.03 1.65 0 . . . 65
New NaN Afghan 33.00 65.00 0 . . . 74Confirmed Victoria Australia -37. 8 144. 96 0 . . . 411
NaN Algeria 28.03 1.65 0 . . . 264
TABLE 5: Day wise total death cases sample data
Day 1 deaths Day 2 deaths . . . Day 66 deaths0 4 . . . 20
TABLE 6: Day wise total recoveries rate sample data
Day 1 recoveries Day 2 recoveries . . . Day 66 recoveries0 6 . . . 139
TABLE 7: Day wise total new confirmed cases sample data
Day 1 new cases Day 2 new cases . . . Day 66 new cases0 21 . . . 749
After the initial data preprocessing step, the dataset hasbeen divided into two subsets: a training set (56 days) to trainthe models and testing set (10 days). The learning modelssuch as SVM, LR, LASSO, and ES have been used in thisstudy. These models have been trained on the days and newlyconfirmed cases, recovery, and death patterns. The learningmodels have then been evaluated based on important metricssuch as R2-score, R2
adjusted score MSE, RMSE, and MAEand reported in the results. The proposed approach used inthe study has been shown as a block diagram Figure 1.
IV. RESULTS & DISCUSSIONThis study attempts to develop a system for the future fore-casting of the number of cases affected by COVID-19 usingmachine learning methods. The dataset used for the studycontains information about the daily reports of the numberof newly infected cases, the number of recoveries, and the
FIGURE 1: Proposed Workflow
number of deaths due to COVID-19 worldwide. As the deathrate and confirmed cases are increasing day by day which isan alarming situation for the world. The number of peoplewho can be affected by the COVID-19 pandemic in differentcountries of the world is not well known. This study is anattempt to forecast the number of people that can be affectedin terms of new infected cases and deaths including thenumber of expected recoveries for the upcoming 10 days.Four machine learning models LR, LASSO, SVM, and EShave been used to predict the number of newly infected cases,the number of deaths, and the number of recoveries.
A. DEATH RATE FUTURE FORECASTINGThe study performs predictions on death rate and accordingto results ES performs better among all the models, LRand LASSO perform equally well and achieve almost thesame R2 score. In comparison, SVM performs worst in thissituation. The results are shown in Table 8.
TABLE 8: Models performance on future forecasting fordeath rate
Model R2 Score R2Adjusted MSE MAE RMSE
LR 0.96 0.95 840240.11 723.11 916.64LASSO 0.85 0.81 3244066.79 1430.29 1801.12SVM 0.53 0.39 16016210.98 3129.74 4002.02ES 0.98 0.97 662228.72 406.08 813.77
Figures 2, 3, 4 and 5 show the performance of LR, LASSO,SVM, and ES models respectively in the form of graphs.Graphs in all figures predict that the death rate will increasein upcoming days which is a very alarming sign. The currentmortality rate plotted in the graph in Figure 14 shows themodels’ predictions correct.
VOLUME 4, 2016 5

This work is licensed under a Creative Commons Attribution 4.0 License. For more information, see https://creativecommons.org/licenses/by/4.0/.
This article has been accepted for publication in a future issue of this journal, but has not been fully edited. Content may change prior to final publication. Citation information: DOI10.1109/ACCESS.2020.2997311, IEEE Access
Author et al.: Preparation of Papers for IEEE TRANSACTIONS and JOURNALS
FIGURE 2: Death prediction by LR for the upcoming 10 days
FIGURE 3: Death prediction by LASSO for the upcoming 10days
FIGURE 4: Death prediction by SVM for the upcoming 10days
FIGURE 5: Death prediction by ES for the upcoming 10 days
B. NEW INFECTED CONFIRM CASES’ FUTUREFORECASTINGThe new confirmed cases of COVID-19 increase day by dayTable 9 shows the forecasting results of the models used
in this study. ES and LASSO lead the table in terms ofperformace, LR also performed good, while SVM performsvery poorly in terms of all the evaluation metrics. Graphs infigures 6, 7, 8, 9 show the predictions of learning models.
TABLE 9: Models performance on future forecasting for newinfected confirm cases
Model R2 Score R2Adjusted MSE MAE RMSE
LR 0.83 0.79 1472986504.96 30279.55 38390.51LASSO 0.98 0.97 234489560.99 11693.97 15322.11SVM 0.59 0.47 5760890969.30 60177.90 75911.28ES 0.98 0.97 283201302.2 8867.43 16828.58
FIGURE 6: New infected confirm cases prediction by LR forthe upcoming 10 days
FIGURE 7: New infected confirm cases prediction byLASSO for the upcoming 10 days
FIGURE 8: New infected confirm cases prediction by SVMfor the upcoming 10 days
6 VOLUME 4, 2016

This work is licensed under a Creative Commons Attribution 4.0 License. For more information, see https://creativecommons.org/licenses/by/4.0/.
This article has been accepted for publication in a future issue of this journal, but has not been fully edited. Content may change prior to final publication. Citation information: DOI10.1109/ACCESS.2020.2997311, IEEE Access
Author et al.: Preparation of Papers for IEEE TRANSACTIONS and JOURNALS
FIGURE 9: New infected confirm cases prediction by ES forthe upcoming 10 days
C. RECOVERY RATE FUTURE FORECASTINGIn recovery rate future forecasting the ES again performsbetter among all the other models. All other models performpoorly, the order of performance from best to worst is ESis best followed by LR, LASSO and SVM due to the natureof available time-series data. The prediction trends for thecoming days are shown in Figures 10, 11, 12, and 13. Theperformance results of learning models are shown in Table10 below:
TABLE 10: Models performance on future forecasting forrecovery rate
Model R2 Score R2Adjusted MSE MAE RMSE
LR 0.39 0.21 480922814.51 17016.08 21929.95LASSO 0.29 0.08 1462144344.82 30705.27 38237.99SVM 0.24 0.02 13121148615.72 106739.82 114547.58ES 0.99 0.99 5970634.07 1827.85 2443.48
FIGURE 10: Recovery rate prediction by LR for the upcom-ing 10 days
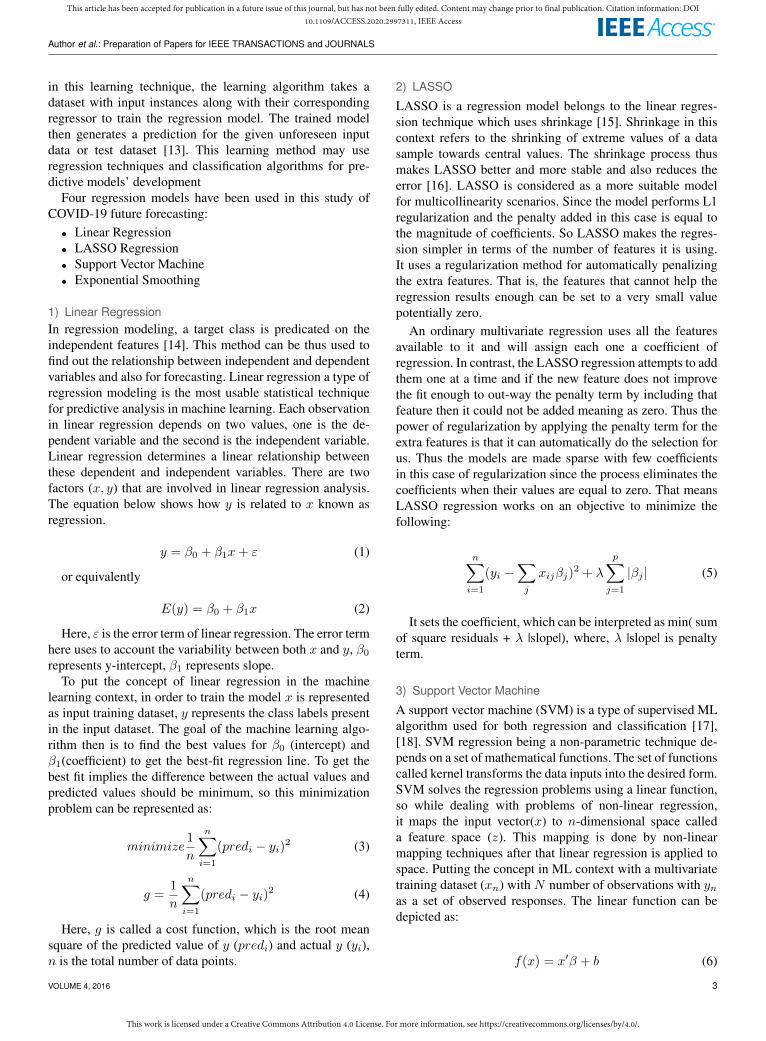
However, comparing the current recovery statistics (Figure19) with our models’ predictions, the ES prediction is follow-ing the trends which are very close to the actual situation.
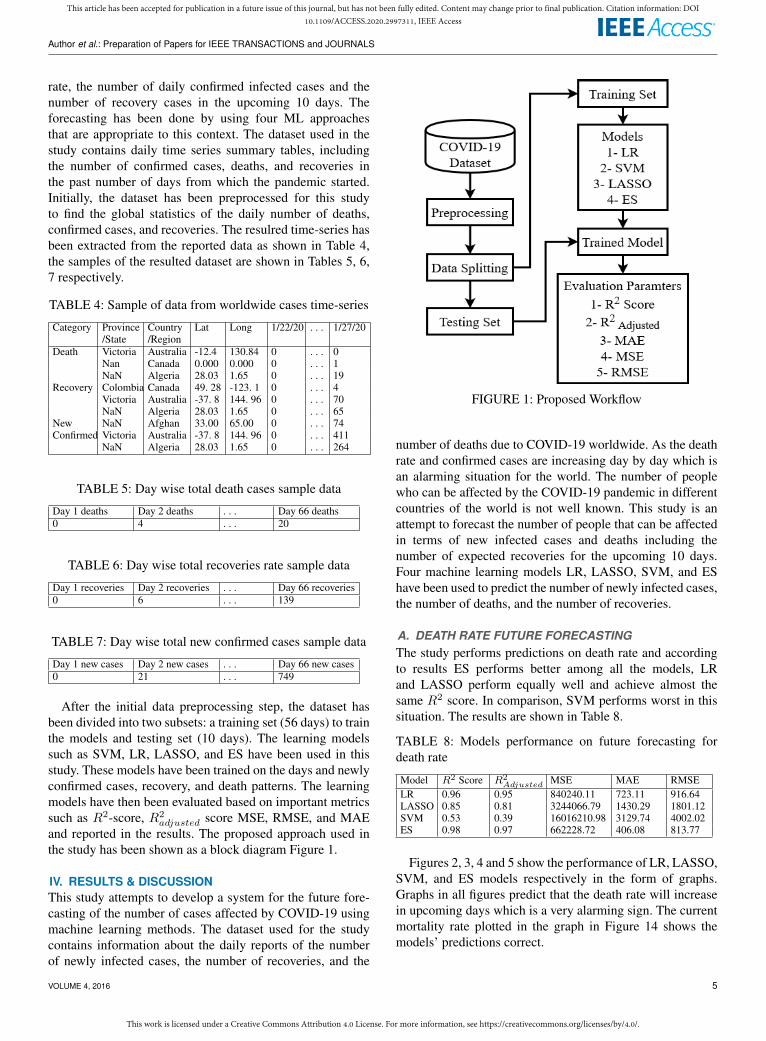
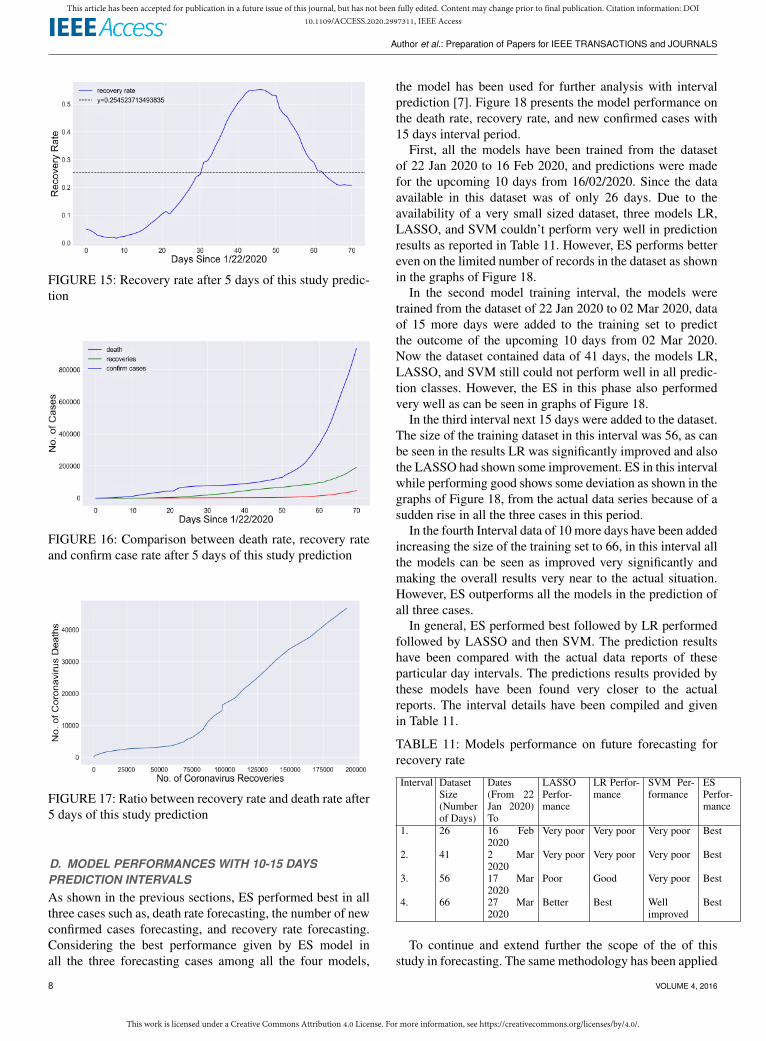
Besides, some more analysis has been performed after 5days of experiments on the updated dataset and some impor-tant statistics have been found as shown in Figure14, 15, 16,and 17. Figure 14 and 15 show that our model predictions arequite promising, because the models predict that in upcomingdays death rate will be increased and the graph of mortalityrate shows the same pattern and in recovery scenario modelspredict that recoveries rate will be slowed down and recovery
FIGURE 11: Recovery rate prediction by LASSO for theupcoming 10 days
FIGURE 12: Recovery rate prediction by SVM for the up-coming 10 days
FIGURE 13: Recovery rate prediction by ES for the upcom-ing 10 days
graph in Figure 15 follows the same pattern which proves themodel predictions correct.
FIGURE 14: Mortality rate after 5 days of this study predic-tion
VOLUME 4, 2016 7
This work is licensed under a Creative Commons Attribution 4.0 License. For more information, see https://creativecommons.org/licenses/by/4.0/.
This article has been accepted for publication in a future issue of this journal, but has not been fully edited. Content may change prior to final publication. Citation information: DOI10.1109/ACCESS.2020.2997311, IEEE Access
Author et al.: Preparation of Papers for IEEE TRANSACTIONS and JOURNALS
FIGURE 15: Recovery rate after 5 days of this study predic-tion
FIGURE 16: Comparison between death rate, recovery rateand confirm case rate after 5 days of this study prediction
FIGURE 17: Ratio between recovery rate and death rate after5 days of this study prediction
D. MODEL PERFORMANCES WITH 10-15 DAYSPREDICTION INTERVALSAs shown in the previous sections, ES performed best in allthree cases such as, death rate forecasting, the number of newconfirmed cases forecasting, and recovery rate forecasting.Considering the best performance given by ES model inall the three forecasting cases among all the four models,
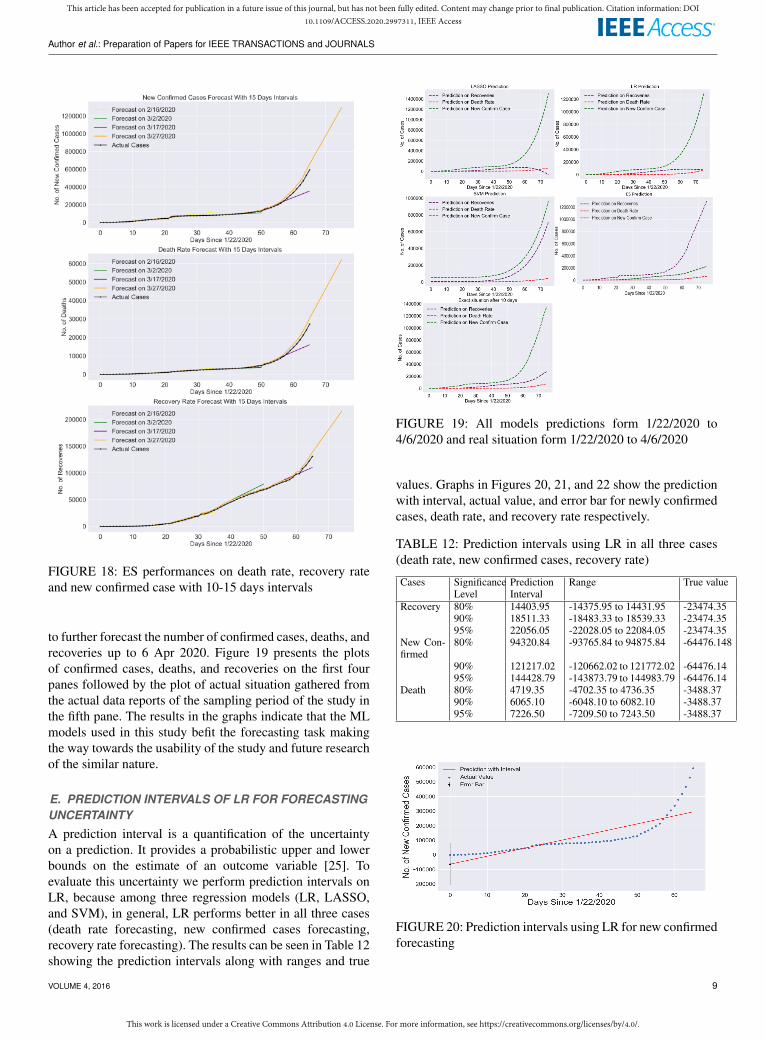
the model has been used for further analysis with intervalprediction [7]. Figure 18 presents the model performance onthe death rate, recovery rate, and new confirmed cases with15 days interval period.
First, all the models have been trained from the datasetof 22 Jan 2020 to 16 Feb 2020, and predictions were madefor the upcoming 10 days from 16/02/2020. Since the dataavailable in this dataset was of only 26 days. Due to theavailability of a very small sized dataset, three models LR,LASSO, and SVM couldn’t perform very well in predictionresults as reported in Table 11. However, ES performs bettereven on the limited number of records in the dataset as shownin the graphs of Figure 18.
In the second model training interval, the models weretrained from the dataset of 22 Jan 2020 to 02 Mar 2020, dataof 15 more days were added to the training set to predictthe outcome of the upcoming 10 days from 02 Mar 2020.Now the dataset contained data of 41 days, the models LR,LASSO, and SVM still could not perform well in all predic-tion classes. However, the ES in this phase also performedvery well as can be seen in graphs of Figure 18.
In the third interval next 15 days were added to the dataset.The size of the training dataset in this interval was 56, as canbe seen in the results LR was significantly improved and alsothe LASSO had shown some improvement. ES in this intervalwhile performing good shows some deviation as shown in thegraphs of Figure 18, from the actual data series because of asudden rise in all the three cases in this period.
In the fourth Interval data of 10 more days have been addedincreasing the size of the training set to 66, in this interval allthe models can be seen as improved very significantly andmaking the overall results very near to the actual situation.However, ES outperforms all the models in the prediction ofall three cases.
In general, ES performed best followed by LR performedfollowed by LASSO and then SVM. The prediction resultshave been compared with the actual data reports of theseparticular day intervals. The predictions results provided bythese models have been found very closer to the actualreports. The interval details have been compiled and givenin Table 11.
TABLE 11: Models performance on future forecasting forrecovery rate
Interval DatasetSize(Numberof Days)
Dates(From 22Jan 2020)To
LASSOPerfor-mance
LR Perfor-mance
SVM Per-formance
ESPerfor-mance
1. 26 16 Feb2020
Very poor Very poor Very poor Best
2. 41 2 Mar2020
Very poor Very poor Very poor Best
3. 56 17 Mar2020
Poor Good Very poor Best
4. 66 27 Mar2020
Better Best Wellimproved
Best
To continue and extend further the scope of the of thisstudy in forecasting. The same methodology has been applied
8 VOLUME 4, 2016
This work is licensed under a Creative Commons Attribution 4.0 License. For more information, see https://creativecommons.org/licenses/by/4.0/.
This article has been accepted for publication in a future issue of this journal, but has not been fully edited. Content may change prior to final publication. Citation information: DOI10.1109/ACCESS.2020.2997311, IEEE Access
Author et al.: Preparation of Papers for IEEE TRANSACTIONS and JOURNALS
FIGURE 18: ES performances on death rate, recovery rateand new confirmed case with 10-15 days intervals
to further forecast the number of confirmed cases, deaths, andrecoveries up to 6 Apr 2020. Figure 19 presents the plotsof confirmed cases, deaths, and recoveries on the first fourpanes followed by the plot of actual situation gathered fromthe actual data reports of the sampling period of the study inthe fifth pane. The results in the graphs indicate that the MLmodels used in this study befit the forecasting task makingthe way towards the usability of the study and future researchof the similar nature.
E. PREDICTION INTERVALS OF LR FOR FORECASTINGUNCERTAINTYA prediction interval is a quantification of the uncertaintyon a prediction. It provides a probabilistic upper and lowerbounds on the estimate of an outcome variable [25]. Toevaluate this uncertainty we perform prediction intervals onLR, because among three regression models (LR, LASSO,and SVM), in general, LR performs better in all three cases(death rate forecasting, new confirmed cases forecasting,recovery rate forecasting). The results can be seen in Table 12showing the prediction intervals along with ranges and true
FIGURE 19: All models predictions form 1/22/2020 to4/6/2020 and real situation form 1/22/2020 to 4/6/2020
values. Graphs in Figures 20, 21, and 22 show the predictionwith interval, actual value, and error bar for newly confirmedcases, death rate, and recovery rate respectively.
TABLE 12: Prediction intervals using LR in all three cases(death rate, new confirmed cases, recovery rate)
Cases SignificanceLevel
PredictionInterval
Range True value
Recovery 80% 14403.95 -14375.95 to 14431.95 -23474.3590% 18511.33 -18483.33 to 18539.33 -23474.3595% 22056.05 -22028.05 to 22084.05 -23474.35
New Con-firmed
80% 94320.84 -93765.84 to 94875.84 -64476.148
90% 121217.02 -120662.02 to 121772.02 -64476.1495% 144428.79 -143873.79 to 144983.79 -64476.14
Death 80% 4719.35 -4702.35 to 4736.35 -3488.3790% 6065.10 -6048.10 to 6082.10 -3488.3795% 7226.50 -7209.50 to 7243.50 -3488.37
FIGURE 20: Prediction intervals using LR for new confirmedforecasting
VOLUME 4, 2016 9

This work is licensed under a Creative Commons Attribution 4.0 License. For more information, see https://creativecommons.org/licenses/by/4.0/.
This article has been accepted for publication in a future issue of this journal, but has not been fully edited. Content may change prior to final publication. Citation information: DOI10.1109/ACCESS.2020.2997311, IEEE Access
Author et al.: Preparation of Papers for IEEE TRANSACTIONS and JOURNALS
FIGURE 21: Prediction intervals using LR for death rateforecasting
FIGURE 22: Prediction intervals using LR for recovery rateforecasting
V. CONCLUSIONThe precariousness of the COVID-19 pandemic can ignitea massive global crisis. Some researchers and governmentagencies throughout the world have apprehensions that thepandemic can affect a large proportion of the world pop-ulation [26], [27]. In this study, an ML-based predictionsystem has been proposed for predicting the risk of COVID-19 outbreak globally. The system analyses dataset contain-ing the day-wise actual past data and makes predictionsfor upcoming days using machine learning algorithms. Theresults of the study prove that ES performs best in the currentforecasting domain given the nature and size of the dataset.LR and LASSO also perform well for forecasting to someextent to predict death rate and confirm cases. According tothe results of these two models, the death rates will increasein upcoming days, and recoveries rate will be slowed down.SVM produces poor results in all scenarios because of the upsand downs in the dataset values. It was very difficult to put anaccurate hyperplane between the given values of the dataset.Overall we conclude that model predictions according to thecurrent scenario are correct which may be helpful to under-stand the upcoming situation. The study forecasts thus canalso be of great help for the authorities to take timely actionsand make decisions to contain the COVID-19 crisis. Thisstudy will be enhanced continuously in the future course,next we plan to explore the prediction methodology usingthe updated dataset and use the most accurate and appropriateML methods for forecasting. Real-time live forecasting will
be one of the primary focuses in our future work.
ACKNOWLEDGMENTThis research was partially supported by National Researchof Korea (NRF) grant funded by Korea government (MSIT)(No. NRF-2019R1F1A1060752) in part by the Fareed Com-puting Research Center, Department of Computer Scienceunder Khwaja Fareed University of Engineering and Infor-mation Technology (KFUEIT), Punjab, Rahim Yar Khan,Pakistan.
REFERENCES[1] S. Makridakis, E. Spiliotis, and V. Assimakopoulos, “Statistical and ma-
chine learning forecasting methods: Concerns and ways forward,” PloSone, vol. 13, no. 3, 2018.
[2] G. Bontempi, S. B. Taieb, and Y.-A. Le Borgne, “Machine learningstrategies for time series forecasting,” in European business intelligencesummer school. Springer, 2012, pp. 62–77.
[3] F. E. Harrell Jr, K. L. Lee, D. B. Matchar, and T. A. Reichert, “Regressionmodels for prognostic prediction: advantages, problems, and suggestedsolutions.” Cancer treatment reports, vol. 69, no. 10, pp. 1071–1077, 1985.
[4] P. Lapuerta, S. P. Azen, and L. LaBree, “Use of neural networks inpredicting the risk of coronary artery disease,” Computers and BiomedicalResearch, vol. 28, no. 1, pp. 38–52, 1995.
[5] K. M. Anderson, P. M. Odell, P. W. Wilson, and W. B. Kannel, “Cardio-vascular disease risk profiles,” American heart journal, vol. 121, no. 1, pp.293–298, 1991.
[6] H. Asri, H. Mousannif, H. Al Moatassime, and T. Noel, “Using machinelearning algorithms for breast cancer risk prediction and diagnosis,” Pro-cedia Computer Science, vol. 83, pp. 1064–1069, 2016.
[7] F. Petropoulos and S. Makridakis, “Forecasting the novel coronaviruscovid-19,” Plos one, vol. 15, no. 3, p. e0231236, 2020.
[8] G. Grasselli, A. Pesenti, and M. Cecconi, “Critical care utilization for thecovid-19 outbreak in lombardy, italy: early experience and forecast duringan emergency response,” Jama, 2020.
[9] WHO. Naming the coronavirus disease (covid-19) and the virus that causesit. [Online]. Available: https://www.who.int/emergencies/diseases/novel-coronavirus-2019/technical-guidance/naming-the-coronavirus-disease-(covid-2019)-and-the-virus-that-causes-it
[10] C. P. E. R. E. Novel et al., “The epidemiological characteristics of an out-break of 2019 novel coronavirus diseases (covid-19) in china,” Zhonghualiu xing bing xue za zhi= Zhonghua liuxingbingxue zazhi, vol. 41, no. 2,p. 145, 2020.
[11] L. van der Hoek, K. Pyrc, M. F. Jebbink, W. Vermeulen-Oost, R. J.Berkhout, K. C. Wolthers, P. M. Wertheim-van Dillen, J. Kaandorp,J. Spaargaren, and B. Berkhout, “Identification of a new human coron-avirus,” Nature medicine, vol. 10, no. 4, pp. 368–373, 2004.
[12] J. H. U. data repository. Cssegisanddata. [Online]. Available:https://github.com/CSSEGISandData
[13] M. R. M. Talabis, R. McPherson, I. Miyamoto, J. L. Martin, and D. Kaye,“Chapter 1 - analytics defined,” in Information Security Analytics,M. R. M. Talabis, R. McPherson, I. Miyamoto, J. L. Martin, andD. Kaye, Eds. Boston: Syngress, 2015, pp. 1 – 12. [Online]. Available:http://www.sciencedirect.com/science/article/pii/B9780128002070000010
[14] H.-L. Hwa, W.-H. Kuo, L.-Y. Chang, M.-Y. Wang, T.-H. Tung, K.-J.Chang, and F.-J. Hsieh, “Prediction of breast cancer and lymph nodemetastatic status with tumour markers using logistic regression models,”Journal of evaluation in clinical practice, vol. 14, no. 2, pp. 275–280, 2008.
[15] R. Tibshirani, “Regression shrinkage and selection via the lasso,” Journalof the Royal Statistical Society: Series B (Methodological), vol. 58, no. 1,pp. 267–288, 1996.
[16] A. E. Hoerl and R. W. Kennard, “Ridge regression: Biased estimation fornonorthogonal problems,” Technometrics, vol. 12, no. 1, pp. 55–67, 1970.
[17] X. F. Du, S. C. Leung, J. L. Zhang, and K. K. Lai, “Demand forecastingof perishable farm products using support vector machine,” Internationaljournal of systems Science, vol. 44, no. 3, pp. 556–567, 2013.
[18] F. Rustam, I. Ashraf, A. Mehmood, S. Ullah, and G. S. Choi, “Tweetsclassification on the base of sentiments for us airline companies,” Entropy,vol. 21, no. 11, p. 1078, 2019.
10 VOLUME 4, 2016

This work is licensed under a Creative Commons Attribution 4.0 License. For more information, see https://creativecommons.org/licenses/by/4.0/.
This article has been accepted for publication in a future issue of this journal, but has not been fully edited. Content may change prior to final publication. Citation information: DOI10.1109/ACCESS.2020.2997311, IEEE Access
Author et al.: Preparation of Papers for IEEE TRANSACTIONS and JOURNALS
[19] E. Cadenas, O. A. Jaramillo, and W. Rivera, “Analysis and forecastingof wind velocity in chetumal, quintana roo, using the single exponentialsmoothing method,” Renewable Energy, vol. 35, no. 5, pp. 925–930, 2010.
[20] J. Lupón, H. K. Gaggin, M. de Antonio, M. Domingo, A. Galán,E. Zamora, J. Vila, J. Peñafiel, A. Urrutia, E. Ferrer et al., “Biomarker-assist score for reverse remodeling prediction in heart failure: the st2-r2score,” International journal of cardiology, vol. 184, pp. 337–343, 2015.
[21] J.-H. Han and S.-Y. Chi, “Consideration of manufacturing data to applymachine learning methods for predictive manufacturing,” in 2016 EighthInternational Conference on Ubiquitous and Future Networks (ICUFN).IEEE, 2016, pp. 109–113.
[22] C. J. Willmott and K. Matsuura, “Advantages of the mean absolute error(mae) over the root mean square error (rmse) in assessing average modelperformance,” Climate research, vol. 30, no. 1, pp. 79–82, 2005.
[23] R. Kaundal, A. S. Kapoor, and G. P. Raghava, “Machine learning tech-niques in disease forecasting: a case study on rice blast prediction,” BMCbioinformatics, vol. 7, no. 1, p. 485, 2006.
[24] S. Baran and D. Nemoda, “Censored and shifted gamma distributionbased emos model for probabilistic quantitative precipitation forecasting,”Environmetrics, vol. 27, no. 5, pp. 280–292, 2016.
[25] Y. Grushka-Cockayne and V. R. R. Jose, “Combining prediction intervalsin the m4 competition,” International Journal of Forecasting, vol. 36, no. 1,pp. 178–185, 2020.
[26] N. C. Mediaite. Harvard professor sounds alarm on ‘likely’ coronaviruspandemic: 40% to 70% of world could be infected this year. Accessed on2020.02.18. [Online]. Available: https://www.mediaite.com/news/harvard-professor-sounds-alarm-on-likely-coronavirus-pandemic-40-to-70-of-world-could-be-infected-this-year/
[27] BBC. Coronavirus: Up to 70% of germany could becomeinfected - merkel. Accessed on 2020.03.15. [Online]. Available:https://www.bbc.com/news/world-us-canada-51835856
FURQAN RUSTAM received his MCS degreein the Department of Computer Science, IslamiaUniversity of Bahawalpur, Pakistan (Oct-2015 toOct-2017). Since Nov-2018, he got himself en-rolled in Master of Computer Science, Depart-ment of Computer Science, Khwaja Fareed Uni-versity of Engineering and Information Technol-ogy (KFUEIT), Rahim Yar Khan, 64200, Pak-istan. He is also serving as Research Assistant atFareed Computing & Research Center, KFUEIT,
Pakistan. His recent research interests are related to Data Mining, MachineLearning, and Artificial Intelligence, mainly working on Creative Comput-ing, and Supervised Machine Learning.
AIJAZ AHMAD RESHI received his Ph.D. degreefrom Department of Computer Science, BIHER,Bharath University,Chennai, India in 2015. Heis working as Assistant Professor in College ofComputer Science and Engineering, Dapartmentof Computer Science, Taibah University Al Mad-ina Al Munawarah, Saudi Arabia. His recent re-search interests include Machine Learning, DeepLearning, Internet of Things (IoT), Web of Things(WoT) and Wireless Sensor and Actuator Net-
works.
ARIF MEHMOOD received his Ph.D. degree inthe Department of Information & CommunicationEngineering, Yeungnam University, Korea (Feb-2014 to Nov-2017). He is working as AssistantProfessor, Department of Computer Science &IT, The Islamia University of Bahawalpur, PAK-ISTAN. His recent research interests are relatedto Data Mining, mainly working on AI and DeepLearning-based Text Mining, and Data ScienceManagement Technologies.
SALEEM ULLAH was born in AhmedPur East,Pakistan in 1983. He received his B.Sc. and MITdegrees in Computer Science from Islamia Univer-sity Bahawalpur and Bahauddin Zakariya Univer-sity (Multan) in 2003 and 2005 respectively. From2006 to 2009, he worked as a Network/IT Ad-ministrator in different companies. He completedhis Doctorate degree from Chongqing University,China in 2012. From August 2012 to Feb 2016, heworked as an Assistant Professor in Islamia Uni-
versity Bahawalpur, Pakistan. Currently, he is working as an Associate Deanin Khwaja Fareed University of Engineering & Information Technology,Rahim Yar Khan since February 2016. He has almost 14 years of Industryexperience in field of IT. He is an active researcher in the field of AdhocNetworks, IoTs, Congestion Control, Data Science, and Network Security.
BYUNG-WON ON received his Ph.D. degree inDepartment of Computer Science and Engineer-ing, Pennsylvania State University at UniversityPark, PA, USA in 2007. Then, he worked asa full- time researcher in University of BritishColumbia, Advanced Digital Sciences Center, andAdvanced Institutes of Convergence Technologyfor seven years. Since 2014, he has been a facultymember in Department of Software ConvergenceEngineering, Kunsan National University, Korea.
His recent research interests are related to Data Mining(esp. ProbabilityTheory and Applications), Machine Learning, and Artificial Intelligence,mainly working on Abstractive Summarization, Creative Computing, andMulti-Agent Reinforcement Learning.
WAQAR ASLAM received the M.Sc. degree incomputer science from Quaid-i-Azam University,Islamabad, Pakistan, and the Ph.D. degree in com-puter science from the Eindhoven University ofTechnology, The Netherlands. For his Ph.D. de-gree, he received the Overseas Scholarship, HEC,Pakistan. He is currently an Assistant Professorwith the Computer Science & IT, The IslamiaUniversity of Bahawalpur, Pakistan. His researchinterests include performance modeling & QoS of
wireless/computer networks, performance modeling of (distributed) soft-ware architectures, radio resource allocation, the Internet of Things, FogComputing, effort/time/cost estimation of software development in (dis-tributed) Agile setups, social network data analysis, and DNA/Chaos-basedinformation security.
VOLUME 4, 2016 11

This work is licensed under a Creative Commons Attribution 4.0 License. For more information, see https://creativecommons.org/licenses/by/4.0/.
This article has been accepted for publication in a future issue of this journal, but has not been fully edited. Content may change prior to final publication. Citation information: DOI10.1109/ACCESS.2020.2997311, IEEE Access
Author et al.: Preparation of Papers for IEEE TRANSACTIONS and JOURNALS
GYU SANG CHOI received his Ph.D. in the De-partment of Computer Science and Engineering,Pennsylvania State University, University Park,PA, USA in 2005. He was a research staff mem-ber at Samsung Advanced Institute of Technology(SAIT) for Samsung Electronics from 2006 to2009. Since 2009, he has been a faculty member inthe Department of Information & Communication,Yeungnam University, Korea. His research areasinclude non- volatile memory and storage systems.
12 VOLUME 4, 2016