covid-19 market trends - brightmls.com · market trends bright footprint 1. daily on-market...
TRANSCRIPT

COVID-19 Market Trends
Week Ending April 5th

OVERVIEW for Week Ending April 5th
Compared to the same week last year, the volume of listings taken off-market remained higher, as new temporarily off-market listings remained well above 2019.
On a week over week basis, however, new T/O volume declined nearly -13%.
The volume of new active listings continued to lag, as the week was down -25% year over year and -5% week to week.
Note : State-level charts can be found in the appendix.
2

Market Trends
Bright Footprint
1. Daily On-Market Inventory
2. Daily Listings Being Removed from the Market
• Temp Off, Canceled, Withdrawn, and Combined
Summary of Listings Being Removed from the Market
• On Market Listings moving to Off Market
3. New Coming Soon Listings
4. New Actives
5. New Active Under Contract
6. New Pendings
• Active Under Contract and Pendings Falling Through
7. New Closed
8. Daily Showing Activity
By State
1. District of Columbia
2. Delaware
3. Maryland
4. New Jersey
5. Pennsylvania
6. Virginia
7. West Virginia

Daily On-Market Inventory – “Active, Active Under Contract”
On-market inventory for the week fell -4.7% below the same week last year and -3.0% under the week prior. Compared to the pre-COVID benchmark week of February 24th, last week fell -4.2%.
Note: The drop from 2019 was due to a change in policy enforced last year.

Daily Number of Listings Changing to “Temp Off” Status
The volume of new T/O status changes continued to slow last week, down -12.9% week to week. However, this was still double the same week year ago, and 129.2% above the pre-COVID benchmark week.
For Monday, April 6th, new T/Os fell -34.3% below the Monday four week benchmark, but +105.2% over the pre-COVID levels.

Daily Number of Listings Changing to “Canceled” Status
Last week’s level of daily new canceled listings was -26.8% lower than the same week the previous year, and only up +5 from last week.
For Monday, April 6th, new canceled listings dipped -9.2% under the Monday average of the last four weeks.
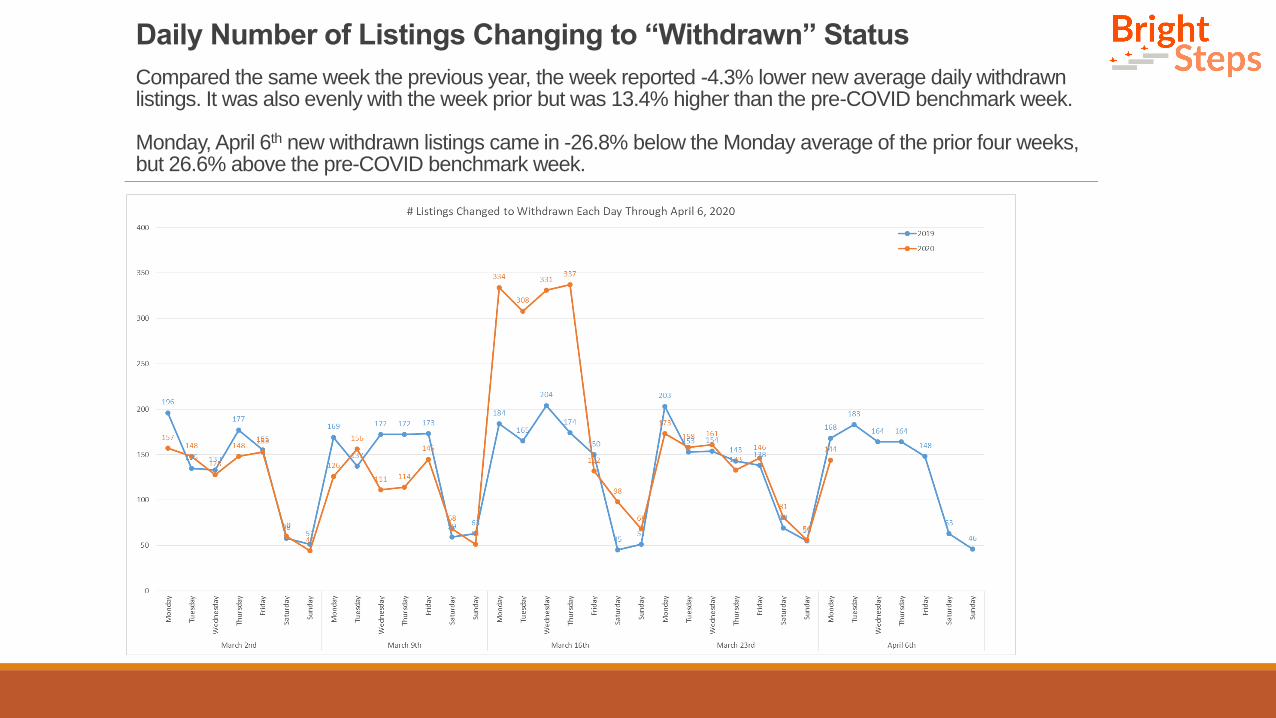
Daily Number of Listings Changing to “Withdrawn” Status
Compared the same week the previous year, the week reported -4.3% lower new average daily withdrawn listings. It was also evenly with the week prior but was 13.4% higher than the pre-COVID benchmark week.
Monday, April 6th new withdrawn listings came in -26.8% below the Monday average of the prior four weeks, but 26.6% above the pre-COVID benchmark week.

Daily Number of Listings Being Removed from the Market
Last week’s overall level of new off-market listing changes saw a 34.6% increase compared to the same week in 2019, and a 60.7% gain compared to the pre-COVID benchmark week. However, it was down -7.5% week to week.
For Monday, April 6th, overall new off-market listing changes fell even will last week.

Daily Disposition of Active and Coming Soon listings Moving to an Off Market Status
Of AUCs and C/S listings coming off market last week, 65.6% moved to T/O – similar to last week.
Of listings that moved to AUC or C/S on Monday, April 6th, about six in ten moved to T/O.

Daily Number of Coming Soon Listings Being Added to the Market
For the week, average daily new ‘coming soon’ listings dipped -24.9% week to week and fell -46.8% under the pre-COVID benchmark.
For Monday, April 6th new coming soon listings came in -33.8% under the Monday four week average.
Note: We are reviewing the 2019 ”coming soon” tracking methodology for reporting.

Daily Number of New Active Listings Being Added to the Market
For the week, average daily new active listings posted -25.1% lower results compared to the same week the previous year, and -5.1% off of the week prior.
Monday, April 6th saw -18.6% fewer new active listings compared the Monday four week average.
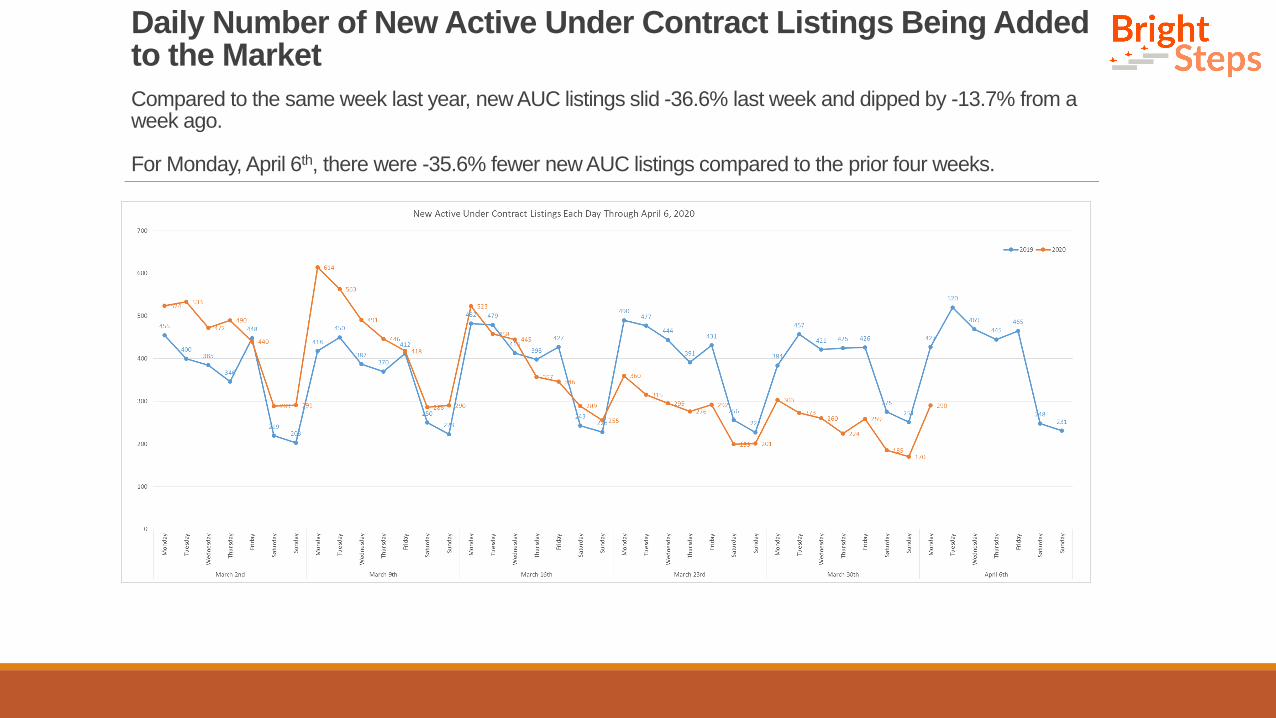
Daily Number of New Active Under Contract Listings Being Added to the Market
Compared to the same week last year, new AUC listings slid -36.6% last week and dipped by -13.7% from a week ago.
For Monday, April 6th, there were -35.6% fewer new AUC listings compared to the prior four weeks.
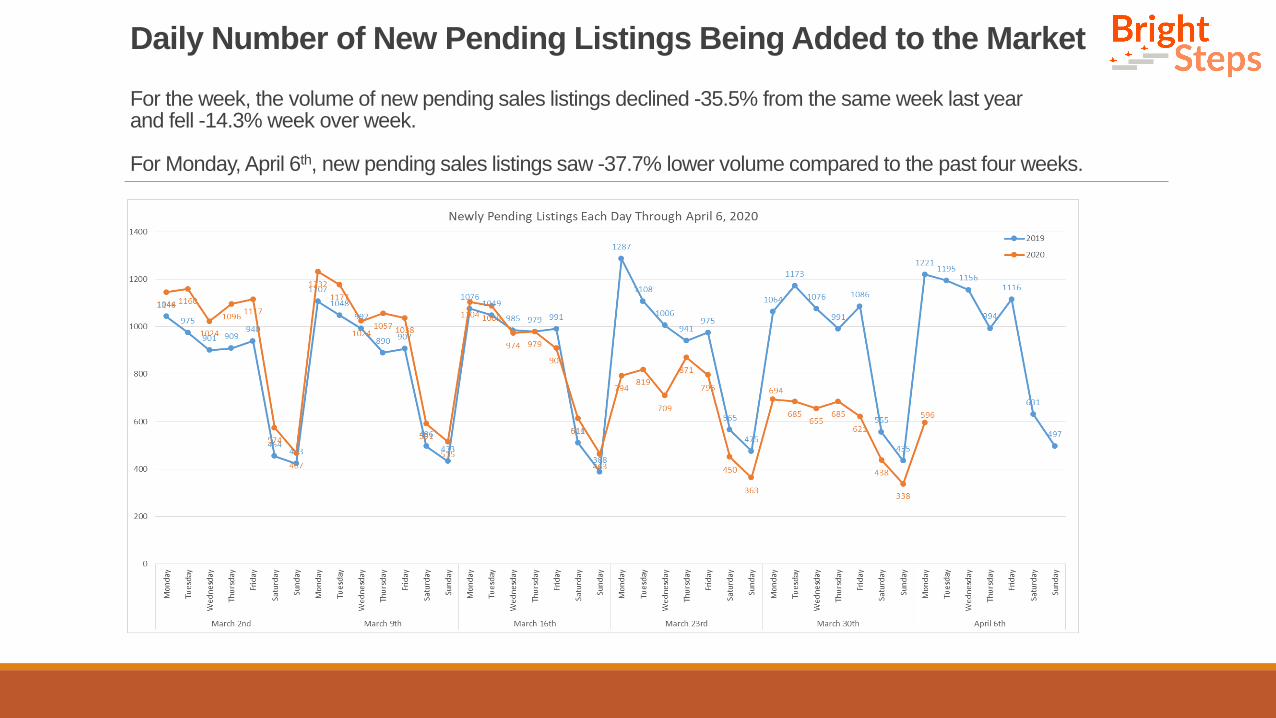
Daily Number of New Pending Listings Being Added to the Market
For the week, the volume of new pending sales listings declined -35.5% from the same week last year and fell -14.3% week over week.
For Monday, April 6th, new pending sales listings saw -37.7% lower volume compared to the past four weeks.

Daily Disposition of Active Under Contract and Pendings Falling Through
Of the deals that fell through last week (1491), 76.1% of listings returned to active status, similar to the week prior.
For Monday, April 6th, 78.1% of deals that fell through returned to active.

Daily Number of New Closed Listings
Average daily closed sales for the week paced +31.8% higher than the same week last year. Closed sales also gained 27.1% week over week, as last week was the end of March.
For Monday, April 6th closed sales saw -18.4% lower volume than the Monday four week average.

Daily Showing Activity
New showings declined -68.9% from the same week last year and fell -15.2% week to week.
For Monday, April 6th, new showing activity declined by -48.1% from the day’s average for the last four weeks.
Note: Confirmed Showings = Showing appointments that were confirmed through showing time. We do not know if they actually went to the appointment.

Appendix

COVID-19 Market TrendsDistrict of Columbia

Daily Number of New Active Listings Being Added to the Market for DC
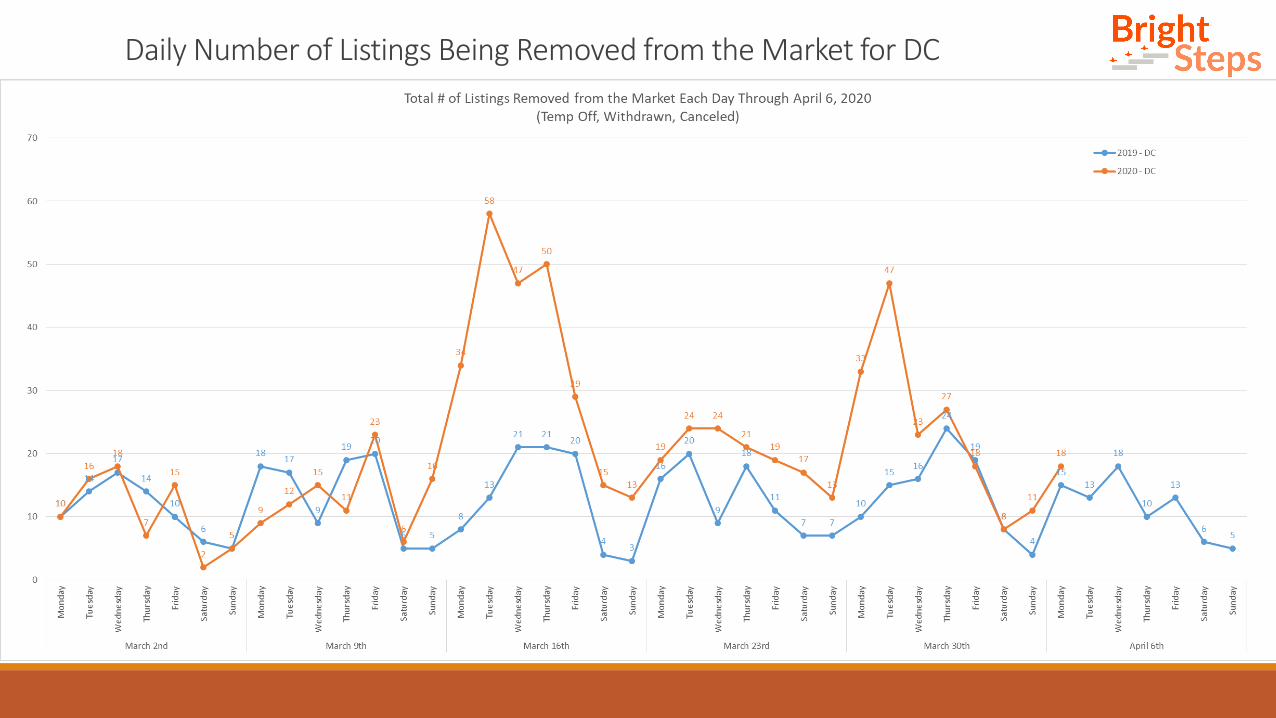
Daily Number of Listings Being Removed from the Market for DC

Daily Number of New Active Under Contract Listings Being Added to the Market for DC

Daily Number of New Pending Listings Being Added to the Market for DC

Daily Number of New Closed Listings for DC

Daily Showing Activity For DC-Confirmed Showings = Showing appointments that were confirmed through showing time. We do not know if they actually went to the appointment.

COVID-19 Market TrendsDelaware

Daily Number of New Active Listings Being Added to the Market for DE

Daily Number of Listings Being Removed from the Market for DE

Daily Number of New Active Under Contract Listings Being Added to the Market for DE

Daily Number of New Pending Listings Being Added to the Market for DE
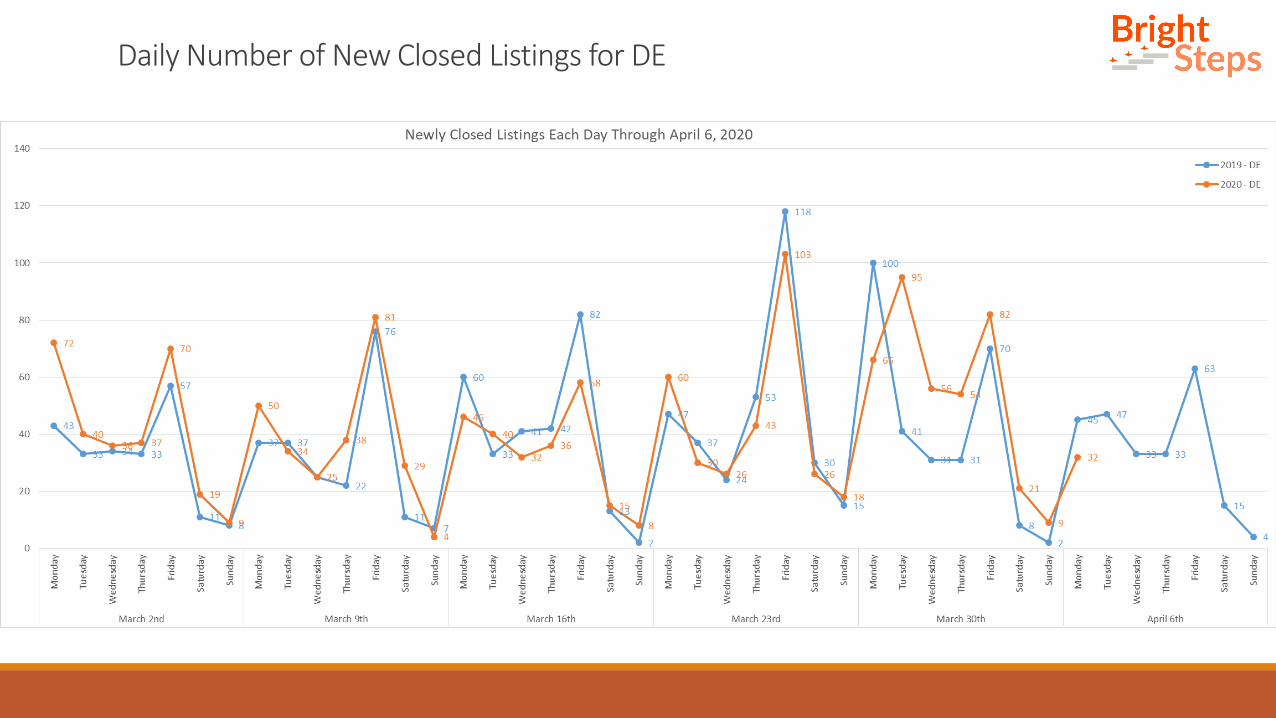
Daily Number of New Closed Listings for DE
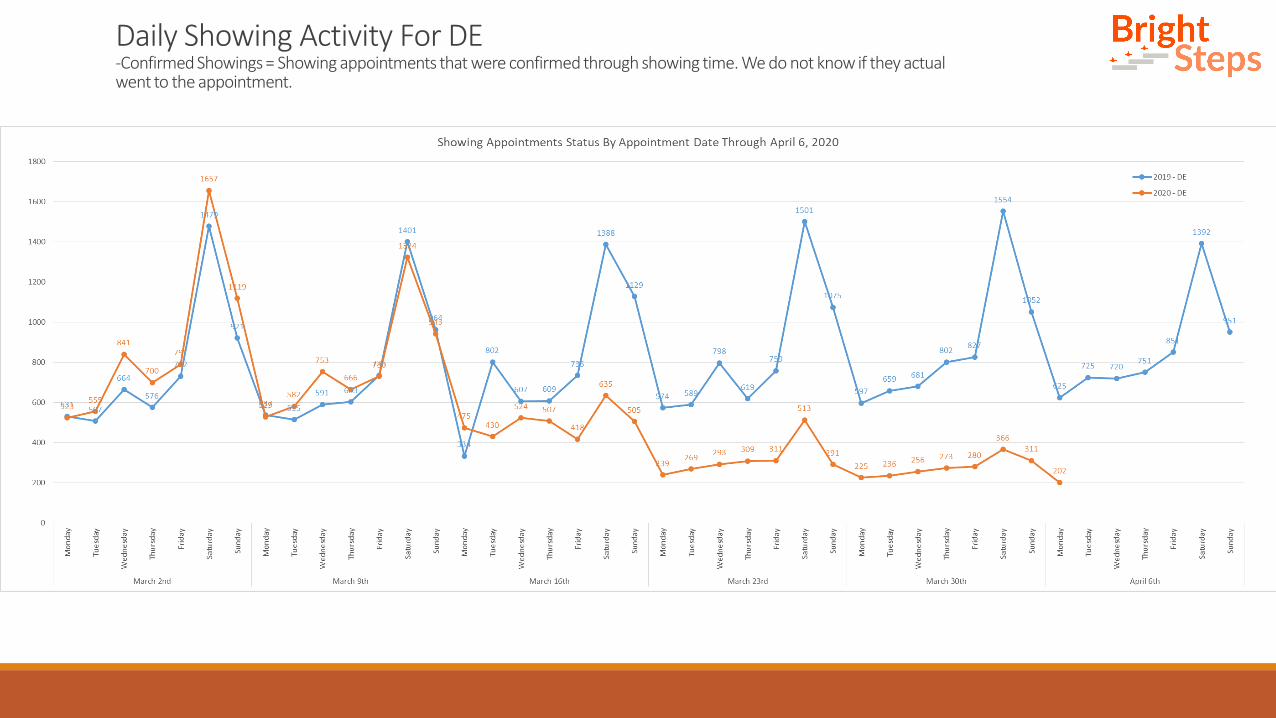
Daily Showing Activity For DE-Confirmed Showings = Showing appointments that were confirmed through showing time. We do not know if they actual went to the appointment.

COVID-19 Market TrendsMaryland

Daily Number of New Active Listings Being Added to the Market for MD

Daily Number of Listings Being Removed from the Market for MD

Daily Number of New Active Under Contract Listings Being Added to the Market for MD
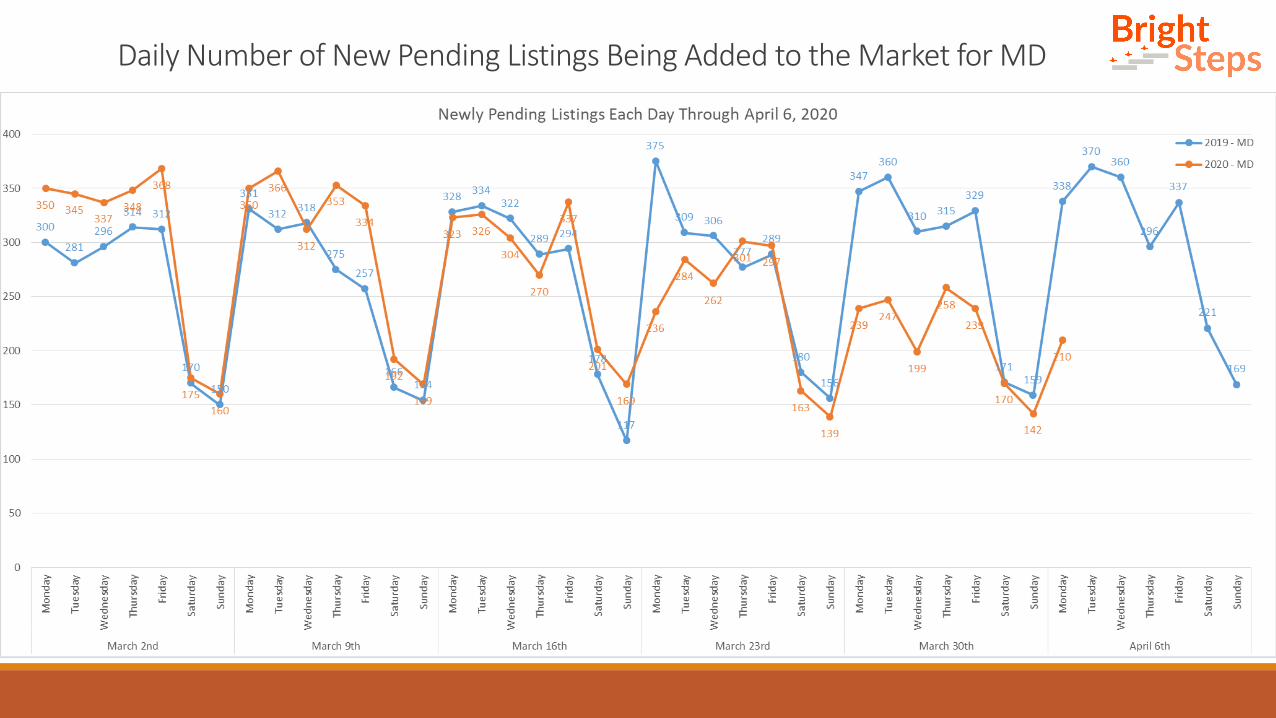
Daily Number of New Pending Listings Being Added to the Market for MD

Daily Number of New Closed Listings for MD

Daily Showing Activity For MD-Confirmed Showings = Showing appointments that were confirmed through showing time. We do not know if they actually went to the appointment.

COVID-19 Market TrendsNew Jersey

Daily Number of New Active Listings Being Added to the Market for NJ

Daily Number of Listings Being Removed from the Market for NJ
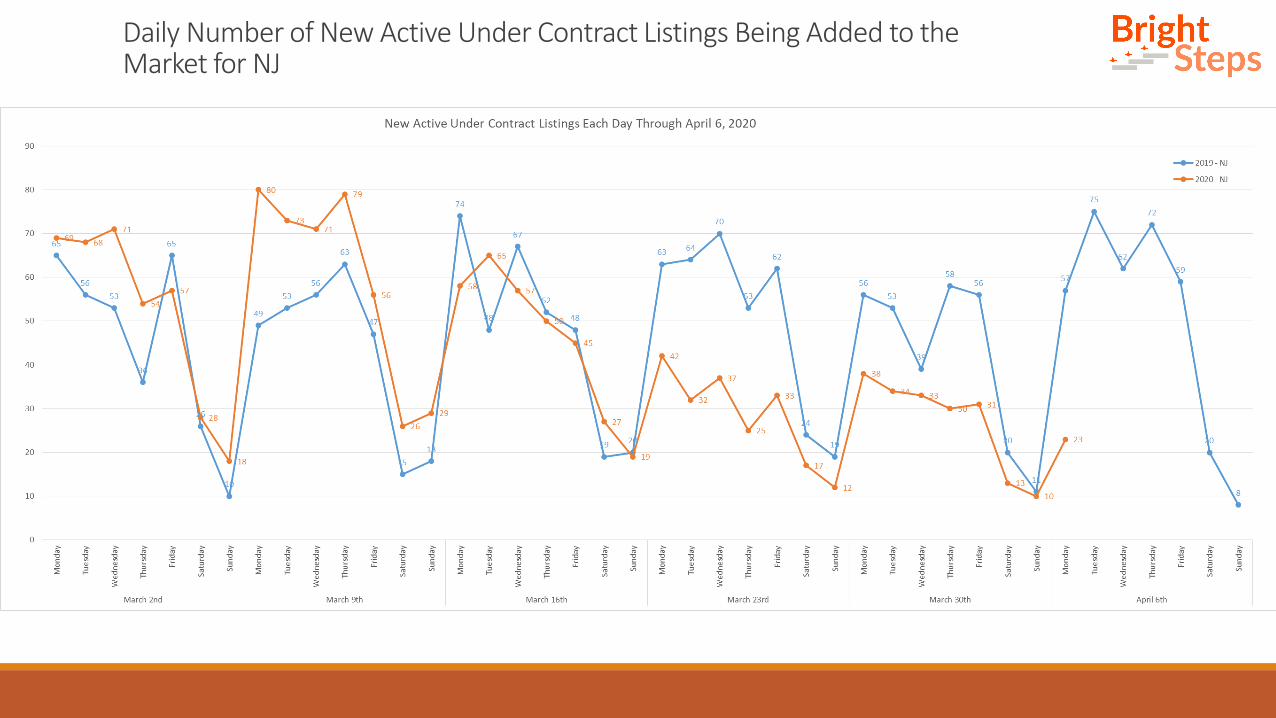
Daily Number of New Active Under Contract Listings Being Added to the Market for NJ

Daily Number of New Pending Listings Being Added to the Market for NJ
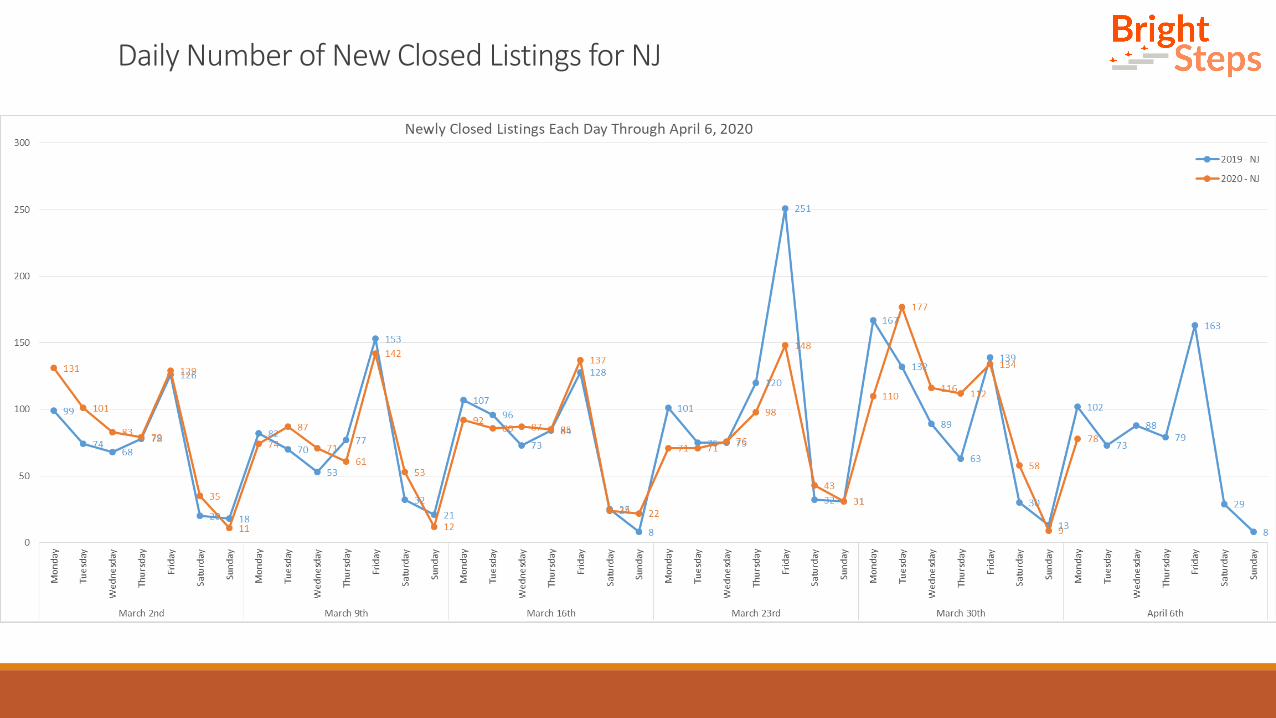
Daily Number of New Closed Listings for NJ

Daily Showing Activity For NJ-Confirmed Showings = Showing appointments that were confirmed through showing time. We do not know if they actually went to the appointment.

COVID-19 Market TrendsPennsylvania

Daily Number of New Active Listings Being Added to the Market for PA

Daily Number of Listings Being Removed from the Market for PA

Daily Number of New Active Under Contract Listings Being Added to the Market for PA

Daily Number of New Pending Listings Being Added to the Market for PA

Daily Number of New Closed Listings for PA

Daily Showing Activity For PA-Confirmed Showings = Showing appointments that were confirmed through showing time. We do not know if they actually went to the appointment.

COVID-19 Market TrendsVirginia

Daily Number of New Active Listings Being Added to the Market for VA

Daily Number of Listings Being Removed from the Market for VA

Daily Number of New Active Under Contract Listings Being Added to the Market for VA

Daily Number of New Pending Listings Being Added to the Market for VA

Daily Number of New Closed Listings for VA

Daily Showing Activity For VA-Confirmed Showings = Showing appointments that were confirmed through showing time. We do not know if they actually went to theappointment.

COVID-19 Market TrendsWest Virginia

Daily Number of New Active Listings Being Added to the Market for WV

Daily Number of Listings Being Removed from the Market for WV

Daily Number of New Active Under Contract Listings Being Added to the Market for WV

Daily Number of New Pending Listings Being Added to the Market for WV

Daily Number of New Closed Listings for WV

Daily Showing Activity For WV