covid-19 pandemic rising to the occasion
TRANSCRIPT

engineering the future 1
IndianEngineeringExportsRs150
ie2 I Magazine of EEPC INDIA (formerly Engineering Export Promotion Council) www.eepcindia.org VOL. 13, ISSUE NO. 2, MAY 2020
LIGHT-WT MATERIALS I EXPORTS FALL I CORPORATE BOND MARKET
Rising to the occasion MANUFACTURERS THE WORLD OVER ARE REPURPOSING THEIR PRODUCT LINES TO PRODUCE CRUCIAL MEDICAL AND HEALTHCARE PRODUCTS
COVID-19 PANDEMIC

MAY 2020 l INDIAN ENGINEERING EXPORTS l 3
VOL. 13, ISSUE NO.2, MAY 2020 I Rs150
IndianEngineeringExportsie 2 | Magazine of the Engineering Export Promotion Council
www.eepcindia.org LETTERS
CHAIRMAN ON CNBC I just watched you on CNBC. I share your views 100 percent. We are engineering exporters and have customers in over 150 countries. The surprising part in this lockdown is that not only are our customers across the globe functioning and asking for our products but we have suppliers in the USA, Italy, and Spain who are all engineering companies and have been working during their lockdowns and are eager to make their supplies to us.
I feel there is a much better way to handle this else we are handing our life’s work to other countries. You have our full support. Please let me know how we can help.
Thank you for Chairing EEPC and god bless. If there is anything else you need, please let me know.
Dinesh Advani, Director, Powermaster
Ltd, Navi Mumbai
***
GST CLARIFICATIONCircular No. 138/08/2020-GST
Circular No.136/06/2020-GST, dated 03.04.2020 and Circular No.137/07/2020-GST, dated 13.04.2020 had been issued to clarify doubts regarding relief measures taken by the Government for facilitating taxpayers in meeting the compliance requirements under various provisions of the Central Goods and Services Tax Act, 2017 (hereinafter referred to as the ‘CGST Act’) on account of the measures taken to prevent the spread of Novel Corona Virus (COVID-19). Post issuance of the said clarifications, certain challenges being faced by taxpayers in adhering to the com-pliance requirements under various other provisions of the CGST Act were brought to the notice of the Board, and need to be clarified.
The issues raised have been examined and in order to ensure uniformity in the implementation of the provisions of the law across the field formations, the Board, in exercise of its powers conferred under
section 168(1) of the CGST Act, hereby clarifies as under:
Issue: Notification No. 11/2020 – Central Tax dated 21.03.2020, issued under section 148 of the CGST Act provided that an IRP/CIRP is required to take a separate registration within 30 days of the issuance of the notification. It has been represented that the IRP/RP are facing difficulty in obtaining registrations during the period of the lockdown and have requested to increase the time for obtaining registration from the present 30 days limit.
Clarification: Vide notification No.39/2020- Central Tax, dated 05.05.2020, the time limit required for obtaining registration by the IRP/RP in terms of special procedure prescribed vide notification No. 11/2020 – Central Tax dated 21.03.2020 has been extended. Accordingly, IRP/RP shall now be required to obtain registration within thirty days of the appointment of the IRP/RP or by 30th June, 2020, whichever is later.
Issue: Another doubt has been raised that the present notification has used the terms IRP and RP interchangeably, and in cases where an appointed IRP is not ratified and a separate RP is appointed, whether the same new GSTIN shall be transferred from the IRP to RP, or both will need to take fresh registration.
In cases where the RP is not the same as IRP, or in cases where a different IRP/RP is appointed midway during the insolvency process, the change in the GST system may be carried out by an amendment in the registration form. Changing the author-izsd signatory is a non-core amendment and does not require approval of tax officer.
Yogendra Garg, Principal Commissioner,
GST Policy Wing, Central Board of Indi-
rect Taxes and Customs
***
[The detailed circular can be found on https://www.cbic.gov.in/resourc-es//htdocs-cbec/gst/Circular_Re-fund_138_8_2020.pdf – Ed]
EXCLUSIVE MEMBER SECTION ATwww.eepcindia.org
An exclusive member’s section has been introduced on EEPC India’s website. The User ID and Password has been sent to members on their email ID that is on record with EEPC India. If any member has not received it, please contact EEPC India at: [email protected].
The email IDs of some members are not
available with EEPC India. Please provide your
email ID at [email protected] so that we can
mail the details to you. It is also recommended
that all members view their details in the
Member’s Directory on EEPC India’s website and
verify their email ID.
All members are also requested to provide
mobile numbers of key contact persons over
email. This will enable EEPC India to send
important alerts and messages on SMS.
EDITORSuranjan Gupta Executive Director, EEPC India
PRINTED AND PUBLISHED BY Suranjan Gupta, Executive Director, for and on behalf of the owner, EEPC India Vanijya Bhavan, 1st Floor International Trade Facilitation Centre 1/1 Wood Street, Kolkata 700 016
PRINTED AT Swapna Printing Works Pvt Ltd52 Raja Rammohan Sarani, Kolkata 700 009
PUBLISHED FROMEEPC India Vanijya Bhavan, 1st Floor International Trade Facilitation Centre 1/1 Wood Street, Kolkata 700 016
CONSULTING EDITORAditi Chowdhury
DESIGNED BY Bee Ideas20/3 Ballygunge Place, Kolkata 700 019 [email protected]
Address all correspondence to the Consulting Editor email: [email protected]
The views expressed in the magazine are not necessarily those of EEPC India.
Export India: Unleashing India’s Engineering Exports PotentialEXPORT INDIA outlines a roadmap for Indian engineering exporters to unleash the country’s exports potential and achieve an aspirational target of US$200 billion for engineering exports by 2025, almost a threefold increase from actual exports in 2017-18.
PRICERs2,500 + GST for membersRs3,000 + GST for non-members
FREE DELIVERY
PREPARED BY
CONTACT: [email protected]
2

4 l INDIAN ENGINEERING EXPORTS l MAY 2020 MAY 2020 l INDIAN ENGINEERING EXPORTS l 5
MONTHLY MUSINGSin this issue
From the Chairman’s Desk
Amidst such issues, there is one silver lining for the Indian exporters – diversification of the global supply chains beyond China ... countries across the world are now looking towards diversifying their supply chains to countries other than China which may include Brazil, Mexico, India, other South Asian and Southeast Asian countries
THE March figures of engineering exports have been released and as expected the dev-astating impact of the COVID-19 pandemic
has become clearly evident. Echoing the trend in India’s merchandise exports, which exhibited a y-o-y decline of 35 percent in March 2020 India’s engineering exports for the same period declined by a whopping 42.5 percent. Within the engineer-ing sector all major product panels exhibited sharp decline in March 2020. Overall, this fiscal (April-March 2019-20), India’s cumulative engineering exports declined by 5.8 percent when compared to the last fiscal. The pandemic has surely brought a halt to the trend of record growth in exports, which the Indian engineering sector was witness-ing in the last two fiscals.
The fall in exports has been majorly attributed to the rapid spread of the disease across the globe and subsequent stoppage of manufacturing activ-ity in different countries, which resulted in mass cancellation of orders. At the same time, the shut-down in Chinese factories implied shortage of key inputs for Indian engineering exporters. Addi-tionally the strict lockdown within India resulted in the absence of labour and logistics. Exporters were unable to transport their finished products and raw materials to and from ports.
Amidst such issues, there is one silver lining for the Indian exporters – diversification of the glob-al supply chains beyond China. As the pandemic first affected the industrial city of Wuhan, which caters to a significant percentage of China’s indus-try, global supply chains across several product categories including engineering faltered. Conse-quently, it highlighted the problems of over-de-pendence on China. As a result countries across the world are now looking towards diversifying their supply chains to countries other than Chi-na which may include Brazil, Mexico, India, other South Asian and Southeast Asian countries. This is already evident from the fact that we at EEPC India are in constant touch with our Missions abroad who are getting us connected to potential buyers in traditional as well as new markets. This is, therefore, a golden opportunity for the Indian engineering exporters to expand their footprint globally.
The question now remains whether the Indi-an exporting community is in a position to grab these new opportunities. Sadly the current sce-nario is not so positive. While both the central and the state governments have done a wonderful job in containing the pandemic, the lockdowns came at a severe economic cost to the exporters who are facing issues mainly in three areas: access to labour, logistics and capital.
The state governments are sceptical in issuing passes for workforce in the factories. Currently most of the states are only allowing permits to 10-15 percent of the workforce whereas the industry’s requirement remains close to 35-40 percent.
Most engineering exporters in India are MSMEs. They are finding it very difficult to maintain their cash flow and make payments such as salary, rent, etc. While the RBI has allowed the banks to impose moratorium on loans, banks are slow in extending the benefits. Even when they extend, exporters are sceptical to avail the benefits since it may lead to significant interest burden. As the possibility of extension of lockdown becomes clear, the bur-den of payment is bound to increase and several companies may face solvency issues in the coming months. We feel that a moratorium along with an interest waiver scheme for at least a few months would prove to be beneficial for all industrial sec-tors in such a situation.
Finally, I would like to mention that, with the gradual opening up of the USA and EU countries such as Italy, Spain, and Germany, this is the most opportune time for the Indian engineering in-dustry in the international markets. If India can-not gear up at this point, it may lose important markets to competitors. While we laud the Indian government for coming in support of the indus-try, we hope that further actions will be brought into force to alleviate the above-mentioned issues. With the support we are sure to turn the tide and take the current situation in our stride.
Ravi Sehgal
5 I MONTHLY MUSINGS
73 I EEPC INDIA OFFICES
74 I EEPC INDIA CALENDAR OF EVENTS
Diversification of global supply chains beyond China
SPOTLIGHT
COVID combat: EEPC adopts Hazra market
EVENT SPECIAL
Countries all over the world are looking for new markets to offset their overdependence on China as a crucial hub for supplies
12
06
14While India has a healthy equity market, the corporate bond market has not really taken off, despite long years of effort by the authorities
Need for a corporate bond market
EXPERTEYE
48The last month of fiscal 2019-20 witnessed a fall in engineering exports spurred mainly by the continuing COVID-19 crisis
Pandemic spurs fall in engineering exports
OVERSIGHT
Advanced light-weight materials
TECH FRONTIERS
CSIR-AMPRI have developed and are in the process of developing light-weight materials that are in demand in a wide range of industry sectors – from sports goods and automobiles, to medical, aerospace, electronic and optical components, to name a few
20
Manufacturers the world over are repurposing their product lines to produce crucial medical and healthcare products
Rising to the occasion
38FOCUS ICOVID-19 PANDEMIC

6 l INDIAN ENGINEERING EXPORTS l MAY 2020 MAY 2020 l INDIAN ENGINEERING EXPORTS l 7
Diversification of global supply chains beyond ChinaCountries all over the world are looking for new markets to offset their overdependence on China as a crucial hub for supplies
SPOTLIGHT
COVID-19 IMPACT
THE rapid spread of the COVID-19 outbreak has been termed as the Black Swan of 2020 – an unpre-
dictable event with an impact much be-yond what is normally expected of the
situation. The event has compelled sever-al countries around the world to impose complete or partial lockdowns, thereby bringing movement of people and goods across borders to a screeching halt. Most of all, it has impacted the manufacturing industry in China, the crucial partici-pant in various important global supply
chains. The severe negative impact of the pandemic is evident in a WTO press re-lease of 8 April 2020.
Over the last two to three decades as China developed its manufacturing prowess, it emerged as the preferred world production centre and consolidat-ed its leadership position in the global
trade and supply chains. However, as the spread of COVID-19, a disease originat-ing from Wuhan, China, disrupted Chi-
nese manufacturing and global supply chains, a lot of attention is drawn to-wards how the global supply chains have
been over-dependent on China. Even as China proclaims to have controlled the pandemic by coming out of lockdown and starting economic activities, several countries including the USA have become sceptical of such supply chain shocks that may again emerge in future due to the growing overdependence on one source. Countries, therefore, are looking into alternative sources of import. It is expected that in the post-COVID scenar-io, several countries may emerge in that position. Does India’s engineering sector have the potential? Can India take this opportunity to emerge as an alternative source of engineering inputs to China in non-traditional markets such as Africa, Latin America, or CIS? This article tries to answer these questions.
Some points of the Trade Statistics Outlook in the WTO press release of 8 April 2020
• World merchandise trade is set to plummet by between 13 and 32 percent in 2020 due to the COVID-19 pandemic
• Nearly all regions will suffer double digit declines in trade volumes
in 2020, with exports from North America and Asia hit hardest
• Trades will likely fall steeper in sectors with complex value chains, particularly electronics and automotive products
EEPC INDIA
GLOBAL SUPPLY CHAINS: OVERDEPENDENCE ON CHINAChina provides the bulk of components, processes, raw materials, and subsystems for several major industries including automotive, electronics, medical equip-ment, machinery, and consumer goods across the world. In this section we look into the extent of China’s integration into the global supply chains through the Grubel-Lloyd Index.
The Intra-industry Trade Index or the Grubel-Lloyd Index measures the extent of intra industry trade in a particular sec-tor between two countries. Nations can hugely benefit from intra-industry trade due to economies of scale. The formula for calculating the index is as follows:
Gli = 1- |Xi- Mi|/ (Xi + Mi), where Xi = Exports; Mi = ImportsIf Gli = 1, there is only intra-industry tradeIf Gli = 0, there is no intra industry trade
The extent of China’s current economic integration as measured by the Grubel-lloyd Index is shown in Figure1. As is
evident from Figure1, there is high in-tra-industry trade between China and the World in some of the major engineer-ing sectors and the highest intra-indus-try trade is evident in the auto and auto component sector. Therefore, it can be
concluded that Chinese manufacturing is essential to several supply chains in the engineering industry and any disruption in China’s supply in these sectors is ex-pected to have a ripple effect on the pro-ducers in the rest of the world.
84
72
80
90
85
91
81
87
0.00 0.20 0.40 0.60 0.80 1.00
Source: Authors’ calculations from ITC Trade Map
Industrial machinery
Iron and Steel
Tin and articles thereof
Electrical machinery
Medical and scientific instruments
Clocks and watches and theirparts
Other base metals and their products
Automobile and auto components
Figure1: China’s integration in global value chains across sectors

8 l INDIAN ENGINEERING EXPORTS l MAY 2020 MAY 2020 l INDIAN ENGINEERING EXPORTS l 9
CURRENT STATUS OF CHINA’S MANUFACTURING INDUSTRYThe Covid-19 pandemic has significant-ly slowed China’s manufacturing capa-bility. The most recent data from China indicates a substantial decline in output. In February 2020 China’s Manufactur-ing Purchasing Manager’s Index (PMI) for production, a critical production in-dex, fell by about 22 points when com-pared to February 2019. This is shown in the Figure2. The figure further indicates that this had a direct impact on the man-ufacturing PMI for new export orders as that also plunged in February 2020. In fact such a decline implies a reduction in exports of about 2 percent on an annu-alised basis.
Even as the Chinese leadership pro-claims to have control over the pandem-ic and partially comes out of lockdown, companies inside the country still face difficulties in resuming production due to several factors including shortage of labourers still trapped in locked-down parts of the country, shortage of parts suppliers, stringent regulations in im-plementing social-distancing norms, and lack of adequate protective gear for the employees. Even resumption of logistics activities is slow. In such a scenario, it is becoming difficult for Chinese companies to fulfil the exist-ing export orders, thereby affecting the manufacturing capability of other countries.
Additionally, even as the Chinese manufacturing opens, the spread of the disease across Europe and USA en-sures partial lockdown in those regions which has a domino effect on global supply chains. A recent article in Dip-lomat1 shows how factories in China struggling to reopen after the COV-ID-19 shock face new threats from the US-Anti Disease Control that threat-ens the supply of microchips and other components to China. The article fur-ther states that Chinese manufacturers assemble 80 percent of smart phones for
companies such as Apple, Samsung etc, half of the world’s personal computers, and a big share of home appliances and other goods. However, for this they are dependent on processor-chips and high value components from America and Korea. A full or partial closure of fac-tories in these countries would, there-fore, have direct impact on the manu-facturing capabilities of China. Similar instances are also present for Europe. So, even if the Chinese manufacturing resumes, it would take some time for it
to actually regain its original position.To counter these issues, many coun-
tries have been scrambling to find al-ternative sources for imports from countries such as Mexico, Brazil, India, etc. For Indian engineering exporters this is really an opportunity to step up their actions into new markets, which were until now dominated by Chinese suppliers especially in the Africa, Latin America, and CIS regions and expand their presence in traditional European, Asian, and American markets.
POTENTIAL REGIONS FOR EXPORTS FROM INDIA In the next section, we look into these regions, both non-traditional and tra-ditional markets, for India’s engineering exports, their dependence on China for engineering imports and whether India can emerge as an alternative source of import for these regions.
AfricaAfrica is heavily dependent on China for industrial components and manu-factured goods. As per a recent research paper by Baker McKenzie and Oxford Economics, African imports from out-side the continent reveal that industrial machinery, manufacturing, and trans-port equipment constitute over 50 per-cent of Africa’s combined needs. The most important suppliers in this regard are Europe (35), China (16), and the rest of Asia, including India (14) percent, re-spectively. As such, disruptions due to the impact of COVID-19 will lead to a de-crease in the availability of manufactured goods imported into Africa.
Adding to the supply chain challenges are the travel restrictions that have been imposed by several African countries, in-cluding, most recently, South Africa, on citizens from high risk countries. This is causing further uncertainty in a conti-nent already grappling with widespread geopolitical and economic instability. Africa is also facing reduction in demand for raw materials produced in the Chi-nese market due to decline in manufac-turing activities in China.
Africa is considered to be the next emerging destination for Indian engi-neering sector exports that have wit-nessed impressive growth. Between 2017 and 2018, India’s engineering exports to Africa increased more than 17 percent. However, among India’s top 25 destina-tions, only two African countries feature – Nigeria and South Africa – and a large potential remains untapped. For instance, while East Africa is geographically one
of the closest regions to India with large markets such as Kenya and Tanzania, these countries do not feature in India’s top export partners’ list. The monthly re-ports from the Embassies in the African region also show considerable scope for Indian engineering exports in areas such as medical instruments, pharmaceutical machineries, agricultural machineries, printing machineries, and so on.
Latin America and Caribbean Region (LAC)The outbreak of COVID-19 is a source of volatility and a threat to the macroe-conomic stability of Latin America and the Caribbean. Latin America and the Caribbean have significant links to Chi-na, trade and economic links have sky-rocketed recently as China is already the second largest trading partner. China’s six main trading partners in Latin America and the Caribbean are Brazil, Argentina, Chile, Peru, Colombia, and Venezuela, whose exports are concentrated in four products that represent 75 percent of the total Latin American exports – soy, copper, crude oil, and iron ore. China represents 28.1 percent of total Brazilian exports, as well as 10.5 percent of Argen-tina’s and 32.4 percent of Chile’s exports. Although China mainly imports primary products such as minerals and metals, ag-ricultural products and fuels, its exports to LAC consist of machines and electrical equipment, textiles, chemicals, and met-als. In fact in engineering, China is the largest exporter to the LAC region with almost 25.3 percent share. Thus a slow-down in the Chinese economy will have a strong impact in countries such as Brazil, Chile, and Peru.
India’s share in LAC’s total engineering imports is only 1.2 percent. Our recent analysis on potential export markets for India show that the main trading part-ners of the LAC region mentioned here can also provide huge potential to be-
come important export destinations for India’s engineering sector given their sig-nificant engineering demand. Among all the Latin American nations, only Brazil feature in the top 25 list of India’s ex-port destinations. India can cautiously make its presence felt in these markets in the aforementioned demanding sectors. Some of the major potential markets for India remain Argentina, Chile, Colombia, Peru, and Ecuador.
As per the recent monthly economic reports by the Indian Mission in vari-ous LAC countries there is substantial scope for Indian exports in the auto-motive, metals, and machinery sector. It needs to be mentioned that the LAC has already understood the need to engage with non-FTA partners such as India to diversify their supply chains beyond Chi-na. Consequently Brazil, Argentina, Co-lombia, Ecuador, Paraguay, and Dominic Republic have reduced import duties of the engineering products to 0 percent as a temporary measure and India can take advantage of the tariff elimination to boost its exports.
Commonwealth of Independent States (CIS)Based on the WTO analysis, the CIS re-gion will be spared double-digit decline both in exports and in imports in 2020. The relatively small estimated decline in exports stems from the fact that countries from these regions rely heavily on exports of energy products, demand for which is relatively unaffected by fluctuating pric-es. If the pandemic is brought under control and trade starts to expand again, most regions could record double-digit rebounds in 2021 of around 21 percent in the optimistic scenario and 24 percent in the pessimistic scenario. Russia, one of the largest trading partners among CIS nations, will be under pressure from quarantine measures in the European Union – the EU countries account for 43
SPOTLIGHT
Manufacturing PMI Production Index
Manufacturing PMI New Export Orders
Janu
ary
2019
Janu
ary
2020
Febr
uary
201
9
Febr
uary
202
0
Sept
embe
r 201
9
Octo
ber 2
019
Nove
mbe
r 201
9
Dece
mbe
r 201
9
Augu
st 2
019
Mar
ch 2
019
April
201
9
June
201
9
July
201
9
May
201
9
55
50
45
40
35
30
25
Source: https://unctad.org/en/PublicationsLibrary/ditcinf2020d1.pdf
-22 Points MoM
Figure2: China’s manufacturing PMI for production and new export orders
10 l INDIAN ENGINEERING EXPORTS l MAY 2020 MAY 2020 l INDIAN ENGINEERING EXPORTS l 11
lifting lockdown on some economically key sectors, the exporters have urged the authorities to look at export as an essen-tial commodity to restart the economy in these difficult times.
Furthermore, India’s dependence on China in key engineering sectors is also a cause for concern for our industries. A re-cent report by the HDFC Bank on Assess-ing the Impact of COVID-1910 accepts this problem and suggests the development of a holistic ecosystem in the country that not only focuses on assembling of key products but also manufacturing of these products within the country. India should also look towards increasing their diplo-matic and economic cooperation with the countries mentioned so as to strengthen their relations. In the long run India can really complete signing of key FTAs with African regions including SACU (South African Customs Union) and COMESA (Common Market for Eastern and South-ern Africa), Eurasian Economic Union (EAEU), and the LAC countries including Peru. At the same time it should also ex-pand existing PTAs such as the MERCO-SUR and Chile PTAs. These steps would help these countries to diversify their im-port bases to India thereby strengthening India’s position in case of such future ex-igencies.
Notes 1. https://thediplomat.com/2020/03/chi-nese-factories-face-new-threat-us-anti-vi-rus-controls/2. https://www.japantimes.co.jp/news/2020/03/06/business/japan-aims-break-supply-chain-dependence-china/#.XqL_fcgzbIU3. https://www.japantimes.co.jp/news/2020/03/06/business/coronavi-rus-south-korean-tech-vietnam/#.XqMcf8g-zbIU4. https://www.livemint.com/industry/man-ufacturing/global-firms-look-to-shift-from-china-to-india-11587494725838.html5. https://www.japantimes.co.jp/news/2020/03/06/business/coronavi-
rus-south-korean-tech-vietnam/#.XqMcf8g-zbIU6. https://asean.org/storage/2020/04/ASE-AN-Policy-Brief-April-2020_FINAL.pdf7. https://www.economist.com/chi-na/2020/02/29/covid-19-is-teaching-hard-lessons-about-china-only-supply-chains8. https://www.wsj.com/articles/pandem-ic-makes-u-s-china-economic-breakup-
more-likely-u-s-businesses-in-china-say-115871139269. https://www.cnbc.com/2020/04/21/sup-ply-chains-will-move-away-from-china-af-ter-coronavirus-mark-mobius.html10. https://retail.economictimes.indiatimes.com/news/industry/covid-19-india-can-replace-china-as-global-sourcing-base/74458859
SPOTLIGHT
percent of Russia’s foreign trade.India can very well tap into these mar-
kets where there is adequate demand, which is not getting filled. In fact, India’s engineering exports to Russia accounts for more than 60 percent exports to CIS region. Thus India needs to engage more with these countries and conduct B2Bs, which will help in increasing engineering exports from India. However, demand for engineering goods is also present in Kazakhstan, Ukraine and Belarus. In the weekly economic and commercial report of 19 April 2020, the Indian Mission in Kazakhstan states that the government has already put zero duty on imports of socially important goods, personal protec-tive equipment, certain types of medical equipment, etc. Furthermore, the country is slowly restarting its major industrial en-terprises in the fields of construction and transport industries. With disruptions in Chinese supply chains Indian exporters can find opportunity to penetrate these markets.
Asian marketsIn Asia too, major industrial countries such as Japan and Korea are looking to-wards diverting their supply chains be-yond China as the COVID-19 hit their supply chains hard. A recent article in the Japan Times states that Japan has already empanelled a State Investment Council chaired by the Prime Minister, which will consider encouraging manufacturers to source from markets other than China.2 This decision has been heavily influenced by the huge loss Japanese manufacturers faced as Chinese manufacturing declined during this pandemic. This has been most evident in the automobile sector which is heavily dependent on auto parts sourced from China.
In Korea, several industries are reeling under the impact of declining manufac-turing in China. Recent news articles state that manufacturers of key components for smartphones and other electronic devices in the country have been significantly im-
pacted.3 Indian exporters in the electron-ic parts and components sector already mention a rise in demand from Japan and South Korea, which is a very positive step for India.4
ASEAN markets are significantly de-pendent on China in trade and investment and the COVID-19 outbreak severely impacts their industrial sectors. Most im-portantly overdependence on China has disrupted ASEAN’s capacity to fulfil their export orders in other markets. For in-stance, supply chain disruptions in China meant drying up of resources in Vietnam-ese plants manufacturing and supplying key components to South Korean smart-phone manufacturers.5 The recent ASEAN Policy Brief strongly recommends diversi-fication of both export and import prod-ucts as well as markets to reduce the im-pact of such pandemics on supply chains in the future. All these factors, therefore, present significant opportunities for In-dian engineering exporters in key Asian markets.6
EuropeEuropean markets, especially those of Ger-many, UK, and France, are heavily reliant on China for components and parts in in-dustrial machinery, electronic machinery, and automotive sectors. Reeling under the supply chain disruptions, European coun-tries are also looking towards diversifica-tion of import bases. In a recent interview by the head of European Union Chamber of Commerce in China it was stated that China’s dominance in certain sectors is a cause of concern in Europe especially in recent times. It was further mentioned that while companies across Europe are finding it difficult to identify new import bases with similar infrastructure as China, they have understood the need to diversify in the present situation.7
USAAccording to a recent article in the Wall Street Journal, the American Chamber of Commerce in China and Shanghai have
stated that the Coronavirus pandemic has made the decoupling between US and Chinese companies easier. There is a grow-ing sentiment among US companies to di-versify their supply bases. A survey by the chambers show that in March 2020 only 44 percent of 25 large US companies in China said decoupling would be impossi-ble as against 66 percent in October 2019.8 Industry experts in the USA proclaim that while a lot of diversification will happen domestically and to local overseas markets such as Canada and Mexico, there would be substantial scope for countries such as Brazil, Vietnam, Bangladesh, or India.9
What can India do to take these opportunities?The Indian government, realising the pos-sibilities for expansion of export markets, has tasked the Indian missions located in the regions mentioned to come up with potential areas where India can intervene in the absence of Chinese supplies. The missions have been directed to contact key export councils and associations so that queries can be taken up by the re-spective member exporters. As the major representative of the Indian engineering export industry, EEPC India has also re-ceived several queries in this respect and contacted key member exporters who can take up these queries. The missions have even helped the exporters to get in touch with the buyers in the respective markets. Additionally the government has also set up a DGFT Help Desk to resolve any ex-port-related queries in these regions.
These measures have been welcomed by the exporting community. However, intensified lockdown in the transport and logistics sector disrupted movement of key consignments from the factories to ports and key inputs from ports to factories. Companies are increasingly facing diffi-culties in fulfilling existing export orders. In such a scenario even if India gains new opportunities in these markets it would be difficult for the exporters to fulfil the or-ders. Now as the government is gradually

12 l INDIAN ENGINEERING EXPORTS l MAY 2020 MAY 2020 l INDIAN ENGINEERING EXPORTS l 13
EVENT SPECIAL EVENT SPECIAL
COVID-19: EEPC India adopts Hazra market
Following the West Bengal government’s decision to appoint EEPC India to adopt Hazra Market in Kolkata in the campaign to combat COVID-19, EEPC India has taken over the sanitisation project of the market. The task was entrusted to EEPC India by the Chief Minister of West Bengal, Ms Mamata Banerjee, over a Consultation Meeting with Trade Bodies and Councils on 9 April 2020 at Nabanna. The Chief Minister had requested different industry bodies and councils to come forward to ensure proper sanitisation arrangements at the selected market spots in Kolkata as one of the remedial measures to prevent the spread of COVID-19. On 18 April, Mr Sobhandeb Chattopadhyay, Minister for Power & Non Conventional Energy sources, West Bengal, joined Mr Ravi Sehgal, Chairman, EEPC India, in the distribution of hand sanitisers, masks, hand gloves, temperature measuring devices and so on to members of the Hazra Boys Association at Hazra MarketThe EEPC India Chairman said, ‘This is a month-long endeavour and so far EEPC India has distributed 550 face masks, 150 hand
gloves and 30 litres of hand sanitisers.’ Mr Dhrubo Jyoti Basu, Senior Joint Director, EEPC India, said EEPC India officials were regularly visiting the market to check that all visitors were given sanitisers, their temperatures taken at the entry point, and everyone was using gloves and masks. EEPC India members have contributed to cover the costs. (1) Mr Sobhandeb Chattopadhyay, Minister for Power & Non Conventional Energy sources of Government of West Bengal, speaking to media during the handing over of sanitisation monitoring devices in Hazra Market in the presence of Mr Ravi Sehgal Chairman ( to the left of the minister), Mr Dhrubo Jyoti Basu, Senior -Joint Director (far left), and Mr Krishno Ganguly, Sr Assistant, EEPC India at Hazra Market. (2) Mr Ravi Sehgal, Chairman, EEPC India, taking the temperature of a visitor to the market. (3) Mr Ravi Sehgal, Chairman, EEPC India, handing over sanitisers, gloves, and masks to the Hazra Boys’ Association representative. (4) Random checking of temperature of visitors at the entry point of Hazra Market.
1
2
3
4

14 l INDIAN ENGINEERING EXPORTS l MAY 2020 MAY 2020 l INDIAN ENGINEERING EXPORTS l 15
EXPERTEYE
While India has a healthy equity market, the corporate bond market has not really taken off, despite long years of effort by the authorities
Need for a corporate bond market
THE traditional method of raising funds by a corporate has been to either bring in equity or raise debt
or both. Equity was brought in by the promoters or raised through the capital
market. Over the years, regulatory guide-lines, investor appetite, and orderliness in the equity market have helped in sta-bilising this route for raising equity. For debt, the obvious choice was to approach financing institutions. It could be banks for working capital requirements or spe-cialised institutions called development financial institutions (DFIs) such as IC-ICI, IFCI, and IDBI earlier and subse-
quently established sector-specific DFIs like Exim Bank and SIDBI for raising long-term loans for the projects. NBFCs and financial intermediaries like MFs also pitched in.
Over a decade ago, banks also started extending long-term loans, particularly for infrastructure requirements. Raising debt from the public was never a popular or a successful experiment. Companies
Prof. Shastri is a former Banker based in Bengaluru
TR SHASTRI
issued debentures but these instruments were not popular. Either there were in-stances of public being taken for a ride by unscrupulous companies or the in-terest rates were not attractive enough. The secondary market was never active and hence investors faced liquidity issues. Sweeteners like debenture being fully or partly convertible into equity shares, sup-ported by tangible security or favoured tax treatments also did not help in sus-taining the debentures as popular invest-ment instruments similar to equity.
There was another type of instrument called bonds. The difference between a debenture and a bond is not sharp. The terms are interchangeably used though certain market practices may differen-tiate depending on the class of issuer, availability of security, pricing, etc. The definitions differ from American and British usage perspective. Companies were also permitted to raise funds in the form of accepting deposits from public. These highly illiquid and unsecured in-struments did not find favour with the investors.
The original DFIs did not find the going smooth. There was concentration risk, mismatch of assets and liabilities and deterioration of quality of assets dur-ing the phases when the economy was not doing well. ICICI and IDBI transformed themselves into regular commercial banks to tide over these challenges. IFCI has a steadily shrinking balance sheet, de-clining operational income, and capital adequacy ratio and a comprehensive loss for the latest year. As much as 85 percent of the lending by SIDBI is in the form of refinance to banks, 8 percent is assistance to NBFCs and SFCs, and only the rest, i.e. 7 percent, is direct lending to other bor-rowers, for the latest year. For Exim Bank, direct lending ratio was 46 percent as per latest available data.
In banks, over 40 percent of the depos-its are callable on demand (like SB and CA deposits) and nearly 75 percent of the remaining term deposits have resid-
ual maturity of less than one year. Hence technically it is unwise for the banks to lend on long-term basis to any large ex-tent, though the ‘core’ part of these de-posits may mitigate the circumstances in practice. Thus, there appears to be none equipped to lend to projects on long-term basis. Thus, it looks like we have reached a stage where banks are reluctant to finance projects, there are no DFIs and public fundraising through debt instru-ments is not stabilised.
A leading financial newspaper men-tioned in January this year that conse-quently, ‘there has been a rising clamour for the government to set up a new DFI, to provide long-term capital for infrastruc-ture projects.’ However, the article argued that it is necessary to tackle the issues in-volved in raising long-term funds rather than creating a new DFI, which will only be another savings pool to invest in pro-jects. Present financial intermediaries are unable to raise long-term funds. The pa-per concluded that ‘this yearning for new DFIs is just an excuse to put off confront-ing the hard job of developing a market for corporate bonds.’
Investment pools like mutual funds and insurance funds have long-term deployable resources. They do invest in projects based on detailed appraisal, credit rating, and risk analysis. Howev-er, as a finance minister mentioned years ago, there is need to dis-intermediate the funding pattern of projects. In other words, there is need to raise debt directly from the retail investors subject to prop-er regulatory oversight. This will require the reshaping and rejuvenation of the moribund debentures as dynamic retail debt instruments and raising the share of the corporate bond market as a source of finance from the present ~4 percent, that too accessible mainly by large Indian companies.
Long-term lendingIt has been recognised since several years that long-term lending is a class with its
own special characteristics. The resourc-es available are to be of matching dura-tion. The lender or investor may prefer the originate to distribute model and not like to hold on to the assets till maturity and, hence, there has to be an active sec-ondary market to enable liquidity. More importantly, project finance has inherent risks beyond the usual textbook descrip-tions. Each large project is so unique that no appraisal can visualise and fully risk-proof it. Hence a financial intermediary may be doing injustice to resource pro-viders. In such circumstances, it is best that the retail investor directly takes the risk with an informed decision based on templated disclosure documentation is-sued under regulatory guidelines with the confidence of an active secondary market for liquidity concerns. If the perceived risk is compensated by the risk premium loaded in the coupon rate in the form of spread over the ongoing interest rate, the residual uncertainty for the investor will be the base interest rate. The pricing in the secondary market will reflect this and will normalise the yield to the investor. This looks fine conceptually but issuing debt instruments in this way faced chal-lenges from time to time.
Several committees have examined the issues relating to developing this debt instrument for companies, popularly referred to as corporate bonds, both in issuing (primary market) and in subse-quent trading (secondary market).
The high-level Expert Committee on Corporate Bonds and Securitisation (RH Patil Committee, 2005) recommended several steps to develop the primary mar-ket (standardising stamp duty, removing TDS, etc), broadening issuer class, en-hancing investor base, trade reporting system, order matching trading system with clearing, and settlement system etc. It even recommended steps for develop-ment of a securitised debt market.
The high powered expert committee on making Mumbai an International Fi-nancial Centre (Percy Mistry Committee,

16 l INDIAN ENGINEERING EXPORTS l MAY 2020 MAY 2020 l INDIAN ENGINEERING EXPORTS l 17
2007) set up by the government identi-fied that a liquid spot market for INR denominated corporate bonds is one of the most critical financial market compo-nents missing in India. It recommended that no limits should apply to purchases by foreign clients of INR denominat-ed corporate bonds; short selling of the bonds to be permitted enabling to derive an arbitrage free yield curve etc.
A Hundred Small Steps (report of Raghuram Rajan Committee, 2009) rec-ommended allowing domestic financial institutions greater leeway to invest in corporate bonds, raising limits on foreign investment in corporate bonds, reducing transaction costs in issuing and trading (including stamp duty) etc. Banks pre-ferred loan to, rather than investment in, bonds of a company since the former need not be valued, provided for and capital earmarked. Hence an interesting recommendation was for ‘reducing the artificial preference of banks for loans by subjecting loans and bonds to similar mark-to-market requirements, especially for aspects such as interest rate exposure that are easily measured.’
New Thinking on Corporate Bond Market in India (Union Finance Min-istry, 2011), a working paper on this topic of strategic economic policy, aca-demically discussed the issues involved. Its generic recommendations included ‘the policymakers must apply quantum forces to break the vicious circle of low level participation and poor liquidity.’ It included suggestions on effectiveness of credit rating agencies and SIDBI offering Repo window to market makers dealing with SME bonds.
The Working Group on Development of Bond Market in India (HR Khan Committee, 2016) made a number of recommendations across all relevant is-sues including already highlighted issues like rationalisation of stamp duty, allow-ing enhanced institutional and foreign investments, repositories etc. It recom-mended banks and NBFCs providing
partial credit enhancements (i.e. support in the form of guarantees) to higher than then allowed 20 percent and not neces-sarily only for infrastructure companies as then prevailing. However, it did not specify the ceiling and did not discuss the implication of corporate bond essential-ly becoming a bank bond from risk per-spective if the percentage is large. It even made a list of key recommendations of earlier committees/reports not fully im-plemented by then.
RBI went one step further and set up a Task Force on the Development of Sec-ondary Market for Corporate Loans (TN Manoharan, 2019). Its terms of reference included making recommendations for facilitating the development of a second-ary market in corporate loans, including loan transaction platform for stressed assets. The report noted that when its recommendations are implemented, it could further facilitate the development of the corporate bond market as well. It summarised that corporate loans would not have the degree of liquidity current-ly enjoyed by corporate bonds, though it did not quantify the degree of liquidity currently enjoyed by corporate bonds.
Asian Development Bank had brought a report ‘India’s Bond Market: Develop-ments and Challenges Ahead’ in 2008. TheCityUK, an industry-led body rep-resenting UK-based financial and related professional services, published a report in 2015 titled ‘IUKFP: Development of a Corporate Bond Market’ focusing on increasing the depth of the bond market in India as well as making it easier for Indian companies to issue bonds over-seas. The World Bank had brought out a report on Developing India’s corporate bond market in 2016. CRISIL, CCIL and many other agencies have also brought out reports on this subject over the years.
What the Deputy Governor of RBI mentioned in one of his speeches can be taken as the overview on this subject. He had said,
‘... the fact that I spoke about the same
issue at the same forum three years back and many other fora earlier reflects the deep-rooted, inertial nature of under-lying factors. At least for more than 10 years now, development of corporate bond markets in India has been the fo-cus of all stakeholders but the arduous pursuit of the ‘holy grail’ has not deliv-ered desired results. In the process this has unfortunately become a convenient stick to flag the policy and regulatory in-tent. Every set of stakeholders has its own views on what needs to be done but much of the prognosis ends up giving a limited perspective.’
He mentioned this in 2015 and the situation remains more or less the same even now. The latest SEBI report con-firms this with its remarks that ‘There is no doubt that the equity market in India is quite well developed and plays a cru-cial role in the growth of Indian econ-omy. Government Securities market in India has also experienced a tremendous growth in the last decade. Despite a lot of policy and regulatory attention in the past, the corporate debt segment in India still requires lot of focus on its develop-ment so as to make it more liquid.’
Equity marketThe Indian equity market is well devel-oped and follows global best practices. India’s contribution to total global mar-ket capitalisation stood at 2.6 percent compared with the 10-year historical average of 2.56 percent. It stands within the top ten global equity markets in terms of market capitalisation. As per the latest SEBI annual report, NSE ranked second globally in terms of number of trades in equity shares while BSE ranked 11th. In-dia accounted for 6 percent of the total number of IPOs made globally during 2018 and 9.9 percent of the total number of IPOs made in the Asia-Pacific region. In quantum of capital so raised, the per-centage was 2.7 and 5.2 respectively. NSE ranked first among the global equity de-rivatives exchanges in terms of number of
stock index options contracts traded. NSE and BSE occupied the top two slots in the number of currency derivatives contracts traded. Derivatives on the USD-INR pair traded on BSE and NSE accounted for four slots including the first. Nifty Bank Index Options contracts and Nifty 50 Index Options contracts ranked first and third respectively among all the stock index options contracts traded global-ly. Multi Commodity Exchange of India
Ltd (MCX) stood at the eighth position among the global derivatives exchanges in terms of commodity derivatives con-tracts traded. MCX ranked fourth among global derivatives exchanges in terms of both the derivatives contracts traded on non-precious metals and the derivatives contracts traded on precious metals.
The establishment of the present market regulator in 1992 followed by the introduction of global standards
enabled healthy and orderly growth of these segments of the capital market. The government or the regulator neither formed sequential multiple committees nor took steps to synthetically grow the equity market. The market attracted in-vestors and grew naturally. Hence it is of concern to observe why the corporate debt market has not grown and become popular equally, particularly at the retail level.
CORPORATE BOND MARKETActually, there is a corporate bond mar-ket at present. As per RBI bulletin, the corporate debt market in India remains small, accounting for nearly 17 per-cent of GDP, compared to 123 percent in the USA, 44 percent in Malaysia, and 19 percent in China as at June 2018. As per the latest annual report of SEBI, the current year witnessed Rs6,10,318 crore raised through 2358 issues by the way of private placement listed at BSE and NSE while there were 25 public debt issues worth Rs36,679 crore in 2018-19. In the secondary market, the equity derivatives segment constitutes the highest market share of 86.7 percent, followed by cur-rency derivatives (5.8), equity cash seg-ment (3.2), commodity derivatives (2.7), corporate bonds (1.5) and interest rate derivatives (0.1) percent, respectively, indicating a low share of the corporate bond market.
Apart from the size, some of the areas of concern are: • The demand for corporate bond as an investment is mostly confined to insti-tutional investors with retail investors accounting for only 4 percent of the out-standing issuances • Nearly 99 percent of the debt is placed privately • Finance and infrastructure companies together accounted for over 90 percent of total cumulative value outstanding dur-ing 2017-19. The share of manufacturing
was less than 1 percent. RBI data confirms that more than 85
percent of corporate bond issuance in India is by borrowers with ratings of ‘A’ and above. The Rajan Report of 2009 confirms these by mentioning that ‘Most of the large issuers are quasi-government, including banks, public sector oil compa-nies, or government sponsored financial institutions. Of the rest, a few known names dominate. There is very little high yield issuance, and spreads between sov-ereign debt, AAA debt and high yield debt are high in comparison to other markets. Very few papers trade on a regular basis. Trading in most papers dries up after the first few days of issuance, during which the larger players ‘retail’ the bonds they have picked up to smaller pension funds and cooperative banks. Most trading is between financial institutions.’ In other words, a yet to be well-rated manufactur-ing company raising funds in corporate bonds market from retail investors and its trading like in equity market are un-common.
Causes for shallow corporate bond marketCommittees have enlisted the reasons for poor volume of funds raised by corpo-rates through bonds and also the reasons for poor trading of such bonds in sec-ondary market. While some of the issues have been addressed by the authorities,
there are still demands both on demand (investors) and supply (issuers) side of these bonds. The stamp duty on these instruments is not uniform across all States. Moreover, for an efficient trading of these bonds, the cost should be very low implying whether the stamp duty can be dispensed with or made significantly low. This is an issue pending for long. In fact, the latest Manoharan Commit-tee has devoted four paragraphs for this long-pending issue. Proposal for credit enhancement fund is being discussed over four years and has not yet fructified. Regulatory constraints on the quantum and type of investments by institutions like pension funds, foreign investors and though marginal, MFs and insurance companies still exist.
However, there appears one other ma-jor reason, which none of the commit-tees have examined. The equity market is very active because the investors look for capital appreciation during price fluctu-ations. Considering the high PE ratio, an investor will not get a satisfactory RoI un-less the market price appreciates. Inves-tors in currency market do not have any ‘return’ like dividend or interest on the investment, unless it is a foreign currency denominated money market instrument, which is not accessible to Indian inves-tors. It is purely the price fluctuation that attracts the investor. This is true for com-modity market and also for the short term
EXPERTEYE

18 l INDIAN ENGINEERING EXPORTS l MAY 2020 MAY 2020 l INDIAN ENGINEERING EXPORTS l 19
Important guidelines on Partial Credit Enhancement (PCE) to corporate bonds by banks
1. With a view to encouraging corporates to avail of bond financing, banks can provide PCE to bonds issued by corporates/special purpose vehicles (SPVs) for funding all types of projects.
2. Bonds issued for funding projects by corporates/SPVs do not necessarily get high ratings from the Credit Rating Agencies, because of the inherent risk in the initial stages of project implementation. Insurance and provident/pension funds, whose liabilities are long term, may be better suited to finance such projects. The regulatory requirement for insurance and provident/pension funds is to invest in bonds of high or relatively high credit rating.
3. The objective behind allowing banks to extend PCE is to enhance the credit rating of the bonds issued so as to enable corporates to access the funds from the bond market on better terms.
4. Banks can provide PCE to a project as a non-funded subordinated facility in the form of an irrevocable contingent line of credit which will be drawn in case of shortfall in cash flows for servicing the bonds and thereby improve the credit rating of the bond issue. It cannot be in the form of a guarantee. The documentation for the facility must clearly define the circumstances under which the facility would be drawn upon.
5. The aggregate PCE provided by all banks for a given bond issue shall be limited to 50 percent of the bond issue size (per bank max 20 percent). Each bank’s exposure is limited to 5 percent of the single group exposure limit. Aggregate of bank’s exposure should not exceed 20 percent of its Tier 1 capital. Recording the accounting exposures, capital provisions etc., are similar to other credit limits.
• Interestingly, when this facility was introduced initially in September 2015 it was 20 percent but it was enhanced to 50 percent in August 2016, even though ‘no such PCE has been provided till date by the banks.’
6. Banks may offer PCE only in respect of bonds whose pre-enhanced rating is BBB minus or better (by a minimum of two external credit rating agencies at all times).The project should have a robust and viable financial structure. Banks should exercise necessary due diligence and risk appraisal and should not entirely rely on the ratings with a system of regular (quarterly or half-yearly) tracking of the financial position of the issuer.
7. Additional guidelines for systemically important NBFCs and HFCs.
8. Banks are expected not to invest in corporate bonds which are credit enhanced by other banks or by themselves.
money market like T bills. In all these market segments, the underlying variable – equity price, currency exchange rate, commodity price, and short term interest rate – all fluctuate quite well. This gives scope for ‘forecasting’ or ‘speculating’ on the price and hence trading takes place. Corporate bonds are long-term instru-ments and in our financial market, long-term interest rates do not fluctuate much in short horizons. The long-term interest rate is generally much higher than short term interest rate. Hence if there is an instrument whose price depends solely on long-term interest rate, its price will
remain stable. Thus, there is no incentive to the investor through price fluctuation.
The remedy appears to have the long-term interest rate also to fluctuate. But this cannot be done artificially. The re-cent Operation Twist conducted by RBI which involved simultaneous purchase of (long-term) securities and sale of (short-term) securities is helpful for this. This will bring correction in the yield curve by reducing the differential between the long and short-term bond yields. Essen-tially this will apply to G-secs. A corpo-rate bond is generally priced on the basis of price of G-sec of comparable tenure.
The longer end of the yield curve is pre-dominantly dominated by debt papers of public sector undertakings, financial institutions and select housing finance companies, while shorter end is dominat-ed by non-banking finance companies. The yield curve is fragmented because trading is concentrated in maturities of 10 years and in short term buckets. The trading in corporate bonds, being of var-ying maturities, will fill up this gap. As the SEBI Chief recently (but before RBI’s surprise operation twist) said, ‘The first issue is the fragmented yield curve. I feel the fundamental challenge is the absence
of a continuous corporate bond yield curve spanning across different maturi-ties and different rating buckets.’
Credit enhancement means essentially enhancing the credit quality or improv-ing the creditworthiness of the loan pro-posal by offering external instrumental support. This will enthuse the lenders and may favourably consider a loan proposal which was otherwise not acceptable be-fore such credit enhancement. Corporate guarantee, guarantee of directors, collat-eral security, coacceptance, letter of cred-it, and letter of comfort are examples of this synthetic strengthening. RBI has al-lowed banks to offer credit enhancement to corporate bonds partially, though it is not in the form of bank guarantee. There are a number of conditions, some of which are listed on page ..... It is partial because such partial credit enhancement (PCE) can be only up to 50 percent (orig-inally only 20 percent) of the bond issue size. Thus, for an investor, the credit risk is underwritten up to 50 percent. This is in vogue since the last four years but has not yet energised the corporate bond market, which means that there is a ba-sic aversion for retail investors to invest in corporate bonds. Interestingly, not a single PCE was done by banks during the first year and its usage in subsequent years is reported to be miniscule. For the last over a year, the attention of everyone stood diverted to similar credit guarantee scheme offered to nonbank lenders (i.e. rescuing NBFCs).
Steps taken to promote corporate bondsBased on the recommendations of the various committees, a number of steps have been introduced to activate the cor-porate bond market from time to time, e.g. introduction of DvP in settlement of OTC transactions, setting up reporting platform, banks allowed to issue long-term bonds for financing long-term pro-jects, banks and PDs becoming members of stock exchange to trade in such bonds,
FPI investment limits enhancement, simplification of disclosure and listing requirements etc. In the recent budget announcements, the finance minister specifically mentioned about the gov-ernment planning to increase investment limit of foreign portfolio investors (FPI) in corporate bonds from 9 percent to 15 percent. the government also mentioned that ‘The Credit Guarantee Enhancement Corporation fund is being set up as a Non-Banking Financial Company with partnership of IIFCL, LIC, PFC, REC and similar other companies. A CCEA Note in this regard is under process,’ though as per the previous budget ‘A Credit Guar-antee Enhancement Corporation for which regulations have been notified by the RBI, will be set up in 2019-20.’ This idea of credit enhancement fund is being discussed over several years. In the 2016-17 Budget speech, then finance minister had proposed that LIC will set up a ded-icated fund to provide credit enhance-ment to infrastructure projects. However, LIC could not anchor the proposed com-pany because of regulatory issues. There are now indications that this would be done through creation of a special pur-pose vehicle – the National Infrastructure Credit Enhancement Ltd or NICE Ltd, to be piloted by the IIFCL – though the current budget document still mentions about LIC’s participation. It may be not-ed that the PCE scheme has not made the bond market popular, even after allowing banks to offer such credit enhancement up to 50 percent. The latest budget doc-ument also assured that ‘Policy initiatives that are to be taken for development of bond market in India have been identi-fied. Steps are being taken by regulators and Govt. to deepen the Bond Market.’
The government recently said that it will take further action to develop the credit default swaps (CDS) markets in India, and will ask the RBI to initiate measures to increased trading in the bond market further. However, the mar-ket opinion is that ‘the CDS is unlikely to
gain popularity anytime soon. Except for a few foreign banks, nobody is comforta-ble with that instrument.’
What needs to be done furtherThere are contrasting expectations. Cor-porates, not necessarily the larger ones, need to raise debt funds from the mar-ket, directly from investors. It has to be under regulated conditions as, otherwise, unscrupulous entities will exploit and permanently spoil the market. The cost of raising such debt funds should be ac-ceptably low. Regulators could consider allowing regional issues. For example, for a small issue by a well-known entity in a state, the issue could be confined to inves-tors in that state, by having the issue doc-uments in regional language and issue efforts locally, reducing the cost. Retail in-vestors either directly or through invest-ment pools like MFs will need to invest in such instruments. While the coupon rate should be attractive enough to take care of the credit risk, the yield (on account of market price in traded secondary mar-ket) should be attractive and, more im-portantly, the yield should fluctuate to attract speculative investors. Investments by institutions are anyway a major part of the total. Authorities are also consider-ing further relaxations in their quantum limits. There could be monetary incen-tives like taxation benefits to individual investors (e.g. commencement of long-term capital gains, dividend distributed by debt MFs, exemption from TDS etc), eligibility as security including for RE-POs etc, till the corporate bond market stabilises. Such efforts to popularise the corporate bond market among retail investors will have a long-term impact. Unlike the earlier committee, the latest RBI task force (of 2019) submitted its re-port exclusively for developing a second-ary market in corporate loans. When its recommendations are implemented, the secondary market for corporate bonds hopefully will also get activated along with that for corporate loans.
EXPERTEYE

20 l INDIAN ENGINEERING EXPORTS l MAY 2020 MAY 2020 l INDIAN ENGINEERING EXPORTS l 21
TECH FRONTIERS
The Council of Scientific and Industrial Research and the Advanced Materials and Processes Research Institute (CSIR-AMPRI) have developed and are in the process of developing light-weight materials that are in demand in a wide range of industry sectors – from sports goods and automobiles, to medical, aerospace, electronic and optical components, to name a few
Advanced light-weight materials
APPLICATIONS OF LIGHT-WEIGHT MATERIALS
INTEREST in light-weight materials is increasing across industry and in re-search areas. Demand for light-weight,
high performance materials in the Au-tomotive, Aerospace, and Construction sectors and other related industries has increased multifold due to concerns in government regulations, environment, and consumer requirements.
Light-weight materials are a preferred choice for industries due to their weight reduction, energy savings, increased pay-off loads, savings of natural resources, improved performances and environ-mental control aspects.
Light-weight materials include poly-mers, ceramics, aluminium and its alloys, magnesium and its alloys, composites and ultra high strength steel. They suc-cessfully replace steel and cast irons, lead, brass, bronze parts, and heavy duty con-cretes with 20-80 percent reduction in weight.
Researches adapt suitable method-ologies such as improved alloy design, advanced processing technique, devel-opment in heat treatment schedule, ad-vanced casting, secondary processing, heat treatment etc and intelligent mate-rials and processing.
Intervention by CSIR-AMPRI towards further developments in these method-ologies are active in Al-alloys and com-
posites, Magnesium alloys and compos-ites, Al-foams, Carbon foams, Ti-foams, Foam core sandwich panels, Squeeze casting, EMF forming, and Shape mem-ory alloys.
Light-weight materials have found their applications across various domains – from sports goods and automobiles, to medical, aerospace, electronic and optical components. A few are listed here.Sports: Golf clubs, tennis rackets and the handles of archery bows, bicycle frame and the chassis of in-line skates
Automobiles: Engine block, wheels, steer-ing columns, seats, front consoles, and hoods, gearboxes, steering columns, and driver’s air bag housings as well as in
CSIR-AMPRI
steering wheels, seat frames, and fuel tank covers.
Medical: Biodegradable plates and screws for orthopaedic surgery
Aerospace: Magnesium can be found in the thrust reversers for the Boeing 737, 747, 757, and 767, as well as in engines and air-craft and helicopter transmission casings, intercontinental missiles and spacecraft.
Advantages of light-weight materials• Density: 1.75 to 1.8 g/cc (lightest struc-
tural materials, even lighter than FRP)• Room temperature strength equivalent to that of aluminium alloys• Lower cost, high damping capacity, vi-bration and noise reduction, improved EMI shielding• Huge energy savings, cost competitive, increase payoff load, biocompatible
Current problems• Highly reactive (greater safety and pre-caution to be taken during processing)• Poor high temperature stability • Inferior creep properties• Highly corrosive
Solutions• Melting and casting under controlled at-mosphere, reduce oxygen pressure over melt – (direct metal pumping to the mould – inert atmosphere in the mould)• RE and TE alloying addition – Pressure die casting: (thin walled casting), SPS (corro-sion resistant Mg alloy)• RE: Zr, Nb, Ce; TE: Ca, Mn, Zn; Coating: Anodising• CSIR-AMPRI has developed the capability of melting and casting of these alloys with-out any difficulty• Solid casting: Addition of 5wt% Si led to 50 percent improvement in strength of AZ91 alloys
MAGNESIUM ALLOYS AND ITS APPLICATIONS
High speed train• The newest train includes six passenger carriages, and the front end is tapered to a fine sword-like point• The power of this train is 22,800 kilo-watts • It is constructed of lightweight plastic (Mg alloy and reinforced with carbon fi-bre)
Benefits• 1/5th the weight of steel • RE and TE improve flame retardance, creep resistance, and corrosion resistance • Less noise and sound, good damping capacity
Mg-alloy melting• Simple flux melting and casting can be adopted• Parameters optimised for melting, bot-tom pouring would be best way• Thin wall casting could be done using low pressure die casting• AZ91 when added with 5wt% Si the hardness increase from 80 HV to 135 HV. • The same methodology could be adopt-ed for making composite and foamAZ91 + 0.3% Si (Micro structural refinement, almost 60 percent improvement in hardness/strength)
AZ91
AZ91+0.3% Si

22 l INDIAN ENGINEERING EXPORTS l MAY 2020 MAY 2020 l INDIAN ENGINEERING EXPORTS l 23
METALLIC FOAM AND ITS APPLICATIONS
Ti-foam: Bone implants, teeth grafting, catalyst, high temperature filters and high energy absorptions
Ni foam: Battery, heat exchanger
Al-foam and Copper foam: Heat ex-changer, gas scrubber, solar heat arrest-er, hydrogen storage, energy absorption, vibration and sound attenuation, light-weight structure
Brass foam for water treatment Major applications of metallic foam
Possible locations for Al-foam in automobile applications
Sandwich panels
Large size foam billets
Engine bracket
Foam Casting weighing 30kg
Foam filled tubes
Major applications of metallic foam
Closed cell aluminium foam
ALUMINIUM FOAM AND ITS APPLICATIONS
Load-bearingcomnponents
energy absorbers
soundabsorbers
closedpartially open
structural
functional
kind of application
type of porosity
open
heatexchangers
bio-medicalimplants
catalystsupports
bearingsfilters
silencers
Aerospace 6%
Transport26%
Engineering Manufacturing
5%Cmponent
Manufacturing 11%Material Manufacturing 10%Power Engineering 5%
Process Industries 3%
Research Education 16%
Others 18%
Blast resistance(Defense, civilian)
Ballistic resistance(Defense, civilian)
Jetties, Bridges, Ship hulls and cabins, flooring panels
(ship building and construction sectors)
Light weight portable huts (disaster management)
Gear box, engine bracket, door panels, chassis, pillars
(automobiles, rails)
Foam filled channels for light weight for light weight
structures
Closed Cell Aluminum Foam
Partition panels, and wall mounting panels (building
and construction)
Lightweight sandwich panels (ship building, rail,
construction sectors)
Noise and vibration attenuation (defense, automobile,rail,
engineering sectors)
Crash worthiness(Automobiles, rail)
TECH FRONTIERS

24 l INDIAN ENGINEERING EXPORTS l MAY 2020 MAY 2020 l INDIAN ENGINEERING EXPORTS l 25
FOAM SAMPLES AND MICROSTRUCTURE Factors affecting foams structure(i) Melt temperature(ii) Viscosity (concentration of thicken-ing agent)(iii) Cooling rate of foam structure
Benefits• Cost of foam reduced to Rs800 per kg• 200 g of cenosphere/fly ash per kg could be used
Aluminium foam property (comparison with internationally available foam)Sl no. Property AMPRI-foam Aluminium light foam
1 Yield strength/plateau strength (MPa) (compression) at strain rate of 0.001/s
4 – 25 3 – 26
2. Flexural stress (MPa) 5 – 25 5 – 28
3. Energy absorption (Mj/m3) 2 – 18
4. Density (g/cc) 0.20 – 0.7 0.2 – 0.75
5. Modulus (GPa) 0.2 – 5.0 0.15 – 5
6. Cell size (mm) 1.5 – 5.0 1.0 – 5.0
Foam core sandwich panelsSample Density of the sample (kg/m3) Load (kN) Bending stiffness (N-m2) Specific stiffness (m6/s2)
Bare foam 428.11 0.442 9.728 0.0227
With mounting 574.7 1.11 26.34 0.0458
With single layer 612.94 3.236 32.18 0.0525
With double layer 707.4 3.63 41.533 0.0587
Bare foam 365.32 0.501 12.18 0.033
With mounting 554.91 1.34 28.89 0.052
With single layer 603.17 3.3 36.31 0.0602
with double layer 651.58 5.33 62.26 0.0955
Bare foam 303 0.8 15.73 0.052
With single layer 501.3434 3.77 39.21 0.0782
45.00
45.00
45.00
45.00
45.00
45.00
45.00
45.00
45.00
45.00
50-6
0
60-7
0
70-8
0
80-9
0
90-1
00
110-
120
% F
requ
ency
Size - 100p.m
Average Particlesize: 90.41p.m
Particle size (p.m.) 120-
130
100-
110
TECH FRONTIERS

26 l INDIAN ENGINEERING EXPORTS l MAY 2020 MAY 2020 l INDIAN ENGINEERING EXPORTS l 27
Al prototype products made
Empty/foam filled crash box
Foam filled crash box
Energy absorption: 9.8 kJ
Energy absorption: 19.8 kJ
Foam billets made at 80 percent reproducibility, large size foam billet preparation demonstrated
Aluminium foam core 2014 Al-alloy (0.5 mm thickness) faced sandwich panels (size 1m x 2m x 0.025 m) (areal density: 3.5 kg/m2)
Foam blocks supplied to Tata Motors
FRP faced Al-foam core sandwich panel, 30 mm thickness (areal density: 7.0 kg/m2)
Foam core sandwich panels PROJECT-1Drop weight test of empty/foam filled crash box
FEM resultsEnergy dissipation: 2 times
130mm crash box > 35mm
Same as experimentally determined
Use of 400 gm of foam Crash box weight: 800 gm
Energy absorption with foam filled > double
FEM results
3.5
4
3
2.5
2
1.5
1
0.5
00 1 2 3 4 5 6
For Bare Foam
For 16mm thickness
For mountingFor Single Layer
Load
(KM
)
For Double Layer
Deflection (mm)
400
350
300
250
200
150
100
Displacement (m)
Forc
e (k
N)
50
00.00 0.02 0.04 0.06 0.08 0.10 0.12
400
350
300
250
200
150
100
Displacement (m)
Forc
e (k
N)
50
00.00 0.02 0.04 0.06 0.08 0.10 0.12
TECH FRONTIERS

28 l INDIAN ENGINEERING EXPORTS l MAY 2020 MAY 2020 l INDIAN ENGINEERING EXPORTS l 29
PROJECT-2FEM simulationEmpty/foam filled bumper and crash box assemblyCar crash analysis: Euro NCAP Standard (135-165 kJ)Energy dissipation at 150 mm deformation
Case1: Foam: Bumper + crash box (200 kJ)
Case3: Foam: Only bumper (16.5 kJ)
Case 2: Foam: Only crash box (97 kJ)
Case4:-Empty: Bumper + crash box (11 kJ)
Product samplesFoam filling methodology established, simulation done
Tata Motors will be conducting tests
(1500 gm of foam insert ~ 200 kJ)
ALUMINIUM MATRIX COMPOSITESAdvantages• Light-weight• Higher specific strength and stiffness• Higher damping capacity• Comparable TEC to steel and cast iron• Higher wear resistance
Limitations• Uniformity in reinforcement distri-
bution
• Interface bonding
• Poor machinability light-weight
Solutions• Near net shape casting and forming
• Squeeze casting/pressure die casting/
thixocasting
• Nano particle dispersion using second-
ary dispersion
• Ultrasonic stirring
Probable automobile componentsConnecting rods, cylinder liner, engine
blocks, brake drums/discs, pistons, clutch
plates etc
Pressure die cast and squeeze cast compositeYield strength: 170 to 220 MPa; UTS: 200 to 280 MPa
TECH FRONTIERS

30 l INDIAN ENGINEERING EXPORTS l MAY 2020 MAY 2020 l INDIAN ENGINEERING EXPORTS l 31
FUNCTIONALISATION OF CNTS, PARTICLE PROCESSING
NANO COMPOSITE AND HYBRID COMPOSITE
stre
ss (M
Pa)
Strain (mm/mm)
350
300
250
200
150
100
50
00 0.05 0.1 0.15
HC1HC2HC3
HC4
HC5Alloy (LM13)
0.2 0.25 0.3
TECH FRONTIERS

32 l INDIAN ENGINEERING EXPORTS l MAY 2020 MAY 2020 l INDIAN ENGINEERING EXPORTS l 33
MICROSTRUCTURE AND MECHANICAL PROPERTIES OF HYBRID FOAM
METAL FOAMS AND MMCS AT CSIR-AMPRI
Aluminium metal matrix composites(Stir casting & in-situ technology, 60 kg/heat)Technology developed and licensedStrength: 200 to 450 MPa (cast, rolled/forged)Density – 1/3rd of steelAutomobile, Defence, Aerospace and General Engineering
Connecting rod
TECH FRONTIERS

34 l INDIAN ENGINEERING EXPORTS l MAY 2020 MAY 2020 l INDIAN ENGINEERING EXPORTS l 35
Nose Cone
Blast resistant panel, foam (30 kg) & structure
Carbon-foam/energy storage and Ni-foam/high temperature applications
Break drum
METAL FOAMS AND MMCS AT CSIR-AMPRI
METAL FOAMS AND MMCS AT CSIR-AMPRI
Closed cell Al-foams (100 kg/day)• Density: 0.2 to 0.8 g/cm3• Porosity: 40 to 90 percent; Strength:
2 to 35 MPa• Sound absorption: Equivalent to glass wool – Auto industries: Crash-worthiness, weight
reduction, sound and vibration control – Defence: Blast resistance, armour – Rail and ship building: Flooring, cabins & hulls
Open Cell Foams (Porosity: 50 to 90%)• Nickel , Copper, Carbon and Titanium • Aluminum, Titanium, Stainless steel• Process developed. Animal trials made with
Ti-foam Bio medical applications• Filters , Heat Sink, Catalyst, Batteries • Capacitors, EMI shielding
crash box and bumber
Ti-foam (bone scaffold and joining applications)
TI-FOAMS FOR FILTERS AND PROTOTYPE BIO-IMPLANTS AT CSIR-AMPRI• Partially open cell Ti-foam with pre-cise control of cell size and pore fraction could be made
• These could be coated with HAP solu-tion for improved bio-compatibility
• The powder metallurgy technology for Ti-foam is developed at CSIR-AMPRI
• Because of porous and bioactive coat-ing, these implants help faster cell growth and adherence vis-à-vis faster recovery and increased life
P250
80%
P250
70%
P250
60%
P250
50%
P250
80%
P250
70%
P250
60%
P250
50%
Cont
rol
Cell
Viab
illity
L929 Cells150
100
50
0
TECH FRONTIERS

36 l INDIAN ENGINEERING EXPORTS l MAY 2020 MAY 2020 l INDIAN ENGINEERING EXPORTS l 37
Stress-strain curves Ti-foam lumber fusion
Foam filter Microstructure of Ti-foamPhotographic and SEM image of carbon foam
CARBON FOAM AND ITS APPLICATIONS AT CSIR-AMPRI• Porous solid • Light-weight • Low density (>0.5 g/cc) • Thermal expansion is very low • High thermal conductivity (>100 W/m.K)• High temp tolerance (up to 3000°C, inert atm)• Large surface area with open cell structures• Porosity ( 70-80 percent )
Properties Carbon foam
Density (g/cm3) < 0.50
Compressive strength (MPa) 5-8
Electrical conductivity (S/cm) 80-150
Thermal conductivity (W/m.K) >60
Total EMI shielding (dB) >80
Open porosity (%) 75-80
700
600
500
400
300
200
R.D=0.67
R.D=0.58
R.D=0.47
Compressive strain (mm/mm)
Com
pres
sive
stre
ss (M
Pa)
Sintering temp=12000C.HT = 2000C
100
0
0 0.2 0.4 0.6 0.8 1
TECH FRONTIERS
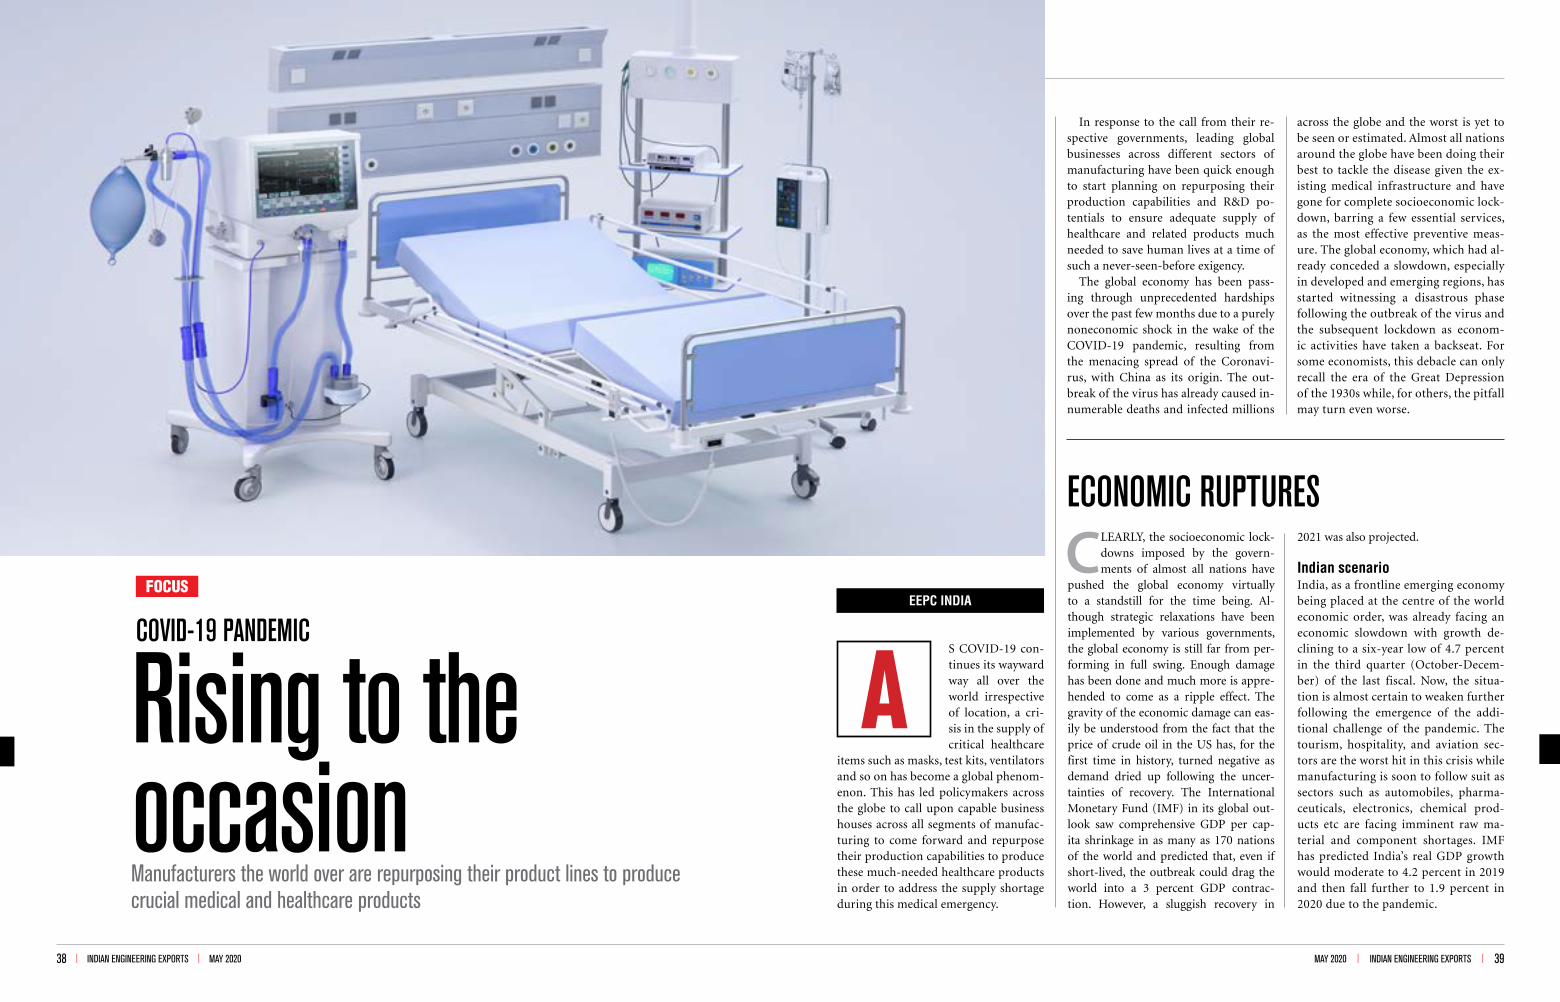
38 l INDIAN ENGINEERING EXPORTS l MAY 2020 MAY 2020 l INDIAN ENGINEERING EXPORTS l 39
FOCUS
Rising to the occasion Manufacturers the world over are repurposing their product lines to produce crucial medical and healthcare products
COVID-19 PANDEMICS COVID-19 con-tinues its wayward way all over the world irrespective of location, a cri-sis in the supply of critical healthcare
items such as masks, test kits, ventilators and so on has become a global phenom-enon. This has led policymakers across the globe to call upon capable business houses across all segments of manufac-turing to come forward and repurpose their production capabilities to produce these much-needed healthcare products in order to address the supply shortage during this medical emergency.
In response to the call from their re-spective governments, leading global businesses across different sectors of manufacturing have been quick enough to start planning on repurposing their production capabilities and R&D po-tentials to ensure adequate supply of healthcare and related products much needed to save human lives at a time of such a never-seen-before exigency.
The global economy has been pass-ing through unprecedented hardships over the past few months due to a purely noneconomic shock in the wake of the COVID-19 pandemic, resulting from the menacing spread of the Coronavi-rus, with China as its origin. The out-break of the virus has already caused in-numerable deaths and infected millions
across the globe and the worst is yet to be seen or estimated. Almost all nations around the globe have been doing their best to tackle the disease given the ex-isting medical infrastructure and have gone for complete socioeconomic lock-down, barring a few essential services, as the most effective preventive meas-ure. The global economy, which had al-ready conceded a slowdown, especially in developed and emerging regions, has started witnessing a disastrous phase following the outbreak of the virus and the subsequent lockdown as econom-ic activities have taken a backseat. For some economists, this debacle can only recall the era of the Great Depression of the 1930s while, for others, the pitfall may turn even worse.
EEPC INDIA
A
ECONOMIC RUPTURES
CLEARLY, the socioeconomic lock-downs imposed by the govern-ments of almost all nations have
pushed the global economy virtually to a standstill for the time being. Al-though strategic relaxations have been implemented by various governments, the global economy is still far from per-forming in full swing. Enough damage has been done and much more is appre-hended to come as a ripple effect. The gravity of the economic damage can eas-ily be understood from the fact that the price of crude oil in the US has, for the first time in history, turned negative as demand dried up following the uncer-tainties of recovery. The International Monetary Fund (IMF) in its global out-look saw comprehensive GDP per cap-ita shrinkage in as many as 170 nations of the world and predicted that, even if short-lived, the outbreak could drag the world into a 3 percent GDP contrac-tion. However, a sluggish recovery in
2021 was also projected.
Indian scenarioIndia, as a frontline emerging economy being placed at the centre of the world economic order, was already facing an economic slowdown with growth de-clining to a six-year low of 4.7 percent in the third quarter (October-Decem-ber) of the last fiscal. Now, the situa-tion is almost certain to weaken further following the emergence of the addi-tional challenge of the pandemic. The tourism, hospitality, and aviation sec-tors are the worst hit in this crisis while manufacturing is soon to follow suit as sectors such as automobiles, pharma-ceuticals, electronics, chemical prod-ucts etc are facing imminent raw ma-terial and component shortages. IMF has predicted India’s real GDP growth would moderate to 4.2 percent in 2019 and then fall further to 1.9 percent in 2020 due to the pandemic.

40 l INDIAN ENGINEERING EXPORTS l MAY 2020
ADVERSITY IN INTERNATIONAL TRADE
THE Coronavirus outbreak, right from its very initial stage, led to large-scale disruptions in supply
chains and demand resulting in cancel-lation of orders from overseas buyers. International trade of goods came to a near-halt as an inevitable consequence. Sectors with complex value chains such as electronics, automobiles etc. were the worst hit. According to an estimate pub-lished by the United Nations Conference on Trade and Development (UNCTAD), the slowdown of manufacturing in Chi-na due to the Coronavirus outbreak is
disrupting world trade and could result in lowering exports by as much as $50 billion across global value chains. Ac-cording to the World Trade Organisa-tion (WTO), global merchandise trade volume has already been down by 0.1 percent in 2019 over the previous year and this ongoing pandemic may cause it to decline between 13 to 32 percent in 2020, depending on the duration of the crisis as well as the extent of damage done. A recovery in trade volume is pro-jected in 2021 by the WTO but, again, it is dependent on the course of the out-
break and effectiveness of government policies.
Indian scenarioIndia, like other nations, has also been witnessing dismal merchandise trade since March 2020 that has suddenly slumped by 31 percent in the month. The UNCTAD report estimated the trade impact of the Coronavirus epidemic for India to be around $348 million with sec-tors such as chemicals, textiles and appar-el, automotive, electrical machinery, and leather to be the most affected.
FOCUS
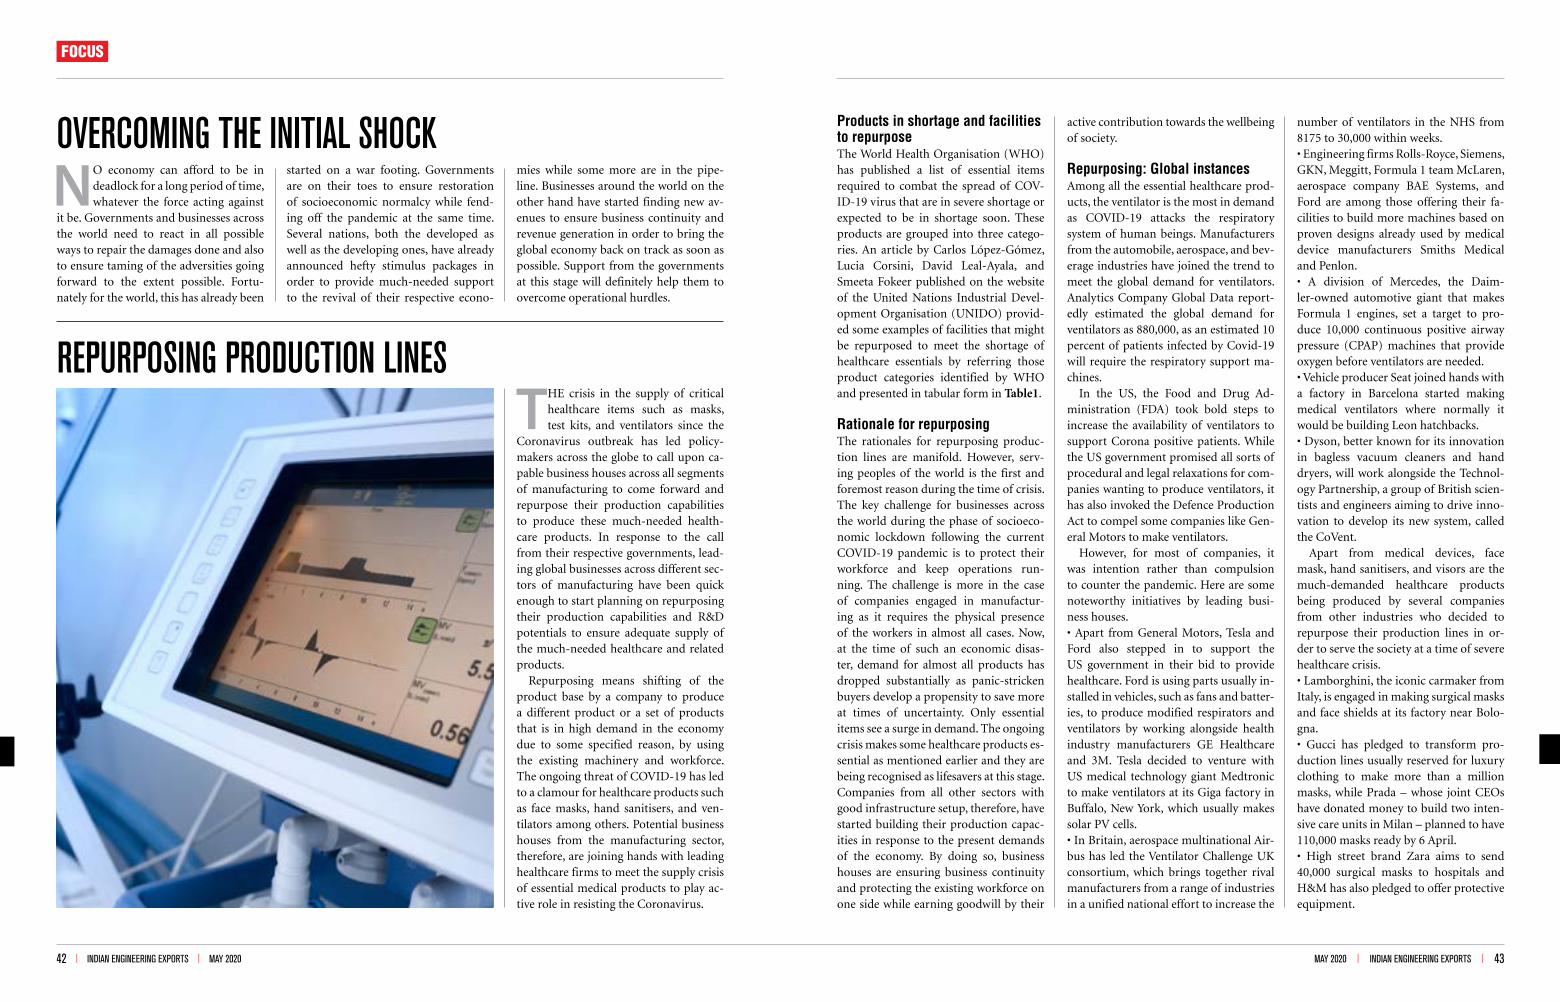
42 l INDIAN ENGINEERING EXPORTS l MAY 2020 MAY 2020 l INDIAN ENGINEERING EXPORTS l 43
OVERCOMING THE INITIAL SHOCK
REPURPOSING PRODUCTION LINES
NO economy can afford to be in deadlock for a long period of time, whatever the force acting against
it be. Governments and businesses across the world need to react in all possible ways to repair the damages done and also to ensure taming of the adversities going forward to the extent possible. Fortu-nately for the world, this has already been
started on a war footing. Governments are on their toes to ensure restoration of socioeconomic normalcy while fend-ing off the pandemic at the same time. Several nations, both the developed as well as the developing ones, have already announced hefty stimulus packages in order to provide much-needed support to the revival of their respective econo-
mies while some more are in the pipe-line. Businesses around the world on the other hand have started finding new av-enues to ensure business continuity and revenue generation in order to bring the global economy back on track as soon as possible. Support from the governments at this stage will definitely help them to overcome operational hurdles.
THE crisis in the supply of critical healthcare items such as masks, test kits, and ventilators since the
Coronavirus outbreak has led policy-makers across the globe to call upon ca-pable business houses across all segments of manufacturing to come forward and repurpose their production capabilities to produce these much-needed health-care products. In response to the call from their respective governments, lead-ing global businesses across different sec-tors of manufacturing have been quick enough to start planning on repurposing their production capabilities and R&D potentials to ensure adequate supply of the much-needed healthcare and related products.
Repurposing means shifting of the product base by a company to produce a different product or a set of products that is in high demand in the economy due to some specified reason, by using the existing machinery and workforce. The ongoing threat of COVID-19 has led to a clamour for healthcare products such as face masks, hand sanitisers, and ven-tilators among others. Potential business houses from the manufacturing sector, therefore, are joining hands with leading healthcare firms to meet the supply crisis of essential medical products to play ac-tive role in resisting the Coronavirus.
Products in shortage and facilities to repurposeThe World Health Organisation (WHO) has published a list of essential items required to combat the spread of COV-ID-19 virus that are in severe shortage or expected to be in shortage soon. These products are grouped into three catego-ries. An article by Carlos López-Gómez, Lucia Corsini, David Leal-Ayala, and Smeeta Fokeer published on the website of the United Nations Industrial Devel-opment Organisation (UNIDO) provid-ed some examples of facilities that might be repurposed to meet the shortage of healthcare essentials by referring those product categories identified by WHO and presented in tabular form in Table1.
Rationale for repurposingThe rationales for repurposing produc-tion lines are manifold. However, serv-ing peoples of the world is the first and foremost reason during the time of crisis. The key challenge for businesses across the world during the phase of socioeco-nomic lockdown following the current COVID-19 pandemic is to protect their workforce and keep operations run-ning. The challenge is more in the case of companies engaged in manufactur-ing as it requires the physical presence of the workers in almost all cases. Now, at the time of such an economic disas-ter, demand for almost all products has dropped substantially as panic-stricken buyers develop a propensity to save more at times of uncertainty. Only essential items see a surge in demand. The ongoing crisis makes some healthcare products es-sential as mentioned earlier and they are being recognised as lifesavers at this stage. Companies from all other sectors with good infrastructure setup, therefore, have started building their production capac-ities in response to the present demands of the economy. By doing so, business houses are ensuring business continuity and protecting the existing workforce on one side while earning goodwill by their
active contribution towards the wellbeing of society.
Repurposing: Global instancesAmong all the essential healthcare prod-ucts, the ventilator is the most in demand as COVID-19 attacks the respiratory system of human beings. Manufacturers from the automobile, aerospace, and bev-erage industries have joined the trend to meet the global demand for ventilators. Analytics Company Global Data report-edly estimated the global demand for ventilators as 880,000, as an estimated 10 percent of patients infected by Covid-19 will require the respiratory support ma-chines.
In the US, the Food and Drug Ad-ministration (FDA) took bold steps to increase the availability of ventilators to support Corona positive patients. While the US government promised all sorts of procedural and legal relaxations for com-panies wanting to produce ventilators, it has also invoked the Defence Production Act to compel some companies like Gen-eral Motors to make ventilators.
However, for most of companies, it was intention rather than compulsion to counter the pandemic. Here are some noteworthy initiatives by leading busi-ness houses.• Apart from General Motors, Tesla and Ford also stepped in to support the US government in their bid to provide healthcare. Ford is using parts usually in-stalled in vehicles, such as fans and batter-ies, to produce modified respirators and ventilators by working alongside health industry manufacturers GE Healthcare and 3M. Tesla decided to venture with US medical technology giant Medtronic to make ventilators at its Giga factory in Buffalo, New York, which usually makes solar PV cells.• In Britain, aerospace multinational Air-bus has led the Ventilator Challenge UK consortium, which brings together rival manufacturers from a range of industries in a unified national effort to increase the
number of ventilators in the NHS from 8175 to 30,000 within weeks.• Engineering firms Rolls-Royce, Siemens, GKN, Meggitt, Formula 1 team McLaren, aerospace company BAE Systems, and Ford are among those offering their fa-cilities to build more machines based on proven designs already used by medical device manufacturers Smiths Medical and Penlon.• A division of Mercedes, the Daim-ler-owned automotive giant that makes Formula 1 engines, set a target to pro-duce 10,000 continuous positive airway pressure (CPAP) machines that provide oxygen before ventilators are needed.• Vehicle producer Seat joined hands with a factory in Barcelona started making medical ventilators where normally it would be building Leon hatchbacks. • Dyson, better known for its innovation in bagless vacuum cleaners and hand dryers, will work alongside the Technol-ogy Partnership, a group of British scien-tists and engineers aiming to drive inno-vation to develop its new system, called the CoVent.
Apart from medical devices, face mask, hand sanitisers, and visors are the much-demanded healthcare products being produced by several companies from other industries who decided to repurpose their production lines in or-der to serve the society at a time of severe healthcare crisis. • Lamborghini, the iconic carmaker from Italy, is engaged in making surgical masks and face shields at its factory near Bolo-gna.• Gucci has pledged to transform pro-duction lines usually reserved for luxury clothing to make more than a million masks, while Prada – whose joint CEOs have donated money to build two inten-sive care units in Milan – planned to have 110,000 masks ready by 6 April.• High street brand Zara aims to send 40,000 surgical masks to hospitals and H&M has also pledged to offer protective equipment.
FOCUS

44 l INDIAN ENGINEERING EXPORTS l MAY 2020 MAY 2020 l INDIAN ENGINEERING EXPORTS l 45
• Britain’s Wales-based Royal Mint, start-ed producing plastic visors for health workers in late March, in addition to the coins and precious metal investment products it is known for.• Apple is designing and producing face shields to protect health workers and medical staff from the Novel Coronavi-rus.
Repurposing in IndiaTaking lessons from the topmost COV-ID-19 effected nations in Asia, Europe, and North America, India has made an early move to arrest the spread of the vi-rus and has succeeded to a large extent to control its wild run on Indian soil.
However, a populous geographical en-tity like India cannot escape such a global epidemic completely, especially when its medical infrastructure is not as devel-oped as its counterparts in Europe and North America. Moreover, the country needs to be well-equipped once the lock-down is withdrawn. Medical devices and other healthcare-related products are in
acute shortage in India. Currently, the subcontinent has around 40,000 venti-lators but estimates say that the demand could go up to 80-100 times of the exist-ing availability if the situation worsens rapidly after the lockdown phase.
Indian medical device manufacturers have drawn up plans to deliver 50,000 ventilators by May 2020 to meet the growing demand for this lifesaving de-vice. Indian business houses from dif-ferent sectors, like their global peers has also jumped into the drive to meet the shortages of medical essentials in order to combat the corona outbreak.
The government and industry plan to tackle the shortage of ventilators with the development of two-three different models. While one will be a low-cost res-pirator model, another will be a high-end ICU model.
Quick response from large cap EEPC India members Several large-scale firms among EEPC In-dia’s 13,000 member base have responded
superfast to the ongoing crisis. Some of them are listed here.• Tata Motors, is in last-minute negotia-tions with a Mysuru-based manufactur-er to ramp up ventilator manufacturing. ‘Tata Group is looking at setting up a plant to manufacture ventilators. We are working on this on priority,’ said Mr N Chandrasekaran, Chairman, Tata Sons.• Mahindra & Mahindra, along with BEL and BHEL, has joined a consortium formed by leading ventilator manufac-turer SkanRay to ramp up production of ventilators from standard 2000 pieces per month to currently 5000 pieces per month and 30,000 pieces per month by May 2020. ‘Mahindra Group will imme-diately begin work on how our manu-facturing facilities can make ventilators, stated Mr Anand Mahindra, CEO, Ma-hindra & Mahindra. • Hyundai India has already initiated the development of an in-house ventilator and the prototype has been submitted to the Tamil Nadu government.• Maruti has tied up with medical device
Table1: COVID-19 critical Items and what might be repurposedCategory Critical items identifiled by WHO Example of facilities that might be repurposed
Protective personal equipment (PPE)
• Gloves, examination• Gloves, surgical• Goggles, protective• Gown, protective• Face shield• Mask, particulate respirator• Mask, surgical
• Textile factories• Garment plants• Yarn spinning mills• Electronics assembly plants• Injection moulding facilities• Prototyping shops (including 3D printing)
Diagnostic equipment • Lab screening test kit• Lab confirmation test kit• RT-PCR kit• Extraction Kit• Cartridges for RT-PCR automatic systems• Swab and viral transport medium
• Pharmaceutical preparations• Biopharmacetical preparations• Pilot biotech plants• Clinical research laboratories
Clinical care equipment • Pluse oximeter• Concentrator O2, 10L, 23OV, 50Hz + acc.• Nasal oxygen cannula, with prongs,• Ventilator patient, for adult, pediatric.• CPAP with tubing and patient interfaces for adult and
pediatric.• Suction pump, mechanical• High-flow nasal cannula (HFNC)
• Automotive production lines• Aerospace manufacturing plants• Specialized engineering service and testing facilities• Manufacturing technology and innovation centres• Vacuum cleaner assembly plants• Machining shops
Note: List of critical items was identified by WHO while examples of manufacturing facilities were provided by the authors based on government communications and media reports. Source: Article published by Carlos López-Gómez, Lucia Corsini, David Leal-Ayala and Smeeta Fokeer on UNIDO Website.
manufacturer AgVa, to scale up produc-tion from 400 pieces per month to 4000 pieces per month in April and to 10,000 pieces per month by May. According to Mr R C Bhargava of Maruti Suzuki, Maruti’s tieup with AgVa will use venti-lator design and technology designed by AgVa. As AgVa is a small setup, it does not have working capital to ramp up produc-tion, so Maruti will use its own premises and vendor’s premises to manufacture ventilators. At present AgVa has no im-ported components in stock and is look-ing for sources other than China. Produc-tion will begin as soon as the first lot of imported components arrive.
Others are similarly gearing up to ad-dress the challenge.
Initiatives by other member companiesSmall- to medium-sized manufacturers
are also taking part in this repurposing venture and offering masks, sanitisers, and other essential supplies to counter the shortage. Some of these initiatives are listed in Table2.
DRDO gears up to counter Coronavirus• A body suit developed by India’s pre-mier research and development or-ganisation DRDO can protect doctors and other health-workers attending to Covid-19 patients. The suit is washable and has passed the ASTM international standards. Frontier Protective Wear Pvt Ltd, Kolkata and Medikit Pvt Ltd, Mum-bai are producing 10,000 suits per day. The body suit is one of the four instru-ments developed by the DRDO. • Another instrument developed by DRDO is the five-layer N99 mask with two layers of nano mesh. The produc-
tion vendors of this advanced mask are Venus Industries Mumbai, and IMTEC Kolkata. The capacity is 10,000 masks per day.• The DRDO has also developed hand sanitiser, a basic instrument against spread of Covid-19. It has provided about 4000 litres of hand sanitiser to the Indian armed forces, Armed Forces Medical Corps, and the Defence Security Corps; 1500 litres to the Ministry of De-fence; 300 litres to Parliament; and 500 litres to various security establishments and high offices.
Challenges faced in repurposing process Despite the full fledged attempts of busi-ness houses to response to the need of the times, the results have not been as expected so far. In reality, it is not an easy task to shift to a new product line
FOCUS

46 l INDIAN ENGINEERING EXPORTS l MAY 2020
overnight by just using the existing in-frastructure, as production processes in modern manufacturing are highly spe-cialised with the objective of maximising efficiency. Moreover, the level of repur-posing depends on the level of complexity of the products. Repurposing to produce high-tech ventilators is far more difficult than producing masks and gloves. Dif-ficulty in assessing the risk of entering a new market with insufficient domain knowledge, lack of specialised skill, and, above all, lack of adequate time-span to source factor inputs and develop prod-uct design are among the other bottle-necks faced by the repurposing facilities. As per media reports, several essentials to resist COVID-19 produced by repur-posed facilities have been rejected in the US and the UK on the grounds of tech-
nical non-compliance.
Way forwardNotwithstanding the limitations, there are several successes too that necessi-tates repurposing as an effective way to arrest the spread of the virus and then its eradication. When the products rec-ognised as lifesavers are in short supply at this current juncture and traditional business houses are unable to meet the scarcity, repurposing is the only avenue left. Needless to say, adequate policy re-sponse from the governments can help the repurposing units to eliminate hin-drances to production. Ensuring supply of raw material, removing procedural delay, and relaxing stringency in busi-ness norms among others are the meas-ures expected from the governments
in order to help these units to develop a well thought-out roadmap for repur-posing and to deliver the best feasible outcome in turn.
To conclude, let’s hope to see a COV-ID free natural world very soon.
References 1. Business Today2. COVID-19 critical supplies: the manu-facturing repurposing challenge, by Car-los López-Gómez, Lucia Corsini, David Leal-Ayala and Smeeta Fokeer published on the website of UNIDO3. https://www.nsmedicaldevices.com4. Newspapers and Media Reports5. United Nations Conference on Trade and Development (UNCTAD)6. World Health Organisation (WHO)6. World Economic Forum
Table2: Initiatives by SMEs
Organisation Location Product
ACE Micromatic Bengaluru Ventilators
Canadian Crystalline Water India Limited Tamil Nadu Advanced ultraviolet disinfection, ozone disinfection equipment’s for air and surface sterilisation and disinfection
Cognify Tech Pune, Maharashtra Anti-droplet face shield
Janatics Tamil Nadu Ventilators
Jyoti CMC Rajkot Ventilators
MSB Consulting (dealer for a Chinese company) New Delhi Machines for 3-layer surgical masks
Nantex Machineries Haryana Surgical masks
Noble Eco System Pvt Ltd Chennai Disinfection generator for Covid-19
Nuva Machine Works India Pvt Ltd (dealer for a Chinese company)
Tirupur, Tamil Nadu Mask-making machinery
Pushpak Products India Pvt Ltd Bengaluru 3-ply mask, N95 respirator, gloves, Coronavirus protective kit, Hand sanitiser, disinfectant wipes, ICU beds, etc
Rodas Impex Pvt Ltd Bhilwada, Rajasthan Surgical masks
Samanjas Udyog Pvt Ltd Jamnagar, Gujarat Brass parts for ventilators for hospital
Uniq Engineering Surat, Gujarat 3-fold mask-making machine – capable of manufacturing N-95 mask
UPL group Mumbai Sodium hypo chloride for sanitiser
Vishwakarma industries Bhiwandi, Thane, Maharashtra Mist Shower which can be used for Decontamination and to stop spread of such COVID-19 virus
FOCUS

48 l INDIAN ENGINEERING EXPORTS l MAY 2020 MAY 2020 l INDIAN ENGINEERING EXPORTS l 49
Pandemic spurs fall in engineering exportsThe last month of fiscal 2019-20 witnessed a fall in engineering exports spurred mainly by the continuing COVID-19 crisis
OVERSIGHT
POLICY WONK
ENGINEERING EXPORTSThe monthly engineering figures for 2019-20 vis-à-vis 2018-19 are depicted in Table1 and Figure1 as per the latest DGCI&S es-timates.
Correlation between manufacturing production and engineering exportsThe engineering sector is an important component of the broader manufactur-ing sector and the share of engineering production in overall manufacturing output is quite significant. As exports generally come from what is produced within a country, some correlation be-tween manufacturing production growth
Table1: Engineering exports: Monthly trend ($ million)Month 2018-19 2019-20 Growth (%)April 7020.54 6480.13 -7.70
May 6928.08 7244.53 4.57
June 6512.31 6352.16 -2.46
April-June 20460.93 20076.82 -1.88
July 6052.64 5949.01 -1.71
August 6974.48 6347.76 -8.99
September 6769.15 6344.77 -6.27
April-September 19796.27 18641.54 -5.83
October 6151.93 6252.68 1.64
November 5740.17 6199.17 8.00
December 6905.63 6811.53 -1.36
October-December 18797.73 19263.38 2.48
January 6295.94 6011.39 -4.52
February 6442.37 7015.51 8.90
March 9162.3 5266.9 -42.52
January-March 21900.61 18293.8 -16.47
April-March 80955.54 76275.54 -5.78
Source: DGCI&S, Govt of India
and engineering export growth should exist. We briefly looked at the trend in manufacturing growth as also engineer-ing export growth to see if they move in tandem. It may be mentioned that manu-facturing has 77.63 percent weightage in India’s industrial production.
The first month of fiscal 2019-20 saw engineering exports growth and man-ufacturing growth moving in the oppo-site direction but the next four months saw just the reverse. In April 2019, man-ufacturing growth accelerated while engineering exports dropped to nega-tive. During May, engineering exports bounced bank to growth path and man-ufacturing growth accelerated. Engineer-ing exports declined once again in June 2019 and manufacturing growth also slowed down noticeably. The decline in engineering exports continued in July but at a slower pace while manufactur-ing witnessed accelerated growth. During August, engineering exports decelerated faster and manufacturing growth turned negative. September 2019 again saw both moving in opposite directions when de-cline in engineering exports moderated but decline in manufacturing growth accelerated. Again during October to December 2019, both moved in the same direction. Engineering exports bounced back to the growth path in October 2019 while growth accelerated in November 2019. On the other hand, decline in man-ufacturing moderated in October and then registered decent growth in Novem-ber 2019. During December 2020, both engineering exports and manufactur-ing output conceded y-o-y decline. The trend was reversed in January 2020, when manufacturing output registered a rise against a decline in engineering exports. In February 2020, however, engineering exports came back to the growth path while manufacturing growth witnessed acceleration. As per the latest figures, manufacturing output and engineering exports moved in the same direction in eight out of the first 11 months of fiscal
• After experiencing a downtrend for five months to January 2020, India’s merchan-dise exports managed around 3 percent growth in February 2020 over the same month last fiscal. However, exports in March conceded an unprecedented 34.57 percent decline year-on-year as outbreak of the Coronavirus caused large-scale disruptions in supply chains and demand resulting in cancellation of orders. Merchandise exports were recorded at $21.41 billion during the month as against $32.72 billion in March 2019. In rupee terms, the decline was somewhat lower at 29.98 percent.
• Except iron ore, which registered a growth of 58.43 percent, all other commodity/com-modity groups registered negative growth in March 2020 vis-à-vis March 2019.
• Cumulative value of merchandise exports
for the period April-March 2019-20 was $314.31 billion as against $330.08 billion during the last fiscal, registering a 4.78 percent fall in dollar terms. In rupee terms, the decline was 3.52 percent.
• Imports, due to the same reason, declined by 28.72 percent in dollar terms during March 2020 to $31.16 billion from $43.72 billion in March 2019. The decline was somewhat lower at 23.72 percent in rupee terms.
• Trade deficit narrowed down marginally to $9.76 billion in March 2020 from $11 billion in the same month last fiscal, registering 11.27 percent decline as both exports and imports were hit by the ongoing crisis. On a cumulative basis, trade deficit shrank by 16.91 percent to $152.88 billion during April-March 2019-20 from $184 billion during the same period last fiscal.
• Engineering exports from India also record-ed y-o-y increase in February 2020, but as the COVID-19 pandemic started biting the global economy, engineering exports, following the broader merchandise trend, slumped by 42.5 percent to $5.3 billion in March 2020 from $9.2 billion in the same month last fiscal. However, a little bit of base effect was also there behind this massive decline.
• Cumulative engineering exports during fiscal 2019-20 dropped by 5.8 percent as a consequence. India’s engineering exports stood at $76.3 billion in 2019-20 as against $81 billion during fiscal 2018-19.
• The share of engineering exports in India’s total merchandise exports, however, re-mained largely unchanged at 24.6 percent as
against 24.1 percent in February 2020. On a cumulative basis, the contribution of engi-neering exports in India’s total merchandise exports was recorded at 24.3 percent during April-March 2019-20.
• Out of 33 engineering panels, only zinc and products made of zinc recorded 53.4 percent growth in exports during March 2020 while the remaining 32 panels conceded decline in y-o-y exports. On a cumulative basis, 21 panels recorded negative growth in April-March 2019-20 over the last fiscal.
• During March 2020, exports to 22 nations out of India’s top 25 export destinations for engineering products recorded y-o-y decline. On a cumulative basis for April-March 2019-20, the number of such nations was 16.
• India’s engineering imports during March 2020 were valued at $7.1 billion compared to $9.4 billion in March 2019, recording significant negative growth of 24.1 percent in dollar terms.
• Cumulative engineering imports during April-March 2019-20 were recorded at
$100.55 billion as against $111.21 billion during the same period last fiscal, register-ing a fall of 9.6 percent.
• The share of engineering imports in India’s total merchandise imports during April-March 2019-20 has been estimated at 21.5 percent.
India’s merchandise exports declined by ~35 percent in March 2020 as COV-ID-19 pandemic led to cancellation of overseas orders
India’s engineering exports declined by 42.5 percent in March 2020 following the broader merchandise exports
India’s March engineering imports down by 24.1 %
OVERALL SCENARIO

50 l INDIAN ENGINEERING EXPORTS l MAY 2020 MAY 2020 l INDIAN ENGINEERING EXPORTS l 51
2019-20. Perhaps, the trend in Table2 shows a lagged effect of a month. We need to see how this plays out during the last quarter of the fiscal.
We also present the month-wise corre-sponding revised engineering exports for 2018-19 as opposed to 2017-18.
Impact of exchange rateHow has the exchange rate been chang-ing in 2020 vis-à-vis 2019? We look at the monthly average exchange rate for both 2020 and 2019. Table4A and Figure2A provide the scenario.
As the figures of just one month does not determine a trend, we will continue to include the rupee-dollar trend analysis table and the movement chart for 2019 so that the short-term trend can be under-stood clearly.
Rupee weakens significantly in March 2020 vis-à-vis the dollar: After appreci-ating from September to November 2019 over the dollar, the rupee again started weakening from December 2019 and conceded as much as 7.1 percent depre-ciation in March 2020 over the greenback as the outbreak of Coronavirus led to outflow of dollars from the Indian capital market following withdrawal of invest-ments, mainly by foreign portfolio in-vestors. The fear of debt monetisation by the Indian government following the in-crease in expenditure in order to manage the COVID-19 crisis also played a role in weakening the rupee.
Rupee-dollar trends in 2019A noteworthy feature of the rupee-dollar movement in 2019 had been the relative hardening of the rupee in 2019, as indi-cated by the narrowing in the rate of de-preciation over corresponding months of last year between January and July 2019 (Table4B). After a somewhat higher de-preciation in August 2019, the rupee started appreciating against the dollar for the next three months. However, the rupee saw an increasing depreciating
mode in the later months and reached an alarming low in March 2020 as impact of the COVID-19 pandemic started tak-ing its toll on investors’ sentiments. The pictorial representation in Figure2B pro-vides a clearer picture.
Top 25 engineering export destinations in March 2020We now look at the export scenario of the
top 25 nations that had highest demand for Indian engineering products during April-March 2019-20 over April-March 2018-19 (Table5).
India’s top 25 engineering export desti-nations: Some observations• Only 9 out of 25 countries, recorded positive cumulative growth of engineer-ing exports during April-March 2019-20
over April-March 2018-19.• India’s engineering exports to its top 25 nations accounted for 75.5 percent of India’s total engineering exports in April-March 2019-20, which is margin-ally higher than its share in April-March 2018-19. • Interestingly, USA ranked as the nume-ro uno destination for India’s engineer-ing products during March 2020 over March 2019 as well as for April-March 2019-20 over April-March 2018-19. Un-like the previous month’s trend, India’s exports to US recorded substantial neg-ative growth in March 2020 over March 2019, with marginal positive cumulative growth in April-March 2019-20 over April-March 2018-19.• Vietnam for the seventh time in a row recorded highest positive cumulative growth during April-March 2019-20 over April-March 2018-19, followed by Ma-laysia and Nigeria.• Among the ASEAN countries under the top 25 engineering exports destinations, Vietnam and Malaysia only recorded high positive growth while Singapore and Indonesia recorded significant negative growth during April-March 2019-20 over April-March 2018-19, while Thailand re-corded nominal negative growth during the same period.• India’s engineering exports to China re-corded high positive cumulative growth during April-March 2019-20 over April-March 2018-19 but a negative monthly growth for March 2020 over March 2019, like the previous month. • All the European nations falling under the top 25 engineering exports destina-tions, recorded negative monthly as well as negative cumulative growth during April-March 2019-20 over April-March 2018-19. • India’s engineering exports to its top 25 destinations during April-March 2019-20 over April-March 2018-19 recorded moderate negative growth, which is a little less than in comparison to the neg-ative growth in India’s total global engi-
Table2: Engineering exports growth vis-à-vis manufacturing growth (2019-20)Month/Year Engg export growth (%) Manufacturing growth (%)
April 2019 -7.70 2.5
May 2018 4.57 4.4
June 2019 -2.46 0.3
July 2019 -1.72 4.8
August 2019 -8.99 -1.6
September 2019 -6.27 -4.0
October 2019 1.63 -2.1
November 2019 8.00 3.0
December 2019 -1.05 -0.7
January 2020 -4.52 1.6
February 2020 8.90 3.2
March 2020 -42.52 N A
Source: Department of Commerce and CSO
Table3: Revised engineering exports for 2017-18 ($ million)
Month 2017-18 2018-19 Growth (%)
April 5902.86 7020.54* 18.93%
May 6047.26 6928.08* 14.57%
June 5703.28 6512.31* 14.19%
Quarter 1 17653.40 20460.93* 15.90%
July 5595.63 6052.64* 8.17%
August 5766.60 6974.48* 20.95%
September 7088.19 6769.15* -4.50%
Quarter 2 18450.42 19796.27* 7.29%
October 5669.59 6151.93* 8.51%
November 6872.84 5740.17* -16.48%
December 7163.56 6905.63* -3.60%
Quarter 3 19705.99 18797.73* -4.61%
January 6217.28 6295.94* 1.27%
February 6332.92 6442.37* 1.73%
March 7839.32 9156.46* 16.88%
Quarter 4 20389.52 21900.61* 7.41%
April-March 76199.33 80955.54* 6.24%
* Revised dataSource: DGCI&S
Table4A: USD-INR average exchange rate(1USD = INR) in March 2020
Month 2019 2020 Change y-o-y (%) Direction
March 69.48 74.35 7.10 Depreciation
6.5 6.
9 7.2
6.5
6.4 6.1
5.9
7.0
6.3 6.
86.
3
6.2
6.3
5.7
6.2
6.9
6.3 6.4
6.0
5.3
9.2
6.87.
0
7.0
10.0
9.0
8.0
7.0
6.0
5.0
4.0
3.0
2.0
1.0
20.0
10.0
0.0
-10.0
-20.0
-30.0
-40.0
-50.00.0
$ bo
llion
April
May July
Augus
t
Septem
ber
Octobe
r
Novem
ber
Decem
ber
Janu
ary
Febru
ary
MarchJu
ne
2018-19 2019-20 Growth (%)
Figure1: Monthly engineering exports in 2019-20 vis-à-vis 2018-19
-42.5
75
7473
72
71
70
69
68
67
2019
69.48
7.10%
74.35
2020
Figure2A: Movement of USD-INR exchange rate in March 2020
Source: RBI, FBIL, EEPC Research
OVERSIGHT

52 l INDIAN ENGINEERING EXPORTS l MAY 2020 MAY 2020 l INDIAN ENGINEERING EXPORTS l 53
neering exports during the same period.
India’s region-wise engineering exportsTable6 and Figure3 depict region-wise India’s engineering exports for April-March 2019-20 as opposed to April-March 2018-19.
Region-wise engineering exports: some observations• North America retained its numero uno position like before as the region with the highest shipment of engineering products from India during April-March 2019-20 over April-March 2018-19 with a share of 19.9 percent of total engineering exports.• India’s exports to CIS recorded highest positive growth for the third time during April-March 2019-20 over April-March 2018-19, followed by NE Asia. • India’s exports to EU and ASEAN+2 ranked second and third in global ship-ments of Indian engineering goods in April-March 2019-20 with a share of 18.8 percent and 14.9 percent of total engi-neering exports respectively.• Only three regions – CIS, NE Asia, and MEWA – recorded positive cumu-lative growth in exports of engineering products from India during April-March 2019-20 over April-March 2018-19.
Panel-wise engineering exportsWe begin by looking at the engineering panel-wise exports for March 2020 vis-à-vis March 2019 as well as April-March 2019-20 vis-à-vis April-March 2018-19. The data is given in Table7.
Panel-wise engineering exports: Some observations• Year-on-year decline for March 2020 was witnessed in almost all the panels except for zinc and products panel. Out of 33 engineering panels 32 panels wit-nessed decline in exports during March 2020 vis-à-vis March 2019. Sharp decline was observed in some of the major panels
like iron and steel and products, copper and products, industrial machinery like boilers, air condition and repair machin-ery, railway transport equipments, etc. In cumulative terms, 21 out of 33 panels ex-hibited a y-o-y decline.• After recovering from monthly decline during December 2019, iron and steel figures continued its negative trend since January 2020 and observed sharp decline to the extent of 31 percent in March 2020 compared to March 2019. In cumulative terms, too, iron and steel figures dipped by 5 percent during the fiscal 2019-20 vis-à-vis the same period last fiscal. • Products of iron and steel also displayed negative trend similar to the one observed in previous month, dipping sharply by
36.2 percent in March 2020 vis-à-vis March 2019. Cumulative exports also registered negative growth of 3.5 percent during April-March 2019-20 compared to same period last fiscal. The significant drop in products of iron and steel led to monthly decline in combined iron and steel and products of iron and steel of 33.24 percent in March 2020 correspond-ing to the same period last year. However, in cumulative terms the two panels to-gether registered a fall of 4.27 percent.• The non-ferrous metal segment wit-nessed sharp decline in export growth in copper and products of 55.07 percent in the month of March 2020 vis-à-vis March 2019, unlike the previous month of February 2020. Decline was also wit-
Table4B: USD-INR average exchange rate (1USD = INR) in 2019-20Month 2018-19 2019-20 Change y-o-y (%) Direction
April 65.64 69.42 5.76 Depreciation
May 67.53 69.77 3.32 Depreciation
June 67.79 69.44 2.43 Depreciation
July 68.69 68.81 0.17 Depreciation
August 69.55 71.15 2.30 Depreciation
September 72.21 71.33 -1.22 Appreciation
October 73.63 71.03 -3.53 Appreciation
November 71.85 71.45 -0.56 Appreciation
December 70.73 71.19 0.65 Depreciation
January 70.73 71.31 0.82 Depreciation
February 71.22 71.49 0.37 Depreciation
March 69.48 74.35 7.10 Depreciation
Table5: Engineering exports country-wise, 2019-20 ($ million)Country March 2019 March 2020 Growth (%) Apr-Mar 2018-19 Apr-Mar 2019-20 Growth (%)
USA 1141.13 929.61 -18.54 11905.72 11929.38 0.20
UAE 371.42 370.41 -0.27 4303.60 4465.50 3.76
Germany 272.60 189.15 -30.61 3244.12 2988.93 -7.87
Nepal 229.38 183.64 -19.94 2992.34 2633.93 -11.98
UK 283.46 139.36 -50.84 2801.10 2598.18 -7.24
Bangladesh 333.70 183.04 -45.15 2864.80 2452.78 -14.38
Mexico 207.07 136.85 -33.91 2505.31 2348.44 -6.26
Malaysia 147.55 192.86 30.71 1759.35 2327.67 32.30
Singapore 1431.23 106.06 -92.59 3483.59 2259.70 -35.13
China 219.27 126.51 -42.31 1834.60 2124.58 15.81
Italy 297.59 145.33 -51.16 2352.39 1937.29 -17.65
Korea 165.21 114.36 -30.78 1734.49 1887.65 8.83
Vietnam 171.59 109.50 -36.18 1179.44 1752.21 48.56
Nigeria 179.66 132.17 -26.43 1338.10 1743.97 30.33
Saudi Arabia 132.03 160.94 21.90 1438.95 1646.14 14.40
Indonesia 627.31 96.68 -84.59 2362.64 1618.40 -31.50
Thailand 148.49 98.94 -33.37 1619.36 1599.75 -1.21
South Africa 114.48 108.67 -5.08 1553.84 1527.70 -1.68
France 146.68 74.03 -49.53 1402.41 1360.89 -2.96
Sri Lanka 118.88 65.51 -44.90 1740.10 1222.18 -29.76
Turkey 91.70 101.11 10.26 1732.03 1172.39 -32.31
Brazil 126.52 87.62 -30.75 1028.34 1075.12 4.55
Japan 103.63 66.37 -35.95 1233.39 1004.42 -18.56
Belgium 109.57 59.13 -46.04 1615.09 993.24 -38.50
Netherlands 82.96 54.47 -34.34 1007.25 924.49 -8.22
Total engineering exports to top 25 countries 7253.10 4032.32 -44.41 61032.36 57594.94 -5.63
Total engineering exports 9162.31 5266.90 -42.52 80955.54 76275.54 -5.78
Share (%) 79.16 76.56 75.39 75.51
Source: Department of Commerce, Government of India
nessed in the panels of aluminium, nickel, lead and tin of 22.3, 25.8, 29.8, and 61.6 percent respectively during March 2020 vis-à-vis March 2019. Zinc and products is the sole panel that recorded positive ex-port growth to of 53.4 percent in March 2020 vis-à-vis March 2019. In cumulative terms though fall was noticed of 5.63 per-
cent during April-March 2019-20 vis-à-vis April-March 2018-19.• All the seven panels under industrial machinery exhibited negative growth in March 2020 that led the total industrial machinery panel dip by 37.5 percent dur-ing March 2020. In the month of March 2020, panels like industrial machinery for
boilers dipped by 61.7 percent, machinery for IC engines (30.2), pumps and valves (37.8), air condition and repair machin-ery (49.5), industrial machinery for dairy (34.1) percent, machine tools (41), and machinery for ATMs (29.5) percent re-spectively. In cumulative terms, too, the panel registered negative growth of 6.79
April
2018-19 2019-20 Year-on-Year Change (%)
May JulyAugust
SeptemberOctober
November
DecemberJanuary
February MarchJune
65.6
Chan
ge (%
)
INR
vs 1
USD 69
.4
0
2
4
6
8
-2
-4
-6
69.8
67.5 67
.869
.4
68.7 68
.8
69.6 69
.5
69.6
71.2 71
.2
71.2
71.3
73.6
71.0
71.9
71.5
70.7 71
.3
70.2 71
5 74.4
72
7476
70
68
6664
62
60
Figure2B: Movement of USD-INR exchange rate, 2019-20 (monthly average)
Source:RBI, FBIL, EEPC Research
-1.2
0.4
7.0
0.8
0.72.3
-3.5
-0.6
5.8
3.3
2.4
0.2
2.3
OVERSIGHT
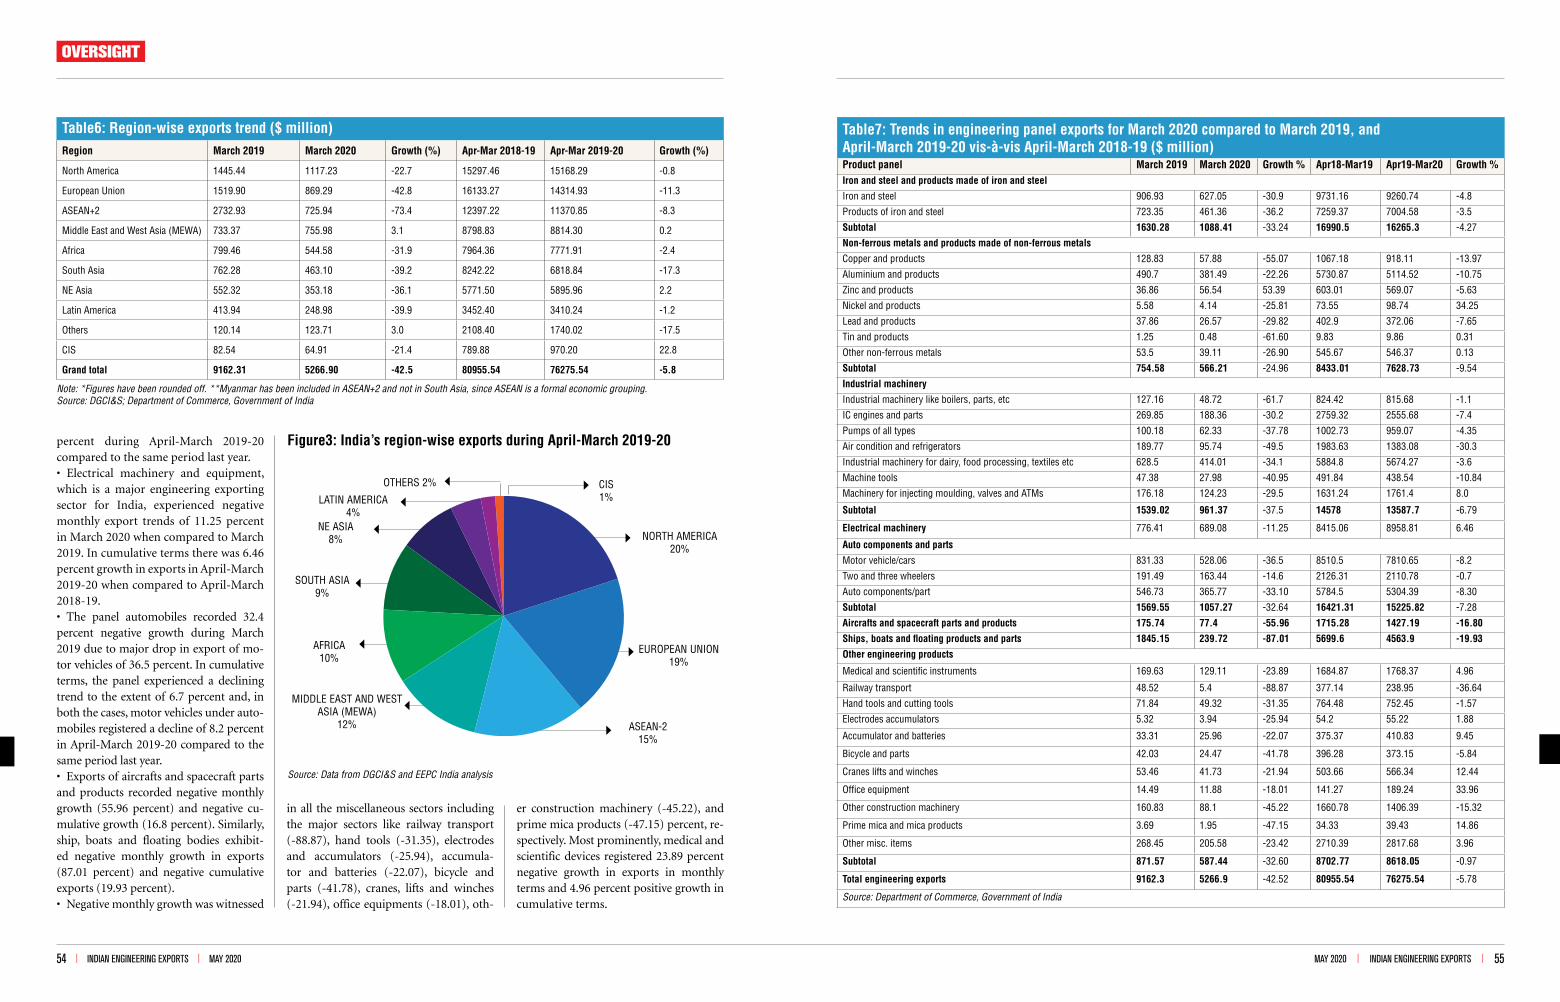
MAY 2020 l INDIAN ENGINEERING EXPORTS l 55 54 l INDIAN ENGINEERING EXPORTS l MAY 2020
percent during April-March 2019-20 compared to the same period last year.• Electrical machinery and equipment, which is a major engineering exporting sector for India, experienced negative monthly export trends of 11.25 percent in March 2020 when compared to March 2019. In cumulative terms there was 6.46 percent growth in exports in April-March 2019-20 when compared to April-March 2018-19. • The panel automobiles recorded 32.4 percent negative growth during March 2019 due to major drop in export of mo-tor vehicles of 36.5 percent. In cumulative terms, the panel experienced a declining trend to the extent of 6.7 percent and, in both the cases, motor vehicles under auto-mobiles registered a decline of 8.2 percent in April-March 2019-20 compared to the same period last year. • Exports of aircrafts and spacecraft parts and products recorded negative monthly growth (55.96 percent) and negative cu-mulative growth (16.8 percent). Similarly, ship, boats and floating bodies exhibit-ed negative monthly growth in exports (87.01 percent) and negative cumulative exports (19.93 percent). • Negative monthly growth was witnessed
in all the miscellaneous sectors including the major sectors like railway transport (-88.87), hand tools (-31.35), electrodes and accumulators (-25.94), accumula-tor and batteries (-22.07), bicycle and parts (-41.78), cranes, lifts and winches (-21.94), office equipments (-18.01), oth-
er construction machinery (-45.22), and prime mica products (-47.15) percent, re-spectively. Most prominently, medical and scientific devices registered 23.89 percent negative growth in exports in monthly terms and 4.96 percent positive growth in cumulative terms.
Table6: Region-wise exports trend ($ million)Region March 2019 March 2020 Growth (%) Apr-Mar 2018-19 Apr-Mar 2019-20 Growth (%)
North America 1445.44 1117.23 -22.7 15297.46 15168.29 -0.8
European Union 1519.90 869.29 -42.8 16133.27 14314.93 -11.3
ASEAN+2 2732.93 725.94 -73.4 12397.22 11370.85 -8.3
Middle East and West Asia (MEWA) 733.37 755.98 3.1 8798.83 8814.30 0.2
Africa 799.46 544.58 -31.9 7964.36 7771.91 -2.4
South Asia 762.28 463.10 -39.2 8242.22 6818.84 -17.3
NE Asia 552.32 353.18 -36.1 5771.50 5895.96 2.2
Latin America 413.94 248.98 -39.9 3452.40 3410.24 -1.2
Others 120.14 123.71 3.0 2108.40 1740.02 -17.5
CIS 82.54 64.91 -21.4 789.88 970.20 22.8
Grand total 9162.31 5266.90 -42.5 80955.54 76275.54 -5.8
Note: *Figures have been rounded off. **Myanmar has been included in ASEAN+2 and not in South Asia, since ASEAN is a formal economic grouping.Source: DGCI&S; Department of Commerce, Government of India
Source: Data from DGCI&S and EEPC India analysis
EUROPEAN UNION19%
CIS1%
NORTH AMERICA20%
SOUTH ASIA9%
LATIN AMERICA4%
NE ASIA8%
OTHERS 2%
AFRICA10%
MIDDLE EAST AND WEST ASIA (MEWA)
12% ASEAN-215%
Figure3: India’s region-wise exports during April-March 2019-20
Table7: Trends in engineering panel exports for March 2020 compared to March 2019, and April-March 2019-20 vis-à-vis April-March 2018-19 ($ million)Product panel March 2019 March 2020 Growth % Apr18-Mar19 Apr19-Mar20 Growth %Iron and steel and products made of iron and steel
Iron and steel 906.93 627.05 -30.9 9731.16 9260.74 -4.8
Products of iron and steel 723.35 461.36 -36.2 7259.37 7004.58 -3.5
Subtotal 1630.28 1088.41 -33.24 16990.5 16265.3 -4.27
Non-ferrous metals and products made of non-ferrous metals
Copper and products 128.83 57.88 -55.07 1067.18 918.11 -13.97
Aluminium and products 490.7 381.49 -22.26 5730.87 5114.52 -10.75
Zinc and products 36.86 56.54 53.39 603.01 569.07 -5.63
Nickel and products 5.58 4.14 -25.81 73.55 98.74 34.25
Lead and products 37.86 26.57 -29.82 402.9 372.06 -7.65
Tin and products 1.25 0.48 -61.60 9.83 9.86 0.31
Other non-ferrous metals 53.5 39.11 -26.90 545.67 546.37 0.13
Subtotal 754.58 566.21 -24.96 8433.01 7628.73 -9.54
Industrial machinery
Industrial machinery like boilers, parts, etc 127.16 48.72 -61.7 824.42 815.68 -1.1
IC engines and parts 269.85 188.36 -30.2 2759.32 2555.68 -7.4
Pumps of all types 100.18 62.33 -37.78 1002.73 959.07 -4.35
Air condition and refrigerators 189.77 95.74 -49.5 1983.63 1383.08 -30.3
Industrial machinery for dairy, food processing, textiles etc 628.5 414.01 -34.1 5884.8 5674.27 -3.6
Machine tools 47.38 27.98 -40.95 491.84 438.54 -10.84
Machinery for injecting moulding, valves and ATMs 176.18 124.23 -29.5 1631.24 1761.4 8.0
Subtotal 1539.02 961.37 -37.5 14578 13587.7 -6.79
Electrical machinery 776.41 689.08 -11.25 8415.06 8958.81 6.46
Auto components and parts
Motor vehicle/cars 831.33 528.06 -36.5 8510.5 7810.65 -8.2
Two and three wheelers 191.49 163.44 -14.6 2126.31 2110.78 -0.7
Auto components/part 546.73 365.77 -33.10 5784.5 5304.39 -8.30
Subtotal 1569.55 1057.27 -32.64 16421.31 15225.82 -7.28
Aircrafts and spacecraft parts and products 175.74 77.4 -55.96 1715.28 1427.19 -16.80
Ships, boats and floating products and parts 1845.15 239.72 -87.01 5699.6 4563.9 -19.93
Other engineering products
Medical and scientific instruments 169.63 129.11 -23.89 1684.87 1768.37 4.96
Railway transport 48.52 5.4 -88.87 377.14 238.95 -36.64
Hand tools and cutting tools 71.84 49.32 -31.35 764.48 752.45 -1.57
Electrodes accumulators 5.32 3.94 -25.94 54.2 55.22 1.88
Accumulator and batteries 33.31 25.96 -22.07 375.37 410.83 9.45
Bicycle and parts 42.03 24.47 -41.78 396.28 373.15 -5.84
Cranes lifts and winches 53.46 41.73 -21.94 503.66 566.34 12.44
Office equipment 14.49 11.88 -18.01 141.27 189.24 33.96
Other construction machinery 160.83 88.1 -45.22 1660.78 1406.39 -15.32
Prime mica and mica products 3.69 1.95 -47.15 34.33 39.43 14.86
Other misc. items 268.45 205.58 -23.42 2710.39 2817.68 3.96
Subtotal 871.57 587.44 -32.60 8702.77 8618.05 -0.97
Total engineering exports 9162.3 5266.9 -42.52 80955.54 76275.54 -5.78
Source: Department of Commerce, Government of India
OVERSIGHT

Table 8A: Chapter 72: Iron and steel ($ million)Month 2017-18 2018-19 Growth (%) 2019-20 Growth (%)
April 900.36 837.85 -6.9 715.13 -14.6
May 787.41 776.79 -1.3 692.45 -10.9
June 691.32 735.22 6.4 653.72 -11.1
July 850.94 804.63 -5.4 749.6 -6.8
August 899.14 1053.2 17.1 907.48 -13.8
September 1064.53 843.61 -20.8 933.47 10.7
October 941.68 755.77 -19.7 903.55 19.6
November 1203.34 710.91 -40.9 831.35 16.9
December 1069.17 687.04 -35.8 851.57 23.9
January 916.07 816.34 -10.9 735.75 -9.9
February 879.24 802.61 -8.8 637.73 -20.5
March 1015.85 906.93 -10.68 627.05 -30.9
April-March 11244.72 9731.16 -13.96 9260.74 -4.83
Table8B: Chapter 72: Iron and steel (‘000 tons)Month 2017-18 2018-19 Growth (%) 2019-20 Growth (%)
April 1286.78 1018.92 -20.82 1006.52 -1.22
May 1118.10 887.02 -20.67 941.31 6.12
June 952.26 860.95 -9.59 843.09 -2.07
July 1337.86 973.34 -27.25 1086.62 11.64
August 1300.24 1390.90 6.97 1462.13 5.12
September 1573.39 1060.65 -32.59 1561.48 47.22
October 1376.31 924.98 -32.79 1525.51 64.92
November 1798.00 874.52 -51.36 1440.58 64.73
December 1520.10 888.97 -41.52 1478.81 66.35
January 1225.14 1140.41 -6.92 1173.78 2.93
February 1135.11 1164.30 2.57
March 1264.93 1291.35 2.09 (April to January) 6.90
April-March 15888.26 12476.30 -21.47 12519.88
Engineering ferrous and non-ferrous products with negative growth in March 2020• Export of iron and steel under chapter 72: fell by 30.9 percent in
March 2020 and 4.8 percent in April-March 2019-20• Exports of products of iron and steel under chapter 73: fell by 36.2
percent in March 2020 and 3.5 percent in April-March 2019-20• Exports of copper and products under chapter 74: fell by 55.07
percent in March 2020 and 13.97 percent in April-March 2019-20• Exports of aluminium and products under chapter 76: fell by 22.3
percent in March 2020 and 10.75 percent in April-March 2019-20
• Exports of nickel and products under chapter 75: fell by 25.8 per-cent in March 2020 but cumulatively increased by 34.25 percent in April-March 2019-20
• Exports of lead and products under chapter 78: fell by 29.8 per-cent in March 2020 and 7.65 percent in April-March 2019-20
• Exports of tin and products under chapter 80: fell by 61.6 percent in March 2020 but cumulatively increased by 0.31 percent in April-March 2019-20.
Data for ferrous and non-ferrous panels experiencing decline in March 2020 vis-à-vis March 2019
Table9A: Chapter 73: Products of iron and steel ($ million)Month 2017-18 2018-19 Growth (%) 2019-20 Growth (%)
April 529.64 565.04 6.6 558.78 -1.1
May 511.27 575.87 12.6 544.83 -5.3
June 518.62 587.78 13.3 591.46 0.6
July 520.50 539.72 3.6 596.79 10.5
August 593.79 691.22 16.4 624.46 -9.3
September 641.24 615.69 -3.98 570.35 -7.36
October 506.61 569.97 12.51 592.72 3.99
November 542.52 533.39 -1.68 572.77 7.38
December 674.25 666.88 -1.09 653.10 -2.07
January 492.37 562.16 14.17 628.11 11.73
February 535.11 539.59 0.84 590.07 9.35
March 654.91 723.35 10.91 461.36 -36.2
April-March 6795.22 7259.37 7.28 7004.58 -3.51
Table9B: Chapter 73: Products of iron and steel (‘000 tons)Month 2017-18 2018-19 Growth (%) 2019-20 Growth (%)
April 310.06 265.94 -14.23 264.77 -0.44
May 311.18 295.46 -5.05 248.23 -15.99
June 296.59 288.75 -2.64 293.38 1.60
July 287.19 237.38 -17.34 271.11 14.21
August 343.02 327.95 -4.39 284.78 -13.16
September 362.63 293.51 -19.06 259.36 -11.63
October 253.61 247.69 -2.33 263.78 6.49
November 280.02 241.06 -13.91 267.61 11.01
December 370.05 323.76 -12.52 305.78 -5.55
January 327.68 278.10 -15.13 381.53 37.19
February 301.15 276.80 -8.07
March 360.09 349.72 -2.88 (April to January)
April-March 3803.32 3426.18 -9.92 2840.38
Table10A: Chapter 74: Copper and products ($ million) contdMonth 2017-18 2018-19 Growth (%) 2019-20 Growth ()
April 202.47 109.54 -48.6 67.17 -38.7
May 236.24 66.38 -74.01 63.75 -4.0
June 281.22 69.23 -77.19 56.46 -18.4
July 257.73 55.65 -80.19 62.53 12.4
August 319.68 77.73 -77.36 62.71 -19.3
September 340.95 95.89 -73.68 87.55 -8.7
October 297.22 108.51 -65.54 115.43 6.4
OVERSIGHT
MAY 2020 l INDIAN ENGINEERING EXPORTS l 57 56 l INDIAN ENGINEERING EXPORTS l MAY 2020

Table10A: Chapter 74: Copper and products ($ million)Month 2017-18 2018-19 Growth (%) 2019-20 Growth ()
November 296.92 113.36 -63.28 56.48 -50.2
December 303.64 109.86 -65.67 135.37 23.2
January 315.88 75.44 -77.81 83.10 10.2
February 248.80 56.76 -79.59 69.68 22.8
March 317.95 128.83 -62.61 57.88 -55.1
April-March 3418.76 1067.18 -70.00 918.11 -13.97
Table 10B: Chapter 74: Copper and products (‘000 tons)Month 2017-18 2018-19 Growth (%) 2019-20 Growth (%)
April 33.06 15.12 -54.26 7.32 -51.88
May 37.93 7.34 -80.63 7.21 -1.76
June 46.04 7.03 -84.73 5.60 -20.29
July 42.88 6.44 -84.97 7.66 18.84
August 46.69 9.35 -79.97 6.78 -27.24
September 49.63 12.68 -74.43 11.53 -9.13
October 44.00 15.35 -65.11 15.91 3.63
November 42.62 15.24 -64.23 7.12 -53.27
December 43.36 15.24 -64.84 20.54 34.73
January 43.82 8.80 -79.91 39.59 349.78
February 36.40 5.93 -83.71
March 45.00 15.99 -64.45 (April to January)
April-March 511.49 134.57 -73.69 129.30
Table11A: Chapter 76: Aluminium and products ($ million) Month 2017-18 2018-19 Growth (%) 2019-20 Growth (%)
April 395.75 412.51 3.6 407.91 -1.1
May 291.4 514.50 75.9 375.44 -27.0
June 331.32 542.75 63.2 412.74 -24.0
July 341.04 475.16 38.8 399.74 -15.9
August 359.46 504.19 40.3 417.68 -17.2
September 451.66 494.77 9.5 490.96 -0.8
October 405.08 478.33 44.97 399.72 -16.4
November 422.65 469.76 11.1 470.45 0.1
December 477.19 473.85 -0.7 524.59 10.7
January 439.12 463.83 5.6 428.82 -7.5
February 271.85 410.52 41.09 404.16 -1.5
March 519.83 490.70 -6.14 381.49 -22.3
April-March 4775.76 4829.65 19.42 4328.05 -10.4
Table12A: Chapter 75: Nickel and products ($ million)Month 2017-18 2018-19 Growth (%) 2019-20 Growth (%)
April 2.74 6.1 122.6 4.45 -27.0
May 2.31 6.72 190.9 35.23 424.3
June 2.16 6.81 215.3 5.50 -19.2
July 2.65 6.08 129.4 4.80 -21.1
August 6.69 7.47 11.7 4.92 -34.1
September 3.28 5.24 59.70 6.07 15.89
October 6.42 5.90 -8.16 9.34 40.46
November 2.98 3.88 30.22 4.91 26.58
December 2.89 5.35 85.33 6.88 28.47
January 5.24 2.75 -47.58 6.24 127.22
February 3.77 5.89 44.45 3.84 -34.8
March 3.73 5.58 38.23 4.14 -25.8
April-March 66.53 73.55 57.02 98.74 34.25
Table 11B: Chapter 76: Aluminium and products (‘000 tons)Month 2017-18 2018-19 Growth (%) 2019-20 Growth (%)
April 164.65 163.31 -0.82 178.10 9.05
May 129.38 197.50 52.65 166.61 -15.64
June 147.60 207.71 40.73 190.31 -8.38
July 150.35 185.54 23.41 179.80 -3.10
August 156.97 198.46 26.43 186.99 -5.78
September 192.78 202.27 4.92 221.73 9.62
October 170.34 200.96 18.00 129.26 -35.88
November 174.01 197.03 13.23 179.77 -8.79
December 196.09 195.44 -0.33 245.15 25.42
January 179.89 202.26 13.29 199.89 -1.37
February 152.94 178.03 16.41
March 197.78 208.88 5.61 (April to January) -22.3
April-March 2011.78 2337.85 16.21 1877.64
Table12B: Chapter 75: Nickel and products (‘000 tons) contdMonth 2017-18 2018-19 Growth (%) 2019-20 Growth (%)
April 0.15 0.32 115.74 0.26 -17.66
May 0.14 0.32 134.64 0.23 -29.68
June 0.12 0.33 170.02 0.28 -15.92
July 0.18 0.28 55.27 0.31 9.28
August 0.56 0.35 -37.04 0.24 -31.30
MAY 2020 l INDIAN ENGINEERING EXPORTS l 59 58 l INDIAN ENGINEERING EXPORTS l MAY 2020
OVERSIGHT

Table12B: Chapter 75: Nickel and products (‘000 tons)Month 2017-18 2018-19 Growth (%) 2019-20 Growth (%)
September 0.22 0.30 38.77 0.43 43.57
October 0.43 0.32 -24.22 0.33 -1.04
November 0.21 0.25 19.32 0.25 -0.94
December 0.14 0.22 56.06 0.34 50.15
January 0.20 0.34 74.14 0.43 29.03
February 0.25 0.36 46.36
March 0.21 0.35 67.50 (April to January)
April-March 2.8 3.76 34.13 3.10
Table13A: Chapter 78: Lead and products ($ million)Month 2017-18 2018-19 Growth (%) 2019-20 Growth (%)
April 26.58 27.35 2.91 30.1 10.1
May 15.41 35.8 132.35 24.75 -30.9
June 15.02 32.68 117.56 19.5 -40.3
July 27.13 31.24 15.15 19.47 -37.7
August 35.27 33.04 -6.33 38.90 17.7
September 41.56 31.05 -25.28 36.69 18.2
October 30.09 38.15 26.80 39.60 3.8
November 31.63 28.69 -9.31 45.76 59.5
December 38.94 43.47 11.64 40.96 5.8
January 36.39 38.05 4.9 25.66 -32.6
February 41.01 25.52 -37.78 23.25 -8.9
March 57.62 37.86 -34.29 26.57 -29.8
April-March 396.65 402.9 1.58 372.06 -7.65
Table13B: Chapter 78: Lead and products (‘000 tons)Month 2017-18 2018-19 Growth (%) 2019-20 Growth (%)
April 11.10 11.02 -0.73 13.89 26.05
May 6.39 14.68 129.54 11.92 -18.81
June 6.50 13.20 102.92 9.49 -28.04
July 11.81 12.34 4.49 9.42 -23.67
August 15.20 13.81 -9.13 18.73 35.59
September 17.14 13.81 -19.43 17.10 23.84
October 12.13 17.25 42.13 18.13 5.12
November 12.61 13.17 4.53 20.53 55.87
December 15.27 20.65 35.23 18.71 -9.40
January 14.00 17.89 27.74 12.12 -32.24
February 15.67 11.84 -24.43
March 21.67 17.13 -20.92 (April to January) -29.8
April-March 159.54 176.84 10.84 150.13
Table14A: Chapter 80: Tin and products ($ million)Month 2017-18 2018-19 Growth (%) 2019-20 Growth (%)
April 1.18 0.56 -52.46 0.65 16.1
May 1.98 0.38 -80.69 0.91 139.5
June 0.73 0.84 15.16 0.97 15.5
July 0.45 0.84 88.10 0.48 -42.9
August 0.69 0.81 17.60 1.22 50.6
September 1.58 0.58 -62.99 0.84 44.8
October 0.50 0.69 36.37 0.78 13.0
November 0.66 1.17 78.69 1.10 -6.0
December 0.51 1.23 139.90 0.46 62.6
January 1.27 0.57 -54.83 1.24 117.5
February 1.16 1.26 8.79 0.54 -57.1
March 1.12 1.25 14.79 0.48 -61.60
April-March 11.84 9.83 -13.50 9.86 0.31
Table14B: Chapter 80: Tin and products (‘000 tons)Month 2017-18 2018-19 Growth (%) 2019-20 Growth (%)
April 0.15 0.07 -49.5 0.06 -15.05
May 0.16 0.12 -24.5 0.11 -2.92
June 0.14 0.13 -5.7 0.01 -23.99
July 0.069 0.068 -2.1 0.061 -10.69
August 0.562 0.727 29.3 0.11 52.22
September 0.038 0.038 0.0 0.065 72.57
October 0.037 0.043 16.2 0.13 193.45
November 0.05 0.06 23.40 0.07 17.38
December 0.04 0.07 53.79 0.04 -42.63
January 0.07 0.03 -51.39 0.13 292.15
February 0.062 0.061 -1.39
March 0.07 0.08 9.98 (April to January)
April-March 0.996 0.859 -13.75 0.83
Figure4: Slump in iron and steel exports, March 2020 v/s March 2019 ($ million)Slump in iron and steel exports
Reasons for the fallIron and steel exports experienced a decline in the last month due to various reasons including high domestic demand and poor access to raw materials. The impact of COVID-19 was not so significant ow-ing to the fact that export orders had been received and export processing was happening smoothly. However, this month all of India’s exports have been heavily impacted due to the rapid spread of the COVID-19 pandemic globally and disruption of global supply chains.
1000900800700600500400300200100
0
906.93
627.05
-30.9%
March 2019 March 2020
$ M
illio
n
MAY 2020 l INDIAN ENGINEERING EXPORTS l 61 60 l INDIAN ENGINEERING EXPORTS l MAY 2020
OVERSIGHT

Figure5: Slump in products of iron and steel exports, March 2020 v/s March 2019 ($ million)
800
700
600
500
400
300
200
100
0
723.35
461.36
-36.2%
Slump in products of iron and steel exports
Figure6: Slump in copper and products exports, March 2020 v/s March 2019 ($ million)
140
120
100
80
60
40
20
0
$ M
illio
n$
Mill
ion
$ M
illio
n
128.83
57.88
-55.1%
Slump in copper and products exports
Reasons for the fallAs explained in the case of iron and steel exports, exports
of products of iron and steel are also reeling under the
impact of COVID-19 pandemic.
Reasons for the fallIndia’s copper exports have been on the decline during the
last year mainly due to the closure of the Starlight Smelt-
ing plant in Tamil Nadu. However, since the last two to
three months copper exports were improving in the coun-
try. This month’s slump can be attributed to the global
COVID-19 pandemic.
Figure7: Slump in aluminium exports, March 2020 v/s March2019 ($ million)Slump in aluminium and products exports
Reasons for the fallThe global COVID-19 pandemic and subsequent disrup-
tion of the global value chain is primarily accountable for
the falling aluminium exports in March 2020. In fact the
LME prices of aluminium have been on the decline since
sometime which implies lesser gains from trade.
600
500
400
300
200
100
0
490.7
381.49
-22.3%
Figure8: Slump in lead and products exports, March 2020 v/s March 2019 ($ million)
40
35
30
25
20
15
10
5
0
37.86
26.57
29.8%
Slump in lead and lead products exports
Reasons for the fallGlobally all base metal markets have been reeling
under the COVID-19 pandemic, disruption of key
value chains and falling LME prices.
Figure9: Slump in nickel and products exports, March 2020 v/s March 2019 ($ million)
Figure10: Slump in tin and products exports, March 2020 v/s March 2019 ($ million)
6
5
4
3
2
1
0
5.58
4.14
-25.8%
Slump in nickel and products exports
Slump in tin and products exports
Reasons for the fallGlobally all base metal markets have been reeling under COVID-19 pandemic, disruption of key val-ue chains and falling LME prices.
Reasons for the fallGlobally all base metal markets have been reeling under COVID-19 pandemic, disruption of key val-ue chains and falling LME prices.
1.4
1.2
1
0.8
0.6
0.4
0.2
0
1.26
0.54-61.6%
$ M
illio
n$
Mill
ion
$ M
illio
n
March 2019
March 2019
March 2019
March 2020
March 2020
March 2020
March 2019
March 2019
March 2020
March 2020
March 2019 March 2020
MAY 2020 l INDIAN ENGINEERING EXPORTS l 63 62 l INDIAN ENGINEERING EXPORTS l MAY 2020
OVERSIGHT

64 l INDIAN ENGINEERING EXPORTS l MAY 2020 MAY 2020 l INDIAN ENGINEERING EXPORTS l 65
Engineering panels – country-wise analysisWe now analyse the performance of some of the important products during March 2020. We have taken the major panels and computed the top importers and sharp declines to get an idea of the current trade pattern. (Tables 15-23)
Export of iron and steel• Vietnam, Nepal, and UAE were the three top importers of Indian iron and steel during April-March 2019-20 with market shares of 11.86, 10.61, and 8.36 percent respectively.• Vietnam, China, and Egypt recorded more than 50 percent y-o-y growth in exports of Indian iron and steel during April-March 2019-20 compared to April-March 2018-19.• Ethiopia, Saudi Arabia and Korea ex-perienced sharp downfall to the extent of more than 35 percent drop in exports during April-March 2019-20 compared to same period last fiscal.
Export of products of iron and steel• USA, UAE, and Germany were the three top importers of India’s products of iron and steel during April-March 2019-20 with 22.69, 6, and 5.37 percent shares respectively in India’s global import of the same.• Peru, Libya, Cameroon, and Ethio-pia experienced more than 250 percent growth in import of products of iron and steel during April-March 2019-20.• Iraq, Mauritania, Egypt, and Tanzania conceded substantial decline in imports by more than 60 percent for the product group from India during April-March 2019-20.
Export of industrial machinery• USA was the largest importer of Indi-an industrial machinery during April-March 2019-20 with 15.64 percent share in India’s global import of the product group. Thailand and Bangladesh were the two immediate followers with 5.07 and
4.73 percent shares respectively. • Russia and Uganda were among the ma-jor importing nations witnessing growth of 99.66 and 41.09 percent respectively in imports of industrial machinery from In-dia during April-March 2019-20 over the same period last fiscal.• Among the major importers, Iran, Viet-nam, Indonesia, and Kenya recorded over 30 percent y-o-y decline in imports dur-ing April-March 2019-20.
Export of Automobiles• Mexico, USA, and South Africa were the three top importers of India’s auto-mobiles during April-March 2019-20 with 14.12, 10.17, and 9.28 percent share in India’s global exports respectively over the same period last fiscal. • Saudi Arabia recorded over 100 percent growth in imports of the product group from India during April-March 2019-20 over the same period last fiscal. • Countries like Belgium, Egypt, Spain, and Algeria saw their imports of auto-mobile lower by more than 65 percent during April-March 2019-20 compared to same period last fiscal.
Export of non-ferrous metals• Malaysia, Korea, and USA were the three top importers of India’s non-fer-rous metals and products during April-March 2019-20 with 17.27, 15.07, and 12.06 percent shares respectively in In-dia’s global import of the same.• Tanzania and Egypt experienced more than 45 percent growth in import of non-ferrous metals and products during April-March 2019-20.• Turkey, Mexico, and Spain conceded substantial decline in imports by more than 55 percent for the said product group from India during April-March 2019-20 vis-à-vis same period last fiscal.
Export of electrical machinery and components• USA, Germany, and UK were the three top importers of Indian electrical ma-
chinery and components during April-March 2020 with market shares of 31.21, 9.84, and 7.14 percent respectively. Out of these top five importers, Singapore experienced a drop in imports during April-March 2019-20 compared to April-March 2018-19.• Nigeria, South Africa, Turkey, and Poland recorded more than 50 percent growth in imports of India’s electri-cal machinery and components during April-March 2019-20 vis-à-vis April-March 2018-19. • Belgium and Indonesia experienced sharp decline of about 70 percent in their imports in April-March 2019-20 when compared to April-March 2018-19. It is also the case for Egypt and Japan which experienced more than 50 percent drop.
Export of aircrafts and space crafts• USA, UK, and Singapore were the top three importers of India’s aircrafts and spacecrafts during April-March 2019-20 with around 35.2, 12.08, and 11.78 per-cent shares respectively in India’s total global exports of the product. • Mauritius, UAE, and Mexico registered substantial growth of more than 100 percent in imports of the product group from India during April-March 2019-20 as compared with the same period last fiscal. • On the flipside, demand for India’s air-crafts and spacecrafts from Seychelles, Ireland, Belgium, and Switzerland dropped more than 65 percent on a y-o-y basis during April-March 2019-20 when compared to April-March 2018-19.
Export of ships, boats and floating structures and parts • UAE, Singapore, and Indonesia became the largest importers of ships, boats and floating structures followed by Cyprus and Sri Lanka. Their respective shares were 28.66, 20.41, 11.56, 7.67, and 5.18 percent.• Imports to Norway, UK, and Nether-lands recorded meteoric increase as they
Table15: Export of iron and steel ($ million)Country March 18 March 19 Growth % Apr-Mar 18-19 Apr-Mar 19-20 Growth %
TOP 5 IMPORTERS
Vietnam 77.39 59.47 -23.15 486.22 1098.14 125.85
Nepal 75.50 82.61 9.42 1140.02 982.89 -13.78
UAE 83.74 71.43 -14.70 733.35 774.53 5.61
Italy 154.89 61.90 -60.04 884.33 727.25 -17.76
China 45.97 19.79 -56.96 318.91 513.90 61.15
HIGH CUMULATIVE GROWTH
Vietnam 77.39 59.47 -23.15 486.22 1098.14 125.85
China 45.97 19.79 -56.96 318.91 513.90 61.15
Egypt 4.67 7.81 67.39 45.27 69.98 54.58
Bhutan 7.18 5.75 -19.85 55.09 81.61 48.13
Russia 8.17 7.54 -7.63 80.99 112.99 39.51
Oman 3.67 4.92 33.86 84.31 114.15 35.40
SHARP CUMULATIVE DECLINE
Ethiopia 8.08 3.08 -61.90 85.79 49.13 -42.73
Saudi Arabia 3.86 8.47 119.13 158.72 98.96 -37.65
Korea 29.67 17.44 -41.22 448.98 284.22 -36.70
Mexico 8.16 5.19 -36.32 105.53 70.88 -32.84
USA 20.52 10.40 -49.31 247.40 170.58 -31.05
Spain 25.11 4.46 -82.25 310.76 215.47 -30.66
Source: Department of Commerce Government of India
Table16: Export of products iron and steel ($ million)Country March 18 March 19 Growth % Apr-Mar 18-19 Apr-Mar 19-20 Growth %
TOP 5 IMPORTERS
USA 158.14 98.60 -37.65 1692.91 1589.07 -6.13
UAE 46.95 32.35 -31.09 453.81 419.98 -7.46
Germany 34.26 23.50 -31.40 423.53 376.08 -11.20
Canada 20.01 14.83 -25.87 272.66 373.58 37.01
UK 28.39 17.02 -40.04 318.50 296.54 -6.89
HIGH CUMULATIVE GROWTH
Peru 1.33 4.25 218.82 6.59 70.02 961.69
Libya 0.14 0.75 416.12 4.03 25.19 525.56
Cameroon 0.13 3.86 2894.29 4.56 26.34 478.06
Ethiopia 0.78 4.24 440.61 13.43 51.03 279.95
Oman 6.60 4.57 -30.77 77.67 120.50 55.15
Indonesia 6.20 7.10 14.57 58.75 90.20 53.52
SHARP CUMULATIVE DECLINE
Mauritania 3.53 0.80 -77.42 39.30 6.39 -83.75
Iraq 0.32 0.82 156.60 32.00 6.29 -80.33
Tanzania 5.42 0.85 -84.28 80.89 30.07 -62.83
OVERSIGHT

66 l INDIAN ENGINEERING EXPORTS l MAY 2020 MAY 2020 l INDIAN ENGINEERING EXPORTS l 67
Table16: Export of products iron and steel ($ million) contdCountry March 18 March 19 Growth % Apr-Mar 18-19 Apr-Mar 19-20 Growth %
SHARP CUMULATIVE DECLINE
Egypt 5.34 1.25 -76.64 89.72 34.51 -61.53
Chile 68.89 0.93 -98.65 123.83 52.47 -57.62
Kuwait 4.65 3.67 -21.10 103.16 63.62 -38.33
South Africa 5.22 4.76 -8.95 88.08 58.70 -33.36
Source: Department of Commerce Government of India
Table17: Export of industrial machinery ($ million)Country March 18 March 19 Growth % Apr-Mar 18-19 Apr-Mar 19-20 Growth %
TOP 5 IMPORTERS
USA 221.76 142.80 -35.61 2324.52 2125.33 -8.57
Thailand 64.25 53.39 -16.90 634.60 688.95 8.56
Bangladesh 109.96 38.91 -64.61 727.14 642.18 -11.68
Germany 71.83 35.66 -50.36 662.49 591.70 -10.69
China 53.81 50.18 -6.76 518.07 577.49 11.47
HIGH CUMULATIVE GROWTH
Russia 17.04 11.12 -34.76 134.91 269.35 99.66
Uganda 8.15 5.19 -36.31 60.25 85.01 41.09
Singapore 27.21 19.76 -27.40 229.26 313.39 36.70
Myanmar 8.21 3.24 -60.51 55.76 69.95 25.45
Nigeria 71.30 37.17 -47.86 431.39 538.72 24.88
Brazil 15.88 24.12 51.90 189.35 233.44 23.29
Philippines 9.28 4.53 -51.19 78.33 95.99 22.55
SHARP CUMULATIVE DECLINE
Iran 4.61 5.55 20.20 166.23 57.60 -65.35
Vietnam 38.63 11.29 -70.78 207.77 125.18 -39.75
Indonesia 39.93 17.36 -56.54 405.69 275.89 -31.99
Kenya 13.68 9.60 -29.82 196.20 135.41 -30.98
Saudi Arabia 33.73 17.86 -47.04 382.56 269.48 -29.56
Spain 21.01 14.48 -31.08 248.80 182.76 -26.54
Source: Department of Commerce Government of India
Table18: Export of automobiles ($ million)Country March 18 March 19 Growth % Apr-Mar 18-19 Apr-Mar 19-20 Growth %
TOP 5 IMPORTERS
Mexico 122.50 70.30 -42.61 1343.64 1400.42 4.23
USA 116.14 116.18 0.03 1178.07 1008.85 -14.36
South Africa 49.24 65.46 32.93 708.40 920.31 29.92
Saudi Arabia 46.50 85.14 83.10 335.14 726.68 116.83
Nigeria 46.13 39.99 -13.32 432.65 543.65 25.65
Table18: Export of automobiles ($ million) contdCountry March 18 March 19 Growth % Apr-Mar 18-19 Apr-Mar 19-20 Growth %
HIGH CUMULATIVE GROWTH
Saudi Arabia 46.50 85.14 83.10 335.14 726.68 116.83
UAE 28.39 19.84 -30.11 225.55 330.88 46.70
Peru 11.88 11.86 -0.20 120.78 160.94 33.25
South Africa 49.24 65.46 32.93 708.40 920.31 29.92
Kuwait 9.57 1.69 -82.38 67.30 87.16 29.50
Nigeria 46.13 39.99 -13.32 432.65 543.65 25.65
Iraq 4.19 7.11 69.84 15.92 26.25 64.95
Qatar 3.60 7.67 113.24 18.99 28.94 52.36
SHARP CUMULATIVE DECLINE
Belgium 5.98 0.00 -100.00 62.64 10.19 -83.73
Egypt 14.66 3.34 -77.20 149.20 36.54 -75.51
Algeria 41.81 0.00 -100.00 287.06 80.74 -71.87
Spain 4.22 0.18 -95.76 66.60 20.74 -68.86
Indonesia 20.12 10.06 -50.02 373.95 177.79 -52.46
Canada 16.18 6.56 -59.44 137.80 70.46 -48.87
Indonesia 37.27 4.49 -87.94 279.72 150.60 -46.16
Note: Automobiles sector includes motor vehicles and two- and three-wheelersSource: Department of Commerce Government of India
Table19: Export of nonferrous metals ($ million)Country March 18 March 19 Growth % Apr-Mar 18-19 Apr-Mar 19-20 Growth %
TOP 5 IMPORTERS
Malaysia 78.10 129.12 65.33 965.47 1317.54 36.47
Korea 80.96 67.07 -17.15 860.38 1149.65 33.62
USA 101.32 57.50 -43.25 1069.34 919.88 -13.98
China 68.43 22.29 -67.43 332.98 458.36 37.65
Taiwan 11.92 15.07 26.39 341.96 256.15 -25.09
HIGH CUMULATIVE GROWTH
Tanzania 1.38 2.32 68.56 19.87 31.06 56.27
Egypt 1.74 3.28 88.94 37.14 54.95 47.94
China 68.43 22.29 -67.43 332.98 458.36 37.65
Malaysia 78.10 129.12 65.33 965.47 1317.54 36.47
Korea 80.96 67.07 -17.15 860.38 1149.65 33.62
Israel 5.20 5.15 -1.00 49.34 62.12 25.90
SHARP CUMULATIVE DECLINE
Turkey 3.85 4.45 15.73 507.22 51.57 -89.83
Spain 14.09 7.24 -48.61 216.88 85.71 -60.48
Mexico 14.80 11.90 -19.63 318.73 143.12 -55.10
Italy 22.35 18.90 -15.42 276.54 126.71 -54.18
Netherlands 12.15 5.58 -54.07 179.73 94.96 -47.16
Bangladesh 15.18 12.34 -18.68 251.75 171.91 -31.72
Source: Department of Commerce Government of India
OVERSIGHT

68 l INDIAN ENGINEERING EXPORTS l MAY 2020 MAY 2020 l INDIAN ENGINEERING EXPORTS l 69
Table20: Export of electrical machinery and components ($ million)Country March 18 March 19 Growth % Apr-Mar 18-19 Apr-Mar 19-20 Growth %
TOP 5 IMPORTERS
USA 190.42 280.32 47.22 1997.49 2796.10 39.98
Germany 55.47 65.66 18.38 880.72 881.20 0.05
UK 86.60 39.42 -54.48 557.74 639.97 14.74
Singapore 19.61 16.01 -18.34 512.40 422.38 -17.57
France 32.02 10.18 -68.20 260.63 297.05 13.97
HIGH CUMULATIVE GROWTH
Nigeria 20.79 28.95 39.26 99.64 268.78 169.76
South Africa 4.53 12.18 169.03 39.07 76.22 95.09
Turkey 8.24 22.40 171.73 109.96 193.15 75.65
Poland 9.12 4.08 -55.22 80.56 123.97 53.89
USA 190.42 280.32 47.22 1997.49 2796.10 39.98
SHARP CUMULATIVE DECLINE
Belgium 11.76 2.00 -83.02 330.03 99.74 -69.78
Indonesia 6.41 3.10 -51.58 166.69 50.60 -69.64
Egypt 4.21 2.21 -47.45 54.98 23.36 -57.51
Japan 5.17 4.45 -13.97 238.97 116.92 -51.07
Switzerland 3.26 0.84 -74.35 46.12 24.42 -47.06
Source: Department of Commerce Government of India
Table21: Export of aircrafts and spacecrafts ($ million)Country March 18 March 19 Growth % Apr-Mar 18-19 Apr-Mar 19-20 Growth %
TOP 5 IMPORTERS
USA 70.10 29.20 -58.34 557.49 502.38 -9.88
UK 29.79 9.06 -69.59 229.49 172.37 -24.89
Singapore 12.85 6.99 -45.62 226.49 168.10 -25.78
France 27.69 8.31 -69.98 238.52 165.79 -30.50
Germany 7.09 5.02 -29.22 109.07 76.42 -29.93
HIGH CUMULATIVE GROWTH
Mauritius 0.08 0.00 -99.74 0.58 4.53 680.03
UAE 0.27 0.52 92.91 8.17 22.51 175.53
Mexico 0.70 1.29 83.66 5.98 12.64 111.33
Spain 0.55 0.34 -37.70 2.41 4.74 96.28
Russia 0.33 0.59 77.77 16.25 31.67 94.88
Vietnam 0.13 0.00 -100.00 3.17 5.93 86.81
SHARP CUMULATIVE DECLINE
Seychelles 0.31 0.00 -100.00 26.39 0.15 -99.44
Belgium 0.04 0.13 212.61 13.15 1.91 -85.47
Ireland 0.14 0.02 -83.06 12.94 2.15 -83.37
Switzerland 0.80 0.15 -81.45 22.33 7.64 -65.77
Poland 0.51 0.35 -30.22 12.45 4.45 -64.30
Source: Department of Commerce Government of India
Table22: Export of ships boats and floating structures and parts ($ million)Country March 18 March 19 Growth % Apr-Mar 18-19 Apr-Mar 19-20 Growth %
TOP 5 IMPORTERS
UAE 34.44 119.37 246.64 1357.70 1307.85 -3.67
Singapore 1283.95 27.35 -97.87 1989.65 931.30 -53.19
Indonesia 504.08 19.95 -96.04 734.61 527.45 -28.20
Cyprus 0.00 0.00 - 0.00 349.98 -
Oman 0.00 62.45 1604545.94 276.46 236.56 -14.43
HIGH CUMULATIVE GROWTH
Norway 0.00 0.00 - 0.00 58.33 7879122.47
U K 0.00 0.00 - 0.01 209.36 1810300.53
Netherlands 0.00 0.02 - 0.03 74.63 218931.12
Malaysia 0.00 0.00 - 8.52 198.93 2235.47
France 0.00 0.00 - 2.97 22.55 658.17
SHARP CUMULATIVE DECLINE
Namibia 0.00 0.00 - 24.01 0.00 -100.00
South Africa 0.00 0.00 - 198.48 0.00 -100.00
Belgium 0.00 0.00 - 150.05 0.01 -100.00
Nigeria 0.00 0.00 - 24.87 0.00 -99.99
Qatar 0.00 0.00 - 29.39 0.01 -99.97
Saudi Arabia 0.03 0.00 - 104.63 4.71 -95.50
Bahrain 0.00 9.25 - 63.63 9.25 -85.47
Note: Export figures in case of some nations are showing zero due to rounding off but actually they are very small in valueSource: Department of Commerce and CSO
Table22: Export of auto components ($ million)
Country February 18 February 19 Growth % Apr-Feb 18-19 Apr-Feb 19-20 Growth %
TOP 5 IMPORTERS
USA 116.01 75.43 -34.98 1269.36 1164.95 -8.23
Bangladesh 32.18 23.46 -27.10 315.13 283.45 -10.05
Brazil 31.84 20.51 -35.57 298.58 271.90 -8.94
Turkey 21.52 19.26 -10.52 308.66 267.33 -13.39
Germany 27.42 17.82 -35.01 272.72 258.14 -5.35
HIGH CUMULATIVE GROWTH
Slovenia 0.53 1.49 182.48 6.65 15.07 126.54
Philippines 5.71 6.36 11.33 51.57 91.30 77.03
Czech Republic 2.86 2.06 -28.07 22.05 34.03 54.34
Morocco 1.19 1.23 3.54 11.58 16.85 45.47
Taiwan 2.39 2.14 -10.61 19.57 25.35 29.53
Malaysia 3.59 1.88 -47.75 23.59 28.67 21.55
OVERSIGHT

70 l INDIAN ENGINEERING EXPORTS l MAY 2020
had practically no import in April-March 2018-19. Malaysia registered substan-tial growth of 2235.5 percent in import of the product group from India during April-March 2019-20 as compared with the same period last fiscal.• However, sharp decline was noticed in exports to Saudi Arabia. In fact exports to that country have been less than $5 million in April-March 2019-20 except
Bahrain, whereas exports dropped to zilch for Namibia, South Africa, Belgium, Nigeria, and Qatar.
Export of auto components• USA remained the top importer of auto components in April-March 2019-20 with a share of 21.96 percent. It was fol-lowed by Bangladesh, Brazil, Turkey, and Germany with respective shares of 5.34,
5.13, 5.04, and 4.87 percent.• Slovenia and Philippines recorded maximum increase of more than 75 per-cent in imports from April-March 2019-20 when compared to April-March 2018-19.• However, Singapore and Romania re-corded significant decline of more than 30 percent in April-March 2019-20 when compared to April-March 2018-19.
INDIA’S ENGINEERING IMPORTSIndia’s engineering imports during March 2020 were valued at $7132.2 million compared to $9402.1 million in March 2019 registering a negative growth of 24.1 percent in dollar terms.
Cumulative engineering imports dur-ing April-March 2019-20 were recorded at $100.55 billion as against $111.21 bil-lion during the same period last fiscal, registering a fall of 9.6 percent.
The share of engineering imports in India’s total merchandise imports dur-ing April-March 2019-20 has been esti-mated at 21.5 percent.
The monthly engineering import fig-ures for fiscal April-March 2019-20 vis-à-vis April-March 2018-19 is depicted in Table24 as per the latest availability of data. Figure11 depicts the monthly trend in engineering imports for April-March 2019-20 compared to April-March 2018-19.
Table24: Engineering imports ($ million)Months 2018-19 2019-20 Growth (%)April 8139.45 8143.84 0.1May 8536 8875.2 4.0June 8890.89 7827.95 -12.0July 9272.5 8938.2 -3.6August 10097.3 8779.3 -13.1September 8858.41 7915.5 -10.6October 9346.29 8711.71 -6.8
November 9245.44 7611.71 -17.7
December 10331.2 8896.1 -13.9January 9594.17 9271.98 -3.4February 8381.48 8446.97 0.8March 9402.1 7132.2 -24.1
Source: Department of Commerce, Government of India
Table22: Export of auto components ($ million) contd
Country February 18 February 19 Growth % Apr-Feb 18-19 Apr-Feb 19-20 Growth %
SHARP CUMULATIVE DECLINE
Singapore 0.91 1.25 36.58 30.78 15.21 -50.60
Romania 7.48 1.99 -73.37 97.68 63.92 -34.57
Kenya 0.81 1.52 88.50 23.13 16.85 -27.16
Russia 9.76 4.08 -58.18 92.46 67.54 -26.96
Peru 2.09 0.68 -67.28 25.74 18.87 -26.66
Source: Department of Commerce and CSO
8.1 8.5 8.9 9.3 10
.18.
9 9.3
9.2 10
.39.
68.
4 9.4
7.1
8.49.
3
8.9
7.6
8.7
7.98.
88.
97.
88.9
8.1
Figure11: Monthly engineering imports for 2019-20 vis-à-vis 2018-19 ($ billion)
Source: EEPC India analysis
12.0
10.0
8.0
6.0
4.0
2.0
0.0 2018-2019 2019-2020Apr May Jun Jul Aug Sep Oct Nov Dec Jan Feb Mar
$ m
illio
n
24%
OVERSIGHT
Follow these important instructions

72 l INDIAN ENGINEERING EXPORTS l MAY 2020 MAY 2020 l INDIAN ENGINEERING EXPORTS l 73
TREND IN TWO-WAY ENGINEERING TRADEWe now present the trend in the two-way yearly trade for the engineering sec-tor from 2014-15 to 2018-19 as well as the current fiscal 2019-20 depicted in Table25. Figure12 depicts the yearly trend in engineering trade from 2014-15 to 2019-20.
To concludeAfter After experiencing a marginal increase last month, India’s engineering exports have declined significantly this month owing to the global economic disruptions under the COVID-19 crisis. Almost all the major panels (33 out of 36) have experienced significant export decline in March 2020 when compared to the same period last year. Barring zinc and zinc products, all the base metal exports have fallen significantly.
India’s engineering exports have been already performing weakly in the recent fiscal majorly due to global trade ten-sions, heavy protectionism among key markets, and high raw material prices within the country. However, the export-ing community had been hopeful that the export performance will improve signifi-cantly in the last two months of the fiscal and India’s engineering exports would continue to match up to last year’s level of $81 billion. This hope, however, was shattered by the pandemic, which initiat-ed in China in December 2019 and rap-idly created a global health and economic crises. The current global economic sit-uation has been compared to the global recession during the Great Depression era by both the World Bank and IMF. In her latest press conference, the IMF Managing Director, Ms Kristalina Geor-gieva, has clearly mentioned that the year 2020 could see the worst global economic fallout since the Great Depression in the 1930s with over 170 countries experienc-ing negative per capita income growth
due to the pandemic. The pandemic has compelled countries
including India to take tough decisions such as lockdowns and shutting up of eco-nomic activities. This has heavy impacted supply chains and global value chains. As per the recent WTO press release world trade is expected to fall between 13 per-cent and 32 percent in 2020 due to the pandemic. Given the disruptions the pan-demic has caused in global supply chains, WTO further mentions that industries with complex supply chains including au-tomobile and electronics would be hardest hit. All the regions around the world are expected to suffer a declining trade with exports from USA and Asian economies undergoing the worst impact.
In such times, the Government of In-dia has extended support to the export-ing community by organising repeated conferences with key industries to under-stand and solve issues affecting exports. They have also extended key benefits such as Foreign Trade Policy for the next fis-
cal which is of great importance for the exporting community. The recent RBI announcements on access to finance for MSMEs during these difficult times have also benefited the engineering indus-try, a substantial percentage of which are MSMEs.
Since the lockdown in India, the sup-ply chain has been significantly disrupted. While exporters have received orders for the month of March, they cannot procure raw materials or transport their products to the port due to lack of transporters and labourers. In such a scenario, exporters are worried that they may lose the mar-kets to other competitors. With this back-ground, the exporting community has re-quested the government to give exporters and manufacturing top priority and to permit engineering goods manufacturers and exporters to resume in a controlled manner during the lockdown phase keep-ing all safety measures in place. This will allow the community to fulfil existing or-ders and pre-empt cancellations.
Table25: Engineering trade ($ billion)Trade flow 2014-
152015-16
2016-17
2017-18 2018-19
Growth %
Apr-Mar 19
Apr-Mar 20
Growth %
Engineering export
70.7 58.4 65.2 76.2 81.0 6.3 80.96 76.28 -5.8
Engineering import
77.3 75.9 81.8 93.9 104.2 10.9 111.21 100.55 -9.6
Trade balance -6.6 -17.5 -16.6 -17.7 -23.1 -30.25 -24.27
Figure12: Trend in monthly engineering trade
120.0
100.0
80.0
60.0
40.0
20.0
0.0
-20.0
-40.0
100.55
76.28
111.21
93.981.8
65.275.958.4
77.370.7 80.9676.2
Engineering Export
$ bi
llion
Engineering Import Trade Balance
2014-15 2015-16 2016-17 2017-18 2018-19 2019-20
OVERSIGHT
HO (Cell)Suranjan GuptaExecutive DirectorEEPC IndiaVandhna (4th Floor)11 Tolstoy Marg, New Delhi 110 001Tel: 91-11-23353353, 23711124/25Fax: 91-11-23310920e-mail: [email protected]
REGISTERED & HEAD OFFICEAdhip MitraAdditional Executive Director & SecretaryEEPC IndiaVanijya Bhavan (1st Floor)International Trade Facilitation Centre1/1 Wood StreetKolkata 700 016Tel: 91-33-22890651/52/53Fax: 91-33-22890654e-mail: [email protected]
REGIONAL OFFICESChennaiEEPC IndiaGreams Dugar (3rd Floor)149 Greams Road, Chennai 600 006Tel: 91-44-28295501/5502 Fax: 91-44-28290495e-mail: [email protected]
KolkataEEPC IndiaVanijya Bhavan (2nd Floor)International Trade Facilitation Centre1/1 Wood Street, Kolkata 700 016Tel: 91-33-22890673/74 Fax: 91-33-22890687e-mail: [email protected]
MumbaiEEPC IndiaB-202 & 220, Aurus Chambers Annex "B", 2nd Floor (behind Mahindra Tower)S.S. Amrutwar Marg, Worli, Mumbai 400 013Tel: 91-22-42125555 Fax: 91-22-42125556e-mail: [email protected]
New DelhiEEPC IndiaFlat No. 10 P, Q, N, 10th Floor, DCM Building16 Barakhamba Road, New Delhi 110 001Tel: 91-11-23314171/74 Fax: 91-11-23317795e-mail: [email protected]
BengaluruEEPC IndiaEmbassy Square, Flat 103148 Infantry RoadBengaluru 560 001Tel: 91-80-22261396 / 8669Fax: 91-80-22266914e-mail: [email protected]
HyderabadEEPC India'Soham Mansion' (1st Floor)No. 5-4-187/3 & 4/4, M. G. RoadSecunderabad 500 003Tel: 91-40-27536704 Telefax: 91-40-27536705e-mail: [email protected]
JalandharEEPC IndiaPlot Comm. 1, Focal PointJalandhar 144 012Tel: 91-181-2602264Fax: 91-181-2601124e-mail: [email protected]
AhmedabadEEPC IndiaTF-313/A (3rd Floor) ATMA House, Ashram RoadAhmedabad 380 009Tel: 91-9725663534/79-26588720e-mail: [email protected]
CIN: U51900WB1955NPL022644
EEPC India officesCHAIRMANRavi SehgalTel: 91-33-22903284 / 22878229Fax: 91-33-22879938e-mail: [email protected]@carnationindustries.com
SR VICE CHAIRMANMahesh K DesaiTel: 91-40-27617098 / 5131 Fax: 91-40-27614376e-mail: [email protected]
VICE CHAIRMANArun Kumar GarodiaTel: 91-33-40052700 Fax: 91-33-40052800e-mail: [email protected], [email protected]
REGIONAL CHAIRPERSONSEastern RegionB D AgarwalTel: 91-33-22487249 Fax: 91-33-22481879e-mail: [email protected], [email protected]
Northern RegionKamna Raj Aggarwalla Tel: 91-181-2642001/02/03/04 Fax: 91-181-2642005 e-mail: [email protected], [email protected]
Southern RegionK S Mani Tel: 91-491-253-5669, 253-9870, 253-6017 e-mail: [email protected]; [email protected]
Western RegionKrishanlal DhingraTel: 91-22-64527953 Fax: 91-22-26556955e-mail: [email protected]
Office bearers of EEPC India
Offices in India
Sub-regional offices
The rates are for a single
insertion. Discounts may be
given for more than one
insertion.
The discounts are:
For 3 months 3%
For 6 months 6%
For 12 months 10%
Members of EEPC India will get
a further discount of 10% of the
total cost.
Advertisement Tariff
Colour Black and white
Back Cover Rs20,000 (US$294)
Inside Back Cover Rs16,000 (US$235)
Inside Front Cover Rs18,000 (US$264)
Centre-spread Rs30,000 (US$441)
Full Page Rs13,000 (US$191) Rs10,000
Half Page Rs8,000 Rs6,000
Strip Rs6,000
Print Area
Back Cover 26.6 cm x 20.7 cm
Inside Back Cover 26.6 cm x 20.7 cm
Inside Front Cover 26.6 cm x 20.7 cm
Centre-fold 26.9 cm x 41.4 cm
Full Page 26.6 cm x 20.7 cm
Half Page 12.9 cm x 18.4 cm
IndianEngineeringExports advertising rates
The US dollar tariffs will be based on the
prevailing exchange rate

74 l INDIAN ENGINEERING EXPORTS l MAY 2020
Name of the event Place Date
Jimex Amman, Jordan 22-25 Jun 2020
Kenya Pharma 2020 Kenya 3-4 Sep 2020
Automechanika, Frankfurt Germany 8-12 Sep 2020
INDEE Tanzania Dar-es-Salaam, Tanzania 9-11 Sep 2020
IMTS, USA USA 14-19 Sep 2020
Pumps, Valves & Pipes, Africa South Africa 16-18 Sep 2020
Feria De Bogota Bogota, Colombia 21-25 Sep 2020
International Technical Fair Plovdiv, Bulgaria 23-28 Sep 2020
SUBCON, UK Birmingham, United Kingdom 28-30 Sep 2020
International Fasteners Expo Las Vegas, USA 28-30 Sep 2020
ITM, Poland Poland 3 - 6 Nov 2020
EEPC INDIA CALENDAR OF EVENTSAll events subject to change
EEPC India in collaboration with the ASEAN-India Centre (AIC) at Research and Information System for Developing Countries (RIS) presents COVID-19: Challenges for the Indian Economy - Trade and Foreign Policy Effects. It not only captures vital narratives but also presents important literature on the crisis.
The report covers three important issues: first, what is the magnitude of the impact of the crisis on Indian economy – is it shallow or deep, and the scope to rebound, particularly India’s exports; second, India’s immediate challenges in managing the recovery; and third, the longer-term structural challenges to the Indian economy.
Forty important commentaries by research scholars, professors, economists and practitioners on the trade and foreign policy challenges posed by Covid-19
and the way forward.
Challenges for the India Economy: Trade and Foreign Policy Effects
COVID-19
Click on the link below to download the pdf copy of this report: https://www.eepcindia.org/eepc-download/617-Covid19_Report.pdf
75

76
We are manufacturers of Horizontal and Vertical Surface Grinders Head Surface, Rotary Surface and Power Presses
New AHD Series
Vertical Rotary Surface Grinder
Vertical Surface Grinder
IMPACT ENGG. CORPN. (INDIA) Plot No. 14595, Sl. No. 2, Ganchi Nagar, Dholewal, Ludhiana 141003Ph: 0161-4663712, M: +91-98157-03712, 98725-07600Email: [email protected]
www.impactenggcorpn.com
IMPACT INTERNATIONAL Guruwali, Near Power House, Tarn Taran Road, Amritsar M: +91-98725-07600, 98157-03712Email: [email protected]
Date of publication: 1 MAY 2020, R.N.I. No: WBENG/2008/24569 Postal Registration No. KOL RMS/397/2018-2020