covid-19 transfer, mobility, and progress
TRANSCRIPT

COVID-19 TRANSFER, MOBILITY, AND PROGRESS
First Look Fall 2020 Report
October 27, 2020
FIRST IN THE SERIES
© 2020 National Student Clearinghouse. All rights reserved. 2
BACKGROUND – Transfer Pathways Amidst a Pandemic
Even before the pandemic turned the higher education landscape on its head, many college students intending to transfer struggled to manage the complexities of available transfer options, a task particularly daunting for underrepresented student groups. As prior research from the National Student Clearinghouse Research Center shows, Black and Hispanic students are significantly less likely than their Asian and White peers to transfer from a two-year to a four-year university as well as to leverage two-year institutions in summer enrollment between spring and fall terms at four-year institutions (behavior known as “summer swirling”). Lower income students beginning at a community college also transfer at much lower rates than higher income students and subsequently graduate with a bachelor’s degree at only half the rate of their higher income counterparts, according to new research from the NSC Research Center.
Early disruptions in institutional reopening plans due to COVID-19, coupled with the disparate economic and health impacts of COVID-19 across different populations, make navigating these transfer options even more difficult. Black, Hispanic, and indigenous populations in the U.S. have seen disproportionately high COVID-19 cases and virus-related deaths compared to Whites. Additionally, though loss of academic credits upon transfer has widened transfer gaps, many colleges are streamlining the transfer process in an effort to fill seats and improve diversity amidst the pandemic, but the scope and impact of this trend remains unclear.
The transfer and enrollment gaps by race and ethnicity and other student characteristics that existed before the pandemic may accelerate due to these disruptions that disproportionately impact underserved groups. Moreover, typical pathways of transfer and mobility may be altered due to concerns borne out of the pandemic related to cost and a sudden need to move closer to home, circumstances that may affect the rate at which students transfer from four-year to two-year colleges (reverse transfers), for example.
This new research series quantifies the impact of the pandemic on the various transfer pathways. The current report is a first look into how these patterns may be changing roughly one month into the fall semester of 2020 (as of September 24).
HIGHLIGHTS
The overall transfer enrollment is down 4.7 percent from last fall, declining slightly more steeply than undergraduate students generally (-4.5%). Each transfer pathway, however, responded differently. The number of reverse transfers fell far more (-18.4%), along with summer swirlers (-10.8%) and lateral transfers (-8.3%), while upward transfers unexpectedly increased by 2.6 percent.
The growth in upward transfers is led by continuing students, those who maintained enrollment since the COVID-19 outbreak. Most transferred without finishing an associate degree and their numbers grew this fall; and upward transfer students who cross state lines increased from last fall. Students who had stopped out prior to the outbreak are less likely to have come back at all this fall, and less than half of those who came back transferred.
This first look challenges recent predictions about the likely effects of the pandemic, such as an anticipated influx of four-year college students transferring into community colleges. There is also little evidence of an expected increase in the challenges facing students attempting upward transfers.
INTRODUCING THE COVID-19
TRANSFER, MOBILITY, AND PROGRESS REPORT SERIES
The National Student Clearinghouse Research Center will report transfer pattern data in a rapid-response series, with this initial report detailing what we know as of September 24, 2020, when 54 percent of colleges reported fall enrollments to the Clearinghouse. These immediate effects of the pandemic will be revised and updated in the subsequent issue to be released in December 2020.
We will issue two reports per academic term, starting with a first look of the term, followed by the end of term update.
Later reports in this series will provide a fuller picture of transfer and mobility trends based on a full academic year of data, and through the possible inclusion of additional data such as income, borrowing status, college reopening model, or program type, to name a few.
With support from Ascendium Education Group and the ECMC Foundation, we will publish a total of nine rapid response transfer updates and special reports over the next two years.

© 2020 National Student Clearinghouse. All rights reserved. 3
STUDENT PROFILES – FIRST TIME, RETURNING, AND CONTINUING
1. As of September 24, undergraduate enrollment fell 4.5 percent over last year as a result of sharp declines in both freshman enrollments and students returning after a stop-out.
Sharp enrollment declines are detected across two student groups, first-time first-year students (-16.1%) and students reenrolling following a stop-out (Returning Students, down 15.6%), while students who maintained enrollment from the spring term or the summer term (Continuing Students) were nearly unchanged overall (-0.3%) due to increases at four-year colleges (of 1.3% to 2.0%) offset by declines at community colleges (5.4%; see Figure 1).
First-time first-year students were also hit hardest in terms of their share among all enrolled students this fall (down 2.2 percentage points to 16.2%, see Figure 2). Note that the total undergraduate enrollment decline described in this report (4.5%) is larger than described in the September 24 update in the Stay Informed series (4.0%) because the transfer research only includes non-dual enrolled undergraduates without prior awards (other than an associate degree or certificate).
First-time enrollment fell considerably at all types of institutions except for private for-profit four-year institutions (+3.7%; see Figure 1). Public four-year and private nonprofit four-year institutions suffered steep declines (-13.7% and -11.8%, respectively), but community colleges were hit hardest, with a 22.7 percent drop. First-time enrollment dropped regardless of age or gender, but delayed entry students (age 21-24) declined the steepest at 28.0 percent, and men declined more than women (-18.1% vs. -14.6%).
Errata (December 18th, 2020):
On page 5, Figure 3, the title of the horizontal bar has been corrected to “Total Undergraduate Enrollment from Transfer Enrollment.”
On page 9, the 1st paragraph, the following sentence now reads: “The public four-year sector remains the most common destination of upward transfers from a community college (76.8%, not shown in the chart).” 76.8% has been revised from 58.8%.
Method in Brief
This research quantifies the impact of the pandemic on the various transfer pathways through three different lenses: First, by comparing the number of students whose enrollment in fall 2020 occurs at a different institution from their last enrollment (“transfers” or “transfer enrollment”) to the numbers of similar students in fall 2019 (the baseline); second, by comparing the percent change in these numbers between fall 2019 and fall 2020 to the similar change occurring between 2018 and 2019 (the baseline trend); and third, by comparing the share of transfer students among all students enrolled in fall 2020 to the share in fall 2019.
How Transfer and Mobility are Defined
We track the transfer and mobility pathways of students who enroll in fall 2020 without prior undergraduate completion. Transfer and mobility is defined as any change in a student’s enrolled institution irrespective of the timing, direction, or location of the move, and regardless of whether any course credits were transferred from one institution to another. Transfer and mobility are tracked across institutions, sectors, and states—even including these movements occurring over summer terms, after a lapse of enrollment, or even if the movements later prove to have been temporary.
Three Student Groups in Focus
First-time students: Students with no previous college enrollment or degree/certificate award records unless the previous record is prior to when they turn age 18 or they graduate from high school. These students make up 16.2 percent of the fall 2020 undergraduates as of September 24. This number declined from 18.4 percent from the same time in the previous year.
Returning students: Students who had a stop-out without undergraduate completion and re-enrolled in the current term. These students have no enrollment records in the preceding term (spring or summer 2020 for this report) and at least one enrollment at some point before that term. This group represents 7.2 percent of undergraduates, down from 8.2 percent last fall.
Continuing students: Students who continued enrollment from the preceding term (spring or summer term 2020 for this report), with or without having earned an associate degree or certificate. These students comprise 76.6 percent of the fall 2020 undergraduates, up from 73.4 percent in fall 2019. For more information, see the Methodological notes at the end of the report.

© 2020 National Student Clearinghouse. All rights reserved. 4
Figure 1. Change in Undergraduate Enrollment by Student Group and Institution Sector
Figure 2. Fall 2020 Undergraduates at a Glance
© 2020 National Student Clearinghouse. All rights reserved. 5
2. Far fewer students returned this fall after a stop-out (down 15.6% from fall 2019).
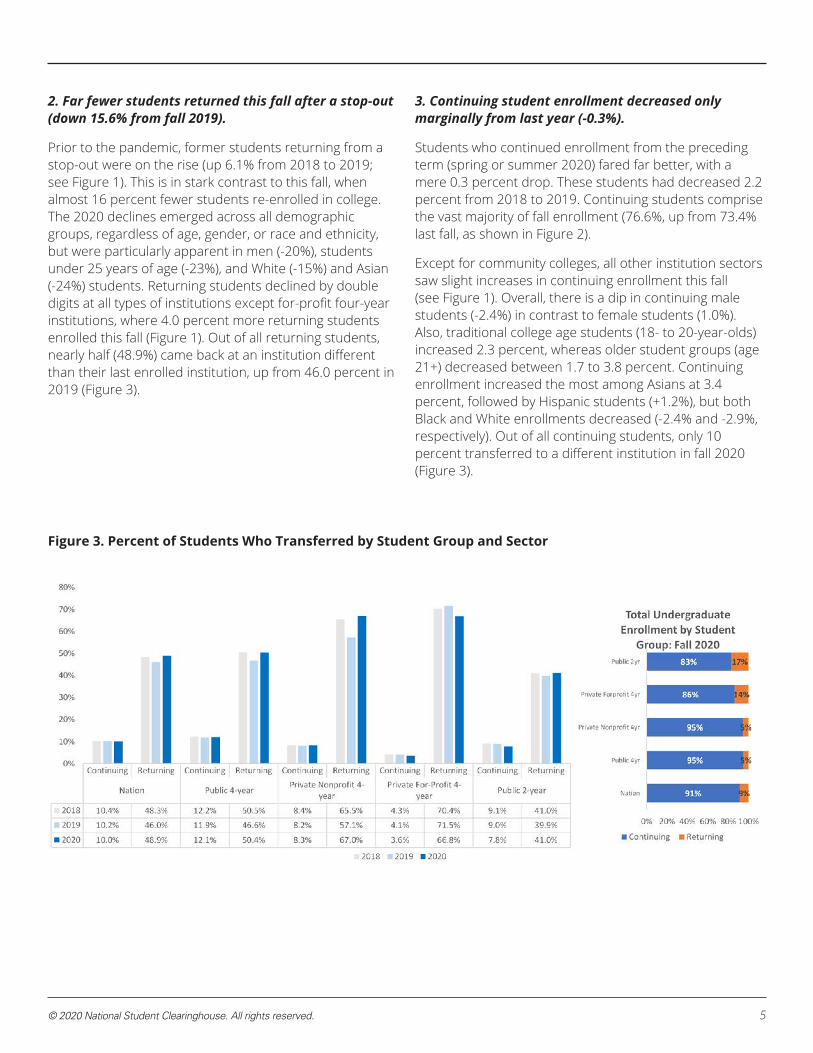
Prior to the pandemic, former students returning from a stop-out were on the rise (up 6.1% from 2018 to 2019; see Figure 1). This is in stark contrast to this fall, when almost 16 percent fewer students re-enrolled in college. The 2020 declines emerged across all demographic groups, regardless of age, gender, or race and ethnicity, but were particularly apparent in men (-20%), students under 25 years of age (-23%), and White (-15%) and Asian (-24%) students. Returning students declined by double digits at all types of institutions except for-profit four-year institutions, where 4.0 percent more returning students enrolled this fall (Figure 1). Out of all returning students, nearly half (48.9%) came back at an institution different than their last enrolled institution, up from 46.0 percent in 2019 (Figure 3).
3. Continuing student enrollment decreased only marginally from last year (-0.3%).
Students who continued enrollment from the preceding term (spring or summer 2020) fared far better, with a mere 0.3 percent drop. These students had decreased 2.2 percent from 2018 to 2019. Continuing students comprise the vast majority of fall enrollment (76.6%, up from 73.4% last fall, as shown in Figure 2).
Except for community colleges, all other institution sectors saw slight increases in continuing enrollment this fall (see Figure 1). Overall, there is a dip in continuing male students (-2.4%) in contrast to female students (1.0%). Also, traditional college age students (18- to 20-year-olds) increased 2.3 percent, whereas older student groups (age 21+) decreased between 1.7 to 3.8 percent. Continuing enrollment increased the most among Asians at 3.4 percent, followed by Hispanic students (+1.2%), but both Black and White enrollments decreased (-2.4% and -2.9%, respectively). Out of all continuing students, only 10 percent transferred to a different institution in fall 2020 (Figure 3).
Figure 3. Percent of Students Who Transferred by Student Group and Sector
© 2020 National Student Clearinghouse. All rights reserved. 6
STUDENT TRANSFER AND MOBILITY DURING COVID-19
1 Transfer student enrollment declined this fall at a slightly steeper rate (-4.7%) than the decline in overall enrollment (-4.5%). Transfers also declined as a share of the overall enrollment, comprising 13.4 percent.
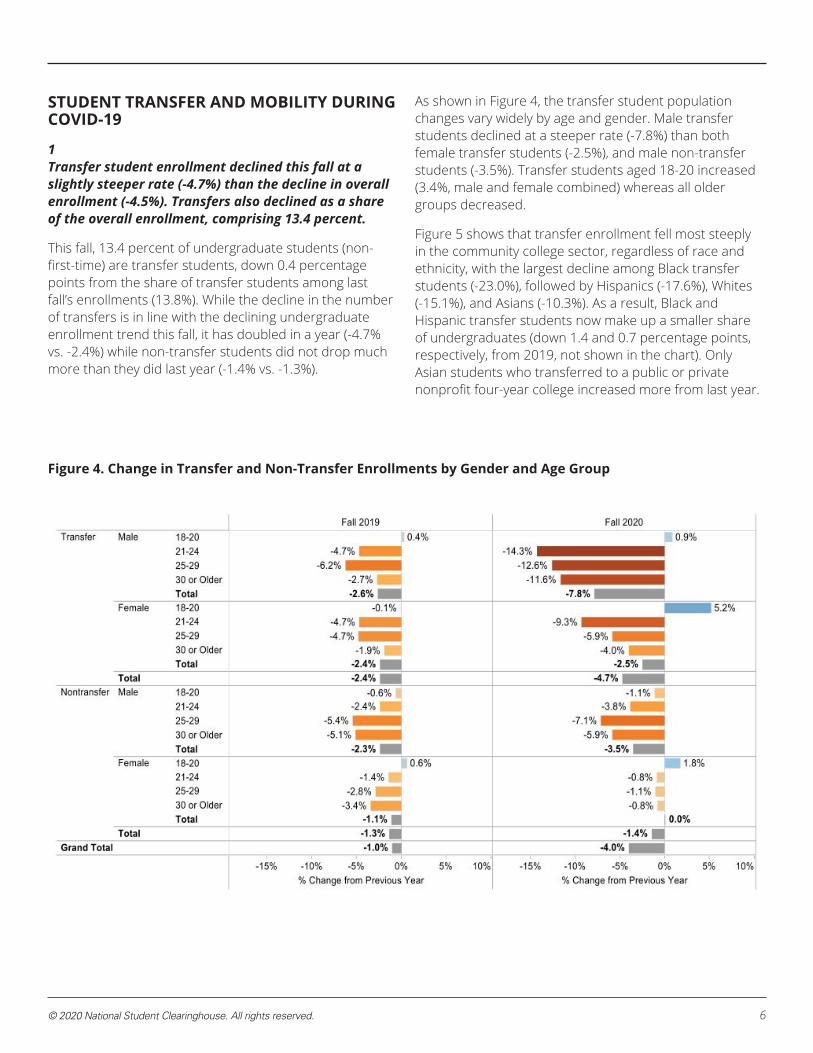
This fall, 13.4 percent of undergraduate students (non-first-time) are transfer students, down 0.4 percentage points from the share of transfer students among last fall’s enrollments (13.8%). While the decline in the number of transfers is in line with the declining undergraduate enrollment trend this fall, it has doubled in a year (-4.7% vs. -2.4%) while non-transfer students did not drop much more than they did last year (-1.4% vs. -1.3%).
As shown in Figure 4, the transfer student population changes vary widely by age and gender. Male transfer students declined at a steeper rate (-7.8%) than both female transfer students (-2.5%), and male non-transfer students (-3.5%). Transfer students aged 18-20 increased (3.4%, male and female combined) whereas all older groups decreased.
Figure 5 shows that transfer enrollment fell most steeply in the community college sector, regardless of race and ethnicity, with the largest decline among Black transfer students (-23.0%), followed by Hispanics (-17.6%), Whites (-15.1%), and Asians (-10.3%). As a result, Black and Hispanic transfer students now make up a smaller share of undergraduates (down 1.4 and 0.7 percentage points, respectively, from 2019, not shown in the chart). Only Asian students who transferred to a public or private nonprofit four-year college increased more from last year.
Figure 4. Change in Transfer and Non-Transfer Enrollments by Gender and Age Group

© 2020 National Student Clearinghouse. All rights reserved. 7
2 Of all transfer students, those transferring from four-year to two-year colleges (reverse transfers) decreased the most (-18.4%), while upward transfers, from a two-year college to a four-year college, unexpectedly increased (+2.6%), driven by a growing number of students transferring from a community college without an associate degree.
Examining transfer directions, Figure 6 shows that reverse transfers (students transferring from four-year to two-year institutions) fell sharply this fall (-18.4%, compared to -5% in 2019). Reverse transfers now comprise 11 percent of all transfers, down by 1.8 percentage points from last year (Figure 7). This decline runs counter to expectations that more students would transfer to local community colleges this year due to pandemic-related financial or travel constraints.
Lateral transfers also decreased, with a 15.1 percent drop in transfers from two-year to two-year institutions and a 3.6 percent drop in transfers from four-year to four-year institutions (down 8.3 percent as a total).
In contrast, upward transfers from two-year to four-year institutions increased, growing by 2.6 percent this fall after having had no growth last year (-0.3%). As a result, upward transfers now make up 48.5 percent of all transfers this fall, a 3.5 percentage point increase from 2019 (see Figure 7).
Figure 5. Change in Total Transfer Enrollment by Institution Sector and Race/Ethnicity

© 2020 National Student Clearinghouse. All rights reserved. 8
Figure 6. Transfer and Mobility Overall: Fall 2019 and Fall 2020
Note: Click here for the chart with full interactivity
Figure 7. Distribution Shifts Across Three Transfer Directions by Student Group: Fall 2018 - Fall 2020
© 2020 National Student Clearinghouse. All rights reserved. 9
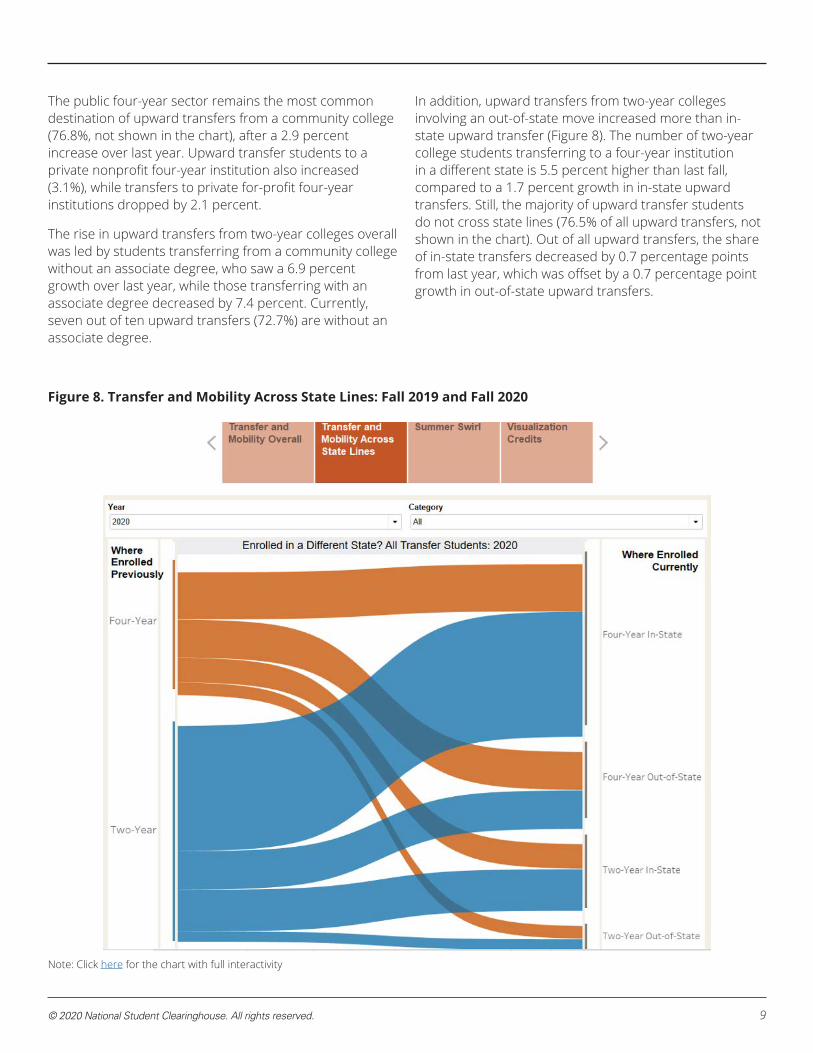
The public four-year sector remains the most common destination of upward transfers from a community college (76.8%, not shown in the chart), after a 2.9 percent increase over last year. Upward transfer students to a private nonprofit four-year institution also increased (3.1%), while transfers to private for-profit four-year institutions dropped by 2.1 percent.
The rise in upward transfers from two-year colleges overall was led by students transferring from a community college without an associate degree, who saw a 6.9 percent growth over last year, while those transferring with an associate degree decreased by 7.4 percent. Currently, seven out of ten upward transfers (72.7%) are without an associate degree.
In addition, upward transfers from two-year colleges involving an out-of-state move increased more than in-state upward transfer (Figure 8). The number of two-year college students transferring to a four-year institution in a different state is 5.5 percent higher than last fall, compared to a 1.7 percent growth in in-state upward transfers. Still, the majority of upward transfer students do not cross state lines (76.5% of all upward transfers, not shown in the chart). Out of all upward transfers, the share of in-state transfers decreased by 0.7 percentage points from last year, which was offset by a 0.7 percentage point growth in out-of-state upward transfers.
Figure 8. Transfer and Mobility Across State Lines: Fall 2019 and Fall 2020
Note: Click here for the chart with full interactivity
© 2020 National Student Clearinghouse. All rights reserved. 10
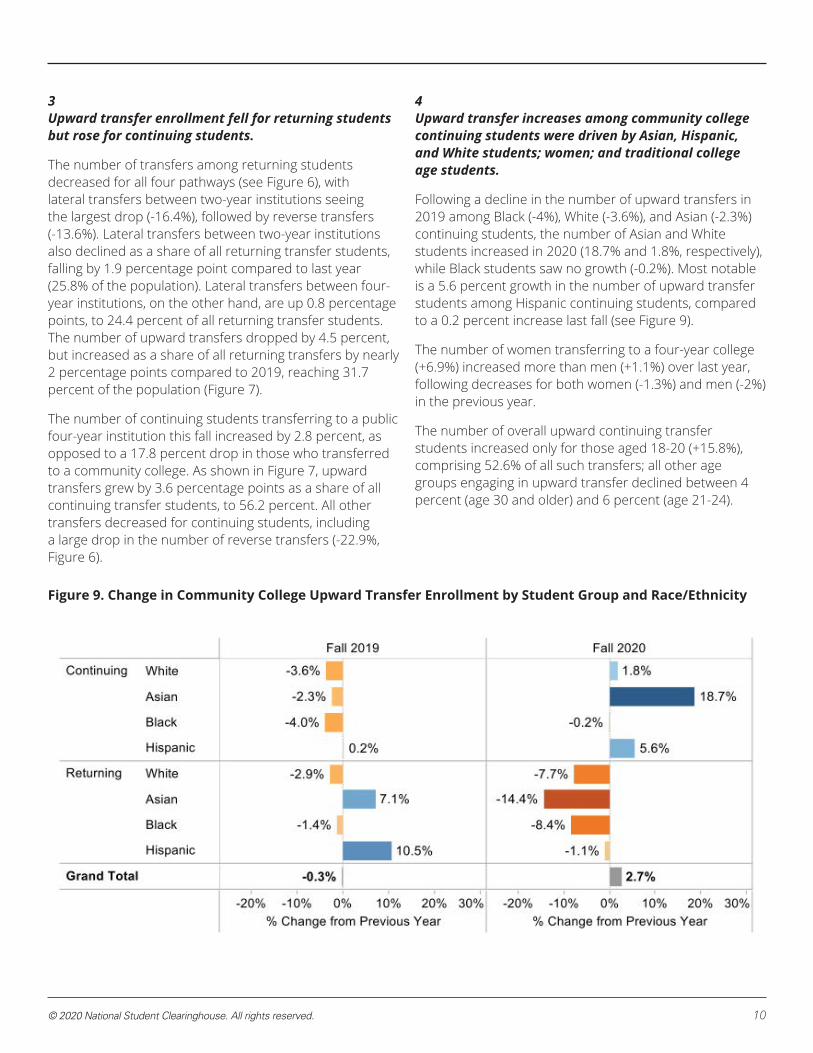
3 Upward transfer enrollment fell for returning students but rose for continuing students.
The number of transfers among returning students decreased for all four pathways (see Figure 6), with lateral transfers between two-year institutions seeing the largest drop (-16.4%), followed by reverse transfers (-13.6%). Lateral transfers between two-year institutions also declined as a share of all returning transfer students, falling by 1.9 percentage point compared to last year (25.8% of the population). Lateral transfers between four-year institutions, on the other hand, are up 0.8 percentage points, to 24.4 percent of all returning transfer students. The number of upward transfers dropped by 4.5 percent, but increased as a share of all returning transfers by nearly 2 percentage points compared to 2019, reaching 31.7 percent of the population (Figure 7).
The number of continuing students transferring to a public four-year institution this fall increased by 2.8 percent, as opposed to a 17.8 percent drop in those who transferred to a community college. As shown in Figure 7, upward transfers grew by 3.6 percentage points as a share of all continuing transfer students, to 56.2 percent. All other transfers decreased for continuing students, including a large drop in the number of reverse transfers (-22.9%, Figure 6).
4 Upward transfer increases among community college continuing students were driven by Asian, Hispanic, and White students; women; and traditional college age students.
Following a decline in the number of upward transfers in 2019 among Black (-4%), White (-3.6%), and Asian (-2.3%) continuing students, the number of Asian and White students increased in 2020 (18.7% and 1.8%, respectively), while Black students saw no growth (-0.2%). Most notable is a 5.6 percent growth in the number of upward transfer students among Hispanic continuing students, compared to a 0.2 percent increase last fall (see Figure 9).
The number of women transferring to a four-year college (+6.9%) increased more than men (+1.1%) over last year, following decreases for both women (-1.3%) and men (-2%) in the previous year.
The number of overall upward continuing transfer students increased only for those aged 18-20 (+15.8%), comprising 52.6% of all such transfers; all other age groups engaging in upward transfer declined between 4 percent (age 30 and older) and 6 percent (age 21-24).
Figure 9. Change in Community College Upward Transfer Enrollment by Student Group and Race/Ethnicity

© 2020 National Student Clearinghouse. All rights reserved. 11
5 The number of upward transfer returning students from a community college decreased regardless of race and ethnicity and gender.
Upward transfer returning students who enrolled this fall after a stop-out decreased in all racial/ethnic categories, with Asian students declining the most (-14.4%), followed by Black students (-8.4%), White students (-7.7%), and Hispanic students (-1.1%). In contrast, in the previous year, both Asian and Hispanic returning upward transfer students increased (7.1% and 10.5%, respectively), while their Black and White peers declined by 1.4 percent and 2.9 percent, respectively (see Figure 9).
While both groups declined, men dropped more than women (-5.8% and -2.8%, respectively). In contrast, last fall, both men and women increased in upward transfer (5% for men and 3.8% for women).
Returning students aged 18-20 declined more this year than their older counterparts (-13.1%). Students aged 21-24 and 25-29 dropped by 7.7 percent and 2.1 percent, respectively. However, students 30 or older saw an increase of 1.0 percent between 2019 and 2020. Between 2018 and 2019, those returning students aged 18-20
and 21-24 engaged in upward transfer increased by 31.3 percent and 4.5 percent, respectively, and those aged 25 and older increased by 0.5 percent.
Upward transfer returning students enrolling in a four-year college in a state different from the state of their last enrollment have slipped to a smaller increase this fall (+0.5% in 2020 vs. 3.4% in 2019). On the other hand, similar transfers occurring within the same state decreased by 8.3 percent following an increase of 5.2 percent in the prior year.
6 Summer swirl declined steeply this year, 10.8 percent below the pre-pandemic level.
Far fewer students transferred to a different institution over the summer (behavior known as summer swirling), having declined at almost four times the rate of the pre-pandemic decline trend from 2019 (-10.8% vs. -2.8%). Summer swirlers remain a small share of the total enrollment (1.6% in 2020 and 1.4% in 2019). The majority of summer swirlers (Figure 10) went to a two-year institution in the summer before returning to a four-year institution in the fall (81%, not shown in chart), activity which did not see a major increase or decrease compared to last year.
Figure 10. Summer Swirl: Fall 2019 and Fall 2020
Note: Click here for the chart with full interactivity

© 2020 National Student Clearinghouse. All rights reserved. 12
SUMMARY AND IMPLICATIONS
This first look challenges recent predictions about the effects of the pandemic. Despite an anticipated influx of students into the community college sector from four-year colleges, we found that the number of reverse transfers dropped steeply this fall, while an unusually high number of students engaged in upward transfer instead. Equally unexpectedly, former students (some college no degree) were less likely to have returned to college at all this fall, with or without transfer and mobility, while continuing students have become the key driver of the increases in upward transfer this fall.
The uptick in upward transfer is good news for community college students seeking to earn a bachelor’s degree, but was uneven across different student subgroups, with male students, Black students, and adult learners falling further
behind other demographics. This trend was also good news for four-year colleges looking to close enrollment gaps, but it only adds to the concerns of a looming enrollment crisis in the community college sector. On top of a 23 percent decline in freshman enrollment (identified in our recent Stay Informed report, the combination of higher upward transfer and lower reverse transfer adds up to a triple threat for further declines in the number of students enrolled in community colleges.
Best known for low cost access to postsecondary education, with broad institutional missions to serve diverse groups of students, many community colleges are likely to remain in a difficult spot during this pandemic. The students and families who rely on them for further education, particularly those from low-income and underrepresented groups, will be disproportionately impacted.

© 2020 National Student Clearinghouse. All rights reserved. 13
METHODOLOGICAL NOTES
The Transfer, Mobility, and Progress series is designed to track the impact of COVID-19 on postsecondary transfer and mobility, using the latest data available and the historical data from the two most recent years (2018 and 2019) as pre-pandemic baselines. It updates transfer data dashboards twice per academic term, disaggregated by various subgroups of students, programs, institutions, states, or regions.
The first look at fall 2020 transfer pathways is based on institution’s fall enrollments reported as of September 24, 2020. It focuses on year-over-year percent changes in enrollment based on the same institutions’ fall 2019 and fall 2018 reporting as of September 24 in each year. Since these institutions represent just over half of the institutions participating in the Clearinghouse, the results should be considered preliminary.
Report Fall Term Submission Window
Institutional Coverage
Fall #1 8/1 – 12/31 8/1 – 9/24 53.9%
Fall #2 8/1 – 12/31 8/1 –11/19 TBD
NATIONAL COVERAGE OF THE DATA
Clearinghouse data track enrollments nationally and are not limited by institutional and state boundaries. As of fall 2019, institutions actively submitting enrollment data to the Clearinghouse account for 97 percent of all enrollments at Title IV, degree-granting institutions in the U.S. Since Clearinghouse data is comprised of student-level data, researchers can use it to link concurrent as well as consecutive enrollments of individual students at multiple institutions. Therefore, these data present a unique opportunity to follow students’ individual transfer patterns over their whole postsecondary experience.
Unlike previous Transfer and Mobility reports, where enrollment rates are weighted by data coverage rates, the Transfer, Mobility, and Progress series focuses on unweighted data. This is because the emphasis of this series is on year-over-year changes in transfer patterns at the same institutions (a “fixed panel”) rather than estimating the total transfer numbers.
PRE-PANDEMIC BASELINE DEVELOPMENT
To accurately assess the impact of COVID-19 on postsecondary transfer and mobility, the analyses focused on a fixed panel of all institutions that submitted data to
the Clearinghouse during the same time frame across all comparison years. We created the panel to control for year-to-year variations in institutional coverage as well as the variations in data submission dates.
To control for institutional coverage, only the institutions that submitted enrollment data in 2018, 2019, and 2020 were included in the analyses. Institutions that discontinued or only started submitting enrollments at any point within these years were excluded. To control for submission timing among these institutions, only fall term data that was submitted within the data submission window (specified in Term Definition below) in each of the three years was included. However, it is important to note that even with these controls, enrollments at some institutions in the panel may have been overcounted or undercounted for 2020 due to unusual file submission patterns. Our investigations suggest that such data noise is minor.
STUDENT POPULATION, TRANSFER DEFINITION AND DIRECTIONS OF MOBILITY
In light of this pandemic and its mostly unpredictable consequences on the higher education world at this point, we decided to investigate a very inclusive subset of the student population to capture any possible unforeseen effects on transfer behavior due to COVID-19. As a result, some of the definitions and identification strategies differ from previous transfer and mobility reports.
Student Population
This study includes all first-ever-in-college, degree-seeking students who were enrolled at a Title IV, degree-granting institution in the U.S. in the fall of the applicable year, as reported by September 24. This definition also includes students who were dual enrolled prior to beginning their postsecondary career but excludes current dual enrollees. We then look at students’ enrollment history to classify students into the following three subgroups: (1) First-time students, (2) Continuing students and (3) Returning students. Continuing and returning students were included only if they had not previously earned a bachelor’s degree or higher. Students were included as either continuing or returning students if they had previously earned an associates or undergraduate certificate.
(1) Freshmen or first-time students are those who had no enrollment records or degree/certificate awards at Title IV U.S. institutions prior to the fall of the applicable year, unless the previous enrollment record was before the student turned 18 years old or before
© 2020 National Student Clearinghouse. All rights reserved. 14
the student graduated from high school (prior dual enrollment).
(2) Continuing students are those who had at least one valid enrollment in the same year prior to their fall enrollment in the same year.
(3) Returning students are those who returned after a stop-out and were therefore not enrolled in the same year prior to their fall enrollment.
Transfer Definition
We define students as transfer students in year 2020 if they were enrolled at a Title IV, degree-granting institution after January 1, 2020, and subsequently enrolled in another Title IV, degree-granting institution in fall 2020. Note that we only consider the change of institution a student is enrolled in, regardless of whether academic credits are recognized between institutions. For more in-depth analysis of transfer patterns, we group all transfer students into two categories:
(1) Continuing transfer students are those who had at least one valid enrollment record in the Spring term or the Summer term and enrolled in fall at an institution different than their last enrolled institution.
(2) Returning transfer students are those who had previously enrolled in postsecondary education but had stopped out up until the fall term, and re-enrolled in the fall at an institution different than their last enrolled institution.
The same logic is applied to years 2018 and 2019 to determine the pre-pandemic baselines.
Directions or Pathways of Student Transfer and Mobility
This report also investigates differences in the directions of student mobility. We categorize the following types or pathways of student mobility:
(1) Upward transfer: Students who transfer from a two-year to a four-year institution, with or without first receiving an award (either a certificate or associate degree). This is also known as vertical transfer.
(2) Reverse transfer: Student who transfer from a four-year to a two-year institution.
(3) Lateral transfer: Students who either transfer from a two-year to a two-year institution or from a four-year to a four-year institution.
(4) Summer Swirl: Students who only enroll in a different institution for the summer and return to their last enrolled institution in the fall. For the purpose of this report, Summer Swirlers are considered Continuing non-transfer students in the fall.
All types of transfers, plus Summer Swirlers, are collectively termed “Mobility.”
RACE AND ETHNICITY
Not all institutions report race and ethnicity data to the Clearinghouse. Missing data (for institutions that do not report to the Clearinghouse) and unknown data (for students that do not report to their institution) account for an average of 25 percent of all enrollments, combined. For the rest of the student populations, the race/ethnicity category includes White, Black, Hispanic, American Indian/Native Alaskan, Native Hawaiian/Pacific Islander, Two or More Races and Non-Resident Aliens.
IN-STATE AND OUT-OF-STATE
Transfers are considered in-state if both institutions (of current enrollment and previous enrollment) are located in the same state, out-of-state if they are in different states. These designations apply regardless of the student’s state of residence. Transfers to or from a multi-state institution (with campuses in more than one state) are excluded from state analyses.
SUGGESTED CITATION
Causey, J., Harnack-Eber, A., Huie, F., Lang, R., Liu, Q., Ryu, M., and Shapiro, D. (October 2020), COVID-19 Transfer, Mobility, and Progress, Report #1, Herndon, VA: National Student Clearinghouse Research Center.