c&p lead analyzer - frtr validation of real time airborne lead analyzer january 2002 . i ......
TRANSCRIPT

Environmental Security Technology Certification Program
(ESTCP)
Cost and Performance Report
Field Validation of Real Time Airborne Lead Analyzer
January 2002

i
EXECUTIVE SUMMARY
The Occupational Safety and Health Administration (OSHA) estimates 936,000 sites in the U.S. are potentially hazardous due to the risk of airborne lead inhalation. The Department of Defense (DOD) real estate records indicate there are more than 2,600 munitions related sites containing lead, and there are over 101 million square feet of Army buildings that were built before the 1978 ban on lead-based paint (LBP). DOD is responsible for maintaining 166,000 family housing units, 65 percent of which are estimated to contain LBP and require abatement. Environmental responses at these sites require Environmental Protection Agency (EPA) mandated monitoring (40 CFR 50) as well as verification of worker safety according to OSHA regulations. These regulations do not provide a real-time method to verify compliance. Rapid, on-site airborne lead measurements are needed to provide a basis for immediate response to airborne lead levels that are near or exceeding OSHA Permissible Exposure Limits (PEL) to minimize any significant exposure to field personnel. In 1995, OSHA issued over 3,000 citations for violations of the General Industry Standard for Lead (29 CFR 1910.1025) and the Construction Industry Standard for Lead (29 CFR 1962.26).
The objective of this project was to demonstrate and validate a personal breathing zone (PBZ) lead analyzer/single sample ambient air monitor (AAM), which will report occupational airborne lead levels in near real-time. The first field site where the analyzer was tested was the indoor firing range located at Naval Amphibious Base ( (NFESC Feb 2000) Little Creek, Virgina. The demonstration occurred from 19 to 21 January 2000. Based on the field results, further work was conducted on the unit before going to the second demonstration location at MCAGCC Twentynine Palms, California. The tests took place from 6 to 8 June 2000 (NFESC Aug 2000). This site was an outdoor firing range. Both facilities provided real-world materials created by live fire rifle and pistol shooting exercises. The AeroLeadTM failed to meet all of the performance criteria during this program, and therefore, was not validated. Had the objective been accomplished, significant improvements to occupational safety and decreases in the cost of OSHA compliance would be realized. Current OSHA protocols require sending PBZ samples to a laboratory for analysis, resulting in delayed report times (24 hours to 3 days) and an increased potential for sample integrity breaches due to shipping and handling. It was our intent that the AeroLeadTM analyzer would provide an improved method of airborne lead sampling and analysis, providing nearly instantaneous feedback. Cost estimates indicated that sampling costs would have been reduced from $25 to less than $3 per sample.
Demonstration results from the final controlled test showed there was a high degree of variability in performance between the units. Precision varied between 15 and 87 percent in individual units at the three standard lead concentrations tested; this inter-instrument variability contributed to generally poor overall precision when viewing the overall results from all instruments between 65 and 82 percent. Inter-instrument variability was also apparent in accuracy (bias) of AeroLeadTM results and ranged between 29 and 75 percent. In almost all cases, the AeroLeadTM instruments over-determined lead concentrations. The primary contributor to inter-instrument variability has been traced to response differences between working electrodes; the manufacturer is currently improving working electrode design and manufacturing techniques so that sensitivity/response issues are resolved. Capture efficiency (100 percent) and extraction efficiency (91 percent) were validated under this program. Users of the technology are anxious to purchase the unit and the manufacturer is continuing the validation process outside of this program.

ii
ACKNOWLEDGEMENT Support for this program was provided through the Environmental Security Technology Certification Program (ESTCP). We would also like to acknowledge facility personnel at the Naval Amphibious Base (NAB) Little Creek for access to their indoor shooting range; Marine Corps Air Ground Combat Center (MCAGCC) Twentynine Palms for access to their outdoor shooting range; and to Dr. Meng-Dawn Cheng of the Oak Ridge National Laboratory (ORNL), for their support and use of the Aerosol Particle Generator (APG) Laboratory.

iii
ACRONYMS
AAM Ambient Air Monitor
ASTM American Society of Testing and Materials
ASV Anodic stripping voltammetry
BDL Below detection limit
COTS Commercial-off-the-shelf
DCU Dust collection unit
DEMVAL Demonstration and validation
DOD Department of Defense
ELS Environmental Life Support
EPA Environmental Protection Agency
ESTCP Environmental Security Technology Certification Program
FAAS Flame Atomic Absorption Spectrometry
GFAAS Graphite Furnace Atomic Absorption Spectrometry
HEPA High Efficiency Particulate Air
ICP-AES Inductively Coupled Plasma Atomic Emission Spectrometry
LBP Lead-based paint
LIPS Laser Induced Plasma Spectrometer
MCAGCC Marine Corps Air Ground Combat Center
MCE Mixed Cellulose Ester
NAB Naval Amphibious Base
NFESC Naval Facilities Engineering Service Center
NIOSH National Institute of Occupational Safety and Health
NIST National Institute of Standards and Technology
ORNL Oak Ridge National Laboratory
OSHA Occupational Safety and Health Administration
PBZ Personal breathing zone
PC Personal computer
PEL Permissible Exposure Limit
PPE Personnel protection equipment
RSD Relative standard deviation
SBIR Small Business Innovative Research
SRM Standard Reference Materials
TWA Time-weighted average
iv
Table of Contents Page 1.0 TECHNOLOGY DESCRIPTION ...................................................................................... 1
1.1 Technology Development and Application .................................................................... 1 1.2 Process Description......................................................................................................... 1 1.3 Previous Testing of the Technology ............................................................................... 2 1.4 Advantages and Limitations of the Technology ............................................................. 2
2.0 DEMONSTRATION DESIGN .......................................................................................... 3 2.1 Performance Objectives .................................................................................................. 3 2.2 Selection of Test Site/Facility......................................................................................... 4 2.3 Site/Facility Characteristics ............................................................................................ 4
2.3.1 NAB Little Creek Facility....................................................................................... 4 2.3.2 Twentynine Palms Facility ..................................................................................... 4 2.3.3 Oak Ridge Facility .................................................................................................. 5
2.4 Physical Set-up and Operation........................................................................................ 6 2.4.1 Extraction Efficiency Test ...................................................................................... 6 2.4.2 Capture Efficiency Tests......................................................................................... 7 2.4.3 Comparison Tests.................................................................................................... 7 2.4.4 Interference Test ..................................................................................................... 7 2.4.5 NAB Little Creek Field Test................................................................................... 7 2.4.6 Twentynine Palms Field Test.................................................................................. 8 2.4.7 Oak Ridge Field Test .............................................................................................. 8
2.5 Sampling/Monitoring Procedures ................................................................................... 8 2.5.1 NAB Little Creek Field Test................................................................................... 8 2.5.2 Twentynine Palms Field Test.................................................................................. 9 2.5.3 Oak Ridge Field Test .............................................................................................. 9
2.6 Analytical Procedures ................................................................................................... 10 3.0 PERFORMANCE ASSESSMENT .................................................................................. 10
3.1 Performance Data.......................................................................................................... 10 3.1.1 Interference Testing .............................................................................................. 10 3.1.2 Extraction Efficiency Testing ............................................................................... 10 3.1.3 Capture Efficiency Testing ................................................................................... 12 3.1.4 Comparison Tests.................................................................................................. 12 3.1.5 Oak Ridge Field Test ............................................................................................ 14
3.2 Performance Criteria..................................................................................................... 15 3.3 Data Assessment ........................................................................................................... 16
3.3.1 Little Creek Field Test .......................................................................................... 16 3.3.2 Twentynine Palms Field Test................................................................................ 17 3.3.3 Oak Ridge Field Test ............................................................................................ 18
3.4 Technology Comparison............................................................................................... 21 4.0 COST ASSESSMENT...................................................................................................... 21
4.1 Cost Reporting .............................................................................................................. 21 4.2 Cost Comparisons ......................................................................................................... 23
5.0 IMPLEMENTATION ISSUES ........................................................................................ 24

v
5.1 Cost Observations ......................................................................................................... 24 5.2 Performance Observations ............................................................................................ 24 5.3 Scale-up......................................................................................................................... 24 5.4 Other Significant Observations..................................................................................... 24 5.5 Lessons Learned............................................................................................................ 25 5.6 End-User Issues ............................................................................................................ 25 5.7 Approach to Regulatory Compliance and Acceptance ................................................. 25
6.0 REFERENCES ................................................................................................................. 26 7.0 POINTS OF CONTACT................................................................................................... 27
LIST OF FIGURES Figure 1.1. AeroLead™ picture and schematic ..............................................................................2 Figure 2-1. Twentynine Palms test setup........................................................................................5 Figure 2-2. Oak Ridge test setup.....................................................................................................6 Figure 3-1. Capture Efficiency Test 1...........................................................................................12 Figure 3-2. Capture Efficiency Test 2...........................................................................................12 Figure 3-3. Comparison test results ..............................................................................................13 Figure 3-4. ORNL NIOSH results ................................................................................................14 Figure 3-5. ORNL AreoLead™ results combined........................................................................19
LIST OF TABLES Table 3-1. Extraction Efficiency Data ..........................................................................................11 Table 3-2. Non-extracted Membrane Data ...................................................................................11 Table 3-3. Adjusted Extraction Efficiency Data...........................................................................12 Table 3-4. ASTM-E1775 Precision Requirements .......................................................................13 Table 3-.5. Analytical Laboratory Results of Non-Extracted Filters Using NIOSH Method 7082 .....................................................................................................15 Table 3-6. ASTM-E1775 Specification Summary........................................................................15 Table 3-7. Data Assessment Summary .........................................................................................16 Table 3-8. Calibration Solution NIOSH Analysis ........................................................................17 Table 3-9. Averaged Results for Individual AeroLeadTM Instruments.......................................18 Table 3-10. Averaged Combined Results for AeroLeadTM Instruments.....................................19 Table 3-11: Precision of Each AeroLeadTM Instrument Based on Mean Result Compared to NIOSH Method 7082 Mean Result..........................................................20 Table 3-12. Accuracy (Bias) for Each AeroLeadTM Instrument Compared to NIOSH Method 7082............................................................................................................20 Table 3-13. Precision and Accuracy (Bias) for All AeroLeadTM Instruments Combined Compared to NIOSH Method 7082 ........................................................................20 Table 3-14. Technical Performance Comparison .........................................................................21 Table 4-1. Cost Data Table for the AeroLead™ Airborne Lead Analyzer...................................22 Table 4-2. Cost Data Table for NIOSH Method 7105 or 7082 ....................................................22 Table 4-3. Comparative Methods Cost Estimate ..........................................................................23

1
1.0 TECHNOLOGY DESCRIPTION 1.1 Technology Development and Application
Under the Small Business Innovative Research (SBIR) program, the Navy funded the development of an airborne sampling and analysis monitor for use at small arms ranges and lead paint abatement sites. The conceptual design and AeroLeadTM prototype was established under Phase I and II. Environmental Life Support (ELS) Technology, Inc. developed the instrument based upon anodic stripping voltammetry (ASV). The selection criteria included analytical sensitivity, potential for automated operation, instrument cost, analysis time and simplicity of operation.
The AeroLeadTM analyzer is the first, and currently the only portable, automatic, low-cost method to analyze airborne lead and lead dust contamination on-site and in near real-time. The analyzer’s primary purposes are to provide near real-time, single sample ambient air monitoring and personal breathing zone (PBZ) analyses during lead-based paint (LBP) abatement projects, and near small arms ranges (especially indoor ranges). Use of the AeroLeadTM instrument will result in a greater level of worker safety by providing portable, automated, on-site quantification of airborne lead concentrations to which the workers may be exposed. The working range of the AeroLeadTM is 3-300 ug of lead. The min and max range was not verified, but lower and higher concentrations were easily detected.
The AeroLeadTM analyzer has two modes of operation: single sample ambient air monitoring and PBZ monitoring. Single sample ambient air monitoring combines sampling, extraction, and analysis into one process. The PBZ mode allows the user to analyze previously collected PBZ samples in near real-time, eliminating the need for sample storage and transportation to a laboratory for subsequent analysis. In both modes, the airborne lead is concentrated into a specially designed aqueous phase and analyzed voltammetrically. An integrated airflow meter is used for ambient air monitoring to determine air sample volume. The volume measurement is combined with the voltammetric result to yield an accurate airborne lead concentration on-site. The instrument then automatically resets itself for the next sample and can be programmed to sample automatically throughout the day. Data can be downloaded to a personal computer (PC) through an RS-232C port. Software is available to allow the user to import the data directly into MS Excel® in real-time, parse, and graph with the touch of a button, simplifying the data reduction process. 1.2 Process Description The AeroLead combines sampling, extraction, and analysis into one unit. Air samples are taken through an innovative sample filter/detector assembly. The airborne lead is concentrated into a specially designed aqueous phase consisting of dilute HCI and extractants. The lead concentration is analyzed by ASV, where the metal is plated onto a working electrode; the polarity of the electrode is then reversed, stripping the lead from the electrode. For a general outline of ASV, see K. Ashley (1998). The current consumed by the stripping step provides an accurate measurement of the lead concentration. Analysis time is 5 minutes; air sample time is user selectable, 10 minutes minimum. An integrated airflow meter is used to determine air

2
sample volume (accuracy + 1 percent) and combined with the voltammetric results to yield accurate airborne lead concentration. The instrument automatically resets for the next sample. Data can be downloaded to a PC through an RS-232C interface. A picture and schematic of the AeroLead unit is shown in Figure 1-1. No special training is required to operate the AeroLeadTM unit. An Operators Manual has been developed and is sufficient for personnel training. The manufacturer can provide hands on training if desired. It is very easy to program sample time and quantity. Sampling and analysis is automatic. Set up and calibration may be time consuming at the start of operation. Fluid levels must be periodically checked. There are no special health and safety requirements. Care should be exercised when handling the calibration and extractant solutions, as with any reagent. The solutions have very low concentrations of HCl, Pb, and Hg. Electrodes can be returned to the manufacturer for disposal. 1.3 Previous Testing of the Technology
Extensive laboratory testing has been performed to validate the ASV method for lead in water and blood. A NIOSH Method for airborne lead detection has previously been established based on ASV technology (NIOSH 7701, 1998), but this is not an automated method. No other testing of this technology has been conducted outside the limited scale field and laboratory tests that were conducted during SBIR Phase I and Phase II which demonstrated the viability of the technology.
Figure 1.1. AeroLead™ picture and schematic. 1.4 Advantages and Limitations of the Technology
The advantages of this technology are faster sample turn-around and lower compliance cost. The operational costs will be reduced from $9 to 20 per sample (NIOSH 7105, 1994) to an estimated $2.77 per sample (AeroLeadTM). The total air sample volume is quantified by the
ANALOG I/O,DIGITAL I/O &MICROPROCESSOR
DETECTOR/COLLECTORASSEMBLY
REGENERATIONMODULE
MANUALDIV VALVE
SYRINGE PUMP
FLOWMETER
AIRPUMP
WATERTRAP
AIR ON/OFFVALVE
AIR SAMPLE INLET
FILTER (per NIOSH 7082)
AeroLeadTM AnalyzerFunctional Schematic
3
AeroLead, resulting in only 1 to 2 percent error in sampling air volume, compared to the 5 percent air sampling error of the belt pump and filter assembly used for NIOSH 7105. Other advantages include:
• A cost-effective method to ensure compliance with occupational exposure regulations
on-site and in real-time • Reduced cost of compliance compared to current NIOSH Method 7105 by reducing
the personnel requirements • Enhanced worker safety and cost avoidance of potential safety violations • Technological basis for a method to measure additional airborne metals used in
Department of Defense (DOD) operations. It was envisioned that the filter mechanism of the AeroLead™ unit would be capable of
performing multiple samples. The current design did not meet this requirement, and one filter per sample is required, incurring greater costs and manpower. While the instrument can be used to monitor lead, it cannot be used to satisfy legal monitoring requirements at lead sites until it passes all performance criteria.
2.0 DEMONSTRATION DESIGN 2.1 Performance Objectives
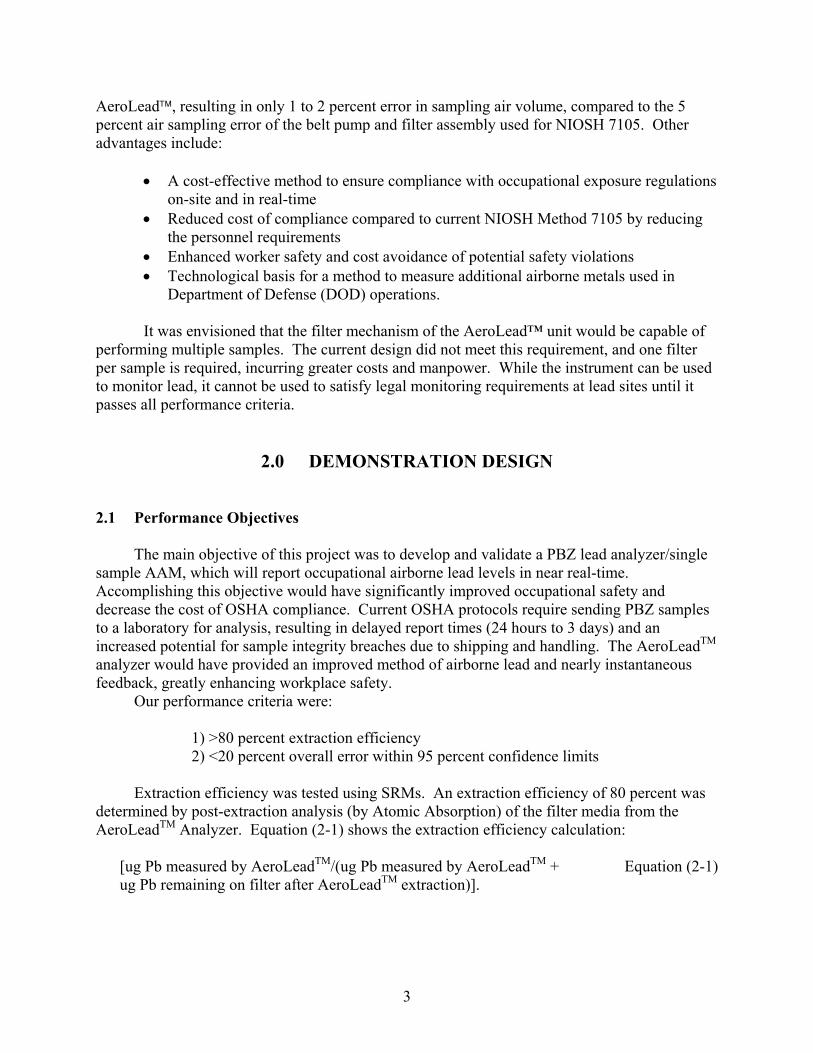
The main objective of this project was to develop and validate a PBZ lead analyzer/single sample AAM, which will report occupational airborne lead levels in near real-time. Accomplishing this objective would have significantly improved occupational safety and decrease the cost of OSHA compliance. Current OSHA protocols require sending PBZ samples to a laboratory for analysis, resulting in delayed report times (24 hours to 3 days) and an increased potential for sample integrity breaches due to shipping and handling. The AeroLeadTM analyzer would have provided an improved method of airborne lead and nearly instantaneous feedback, greatly enhancing workplace safety.
Our performance criteria were:
1) >80 percent extraction efficiency 2) <20 percent overall error within 95 percent confidence limits
Extraction efficiency was tested using SRMs. An extraction efficiency of 80 percent was determined by post-extraction analysis (by Atomic Absorption) of the filter media from the AeroLeadTM Analyzer. Equation (2-1) shows the extraction efficiency calculation:
[ug Pb measured by AeroLeadTM/(ug Pb measured by AeroLeadTM + Equation (2-1) ug Pb remaining on filter after AeroLeadTM extraction)].

4
2.2 Selection of Test Site/Facility
The majority of the development testing was performed in the laboratory at ELS Technology Inc. Extraction efficiency and capture efficiency tests were performed at a local indoor shooting range to more accurately determine the effectiveness of each parameter using real-world materials. Three field tests were conducted during the AeroLeadTM Demonstration and Validation (DEMVAL) program. The sites were chosen by the Naval Facilities Engineering Service Center (NFESC) based on Environmental Security Technology Certification Program (ESTCP) requirements and preliminary lead level testing. The first field test was performed at an indoor shooting range at Naval Amphibious Base (NAB) Little Creek facility in Norfolk, Virginia from 19 to 21 January, 2000. The second field test took place at an outdoor range at the Twentynine Palms Marine Corps Air Ground Combat Center (MCAGCC) in Twentynine Palms, California, from 6 to 8 June 2000. Both facilities provided real-world materials created by live fire rifle and pistol shooting exercises. The third test was performed under controlled conditions at Oak Ridge National Laboratory (ORNL) in Oak Ridge, Tennessee from 12 to 14 September 2000. Lead for the Oak Ridge field test was generated by an aerosol particle generator. 2.3 Site/Facility Characteristics 2.3.1 Naval Amphibious Base Little Creek Facility
The indoor range at NAB Little Creek is divided into two sections: a rifle range and a pistol range. There are 16 rifle shooting stations and 15 pistol shooting stations. Each station is approximately 4 feet wide. The distance between the rifle firing lines and the targets is 25 yards.
The shooting range is equipped with an open loop ventilation system. Outside air enters the range through a diffuser pipe. The diffuser pipe is located 15 feet behind the shooting positions and is attached to the ceiling. It spans the entire width of the room except for the 6-foot wide doorway in the center of the supply plenum. The doorway leads from the foyer into the range. The ceiling height is 8 feet. Direction of air flow is from rear to front (targets) of the range. Outside air is supplied by the diffuser pipe from behind the shooters, circulates toward the bullet traps, and out through the exhaust fan. The exhaust air is sent through primary, secondary, and High Efficiency Particulate Air (HEPA) filters before being exhausted outside. 2.3.2 Twentynine Palms Facility
Range 1 at Twentynine Palms is a 50-lane outdoor shooting range used to train military personnel in high power rifle proficiency. Shooters position themselves at the 100, 200, 300, and 500 meter shooting lines with the targets located at the zero meter line. The bullet traps are located approximately 30 meters behind the zero meter line. The bullet traps are designed to capture bullet materials, upon impact, for recycle. The bullet breaks apart upon impact, resulting in debris of various lead and copper particle sizes. The large particles are collected in bins at the base of the trap. The bullet traps are equipped with a dust collection unit (DCU) which traps and filters lead particulate generated by bullet impact on the trap. The DCU ventilation system pulls air from the bullet deceleration chamber

5
Figure 2-1 provides an illustration of the DCU on the underside of the bullet traps. Samples were collected in the vent leading from the bullet trap to the DCU, as depicted in Figure 2-1. 2.3.3 Oak Ridge Facility
The Oak Ridge field test was conducted in the Aerosol Research Laboratory of the Environmental Sciences Division of ORNL. The facility is equipped with a Thermal System Incorporated (TSI) Corporation aerosol particle generator, capable of transferring particulate from an aqueous solution to an aerosol stream. The generator can be adjusted to provide user-selectable particle sizes and concentrations. The particle generator effluent stream was attached to a six-way splitter to allow the interface of two AeroLead™ instruments, two NIOSH sampling loops, and the Laser Induced Plasma Spectrometer (LIPS) instrument (and one exhaust). The effluent from each instrument vented to a facility HEPA filtered vent system. An illustration of the test setup is shown in Figure 2-2.
Figure 2-1. Twentynine Palms test setup.

6
Figure 2-2. Oak Ridge test setup. 2.4 Physical Set-up and Operation
If properly charged, the AeroLead™ instrument requires no ancillary equipment or facilities to operate. No personal protection equipment (PPE) is required to operate the unit. The instrument setup is as follows:
1. Unpack AeroLeadTM analyzer and collector. Open syringe valve to run position, remove collector cap and install collector.
2. Install power supply and AeroLeadTM/computer interface cabling (if not using battery power).
3. Verify proper extraction solution level in analyzer (add solution as necessary). 4. Perform calibration verification 5. Perform multi-scan calibration procedure if verification failed. 6. Instrument ready for sample analyses
2.4.1 Extraction Efficiency Test
Extraction efficiency tests were performed in two parts. First, extraction efficiency tests were performed in the laboratory at ELS Technology, using secondary standards prepared by Anteon Corp. The samples were prepared by depositing lead directly to membrane filters. Lead amounts were gravimetrically determined, and amounts ranged from 0.35ug Pb to 61.47ug Pb per filter. Each sample was extracted and analyzed by an AeroLeadTM instrument. The extracted membrane was then removed and sent to Reservoirs Environmental Services, Inc., in Denver, Colorado, for Pb analysis. The lead remaining on the extracted membrane was determined and compared to the initial lead concentration.

7
The second part of extraction efficiency testing occurred during each of the two subsequent field tests. Selected membranes extracted during these field tests were sent to Reservoirs Environmental Services, Inc., in Denver, Colorado, to determine the quantity of lead remaining on the extracted membranes. This information was combined with the laboratory data to verify ASTM-E1775 conformance. 2.4.2 Capture Efficiency Tests
A series of capture efficiency tests were performed to evaluate the collector design and verify compliance with ASTM-E1775. Both commercial-off-the-shelf (COTS) and in-house designs were tested. The capture efficiency tests were performed by placing two 0.8um (pore size), 25mm (diameter) membranes in series and drawing air through them for a period of 8 hours. Collector design was deemed acceptable if the primary filter membrane captured all the lead present with none being detected on the secondary filter. 2.4.3 Comparison Tests
Comparison tests were performed to evaluate the precision of the instruments and verify compliance with ASTM-E1775 specification. Four instruments were tested. A liquid injection method was used to introduce the lead into the detector in concentrations ranging from 0.5x to 10x the Permissible Exposure Limit (PEL). The comparison test occurred in the laboratory at ELS Technology Inc. ELS personnel prepared all secondary standards used during comparison testing. 2.4.4 Interference Test
To evaluate the effects of potential interference due to the presence of other metals, ELS Technology Inc., performed an interference test early in the project term. An AeroLeadTM detector assembly was bench mounted and an EG&G Model 384B Polarographic Analyzer performed the functions of the current AeroLeadTM electronics and software. Several solutions were prepared containing lead and several interference metals including copper and mercury. Analyses were performed to determine the effects of the interference metals on AeroLeadTM detector performance. 2.4.5 Naval Amphibious Base Little Creek Field Test
The AeroLeadTM instruments were operated in ambient air monitor (AAM) mode during the Little Creek Field Test (19 to 21 January 2000). Three analyzers were tested concurrently, along with three NIOSH sample loops to provide method comparison samples. The AeroLeadTM instruments were programmed for 30-minute sample times, the NIOSH loops were programmed for 8-hour sample times (in general). The AeroLeadTM instruments and the NIOSH sampler were set up on a 3-foot table adjacent to the first shooter lane. The NIOSH samples provided time-weighted average (TWA) and spatial distribution information to compare to the AeroLeadTM data to verify compliance with ASTM-E1775 accuracy criteria. Refer to NFESC/ELS Technology Inc. (2001) for a full report of NAB Little Creek field test activities.

8
Four tests were performed at NAB Little Creek. Airborne lead for tests 1, 2, 3B were created by live fire of a 9mm pistol and M14 and M16 rifles. The number of shooters present and the number of rounds fired differed for each test and test set. Test 3 airborne lead was created by manually vacuuming the rifle range floor, shooter mats, and the "wet snail" bullet trap. The entire cleaning process was performed in approximately 30 minutes. 2.4.6 Twentynine Palms Field Test
The Twentynine Palms field test (6 to 8 June, 2000) was planned to evaluate the PBZ analyzing function of the AeroLeadTM instrument. All airborne lead samples were taken from the range trap air handling system using a combination of NFESC supplied PBZ sampling pumps and ELS Technology Inc., supplied sampling pumps. Each sample pump was calibrated pretest. Samples were taken in groups of three to four per location (see Figure 2-1). Upon completion of sample collection, two samples were analyzed by the AeroLeadTM instrument and one to two samples were sent to Reservoirs Environmental Services, Inc., for analysis. This plan was developed to evaluate the AeroLeadTM instrument accuracy requirements with respect to ASTM-E1775 specifications.
The AeroLeadTM analyzers were set up in the range office at the start of each test day. Two analyzers were used each day and three analyzers were evaluated throughout the 3 days of testing. Pretest calibration was performed at the beginning of each test day on each analyzer used. Furthermore, additional calibration verification was performed on each analyzer throughout the course of testing to verify accurate analyzer performance. 2.4.7 Oak Ridge Field Test
The purpose of the Oak Ridge field test (12 to 14 September 2000) was to evaluate the accuracy of the AeroLeadTM instrument under controlled conditions using real-world materials. Two AeroLeadTM instruments were operated in parallel with a LIPS and two NIOSH sampling loops for comparison purposes. All AeroLeadTM and NIOSH sample pumps were calibrated pretest using a factory calibrated float meter. The LIPS instrument was set up and operated by ORNL personnel. The AeroLeadTM instruments were set up and calibrated pretest. Additional calibration verification was performed on each analyzer throughout the course of testing to verify accurate analyzer performance. For each test point, the AeroLeadTM instruments and NIOSH sampling loops were programmed for 5 minutes of sample collection, at which time the AeroLeadTM instruments performed extraction and analysis operations. Upon completion of analyses the data was recorded and collectors removed in preparation for the next sample. NIOSH-sampled collection assemblies were capped, bagged, and sent to Reservoirs Environmental Services for analysis. 2.5 Sampling/Monitoring Procedures 2.5.1 NAB Little Creek Field Test
Three AeroLeadTM airborne lead analyzers were operated concurrently with an automated NIOSH sampling system consisting of a belt pump and 37mm MCE filter assemblies. The
9
system consists of 3 parallel filter samplers (referred to as A, B, and C) used to measure airborne lead distribution and concentration. Each NIOSH sample pump was calibrated at the beginning and end of each test set to verify air flow rate through each 37mm, 0.8 um membrane. These results were then used to determine the total sample throughput for each test set. The 37mm cartridges were removed and capped at the completion of each test set, then bagged and sent by a third party (Anteon) to Reservoirs Environmental Services, Inc. for analysis. The samples were analyzed using NIOSH 7105 and NIOSH 7082 by the laboratory (NIOSH 1994).
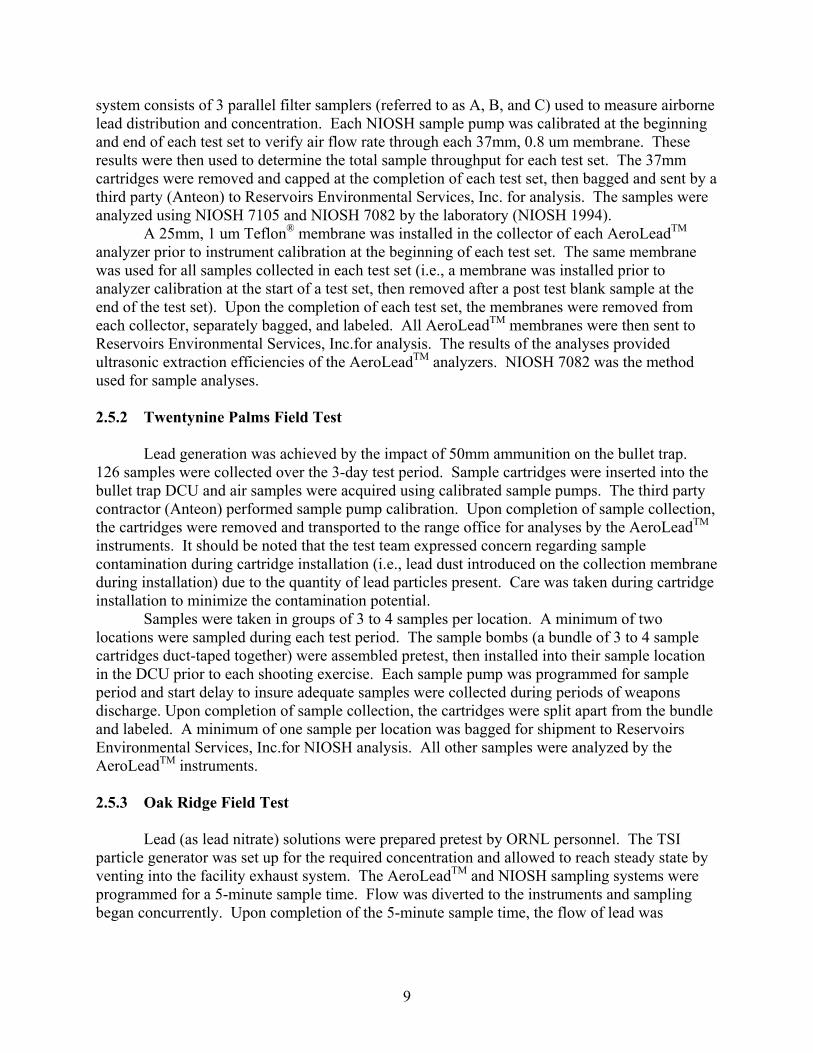
A 25mm, 1 um Teflon® membrane was installed in the collector of each AeroLeadTM analyzer prior to instrument calibration at the beginning of each test set. The same membrane was used for all samples collected in each test set (i.e., a membrane was installed prior to analyzer calibration at the start of a test set, then removed after a post test blank sample at the end of the test set). Upon the completion of each test set, the membranes were removed from each collector, separately bagged, and labeled. All AeroLeadTM membranes were then sent to Reservoirs Environmental Services, Inc.for analysis. The results of the analyses provided ultrasonic extraction efficiencies of the AeroLeadTM analyzers. NIOSH 7082 was the method used for sample analyses. 2.5.2 Twentynine Palms Field Test
Lead generation was achieved by the impact of 50mm ammunition on the bullet trap. 126 samples were collected over the 3-day test period. Sample cartridges were inserted into the bullet trap DCU and air samples were acquired using calibrated sample pumps. The third party contractor (Anteon) performed sample pump calibration. Upon completion of sample collection, the cartridges were removed and transported to the range office for analyses by the AeroLeadTM instruments. It should be noted that the test team expressed concern regarding sample contamination during cartridge installation (i.e., lead dust introduced on the collection membrane during installation) due to the quantity of lead particles present. Care was taken during cartridge installation to minimize the contamination potential.
Samples were taken in groups of 3 to 4 samples per location. A minimum of two locations were sampled during each test period. The sample bombs (a bundle of 3 to 4 sample cartridges duct-taped together) were assembled pretest, then installed into their sample location in the DCU prior to each shooting exercise. Each sample pump was programmed for sample period and start delay to insure adequate samples were collected during periods of weapons discharge. Upon completion of sample collection, the cartridges were split apart from the bundle and labeled. A minimum of one sample per location was bagged for shipment to Reservoirs Environmental Services, Inc.for NIOSH analysis. All other samples were analyzed by the AeroLeadTM instruments. 2.5.3 Oak Ridge Field Test
Lead (as lead nitrate) solutions were prepared pretest by ORNL personnel. The TSI particle generator was set up for the required concentration and allowed to reach steady state by venting into the facility exhaust system. The AeroLeadTM and NIOSH sampling systems were programmed for a 5-minute sample time. Flow was diverted to the instruments and sampling began concurrently. Upon completion of the 5-minute sample time, the flow of lead was

10
terminated and the particle generator was disconnected from the flow splitter. This process was repeated for each test point. 2.6 Analytical Procedures
ASTM-E1775 was the guideline used to evaluate AeroLeadTM performance. A copy of ASTM-E1775 is provided in the final report. ASTM-E1775 specifies ASTM-E1613 as the basis for accuracy determination, which directs the use of Inductively Coupled Plasma Atomic Emission Spectrometry (ICP-AES), Flame Atomic Absorption Spectrometry (FAAS) or Graphite Furnace Atomic Absorption Spectrometry (GFAAS) technique as the accuracy comparitor method.
The AeroLeadTM ASV method was compared to NIOSH Methods 7082 (FAAS Method) and 7105 (1994) (GFAAS Method) for both field tests to determine accuracy. The results of the interference testing were compared to NIOSH 7701 (NIOSH 1998) for consistency.
3.0 PERFORMANCE ASSESSMENT 3.1 Performance Data 3.1.1 Interference Testing
The results of interference testing indicate copper as the primary interference material, which is consistent with NIOSH Method 7701. Copper peaks were identified to occur between –200mV and –500mV during the stripping step. Lead peaks occur between -450mV and –700mV, therefore overlap between the lead and copper peak curves is possible. Anti-interference software was incorporated into the AeroLeadTM instrument to ignore the presence of copper peaks. 3.1.2 Extraction Efficiency Testing
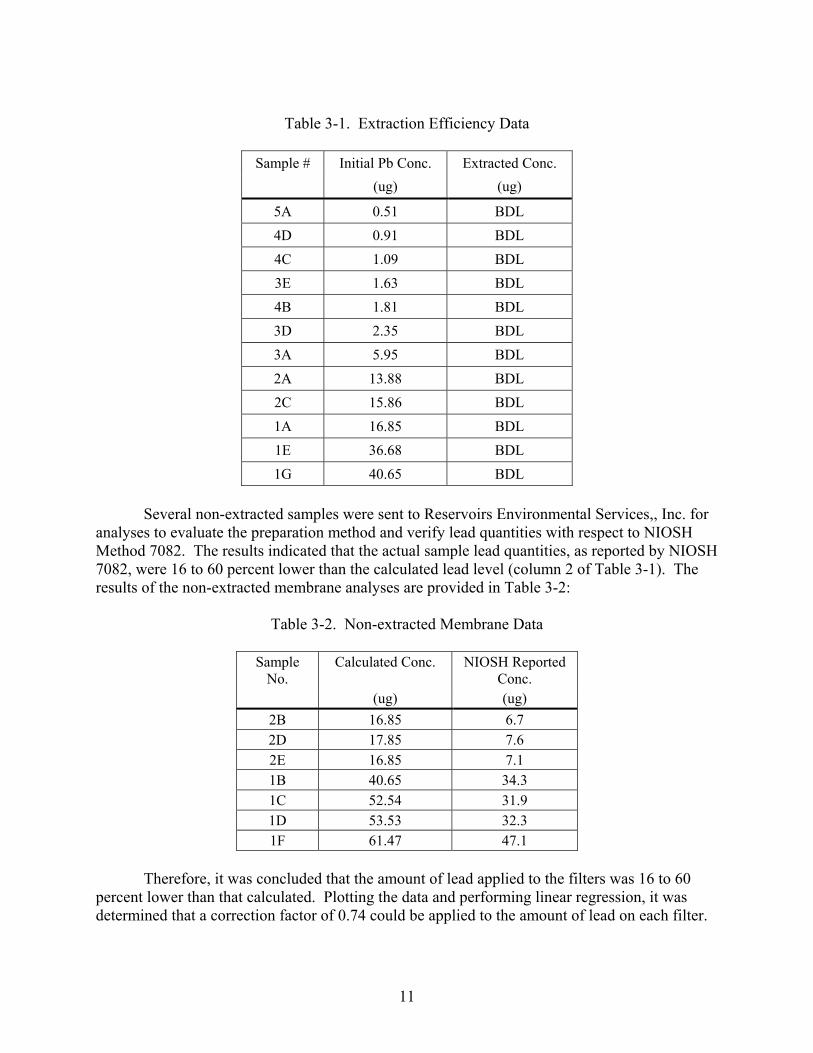
The samples used to perform a laboratory evaluation of the AeroLeadTM extraction mechanism were produced by Anteon personnel at NFESC facilities and transported to ELS Technology Inc., for extraction. All extracted membranes were sent to Reservoirs Environmental Services, Inc. for post extraction analyses. The analyses reported lead levels below the minimum detection limit (BDL) of 2.5ug for all extracted membranes. NIOSH Method 7082 was used for the analyses. The results of the extraction efficiency test are provided in the Table 3-1. The first column provides the sample number, the second column is the Pb quantity on each filter, by mass, as calculated during preparation, and the third column provides the lead quantity remaining on the membrane after extraction as reported by NIOSH Method 7082.
11
Table 3-1. Extraction Efficiency Data
Sample # Initial Pb Conc. Extracted Conc.
(ug) (ug)
5A 0.51 BDL 4D 0.91 BDL 4C 1.09 BDL 3E 1.63 BDL 4B 1.81 BDL 3D 2.35 BDL 3A 5.95 BDL 2A 13.88 BDL 2C 15.86 BDL 1A 16.85 BDL 1E 36.68 BDL 1G 40.65 BDL
Several non-extracted samples were sent to Reservoirs Environmental Services,, Inc. for
analyses to evaluate the preparation method and verify lead quantities with respect to NIOSH Method 7082. The results indicated that the actual sample lead quantities, as reported by NIOSH 7082, were 16 to 60 percent lower than the calculated lead level (column 2 of Table 3-1). The results of the non-extracted membrane analyses are provided in Table 3-2:
Table 3-2. Non-extracted Membrane Data
Sample No.
Calculated Conc. NIOSH Reported Conc.
(ug) (ug) 2B 16.85 6.7 2D 17.85 7.6 2E 16.85 7.1 1B 40.65 34.3 1C 52.54 31.9 1D 53.53 32.3 1F 61.47 47.1
Therefore, it was concluded that the amount of lead applied to the filters was 16 to 60
percent lower than that calculated. Plotting the data and performing linear regression, it was determined that a correction factor of 0.74 could be applied to the amount of lead on each filter.

12
Taking this information into account, the extraction efficiency of the AeroLeadTM instrument was determined to be greater than 91 percent, satisfying ASTM-E1775 requirements.
Table 3-3 has samples 1E and 1G which were extracted and analyzed and contained enough lead to evaluate extraction efficiency (due to the lower detection limit of the NIOSH method used for post extraction analyses). The correction factor of 0.74 was applied.
Table 3-3. Adjusted Extraction Efficiency Data
Sample No.
Calculated Pb (ug)
Actual Pb (ug)
Post-extracted Pb (ug)
Efficiency (%)
1E 36.68 27.23 <2.5 >91% 1G 40.65 30.18 <2.5 >91%
3.1.3 Capture Efficiency Testing
Capture efficiency tests were performed at a local pistol range in order to evaluate the parameter with real-world materials. Test 1, illustrated in Figure 3-1, indicated poor capture efficiencies for the initial collector design. The design was modified to improve the location of sealing surfaces resulting in significant improvements to capture efficiency (see Figure 3-2). ELS Technology Inc., then researched COTS products and found a NIOSH certified collector assembly, which was incorporated into the AeroLeadTM design. Additional capture efficiency tests were performed during the ORNL field test and again with outstanding results.
Figure 3-1. Capture Efficiency Test 1. Figure 3-2. Capture Efficiency Test 2.
3.1.4 Comparison Tests
The AeroLeadTM comparison tests were performed to determine the precision of the instruments. ASTM-E1775 defines acceptable instrument precision as follows (Table 3-4):
Test 1 Capture Efficiency Data
0
50
100
150
200
250
1 2 3
Test #
Pb C
aptu
red
(ug)
Primary Filter Secondary Filter
Test 2 Capture Efficiency Data
020406080
1 2 3Test #
Pb C
aptu
red
(ug)
Primary Filter Secondary Filter
13
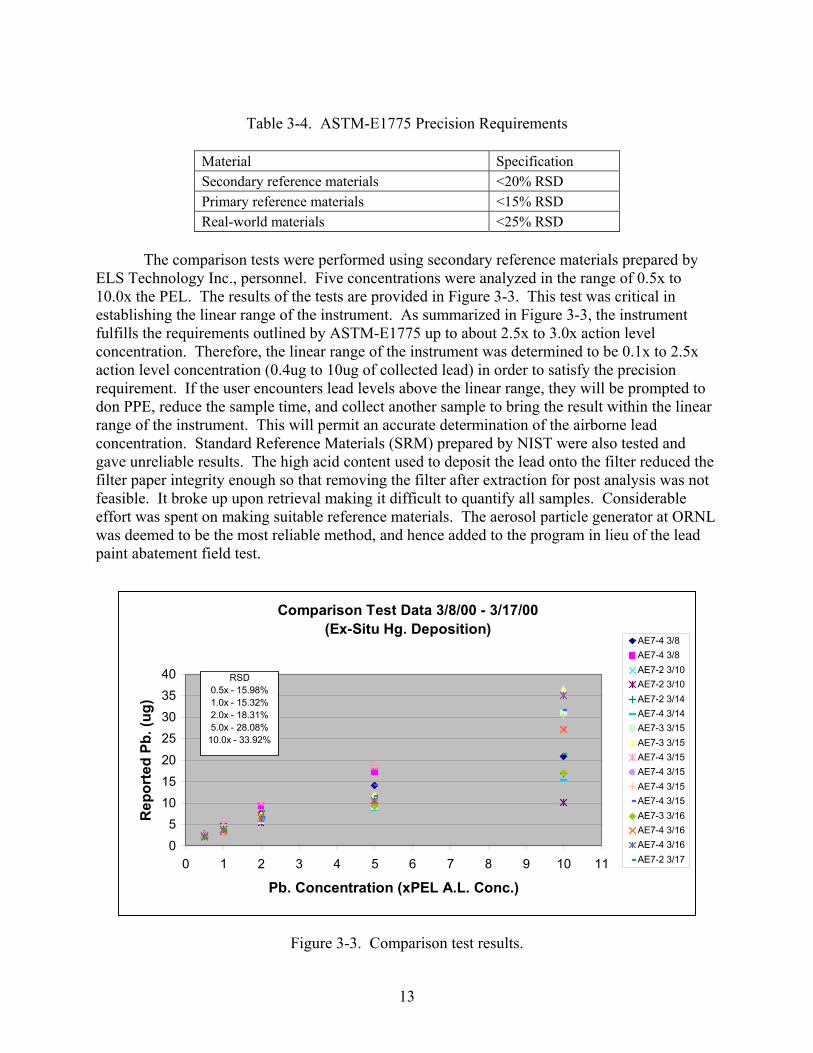
Table 3-4. ASTM-E1775 Precision Requirements
Material Specification Secondary reference materials <20% RSD Primary reference materials <15% RSD Real-world materials <25% RSD
The comparison tests were performed using secondary reference materials prepared by
ELS Technology Inc., personnel. Five concentrations were analyzed in the range of 0.5x to 10.0x the PEL. The results of the tests are provided in Figure 3-3. This test was critical in establishing the linear range of the instrument. As summarized in Figure 3-3, the instrument fulfills the requirements outlined by ASTM-E1775 up to about 2.5x to 3.0x action level concentration. Therefore, the linear range of the instrument was determined to be 0.1x to 2.5x action level concentration (0.4ug to 10ug of collected lead) in order to satisfy the precision requirement. If the user encounters lead levels above the linear range, they will be prompted to don PPE, reduce the sample time, and collect another sample to bring the result within the linear range of the instrument. This will permit an accurate determination of the airborne lead concentration. Standard Reference Materials (SRM) prepared by NIST were also tested and gave unreliable results. The high acid content used to deposit the lead onto the filter reduced the filter paper integrity enough so that removing the filter after extraction for post analysis was not feasible. It broke up upon retrieval making it difficult to quantify all samples. Considerable effort was spent on making suitable reference materials. The aerosol particle generator at ORNL was deemed to be the most reliable method, and hence added to the program in lieu of the lead paint abatement field test.
Figure 3-3. Comparison test results.
Comparison Test Data 3/8/00 - 3/17/00 (Ex-Situ Hg. Deposition)
05
10152025303540
0 1 2 3 4 5 6 7 8 9 10 11
Pb. Concentration (xPEL A.L. Conc.)
Rep
orte
d Pb
. (ug
)
AE7-4 3/8AE7-4 3/8AE7-2 3/10AE7-2 3/10AE7-2 3/14AE7-4 3/14AE7-3 3/15AE7-3 3/15AE7-4 3/15AE7-4 3/15AE7-4 3/15AE7-4 3/15AE7-3 3/16AE7-4 3/16AE7-4 3/16AE7-2 3/17
RSD0.5x - 15.98%1.0x - 15.32%2.0x - 18.31%5.0x - 28.08%10.0x - 33.92%

14
3.1.5 Oak Ridge Field Test
To evaluate instrument performance throughout the linear range of the detector, three lead concentrations were provided by the particle generator, 180ug/m3, 360ug/m3 and 720ug/m3. The high sample concentrations were chosen to allow for 5-minute sample times to expedite the test process. The generator was fitted with a manifold with four sampling ports. In addition, a LIPS was connected to the particle generator to independently determine the lead concentration generated. The high sample concentrations were chosen to allow for 5-minute samples to maximize the sample throughput for the time allocated on the particle generator. Fourteen samples were taken by the AeroLeadTM instruments at each concentration. The data is summarized in Table 3-5. Null fields in Table 3-5 indicate that only one AeroLeadTM was operated at that test point (typically due to operator error or malfunctioning of the instrument). Twenty-seven test points were conducted. Two instruments were operated during each test point, though instruments were occasionally exchanged during the test for electrode changeout and troubleshooting (three AeroleadTM instruments were used during the tests). Data are presented graphically in Figure 3-4, and a complete set of peak current graphical data is provided in Appendices B-D of NFESC (2001).
Figure 3-4. ORNL NIOSH results.
Samples were also collected for analysis by NIOSH Method 7082. A total of 18 to 26 filter samples were prepared for each of the three lead concentrations. Samples were split (unequally) between two laboratories to determine inter-laboratory precision. A summary of
1 2 3 4 5 6 7 8 9 10 11 12 13 14 15 16 17 18 19 20 21 22 23 24
180 ug/m3
720 ug/m3
0
50
100
150
200
250
300
350
400
450
500
Sample Set
Laboratory-Reported Concentration (ug/m3)
180 ug/m3360 ug/m3720 ug/m3

15
results of filters analyzed by NIOSH Method 7082 is presented in Table 3-5. A summary of laboratory data and additional statistics are included in NFESC (2001).
Table 3-.5. Analytical Laboratory Results of Non-Extracted
Filters Using NIOSH Method 7082
Pb Concentration No. of Samples Mean Standard Deviation
95% Confidence Level
180 ug/m3 24 126.4 23.0 9.70 360 ug/m3 22 210.8 37.6 16.7 720 ug/m3 15 402.5 56.5 31.3
One data point from the 720ug/m3 set was omitted as an anomalous outlier (reported as BDL) and three others were omitted due to particle generator orifice clogging. As can be seen in Table 3-5, the mean concentrations for each of the 180, 360 and 720ug/m3 data sets were significantly lower than that calculated to be delivered by the particle generator. The 95% confidence interval is a statistical expression of the “sureness” of a particular average (mean) of a population. It is the range, on either side of the mean, with which one can be sure to a particular degree of confidence (in this case 95%) that the mean is representative of the actual value. The mean error between the calculated amount of lead and the actual amount of lead deposited based on NIOSH Method 7082, expressed as a percentage for each concentration as:
(126.4-180)/180 x 100 = -29.8 percent (210.8-360)/360 x 100 = -41.4 percent (402.5-720)/720 x 199 = -50.6 percent
3.2 Performance Criteria
The specification used to evaluate the performance of the instrument(s) throughout this DEMVAL program was ASTM-E1775. The specification outlines the performance criteria very clearly. A copy of specification ASTM-E1775 is provided in NFESC (2001). A breakdown of performance criteria is provided in Table 3-6.
Table 3-6. ASTM-E1775 Specification Summary
Parameter Specification Working Range 0.1x – 10.0x PEL Extraction Efficiency >80% Capture Efficiency 100% Precision ± 15% for primary standards
± 20% for secondary standards ± 25% for real-world materials
Accuracy ± 25% (Related to AA Method)
16
Working range and precision parameters were first evaluated in the laboratory using ELS prepared secondary standards. Precision, accuracy, capture efficiency and extraction efficiency were determined during the ORNL controlled tests. 3.3 Data Assessment
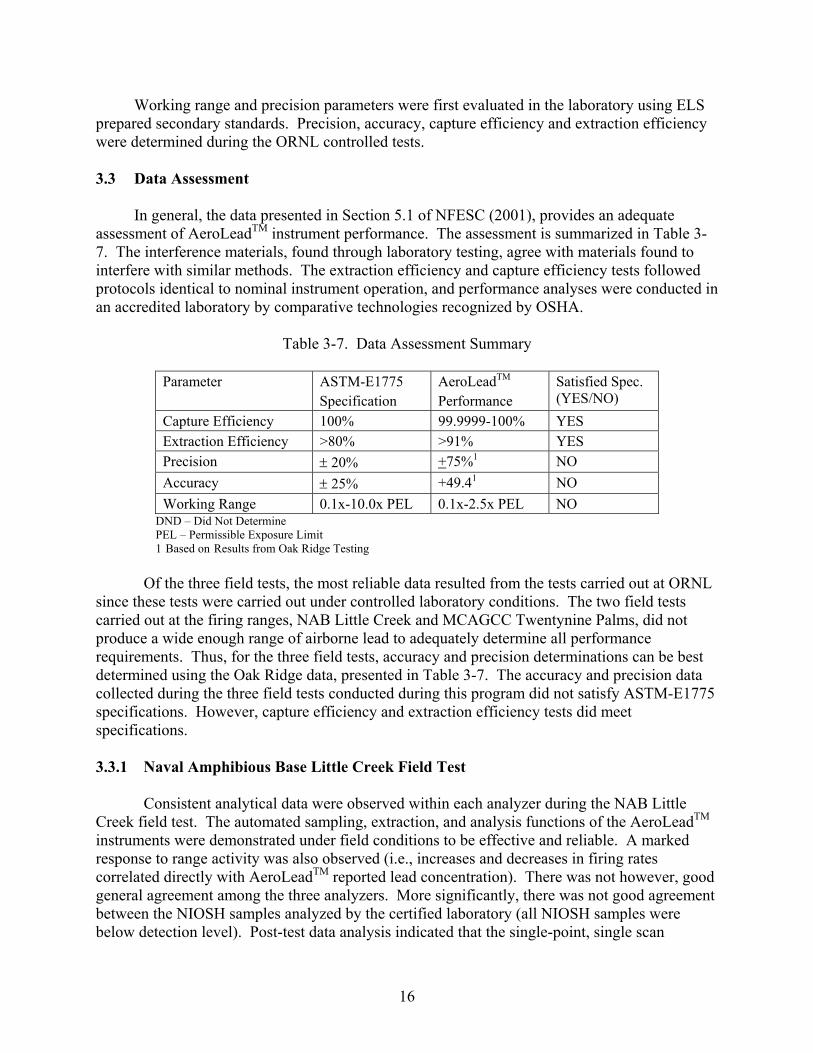
In general, the data presented in Section 5.1 of NFESC (2001), provides an adequate assessment of AeroLeadTM instrument performance. The assessment is summarized in Table 3-7. The interference materials, found through laboratory testing, agree with materials found to interfere with similar methods. The extraction efficiency and capture efficiency tests followed protocols identical to nominal instrument operation, and performance analyses were conducted in an accredited laboratory by comparative technologies recognized by OSHA.
Table 3-7. Data Assessment Summary
Parameter ASTM-E1775 Specification
AeroLeadTM Performance
Satisfied Spec. (YES/NO)
Capture Efficiency 100% 99.9999-100% YES Extraction Efficiency >80% >91% YES Precision ± 20% +75%1 NO Accuracy ± 25% +49.41 NO Working Range 0.1x-10.0x PEL 0.1x-2.5x PEL NO
DND – Did Not Determine PEL – Permissible Exposure Limit 1 Based on Results from Oak Ridge Testing
Of the three field tests, the most reliable data resulted from the tests carried out at ORNL
since these tests were carried out under controlled laboratory conditions. The two field tests carried out at the firing ranges, NAB Little Creek and MCAGCC Twentynine Palms, did not produce a wide enough range of airborne lead to adequately determine all performance requirements. Thus, for the three field tests, accuracy and precision determinations can be best determined using the Oak Ridge data, presented in Table 3-7. The accuracy and precision data collected during the three field tests conducted during this program did not satisfy ASTM-E1775 specifications. However, capture efficiency and extraction efficiency tests did meet specifications. 3.3.1 Naval Amphibious Base Little Creek Field Test
Consistent analytical data were observed within each analyzer during the NAB Little Creek field test. The automated sampling, extraction, and analysis functions of the AeroLeadTM instruments were demonstrated under field conditions to be effective and reliable. A marked response to range activity was also observed (i.e., increases and decreases in firing rates correlated directly with AeroLeadTM reported lead concentration). There was not however, good general agreement among the three analyzers. More significantly, there was not good agreement between the NIOSH samples analyzed by the certified laboratory (all NIOSH samples were below detection level). Post-test data analysis indicated that the single-point, single scan

17
calibration technique used in the original AeroLeadTM instruments allowed too much variability in sample results. This is primarily due to a new configuration of the detector cell (to provide increased electrode operational life) which results in more variable mass transfer of analyte from the filter to the detector cell than has been observed previously. This problem was addressed by incorporating a quadruplicate calibration procedure followed by a quality control calibration check after calibration. 3.3.2 Twentynine Palms Field Test
Consistent analytical data were observed for each AeroLeadTM analyzer during the Twentynine Palms field test. The automated extraction and analysis functions of the AeroLeadTM instruments were found to be effective and reliable. The software modifications made after the NAB Little Creek field test proved to enhance the performance of the instrument. Low level concentrations were detected and accurate calibration was achieved reliably. Software modifications to allow PBZ analyses operated appropriately.
There was good general agreement among the AeroLeadTM analyzed samples. Samples collected in the same location for the same sample period resulted in similar reported lead concentrations. However, in general, the NIOSH data generated by Reservoirs Environmental Services did not agree with the AeroLeadTM data. The disparity of results is believed to be attributed to one of the following: sample contamination during cartridge installation and handling, inaccurate air flow measurements, or mis-prepared calibration solution and instrument variance using real-world samples. To eliminate the possibility of mis-prepared calibration solution, three samples of the calibration solution used during the Twentynine Palms field test were sent to Reservoirs Environmental Services for NIOSH analysis (Flame AA). The results are provided in Table 3-8.
Table 3-8. Calibration Solution NIOSH Analysis
Sample No. Prepared Concentration Reported Concentration Pb-1 1000 ug/l 1167 ug/l Pb-2 1000 ug/l 1000 ug/l Pb-3 1000 ug/l 1158 ug/l
The results indicate that the solution was prepared correctly and that the NIOSH method
and the AeroLeadTM instrument have good analytical agreement on analyses of laboratory prepared aqueous samples. The same solution was used during calibration verification process at Twentynine Palms. The AeroLeadTM instruments reported the correct lead concentration (± 20 percent) with respect to the prepared lead solution, which further confuses the results of the Twentynine Palms collected samples. Aqueous samples, when analyzed, provide better results than corresponding airborne samples. Analyzer modifications were successfully completed and tested prior to the second field test to correct calibration and software issues. From analyzing the pretest laboratory data, it is believed that the instruments were performing properly during the Twentynine Palms field test, therefore, sample contamination, pump calibration, or spatial distribution issues are believed to be the case of data discrepancy.
Specific observations made during test and data analysis are outlined below. Course(s) of action(s) required to improve AeroLeadTM analyzer performance are also addressed.

18
AeroLeadTM software upgrades to incorporate PBZ analyses functioned well.
The modified calibration procedure, which includes quadruple scan calibration and
triple scan verification steps, significantly improved calibration reliability. Performing occasional calibration verification during sample analyses effectively verifies analyzer performance. Ex-situ mercury deposition is advantageous as it eliminates the occurrence of data
scatter experienced during the NAB Little Creek field test. Furthermore, the user is not exposed to mercury while calibrating and maintaining the instrument. Although the AeroLeadTM and NIOSH data displayed similar trends, there was not
good overall agreement between the NIOSH data and the AeroLeadTM data. 3.3.3 Oak Ridge Field Test
Averaged results reported by each of the three AeroLeadTM instruments at each of the three lead concentrations generated by the particle generator are presented in Table 3-9.
Table 3-9. Averaged Results for Individual AeroLeadTM Instruments
Analyzer 2 Analyzer 3 Analyzer 4 Pb Conc.
(NIOSH consensus) No. of
Samples Mean Std.
Dev. No. of Samples
Mean Std. Dev.
No. of Samples
Mean Std. Dev.
126.4 ug/m3
4 122.1 18.7 6 317.8 208.7 2 130.3 53.3
210.8 ug/m3
4 162.4 142.1 5 459.2 237.6 4 147.5 84.9
355.6 ug/m3
5 331.3 80.4 7 716.4 364.5 2 250.3 79.1
A summary of results for all three analyzers combined yields the averaged data presented in Table 3-10. The results are also presented graphically in Figure 3-5. Complete statistical results are presented in the final report (NFESC 2001). Demonstration results from the final controlled test showed there was a high degree of variability in performance between the units. Precision varied between 15 and 87 percent in individual units at the three standard lead concentrations tested; this inter-instrument variability contributed to generally poor overall precision when viewing the overall results from all instruments of between 65 and 82 percent. Inter-instrument variability was also apparent in accuracy (bias) of AeroLeadTM results and ranged from between 29 percent and 75 percent. In almost all cases, the AeroLeadTM instruments over determined lead concentrations. The primary contributor to inter-instrument variability has been traced to response differences between working electrodes; the manufacturer is currently improving working electrode design and manufacturing techniques so that sensitivity/response issues are resolved. Capture efficiency and extraction efficiency were validated. Precision and accuracy did not meet specifications, therefore, the instrument does not meet validation requirements and cannot be used to satisfy regulatory requirements. The 95% confidence interval is a statistical

19
expression of the “sureness” of a particular average (mean) of a population. It is the range, on either side of the mean, with which one can be sure to a particular degree of confidence (in this case 95%) that the mean is representative of the actual value.
Table 3-10. Averaged Combined Results for AeroLeadTM Instruments
Pb conc. (NIOSH
consensus)
No. of Samples Mean Std. Dev. 95% Confidence Level
126.4 ug/m3 12 221.3 174.1 110.6 210.8 ug/m3 13 272.0 222.3 134.4 355.6 ug/m3 14 512.3 330.7 190.9
Precision for each analyzer can be expressed in terms of the coefficient of variation
(relative standard deviation (RSD)) which is the standard deviation divided by the mean, times 100 (percent). Precision for each analyzer at each of the three concentrations is presented in Table 3-11. Accuracy (bias) can be determined by dividing the AeroleadTM result by the actual Pb concentration (i.e. the NIOSH average at each concentration range), as presented in Table 3-11.
Figure 3-5. ORNL AreoLead™ results combined.
1 2 3 4 5 6 7 8 9 10 11 12 13 14
180 ug/m3360 ug/m3
720 ug/m30
200
400
600
800
1000
1200
1400
1600
Sample Set
Aerolead-Reported Concentration (ug/m3)
180 ug/m3360 ug/m3720 ug/m3

20
Table 3-11: Precision of Each AeroLeadTM Instrument Based on
Mean Result Compared to NIOSH Method 7082 Mean Result
Analyzer 2 Analyzer 3 Analyzer 4 Pb conc. (NIOSH consensus)
Precision (±%)
Mean Std. Dev.
Precision (±%)
Mean Std. Dev.
Precision (±%)
Mean Std. Dev.
126.4 ug/m3
15.3 122.1 18.7 16.8 317.8 208.7 40.9 130.3 53.3
210.8 ug/m3
87.5 162.4 142.1 51.7 459.2 237.6 57.5 147.5 84.9
355.6 ug/m3
24.3 331.3 80.4 50.9 716.4 364.5 31.6 250.3 79.1
Accuracy (bias) can be determined by dividing the AeroLeadTM result by the actual Pb
concentration (i.e., the NIOSH average at each concentration range), as presented in Table 3-12.
Table 3-12. Accuracy (Bias) for Each AeroLeadTM Instrument Compared to NIOSH Method 7082
Analyzer 2 Analyzer 3 Analyzer 4 Pb conc.
(NIOSH consensus)
Precision (±%)
Mean Accuracy (Bias)
Precision (±%)
Mean Accuracy (Bias)
Precision (±%)
Mean Accuracy (Bias)
126.4 ug/m3
15.3 122.1 -3.50% 16.8 317.8 +251% 40.9 130.3 +3.01%
210.8 ug/m3
87.5 162.4 -29.8% 51.7 459.2 +218% 57.5 147.5 -30.0%
355.6 ug/m3
24.3 331.3 -7.33% 50.9 716.4 +201% 31.6 250.3 -29.6%
A summary of results for all three analyzers combined in the ORNL field test is presented
in Table 3-13.
Table 3-13. Precision and Accuracy (Bias) for All AeroLeadTM Instruments Combined Compared to NIOSH Method 7082
Pb conc. (NIOSH consensus)
Precision (±%) (Coefficient of Variation)
Mean Std. Dev. Accuracy (Bias)
126.4 ug/m3 78.7 221.3 174.1 +75.1% 210.8 ug/m3 81.7 272.0 222.3 +29.0% 355.6 ug/m3 64.6 512.3 330.7 +44.1%

21
3.4 Technology Comparison
Several NIOSH methods were used for comparison during the AeroLeadTM DEMVAL project including: NIOSH 7082, NIOSH 7105 and NIOSH 7701. For easy comparison, technical performance information for each method is summarized in Table 3-14:
Table 3-14. Technical Performance Comparison
Parameter AeroLeadTM NIOSH 7082
NIOSH 7105 NIOSH 7701
Technology ASV Flame AAS GFAAS ASV Low Detect Limit 0.25 ug 2.5 ug 0.001 ug 0.31ug Accuracy 49.4% ±17.6% not determined ±19.3% Precision 75% 0.072 not determined 0.094 Interferences Cu Cu Sampling Automatic AAM
Separate PBZ Separate Step Separate Step Separate Step
Extraction Automatic 92% Efficient
Separate Step Separate Step Separate Step
Analysis Time 7-10 minutes 24 hrs. 24 hrs. not determined Portability YES NO NO NO
AAM-Ambient Air Monitor ASV-Anodic Stripping Voltammetry PBZ-Personal Breathing Zone AAS-Atomic Absorption Spectrometry GFAAS- Graphite Furnace AAS
4.0 COST ASSESSMENT 4.1 Cost Reporting
The estimated cost of purchasing, operating, and maintaining the AeroLeadTM instrument is provided in the Table 4-1. The estimate assumes a $20.00-per hour labor rate and includes all calibration, operation, and maintenance.

22
Table 4-1. Cost Data Table for the AeroLead™ Airborne Lead Analyzer
Cost Data Table for the AeroLeadTM Airborne Lead Analyzer
Costs by Category Startup Operation & Maintenance Demobilization
Activity $ Activity $ Activity $ Capital Equipment $9600.00 Labor
(calibration/operation – 4 hours @ $25/hr)
$100.00 per day
Removal of Equipment
$0.00
5-year Amortized Equipment Cost per Sample
$0.92 per sample
Labor (20 samples per day)
$5.00 per sample
Site Preparation $0.00 Analytical Services $0.00 Site Restoration
$0.00
Facility Modifications
$0.00
Utilities $0.00 Operation Training
(1 hr. per person) $20.00
Consumables & Supplies
$2.77 (per sample)
Ancillary Equipment $0.00
The consumable and supplies cost estimate is based on electrode life, ion exchange life, and membrane price information gathered during the evaluation phase of the project. The supplies cost requirements are broken down in the following Table 4-2. The total per sample cost is then $0.092 + $2.50 + $2.77= $8.69.
Table 4-2. Cost Data Table for NIOSH Method 7105 or 7082
Component User Cost
($) Sample
Life Cost per Sample
Reference Electrode $25.00 40 $0.625 Auxiliary Electrode $20.00 100 $0.20 Working Electrode $25.00 20 $1.25 Membrane $0.57 1 $0.57 Electrode Solution 10.00 100 $0.10 Ion Exchange Assembly
$10.00 500 $0.02
Total Cost per Sample
$2.77

23
4.2 Cost Comparisons
The technologies most commonly used to analyze airborne lead are FAAS and GFAAS. These methods require costly equipment and highly trained personnel. It is assumed here that a user would send samples to a certified laboratory for a 3 to 5 day turnaround time analysis. . The total cost per sample assumes 20 samples per day, a 5-year instrument life, instrument in use two 8-hour days/week, and labor at $25 per hour. The 5-year amortized per sample cost given these assumptions is (Equation 4-1):
$400.00/(20 samples/event * 2 events/week * 52 weeks/year * 5 years) = Equation (4-1) $0.04/sample. The total cost per sample is then $0.04 +$2.50 + $25.00 + $1d.00 = $28.54.
Table 4-3. Cost Data Table for NIOSH Method 7105 or 7082
Cost Data Table for NIOSH Method 7105 or 7082
Costs by Category Startup Operation & Maintenance Demobilization
Activity $ Activity $ Activity $ Capital Equipment
$400.00 Labor (sample collection)
$25.00 per hr
Removal of Equipment
$0.00
Site Preparation $0.00 Analytical Services (per sample)
$25.00
Site Restoration $0.00
5-year Amortized Equipment Cost per Sample
$0.04 per sample
Labor (20 samples per day)
$2.50 per sample
Facility Modifications $0.00 Utilities $0.00 Operation Training (1 hr.
per person) $20.00
Consumables & Supplies (per sample)
$1.00
Ancillary Equipment $0.00
Therefore, the overall realized savings according to NFESC estimations:
• Assuming 170,000 DOD LBP sites (50 percent) • Assume 32 samples per site ($913.28 versus $278.08) • Cost savings of $635.20 per site • DOD Savings = $107,984,000
24
5.0 IMPLEMENTATION ISSUES
The rigorous conduct of each field and laboratory test showed variability of results that did not surface in preliminary testing of the instrument. From this, several valuable lessons can be passed on: 5.1 Cost Observations
The projected cost of procuring an AeroLeadTM unit remains at the pre-validation estimate of $10,000. There were no major differences in projected costs versus actual costs reported during the validation program. 5.2 Performance Observations
The AeroLeadTM met the performance criteria for capture efficiency and extraction efficiency. The AeroLeadTM did not meet specifications for accuracy and precision. Failure to meet all specifications is thought to be related, in part, to the working electrode. Each electrode is handmade so instrument precision may have been reduced due to minute imperfections imparted to the electrode during its preparation. The manufacturer is continuing work to improve this process. 5.3 Scale-up
This is not relevant to the AeroLeadTM. 5.4 Other Significant Observations The AeroLead™ instrument will require additional demonstration and validation testing to determine instrument accuracy before it can be considered a commercially viable product. A method must also be developed and accepted by NIOSH, which describes the operation and illustrates compliance with specification ASTM-E1775. The manufacturer has conducted additional field and laboratory tests during 2001 to try and resolve precision and accuracy deficiencies. The issues are not completely resolved at this time.
Currently, design improvements to the AeroLead™ are being made by the manufacturer and will be field tested by interested commercial users. It would be helpful to perform a third method of lead analysis to allow the research team to evaluate the validity of both the AeroLead™ and the comparative data. The AeroLead™ instrument has proven reliable in the laboratory in terms of operation, accuracy, and precision using aqueous samples, but has not been proven reliable for real-world or artificially-produced airborne lead determination.
25
5.5 Lessons Learned
The rigorous conduct of each field and laboratory test showed variability of results that did not surface in preliminary testing of the instrument. From this, several valuable lessons can be passed on:
• Perform additional testing using real-world materials under controlled laboratory conditions prior to additional field tests. Do not rely on dissolved lead solutions to determine the reliability of the instrument; instead use known concentrations of lead particles.
• Choose the comparative method and laboratory conducting the comparative sample
analyses carefully. Use methods which provide detection levels commensurate with the samples collected (i.e., low detection limits for sites with low lead levels)
• When sampling in air handling systems, choose sample locations which allow the
sample cartridge to be installed inverted to eliminate the potential for sample contamination during installation
• Perform airborne lead controlled tests early in the demonstration phase when possible
to more easily identify issues. 5.6 End-User Issues
Throughout the extensive development and field testing of the AeroLead™ instrument, many sectors of commercial industry provided comments, including lead abatement supervisors and shooting range mangers. Their response to the instrument was overwhelmingly positive. All those interviewed were interested in using the AeroLead™ instrument upon successful completion of the demonstration process. Potential users are particularly interested in the ability to improve employee safety and reduce potential litigation by having occupational lead concentrations reported in near real-time. 5.7 Approach to Regulatory Compliance and Acceptance
Under this program, the AeroLeadTM was compared against SRMs using standard regulatory approved analytical methods. The specification used to evaluate the performance of the instrument was ASTM E1775. The specification outlines the performance criteria very clearly. Had the AeroLeadTM met the required performance criteria, the method would have been eligible for full regulatory acceptance.

26
6.0 REFERENCES Ashley K. (1998). Appl. Occup. Environ. Hyg. 13, pp 94-98 (1998) ASTM Standard E-1775-96 (1996). Standard Guide for Evaluating Performance of On-Site Extraction and Field-Portable Electrochemical or Spectrophotometric Analysis for Lead: Designation. 1996/ Naval Facilities Engineering Service Center/Environmental and Life Support Technology (2000). Interim Report Field Validation of Real Time Airborne Lead Analyzer, NAB Little Creek Field Test, 25 February 2000. Naval Facilities Engineering Service Center/Environmental and Life Support Technology (2000). Interim Report Field Validation of Real Time Airborne Lead Analyzer, Twentynine Palms Field Test, 9 Aug 2000. Naval Facilities Engineering Service Center (2001). Field Validation of Real Time Airborne Lead Analyzer, ESTCP Final Report, Nov 2001. NIOSH Manual of Analytical Methods (1994). Lead by Flame AAS: Method 7082, Issue 2, 4th Edition, 15 August 1994. NIOSH Manual of Analytical Methods (1994). Lead by GFAAS: Method 7105, Issue 2, 4th Edition, 15 August 1994. NIOSH Manual of Analytical Methods (1998). Lead by Ultrasound/ASV: Method 7701, 4th Edition, 15 January 1998.
27
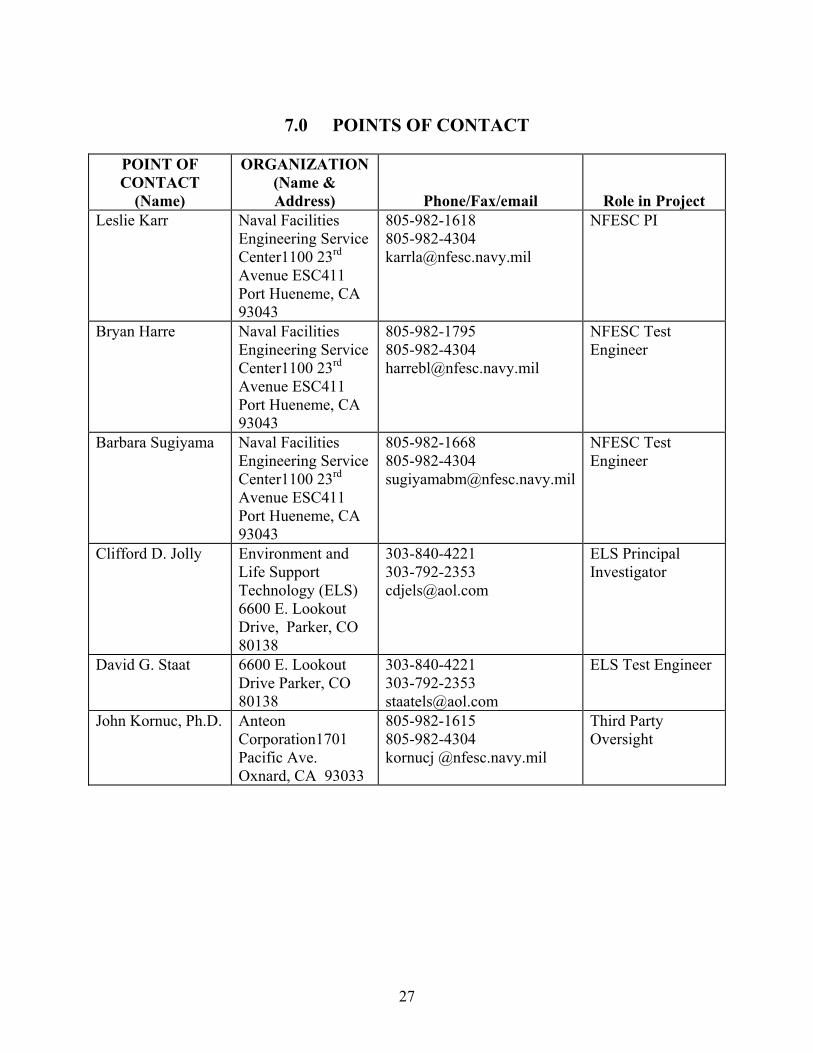
7.0 POINTS OF CONTACT
POINT OF CONTACT
(Name)
ORGANIZATION (Name & Address)
Phone/Fax/email
Role in Project Leslie Karr Naval Facilities
Engineering Service Center1100 23rd Avenue ESC411 Port Hueneme, CA 93043
805-982-1618 805-982-4304 [email protected]
NFESC PI
Bryan Harre Naval Facilities Engineering Service Center1100 23rd Avenue ESC411 Port Hueneme, CA 93043
805-982-1795 805-982-4304 [email protected]
NFESC Test Engineer
Barbara Sugiyama Naval Facilities Engineering Service Center1100 23rd Avenue ESC411 Port Hueneme, CA 93043
805-982-1668 805-982-4304 [email protected]
NFESC Test Engineer
Clifford D. Jolly Environment and Life Support Technology (ELS) 6600 E. Lookout Drive, Parker, CO 80138
303-840-4221 303-792-2353 [email protected]
ELS Principal Investigator
David G. Staat 6600 E. Lookout Drive Parker, CO 80138
303-840-4221 303-792-2353 [email protected]
ELS Test Engineer
John Kornuc, Ph.D. Anteon Corporation1701 Pacific Ave. Oxnard, CA 93033
805-982-1615 805-982-4304 kornucj @nfesc.navy.mil
Third Party Oversight