cpfl energia institucional jun11_eng_final
TRANSCRIPT

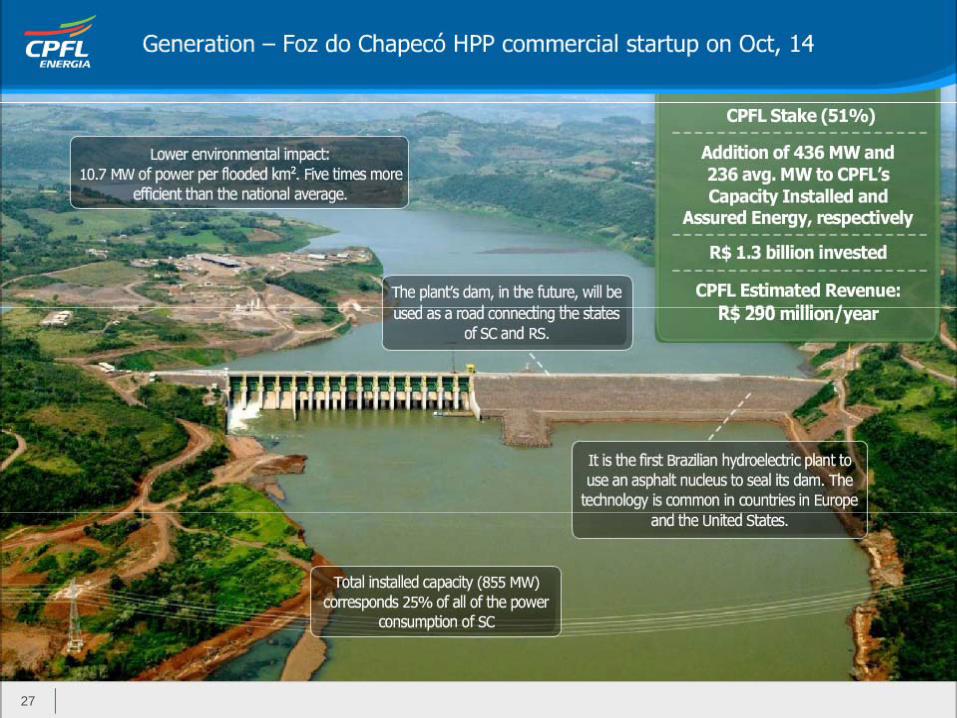
Foz do Chapecó HPPOverview: dam | reservoir
Disclaimer
This presentation may contain statements that represent expectations about future events or results according to Brazilian
and international securities regulators. These statements are based on certain assumptions and analyses made by the
C t t it i d th i i t k t diti d t d f t tCompany pursuant to its experience and the economic environment, market conditions and expected future events, many
of which are beyond the Company's control. Important factors that could lead to significant differences between actual
results and expectations about future events or results include the Company's business strategy, Brazilian and international
economic conditions, technology, financial strategy, developments in the utilities industry, hydrological conditions, financial
market conditions uncertainty regarding the results of future operations plans objectives expectations and intentionsmarket conditions, uncertainty regarding the results of future operations, plans, objectives, expectations and intentions,
among others. Considering these factors, the Company's actual results may differ materially from those indicated or implied
in forward-looking statements about future events or results.
The information and opinions contained herein should not be construed as a recommendation to potential investors and no
investment decision should be based on the truthfulness, timeliness or completeness of such information or opinions. None
of the advisors to the company or parties related to them or their representatives shall be liable for any losses that may
result from the use or contents of this presentation.
This material includes forward-looking statements subject to risks and uncertainties which are based on currentThis material includes forward looking statements subject to risks and uncertainties, which are based on current
expectations and projections about future events and trends that may affect the Company's business. These statements
may include projections of economic growth, demand, energy supply, as well as information about its competitive position,
the regulatory environment, potential growth opportunities and other matters. Many factors could adversely affect the
estimates and assumptions on which these statements are based.est ates a d assu pt o s o c t ese state e ts a e based
2
Agenda
Corporate Overview
Operational Efficiency
Growth in the Generation Business
Wide Portfolio of Services
1 t i l M k C
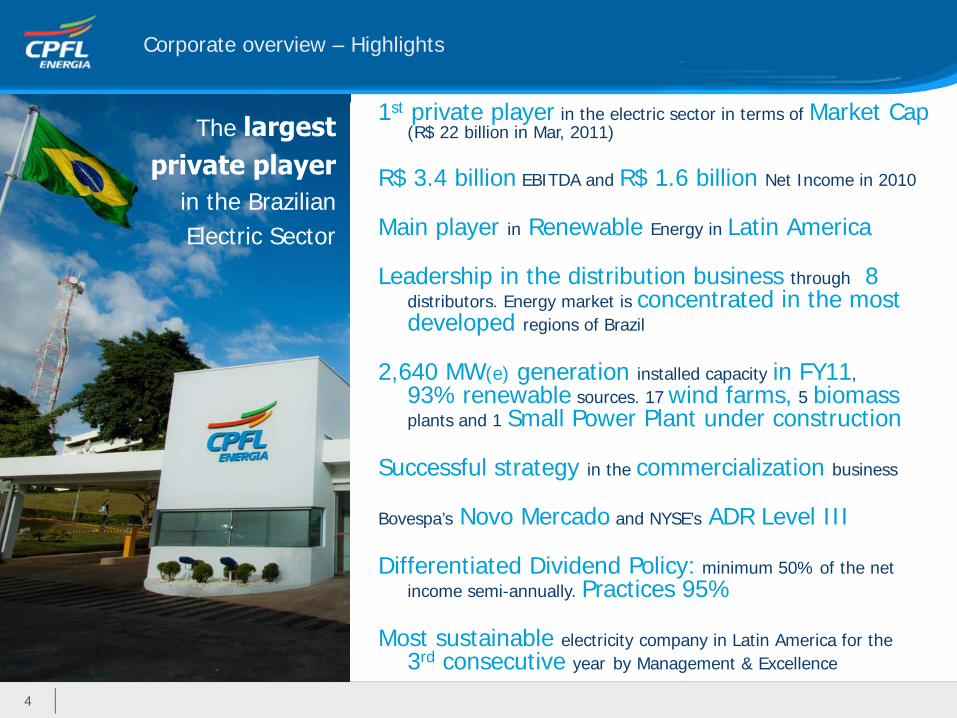
Corporate overview – Highlights
1st private player in the electric sector in terms of Market Cap (R$ 22 billion in Mar, 2011)
R$ 3.4 billion EBITDA and R$ 1.6 billion Net Income in 2010
The largest private player
in the BrazilianMain player in Renewable Energy in Latin America
Leadership in the distribution business through 8 distributors. Energy market is concentrated in the most
in the Brazilian Electric Sector
d bu o gy a co ce t ated t e ostdeveloped regions of Brazil
2,640 MW(e) generation installed capacity in FY11, 93% renewable sources. 17 wind farms, 5 biomass
S ll P Pl t d t tiplants and 1 Small Power Plant under construction
Successful strategy in the commercialization business
B ’ Novo Mercado d NYSE’ ADR Level IIIBovespa’s Novo Mercado and NYSE’s ADR Level III
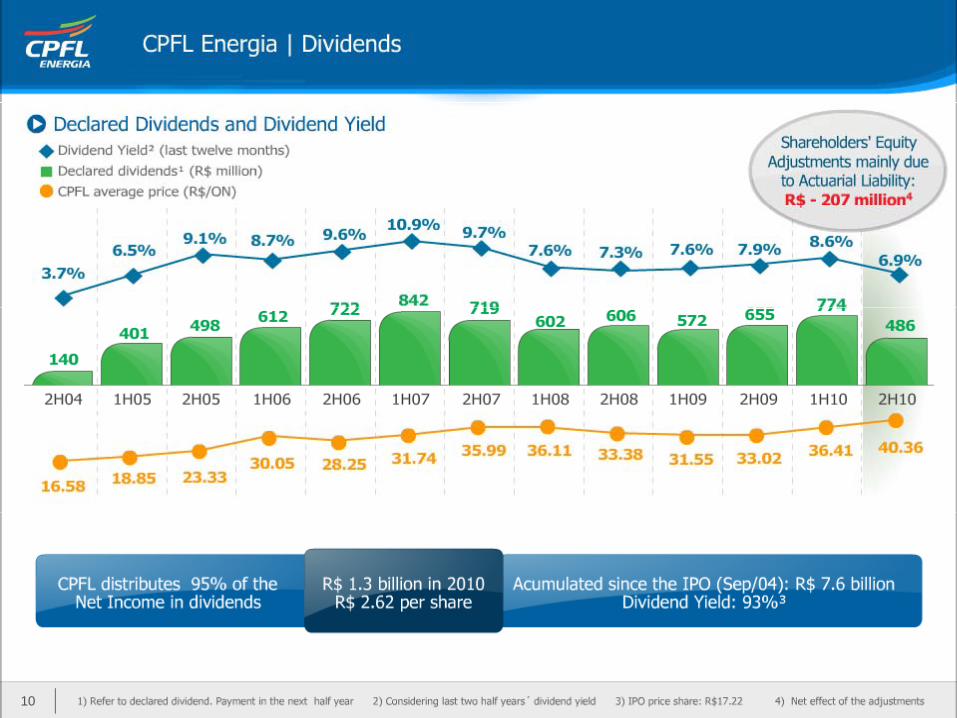
Differentiated Dividend Policy: minimum 50% of the net income semi-annually. Practices 95%
Most sustainable electricity company in Latin America for the3rd consecutive year by Management & Excellence
4
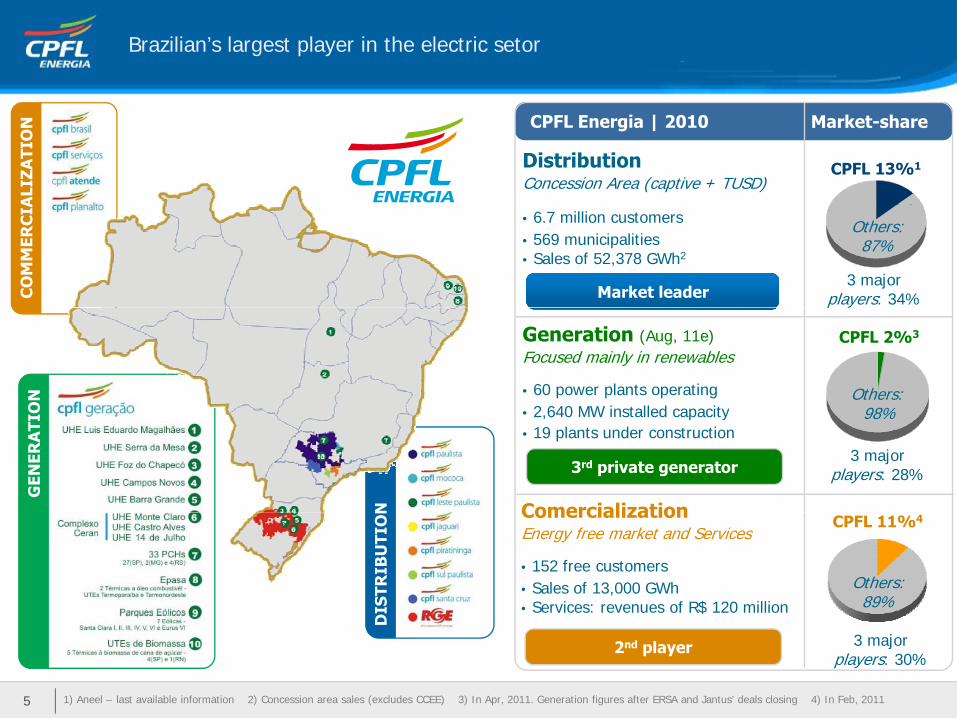
Brazilian’s largest player in the electric setor
CPFL Energia | 2010
CPFL 13%1
Market-share
DistributionConcession Area (captive + TUSD)
ALI
ZATI
ON
Others: 87%
• 6.7 million customers• 569 municipalities• Sales of 52,378 GWh2
Market leader3 major
players: 34% CO
MM
ERC
IA
CPFL 2%3Generation (Aug, 11e)Focused mainly in renewables
• 60 power plants operating2 640 MW installed capacity
Others: 98%
p y
ON
• 2,640 MW installed capacity• 19 plants under construction
Comercialization
3rd private generator
98%
3 majorplayers: 28%
N
GEN
ERA
TIO
CPFL 11%4ComercializationEnergy free market and Services
• 152 free customers• Sales of 13,000 GWh• Services: revenues of R$ 120 million
Others:89%
DIS
TRIB
UTI
ON
1) Aneel – last available information 2) Concession area sales (excludes CCEE) 3) In Apr, 2011. Generation figures after ERSA and Jantus’ deals closing 4) In Feb, 20115
$
2nd player 3 majorplayers: 30%
D
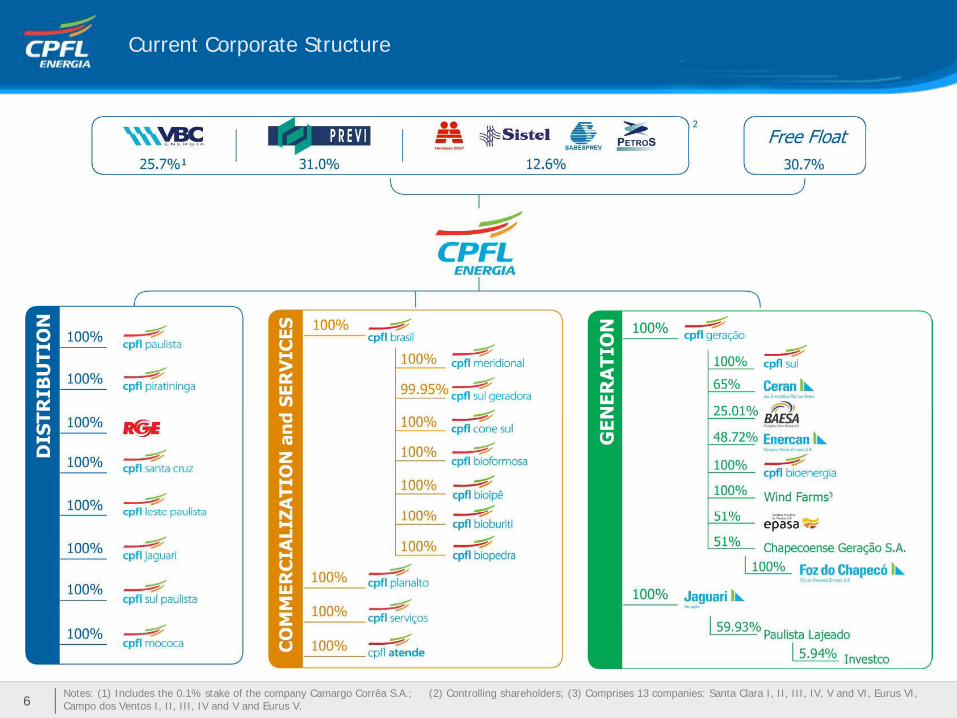
Current Corporate Structure
Notes: (1) Includes the 0.1% stake of the company Camargo Corrêa S.A.; (2) Controlling shareholders; (3) Comprises 13 companies: Santa Clara I, II, III, IV, V and VI, Eurus VI, Campo dos Ventos I, II, III, IV and V and Eurus V.6
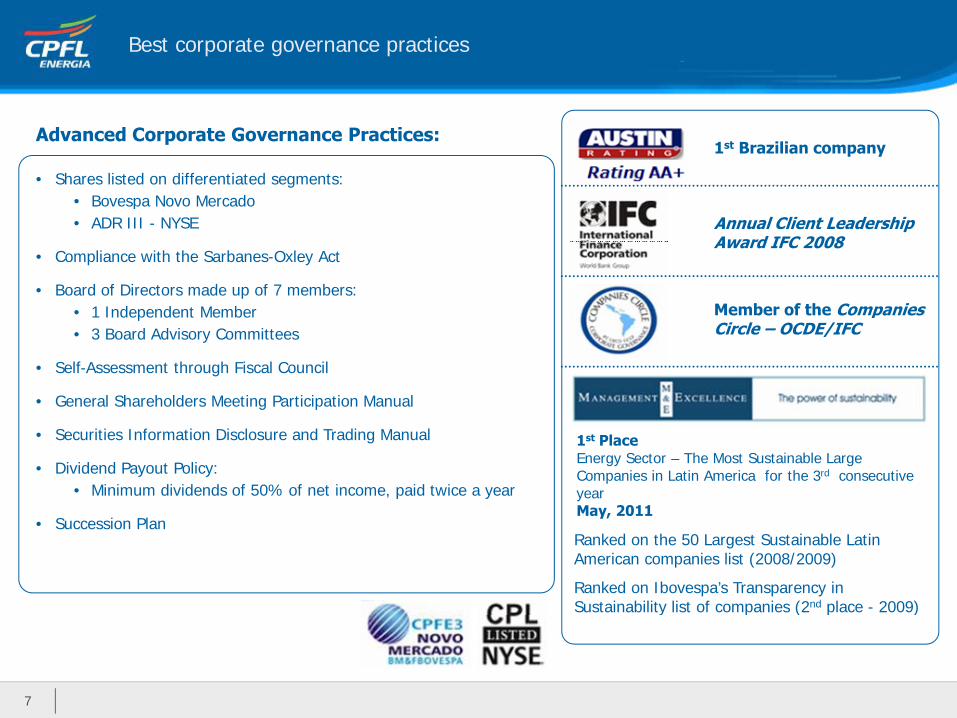
Best corporate governance practices
• Shares listed on differentiated segments:• Bovespa Novo Mercado
1st Brazilian companyAdvanced Corporate Governance Practices:
Bovespa Novo Mercado• ADR III - NYSE
• Compliance with the Sarbanes-Oxley Act
• Board of Directors made up of 7 members:1 I d d t M b
Annual Client Leadership Award IFC 2008
Member of the Companies• 1 Independent Member• 3 Board Advisory Committees
• Self-Assessment through Fiscal Council
• General Shareholders Meeting Participation Manual
Member of the Companies Circle – OCDE/IFC
• Securities Information Disclosure and Trading Manual
• Dividend Payout Policy:• Minimum dividends of 50% of net income, paid twice a year
1st PlaceEnergy Sector – The Most Sustainable Large Companies in Latin America for the 3rd consecutive yearMay 2011
• Succession PlanRanked on the 50 Largest Sustainable Latin American companies list (2008/2009)
Ranked on Ibovespa’s Transparency in Sustainability list of companies (2nd place - 2009)
May, 2011
y p ( p )
7
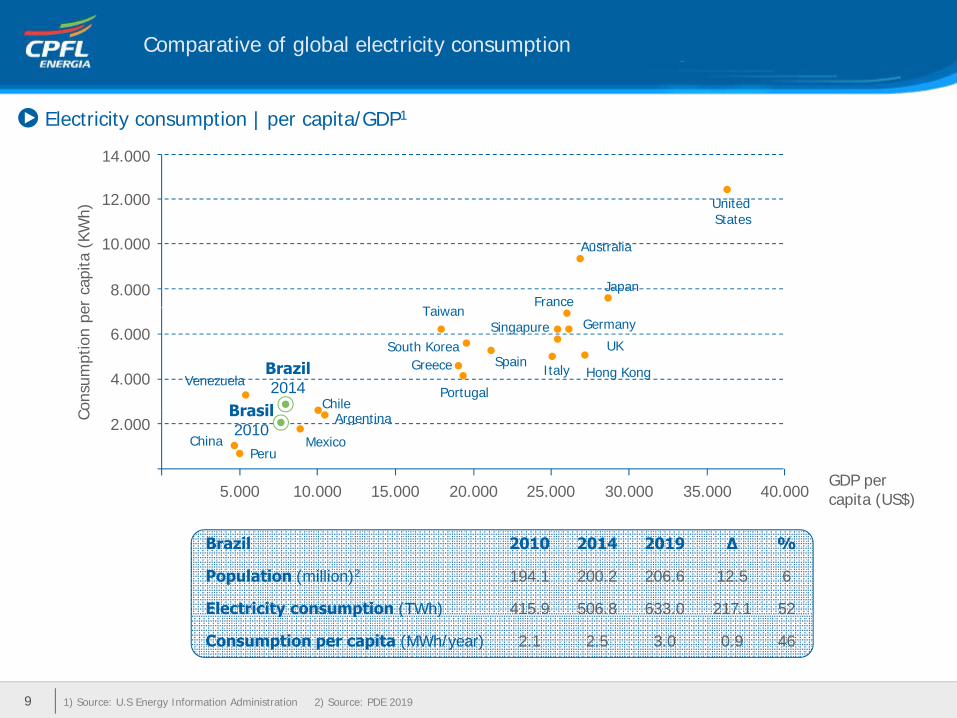
Comparative of global electricity consumption
Electricity consumption | per capita/GDP1
) 12.000
14.000
United
er c
apita
(KW
h)
8.000
10.000
000
T iFrance
Australia
Japan
United States
onsu
mpt
ion
pe
4.000
6.000
Venezuela
ChileBrasilPortugal
GreeceSouth Korea
Taiwan
Spain
Singapure
Italy
Germany
UK
Hong KongBrazil2014
Co
5.000 10.000 15.000 20.000 25.000 30.000 35.000 40.000
2.000China
PeruMexico
ArgentinaBrasil2010
GDP per capita (US$)
Brazil 2010 2014 2019 ∆ %
Population (million)2 194.1 200.2 206.6 12.5 6
Electricity consumption (TWh) 415.9 506.8 633.0 217.1 52
1) Source: U.S Energy Information Administration 2) Source: PDE 2019
y p ( )
Consumption per capita (MWh/year) 2.1 2.5 3.0 0.9 46
9
10
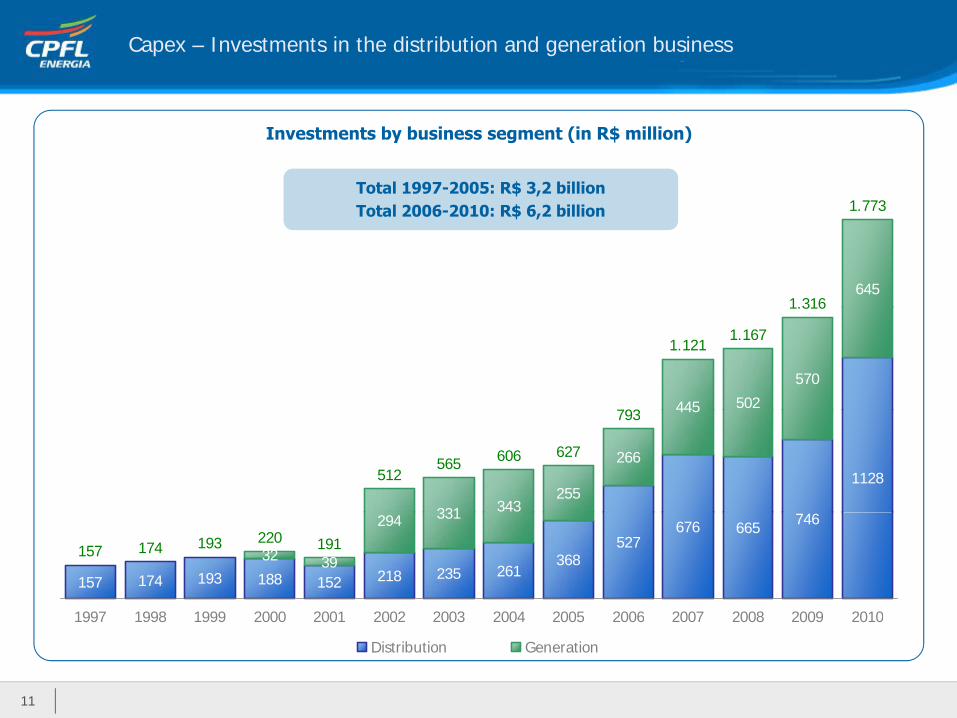
Capex – Investments in the distribution and generation business
1 773
Investments by business segment (in R$ million)
Total 1997-2005: R$ 3,2 billionT l 2006 2010 R$ 6 2 billi
6451.316
1.773Total 2006-2010: R$ 6,2 billion
445 502
570
793
1.1211.167
1.316
1128
331 343255
266
445
512565 606 627
793
157 174 193 188 152 218 235 261368
527676 665 746
32 39
294 331
157 174 193 220 191
1997 1998 1999 2000 2001 2002 2003 2004 2005 2006 2007 2008 2009 20101997 1998 1999 2000 2001 2002 2003 2004 2005 2006 2007 2008 2009 2010
Distribution Generation
11
12 Doesn’t include the figures of Jantus and ERSA’s deals
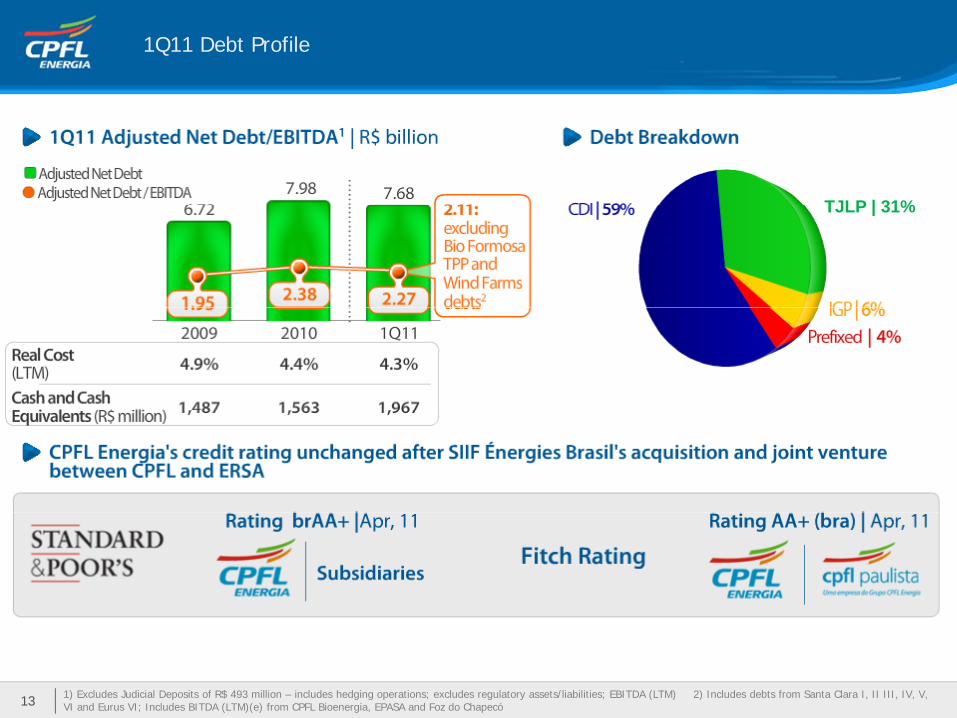
1Q11 Debt Profile
The largest private player
in the Brazilian TJLP | 31%in the Brazilian Electric Sector
TJLP | 31%
13 1) Excludes Judicial Deposits of R$ 493 million – includes hedging operations; excludes regulatory assets/liabilities; EBITDA (LTM) 2) Includes debts from Santa Clara I, II III, IV, V, VI and Eurus VI; Includes BITDA (LTM)(e) from CPFL Bioenergia, EPASA and Foz do Chapecó
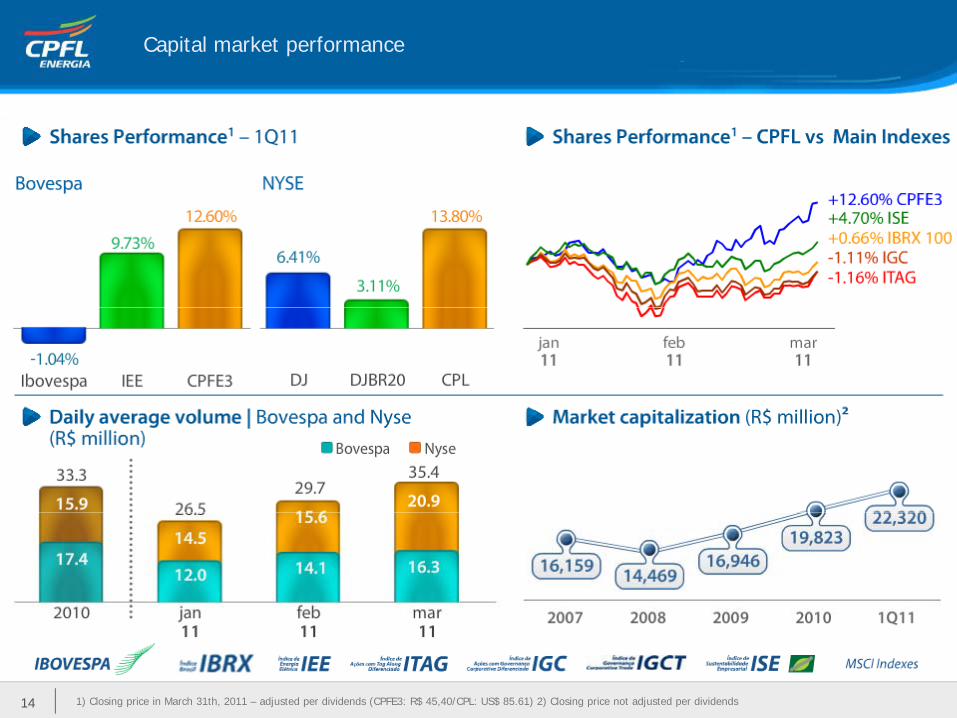
Capital market performance
1) Closing price in March 31th, 2011 – adjusted per dividends (CPFE3: R$ 45,40/CPL: US$ 85.61) 2) Closing price not adjusted per dividends14
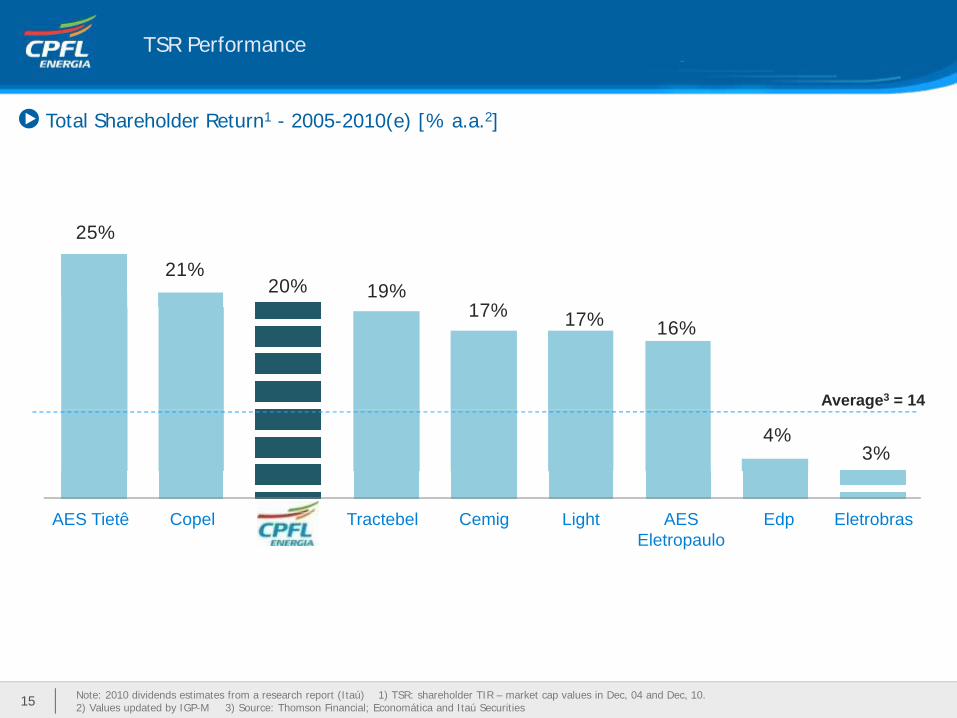
TSR Performance
Total Shareholder Return1 - 2005-2010(e) [% a.a.2]
25%
21%20% 19%
17%17% 17% 16%
Average3 = 14
4%3%
AES Ti ê C l T b l C i Li h AES Ed El bAES Tietê Copel Tractebel Cemig Light AES Eletropaulo
Edp Eletrobras
Note: 2010 dividends estimates from a research report (Itaú) 1) TSR: shareholder TIR – market cap values in Dec, 04 and Dec, 10. 2) Values updated by IGP-M 3) Source: Thomson Financial; Economática and Itaú Securities15
Agenda
Corporate Overview
Operational Efficiency
Growth in the Generation Business
Wide Portfolio of Services
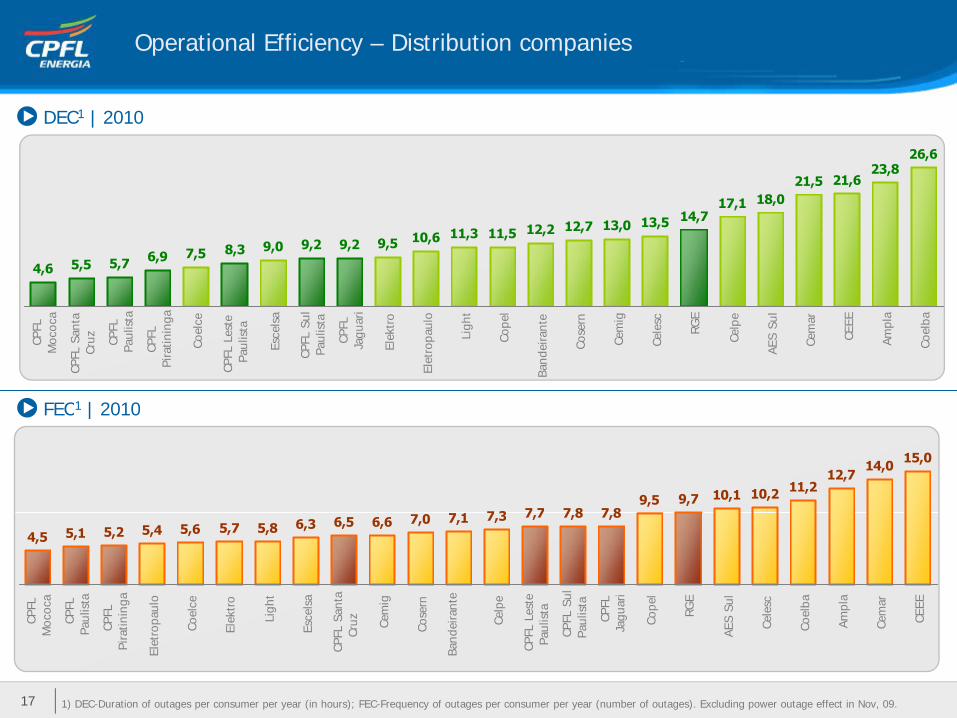
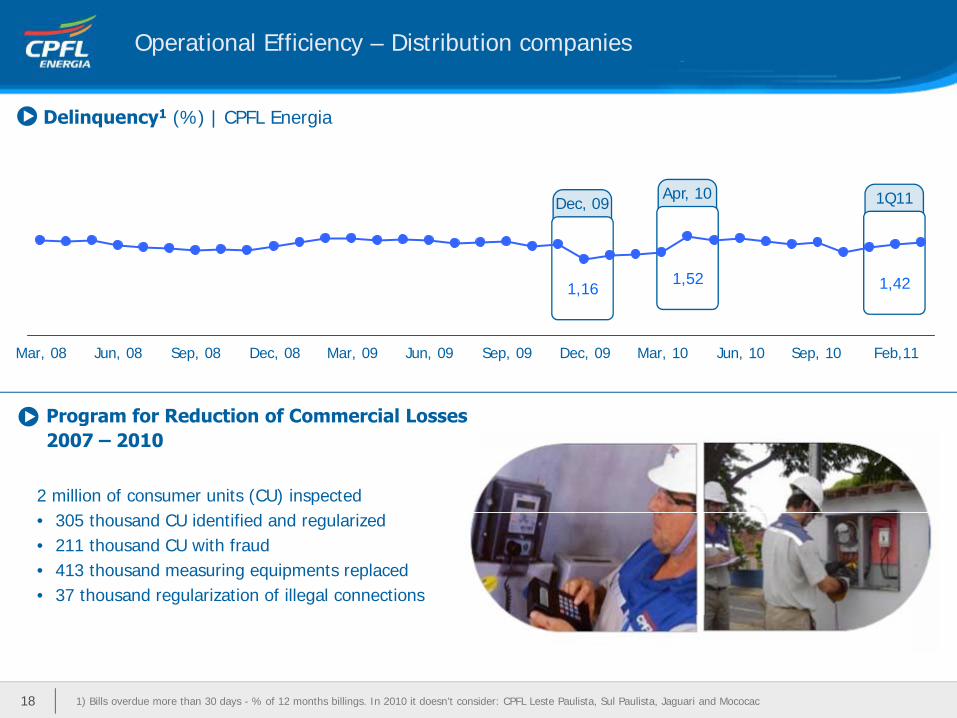
Operational Efficiency – Distribution companies
17 1 18,021,5 21,6
23,826,6
DEC1 | 2010
4,66,9 7,5 8,3 9,0 9,2 9,2 9,5 10,6 11,3 11,5 12,2 12,7 13,0 13,5 14,7
17,1 ,
5,75,5
CPFL
Moc
oca
CPFL
San
taCr
uz CPFL
Paul
ista
CPFL
Pira
tinin
ga
Coel
ce
CPFL
Les
tePa
ulis
ta
Esce
lsa
CPFL
Sul
Paul
ista
CPFL
Jagu
ari
Elek
tro
Elet
ropa
ulo
Ligh
t
Cope
l
Band
eira
nte
Cose
rn
Cem
ig
Cele
sc
RGE
Celp
e
AES
Sul
Cem
ar
CEEE
Ampl
a
Coel
ba
FEC1 | 2010FEC | 2010
7 3 7 7 7 8 7 89,5 9,7 10,1 10,2 11,2
12,714,0 15,0
4,5 5,4 5,6 5,7 5,8 6,3 6,5 6,6 7,0 7,1 7,3 7,7 7,8 7,85,25,1
PFL
coca
PFL
lista
FL inga
aulo
elce
ktro
ight
elsa
anta
z emig
sern
ante
elpe
Lest
est
a L Su
lis
ta
CPFL uari
opel
RGE
Sul
lesc
elba
mpl
a
mar
EEE
1) DEC-Duration of outages per consumer per year (in hours); FEC-Frequency of outages per consumer per year (number of outages). Excluding power outage effect in Nov, 09.17
CP
Moc C
PPa
u
CP F
Pira
tini
Ele
trop
a
Coe
Ele
k
Li
Esc
CPF
L S
Cruz Ce
Cos
Ban
deira Ce
CPF
L L
Paul
is
CPF
LPa
ul C Jag
Co R
AES
Ce l
Coe
Am
Cem CE
Operational Efficiency – Distribution companies
Dec 09 1Q11
Delinquency1 (%) | CPFL Energia
Apr, 10Dec, 09
1,16
Q
1,421,52
P f R d ti f C i l L
Mar, 08 Jun, 08 Sep, 08 Dec, 08 Mar, 09 Jun, 09 Sep, 09 Dec, 09 Mar, 10 Jun, 10 Sep, 10 Feb,11
Program for Reduction of Commercial Losses2007 – 2010
2 million of consumer units (CU) inspected• 305 thousand CU identified and regularized• 211 thousand CU with fraud• 413 thousand measuring equipments replaced• 37 thousand regularization of illegal connections
18 1) Bills overdue more than 30 days - % of 12 months billings. In 2010 it doesn’t consider: CPFL Leste Paulista, Sul Paulista, Jaguari and Mococac

CPFL Energia Group’s Awards
Abradee
Best Electric Energy Distribution Company in Brazil: CPFL Paulista 2000|2003|2006|2008|2009
Economic-Financial Management: CPFL Paulista – 1999|2000|2008CPFL Piratininga 2004|2007CPFL Paulista–2000|2003|2006|2008|2009
RGE – 2010
Best Electric Energy Distribution Company in the South RegionRGE – 2003|2009|2010
CPFL Piratininga – 2004|2007
Management Quality: CPFL Paulista – 2005|2006|2008|2009CPFL Piratininga – 2010
RGE 2003|2009|2010
Operational Management: CPFL Paulista – 2001|2003|2005|2007|2008RGE – 2010
Best Social Responsibility:CPFL Paulista – 2002|2003|2004|2005|2008RGE – 2009|2010
PNQ® – National Quality Award
19
Awarded Awarded Finalist
Agenda
Corporate Overview
Operational Efficiency
Growth in the Generation Business
Wide Portfolio of Services

Incorporation of CPFL Renováveis | Corporate structure
Source: ERSA (IR)21
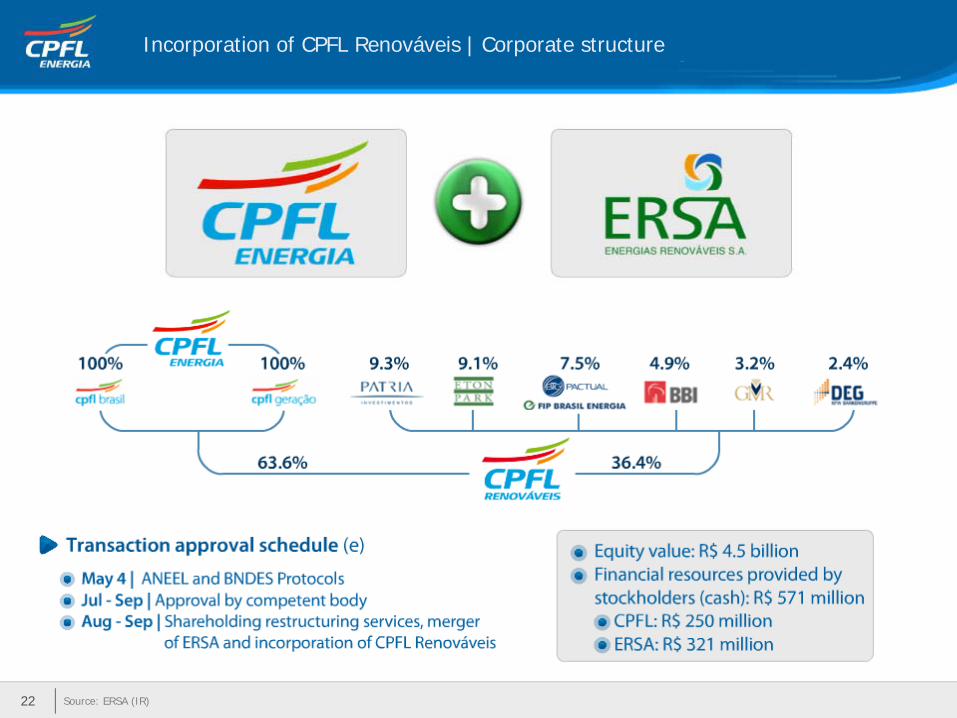
Incorporation of CPFL Renováveis | Corporate structure
Source: ERSA (IR)22
á
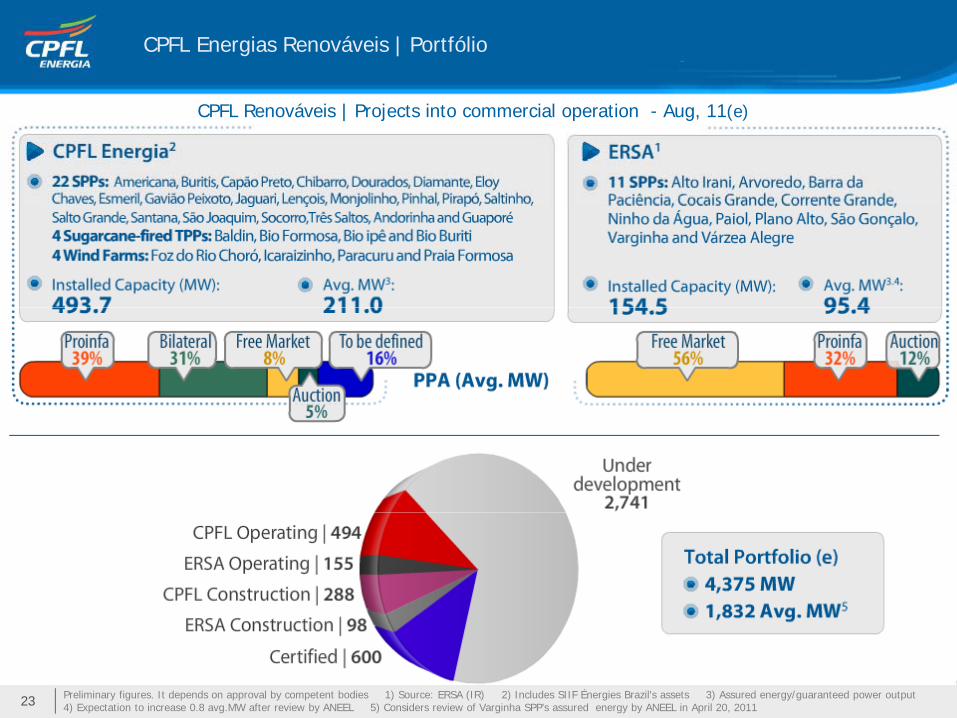
CPFL Energias Renováveis | Portfólio
CPFL Renováveis | Projects into commercial operation - Aug, 11(e)
Preliminary figures. It depends on approval by competent bodies 1) Source: ERSA (IR) 2) Includes SIIF Énergies Brazil's assets 3) Assured energy/guaranteed power output 4) Expectation to increase 0.8 avg.MW after review by ANEEL 5) Considers review of Varginha SPP’s assured energy by ANEEL in April 20, 201123

CPFL Energias Renováveis | Portfolio
SPP
Installed capacity(Total: 4,375 MW)3,341 4,375
Installed capacity (MW)Assured energy (AvgMW)
Bio36%
18%
Wind648
386
1,359 1,832
45%648
Operating (Aug, 11) Under construction
TotalUnder development
306 167
Estimated EvolutionInstalled capacity (MW)Assured energy (AvgMW)
Assured Energy(Total 1,832 AvgMW)
SPP25%2 092
4,375
Bio31%
25%
Wind44%
648306
907410
1,174538
1,692
742
2,092
920
1,832
2011 2012 2013 2014 2015 Total
24
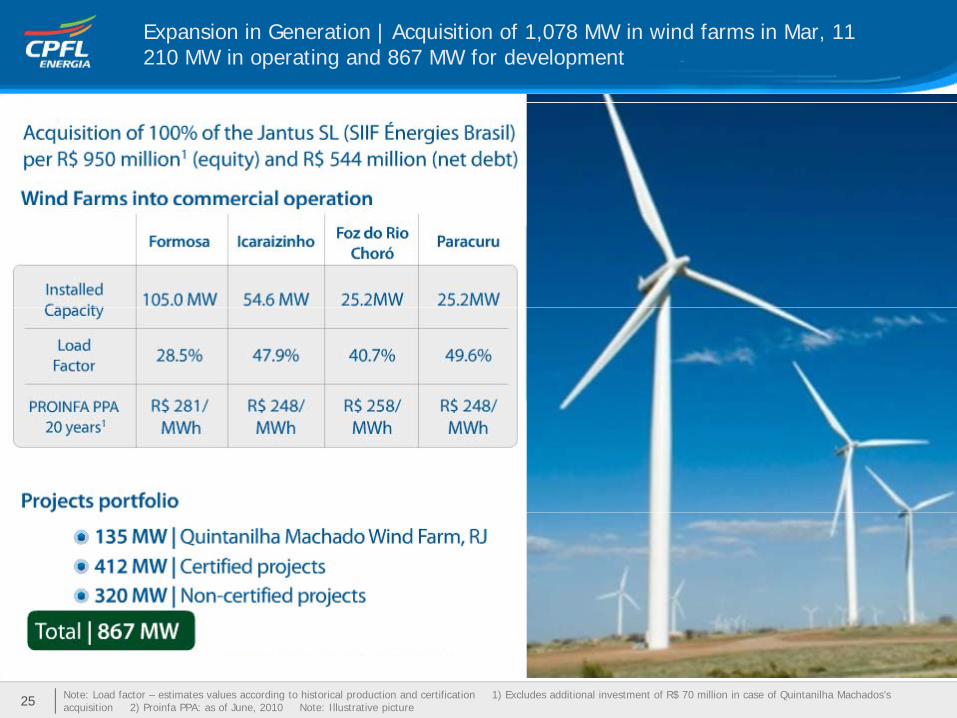
Expansion in Generation | Acquisition of 1,078 MW in wind farms in Mar, 11210 MW in operating and 867 MW for development
Note: Load factor – estimates values according to historical production and certification 1) Excludes additional investment of R$ 70 million in case of Quintanilha Machados’s acquisition 2) Proinfa PPA: as of June, 2010 Note: Illustrative picture25

26
27
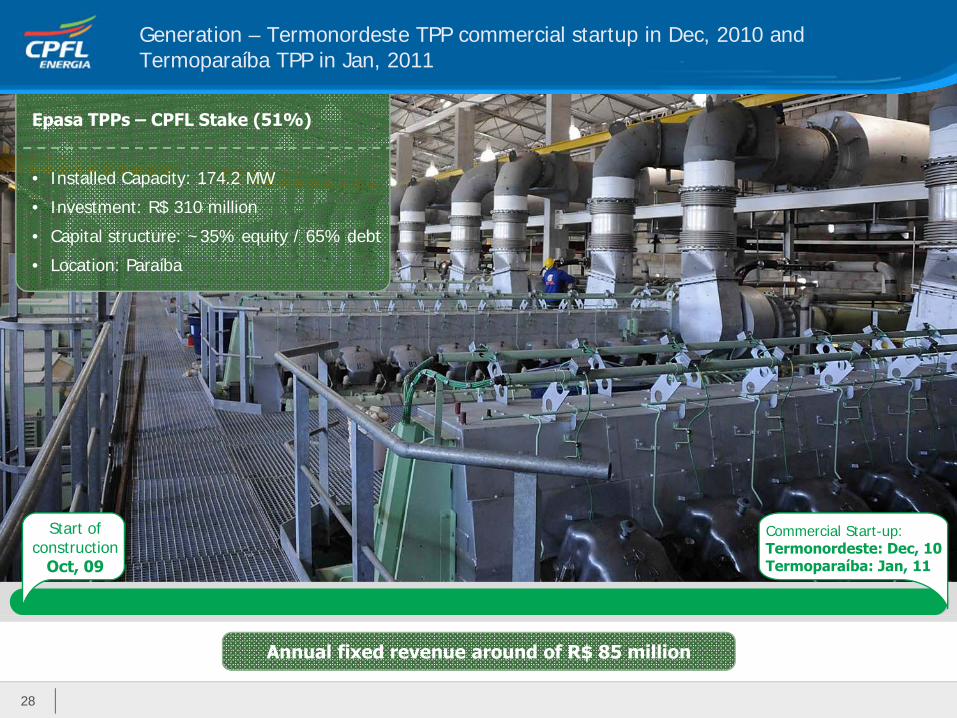
Generation – Termonordeste TPP commercial startup in Dec, 2010 and Termoparaíba TPP in Jan, 2011
Epasa TPPs – CPFL Stake (51%)
• Installed Capacity: 174.2 MW
• Investment: R$ 310 million• Investment: R$ 310 million
• Capital structure: ~35% equity / 65% debt
• Location: Paraíba
Start of construction
Oct, 09
Commercial Start-up:Termonordeste: Dec, 10Termoparaíba: Jan, 11
28
Annual fixed revenue around of R$ 85 million
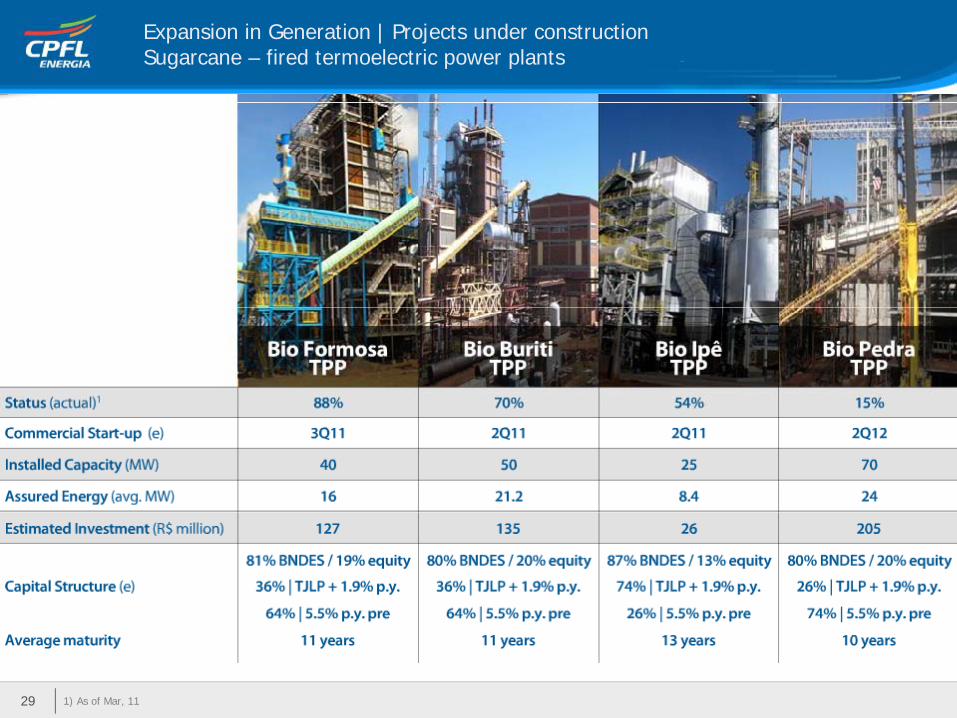
Expansion in Generation | Projects under construction Sugarcane – fired termoelectric power plants
1) As of Mar, 1129
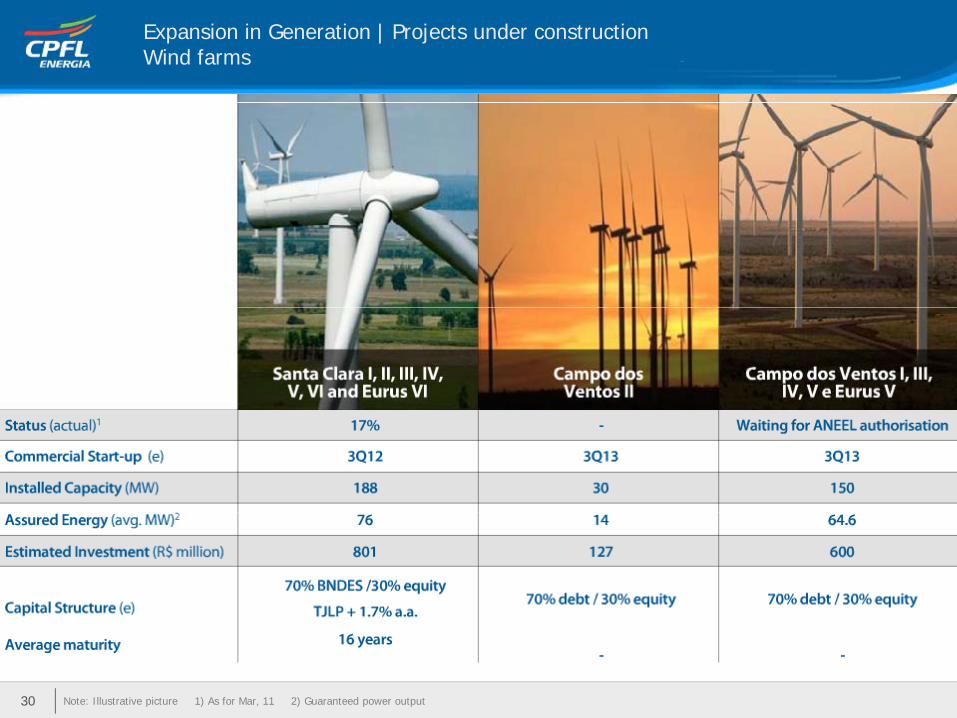
Expansion in Generation | Projects under construction Wind farms
Note: Illustrative picture 1) As for Mar, 11 2) Guaranteed power output30
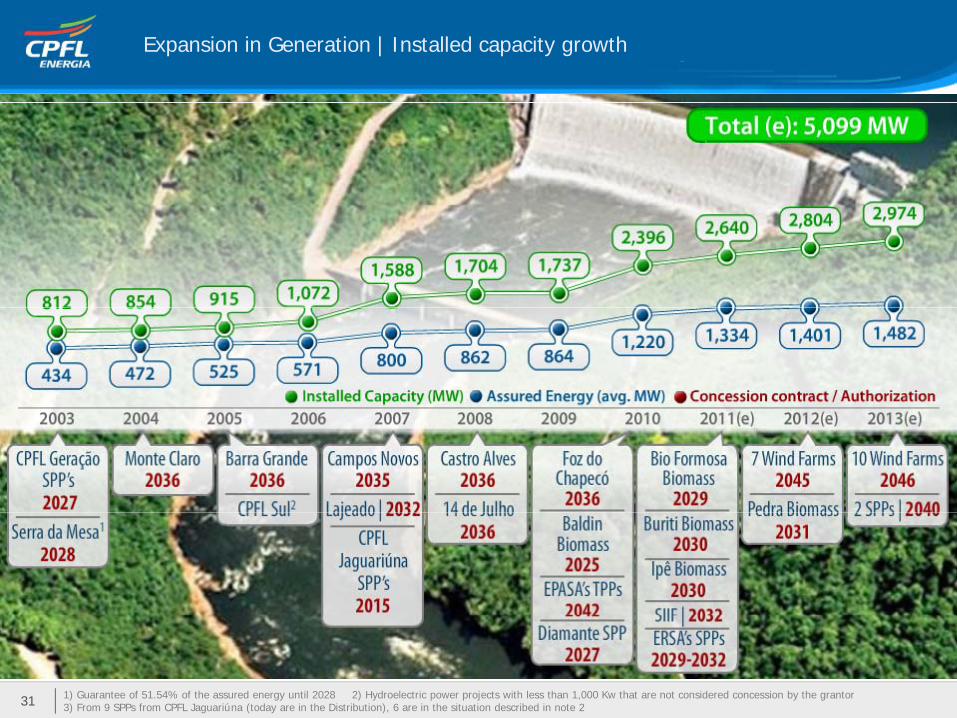
Expansion in Generation | Installed capacity growth
1) Guarantee of 51.54% of the assured energy until 2028 2) Hydroelectric power projects with less than 1,000 Kw that are not considered concession by the grantor3) From 9 SPPs from CPFL Jaguariúna (today are in the Distribution), 6 are in the situation described in note 231
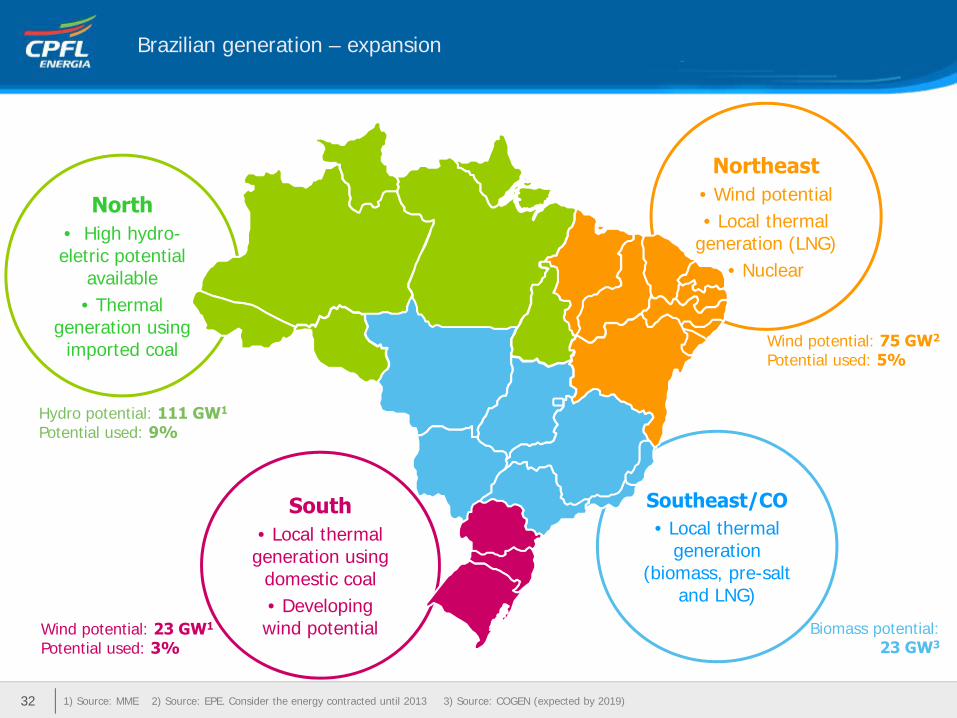
Brazilian generation – expansion
Northeast• Wind potentialNorth• Local thermal
generation (LNG)• Nuclear
North• High hydro-eletric potential
available• Thermal• Thermal
generation using imported coal
Hydro potential: 111 GW1
Wind potential: 75 GW2
Potential used: 5%
Southeast/COSouth
Hydro potential: 111 GW1
Potential used: 9%
• Local thermal generation
(biomass, pre-salt and LNG)
South• Local thermal
generation using domestic coal• Developing p gwind potentialWind potential: 23 GW1
Potential used: 3%Biomass potential:
23 GW3
1) Source: MME 2) Source: EPE. Consider the energy contracted until 2013 3) Source: COGEN (expected by 2019)32
Agenda
Corporate Overview
Operational Efficiency
Growth in the Generation Business
Wide Portfolio of Services
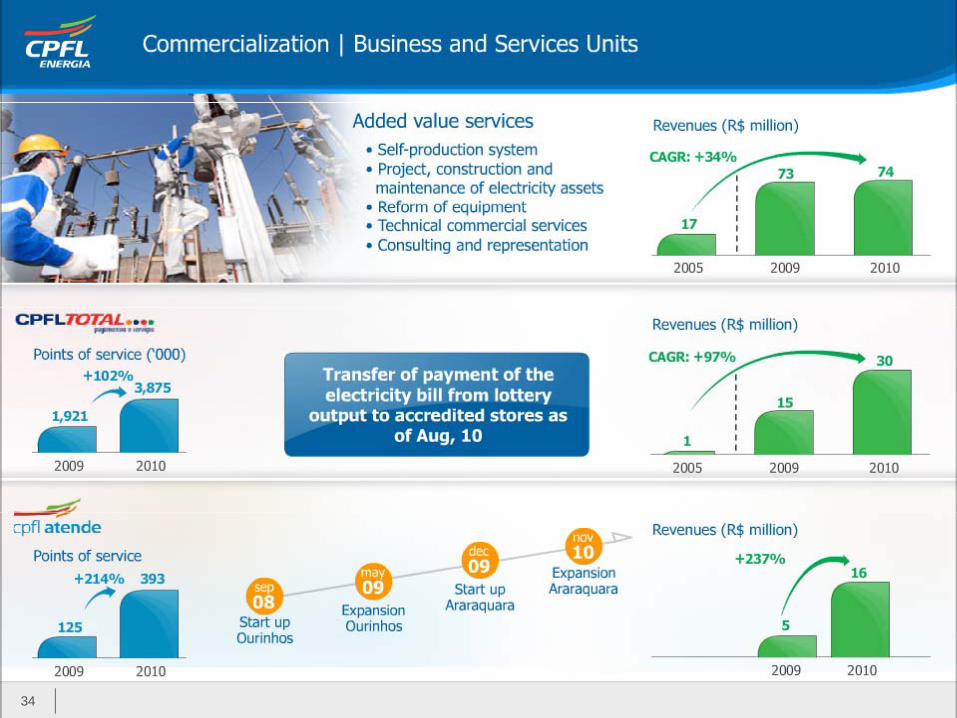
34
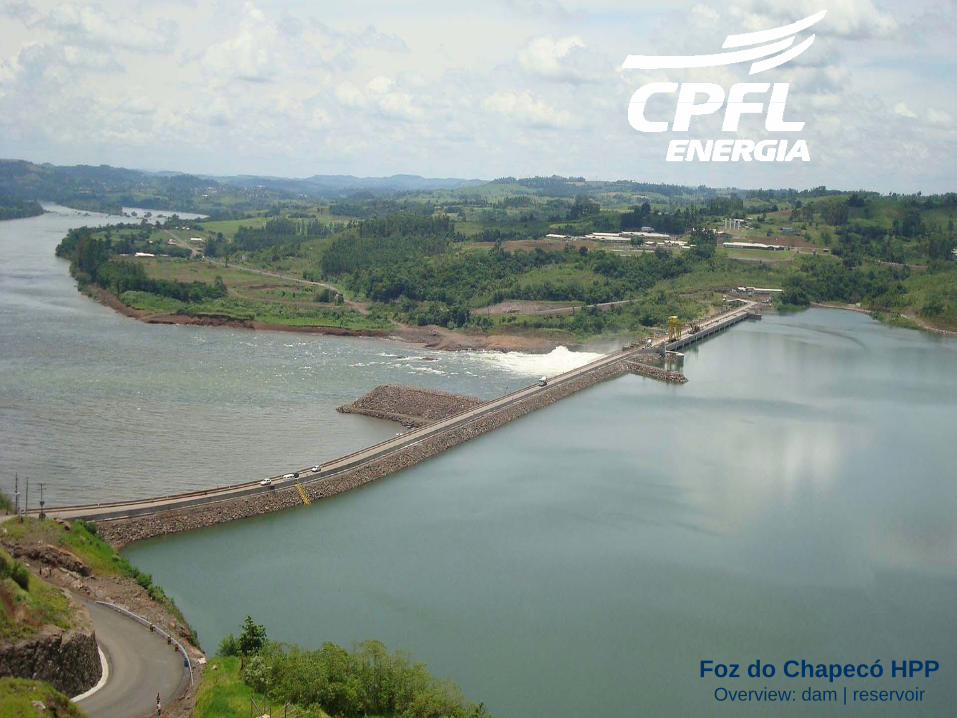
Foz do Chapecó HPPOverview: dam | reservoir