cpfl energia presentation morgan stanley final
TRANSCRIPT
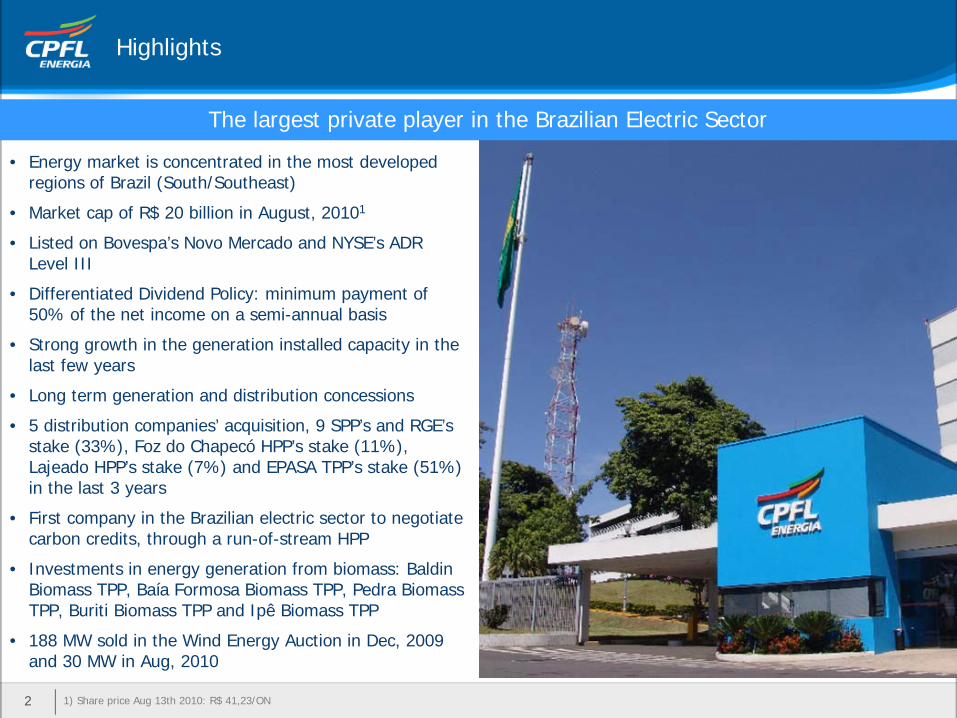
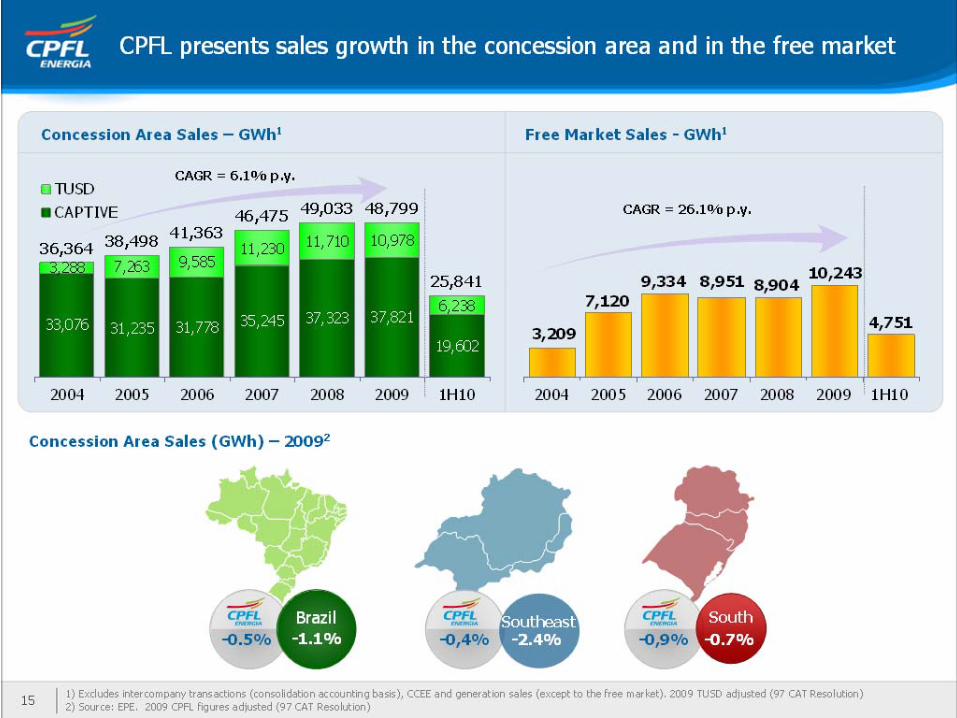
• Energy market is concentrated in the most developed regions of Brazil (South/Southeast)
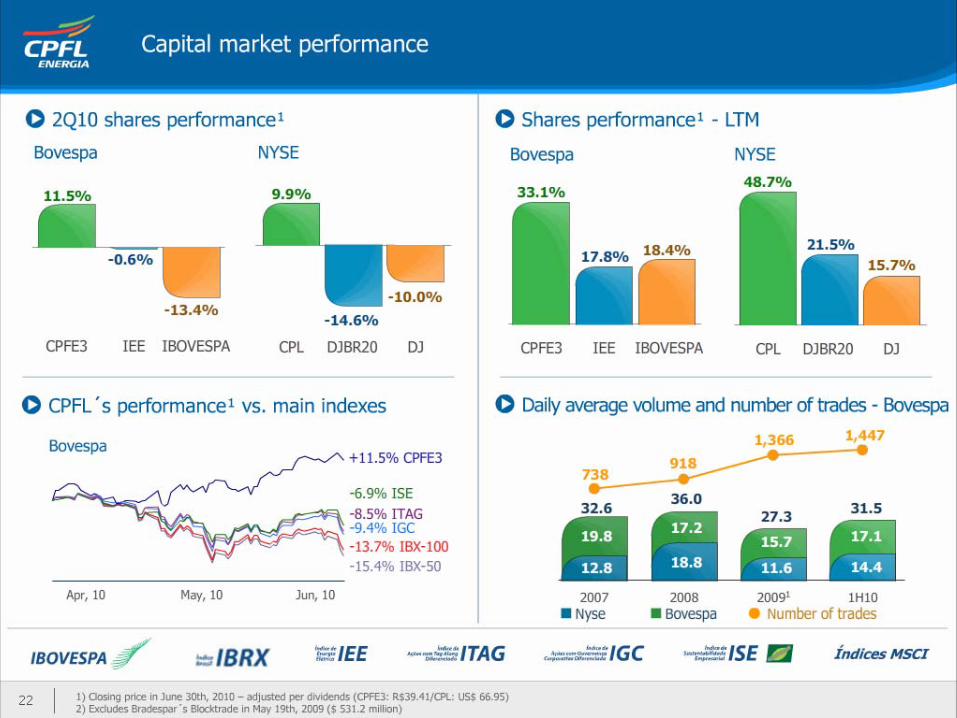
• Market cap of R$ 20 billion in August, 20101
• Listed on Bovespa’s Novo Mercado and NYSE’s ADR Level III
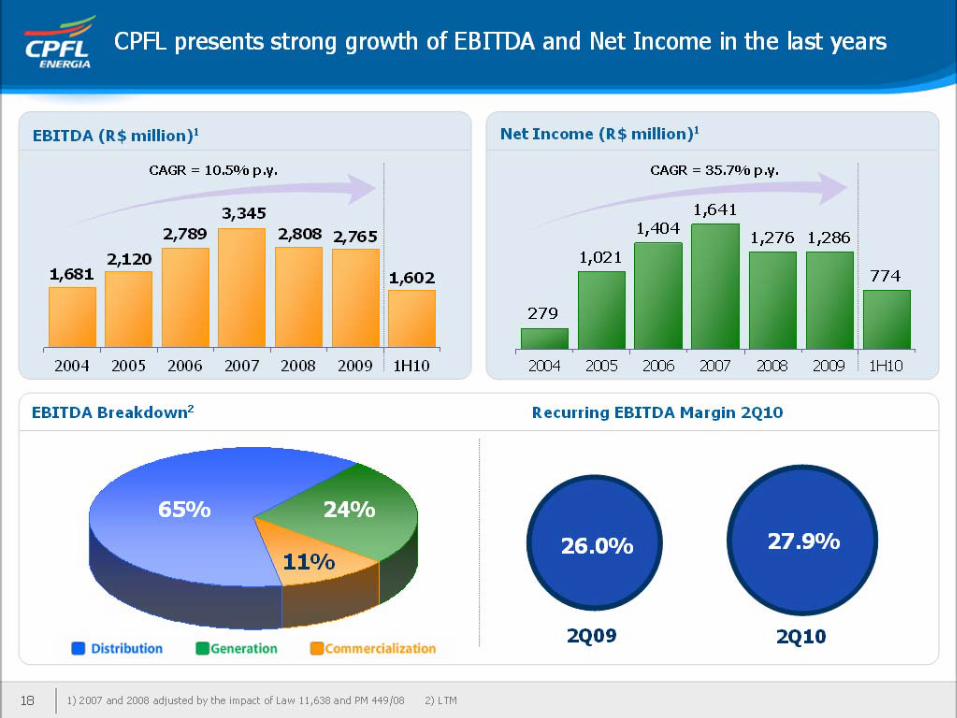
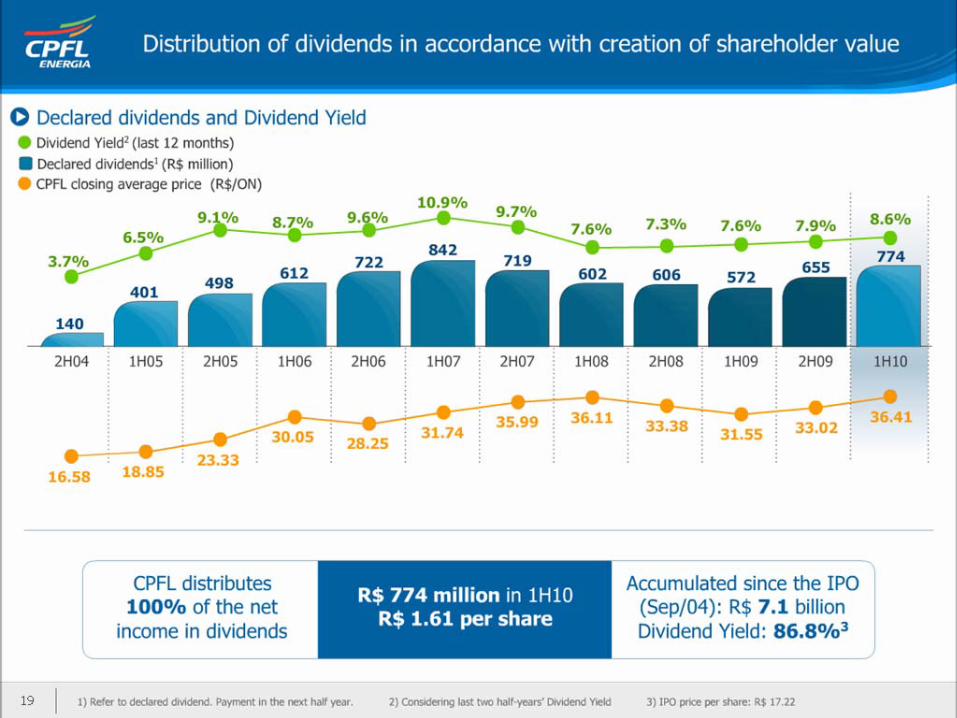
• Differentiated Dividend Policy: minimum payment of 50% of the net income on a semi-annual basis
• Strong growth in the generation installed capacity in the last few years
• Long term generation and distribution concessions
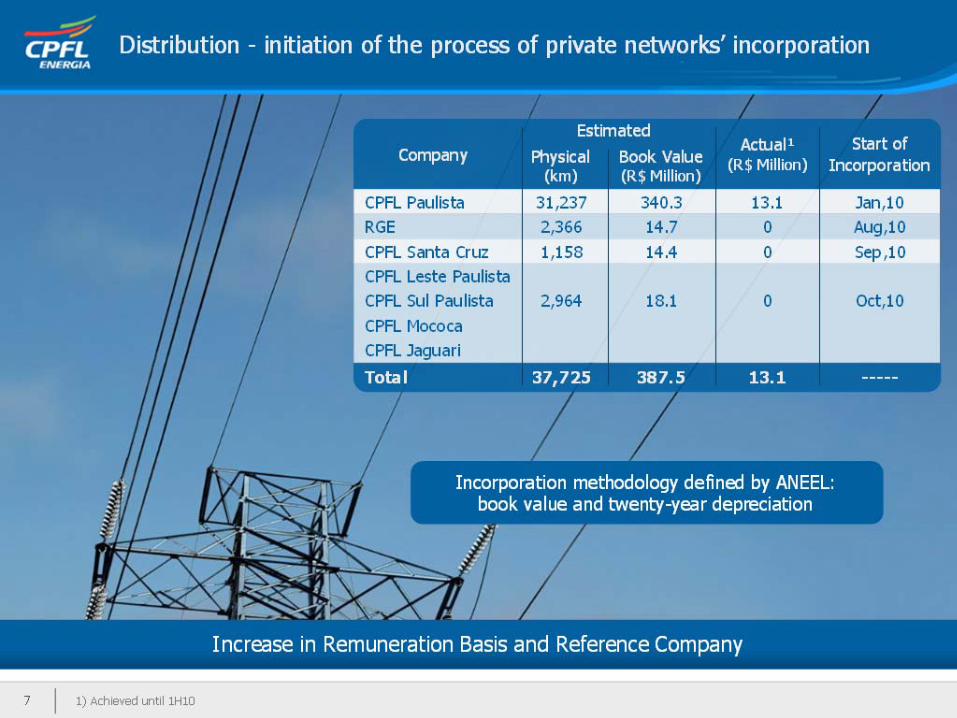
• 5 distribution companies’ acquisition, 9 SPP’s and RGE’s stake (33%), Foz do Chapecó HPP’s stake (11%), Lajeado HPP’s stake (7%) and EPASA TPP’s stake (51%) in the last 3 years
• First company in the Brazilian electric sector to negotiate carbon credits, through a run-of-stream HPP
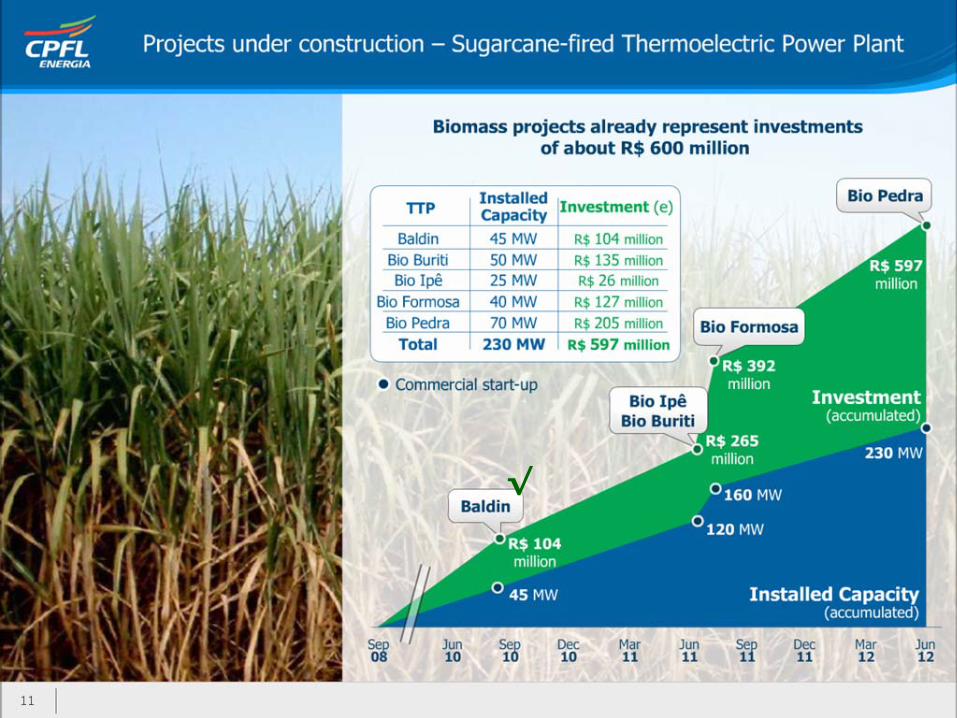
• Investments in energy generation from biomass: Baldin Biomass TPP, Baía Formosa Biomass TPP, Pedra Biomass TPP, Buriti Biomass TPP and Ipê Biomass TPP
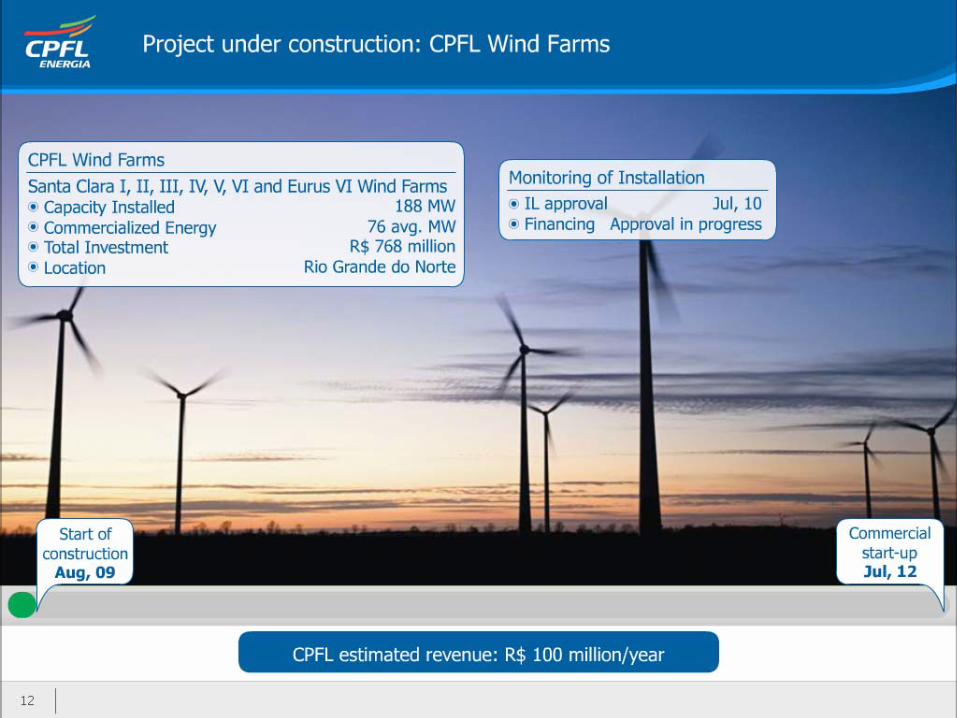
• 188 MW sold in the Wind Energy Auction in Dec, 2009 and 30 MW in Aug, 2010
Highlights
The largest private player in the Brazilian Electric Sector
1) Share price Aug 13th 2010: R$ 41,23/ON2
100%
100%
100%
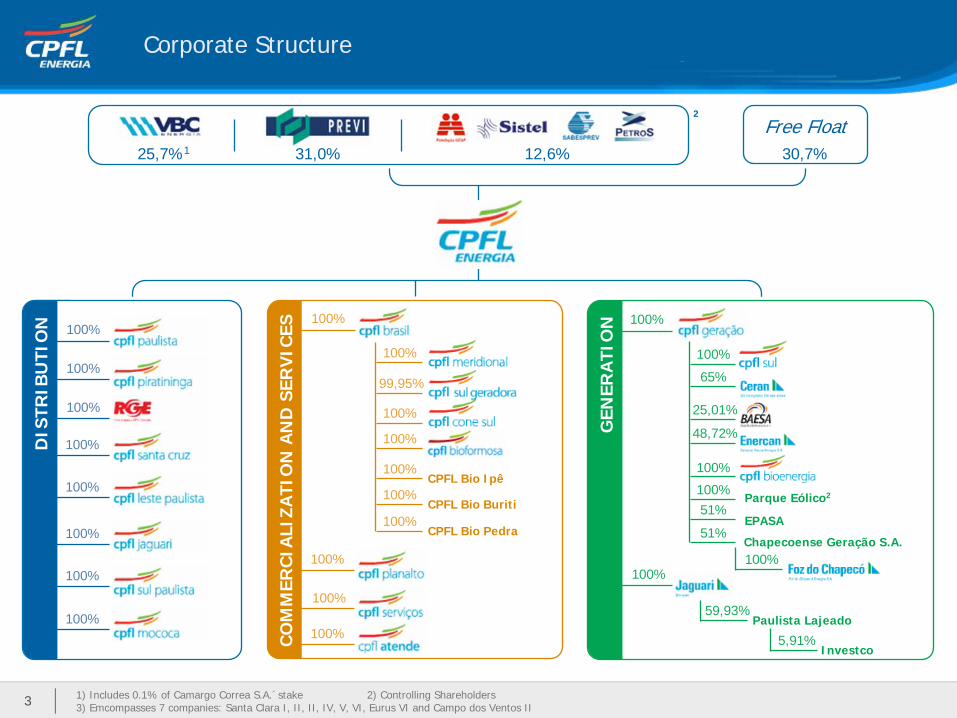
Corporate Structure
31,0% 12,6%25,7%1
DIS
TRIB
UTI
ON 100%
100%
100%
100%
100%
100%
100%
100%G
ENER
ATI
ON 100%
100%
100%
65%
25,01%
48,72%
100%
51%
59,93%
5,91%
100%
51%
100%
Paulista Lajeado
Investco
Parque Eólico2
EPASA
Chapecoense Geração S.A.
CO
MM
ERC
IALI
ZATI
ON
AN
D S
ERV
ICES
100%
100%
100%
100%
100%
100%
100%
CPFL Bio Ipê
CPFL Bio Buriti
CPFL Bio Pedra
30,7%
Free Float2
99,95%
1) Includes 0.1% of Camargo Correa S.A.´stake 2) Controlling Shareholders3) Emcompasses 7 companies: Santa Clara I, II, II, IV, V, VI, Eurus VI and Campo dos Ventos II3
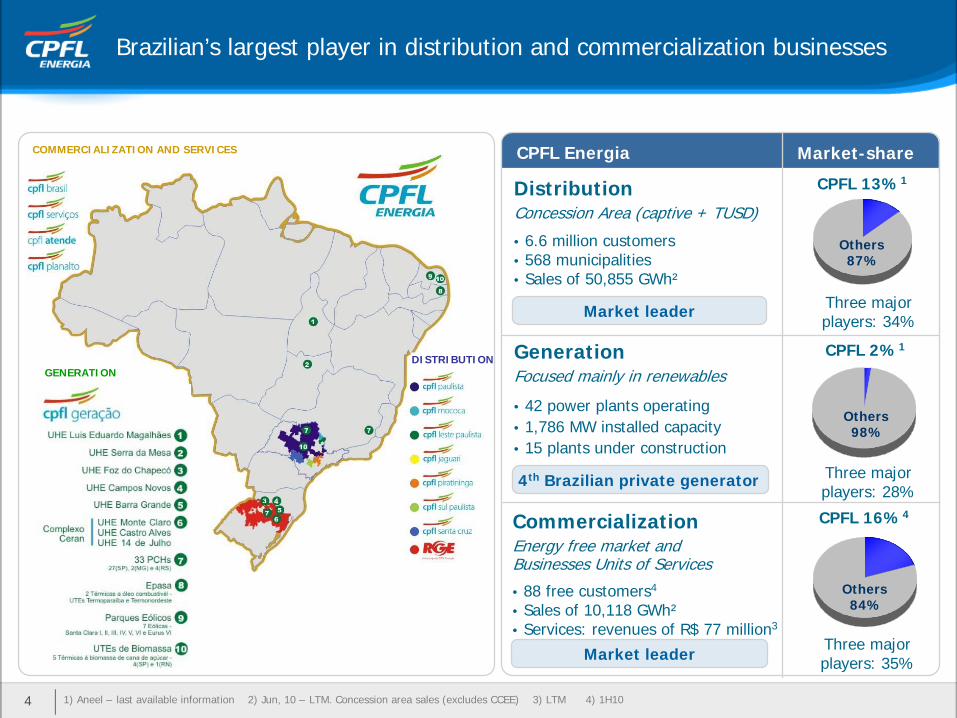
Brazilian’s largest player in distribution and commercialization businesses
CPFL 2%1
CPFL Energia
CPFL 16%4
CPFL 13%1
Market-share
DistributionConcession Area (captive + TUSD)
• 6.6 million customers• 568 municipalities• Sales of 50,855 GWh²
GenerationFocused mainly in renewables
• 42 power plants operating• 1,786 MW installed capacity• 15 plants under construction
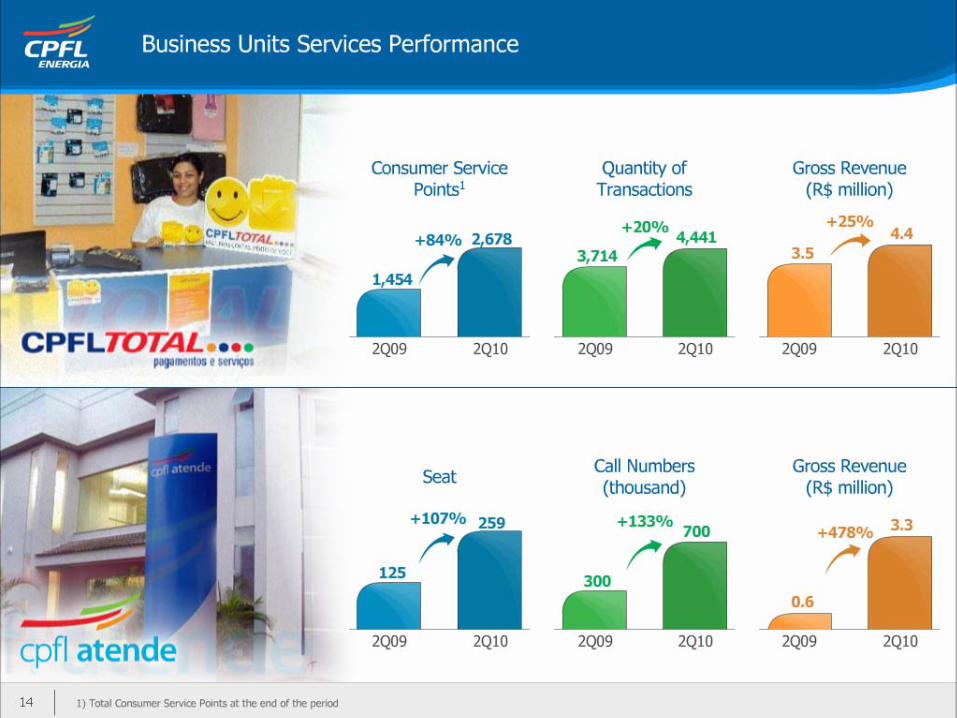
CommercializationEnergy free market and Businesses Units of Services
• 88 free customers4
• Sales of 10,118 GWh²• Services: revenues of R$ 77 million3
Market leader
4th Brazilian private generator
Market leader
GENERATION
COMMERCIALIZATION AND SERVICESCOMMERCIALIZATION AND SERVICES
DISTRIBUTION
1) Aneel – last available information 2) Jun, 10 – LTM. Concession area sales (excludes CCEE) 3) LTM 4) 1H104
Three majorplayers: 34%
Others 87%
Others 98%
Others 84%
Three majorplayers: 28%
Three majorplayers: 35%
1,3161,851
1,645
1,051 957 912746
570794
1,057961
684
761
290
936
22
893
192009 actual
2010(e) 2011(e) 2012(e) 2013(e) 2014(e)
746
1,057961
761893
516936
370
376 470
586 512
448
445
316420
497
396
2009 Actual
2010(e) 2011(e) 2012(e) 2013(e) 2014(e)
570
794684
290
19222009 actual
2010(e) 2011(e) 2012(e) 2013(e) 2014(e)
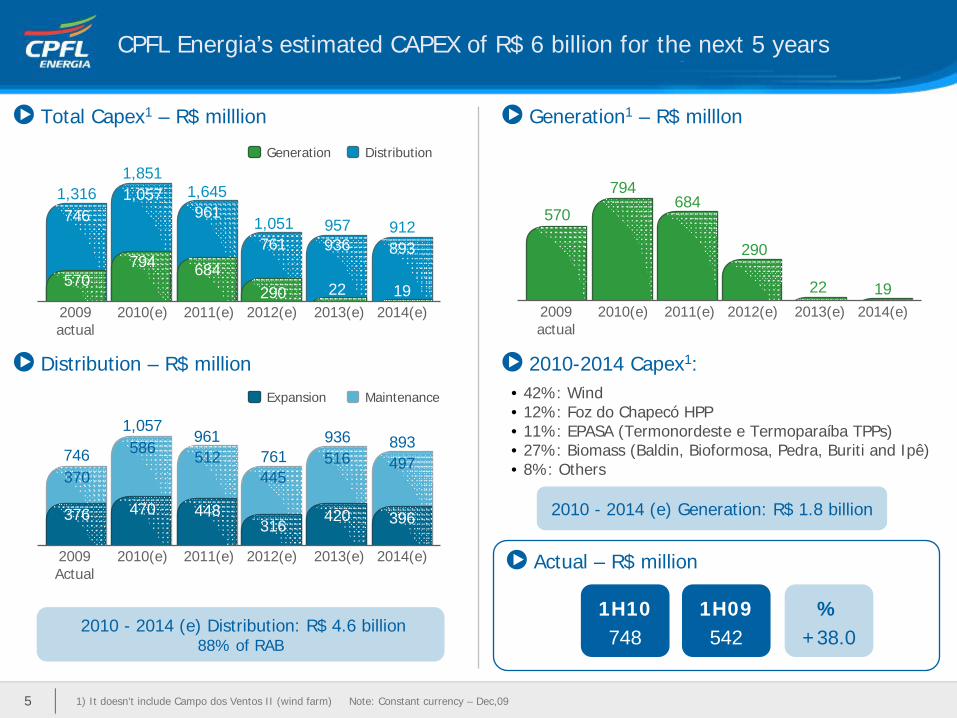
Total Capex1 – R$ milllion
Distribution – R$ million
Generation1 – R$ milllon
2010-2014 Capex1:
Actual – R$ million
2010 - 2014 (e) Distribution: R$ 4.6 billion88% of RAB
2010 - 2014 (e) Generation: R$ 1.8 billion
• 42%: Wind• 12%: Foz do Chapecó HPP• 11%: EPASA (Termonordeste e Termoparaíba TPPs)• 27%: Biomass (Baldin, Bioformosa, Pedra, Buriti and Ipê)• 8%: Others
Generation Distribution
Expansion Maintenance
1) It doesn’t include Campo dos Ventos II (wind farm) Note: Constant currency – Dec,09
1H10748
%+38.0
1H09542
CPFL Energia’s estimated CAPEX of R$ 6 billion for the next 5 years
5
2.511
1.252812 854 915 1.072
1.588 1.704 1.7372.396
8641.220
Serra da Mesa1
CPFL GeraçãoSPP´s
Monte Claro Barra Grande
14 de Julho
Castro Alves Foz do ChapecóCampos Novos
CPFL Sul2 Lajeado
CPFL Jaguariúna SPP´s³
20272036 2036 2036 20362035
2028
20362032
2015
Baldin Biomass
EPASA´s TPPs
BioformosaBiomass
BuritiBiomass
IpêBiomass
7.3%38%
41%
Installed Capacity (MW)Assured Energy (AverageMW)Concession Contracts
2.769
1.362
434 472 525 571 800 862
2011(e)2003 2004 2005 2006 20073 2008 2009 2010(e)
Wind Farms
PedraBiomass
2012(e)
Diamante SPP
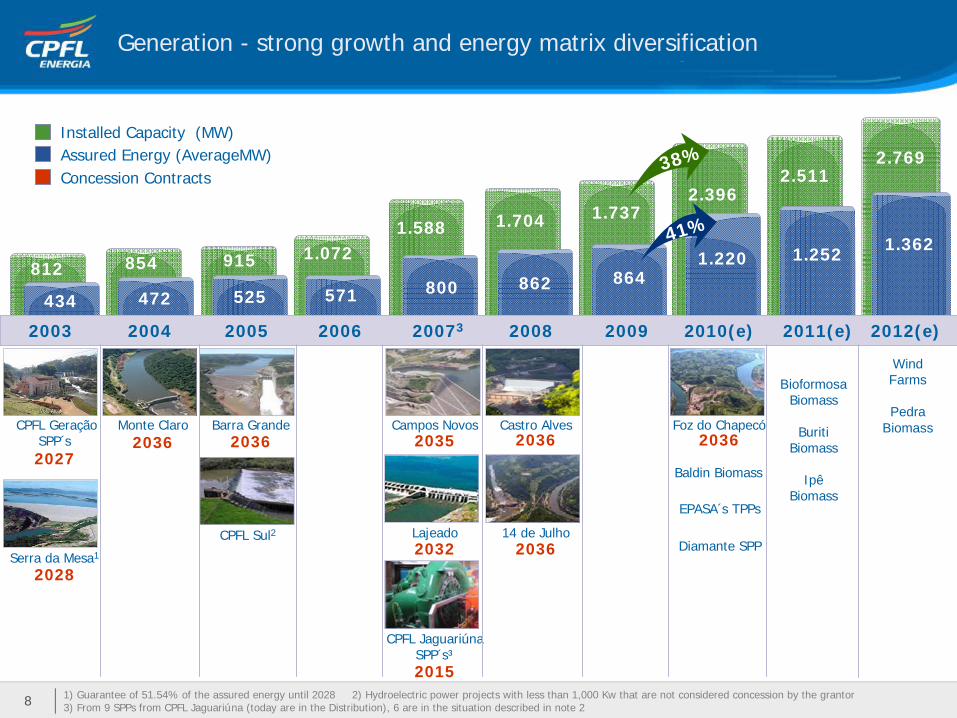
Generation - strong growth and energy matrix diversification
1) Guarantee of 51.54% of the assured energy until 2028 2) Hydroelectric power projects with less than 1,000 Kw that are not considered concession by the grantor3) From 9 SPPs from CPFL Jaguariúna (today are in the Distribution), 6 are in the situation described in note 28
√√
√
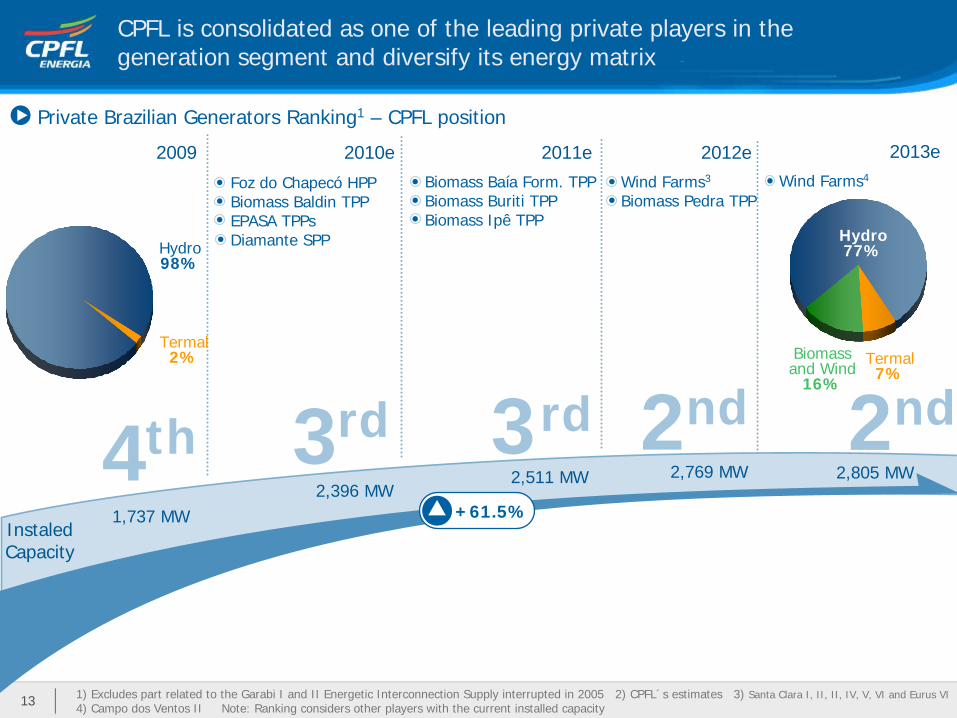
4th 3rd 3 2nd
InstaledCapacity
1,737 MW2,396 MW
2,511 MW 2,769 MW
+61.5%
Private Brazilian Generators Ranking1 – CPFL position
2009 2010e 2011e 2012e
Foz do Chapecó HPPBiomass Baldin TPPEPASA TPPsDiamante SPP
Biomass Baía Form. TPP Biomass Buriti TPPBiomass Ipê TPP
Wind Farms3
Biomass Pedra TPP
1) Excludes part related to the Garabi I and II Energetic Interconnection Supply interrupted in 2005 2) CPFL´s estimates 3) Santa Clara I, II, II, IV, V, VI and Eurus VI4) Campo dos Ventos II Note: Ranking considers other players with the current installed capacity
Termal2%
Hydro98%
Termal7%
Hydro77%
Biomass and Wind
16%
CPFL is consolidated as one of the leading private players in the generation segment and diversify its energy matrix
rd
13
2013eWind Farms4
2nd2,805 MW