cpm dgg gold outlook 2018 2018-01-16 · gold price expectations in 2018 and beyond. from fear to...
TRANSCRIPT

Gold
Denver Gold GroupDenver
16 January 2018

Today’s ThemesGold price expectations in 2018 and beyond.
From Fear to Greed: The changing character of gold investment demand.
The Enormous Asymmetry Of Gold Information: A Few Of The Things We All Know About Gold That Simply Are Not True In Fact:Gold mining is profitableGold reserves are at record levelsCrypto-currencies are not the big distraction for investors from goldRising interest rates are not a major headwind for gold prices
The State of Gold Supply and Demand in 2018
Gold’s relationship with interest rates and the dollar

Gold Price ExpectationsGold prices averaged $1,259.47 in 2017, up 0.7% from 2016’s average price. The price rose 14% from the end of 2016 to the end of 2017, however. (nearby active Comex)
Near-term outlook
CPM projects gold prices will rise about 2.3% to $1,288 on average in 2018, rising modestly during the year.
Further modest gains are expected in 2019 with price gains accelerating.
Long-term outlook
Longer term, CPM expects gold prices to rise sharply, probably to record annual average prices, in the period 2021 – 2024.
Prices might reach $2,185 on a nominal average annual basis, $1,850 in 2016 dollar terms.

Why Gold Prices Are Likely To Rise Longer TermGold prices are projected to rise in the coming 5 – 10 years because of a combination of:
1. Economic, financial, and political factors stimulating increased investment demand.
2. Continued strong investment demand trends.
3. Continued central bank buying.
4. Declining mine production after 2019.

Shifting Investment Trends
5

Net Investment Demand Drives Gold Prices
-20
-10
0
10
20
30
40
50
60
-40
-20
0
20
40
60
80
100
120
66 69 72 75 78 81 84 87 90 93 96 99 02 05 08 11 14
Net Investment Demand
Gold Investment DemandAnnual, Investment Demand Projected Through 2017, Prices Through 2016
Percent Change Million Ounces
Source: CPM Gold Yearbook, March 2017, updated

From Fear To Greed (with some fear still present)There are Major Shifts Underway In Gold Investment Demand
Those investors who bought and held gold out of fear of economic chaos have been pulling back from gold while investors more interested in capital appreciation have been buying.
Coin purchases are offSecondary re-flow of coins sold by older investorsShift away from the fear trade that drives some gold coin buyers
But ETFs, Futures, and Options volumes are up
China up from 2016, as expectations of higher prices spur the ‘greed trade.’
In India the long term, secular decline in investment demand continues. The economy and financial markets are doing better than they were for several years.
(Note that this preceded government restrictions and taxes.)

Dealer Demand For U.S. Mint Gold Coins
8

9
-
10
20
30
40
50
60
70
80
90
-
10
20
30
40
50
60
70
80
90
2003 2004 2005 2006 2007 2008 2009 2010 2011 2012 2013 2014 2015 2016 2017
Million OuncesMillion Ounces
Exchange Traded Products' Physical Gold HoldingsThrough Sept 2017
-40
-30
-20
-10
0
10
20
30
03 04 05 06 07 08 09 10 11 12 13 14 15 16 17
Million Ounces
Annual Net Changes to Gold ETP HoldingsThrough Sep. 2017
ETFs Recovered Around 60% Of Total Net Reduction Between 2013-2015

Chinese Gold Investment Demand Down From 2013 Levels, But Rising
10
0
2
4
6
8
10
12
14
16
18
0
2
4
6
8
10
12
14
16
18
01 02 03 04 05 06 07 08 09 10 11 12 13 14 15 16 17
Million Ounces Million Ounces
Total Chinese Investment Demand

Indian Gold Investment Demand In Long-Term Decline
11
0
2
4
6
8
10
12
14
16
18
20
0
2
4
6
8
10
12
14
16
18
20
01 02 03 04 05 06 07 08 09 10 11 12 13 14 15 16 17
Million Ounces Million Ounces
Total Indian Investment Demand

“Greedy” Investors Seek Profits
12

Shorter Term Investing Can Be Highly Profitable
13
Per OunceInitial Trade Closed Out Position7 October 2016 9 November 2016Dec16 options - Expiry 22 November
Actual Pricing Actual Pricing$1,256.00 $1,303.00 8:40 AM
Priced at Strike Premium Premium Change from Initial Trade
Buy Call $1,300 -$9.20 Sell Call $17.50 $8.30Sell Call $1,350 $2.80 Buy Call -$4.00 -$1.20Sell Call $1,350 $2.80 Buy Call -$4.00 -$1.20Buy Call $1,400 -$1.10 Sell Call $1.10 $0.00Premium Paid -4.70 Premium Received $10.60
Net Gain/Loss $5.90
Value Per 100 - oz Contract -470.00 $1,060 $590
Gross Profit 125.5%
These are the results of an actual trade CPM structured for clients on 7 October 2016, to take advantage of an expected increase in gold prices leading up to the 8 November election. The trade was intended to be liquidated around the election, on 8 or 9 November, as prices were expected to decline sharply after the election. The trades were liquidated 9 November.

14
Per OunceInitial Trade Closed Out Position11 April 2017 9 May 2017Jun17 options - Expiry 25 May
Actual Pricing Actual Pricing$1,273.00 $1,221 9:26 AM
Priced at Strike Premium Premium Change from Initial Trade
Buy Put $1,250 -$14.72 Sell Put $31.40 $16.68Sell Put $1,220 $6.18 Buy Put -$10.40 -$4.22Sell Put $1,220 $6.18 Buy Put -$10.40 -$4.22Buy Put $1,190 -$2.42 Sell Put $1.90 $0.52Premium Paid -4.78 Premium Received $12.50
Net Gain/Loss $7.72
Value Per 100 - oz Contract -478.00 $1,250 $772
Gross Profit 161.5%
Such trades do not need events to drive them. They can be developed and managed on an on-going basis. These are the results of an actual trade CPM structured for clients on 11 April 2017, to take advantage of an expected decrease in gold prices. The trades were liquidated 9 May.
Such Strategies Work Repeatedly

Equities, not bitcoin, are ‘distracting’ gold investorsEquity markets are distracting investors away from gold.
Cryptocurrencies are a sideshow compared to real financial markets.
Cryptocurrencies Gold Equities
~$720 billion value $3.3 trillion physical holdings $68 trillion
~$6 trillion derivatives $ quadrillions derivatives
< 1 million invstors Billions of investors Billions of investors
cryptocurrencies
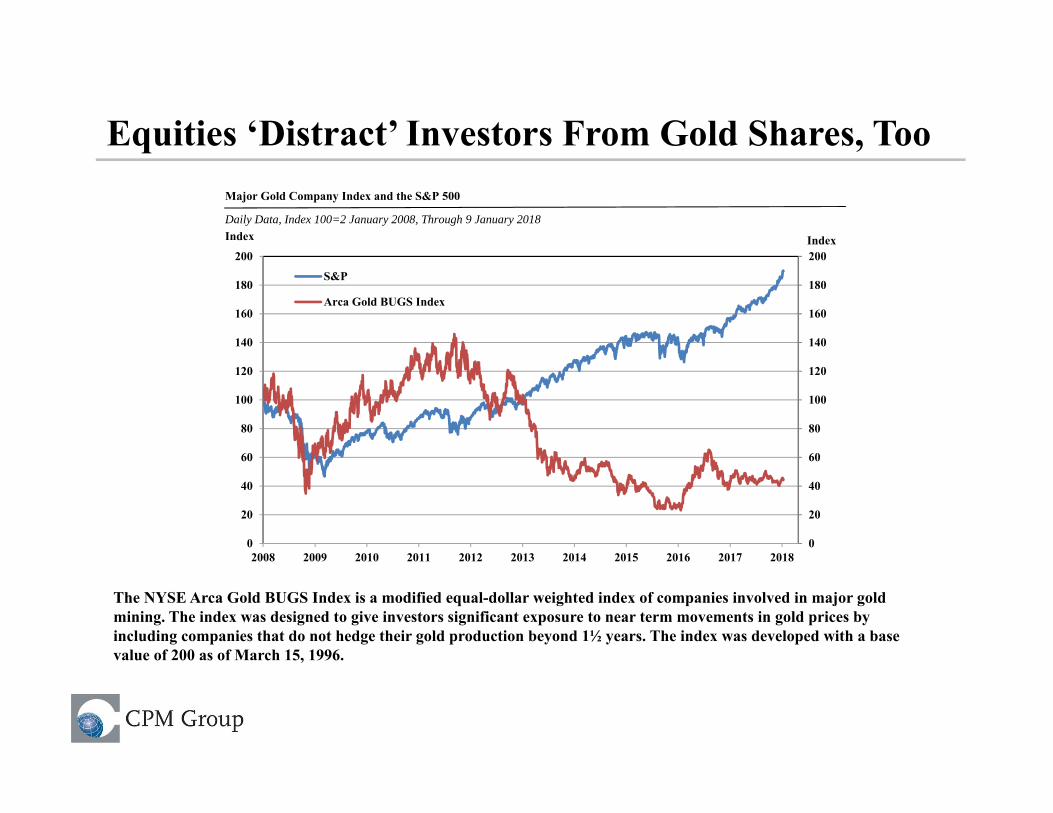
Equities ‘Distract’ Investors From Gold Shares, Too
0
20
40
60
80
100
120
140
160
180
200
0
20
40
60
80
100
120
140
160
180
200
2008 2009 2010 2011 2012 2013 2014 2015 2016 2017 2018
S&P
Arca Gold BUGS Index
Index Index
Major Gold Company Index and the S&P 500
Daily Data, Index 100=2 January 2008, Through 9 January 2018
The NYSE Arca Gold BUGS Index is a modified equal-dollar weighted index of companies involved in major gold mining. The index was designed to give investors significant exposure to near term movements in gold prices by including companies that do not hedge their gold production beyond 1½ years. The index was developed with a base value of 200 as of March 15, 1996.

Gold’s Investment Role
17

The Optimal Allocation To Gold
0%
5%10%15%
20% 25%30%
35%40%
45%50%
55%60%
65%70%
6.0%
6.5%
7.0%
7.5%
8.0%
8.5%
9.0%
9.5%
10.0%
4.5% 5.0% 5.5% 6.0% 6.5% 7.0% 7.5% 8.0% 8.5% 9.0%
Portfolio composed of S&P, T Bills, and Gold
Risk
A portfolio with 25% of its assets in gold had the best risk: reward ratio in the years 1968 - 2016
% Return

Gold as Percentage of Financial Assets
19
0%
1%
2%
3%
4%
5%
6%
0%
1%
2%
3%
4%
5%
6%
68 80 90 95 00 01 02 03 04 05 06 07 08 09 10 11 12 13 14 15 16
Percent Percent
Gold as a Percent of Global Financial Assets

Gold’s “Other” Fundamentals
20

Central Banks Continue Buying, At Slower Pace
21
-50
-40
-30
-20
-10
0
10
20
30
-50
-40
-30
-20
-10
0
10
20
30
1950 1955 1960 1965 1970 1975 1980 1985 1990 1995 2000 2005 2010 2015 2020p 2025p
Million Ounces
Official Transactions: Net Central Bank Gold Purchases and Sales
Net Additions
Net Reductions
Million Ounces
Net Addition = 82.8 MM Oz
Net Addition = 80.8 MM Oz

Fabrication Demand Projected To Decline
22
0
20
40
60
80
100
120
140
0
20
40
60
80
100
120
140
77 79 81 83 85 87 89 91 93 95 97 99 01 03 05 07 09 11 13 15 17p 19p 21p 23p 25p
Other Uses
Dental/ Medical
Electronics
Developed Country-JewelryDeveloping Country-Jewelry
Gold Fabrication Demand
Million Ounces Million Ounces
Changing Jewelry Demand Trends in India and China To Weigh on Total Fabrication Demand

Global Gold Mine Supply: Nearing A Turning Point
23
0
10
20
30
40
50
60
70
80
90
100
110
0
10
20
30
40
50
60
70
80
90
100
110
73 75 77 79 81 83 85 87 89 91 93 95 97 99 01 03 05 07 09 11 13 15 17p 19p 21p 23p 25p
Mln OzMln Oz
Global Gold Mine Supply Annual Data, Through 2026

Secondary Supply Increase Will Offset Mine Output Decline
0
5
10
15
20
25
30
35
40
45
50
0
5
10
15
20
25
30
35
40
45
50
77 80 83 86 89 92 95 98 01 04 07 10 13 16 19p 21p 25p
Mln Oz Mln Oz

Longer Term Total Supply
0
20
40
60
80
100
120
140
0
20
40
60
80
100
120
140
73 77 81 85 89 93 97 01 05 09 13 17p 21p 25p
Secondary SupplyTransitional Economies Exports to Market EconomiesMarket Economy Mine Production
Mln Oz
Total Gold Supply
Mln Oz
0
500
1,000
1,500
2,000
2,500
3,000
3,500
0
500
1,000
1,500
2,000
2,500
3,000
3,500
55 57 59 61 63 65 67 69 71 73 75 77 79 81 83 85 87 89 91 93 95 97 99 01 03 05 07 09 11 13 15
Reserve Base Reserves
Million Ounces Million Ounces
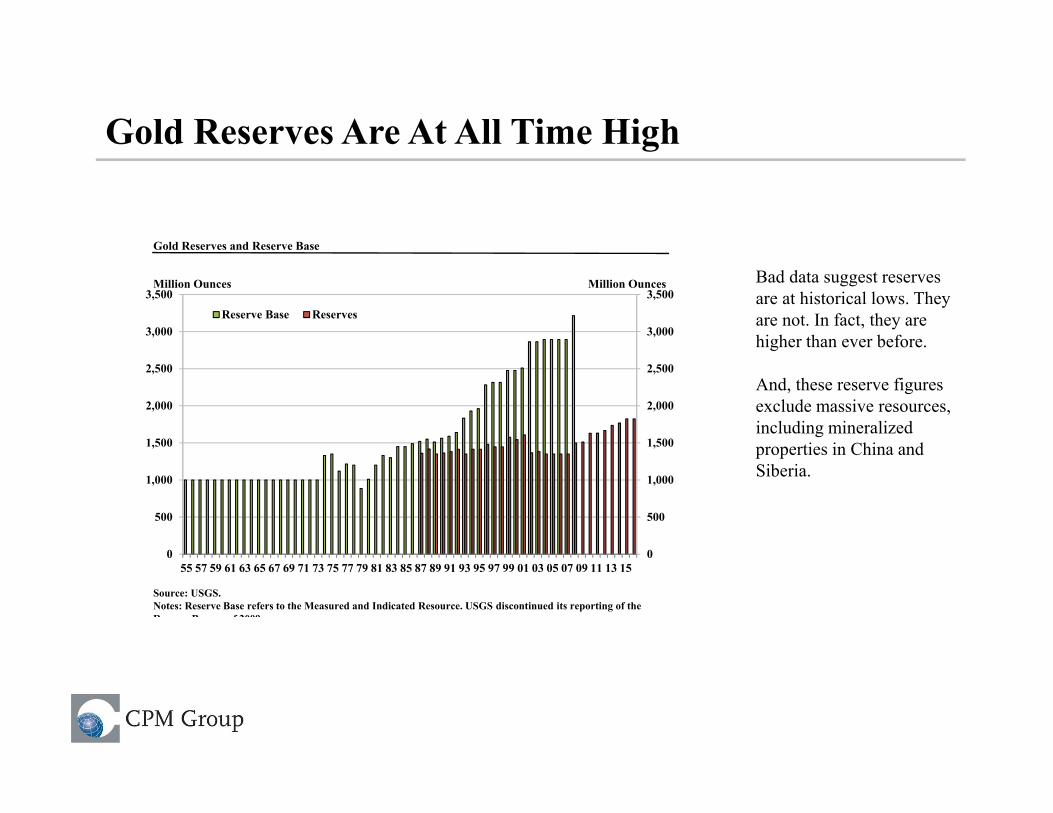
Gold Reserves and Reserve Base
Source: USGS. Notes: Reserve Base refers to the Measured and Indicated Resource. USGS discontinued its reporting of the Reserve Base as of 2009
Bad data suggest reserves are at historical lows. They are not. In fact, they are higher than ever before.
And, these reserve figures exclude massive resources, including mineralized properties in China and Siberia.
Gold Reserves Are At All Time High

Costs Follow Prices: Lower Gold Prices Have Reduced All In Sustaining Costs
$100
$300
$500
$700
$900
$1,100
$1,300
12Q1
Q2 Q3 Q4 13Q1
Q2 Q3 Q4 14Q1
Q2 Q3 Q4 15Q1
Q2 Q3 Q4 16Q1
Q2 Q3 Q4 17Q1
All-in Sustaining Costs
Sustaining Costs
Cash Costs
Production-Weighted All-In Sustaining Cost For Selected Gold Mining Companies
USD/Oz
Gold Mining Is Unsustainable At Current Prices

Cash Production Costs
0
200
400
600
800
1,000
1,200
1,400
1,600
1,800
2,000
2,200
2,400
0
200
400
600
800
1,000
1,200
1,400
1,600
1,800
2,000
2,200
2,400
10% 20% 30% 40% 50% 60% 70% 80% 90% 100%
Gold Mine Cash Cost in Q3 2015 and 2016
Cash Cost/Ounce Cash Cost/Ounce
90th Percentile: $958
Average Gold Price in Q3 2016 = $1,335Weighted Average Cash Cost Q3 2016 = $671
Average Gold Price in Q3 2015 = $1,290Weighted Average Cash Cost Q3 2015 = $674
90th Percentile: $996
Averages hide a lot.
All in sustaining costs are more difficult to gather, but cash costs show that more than 90% of current production was processed for less than $1,000 per ounce.
Many newer operations have lower costs.
Most Gold Mines Are Profitable

Monetary Policy and Gold

Fed Policies and Gold
The Fed is a human institution.
1. What Is The Fed Policy
2. Why Is The Fed Pursuing These Policies
3. CPM’s views on Fed policy being misdirected at this time
4. Interest Rates and Gold: The Empirical Evidence
5. CPM’s Gold Price Outlook
6. The Role of Fed Policy In CPM’s Gold Price Outlook

What Is The Fed Policy
The Fed has begun raising interest rates from abnormally low levels
The Fed is preparing to begin liquidating some of the $4.5 trillion in bonds and other assets it has added to its balance sheet since 2008.
It seeks to try to normalize interest rate markets before the next financial crisis or recession.
• The Fed has squeezed private borrowing, taking lending into less productive and outright unproductive government programs and reducing funds to private corporations and individuals.
There is a fallacy: The Fed has plenty of “ammunition left to use in future crises,” even if it did not pursue these policies.
The Fed has enormous capacity left to fight future crises. Whether it has the wisdom and political power to do so is a separate issue.

The Federal Reserve System Balance Sheet

Excess Reserves As Fed Chartered Banks

Why Is The Fed Pursuing These Policies
Traditionally the Fed has raised interest rates to quell inflation. There is no systemic nor cyclical inflation or tight employment markets at present, and thus there are no empirical reasons existing in the U.S. or global economy to warrant raising interest rates and reducing the balance sheet.
The Fed wants to raise interest rates on the theory that doing so would encourage lending institutions to lend more to small and medium sized enterprises (SMEs) and individual borrowers.
• Borrowing by SMEs and individual is the most powerful engine of real growth. • This theory flies in the face of other proven theories and empirical evidence.
• It makes no sense.• It is counter productive.
Interest earned by the Fed on its balance sheet assets, reverting to the U.S. Treasury, has been reducing the Federal budget deficit by around $100 billion per year since 2010. Throwing that away for no good reason is not logical.

Fiscal Policy and Gold

There Are Limits To US Government Borrowing Power
-1,800
-1,600
-1,400
-1,200
-1,000
-800
-600
-400
-200
0
200
400
-1,800
-1,600
-1,400
-1,200
-1,000
-800
-600
-400
-200
0
200
400
1935 1945 1955 1965 1975 1985 1995 2005 2015 2025
U.S. Budget Surplus & Deficit
Red = Republican Blue = Democrat
$US Billion $US Billion
Actual
CBO projections
Projections
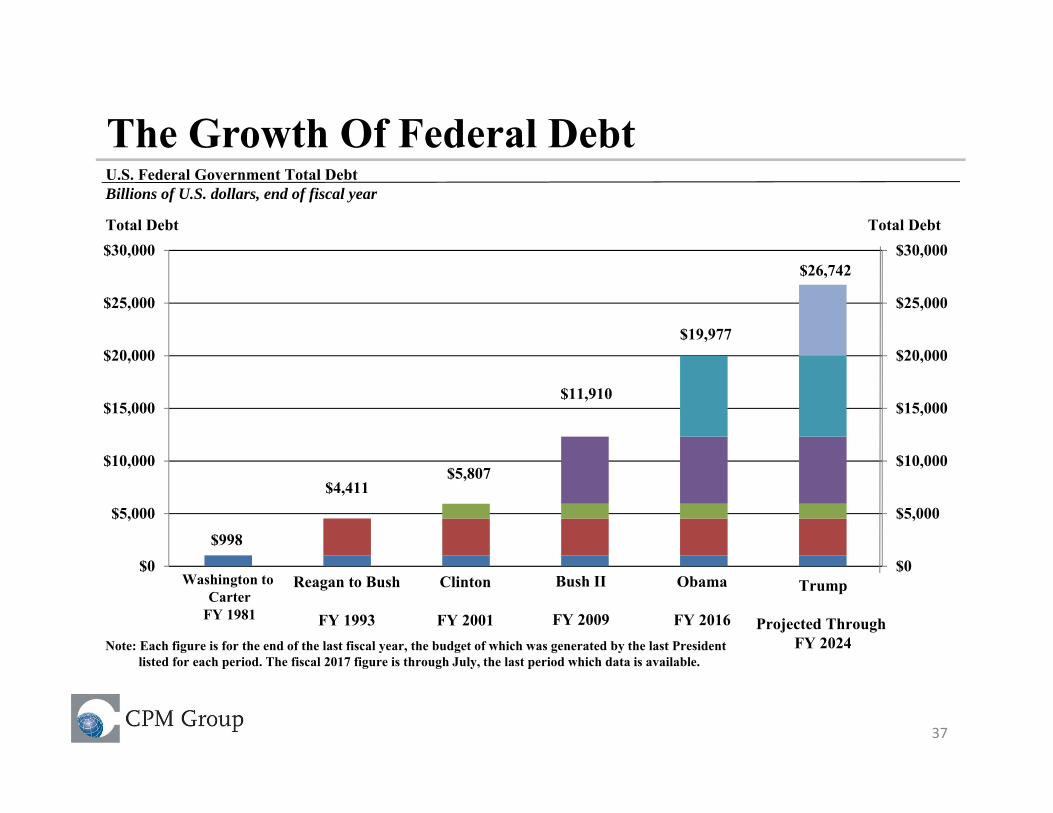
The Growth Of Federal Debt
37
$0
$5,000
$10,000
$15,000
$20,000
$25,000
$30,000
$0
$5,000
$10,000
$15,000
$20,000
$25,000
$30,000
Note: Each figure is for the end of the last fiscal year, the budget of which was generated by the last President listed for each period. The fiscal 2017 figure is through July, the last period which data is available.
U.S. Federal Government Total DebtBillions of U.S. dollars, end of fiscal year
$998
$4,411$5,807
$11,910
$26,742
Washington to Carter
FY 1981
Reagan to Bush
FY 1993
Clinton
FY 2001
Bush II
FY 2009
Obama
FY 2016
Total Debt Total Debt
$19,977
Trump
Projected Through FY 2024

Interest Rates and Gold: The Empirical Evidence

Gold and Real Interest Rates are Virtually Uncorrelated
39
-60%
-50%
-40%
-30%
-20%
-10%
0%
10%
20%
30%
40%
50%
60%
-8 -7 -6 -5 -4 -3 -2 -1 0 1 2 3 4 5 6 7 8
Rea
l In
tere
st R
ates
Real Interest R
ates
Gold Returns
Returns on Gold and Real Interest Rates
Slope: -0.0037Correlation: -0.17
Note: Monthly data from May 1968 through September 2017. Gold returns are based on changes in monthly average London PM fix gold prices. Real interest rates are U.S. 3-Month Treasury bills minus U.S. Consumer Price Index. Gold prices are the dependent variable and real interest rates are the independent variable. Data points in black are for those between September 2007 and July 2014.
• Higher real interest rates do not necessarily mean lower gold prices.
• The reasons behind any interest rate increases, and the levels in real terms, are critical variables in whether any change in interest rates has a measurable effect on gold prices. Another factor is the monetary policies in various countries.
• If rates are seen rising because inflation is becoming problematic, investors could become buyers of gold in spite of an increase in real interest rates.

Gold and Interest Rates
40
-10%
-8%
-6%
-4%
-2%
0%
2%
4%
6%
-10%
-8%
-6%
-4%
-2%
0%
2%
4%
6%
-3 -2 -1 0 1 2 3 4 5 6Real Interest Rates
Percent Percent
Median Returns on Gold in Different Real Interest Rate Environments
Changes in Gold Price Changes in Gold Prices
in Response to Change in Real Interest Rates in Anticipation of Change in Real Interest RatesCorrelation Slope Correlation Slope
No Lag -0.17 -0.0036 No Lag -0.17 -0.00361-Year Lag -0.03 -0.0007 1-Year Lag -0.16 -0.00332-Year Lag -0.09 -0.0020 2-Year Lag -0.13 -0.00273-Year Lag -0.09 -0.0020 3-Year Lag -0.13 -0.0011

Gold and The Dollar: The Empirical Evidence

The U.S. Dollar Is Neither Dead Nor Dying
42
60
70
80
90
100
110
120
130
140
150
Jan-73 Jun-79 Nov-85 Apr-92 Sep-98 Feb-05 Jul-11
Inde
x M
ar 1
973=
100
Source: Board of Governors of the Federal Reserve System/FRED
Trade Weighted U.S. Dollar Index: Major CurrenciesMonthly Data through September 2017

Not Always an Inverse Relation
43
Correlation Of The Trade Weighted U.S. Dollar To Gold
Q1 1968 – Q4 2016 -0.32Q4 1976 – Q3 1977 0.96 Both Rising
Q3 1982 – Q1 1983 0.98 Both Rising
Q1 1986 - Q4 1990 -0.47
Q1 1998 - Q4 2000 -0.52
Q1 2002- Q3 2013 -0.40
Q1 2005 - Q4 2005 0.54 Both Rising
70
80
90
100
110
120
130
140
150
160
170$0
$200
$400
$600
$800
$1,000
$1,200
$1,400
$1,600
$1,800
68 71 74 77 80 83 86 89 92 95 98 01 04 07 10 13 16
$/Ounce Index (Reverse Scale)
Trade Weighted Dollar
Gold (left scale)
Gold and the U.S. Dollar Quarterly, Through December 2016

Research-Driven Research and Consulting
Thank You.
www.cpmgroup.com