cpt-based lateral displacement analysis using method for
TRANSCRIPT

Geomechanics and Engineering, Vol. 7, No. 4 (2014) 000-000 DOI: http://dx.doi.org/10.12989/gae.2014.7.4.000 000
Copyright © 2014 Techno-Press, Ltd. http://www.techno-press.org/?journal=gae&subpage=7 ISSN: 2005-307X (Print), 2092-6219 (Online)
CPT-based lateral displacement analysis using p-y method for offshore mono-piles in clays
Garam Kim, Donggyu Park, Doohyun Kyung and Junhwan Lee
Department of Civil and Environmental Engineering, Yonsei University, 134 Shinchon-dong, Seodaemun-gu, Seoul120-749, Republic of Korea
(Received August 27, 2013, Revised May 17, 2014, Accepted July 03, 2014)
Abstract. In this study, a CPT-based p-y analysis method was proposed for the displacement analysis of laterally loaded piles. Key consideration was the continuous soil profiling capability of CPT and cone resistance profiles that do not require artificial assumption or simplification for input parameter selection. The focus is on the application into offshore mono-piles embedded in clays. The correlations of p-y function components to the effective cone resistance were proposed, which can fully utilize CPT measurements. A case example was selected from the literature and used to validate the proposed method. Various parametric studies were performed to examine the effectiveness of the proposed method and investigate the effect of property profile and its depth resolution on the p-y analysis. It was found that the calculation could be largely misleading if wrongly interpreted sub-layer condition or inappropriate resolution of input soil profile was involved in the analyses. It was also found that there is a significant influence depth that dominates overall load response of pile. The soil profile and properties within this depth range affect most significantly calculated load responses, confirming that the soil profile within this depth range should be identified in more detail.
Keywords: p-y analysis; cone penetration tests; laterally loaded piles; offshore wind turbines; displacement analysis; undrained shear strength 1. Introduction
For offshore wind turbine structures, the installation of foundation costs around 21% of the total construction cost (IEA 2008), which is much higher than for inland wind turbines. Optimized foundation design and construction are particularly desired for offshore structures as great amount of construction cost can be saved. Among several, mono-piles are a common foundation type that is often adopted for offshore wind turbines for water depths shallower than around 30 to 40 m. The design of offshore mono-piles is similar to that of inland piles, while the lateral load response and lateral load carrying capacity are key design consideration as waves and winds are predominant load components.
The lateral load capacity of piles can be defined in two different aspects of the allowable load capacity (Hall) and the ultimate load capacity (Hu). Hu refers to failure of either soil or pile itself while Hall is associated with the level of displacement that is tolerable for a given structure (Broms Corresponding author, Professor, E-mail: [email protected]

Garam Kim, Donggyu Park, Doohyun Kyung and Junhwan Lee
1964, Duncan et al. 1994, Zhang et al. 2005). For the displacement analysis of laterally loaded piles for Hall, the beam-on-elastic foundation (BEF) approach based on the p-y analysis is often used (Matlock 1970, Reese et al. 1975, Duncan et al. 1994). The p-y analysis may be less rigorous than the continuum-based full numerical analysis as it is based on simplified soil springs and assumed load response curve. The p-y method has been however widely adopted in practice mainly due to the simplicity and reasonability of calculated results.
As for other foundation design and analysis, the adequacy of input parameters is crucially important for the successful implementation of the p-y analysis. When offshore environment is involved, the soil characterization using the conventional sampling- and testing-based approach is subjected to various experimental uncertainties with limited reliability of estimated soil parameters. For this reason, in-situ testing methods are preferred and regarded more effective for offshore cases (Titi et al. 2000, Tumay and Kurup 2001, Lee and Randolph 2011).
There have been several cases for the applications of in-situ test results into the p-y analysis (Briaud et al. 1985, Robertson et al. 1989, Gabr et al. 1994, Haldar and Babu 2009). Briaud et al. (1985) and Robertson et al. (1989) proposed the p-y analysis methods based on the pressure metertest (PMT) and dilatometer test (DMT) results, respectively. Gabr et al. (1994) also proposed a DMT-based p-y method using the hyperbolically defined load response curve. PMT and DMT were frequently adopted because the lateral loading mechanisms of the tests were similar to those of laterally loaded piles. Less attention has been given to the cone penetration test (CPT) mainly due to the different loading direction of the vertical cone penetration from the lateral pile loading process. However, it has been well recognized that the cone resistance is essentially governed by the horizontal effective stress rather than the vertical effective stress (Schnaid and Houlsby 1991). Moreover, it was recently found that the cone resistance is closely related to lateral pile load response as both are governed by the horizontal effective stress (Lee et al. 2010).
In the present study, a penetrometer-based p-y analysis method using CPT results is proposed for offshore piles embedded in clays. CPT is adopted to take advantage of the cost effectiveness and popularity in offshore soil investigation. The continuous profiling capability of CPT is an important consideration for the proposed method. The proposed CPT-based p-y analysis can take into account the depth variation of soil and layer profiles in detail by directly using CPT results. The effects of soil layering and property variation on the p-y analysis are examined in comparison to the conventional p-y analysis approach.
2. p-y analysis methods for laterally loaded piles in clays The beam-on-elastic foundation (BEF) approach, often called as Winkler foundation, is a
common approach in practice for the displacement analysis of laterally loaded piles. In this approach, as shown in Fig. 1, soils are assumed as a series of elastic springs with load responses defined by the p-y curves that are either linear or non-linear. Various p-y analysis methods have been proposed (Matlock 1970, Reese et al. 1975, Murchison and O’Neill 1984, Franke and Rollins 2013). The difference of the methods mainly come from the shape of p-y curve and definition of ultimate lateral resistance pu.
For offshorepiles embedded in clays, the method proposed by Matlock (1970) is often used and was adopted in various specifications (DNV 2004, API 2000). Matlock (1970) proposed a p-y curve shown in Fig. 2(a) applicable in soft clays. The function for the p-y curve of Matlock (1970) in Fig. 2(a) is given in a normalized form as follows

CPT-based lateral displacement analysis using p-y method for offshore mono-piles in clays
Fig. 1 p-y analysis model for laterally loaded piles
(a) (b)
Fig. 2 p-y curve models for different clay conditions of: (a) soft clay (Matlock 1970); and (b) stiff clay (Reese et al. 1975).
3/1
50
5.0
y
y
p
p
u
(1)
where p = lateral load per unit length; pu = ultimate lateral soil resistance; y = induced lateral displacement; y50 = limit lateral displacement = 2.550D; 50 = limit strain corresponding to 50% of failure stress in triaxial tests; and D = pile diameter. Beyond the lateral displacement of 8y50, the value of p was set as a constant. In Eq. (1), pu represents the ultimate resistance exerted by surrounding soils given as the following relationship
DsNp ucu (2) where su = undrained shear strength; Nc = bearing capacity factor; and D = pile diameter. Nc varies
1/1/3
Asy
506A
sy
5018A
sy
50
p 0.055py A yA y
.
E kz
E0.0625y
p
p 0.5pyy
.

Garam Kim, Donggyu Park, Doohyun Kyung and Junhwan Lee
from 3 to 9 depending on depth range given as follows
)(3 ru
c zzD
Jz
s
zN
(3)
)(9 rc zzN (4)
where = effective unit weight of soil; z = depth from ground surface; zr = limit depth below ground surface; and J = empirical parameter that can be taken as 0.5 and 0.25 for soft and stiff clays, respectively. Eqs. (3)-(4) indicate that the value of Nc increases down to the limit depth zr and then becomes constant equal to 9. According to Matlock (1970), the limit depth zr can be estimated using the following relationship
Js
DD
z
u
r
6
(5)
For the cases in stiff over consolidated clays, Reese et al. (1975) proposed a p-y curve shown in Fig. 2(b) considering the stress softening behavior. The p-y curve of Reese et al. (1975) in Fig. 2(b) consists of 5 piecewise sections with functions given, respectively, as follows
yzkp )( (6)
5.050)/(5.0 yypp u (7)
25.15050
5.050 )/()(055.0)/(5.0 yAyAypyypp ssuu (8)
)6()/0625.0(411.0)6(5.0 50505.0 yAypypApp suusu (9)
suusu AppApp 75.0411.0)6(5.0 5.0 (10)
where k = subgrade reaction modulus; As = depth correction factor; and y50 = limit displacement = 50D. The depth correction factor As varies from 0.2 at the surface to 0.6 for depths greater than 3 times pile diameter (3D). pu by Reese et al. (1975) is taken as the smaller one among the followings
zsDzDsp uuu 83.22 (11)
Dsp uu 11 (12) where us = average undrained shear strength over the depth z; and = effective unit weight of clays.
For the displacement analysis using the p-y method in clays, as reviewed herein, key components are the magnitude of pu and the function that defines the p-y curve, both of which are controlled by the effective stress and undrained shear strength. Although no particularly specific consideration has been addressed for the p-y analysis for offshore piles, the proper identification of

CPT-based lateral displacement analysis using p-y method for offshore mono-piles in clays
these parameters and their depth profiles is crucial, as it is often subjected to various uncertainties under offshore environment with larger variability than for inland cases.
3. Lateral displacement analysis using CPT results 3.1 Modified p-y function based on effective cone resistance The soil reactions from the soil springs for the BEF approach vary with depth as a result of
increasing stiffness and strength properties of the p-y curves. The undrained shear strength su is the governing soil variable for clays, which characterizes the main features of the p-y curve and the ultimate lateral soil resistance pu. Various experimental methods have been proposed to estimate su (Ladd et al. 1977, Teh and Houlsby 1991, Stewart and Randolph 1994, Lunne et al. 2005). The typical examples of sampling-free, in-situ testing methods popular in practice include the field vane test (FVT) and cone penetration test (CPT). The cone penetration test can be particularly effective for offshore soils as the test is conducted by a single penetration process providing continuous and detailed depth profiles of seabed soil conditions.
The cone factor method is a common approach to estimate su using the CPT cone resistance given as the following relationship
k
vtu N
qs 0
(13)
where su = undrained shear strength; qt = cone resistance; v0 = overburden total stress at cone tip level; and Nk = cone factor. As the cone factor method of Eq. (13) involves additional unknown parameter v0, additional experimental procedure is required, which reduces the effectiveness of CPT application. As a recent development, the effective cone factor method was proposed, where su is given as a sole function of the cone resistance (Lee et al. 2010). The effective cone factor method is given by
e
e
e
tu N
q
N
uqs
0
(14)
where qe = effective cone resistance = qt – u0; u0 = hydrostatic pore pressure; and Ne = effective cone factor 16. It is noted that no additional testing procedure is required for Eq. (14) as u0 can be directly obtained from CPT results.
Introducing the effective cone factor into the ultimate lateral soil resistance pu of Eq. (2), the following CPT-based pu equation can be obtained
ee
cu qD
N
Np
(15)
Nc and D in Eq. (15) are the bearing capacity factor and pile diameter, respectively. As Nc given by Eq. (3) varies with depth, the value of Nc/Ne also varies with depth. Below the limit depth zr, however, Nc becomes constant as specified by Eq. (4). For depths greater than zr, the values of Nc and Ne can be taken equal to 9 and 16, which produces the value of Nc/Ne equal to 0.5625. Using the pu correlation of Eq. (15), the p-y function by Matlock (1970) can be modified in terms of the effective cone resistance qe as follows

Garam Kim, Donggyu Park, Doohyun Kyung and Junhwan Lee
(a) (b)
Fig. 3 Correlation of limit strain values for p-y method: (a) ε50-su correlation; and (b) εCPT-su correlation
3/1
50
5.0
y
yDq
N
Np e
e
c
(16)
Note that, as Eq. (16) does not involve the overburden stress v0, the continuous cone resistance profiles from CPT can be fully utilized into the analysis.
According to Matlock (1970), the limit displacement y50 can be evaluated by using the limit strain value 50 based on the stress-strain curve of the clay at the site. As the original method specifies the discretized values of 50 for a given range of su as indicated in Fig. 3(a), a fitting curve was obtained and included in Fig. 3(a) to describe the 50-su correlation. Following the effective cone resistance of Eq. (14), the 50-su correlation in Fig. 3(a) can be further modified in terms of the effective cone resistance as plotted in Fig. 3(b). CPT in Fig. 3(b) can be directly estimated from CPT cone resistances. Note that all correlations given in Fig. 3 were fit to be compatible to the existing results adopted in current practice. Skempton (1951) and Matlock (1970) suggested the values of 50 in the range from 0.02 to 0.005 for most clayey soils. The maximum value of 50 and CPT equal to 0.02 given in Fig. 3 was also set to maintain the consistency with the value specified in the original method. The CPT-qe correlation given in Fig. 3(b) is
02.0185.0124.1
A
eCPT p
q
(17)
where qe = effective cone resistance; pA = reference stress = 100 kPa. Using Eqs. (16)-(17), the modified CPT-based p-y function is then obtained as follows
3/12
368.0
CPTe
e
c yDq
N
Np
(18)
0.000
0.005
0.010
0.015
0.020
0.025
0 5 10 15 20 25 30
CP
T
qe/pA
Proposed
거듭제곱(Proposed)
Fitting curve
ε_CPT 0.1848 q_e/p_A ^ 1.124
εCPT = 0.02
Fitting c

CPT-based lateral displacement analysis using p-y method for offshore mono-piles in clays
The value of Nc/Ne varies down to the depth of zr, below which it is equal to 0.5625. As the proposed p-y function of Eq. (18) utilizes the continuous CPT profile, any changes in depth profile of soil characteristics can be readily considered into the analysis without a need of assumed simplification or idealization of in-situ soil profiles.
3.2 Load transfer analysis and calculation The load-transfer analysis is the main calculation step in the BEF approach using the p-y curve
for the displacement analysis of laterally loaded piles. It simulates the load responses of assumedpile segments and soil springs upon lateral loading. The schematic illustration of load-transfer mechanism is shown in Fig. 4. A series of pile segments with the length of h are connected at nodes where the shear stress (V), axial stress (Q) and bending moment (M) are transferred. At each node, the bending stiffness is introduced in terms of the elastic modulus (E) and the second moment of inertia (I).
The governing differential equation for the equilibrium condition of a pile segment shown in Fig. 4(b) is given by
02
2
4
4
Wpdz
ydQ
dz
ydEI
(19)
where EI = flexural rigidity of pile; Q = axial load; p = soil reaction per unit length; and W = distributed load along pile. Applying the finite difference scheme, the governing differential
(a) (b)
Fig. 4 Configuration of laterally loaded piles: (a) lateral deflection of pile segments and (b) forces acting on elementary pile segment

Garam Kim, Donggyu Park, Doohyun Kyung and Junhwan Lee
equation of Eq. (19) can be rewritten as the following discretized formulation
iiiiiiiiiii fyeydycybya 2112 (20)
where a, b, c, d, e, and f are model coefficients. The subscript i represents the node number of discretized pile segments. Each model coefficient in Eq. (20) is given by
1 ii Ra (21)
211 22 QhRRb iii (22)
42
11 24 hEQhRRRc pyiiiii (23)
2
122 QhRRd iii (24)
1 ii Re (25)
4Whfi (26) where Ri = flexural rigidity at node i = (EI)i and Epyi = secant modulus of soil springs at node i from the proposed p-y curve of Eq. (18). If lateral load imposed on pile head is the only external load, Q and W are set equal to zero.
The model coefficients of Eqs. (21)-(26) can be determined from the system equations established for the assigned nodes between pile segments and two additional imaginary nodes assigned at the top and bottom ends of pile. If the pile is divided into n segments, n + 5 nodes are generated and thus n + 5 equations are established. If boundary conditions are given at the top and bottom of pile, the set of algebraic equations for the assigned nodes can be solved.
At the bottom of pile, the boundary condition is set as zero-bending moment and zero-shear given as follows
02 101 yyy (27)
011211230 )(
2)22(
2Vyy
h
Qyyyy
h
R
(28)
where, y-2, y-1, y0, y1, y2 = lateral deflections defined at the bottom segment and imaginary nodes of pile shown in Fig. 5(a); R0 = flexural rigidity at the bottom node of pile = (EI)0, h = segment length, Q = axial load, and V0 = shear force at the bottom node of pile. Note that the assumption of zero-bending moment and zero-shear is applicable for long flexible piles and short rigid piles that show rotation behavior upon lateral load as assumed in most cases. However, if a pile is short rigid and yet fixed at base, the bending moment would be generated at pile base and the assumption of zero-bending moment at pile base would be not be valid (Reese et al. 1970).
For the top boundary condition for free head illustrated in Fig. 5(b), the following equations for moment and force equilibriums are imposed

CPT-based lateral displacement analysis using p-y method for offshore mono-piles in clays
(a) (b)
Fig. 5 Node configuration for boundary conditions: (a) bottom boundary of pile; and (b) top boundary of pile
ttttt Myyy
h
R )2( 112
(29)
tttttttt Pyy
h
Qyyyy
h
R )(
2)22(
21121123
(30)
where, Mt and Pt = bending moment and shear force at the top node of pile, yt-2, yt-1, yt, yt+1, yt+2 = lateral deflections at the top segment and imaginary nodes of pile shown in Fig. 5(b), Rt = flexural rigidity at the top node of pile = (EI)t.
In a matrix form, the governing equation of Eq. (20) can be given as follows
fyA (31) where [A] = stiffness matrix; (y) = lateral displacement vector matrix; and (f) = load vector matrix. The stiffness matrix [A] contains the system equations of the model parameters and boundary conditions given by Eqs. (21)-(30). The lateral displacement vector of pile can be obtained taking [A]-1 for each side.
3.3 Calculation algorithm The load transfer mechanism and the proposed CPT-based p-y analysis method described
previously were programmed using the commercial programing software MATLAB. Fig. 6 shows the schematic flow and steps of the developed program for the calculation algorithm using the

Garam Kim, Donggyu Park, Doohyun Kyung and Junhwan Lee
Fig. 6 Calculation flow and algorithm proposed method. The developed program is composed of three main parts. The first part includes the input process of required soil and pile parameters, division of pile segments, node assignment, and construction of the p-y curve. As the cone resistance and its depth profile are used as input soil parameters, CPT results obtained from field are directly introduced into the program. CPT and pu are then calculated to construct the p-y curves at each node, which is incorporated into the main calculation step of the load-transfer analysis. The second part consists of assembling the stiffness matrix for the system equations and solving the matrix equation by iteration. The five-diagonal banded matrix is created with the coefficients given by Eqs. (21)-(26) at nodes. The set of algebraic equations are then solved for lateral pile deflections using the inverse matrix and imposed boundary conditions at the top and bottom of pile. The third, final step is to calculate the bending moments, shear forces, and soil reactions along pile from calculated lateral deflections. 4. Comparison and validation
To check the validity of the proposed CPT-based p-y analysis method, a case example was
CPT-based lateral displacement analysis using p-y method for offshore mono-piles in clays
(a) (b) (c)
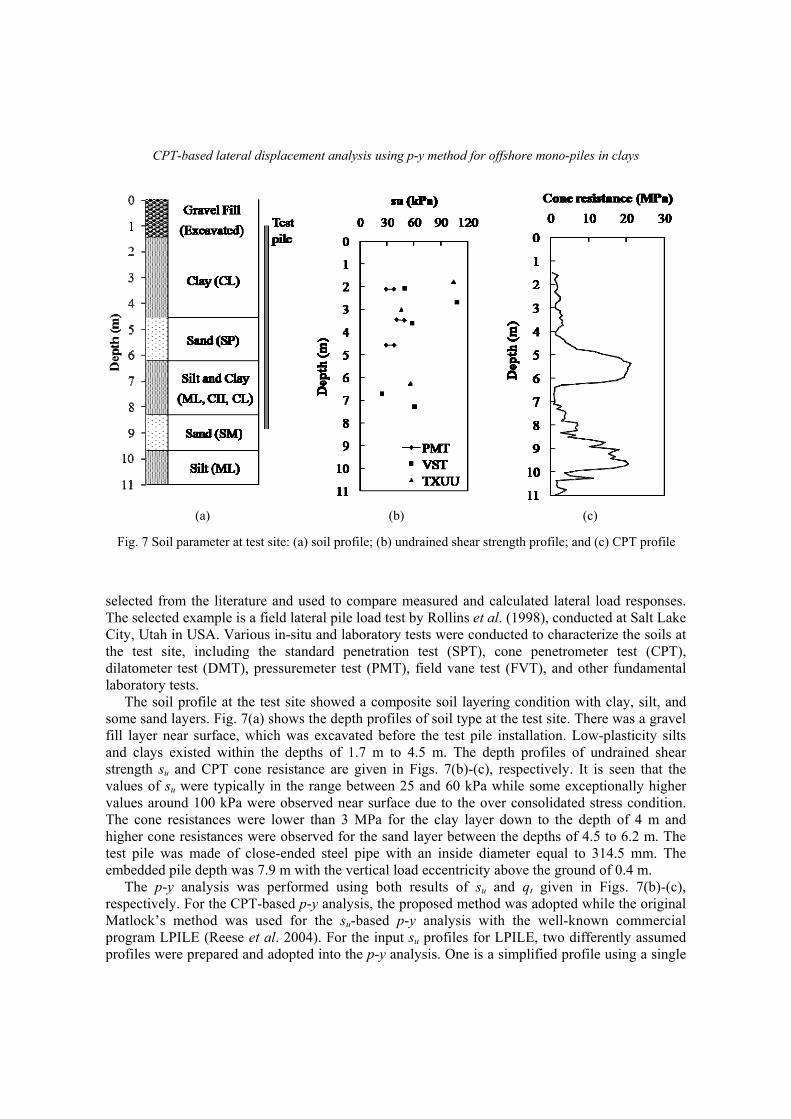
Fig. 7 Soil parameter at test site: (a) soil profile; (b) undrained shear strength profile; and (c) CPT profile
selected from the literature and used to compare measured and calculated lateral load responses. The selected example is a field lateral pile load test by Rollins et al. (1998), conducted at Salt Lake City, Utah in USA. Various in-situ and laboratory tests were conducted to characterize the soils at the test site, including the standard penetration test (SPT), cone penetrometer test (CPT), dilatometer test (DMT), pressuremeter test (PMT), field vane test (FVT), and other fundamental laboratory tests.
The soil profile at the test site showed a composite soil layering condition with clay, silt, and some sand layers. Fig. 7(a) shows the depth profiles of soil type at the test site. There was a gravel fill layer near surface, which was excavated before the test pile installation. Low-plasticity silts and clays existed within the depths of 1.7 m to 4.5 m. The depth profiles of undrained shear strength su and CPT cone resistance are given in Figs. 7(b)-(c), respectively. It is seen that the values of su were typically in the range between 25 and 60 kPa while some exceptionally higher values around 100 kPa were observed near surface due to the over consolidated stress condition. The cone resistances were lower than 3 MPa for the clay layer down to the depth of 4 m and higher cone resistances were observed for the sand layer between the depths of 4.5 to 6.2 m. The test pile was made of close-ended steel pipe with an inside diameter equal to 314.5 mm. The embedded pile depth was 7.9 m with the vertical load eccentricity above the ground of 0.4 m.
The p-y analysis was performed using both results of su and qt given in Figs. 7(b)-(c), respectively. For the CPT-based p-y analysis, the proposed method was adopted while the original Matlock’s method was used for the su-based p-y analysis with the well-known commercial program LPILE (Reese et al. 2004). For the input su profiles for LPILE, two differently assumed profiles were prepared and adopted into the p-y analysis. One is a simplified profile using a single

Garam Kim, Donggyu Park, Doohyun Kyung and Junhwan Lee
Fig. 8 Undrained shear strength profiles Fig. 9 Measured and predicted pile head deflections
average value of su for a given layer and the other is a detailed profile reflecting most significant variation of su within the layers. These two assumed profiles are shown in Fig. 8. For the proposed method, the CPT profile given in Fig. 7(c) was adopted. For the calculation within the sand layers, the API method (API 2000) was used.
Fig. 9 shows measured and calculated lateral load responses. It is seen that the calculated results using the proposed CPT-based method and detailed su-profile are both in similarly close agreement with the measured curve. The simplified su-profile on the other hand produced underestimated lateral load response. While the results in Fig. 9 validates the proposed CPT-based method, it is also indicated that the resolution of depth profile for the input parameters plays an important role in the p-y analysis and affect significantly calculated load responses. 5. Effect of property profile and soil layer condition
5.1 Effect of profile resolution The main advantage of the proposed CPT-based p-y analysis is that detailed soil profiles, often
with complexity, can be readily considered in the analysis without additional sampling and testing procedure. It is distinguished from the conventional way that utilizes individual property values with a certain depth interval. The effectiveness of the proposed method would differ depending on the soil profile and layering conditions. In order to investigate the effect of property profile and its depth resolution on the p-y analysis, a series of clay soil deposits were assumed and parametric study was performed. The assumed soil profiles were defined using the following su profile relationship

CPT-based lateral displacement analysis using p-y method for offshore mono-piles in clays
zsu (32) where su = undrained shear strength; = strength increase factor; and z = depth. While the range of values for NC clays is typically between 1 and 2, the values equal to 0.5, 1, 2, and 3 were considered in the analyses to cover full range of possible clay conditions. The assumed soil conditions are shown in Fig. 10(a).
The assumed su profiles shown in Fig. 10(a) were divided into several sub-layers and average su values were assigned for each sub-layer as input values for the p-y analysis. Fig. 10(b) shows examples of the considered sub-layer conditions adopted in the p-y analysis. Note that, for all the cases shown in Fig. 10(b), the values of average su along the pile embedded depth are the same. In order to consider the effect of pile rigidity, different EI valuesfor the pile, equal to 0.5 106, 1.0
106 and 1.5 106 kN·m, were considered. The total pile length was 35 m with the pile embedded depth of 30 m. Fig. 11 shows lateral deflections (y) at pile head [Fig. 11(a)] and the maximum bending moments (Mmax) [Fig. 11(b)] with the number of sub-layer for different su profile conditions. The lateral load
and EI of the pile in Fig. 11 was 100 kN and 1.0 106 kN·m, respectively. In Fig. 11, the values of y and Mmax were normalized with those obtained for the original continuous su profile (i.e., y0 and Mmax,0). The single sub-layer case produced the values of y and Mmax underestimated by around 40% and 72% compared to those for the continuous su profile. As the number of sub-layer increases, the difference became smaller. For the cases with more than 5 sub-layers, calculated results showed the degrees of match higher than 90% to y0 and Mmax,0. Similar result were obtained for the other pile cases with EI = 0.5 106 and 1.5 106 kN·m. These confirm that the calculated results of the
Fig. 10 Soil profiles for parameter study: (a) assumed su-profiles; and (b) assumed sub-layer conditions

Garam Kim, Donggyu Park, Doohyun Kyung and Junhwan Lee
(a) (b)
Fig. 11 Normalized deflections and bending moments: (a) normalized head deflections; and (b) normalized maximum bending moments
Fig. 12 Assumed soil sub-layer and pile conditions for parameter study
p-y analysis are significantly affected by assumed sub-layer condition and resolution of input soil profile, justifying the effectiveness of the proposed CPT-based method.
5.2 Significant influence layer depth The depths or thicknesses of sub-layers affect the lateral pile load responses as the p-y behavior
changes with depth. If there is a depth range within which the soil condition dominates the overall lateral load response of the pile, input soil variables within this significant influence depth range should be identified in more detail. To analyze the significant influence depth range, additional parametric study was performed assuming different soil layer conditions.
The assumed soil conditions consisted of two sub-layers with different layer thicknesses as illustrated in Fig. 12. The undrained shear strengths (su) for the upper and lower sub-layers were designated as su,1 and su,2, respectively. Zc in Fig. 12 represents the thickness of the upper sub-layer.
For the parametric study, two groups of soil conditions were considered. su,1of the first group is
0.0
0.2
0.4
0.6
0.8
1.0
0 1 2 3 4 5 6 7 8 9 10 11
y h/ y
0
Number of sub-layers
α=0.5
α=1
α=2
α=30.5
0.6
0.7
0.8
0.9
1.0
0 1 2 3 4 5 6 7 8 9 10 11
Mm
ax/ M
max
,0Number of sub-layers
α=0.5
α=1
α=2
α=3
L
zc su,1
su,2
D = 1 m
EI = 1 × 10⁶ kN·m
2

CPT-based lateral displacement analysis using p-y method for offshore mono-piles in clays
(a) (b)
Fig. 13 Calculated head deflection for different sub-layer thickness condition for: (a) long flexible; and (b) short rigid and piles
greater than su,2 and the other group represents the opposite condition. For each group, different values of su,1 and su,2 were considered. Two different pile lengths of 15 and 30 m were considered to check the results for both short (rigid) and long (flexible) pile conditions. Short and long piles in this study were classified based on the pile characteristic length (L) proposed by Broms (1964). Short piles correspond to L smaller than 2.3. The values of pile characteristic length parameter [ = (Es/EpIp)
1/4] were calculated for each given soil and pile conditions. The values of the characteristic pile length (L) for the 15-m pile were between 1.8 and 2.2 indicating short piles. The 30-m pile was classified into a long pile as L ranged from 3.7 to 4.5.
Figs. 13(a)-(b) show calculated pile head deflections (y) from the p-y analysis as a function of zc for the long and short pile cases, respectively. Both zc and y in Fig. 13 were normalized with the pile diameter (D) of 1 m. The results obtained for different su conditions were all included in the figure. As shown in Fig. 13(a) for the long pile case, no significant changes in the calculated pile deflections are observed for zc greater than 10D. This means that input soil profile down to the depth of 10D dominates calculated lateral load responses and the effect of soil profile below 10D is minor. However, for the short pile case with L = 15D in Fig. 13(b), no converged values of zc are observed, indicating the soil profile throughout the entire pile embedded depth contributes the overall load response. This represents that the soil profile identification becomes more important for short pile cases and the proposed method with detailed soil profiling would be more beneficial.
6. Conclusions In this study, a CPT-based p-y analysis method was proposed for the displacement analysis of
laterally loaded piles. Key consideration was the continuous soil profiling capability of CPT and cone resistance profiles that do not require artificial assumption or simplification for input parameter selection. The proposed method is focused on the application into mono-piles embedded in offshore clayey soils where the soil characterization is limited. The correlations of p-y function
0
0.2
0.4
0.6
0.8
1
0 5 10 15 20
y h/ D
zc / D
20 - 3020 - 4020 - 5040 - 1040 -2040 - 30
su,1 - su,2
-2E-15
0.3
0.6
0.9
1.2
1.5
1.8
0 5 10 15
y h/ D
zc / D
20 - 3020 - 4020 - 5040 - 1040 -2040 - 30
su,1 - su,2

Garam Kim, Donggyu Park, Doohyun Kyung and Junhwan Lee
components to the effective cone resistance were proposed, which can fully utilize CPT measurements.
The proposed CPT-based p-y model and the load transfer calculation procedure were programmed and used to obtain load responses of laterally loaded piles. A case example was selected from the literature and used to compare measured and calculated results. Close match was observed from the results measured and using the proposed method. It was indicated that the resolution of depth profile for input parameters in the p-y analysis is important and affect significantly calculated load responses.
Various parametric studies were performed to examine the effectiveness of the proposed CPT-based method and investigate the effect of property profile and its depth resolution on the p-y analysis. A series of assumed clay soil deposits were prepared and introduced into the calculation and comparison of load responses of laterally loaded piles. It was found that the calculation could be largely misleading if wrongly interpreted sub-layer condition or inappropriate resolution of input soil profile was involved in the analysis. From the analysis of the significant influence depth range, it was found that there is a depth range where the soil profile and properties affect the calculated load responses, consequently dominating the overall load response. It was also found that the soil profile identification becomes more important for short piles indicating that the proposed method with detailed soil profiling would be more beneficial. Acknowledgments
This research was supported by Basic Science Research Program through the National
Research Foundation of Korea(NRF) funded by the Ministry of Science, ICT and Future Planning(No. 2011-0030845) and the Ministry of Education(No.2013R1A1A2058863). References API (2000), Recommended Practice for Planning, Designing and Construction Fixed Offshore Platforms -
Working Stress Design, American Petroleum Institute, API Recommended Practice 2A-WSD (RP2A- WSD), (21st Edition), Dallas, TX, USA.
Broms, B.B. (1964), “Lateral resistance of piles in cohesive soils”, J. Soil Mech. Found. Div. – ASCE, 90(2), 27-63.
Briaud, J.L., Tucker, L., Lytton, R.L. and Coyle, H.M. (1985), “Behavior of piles and pile groups in cohesionless soils”, Final Report, Report No. FHWA/RD-83/038, NTIS PB86-152089/AS.
DNV (2004), Det Norske Veritas, Design of Offshore Wind Turbine Structures, Offshore Standard, Norway. Duncan, J., Evans, L. Jr. and Ooi, P. (1994), “Lateral load analysis of single piles and drilled shafts”, J.
Geotech. Eng., ASCE, 120(6), 1018-1033. Franke, K. and Rollins, K. (2013), “Simplified hybrid p-y spring model for liquefied soils”, J. Geotech.
Geoenviron. Eng., ASCE, 139(4), 564-576. Gabr, M., Lunne, T. and Powell, J. (1994), “P-y analysis of laterally loaded piles in clay using DMT”, J.
Geotech. Eng., ASCE, 120(5), 816-837. Haldar, S. and Babu, G.S. (2009), “Design of laterally loaded piles in clays based on cone penetration test
data: A reliability-based approach”, Géotechnique, 59(7), 593-607. IEA (2008), World Energy Outlook 2008, International Energy Agency, Paris, France. Ladd, C.C. (1977), “Stress-deformation and strength characteristics, state of the art report”, Proceedings of
the 9th ISFMFE, Venue, Month, Vol. 4, pp. 421-494.

CPT-based lateral displacement analysis using p-y method for offshore mono-piles in clays
Lee, J., Kim, M. and Kyung, D. (2010), “Estimation of lateral load capacity of rigid short piles in sands using CPT results”, J. Geotech. Geoenviron. Eng., ASCE, 136(1), 48-56.
Lee, J. and Randolph, M. (2011), “Penetrometer-based assessment of spudcan penetration resistance”, J. Geotech. Geoenviron. Eng., ASCE, 137(6), 587-596.
Lee, J., Seo K., Kang, B., Cho, S. and Kim, C. (2010), “Application of effective cone factor for strength characterization of saturated clays”, Proceedings of GeoFlorida 2010 (Advances in analysis, modeling and design), West Palm Beach, FL, USA, February.
Lunne, T., Randolph, M.F., Chung, S.F., Anderson, K.H. and Sjursen, M.A. (2005), “Comparison of cone T-bar factors in two onshore and one offshore clay sediments”, Proceedings of the 1st Intnernational Symposium on Frontiers in Offshore Geotechnics, Perth, WA, USA, September, pp. 981-989.
Matlock, H. (1970), “Correlation for design of laterally loaded piles in soft clay”, The 2nd Annual Offshore Technology Conference, Houston, TX, USA, April, pp. 577-607.
Murchison, J.M. and O’Neill, M.W. (1984), “Evaluation of p-y relationships in cohesionless soils”, Anal. Des. Pile Found., ASCE, 174-191.
Reese, L.C., Cox, W.R. and Koop, F.D. (1975), “Field testing and analysis of laterally loaded piles in stiff clay”, Proceedings of Offshore Technology Conference, Houston, TX, USA, May, pp. 671-690.
Reese, L.C., Wang, S.T., Isenhower, W.M., Arrellaga, J.A. and Hendrix, J. (2004), Computer Program: LPILE Version 5 Technical Manual, Ensoft Inc., Austin, TX, USA.
Robertson, P.K., Davis, M.P. and Campanella, R.G. (1989), “Design oflaterally loaded driven piles using the flat dilatometer”, Geotech. Test. J., 12(1), 30-38.
Rollins, K., Peterson, K. and Weaver, T. (1998), “Lateral load behavior of full-scale pile group in clay”, J. Geotech. Geoenviron. Eng., ASCE, 124(6), 468-478.
Rollins, K.M., Johnson, S.R., Petersen, K.T. and Weaver, T.J. (2003), “Static and dynamic lateral load behavior of pile groups based on full-scale testing”, Proceedings of the 13th International Offshore and Polar Engineering Conference, Honolulu, Hawaii, USA, May.
Schnaid, F. and Houlsby, G.T. (1991), “An assessment of chamber size effects in the calibration of in situ tests in sand”, Géotechnique, 41(3), 437-445.
Skempton, A.W. (1951), “The bearing capacity of clays”, Proceedings, Building Research Congress, Division 1, London, England, Month, pp.180-189.
Stewart, D. and Randolph, M. (1994), “T‐bar penetration testing in soft clay”, J. Geotech. Eng., ASCE, 120(12), 2230-2235.
Teh, C.I. and Houlsby, G.T. (1991), “An analytical study of the cone penetration test in clay”, Géotechnique, 41(1), 17-34.
Titi, H.H., Mohammad, L.N. and Tumay, M.T. (2000), “Miniature cone penetration tests in soft and stiff clays”, Geotech. Test. J., ASTM, 23(4), 432-443.
Tumay, M.T. and Kurup, P.U. (2001), “Development of a continuous intrusion miniature cone penetration test system for subsurface explorations”, Soil. Found., 41(6), 129-138.
Zhang, L., Silva, F. and Grismala, R. (2005), “Ultimate lateral resistance to piles in cohesionless soils”, J. Geotech. Geoenviron. Eng., ASCE, 131(1), 78-83.
GC