cpt “legacy” case histories
TRANSCRIPT

CPT “Legacy” Case Histories
Robb Eric S. Moss, Ph.D., P.E., F.ASCE
PEER NGL Sept 2018 UCLA

Previous PEER Funded Work:
SPT, CPT, VS
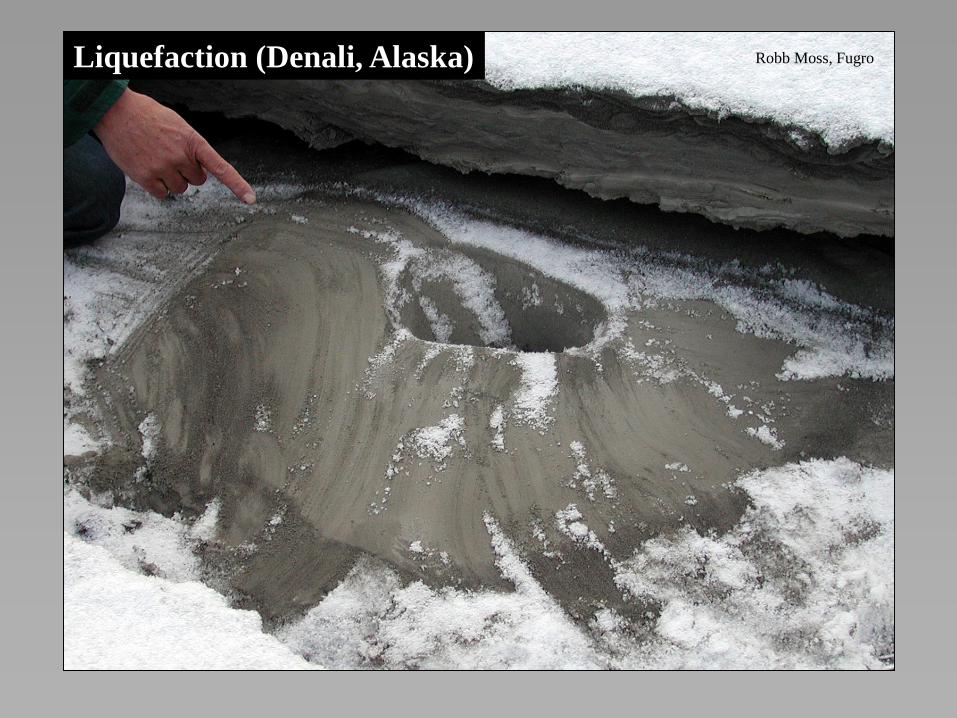
Robb Moss, FugroLiquefaction (Denali, Alaska)

Robb Moss, FugroLateral Spreading (Bhuj, India)

I. M. Idriss
Foundation Failure (Kocaeli, Turkey)

Robb Moss, Fugro
Dam Failure (Bhuj, India)

“Lifelines” Failure (Denali, Alaska)
Robb Moss, FugroRobb Moss, Fugro

1. Assessment of the likelihood of “triggering”
or initiation of soil liquefaction.
2. Assessment of post-liquefaction strength and
overall post-liquefaction stability.
3. Assessment of expected liquefaction-induced
deformations and displacements.
4. Assessment of the consequences of these
deformations and displacements.
5. Implementation (and evaluation) of engineered
mitigation, if necessary.
Key Elements of Soil Liquefaction Engineering

Evaluation of In Situ Resistance to
Triggering of Cyclic Liquefaction
Two Basic Approaches:
1. Laboratory Testing
2. In Situ Index Testing
-SPT
-CPT
-Vs
-BPT
-others

LEGACY EVENTS EVALUATED:
1999 Kocaeli, Turkey
1999 Chi-Chi, Taiwan
1995 Dinar, Turkey
1995 Kobe, Japan
1994 Northridge, USA
1992 Erzincan, Turkey
1989 Loma Prieta, USA
1988 Saguenay, Canada
1987 Edgecumbre, New Zealand
1987 Superstition Hills, USA
1987 Elmore Ranch, USA
1983 Nihonkai-Chubu, Japan
1983 Borah Peak, USA
1981 Westmorland, USA
1980 Mexicali, Mexico
1979 Imperial Valley, USA
1977 Vrancea, Romania
1976 Tangshan, China
1975 Haicheng, China
1971 San Fernando, USA
1968 Inanguahua, New Zealand
1964 Niigata, Japan
Data Source

Moss (2003) - worldwide CPT database
• 139 liquefied and
• 43 nonliquefied cases recorded from
• 18 different earthquakes spanning 5 decades.
Reinvestigations of:
• 1979 Imperial Valley, 1981 Westmoreland, 1987
Superstition Hills (Moss et al. 2005)
• 1976 Tangshan (Moss et al., 2011)
Total = 146 + 54
Objective vs. Subjective - gray areas and nuances and
correlations and ….
LEGACY SUMMAY

river sand dune sand

What constitutes a “Good” case history:
• detailed observations of ground failure or non-failure
that is both relative and global
• well quantified ground shaking (low CoV)
• well quantified water table (other than CPTu)
• modern CPT measurements (non-trivial in other countries)
• multiple measurements of critical layer(s)
• co-located with SPT and VS (downhole)
• consideration of spatial variability/correlation
• other: ageing, thin/thick layer, deformations, severity, timing,
confining layer, fines/plasticity, …

Earthquake: 1989 Loma Prieta
Magnitude: Ms=7.1
Location: Alameda Bay Farm Island (Dike Location)
References: Mitchell et al. (1994), Kayen & Mitchell (1997)
Nature of Failure: No failure, DDC improved site.
Comments: Western portion consists of sandy Hydraulic fill, underlain by bay mud
and deeper stiffer soil.
Liquefaction occurred along the western and northern sections of
the island.
Deep Dynamic Compaction was performed in the western perimeter
dike to prevent liquefaction.
PGA was recorded at 0.27 & 0.21 at the Alameda Naval Air Station.
Correlated with SPT from Cetin et al. (2000)
Corrected water table from 97 reference.
Summary of Data:
Stress Strength
Liquefied N
Data Class Soil Class SP-SM
Critical Layer (m) 5 to 6 D50 (mm) 0.28
Median Depth (m) 5.50 %Fines 7
st.dev. 0.17 %PI
Depth to GWT (m) 2.50
st.dev. 0.30
v (kPa) 103.75 qc (MPa) 7.10
st.dev. 4.23 st.dev. 2.70
v' (kPa) 74.32 fs (kPa) 152.37
st.dev. 3.56 st.dev. 25.35
amax (g) 0.24 norm. exp. 0.34
st.dev. 0.02 Cq, Cf 1.11
rd 0.95 Cthin 1.00
st.dev. 0.09 fs1 (kPa) 168.54
Corrected Magnitude 7.00 st.dev. 28.04
st.dev. 0.12 qc1 (MPa) 7.85
CSReq 0.16 st.dev. 2.98
st.dev. 0.03 Rf1(%) 2.15
C.O.V.CSR 0.15 stdev 0.89
Case History Statistics
(layer specific)

0
0.1
0.2
0.3
0.4
0.5
0.6
0 5 10 15 20
qc,1 (MPa)
CS
R
Parameter Uncertainty

Class A
1. Original CPT trace with qc and fs/Rf, using a ASTM D3441 & D5778 spec. cone.
2. No thin layer correction required
3. CSR 0.20
Class B
1. Original CPT trace with qc and fs/Rf, using a ASTM D3441 & D5778 spec. cone.
2. Thin layer correction required.
3. 0.20 < CSR 0.35
Class C
1. Original CPT trace with qc and fs/Rf, but using a non-standard cone (e.g. Chinese cone or
mechanical cone).
2. No sleeve data but FC 5% (i.e. “clean” sand).
3. 0.35 < CSR 0.50
Class D
1. Not satisfying the criteria for Classes A, B, or C.
Data Screening and Vetting
Expert Panel Review

0
0.1
0.2
0.3
0.4
0.5
0.6
0 5 10 15 20 25 30
qc,1
CS
R
Data points
passing the
screening and
vetting process
(class A,B, & C)
Data

Equivalent Clean Sand
Mw=7.5 v’=1 atm
Modeling
0
0.1
0.2
0.3
0.4
0.5
0.6
0 5 10 15 20
qc,1 (MPa)
CS
R*
80% 20%
PL=95% 50% 5 %


Ticino Sand, Baldi et al. (1981) Olsen (1995)
NORMALIZATION

Olsen & Mitchell (95)
ca
q
'
PC
v
s
v
af
'
PC
qcc,1 Cqq
fss,1 Cff
Field and Lab Data

Theoretical
Approaches for
Predicting Cone
and/or Sleeve
Resistance
• Bearing Capacity
• Cavity Expansion
• Strain Path
• Steady State
• Discrete Element
Calibrated and
Utilized to Predict
Resistance as a
Function of Pressure
and Dr, Ko, and
OCR.

0 .1
1
1 0
1 0 0
0 .1 1 1 0
R f (% )
qc
,1 (
MP
a)
Ladanyi & Johnston (74) analytical
solution with Yu (2000) numerical
FEM generated cavity limit pressure.
Monterey sand used as model soil.
Dr=0.30 c=0.51
Dr=0.45 c=0.50
Cao et al. (2001) analytical MCC
solution. CL/CH used as model soil.
OCR=30 c=0.94
Yu (2000) analytical solution.
CL/CH used as model soil.
OCR=1.0 c=1.00
Salgado & Randolf (2001)
numerical FEM cavity limit
pressure and stress rotation for tip
resistance. Monterey sand used
as model soil.
Dr=0.75 c=0.45
Dr=0.95 c=0.38
Boulanger (2002) analytical results for
high overburden stress (v’>4 atm)
CSR =0.6 Dr=0.75-0.85 c=0.37-0.46
Cavity Expansion Summary
Theoretical
Results

2
3
1
f
f
f
Rfc
where 2
11x
cqxf
)( 3122 yqyf y
c
1))10(log(3
zqcabsf
1.000.75
0.55
0.35
Olsen & Mitchell (1995)
Proposed Tip Exponent
Iterative
Normalization
Procedure
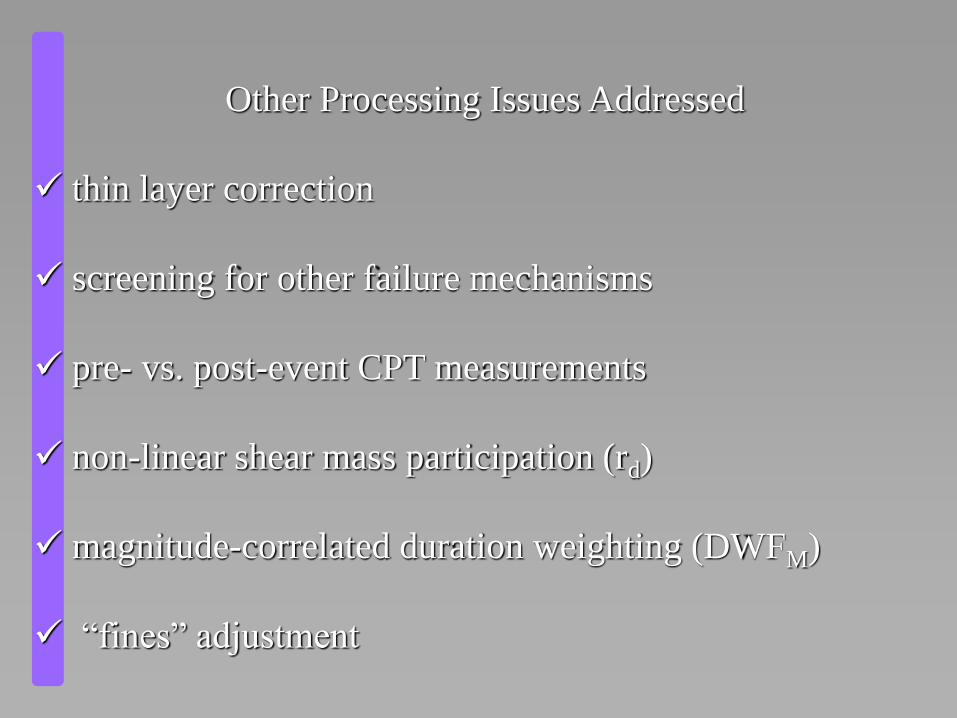
Other Processing Issues Addressed
thin layer correction
screening for other failure mechanisms
pre- vs. post-event CPT measurements
non-linear shear mass participation (rd)
magnitude-correlated duration weighting (DWFM)
“fines” adjustment

Reliability = f(“Load” vs. “Resistance”)
Cone Penetration Test
d
v
v
v
avgr
g
uCSR
max65.0
Uniform Cyclic Stress Ratio
PROBABILISTIC METHODOLOGY

Basic Limit-State Model
)ln(),(ˆ 1,1, CSRqCSRqg cc
Model Parameters
211,1, )ln(),,(ˆ CSRqCSRqg cc
Optimized Model
Safe Set
g(x)>0
Fail Set
g(x)0
Limit-State
Surface
g(x)=0
f(x) contours
Pf
x1
x2
76543211, )'ln()ln()ln()1()1()1( vwfffc MCSRRcRRqg

Accounting for Parameter Uncertainty
)ln()ln( CSReCSRS ),0( )ln()ln( CSRCSR Ne
),0( 11 cc qq Ne
),,(ˆ),,,( SQgSQg
11 cqc eqQ
Accounting for Model Error
),,(ˆ),,,( 11 CSRqgCSRqg cc ),0( N

Posterior distribution
Likelihood function
Prior distribution (non-informative)
Normalizing constant
Application -- Estimating Model Parameters
BAYESIAN UPDATING
)()()( pLcf
)(f
1)]()()([ dpLc
)(L
)(p
Bayes’ Rule

Model Formulation and
Parameter Estimation Techniques
•Bayesian Updating
• Artificial Neural Networks
• System Identification
Information PredictionPhysics
Information Prediction

RELIABILITY ANALYSIS
probability of liquefaction = summation of the
probabilities of all possible combinations
of parameters that will define liquefaction
MVFOSM
FORM
SORM
Monte Carlo Simulation
dddfSQgPSQg
),()(0),,(ˆ0),,(ˆ

Equivalent Clean Sand
Mw=7.5 v’=1 atm
CORRELATION
0
0.1
0.2
0.3
0.4
0.5
0.6
0 5 10 15 20
qc,1 (MPa)
CS
R*
80% 20%
PL=95% 50% 5 %

0
0.1
0.2
0.3
0.4
0.5
0.6
0 5 10 15 20
qc,1,mod (MPa)
CS
R*
80% 20%
PL=95% 50% 5 %
x
Robertson & Wride (1998)
Shibata & Teparaska (1988)
Toprak et al. (1999) PL=50%
Juang et al. (2003) PL=50%
Comparison with other
studies (deterministic
and probabilistic)
qc,1,mod=qc,1+ qc,1

“Fines” Adjusted
Mw=7.5 v’=1 atm
PL=20%
Note: Rf 0.5%
is an equivalent
clean sand
0
0.1
0.2
0.3
0.4
0.5
0.6
0 5 10 15 20
qc,1,mod (MPa)
CS
R*
Rf= 5% 2% 0.5%
qc=4.2 1.7 0
Rf= 5% 2% 0.5%
qc=4.2 1.7 0

qc,1,mod=qc,1+ qc,1
qc,1,cs=Kcqc,1
Robertson’s correction
Proposed correction
0.1
1
10
100
0.1 1 10
Rf (%)
qc
,1 (
Mp
a)
qc =0qc =1.7
qc =4.2
Ic=1.30
Kc=1.0
Ic=1.64
Kc=1.0
Ic=2.36
Kc=2.14
Ic=2.60
Kc=3.31
KC=1.0

0
0.1
0.2
0.3
0.4
0.5
0.6
0 5 10 15 20 25
qc,1,mod
CS
R
Rf<0.5%
Suzuki et al. 1995
1.0%>Rf>0.5%
Robertson & Wride 1997
Ic=2.59
Ic=2.07
Ic=1.64
Rf=5% 2% 0.5%
“Fines” Adjusted
PL=20%
Mw=7.5
v’=1 atm
Note: Rf 0.5%
is an equivalent
clean sand
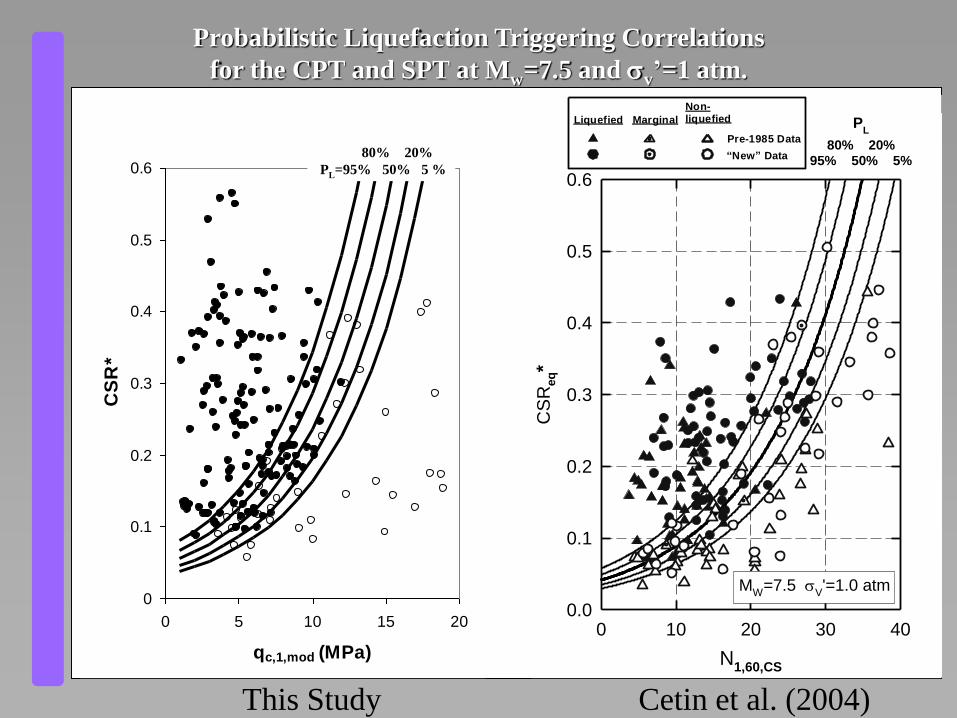
Probabilistic Liquefaction Triggering Correlations
for the CPT and SPT at Mw=7.5 and v’=1 atm.
0
0.1
0.2
0.3
0.4
0.5
0.6
0 5 10 15 20
qc,1,mod (MPa)
CS
R*
80% 20%
PL=95% 50% 5 %
N1,60,CS
0 10 20 30 40
CS
Req*
0.0
0.1
0.2
0.3
0.4
0.5
0.6
MW
=7.5 V'=1.0 atm
PL
80% 20%95% 50% 5%
Liquefied Marginal
Non-liquefied
Pre-1985 Data
“New” Data
Cetin et al. (2004)This Study

Deterministic Liquefaction Triggering Correlations
for the CPT and SPT at Mw=7.5 and v’=1 atm.
Cetin et al. (2004)
0
0.1
0.2
0.3
0.4
0.5
0.6
0 5 10 15 20
qc,1,mod (MPa)
CS
R*
Rf= 5% 2% 0.5%
qc=4.2 1.7 0
Rf= 5% 2% 0.5%
qc=4.2 1.7 0
N1,60
0 10 20 30 40
CS
Req*
0.0
0.1
0.2
0.3
0.4
0.5
0.6FC >35% 15% <5%
MW
=7.5 V'=1.0 atm
Liquefied Marginal Non-liquefied
“Old” Data (Pre-1985)
“New” Data
FC 5%FC 15%FC 35%
~~
This Study