cptu-based settlement modelling for kujala test
TRANSCRIPT

This is an electronic reprint of the original article.This reprint may differ from the original in pagination and typographic detail.
Powered by TCPDF (www.tcpdf.org)
This material is protected by copyright and other intellectual property rights, and duplication or sale of all or part of any of the repository collections is not permitted, except that material may be duplicated by you for your research use or educational purposes in electronic or print form. You must obtain permission for any other use. Electronic or print copies may not be offered, whether for sale or otherwise to anyone who is not an authorised user.
Löfman, Monica; Korkiala-Tanttu, LeenaCPTU-based settlement modelling for Kujala test embankments on overconsolidated siltyclay: A probabilistic approach
Published in:IOP Conference Series: Earth and Environmental Science
DOI:10.1088/1755-1315/710/1/012070
Published: 26/04/2021
Document VersionPublisher's PDF, also known as Version of record
Published under the following license:CC BY
Please cite the original version:Löfman, M., & Korkiala-Tanttu, L. (2021). CPTU-based settlement modelling for Kujala test embankments onoverconsolidated silty clay: A probabilistic approach. IOP Conference Series: Earth and Environmental Science,710(1), [012070]. https://doi.org/10.1088/1755-1315/710/1/012070

IOP Conference Series: Earth and Environmental Science
PAPER • OPEN ACCESS
CPTU-based settlement modelling for Kujala test embankments onoverconsolidated silty clay: A probabilistic approachTo cite this article: M S Löfman and L K Korkiala-Tanttu 2021 IOP Conf. Ser.: Earth Environ. Sci. 710 012070
View the article online for updates and enhancements.
This content was downloaded from IP address 130.233.191.212 on 27/04/2021 at 12:25

Content from this work may be used under the terms of the Creative CommonsAttribution 3.0 licence. Any further distributionof this work must maintain attribution to the author(s) and the title of the work, journal citation and DOI.
Published under licence by IOP Publishing Ltd
18th Nordic Geotechnical MeetingIOP Conf. Series: Earth and Environmental Science 710 (2021) 012070
IOP Publishingdoi:10.1088/1755-1315/710/1/012070
1
CPTU-based settlement modelling for Kujala test embankments on overconsolidated silty clay: A probabilistic approach
M S Löfman and L K Korkiala-Tanttu
Department of Civil Engineering, Aalto University, Rakentajanaukio 4, 02150 Espoo, Finland.
E-mail: [email protected]
Abstract. Sounding resistance, such as CPTU cone tip resistance, is often used to estimate the settlement of the subsoil when designing ground-supported structures. This paper utilizes CPTU-based probabilistic modelling to estimate the settlement of two test embankments located in Finland. The model is based on an empirical correlation between CPTU net cone resistance and constrained modulus (M0), described by factor α. Besides the existing correlation (prior distribution of α), this paper also considers the site-specific observations via Bayes’ theorem. By means of Monte Carlo simulation, the settlement histograms were produced and the results compared to the observed settlements. Lastly, the effect of dry crust on the embankment load transmission was considered in order to decrease the model bias. The results indicate that for the other embankment the effect of dry crust has to be considered in order to acquire satisfactory results. It is concluded that this CPTU-based settlement model might be suitable for stiff, overconsolidated silty clay soils in Finland. However, model calibration using site-specific oedometer test data is recommended. On the other hand, such simplified model with a singular modulus should not be used for normally consolidated clay subsoils.
1. Introduction Recently, cone penetration tests with pore pressure measurement (CPTUs) are increasingly utilized in soil characterization. Accordingly, many researchers have suggested empirical correlations (i.e., transformation models) linking the constrained modulus to CPTU tip resistance (e.g., [1,2]). Since the oedometer tests on soil samples represent only a small portion of the subsoil, and may be subject to disturbance effects, the CPTU-based estimation of compressibility properties may provide more reliable and accurate results [3]. Despite its potential usefulness, CPTU-based settlement estimation is very rarely used in Finland. CPTU-based settlement modelling in Finnish soil conditions has been studied in a few master theses; for instance, according to Toikka’s [4] study the settlement estimates based on cone tip resistance were quite close to the observed settlements at four silty subsoil sites in Lahti, Finland.
This paper aims to evaluate the suitability of such CPTU-based settlement modelling for Kujala test embankments located in Lahti, Finland. At these test embankments, the observed settlements of the overconsolidated (OC) silty clay subsoil were very small, indicating that most of the compression occurs at OC state. Hence, a singular modulus (M0) estimated from CPTU cone tip resistance could be used to acquire a preliminary estimate of the total settlement. However, since the empirical correlation between modulus and cone resistance is characterized by notable transformation uncertainty, a probabilistic

18th Nordic Geotechnical MeetingIOP Conf. Series: Earth and Environmental Science 710 (2021) 012070
IOP Publishingdoi:10.1088/1755-1315/710/1/012070
2
approach is applied in order to consider the underlying uncertainty in a more robust manner (e.g., Phoon [5]). By means of Monte Carlo simulations, this paper aims to evaluate the reliability and accuracy of this CPTU-based preliminary settlement modelling for Kujala test embankments. Lastly, the probabilistic model is utilized to calibrate the embankment load distribution altered by the thick dry crust topsoil.
2. Correlations for constrained modulus Constrained modulus M is defined as the change in effective vertical stress σv’ divided by the change in vertical strain εv. In the case of clay compressibility, the constrained modulus is nonlinear and stress-dependent. In Swedish practice (e.g., Larsson [6]), the constrained modulus at in-situ stress state (σ’v0) is referred to as M0 modulus. It is defined from the initial part of stress-modulus -curve from constant rate of strain (CRS) oedometer test. This modulus M0 is used to calculate the strains during the stress increase from effective in-situ stress σ’v0 to the preconsolidation pressure σ’p. In the case of Scandinavian clays, such strain within the overconsolidated stress state is usually in the scale of 3-5 % (e.g., [6,7]).
The empirical correlation between in-situ stress constrained modulus M and CPT cone tip resistance has been studied by many researchers (e.g., [1–3,8–11]). In this transformation model, the constrained modulus can be taken as the in-situ (initial) modulus M0 [12], thus giving equation (1) for the correlation:
𝑀 ≈ 𝛼(𝑞 − 𝜎 ) = 𝛼𝑞 (1) In which qt is the corrected cone tip resistance, σv0 is the total in-situ stress, qnet is the net cone tip resistance and α is the constant (correlation factor). However, it should be noted that some of the established correlations link the modulus to the measured cone tip resistance qc instead of qnet.
Various suggestions for the value of factor α has been given for different soils. Mayne [2] collected a diverse group of soils ranging from sands, silts, organic clays and intact inorganic clays (see figure 3). Based on this summary, Mayne [2] suggested some representatives values for α factor: α≈5 for soft to firm ”vanilla clays” and normally consolidated “hourglass sands”, α≈1-2 for organic plastic Swedish clays and α≈10-20 for cemented clay. In this data, α=28 is the maximum value (OC Ticino sand).
Regarding clays in Finland, Di Buò et al. [12] concluded (based on five clay sites in Finland) that α=5-10 captured majority of the data points. However, the authors emphasize that α=10 captured the mean trend of the sites that were characterized by the highest sample quality. However, it should be noted that the Finnish clays studied by Di Buò et al. [12] were all very soft; the range of reported qnet values was only 50-250 kPa. Toikka [4] studied the correlation with the measured cone tip resistance qc for Lahti silty soil, and found the factor α to vary between 2 and 10 with mean value around α=5. The tip resistance in Toikka’s data varied between 200 kPa and 5000 kPa.
Besides CPTU, other sounding methods have also been used to estimate the constrained modulus. In Swedish practice (e.g., Larsson [6]), the initial constrained modulus M0 for clays is often estimated from empirical correlations utilizing undrained shear strength su (M0=250su) or preconsolidation pressure σ’p (M0=50σ’p). Other common transformation models include the correlation between N value of standard penetration test (SPT) and modulus, but this correlation for clays is not very strong (e.g., [11]).
3. Probabilistic settlement model
3.1. Dimensions and settlement monitoring at the test embankments Kujala test embankments were built as a part of Kujala interchange construction works, a subproject related to Lahti Southern Ring Road highway project in Finland. This paper uses the term “test embankment” to refer to the test fills constructed during the geotechnical design phase. These two test fills, located 250 meters from each other, remained as the final ramp embankments connected to an interchange bridge. The remaining road structures adjacent to the test fills were constructed at the end of the monitoring period. In the following sections, the higher test embankment (test fill) will be referred to as “Kujala-5” and the lower as “Kujala-4”.
18th Nordic Geotechnical MeetingIOP Conf. Series: Earth and Environmental Science 710 (2021) 012070
IOP Publishingdoi:10.1088/1755-1315/710/1/012070
3
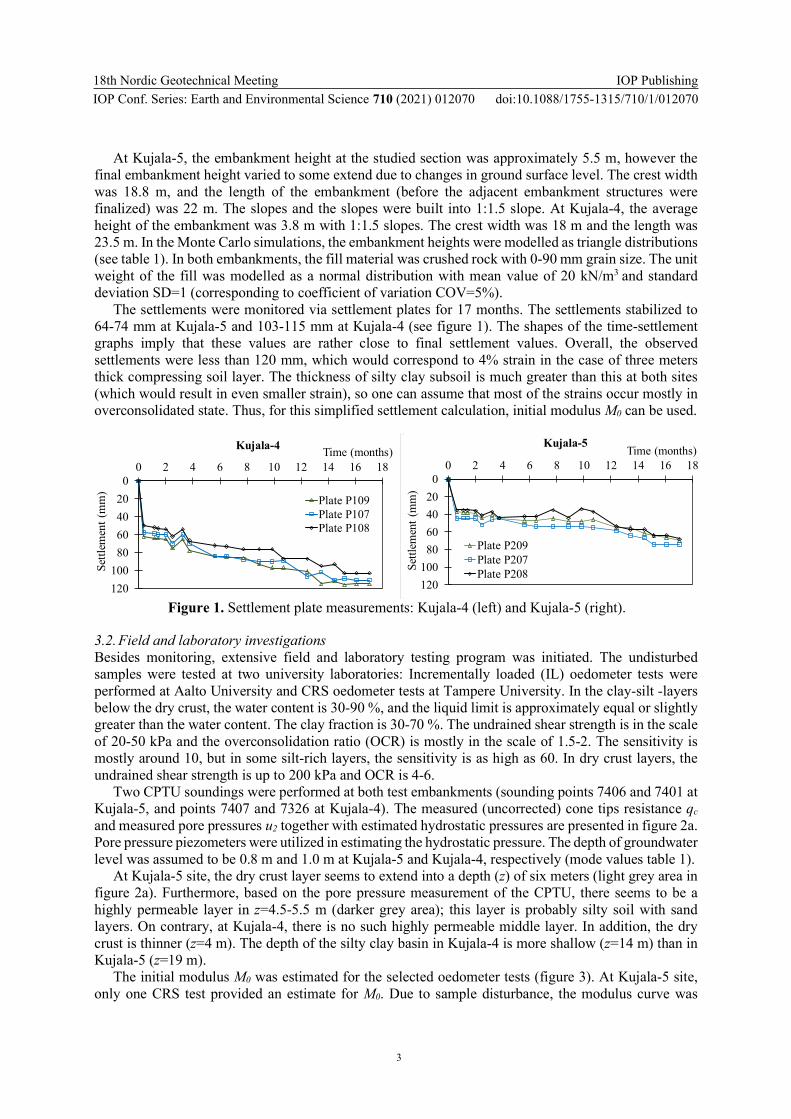
At Kujala-5, the embankment height at the studied section was approximately 5.5 m, however the final embankment height varied to some extend due to changes in ground surface level. The crest width was 18.8 m, and the length of the embankment (before the adjacent embankment structures were finalized) was 22 m. The slopes and the slopes were built into 1:1.5 slope. At Kujala-4, the average height of the embankment was 3.8 m with 1:1.5 slopes. The crest width was 18 m and the length was 23.5 m. In the Monte Carlo simulations, the embankment heights were modelled as triangle distributions (see table 1). In both embankments, the fill material was crushed rock with 0-90 mm grain size. The unit weight of the fill was modelled as a normal distribution with mean value of 20 kN/m3 and standard deviation SD=1 (corresponding to coefficient of variation COV=5%).
The settlements were monitored via settlement plates for 17 months. The settlements stabilized to 64-74 mm at Kujala-5 and 103-115 mm at Kujala-4 (see figure 1). The shapes of the time-settlement graphs imply that these values are rather close to final settlement values. Overall, the observed settlements were less than 120 mm, which would correspond to 4% strain in the case of three meters thick compressing soil layer. The thickness of silty clay subsoil is much greater than this at both sites (which would result in even smaller strain), so one can assume that most of the strains occur mostly in overconsolidated state. Thus, for this simplified settlement calculation, initial modulus M0 can be used.
Figure 1. Settlement plate measurements: Kujala-4 (left) and Kujala-5 (right).
3.2. Field and laboratory investigations Besides monitoring, extensive field and laboratory testing program was initiated. The undisturbed samples were tested at two university laboratories: Incrementally loaded (IL) oedometer tests were performed at Aalto University and CRS oedometer tests at Tampere University. In the clay-silt -layers below the dry crust, the water content is 30-90 %, and the liquid limit is approximately equal or slightly greater than the water content. The clay fraction is 30-70 %. The undrained shear strength is in the scale of 20-50 kPa and the overconsolidation ratio (OCR) is mostly in the scale of 1.5-2. The sensitivity is mostly around 10, but in some silt-rich layers, the sensitivity is as high as 60. In dry crust layers, the undrained shear strength is up to 200 kPa and OCR is 4-6.
Two CPTU soundings were performed at both test embankments (sounding points 7406 and 7401 at Kujala-5, and points 7407 and 7326 at Kujala-4). The measured (uncorrected) cone tips resistance qc and measured pore pressures u2 together with estimated hydrostatic pressures are presented in figure 2a. Pore pressure piezometers were utilized in estimating the hydrostatic pressure. The depth of groundwater level was assumed to be 0.8 m and 1.0 m at Kujala-5 and Kujala-4, respectively (mode values table 1).
At Kujala-5 site, the dry crust layer seems to extend into a depth (z) of six meters (light grey area in figure 2a). Furthermore, based on the pore pressure measurement of the CPTU, there seems to be a highly permeable layer in z=4.5-5.5 m (darker grey area); this layer is probably silty soil with sand layers. On contrary, at Kujala-4, there is no such highly permeable middle layer. In addition, the dry crust is thinner (z=4 m). The depth of the silty clay basin in Kujala-4 is more shallow (z=14 m) than in Kujala-5 (z=19 m).
The initial modulus M0 was estimated for the selected oedometer tests (figure 3). At Kujala-5 site, only one CRS test provided an estimate for M0. Due to sample disturbance, the modulus curve was
0
20
40
60
80
100
120
0 2 4 6 8 10 12 14 16 18
Settl
emen
t (m
m)
Time (months)Kujala-4
Plate P109Plate P107Plate P108
0
20
40
60
80
100
120
0 2 4 6 8 10 12 14 16 18
Settl
emen
t (m
m)
Time (months)Kujala-5
Plate P209Plate P207Plate P208

18th Nordic Geotechnical MeetingIOP Conf. Series: Earth and Environmental Science 710 (2021) 012070
IOP Publishingdoi:10.1088/1755-1315/710/1/012070
4
almost a straight line for many silty samples. (In fact, a sample quality criteria based on the ratio of the peak initial modulus to the smallest modulus after the peak has been proposed due to this phenomena [7].) The incrementally loaded oedometer tests were of better quality, but the determination of M0 is more unreliable due to the lack of continuous stress-strain curve. The value of factor α was calculated considering the net cone resistance at the same depth. Observed minimum α is 6 and maximum is α=23.5. At Kujala-4, the initial modulus M0 could be estimated for one oedometer test only; CRS test in the depth of z=10.4 m with α=4. However, since the distance between the sites was only 250 m, one can assume that the α values defined for both Kujala sites represent the same “site-specific” transformation model.
Figure 2a. Measured cone tip resistances qc and pore pressures u2 at the test embankments.
Figure 2b. Net cone resistance (qnet) and unit weight (γ) profiles used in the settlement calculation.
3.3. Probabilistic transformation model for constrained modulus (prior α) The probabilistic transformation model (α factor) for M0 was defined first based on the data collected by Mayne [2]. This “prior distribution” for α was defined by visual fitting. A lognormal distribution with mean μ=9 and standard deviation SD=5.5 (COV=61 %) was selected as the prior distribution based on its upper and lower 95 % confidence limits (2.55 and 23.17); as shown in figure 3, almost all
0
2
4
6
8
10
12
14
16
18
20
0 200 400 600 800
Kujala-5
0
2
4
6
8
10
12
14
16
18
20
0 1 2 3
Dep
th z
(m
)
Measured cone resistance qc (MPa)
Kujala-5
0
2
4
6
8
10
12
14
16
18
20
0 200 400 600 800
Kujala-4
0
2
4
6
8
10
12
14
16
18
20
0 1 2 3
Dep
th z
(m)
Axis Title
Kujala-4Kujala-5 Kujala-4qc (MPa) u2 (kPa) qc (MPa) u2 (kPa)
p7406 p7401 Hydrostatic pressure p7407 p7326 Hydrostatic pressure
0
2
4
6
8
10
12
14
16
18
20
15 16 17 18 19 20
Kujala-4
0
2
4
6
8
10
12
14
16
18
20
0 1000 2000 3000
Dep
th z
(m)
Net cone resistance qnet (kPa)Kujala-5
Measured Model
0
2
4
6
8
10
12
14
16
18
20
15 16 17 18 19 20
Kujala-5
0
2
4
6
8
10
12
14
16
18
20
0 1000 2000 3000
Dep
th z
(m
)
Net cone resistance qnet (kPa)Kujala-4
Measured Model
qnet (kPa) γ (kN/m3) qnet (kPa) γ (kN/m3)Kujala-5 Kujala-4
Measured20
SelectedModelMeasured20
SelectedModel

18th Nordic Geotechnical MeetingIOP Conf. Series: Earth and Environmental Science 710 (2021) 012070
IOP Publishingdoi:10.1088/1755-1315/710/1/012070
5
the prior data is within these limits (except for organic plastic clays, which were considered irrelevant for Kujala subsoil conditions). The first Monte Carlo simulations were performed using this prior α.
However, when site-specific data is available, the distribution of global α values can be updated via Bayes’ theorem (e.g., [13]) to acquire a posterior distribution marked with less uncertainty. In other words, the prior distribution of α based on global data (Mayne [2]) was combined with the site-specific observations (observed α at both Kujala sites). The mean value of 12 site-specific α factors was μ=11.7 (SD=5.1, COV=44%). The updated, posterior lognormal distribution for α has a mean value of μ=10.7 and SD=1.23. This corresponds to a much smaller COV=11 %.
Figure 3. Correlation between the net cone resistance and constrained modulus (data after Mayne [2]).
Figure 4. Definition of modulus M0 for the Kujala-5 samples.
3.4. Probabilistic settlement modelling (Monte Carlo simulation) For the settlement analysis, one CPTU profile was selected for each test embankment (marked with black line in figure 2a). Only one was selected since there was very little difference between the two CPTUs at each site. At Kujala-4, point 7326 was right below the embankment and therefore selected. At Kujala-5, point 7401 was closer to two settlement plates with consistent measurements (64 mm and 66 mm) and thus selected. Figure 2b presents the net cone resistances and the unit weight profile of both embankments. The unit weigh values in dry crust layer were estimated from the water content of disturbed samples. The CPTU measurements were made every 2 cm, but for the analysis, the mean value of 10 cm section was used (“Model” in figure 2b). However, it should be noted that in the settlement analysis, the mean value of corrected cone resistance (instead of net value) was used in order to account for the uncertainty related to the total in-situ stress (or rather, the unit weight of soil).
The corrected cone resistance qt was modelled as a random variable as well via an error term εqt applied to its measured value (qt_measured) as defined in equation (2):
𝑞 = 𝑞 _ 휀 (2) The distribution for the error term εqt was a lognormal distribution with mean value of 1 and COV = 8 %, based on the average COV observed by Phoon and Kulhawy [14] regarding the inherent variability of corrected cone tip resistance qt. Parameters for all random variables are listed in table 1.
The inherent variability of subsoil unit weight was modelled in a similar manner, with normally distributed error term εγ with COV = 5 % applied to the mean value (figure 2b, “Model”). The value of COV was selected as a cautious estimate based on observations by Löfman and Korkiala-Tanttu [15]: the range of inherent variability of unit weight of soil (for Finnish clays and silts) was COV = 1-4 %.
Con
stra
ined
mod
ulus
M(M
Pa)
α factors: 27
0,1
1
10
100
1000
0,1 1 10 100
27
Upperlimit
9
5
Organic plastic clays
Intact clays
Sands
Net cone tip resistance qnet (MPa)
Con
stra
ined
Mod
ulus
M(M
Pa)
27
23.17
9
5
2.55
Kujala 0
1
2
3
4
5
6
7
8
0 200 400 600 800 1000 1200
Con
stra
ined
mod
ulus
M(M
Pa)
Vertical effective stress σv' (kPa)
5m
10m
8.8m
8.6m
9.4 m
Peak modulus = M0

18th Nordic Geotechnical MeetingIOP Conf. Series: Earth and Environmental Science 710 (2021) 012070
IOP Publishingdoi:10.1088/1755-1315/710/1/012070
6
The Monte Carlo simulation was performed using the @RISK software, an add-in for Microsoft® Excel [16]. The adopted sampling method was Latin Hypercube sampling. The number of simulations was 50 000, and the random variables were assumed to be independent. The variance reduction due to averaging was not considered (variance reduction factor was assumed to be 1) because the settlements were calculated for each 100 mm section. In other words, the averaging length is less than the vertical autocorrelation length θ (for qt, Phoon and Kulhawy [14] found θ=0.2-0.5 m); hence, the variance reduction factor can be taken as 1 (e.g., [17]). Table 1. Random variable parameters in the Monte Carlo simulation.
Parameter description Symbol Distribution type Min Modea Mean Max SDb COVc
Error term for cone resistance qt
εqt Lognormal 0 0.991 1.0 +∞ 0.080 8.0 %
Net cone resistance qnet of the top soil (kPa)
qnet_top soil Triangle 1500 3000 3000 4500 612.4 20 %
Error term for unit weight γ εγ Normal -∞ 1.0 1.0 +∞ 0.050 5.0 %
Factor α for modulus M0 αprior Lognormal 0 5.591 9.0 +∞ 5.500 61 %
αposterior Lognormal 0 10.52 10.73 +∞ 1.230 11 %
Groundwater depth (m) GWKujala-5 Triangle 0.6 0.8 0.867 1.2 0.125 14 % GWKujala-4 Triangle 0.3 1.0 1.0 1.7 0.286 29 %
Unit weight of the fill material (kN/m3)
γfill Normal -∞ 20 20 +∞ 1.000 5 %
Embankment height (m) HKujala-5 Triangle 5.3 5.5 5.5 5.7 0.0817 1.5% HKujala-4 Triangle 3.6 3.8 3.8 4.0 0.0817 2.2 %
a The value that appears most often (i.e., the most frequent value). b Standard deviation. c Standard deviation divided by the mean (∙100 %).
3.5. Modelling of the embankment load and the effect of dry crust The first analyses (section 4.1) were conducted using the vertical load component of the embankment load ([18]) in the middle line of the embankment. Almost identical load distribution (in the middle of the embankment) is acquired by applying an rectangular vertical loading ([18]). In these first analyses, higher stiffness of the dry crust layer was considered via higher cone resistance (qnet_top soil in table 1), but its possible effects on the embankment load distribution was not modelled.
In sections 4.2 and 4.3 however, the effect of a stiffer dry crust layer on the load distribution is studied via Odemark’s [19] method, also known as the equivalent thickness method. In this method, the upper layer’s thickness (h) is transformed into an equivalent thickness which corresponds to the Young’s modulus E2 of the deeper (less stiff) layer via equation (3) [19,20]:
ℎ = 𝛿( )
( )ℎ ≈ 0.9 ℎ (3)
E1 is the upper layer’s Young’s modulus (E1>E2), ν1 and ν2 are the Poisson’s ratios of upper and deeper layers, respectively. Correction factor δ can be taken as 0.9 [20] and if the Poisson’s ratios are assumed equal, the equation simplifies into the latter form, which was used in the analyses. The equivalent thickness he is then used to define the modified depth z’ according to equations (4a) and (4b) [20]:
𝑧 = 𝑧 , 𝑤ℎ𝑒𝑛 𝑧 ≤ ℎ (4a)
𝑧 = 𝑧 + 𝑧 − ℎ , 𝑤ℎ𝑒𝑛 𝑧 > ℎ (4b)

18th Nordic Geotechnical MeetingIOP Conf. Series: Earth and Environmental Science 710 (2021) 012070
IOP Publishingdoi:10.1088/1755-1315/710/1/012070
7
The modified depth z’ is then used to calculate the embankment load (modelled as rectangular vertical loading) in order to acquire the “corrected” vertical load at real depth z from the ground surface. Examples of this correction are presented in section 4.2.
For Kujala-5, the selected value for upper layer thickness was h = 6 m (see figure 2a). Besides the dry crust clay layer, this thickness includes the permeable (and probably stiff) sandy silt intermediate layer as well. In the case of Kujala-4, h = 4 m was estimated to be suitable. Since there is no CPTU data for the uppermost top soil, the ratio E1/E2 was varied. Nevertheless, the possible range for this ratio can be estimated; the net cone resistance in the deeper layers is in the scale of 500 kPa (figure 2b), and the upper layer’s net cone resistance was estimated to lie within the range 1500-4500 kPa (table 1), leading to probable range of E1/E2 =3-9.
4. Results
4.1. Probabilistic settlement analysis with embankment load The Monte Carlo simulation was performed with both prior α and updated, posterior α. According to the produced histograms (probability densities in figures 5 and 6), using the posterior distribution of α (instead of prior) decreases the uncertainty in the settlement prediction greatly (i.e., standard deviation decreases). In the case of Kujala-4, the uncertainty is smaller than at Kujala-5 in both analyses (prior and posterior α); this difference is explained by the fact that the compressing soil layer is thicker in Kujala-5, thus accumulating more sources of uncertainty to the total settlement.
Figure 5. Settlement histogram for Kujala-5 using prior α (left) and posterior α (right).
Figure 6. Settlement histogram for Kujala-4 using prior α (left) and posterior α (right).
In the case of Kujala-4 (figure 6) the calculated and observed settlements are in good agreement in both analyses. In Kujala-5 however, the observed settlement is significantly lower than estimated (outside of
Observed (64-74 mm)
Observed (64-74 mm)
Kujala-5: Settlement with prior α (mm) Kujala-5: Settlement with posterior α (mm)
Observed (103-111 mm)
Observed (103-111 mm)
Kujala-4: Settlement with prior α (mm) Kujala-4: Settlement with posterior α (mm)

18th Nordic Geotechnical MeetingIOP Conf. Series: Earth and Environmental Science 710 (2021) 012070
IOP Publishingdoi:10.1088/1755-1315/710/1/012070
8
90 % confidence limits). Next, the effect of dry crust on the embankment load is taken into account in order to study its effect on the accuracy of the settlement prediction.
4.2. The effect of dry crust: Deterministic analyses The effect of dry crust stiffness was studied by varying the ratio E1/E2. In this analysis, the settlement calculation was deterministic, i.e., the analysis was performed using constant parameters. For each random variable, the most probable (mode) value was used (table 1). For factor α, the posterior value (mode = 10.52) was used. In addition, the settlement was estimated using the highest value α=27 in the prior data (figure 3). The results of these deterministic analyses and examples of the final stresses are presented in figure 7. In the bias calculation, the observations made at the settlement plates situated closest to the selected CPTU profile were used (111 mm for Kujala-4 and 66 mm for Kujala-5). The model bias was defined as the calculated settlement divided by the observed value.
Figure 7. The effect of dry crust stiffness on the model bias (left) and the stress profiles (right). For Kujala-5, the model bias (with α=10.5) with converges closer to the no-bias-line as the stiffness ratio E1/E2 increases. When E1/E2=2, model bias is approximately 3, whereas increase in stiffness ratio to E1/E2=10 decreases the model bias to 2. In other words, the accuracy of the model increases when higher dry crust stiffness is assumed. However, it should be noted that ratios E1/E2 much greater than 9 might not be applicable in actual in-situ conditions due to too large tensile forces [20]. When the maximum value of α is used (α=27), the no-bias-line is met at E1/E2=6-9. Since this stiffness ratio might be more realistic, the actual α that applies to Kujala-5 might be greater than the posterior (c).
For Kujala-4, the model bias decreases below 1 quickly as the stiffness ratio is increased. The initial result (with posterior α=10.5), without any dry crust correction, was already in agreement with the settlement observations (figure 6). Hence, for Kujala-4, taking into account the dry crust stiffness does not increase the model accuracy.
4.3. Calibrated settlement model for Kujala-5 Without the dry crust effect, the observed settlement for Kujala-5 is outside of 90 % confidence limits even when the maximum prior value of α=27 is adopted (figure 8). In other words, it would very unlikely that such small settlements could be caused by the full embankment load. Consequently, in the case of Kujala-5, the effect of dry crust to the embankment load distribution has to be considered.
Therefore, the Monte Carlo simulation is performed again with constant α and with the effect of dry crust. For α, the greatest site-specific value observed was adopted (α=23.5). Similarly, for the dry crust
0
2
4
6
8
10
12
14
16
18
20
0 100 200 300D
epth
z (
m)
Effective in-situ Embankment loadUniform load 506 IL
0
1
2
3
4
0 10 20 30 40 50
Bia
s(c
alcu
late
d/ob
serv
ed)
Modulus ratio E1/E2
Bias in the settlement estimateThe effect of dry crust correction
Kujala-5 (alpha=10.5)Kujala-5 (alpha=27.0)Kujala-4 (alpha=10.5)Kujala-4 (alpha=27.0)No bias -line
Kujala-5 Kujala-4Stress (kPa) Stress (kPa)
0
2
4
6
8
10
12
14
16
18
20
0 100 200 300
E1/E2=50Rectangular loadE1/E2=6 σ‘p (oedometer test)

18th Nordic Geotechnical MeetingIOP Conf. Series: Earth and Environmental Science 710 (2021) 012070
IOP Publishingdoi:10.1088/1755-1315/710/1/012070
9
effect, the greatest realistic value was used (E1/E2 =9). Finally, after this calibration, the agreement between observed and calculated is satisfactory (figure 9).
Figure 8. Settlement histogram for Kujala-5 with constant α=27, without dry crust effect.
Figure 9. Settlement histogram for Kujala-5 with constant α=23.5 and dry crust effect (E1/E2=9).
4. Discussion The CPTU-based settlement prediction performs very differently in these two test embankments. The possible explaining factors for this difference are: (i) the compressing clay-silt basin is thicker in Kujala-5, (ii) the dry crust is thicker and probably stiffer in Kujala-5 (effect of dry crust is greater), and (iii) in Kujala-4, some of the compression occurs in normally consolidated state.
Regarding the last point, the field and laboratory test results (figure 7, right) indicate that the preconsolidation pressure in Kujala-4 profile is indeed smaller than in Kujala-5. Given that the final stress in Kujala-4 is probably also greater (due to thinner dry crust), it seems probable that initial modulus M0 cannot model all the compression at Kujala-4 (since the final stress is probably larger than preconsolidation pressure). The authors expect that the good agreement for Kujala-4 in the first analyses was partly caused by the usage of inaccurate α. Based on Kujala-5 analyses (section 4.3), more accurate value for α would be closer to the greatest observed value (α=23.5). The “incorrectness” of posterior α may have been caused by the bias created by sample disturbance. However, it should be noted that the actual final stress could also be smaller than estimated here (in section 4.3) since the dry crust effect required assumptions that cannot be verified (such as the stiffness ratio E1/E2). 5. Conclusions This paper defined a probabilistic settlement estimation model based on an empirical correlation between CPTU net cone resistance and constrained modulus M0 (described by factor α). The transformation uncertainty related to factor α was quantified for both the existing global correlation (prior α) and for the updated transformation model (posterior α) which considered also the site-specific oedometer test results. By means of Monte Carlo simulation, settlement histograms for the two test embankments were produced and the results compared to observed settlements. Lastly, the model for the for the higher embankment, Kujala-5, was calibrated to account for the stiff dry crust’s effect.
The results demonstrate that for Kujala-5, the effect of dry crust stiffness on the embankment load has to be considered. In addition, the actual factor α seems to be higher than average. For Kujala-5, using the maximum observed value (α=23.5) together with the dry crust effect led to the smallest model bias. For the lower embankment (Kujala-4), the posterior distribution for α produced rather good results (without any calibrations). However, this result may be caused by different subsoil conditions and sample disturbance bias rather than better suitability of the model.
It can be concluded that this CPTU-based preliminary settlement calculation might perform rather well at overconsolidated (OC) silty soils in which the compression occurs at OC state (i.e., the final
5,0% 90,0% 5,0%
77,0 113,2
0 20 40 60 80 100
120
140
160
180
200
0,000
0,005
0,010
0,015
0,020
0,025
0,030
0,035
0,040
Settlement (mm) with constant α=27 Settlement (mm) with constant α=23.5 Without dry crust effect With dry crust effect
5,0% 90,0% 5,0%
59,3 85,7
0,0000,0050,0100,0150,0200,0250,0300,0350,0400,0450,050
Observed (64-74 mm)
Observed (64-74 mm)

18th Nordic Geotechnical MeetingIOP Conf. Series: Earth and Environmental Science 710 (2021) 012070
IOP Publishingdoi:10.1088/1755-1315/710/1/012070
10
stress does not surpass the preconsolidation pressure). However, it is advisable to calibrate the value of factor α by means of site-specific oedometer test. Finally, it should be emphasized that such singular modulus -based settlement model should not be applied to a normally consolidated clay subsoil.
Acknowledgements This research was funded by the Finnish Transport Infrastructure Agency. The planning, construction and monitoring of the test embankments were performed by Pöyry Finland Oy and Skanska Infra Oy.
References [1] Sanglerat G 1972 The Penetrometer and Soil Exploration. (Amsterdam: Elsevier) [2] Mayne P W 2006 In-Situ Test Calibrations for Evaluating Soil Parameters. In Characterization
and Engineering Properties of Natural Soils Proc. Second Int. Workshop on Characterisation and Engineering Properties of Natural Soils (London: Taylor & Francis) pp 1601–52
[3] Abu-Farsakh M Y, Zhang Z and Gautreau G 2007 Evaluating deformation modulus of cohesive soils from piezocone penetration test for consolidation settlement Transp. Res. Rec. J. Transp. Res. Board, No. 2004 49–59
[4] Toikka K 1984 Determination of the mechanical properties of Lahti silt by using CPT [in Finnish] (Helsinki University of Technology)
[5] Phoon K-K 2017 Role of reliability calculations in geotechnical design Georisk 11 4-21 [6] Larsson R 1986 Consolidation of soft soils (Linköping) [7] Karlsrud K and Hernandez-Martinez F G 2013 Strength and deformation properties of Norwegian
clays from laboratory tests on high-quality block samples Can. Geotech. J. 50 1273–93 [8] Mitchell J K and Gardner W S 1975 In-Situ Measurement of Volume Change Characteristics
Proceedings of ASCE Specialty Conference on In-Situ Measurement of Soil Properties, Vol. 2 (ASCE American Society of Civil Engineers) pp 279–345
[9] Schmertmann J H 1978 Guidelines for Cone Penetration Test (Performance and Design) (Washington, D.C.)
[10] Jamiolkowski M, Ladd C C, Germaine J T and Lancellotta R 1985 New Developments in Field and Lab Testing of Soils Proc., 11th Int. Conf. on Soil Mech. and Found. Eng., Vol. 1
[11] Kulhawy F H and Mayne P W 1990 Manual of Estimating Soil Properties for Foundation Design (Palo Alto, California)
[12] Di Buò B, Selänpää J, Länsivaara T and D’ignazio M 2018 Evaluation of existing CPTu-based correlations for the deformation properties of finnish soft clays Proc. of the 4th Int. Symposium on Cone Penetration Testing (CPT’18), The Netherlands, 21-22 June 2018 ed M A Hicks, F Pisanò and J Peuchen (London: CRS Press) pp 571–7
[13] Ang A H-S and Tang W H 2006 Probability Concepts in Engineering: Emphasis on Applications to Civil and Environmental Engineering (Wiley)
[14] Phoon K-K and Kulhawy F H 1999 Characterization of geotechnical variability Can. Geotech. J. 36 612–24
[15] Löfman M S and Korkiala-Tanttu L K 2019 Variability and Typical Value Distributions of Compressibility Properties of Fine-grained Sediments in Finland Proc. of the Seventh Int. Symposium on Geotechnical Safety and Risk (Research Publishing (S) Pte. Ltd.)
[16] Palisade Corporation 2016 @RISK User’s Guide. Risk Analysis and Simulation Add-In for Microsoft® Excel. Version 7. July, 2016.
[17] Vanmarcke E H 1983 Random fields: analysis and synthesis (Cambridge: MIT Press) [18] Poulos H G and Davis E H 1974 Elastic solutions for soil and rock mechanics (John Wiley &
Sons) [19] Odemark N 1949 Undersökning av elasticitetsegenskaperna hos olika jordarter samt teori för
beräkning av beläggningar enlight elasticitetsteorin (Stockholm) [20] Vepsäläinen P 1985 Jännityksen jakautuminen muodonmuutospohjassa RIL 157-1
Geomekaniikka 1 (Helsinki: Finnish Association of Civil Engineers RIL) pp 311–62