cr third quarter financial report to council final 2018 11 … third quarter financial report...
TRANSCRIPT

CORPORATE REPORT
NO: COUNCIL DATE:
REGULAR COUNCIL TO: Mayor & Council DATE: October 23, 2017 FROM: General Manager, Finance FILE: 1880-20 SUBJECT: Quarterly Financial Report - Third Quarter - 2017
RECOMMENDATION The Finance Department recommends that Council receive this report as information. INTENT The purpose of this report is to provide Council with an update on the City’s financial activity for the third quarter of 2017 and to compare this activity with the 2017 Financial Plan and the same period in 2016. DISCUSSION The Five Year (2017-2021) Financial Plan was adopted by Council on December 21, 2016. The following discussion provides a summary of current global, national, and local economic conditions, followed by an outline of Surrey’s financial performance for the third quarter of 2017. It also includes an overview of the City’s investment portfolio performance. International Overview Global central banks have started the process of unwinding highly accommodative monetary policies. The four largest central banks, The US Federal Reserve, Bank of Japan, European Central Bank, and Bank of England, have accumulated an additional $10 trillion in assets since the last financial crisis. The US Federal Reserve is scheduled to start unwinding its balance sheet in October while the Bank of England and the European Central Bank have signalled that tightening policies are forthcoming. The desire to rein in the accumulation of debt, and the fear of diminished policy power in the face of future economic downturns, has spurred central banks into action even though inflation has remained short of their targets. The Eurozone’s economy grew by an annualized rate of 2.3% in the second quarter and average hourly wages rose by 1.8%. The unemployment rate came in at 9.1% in August, with large disparities between member countries. The Euro has risen 13% against the US dollar this year due to the strengthening Eurozone economy. Analysts expect the European Central Bank to reduce stimulus in the upcoming year given the strong economic expansion.

2 The German election in September saw Chancellor Angela Merkel’s Christian Democratic Party win only a third of the seats in parliament. The backing of other parties will be required to form a coalition government. The election also resulted in a right-wing nationalist party forming the third largest political party in Germany. The next major election in the region will take place in Italy. Eurosceptic, populist parties, are calling for a referendum to decide on whether or not Italy should remain in the European Union (“EU”). The election outcome will be closely watched by financial markets as the lead-up and final results could contribute to market volatility. The United Kingdom’s (“UK”) second quarter Gross Domestic Product (“GDP”) grew at an annualized rate of 1.2%. As the British pound lost value, prices increased and continue to impact purchasing power for households. Inflation rose to 2.9% and average wages were up by 2.1% in August. The Bank of England’s governor signalled domestic interest rates are likely to increase over the coming months to combat rising inflation. Brexit talks with the EU have stalled due to an impasse on a UK financial settlement and Eurozone citizens’ rights. Four rounds of negotiations have taken place with no significant progress thus far. Tensions between the US and North Korea have escalated through ongoing rhetoric on both sides along with increased weapons testing by Kim Jong-un’s regime. In response to repeated missile launches and nuclear weapons testing, the United Nations Security Council has imposed sanctions on North Korea to restrict oil imports and ban textile exports. These restrictions are expected to cut the country’s export revenues by a third. China accounts for 90% of North Korea’s trade and is under pressure from the US to adopt a tougher approach with their neighbor. China, in turn, has asked both the US and North Korea to exercise restraint and avoid further provocations. World leaders are stressing the importance of diplomatic talks to de-escalate the situation. United States Overview US GDP grew at an annualized rate of 3.0% in the second quarter due to strong consumer spending and business investments. The August unemployment rate came in at 4.4%, average hourly earnings rose 2.5% over the past year, and inflation grew by 1.4% year-over-year in July. Inflation and GDP are both forecasted to come in at 2.1% in 2017 due to a slow first quarter and the devastating impacts of recent hurricanes. The damage caused by hurricanes Harvey and Irma is estimated at $200 billion. Business disruptions and reduced consumer consumption will negatively impact the US economy. Multiple oil refineries reduced production or ceased output entirely in the wake of the storms. Retail and auto sales are expected to contract in the third quarter and bounce back in quarter four and into 2018. Economists are expecting that US GDP will see a reduction of 0.5% to 1.0% in the third quarter due to the hurricanes. The US Federal Reserve did not raise its key interest rate in September and has signalled that one rate increase may occur before the end of this year. With hurricane after-effects weighing down the economy, the Federal Reserve will likely wait until December to increase interest rates. The Federal Reserve announced plans to start unwinding the $4.5 trillion in bonds amassed on its balance sheet. The process began in October of this year with $10 billion worth of bonds maturing without reinvestment. Adjustments will be made every quarter until the amount reaches $50 billion per disposition in a year’s time. The Federal Reserve is estimating that the normalization process will take five to six years to complete.

3 A US Senate Panel unveiled a plan to reduce the tax rate to 20% from 35% for corporations and small businesses. Individuals’ tax brackets would be simplified from seven brackets to three with increased deductions for the middle-class. The cost for the proposed tax cuts has not yet been released and will be met with resistance from within the Republican Party if the plan adds to the national debt. The US dollar has lost 5.2% of its value against the Canadian dollar since the beginning of 2017. As economies around the world gained strength, the value of the dollar slipped in relation. The Federal Reserve’s signal of a slower pace of interest rate hikes, combined with the protracted roll-out of tax reforms and pro-growth economic policies, have dampened the outlook on the US economy. North American Free Trade Agreement (“NAFTA”) renegotiations have commenced. The US has introduced the idea of a “sunset clause” which would automatically terminate the agreement after five years unless it is renewed by all three countries. Canada and Mexico have rejected the idea, citing a potentially uncertain investment climate which would cause businesses to withhold their capital. The US’s desire to complete talks by the end of the year appears to be an unlikely outcome at this time. Canadian Overview Canada’s second quarter GDP results were strong, posting an annualized growth rate of 4.5%. Increased consumer spending, business investments and exports all contributed to the positive results. The unemployment rate came in at 6.2% in August while average wage growth remained subdued at 1.8%. Inflation was 1.4% in August due to higher gas prices and airfares. Fuel and food costs are expected to rise in the coming months due to impacts from the recent hurricanes in the US. For 2017, the economy is on pace for GDP growth of 3.1% with inflation forecasted at 1.5%. The Bank of Canada (“BOC”) recently raised its key interest rate, with increases of 25 basis points in both July and September. The BOC removed the cuts that were implemented in 2015, citing broad-based growth across various industries and strength in exports. The second increase surprised financial markets due to a lack of signals from the Central Bank and a below-target rate of inflation. The rate increases sent the Canadian dollar higher, with the exchange rate against the US dollar up 14% since April. The Loonie hit a high of 82 cents per US dollar shortly after the second announcement in September but has given back some of those gains in recent weeks. BOC Governor Poloz indicated that interest rate changes will be data driven going forward and also commented that the central bank will not be providing forward guidance on the movement of rates. To further rein in overheated housing markets, the Office of the Superintendent of Financial Institutions (“OSFI”) is drafting new legislation targeting borrowers of uninsured mortgages, where the down-payment is 20% or greater. Applicants will be subjected to a “stress test” to confirm that they can afford their mortgage payments if the interest rate was two percentage points higher than the rate they negotiate with their lender. This follows new requirements enacted last year which placed a similar “stress test” on borrowers with down-payments of less than 20% seeking an insured mortgage. OSFI hopes to curb the potential risks of growing household indebtedness though these measures. The Canada-EU Comprehensive Economic and Trade Agreement came into force in September. The agreement will reduce tariffs, increase mobility of labour, and open up government procurements. Export sectors will benefit as tariffs are removed. The EU market is vast with over 500 million consumers. Increasing trade with the European Union diversifies export markets and mitigates risks as NAFTA negotiations continue down an uncertain path.

4 British Columbia Overview BC’s quarter two GDP growth was 3.5% with strength in retail sales, employment, and exports as contributing factors. Inflation came in 2.0% year-over-year in August, making BC the only large province to meet the Bank of Canada’s inflation target. For 2017, GDP and inflation are forecasted at 3.8% and 1.9%, respectively. BC’s unemployment rate was 5.1% in August and is expected to trend downwards. Labour shortages are being reported in many sectors including retail, restaurant, and construction. The Retail Council of Canada has cited BC’s high cost of living and lack of affordable housing as contributing factors to labour constraints. In September, the Real Estate Board of Greater Vancouver reported a 21.1% year-over-year increase in the benchmark price of condos. In the detached home category, prices were up by only 2.9% from the same period last year. Sales volumes also posted gains as units sold were higher by 19.1% for condos and 27.9% for detached homes. Some market observers see the implementation of the 15% foreign buyer’s tax as one of the causes behind last year’s market slowdown. Demand continues to be prevalent; however, buyers have shifted purchases from detached properties to condos and townhomes. To address pent up demand, Vancouver’s mayor will be introducing a motion later this month that would prioritize sales of new homes in multi-family developments within the city to local residents. Housing critics continue to call on all levels of government to take action to deal with rental shortages and housing affordability throughout the province. The NDP government implemented a number of campaign promises with the elimination of bridge tolls and increases to welfare and disability rates. In the September budget update, a number of key announcements were made. Starting next April, BC’s carbon tax will increase by $5 per tonne, per year, for the next four years. Higher carbon taxes will increase fuel prices and negatively impact household and transportation costs for consumers. Changes are also being made to individual income tax with a proposed top personal income tax rate of 16.8% for taxable income exceeding $150,000. The current rate of 14.7% applies to all income above $106,543 and $108,460 for the 2016 and 2017 tax years, respectively. The NDP government also proposed a 1% increase to the general corporate tax rate, taking it up to 12%. All income tax proposals would take effect January 1, 2018. The NDP government placed the $3.5 billion Massey Tunnel project on hold pending an independent review. The $8.3 billion Site C dam is under review by the BC Utilities Commission with a final report and decision on the future of the project expected by the end of the year. Construction of the $7.4 billion Trans Mountain Pipeline is expected to start next year. It remains to be seen if ongoing court challenges will stall or put an end to the Trans Mountain Pipeline project.
5 Surrey’s Financial Performance The development activity within the City for the first nine months of this year has showed continued strength, with residential and multi-family development leading the way. New single family dwelling building permits have increased by 6.8% year over year and similarly building permits for townhouses are up approximately 16% year over year. Of interest is that the number of building permits for low rise apartment buildings (up to six floors), has increased from 7 permits for the first nine months in 2016 to 10 permits for the same period in 2017. This trend is indicative of the overall affordability challenges seen in the Metro Region. The commercial sector remains quite stable compared to the same period last year, whereas the industrial sector has shown relative strength, with the value of building permits issued for the first nine months of the year being approximately 41% higher than the same period last year. The institutional sector has also shown notable strength when compared to the same period as last year with the value of permits issued increasing by over 100%, although this is due primarily to several large valued projects, notably schools.
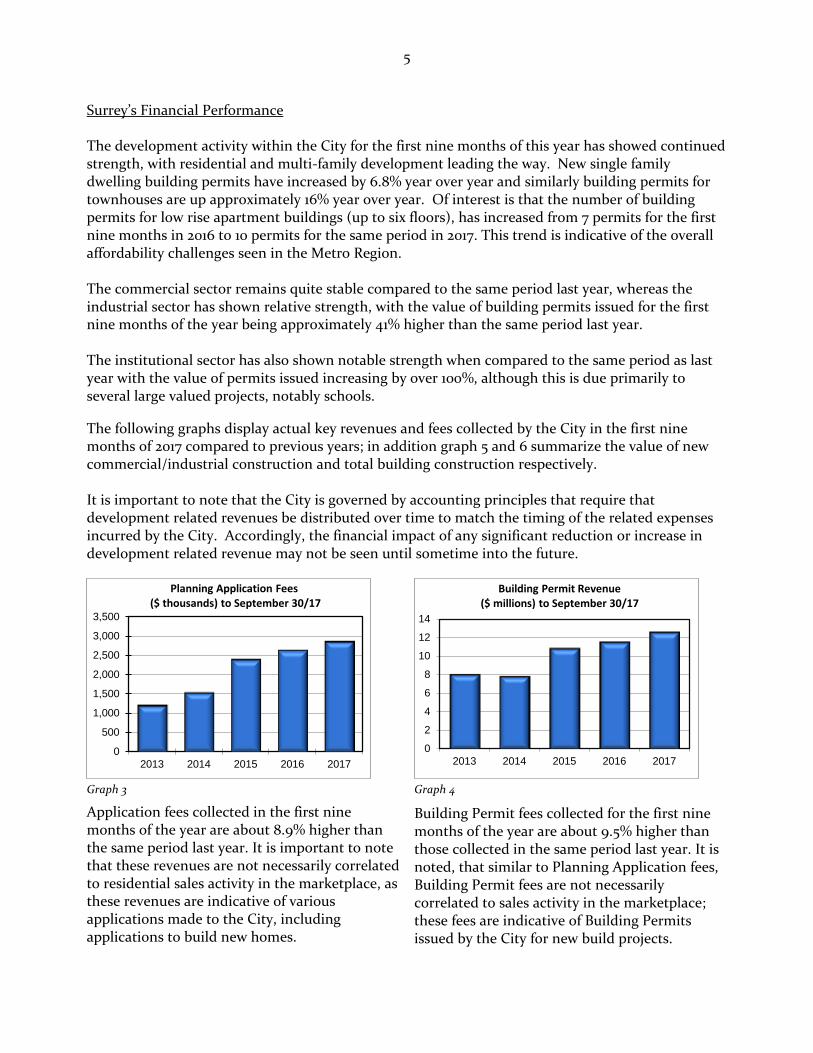
The following graphs display actual key revenues and fees collected by the City in the first nine months of 2017 compared to previous years; in addition graph 5 and 6 summarize the value of new commercial/industrial construction and total building construction respectively. It is important to note that the City is governed by accounting principles that require that development related revenues be distributed over time to match the timing of the related expenses incurred by the City. Accordingly, the financial impact of any significant reduction or increase in development related revenue may not be seen until sometime into the future.
Graph 3
Application fees collected in the first nine months of the year are about 8.9% higher than the same period last year. It is important to note that these revenues are not necessarily correlated to residential sales activity in the marketplace, as these revenues are indicative of various applications made to the City, including applications to build new homes.
Graph 4
Building Permit fees collected for the first nine months of the year are about 9.5% higher than those collected in the same period last year. It is noted, that similar to Planning Application fees, Building Permit fees are not necessarily correlated to sales activity in the marketplace; these fees are indicative of Building Permits issued by the City for new build projects.
0
500
1,000
1,500
2,000
2,500
3,000
3,500
2013 2014 2015 2016 2017
Planning Application Fees ($ thousands) to September 30/17
0
2
4
6
8
10
12
14
2013 2014 2015 2016 2017
Building Permit Revenue ($ millions) to September 30/17
6
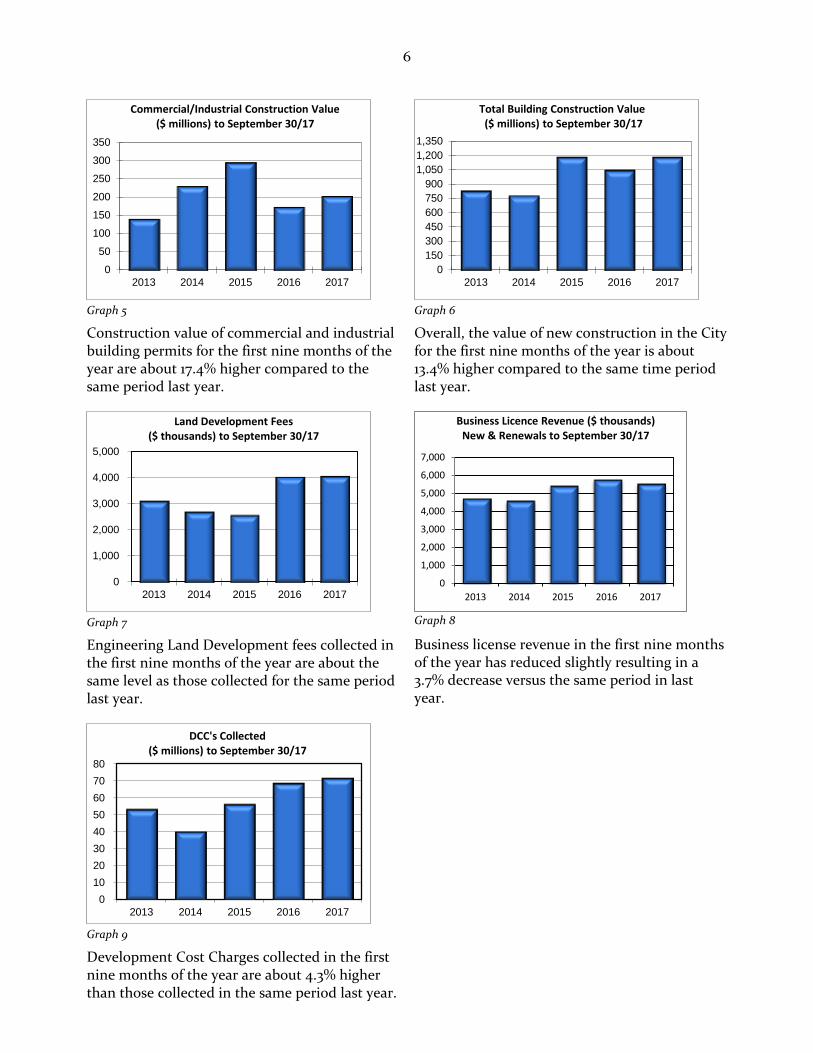
Graph 5
Construction value of commercial and industrial building permits for the first nine months of the year are about 17.4% higher compared to the same period last year.
Graph 6
Overall, the value of new construction in the City for the first nine months of the year is about 13.4% higher compared to the same time period last year.
Graph 7
Engineering Land Development fees collected in the first nine months of the year are about the same level as those collected for the same period last year.
Graph 8
Business license revenue in the first nine months of the year has reduced slightly resulting in a 3.7% decrease versus the same period in last year.
Graph 9
Development Cost Charges collected in the first nine months of the year are about 4.3% higher than those collected in the same period last year.
0
50
100
150
200
250
300
350
2013 2014 2015 2016 2017
Commercial/Industrial Construction Value ($ millions) to September 30/17
0
150
300
450
600
750
900
1,050
1,200
1,350
2013 2014 2015 2016 2017
Total Building Construction Value ($ millions) to September 30/17
0
1,000
2,000
3,000
4,000
5,000
2013 2014 2015 2016 2017
Land Development Fees ($ thousands) to September 30/17
0
1,000
2,000
3,000
4,000
5,000
6,000
7,000
2013 2014 2015 2016 2017
Business Licence Revenue ($ thousands) New & Renewals to September 30/17
0
10
20
30
40
50
60
70
80
2013 2014 2015 2016 2017
DCC's Collected ($ millions) to September 30/17

7 Actual Revenues and Expenditures Relative to the 2017 Budget (Financial Plan) The following graphs illustrate the variances between the actual and budgeted operating revenues and expenditures respectively, excluding transfers to reserves, for the third quarter of 2017.
Graph 11 Graph 12
Appendix “I” documents the General Operating Fund’s revenues and expenditures for the third quarter of 2017 at a more detailed level. Departments are proactively monitoring their actual results on a monthly basis. The following section provides an explanation on a Department-by-Department basis of year to date variances in relation to the 2017 Financial Plan:
RCMP currently has a favorable variance of $101,000 due primarily to vacancies and the timing of expenditures and is forecasted to have a favorable variance at year-end of $76,000.
Fire Services had a favourable variance of $190,000 for the first nine months of the year, resulting from vacancies and timing of expenditures. It is forecasted that Fire Services will have a favorable variance at year end of approximately $157,000.
Engineering Services currently has a favourable variance of $355,000 which is due primarily to staff vacancies and the timing of expenditures and increased revenues, particularly in Land Development services; Engineering Services are forecasted to have a favorable variance by year end of approximately $651,000.
Parks, Recreation & Culture Department is showing a favourable departmental variance of $903,000, due primarily to the timing of expenditures and is forecasted to have a favorable variance for year-end of approximately $226,000.
Library Services currently has a favorable variance of $115,000, due predominately to the timing of expenditures relative to budget and is forecasted to have a positive variance at year end of approximately $60,000.
Planning and Development Department, which also includes Civic Facilities, is reporting a positive variance of $942,000 due to staff vacancies, the timing of maintenance costs for civic facilities, and higher than budgeted revenues. Planning and Development is forecasted to have a favorable variance by year-end of approximately $2,800,000.
Mayor and Council is currently meeting budget and are forecast to meet budget by year-end.
City Grants is currently on budget and are forecast to meet budget by year-end.
City Manager’s Department is currently showing a $148,000 unfavorable variance; this is due primarily to mail out expenses by the City Clerk related to statutory requirements for Land Use Contract terminations. This department is forecasted to have an unfavorable variance of $142,000 at year end.
$349,020 $351,535
0
50,000
100,000
150,000
200,000
250,000
300,000
350,000
400,000
1
Actual to Budget Revenue ($ thousands) - to September 30/17
2017 Actual 2017 Budget
$321,924 $324,946
0
50,000
100,000
150,000
200,000
250,000
300,000
350,000
1
Actual to Budget Expenditures ($ thousands) - to September 30/17
2017 Actual 2017 Budget

8
Public Safety is currently showing an unfavorable variance of $471,000; this is due to higher than budgeted salary costs and lower than budgeted revenues. It is forecast that Public Safety will have an unfavorable variance at year-end of $713,000 due primarily to staffing costs.
Investment & Intergovernmental Relations currently has a favorable variance of $76,000, due to the timing of expenditures, it is forecast that this department will meet budget at year end.
Finance & Technology Department currently has a favourable variance of $183,000. This is primarily due to the timing of the payments on IT maintenance contracts and staff vacancies. It is forecast that Finance & Technology will have a favorable variance at year end of approximately $60,000.
Human Resources Department currently has an unfavourable variance of $305,000 due primarily to increased staffing requirements and operational expenditures related to significant recruitment activity. It is forecasted that HR will have an unfavorable variance at year-end of approximately $166,000.
The results at the end of the Third Quarter indicate an overall unfavourable variance of $784,000. This is primarily a result of overall revenues forecasted to be below budget, of which investment interest is anticipated to have the largest variance at $1,866,000 resulting from the combined interest rate earned to date being 1% lower than budgeted. Staff will continue to closely monitor all areas to ensure that immediate action is taken to address these unfavourable variances and to further reduce, as much as possible, this unfavourable variance of $784,000. City Investment Portfolio The Schedules in Appendix “II” include a summary of the City’s investment portfolio. Schedule 1 is a summary of investments by issuer type with comparative totals for each month-end from July through September 2017. Schedule 2 is a detailed listing of securities as at September 30, 2017 sub-totalled by issuer type. The investment portfolio is currently valued at $976.8 million. The City’s investment portfolio is currently earning a combined rate of approximately 1.93% while maintaining investment security as outlined in the City’s investment policy. Interest revenue is currently not expected to meet budget by year end as the budgeted combined interest rate was 2.92% versus the current actual combined rate of approximately 1.93%. Community Grant Program Update Community Grants
The City of Surrey’s Annual Community Grant Program is designed to support non-profit groups or organizations. Ninety percent of the Community Grants were approved by Council in January of this year. Since that time, the Grants Evaluation Committee has reviewed and made recommendations for grant payments to organizations that have submitted late grant applications, based on the need of the project, number of residents benefiting, the value to the community, history and financial stability of the organization and the effectiveness and quality of the proposed project or event. Grant applications for the 2018 Annual Community Grant Program were due and received by September 30th and the review and evaluation process for these applications is now underway. It is expected that these grant requests will be brought forward to Council in November.

9 Community Enhancement Partnership Grants In January 2010, Council adopted the Community Enhancement Partnership Program (“CEP”), which is intended to provide financial support for projects focussed on community engagement and neighbourhood beautification. Under the CEP program, residents and community groups are required to match the City’s grant with contributions of volunteer labour, donated materials, professional services and/or cash. The process for the CEP program has recently been updated, allowing for the General Manager of Parks, Recreation & Culture or the General Manager of Finance to approve qualifying applications for up to $2,000 with a quarterly update to Council. Façade Enhancement Grants The City of Surrey’s Façade Enhancement Grant program provides grant matching up to 30% of the eligible costs to a maximum of $3,000 to commercial property owners who want to improve their storefront facades. The process for this grant follows the same process as the CEP program. Appendix “III” provides a listing segregated by category of grants issued by the City to various organizations for the nine months ending September 30, 2017. Each year, staff has seen the Community Enhancement Partnership Program grow and since 2015 that growth has taken place predominantly in the community engagement category with more and more applications for block parties. The Façade Enhancement program is also starting to take hold, however as a new program, the availability of the program is not as widely known. In order to provide optimal community benefit, staff are recommending that the funding for the Community Enhancement Partnership Grant and the Façade Enhancement Grant be combined, allowing staff to better meet community demand, however staff will continue to report to Council, on the allocation for each category. SUSTAINABILITY CONSIDERATIONS The 2017 Quarterly Finance Report supports the objectives of the City’s Sustainability Charter, specifically with the following Charter action item:
Corporate SO8: Work towards corporate financial sustainability, including financial reporting.

10 CONCLUSION Overall, in relation to the 2017 adopted budget, there has been no material concerns noted for the third quarter of 2017. Staff will continue to closely monitor all areas to ensure that any variances from the 2017-2021 adopted budgets are recognized in a timely fashion and appropriate mitigating action is taken.
Kam Grewal, CPA, CMA General Manager, Finance KG: llh Appendix “I”: 2017 Second Quarter Council Report Appendix “II”: Third Quarter Investment Summary Appendix “III”: Financial Assistance Awards Update

APPENDIX “I-1”
2017: 3rd Qtr 2017 2017: 3rd Qtr 2017 2017 2017
YTD YTD YTD ANNUAL ANNUAL Projected
REVENUE SUMMARY Actual BUDGET Variance FORECAST BUDGET Variance
Net Taxation 246,061 246,569 (509) 328,293 328,802 (509)
Investment Interest 10,970 11,979 (1,009) 14,652 16,518 (1,866)
Secondary Suite Infrastructure Fee 13,201 13,713 (512) 17,572 18,284 (712)
Contribution from SCDC 3,375 3,375 - 4,500 4,500 -
Provincial Casino Revenue Sharing 2,850 2,850 - 3,800 3,800 -
Penalties & Interest on Taxes 3,052 3,150 (97) 4,303 4,400 (97)
Corporate Leases 4,860 5,032 (173) 6,402 6,710 (308)
Carbon Tax Rebate 300 300 400 400
Other Revenues 1,682 1,894 (211) 1,982 2,525 (543)
Non-Tax Revenues 40,291 42,293 (2,002) 53,611 57,137 (3,526)
Program Revenues 62,669 62,673 (3) 82,613 82,642 (29)
TOTAL REVENUES 349,020 351,535 (2,514) 464,518 468,581 (4,063)
2017: 3rd Qtr 2017 2017: 3rd Qtr 2017 2017 2017
YTD YTD YTD ANNUAL ANNUAL Projected
EXPENDITURE SUMMARY Actual BUDGET Variance FORECAST BUDGET Variance
Program Expenditures 311,578 313,522 1,944 422,529 425,568 3,039
Council Priorities 188 188 - 250 250 -
Fiscal Services 504 613 108 709 817 108
MFA Principal 9,576 9,584 9 12,779 12,779 ()
Other 78 1,039 961 1,058 1,399 341
TOTAL EXPENDITURES 321,924 324,946 3,022 437,325 440,813 3,488
2017: 3rd Qtr 2017 2017: 3rd Qtr 2017 2017 2017
YTD YTD YTD ANNUAL ANNUAL Projected
TRANSFER SUMMARY Actual BUDGET Variance FORECAST BUDGET Variance
Carbon Emission Offsets 300 300 400 400
Transfer to Capital Program 11,775 11,775 - 15,700 15,700 -
Contributions to Road & Trans. Fund 12,444 12,444 () 16,592 16,592 ()
Transfers To(From) Own Sources (3,484) (3,693) (209) (4,715) (4,924) (209)
TOTAL TRANSFERS 21,035 20,826 (209) 27,977 27,768 (209)
Surplus (Deficit) 6,061 5,763 298 (784) - (784)
Transfer (To)From Surplus (6,061) (5,763) (298) 784 - 784
BALANCED BUDGET - - - - - -
PROJECTED SURPLUS (DEFICIT) (784)$
BUDGETED TRANSFER FROM SURPLUS -
ANTICIPATED SURPLUS (DEFICIT) AT YEAR END (784)$
2017 3rd QUARTER COUNCIL REPORT
EXECUTIVE SUMMARY - REVENUES & EXPENDITURES
$ 000's

APPENDIX “I-2”
2016: 3rd Qtr 2017: 3rd Qtr 2017 2017: 3rd Qtr 2017 2017 2017
YTD YTD YTD YTD Projected ANNUAL Projected
PROGRAM REVENUES ACTUAL ACTUAL BUDGET Variance ACTUAL BUDGET Variance
R.C.M.P. 5,962 5,936 6,091 (155) 7,966 8,121 (155)
Fire 1,414 1,619 1,652 (33) 1,789 1,706 83
Engineering Services 4,953 5,120 5,043 77 7,230 6,652 578
Parks, Recreation & Culture 21,846 25,076 25,365 (289) 30,431 33,541 (3,110)
Surrey Public Library 1,198 1,231 1,153 78 1,602 1,520 82
Planning & Development 16,599 16,172 15,641 531 23,406 20,854 2,552
Mayor & Council - - - - - - -
City Grants - - - - - - -
City Manager 6 30 4 26 31 5 26
Public Safety 6,169 6,472 6,719 (247) 8,809 8,903 (94)
Invest. & Intergovernmental Relations 45 47 - 47 47 - 47
Finance & Technology 1,140 967 1,006 (39) 1,302 1,341 (39)
Human Resources (1) - - - - - -
TOTAL PROGRAM REVENUES 59,331 62,669 62,673 (3) 82,613 82,642 (29)
2016: 3rd Qtr 2017: 3rd Qtr 2017 2017: 3rd Qtr 2017 2017 2017
PROGRAM EXPENDITURES YTD YTD YTD YTD Projected ANNUAL Projected
NET OF INTERNAL TRANSFERS ACTUAL ACTUAL BUDGET Variance ACTUAL BUDGET Variance
R.C.M.P. 110,656 117,862 118,118 256 158,108 158,339 231
Fire 44,611 44,421 44,644 222 61,747 61,821 74
Engineering Services 5,594 6,246 6,524 278 8,518 8,591 73
Parks, Recreation & Culture 62,842 65,716 66,909 1,193 88,946 92,282 3,336
Surrey Public Library 12,263 12,797 12,834 37 17,300 17,278 (22)
Planning & Development 22,561 21,723 22,134 411 29,739 29,987 248
Mayor & Council 1,021 1,054 1,053 () 1,433 1,433
City Grants 1,247 1,261 1,261 1,682 1,682
City Manager 4,385 5,093 4,919 (174) 6,804 6,636 (169)
Public Safety 5,992 6,643 6,420 (224) 9,404 8,785 (619)
Invest. & Intergovernmental Relations 850 1,060 1,090 30 1,531 1,484 (47)
Finance & Technology 23,064 24,336 24,558 221 32,975 33,074 99
Human Resources 2,835 3,365 3,061 (305) 4,342 4,176 (166)
TOTAL PROGRAM EXPENDITURES 297,921 311,578 313,522 1,944 422,529 425,568 3,039
2016: 3rd Qtr 2017: 3rd Qtr 2017 2017: 3rd Qtr 2017 2017 2017
YTD YTD YTD YTD Projected ANNUAL Projected
NET PROGRAM ACTUAL ACTUAL BUDGET Variance ACTUAL BUDGET Variance
R.C.M.P. 104,694 111,926 112,027 101 150,142 150,218 76
Fire 43,197 42,802 42,992 190 59,958 60,115 157
Engineering Services 641 1,125 1,481 355 1,288 1,939 651
Parks, Recreation & Culture 40,997 40,640 41,543 903 58,515 58,741 226
Surrey Public Library 11,065 11,565 11,680 115 15,698 15,758 60
Planning & Development 5,963 5,551 6,493 942 6,333 9,133 2,800
Mayor & Council 1,021 1,054 1,053 () 1,433 1,433
City Grants 1,247 1,261 1,261 1,682 1,682
City Manager 4,379 5,063 4,915 (148) 6,773 6,631 (142)
Public Safety (177) 172 (299) (471) 595 (118) (713)
Invest. & Intergovernmental Relations 805 1,014 1,090 76 1,484 1,484 ()
Finance & Technology 21,924 23,369 23,552 183 31,673 31,733 60
Human Resources 2,835 3,365 3,061 (305) 4,342 4,176 (166)
NET PROGRAM TOTAL 238,590 248,909 250,849 1,940 339,916 342,926 3,010
2017 3rd QUARTER COUNCIL REPORT
DEPARTMENTAL DETAIL
$ 000's

APPENDIX “II-1”
THIRD QUARTER INVESTMENT SUMMARY
INVESTMENT INVESTMENT INVESTMENT
DESCRIPTION (MILLIONS) (MILLIONS) (MILLIONS)
JULY/17 AUGUST/17 SEPTEMBER/17
RBC Month End Balance 263.7 181.3 139.1
RBC USD Month End Balance (CAD$) 0.4 0.3 0.2
MAJOR BANKS - SCHEDULE I
Bank of Montreal 40.9 40.9 25.8
Bank of Nova Scotia 46.7 43.7 43.7
Canadian Imperial Bank of Commerce 16.8 16.8 16.8
Canadian Western Bank 98.0 98.0 97.9
Laurentian Bank of Canada 80.3 80.2 95.3
Manulife Bank of Canada 7.0 7.0 7.0
National Bank of Canada 65.0 65.0 52.5
Royal Bank of Canada 29.6 29.5 29.5
Toronto-Dominion Bank 7.2 7.2 7.2
SUB TOTAL - SCHEDULE I BANKS 391.5 388.3 375.9
MAJOR BANKS - SCHEDULE II
HSBC Bank Canada 5.1 5.1 8.1
SUB TOTAL - SCHEDULE II BANKS 5.1 5.1 8.1
CREDIT UNIONS
BlueShore Financial 35.2 35.2 35.2
Central 1 Credit Union (CUCBC) 10.0 10.0 10.0
Coast Capital Savings Credit Union 75.0 75.0 75.0
Coastal Community Credit Union 21.5 21.5 21.5
Community Savings Credit Union 5.2 5.2 5.2
Envision Financial 50.0 50.0 50.0
G&F Financial Group 17.1 17.1 17.1
Khalsa Credit Union 4.1 4.1 4.1
Prospera Credit Union 32.5 32.5 32.5
Vancity Credit Union 75.0 75.0 75.0
Westminster Savings Credit Union 28.1 28.1 28.1
SUB TOTAL - CREDIT UNIONS 353.7 353.7 353.7
PROVINCES 0.0 0.0 0.0
Province - BC 0.0 0.0 0.0
Province - ON 0.0 0.0 0.0
Province - QC 0.0 0.0 0.0
SUB TOTAL - PROVINCES 0.0 0.0 0.0
OTHER
MFA 100.0 100.0 100.0
SUB TOTAL - OTHER 100.0 100.0 100.0
TOTAL PORTFOLIO 1,114.4 1,028.8 977.0

APPENDIX “II-2”
SCHEDULE 2 - 1
MATURITY PURCHASE # OFDATE DATE SECURITY DAYS PRINCIPAL TOTAL
ROYAL BANK MONTH END BALANCE
30-Sep-17 Royal Bank 139,140,746.59
30-Sep-17 Royal Bank USD Account (CAD$) 182,169.82 139,322,916.41
CALL LOAN
14-Dec-17 14-Dec-16 Vancity Credit Union 1 year cashable term deposit 365 5,000,000.00 20,000,000.00
29-Mar-18 29-Mar-17 Prospera Credit Union 1 year cashable term deposit 365 5,000,000.00
29-Mar-18 29-Mar-17 Prospera Credit Union 1 year cashable term deposit 365 5,000,000.00
29-Mar-18 29-Mar-17 Prospera Credit Union 1 year cashable term deposit 365 5,000,000.00
MAJOR BANKS - SCHEDULE I
28-Mar-18 15-Mar-12 Bank of Montreal Zero Coupon 2204 2,509,500.00
28-Mar-18 17-Oct-12 Bank of Montreal Zero Coupon 1988 3,407,086.73
22-Mar-24 22-Mar-17 Bank of Montreal Step Up 2557 9,967,641.77
16-Dec-26 16-Dec-16 Bank of Montreal Step Up 3652 9,953,956.74
*** BANK OF MONTREAL 25,838,185.23
18-Oct-19 29-Sep-15 Bank of Nova Scotia Fixed Floater 1480 10,194,674.26
18-Oct-19 26-Oct-15 Bank of Nova Scotia Fixed Floater 1453 6,089,023.07
18-Oct-19 13-Apr-16 Bank of Nova Scotia Fixed Floater 1283 5,084,947.23
18-Oct-19 27-Apr-16 Bank of Nova Scotia Zero Coupon 1269 9,248,000.00
18-Oct-19 01-Jun-16 Bank of Nova Scotia Fixed Floater 1234 5,084,748.78
21-Aug-20 21-Aug-15 Bank of Nova Scotia GIC 1827 8,000,000.00
*** BANK OF NOVA SCOTIA 43,701,393.34
06-Jun-18 26-Jan-10 Canadian Imperial Bank of Commerce Zero Coupon 3053 2,122,890.00
06-Jun-18 26-Oct-15 Canadian Imperial Bank of Commerce Zero Coupon 954 4,744,500.00
19-Feb-25 19-Feb-15 Canadian Imperial Bank of Commerce Step Up 3653 9,970,457.16
*** CANADIAN IMPERIAL BANK OF COMMERCE 16,837,847.16
01-Jan-18 23-Jun-17 Canadian Western Bank Savings Account 192 20,000,000.00
22-Mar-18 20-Sep-16 Canadian Western Bank Deposit Note 548 5,013,841.61
19-Feb-19 19-May-17 Canadian Western Bank GIC 641 5,000,000.00
17-Dec-19 28-Apr-14 Canadian Western Bank Fixed Floater 2059 3,032,323.11
17-Dec-19 22-May-15 Canadian Western Bank Fixed Floater 1670 5,059,896.80
17-Dec-19 08-Apr-15 Canadian Western Bank Fixed Floater 1714 10,180,374.39
17-Dec-19 03-Jul-15 Canadian Western Bank Fixed Floater 1628 5,083,104.15
17-Dec-19 16-Sep-15 Canadian Western Bank Fixed Floater 1553 5,048,326.46
17-Dec-19 26-Nov-15 Canadian Western Bank Fixed Floater 1482 2,014,702.43
17-Dec-19 19-Oct-15 Canadian Western Bank Fixed Floater 1520 5,038,730.69
17-Dec-19 20-May-16 Canadian Western Bank Fixed Floater 1306 6,017,796.02
17-Dec-19 17-May-17 Canadian Western Bank Fixed Floater 944 3,275,201.46
29-Jun-20 13-Apr-16 Canadian Western Bank Deposit Note 1538 10,061,957.22
29-Jun-20 20-May-16 Canadian Western Bank Deposit Note 1501 3,010,253.64
29-Jun-20 11-Oct-16 Canadian Western Bank Deposit Note 1357 5,056,117.91
13-Sep-21 02-Nov-16 Canadian Western Bank Deposit Note 1776 5,042,656.25
*** CANADIAN WESTERN BANK 97,935,282.13
19-Oct-17 25-Aug-15 Laurentian Bank of Canada Fixed Floater 786 4,002,365.19
19-Oct-17 02-Nov-15 Laurentian Bank of Canada Fixed Floater 717 5,002,309.62
19-Oct-17 25-Aug-15 Laurentian Bank of Canada Fixed Floater 786 8,004,580.15
19-Oct-17 19-Oct-15 Laurentian Bank of Canada Fixed Floater 731 2,000,806.18
19-Oct-17 11-Oct-16 Laurentian Bank of Canada Fixed Floater 373 6,002,950.46
19-Oct-17 05-Jun-17 Laurentian Bank of Canada Fixed Floater 136 2,009,625.09
26-Mar-18 02-Nov-15 Laurentian Bank of Canada Deposit Note 875 1,001,448.23
15-Oct-18 09-Jul-14 Laurentian Bank of Canada Deposit Note 1559 10,070,087.04
15-Oct-18 14-Sep-17 Laurentian Bank of Canada Deposit Note 396 2,050,252.26
31-May-19 31-May-17 Laurentian Bank of Canada GIC 730 8,000,000.00
23-Jan-20 19-Oct-15 Laurentian Bank of Canada Deposit Note 1557 4,980,241.62
23-Jan-20 26-Nov-15 Laurentian Bank of Canada Deposit Note 1519 9,969,996.05
23-Jan-20 16-Sep-15 Laurentian Bank of Canada Deposit Note 1590 10,038,484.28
22-Apr-21 01-Jun-16 Laurentian Bank of Canada Deposit Note 1786 4,030,547.59
22-Apr-21 02-Nov-16 Laurentian Bank of Canada Deposit Note 1632 5,093,922.79
22-Apr-21 14-Sep-17 Laurentian Bank of Canada Deposit Note 1316 3,036,682.81
12-Sep-22 12-Sep-17 Laurentian Bank of Canada Deposit Note 1826 10,027,411.77
*** LAURENTIAN BANK OF CANADA 95,321,711.14
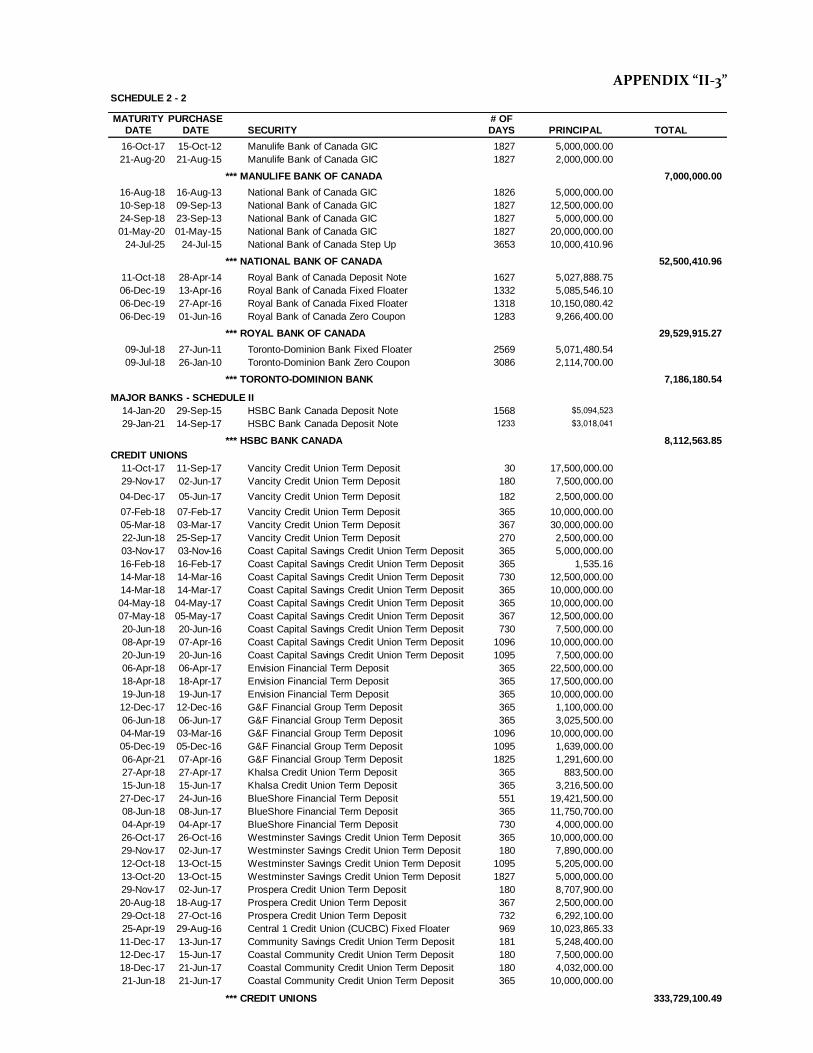
APPENDIX “II-3”
SCHEDULE 2 - 2
MATURITY PURCHASE # OFDATE DATE SECURITY DAYS PRINCIPAL TOTAL
16-Oct-17 15-Oct-12 Manulife Bank of Canada GIC 1827 5,000,000.00
21-Aug-20 21-Aug-15 Manulife Bank of Canada GIC 1827 2,000,000.00
*** MANULIFE BANK OF CANADA 7,000,000.00
16-Aug-18 16-Aug-13 National Bank of Canada GIC 1826 5,000,000.00
10-Sep-18 09-Sep-13 National Bank of Canada GIC 1827 12,500,000.00
24-Sep-18 23-Sep-13 National Bank of Canada GIC 1827 5,000,000.00
01-May-20 01-May-15 National Bank of Canada GIC 1827 20,000,000.00
24-Jul-25 24-Jul-15 National Bank of Canada Step Up 3653 10,000,410.96
*** NATIONAL BANK OF CANADA 52,500,410.96
11-Oct-18 28-Apr-14 Royal Bank of Canada Deposit Note 1627 5,027,888.75
06-Dec-19 13-Apr-16 Royal Bank of Canada Fixed Floater 1332 5,085,546.10
06-Dec-19 27-Apr-16 Royal Bank of Canada Fixed Floater 1318 10,150,080.42
06-Dec-19 01-Jun-16 Royal Bank of Canada Zero Coupon 1283 9,266,400.00
*** ROYAL BANK OF CANADA 29,529,915.27
09-Jul-18 27-Jun-11 Toronto-Dominion Bank Fixed Floater 2569 5,071,480.54
09-Jul-18 26-Jan-10 Toronto-Dominion Bank Zero Coupon 3086 2,114,700.00
*** TORONTO-DOMINION BANK 7,186,180.54
MAJOR BANKS - SCHEDULE II
14-Jan-20 29-Sep-15 HSBC Bank Canada Deposit Note 1568 $5,094,523
29-Jan-21 14-Sep-17 HSBC Bank Canada Deposit Note 1233 $3,018,041
*** HSBC BANK CANADA 8,112,563.85
CREDIT UNIONS
11-Oct-17 11-Sep-17 Vancity Credit Union Term Deposit 30 17,500,000.00
29-Nov-17 02-Jun-17 Vancity Credit Union Term Deposit 180 7,500,000.00
04-Dec-17 05-Jun-17 Vancity Credit Union Term Deposit 182 2,500,000.00
07-Feb-18 07-Feb-17 Vancity Credit Union Term Deposit 365 10,000,000.00
05-Mar-18 03-Mar-17 Vancity Credit Union Term Deposit 367 30,000,000.00
22-Jun-18 25-Sep-17 Vancity Credit Union Term Deposit 270 2,500,000.00
03-Nov-17 03-Nov-16 Coast Capital Savings Credit Union Term Deposit 365 5,000,000.00
16-Feb-18 16-Feb-17 Coast Capital Savings Credit Union Term Deposit 365 1,535.16
14-Mar-18 14-Mar-16 Coast Capital Savings Credit Union Term Deposit 730 12,500,000.00
14-Mar-18 14-Mar-17 Coast Capital Savings Credit Union Term Deposit 365 10,000,000.00
04-May-18 04-May-17 Coast Capital Savings Credit Union Term Deposit 365 10,000,000.00
07-May-18 05-May-17 Coast Capital Savings Credit Union Term Deposit 367 12,500,000.00
20-Jun-18 20-Jun-16 Coast Capital Savings Credit Union Term Deposit 730 7,500,000.00
08-Apr-19 07-Apr-16 Coast Capital Savings Credit Union Term Deposit 1096 10,000,000.00
20-Jun-19 20-Jun-16 Coast Capital Savings Credit Union Term Deposit 1095 7,500,000.00
06-Apr-18 06-Apr-17 Envision Financial Term Deposit 365 22,500,000.00
18-Apr-18 18-Apr-17 Envision Financial Term Deposit 365 17,500,000.00
19-Jun-18 19-Jun-17 Envision Financial Term Deposit 365 10,000,000.00
12-Dec-17 12-Dec-16 G&F Financial Group Term Deposit 365 1,100,000.00
06-Jun-18 06-Jun-17 G&F Financial Group Term Deposit 365 3,025,500.00
04-Mar-19 03-Mar-16 G&F Financial Group Term Deposit 1096 10,000,000.00
05-Dec-19 05-Dec-16 G&F Financial Group Term Deposit 1095 1,639,000.00
06-Apr-21 07-Apr-16 G&F Financial Group Term Deposit 1825 1,291,600.00
27-Apr-18 27-Apr-17 Khalsa Credit Union Term Deposit 365 883,500.00
15-Jun-18 15-Jun-17 Khalsa Credit Union Term Deposit 365 3,216,500.00
27-Dec-17 24-Jun-16 BlueShore Financial Term Deposit 551 19,421,500.00
08-Jun-18 08-Jun-17 BlueShore Financial Term Deposit 365 11,750,700.00
04-Apr-19 04-Apr-17 BlueShore Financial Term Deposit 730 4,000,000.00
26-Oct-17 26-Oct-16 Westminster Savings Credit Union Term Deposit 365 10,000,000.00
29-Nov-17 02-Jun-17 Westminster Savings Credit Union Term Deposit 180 7,890,000.00
12-Oct-18 13-Oct-15 Westminster Savings Credit Union Term Deposit 1095 5,205,000.00
13-Oct-20 13-Oct-15 Westminster Savings Credit Union Term Deposit 1827 5,000,000.00
29-Nov-17 02-Jun-17 Prospera Credit Union Term Deposit 180 8,707,900.00
20-Aug-18 18-Aug-17 Prospera Credit Union Term Deposit 367 2,500,000.00
29-Oct-18 27-Oct-16 Prospera Credit Union Term Deposit 732 6,292,100.00
25-Apr-19 29-Aug-16 Central 1 Credit Union (CUCBC) Fixed Floater 969 10,023,865.33
11-Dec-17 13-Jun-17 Community Savings Credit Union Term Deposit 181 5,248,400.00
12-Dec-17 15-Jun-17 Coastal Community Credit Union Term Deposit 180 7,500,000.00
18-Dec-17 21-Jun-17 Coastal Community Credit Union Term Deposit 180 4,032,000.00
21-Jun-18 21-Jun-17 Coastal Community Credit Union Term Deposit 365 10,000,000.00
*** CREDIT UNIONS 333,729,100.49

APPENDIX “II-4”
SCHEDULE 2 - 3
MATURITY PURCHASE # OFDATE DATE SECURITY DAYS PRINCIPAL TOTAL
PROVINCIAL GUARANTEED PAPER
*** BRITISH COLUMBIA -
*** ONTARIO -
*** QUEBEC -
Open 14-Sep-12 BCMFA Investment Pool-money Market Fund 1,000,000.00
Open 10-Jun-13 BCMFA Investment Pool-money Market Fund 40,000,000.00
Open 25-Jul-16 BCMFA Investment Pool-money Market Fund 19,000,000.00
Open 10-Aug-16 BCMFA Investment Pool-money Market Fund 20,000,000.00
Open 23-Aug-16 BCMFA Investment Pool-money Market Fund 20,000,000.00
*** BC MUNCIPAL FINANCE AUTHORITY 100,000,000.00
TOTAL PORTFOLIO 977,015,506.52

FINANCIAL ASSISTANCE AWARDSsince 2017 Community Grants were approved
to September 30, 2017
Description Amount
Community Grants Awarded November 17, 2016 1,545,375$
Community Grants (late grants)Volunteer Cancer Drivers Society 1,500
3300 BCR Bhai Kanhaiya RCACC 1,000
Progressive Intercultural Community Services Society (PICS) 1,000
Sikh Motorcycle Club 500
Surrey Urban Farmers Market 2,000
Surrey Urban Farmers Market 2,000
8,000$
Neighbourhood Enhancement GrantsNewton Tickle Trunk 2,000
SSCC Community Summit 1,000
Friends of the PLOT 3,000
Alexandra N. House 3,000
129 St. Block Party 750
United Way Avenues of Change 1,000
Chinese Traditional Festival -
Fun Fun Park Cleanup Day 740
Adams Road Community Festival 1,000
Rising Tides Skin Boats Project 320
Clayton Community Festival 1,000
Youth Basketball Tournament 550
Skylands Black Party 500
Blockwatch 3-076 Canada Day Celebration 325
Ocean Park Blooms in the Village Planter Project 900
Country Woods Neighbourhood Celebration 1,000
Surrey Skill Share Fair 1,000
58B Block Party 500
60th Avenue Block Party 500
Clayton Block Watch BBQ 265
135 Street Block Party 440
59 A Avenue Block Party 500
International Day of Yoga 1,000
Harvest Wynde (75 Ave) Block Party 500
69 Avenue Block Party 500
100 Avenue Block Party 500
Jedburgh Place Block Party 500
St. James Block Party 500
Love Newton Community Nights 1,000
Gratitude Garden Project 3,000
Spirit Garden Irrigation Project 2,900
WeLive2Empower 1,000
Panorama Neighbour's Block Party 500
Sequoia Park Block Party 300
165A St Block Party 500
85A Avenue Block Party 350
70A Avenue Block Party 500
Bark Park 2,000
150 B St Block Party 500
158 St The Oliver Bloack Party 500
Amble Greene Halloween Parade 500
Waterstone Block Party 500
109 Ave Cul-de-Sac Garden 350
105 Ave Block Party 500
Claytonwood Grove Block Party 500
170A Street Block Party 500
39,690$
Façade Enhancement GrantsNewton Mural Project 2,000
5615 176A St Landscape Project 375
Mason's Cloverdale Home Furnish 3,000
5,375$
Policing at Community Events3300 BCR Bhai Kanhaiya RCACC 772
Heart and Stroke Foundation 1,733
Gurdwara Sahib Dashmesh Darbar 35,000
Guru Nanak Sikh Gurdwara 7,766
45,270$
Sports Tourism GrantsSurrey Female Hockey Association 1,200
Langley Curling Club 100
SportAbility BC 1,500
BC Ultimate Society 1,500
West Coast Kings Field Hockey Society 3,500
Canadian Open Fastpitch Society 5,000
NSA Canada BC 1,000
Coastal FC 2,500
Coastal FC 3,000
Field Hockey BC 5,000
BC Amateur Syncronized Swimming Association 2,000
Surrey Hospital & Outpatient Care Foundation 500
Water Polo Canada 1,000
BC Tigers Football Club 3,000
BC Soccer National Championships 4,000
34,800$
Total Grants issued to September 30, 2017 1,678,510$
Unallocated Grant FundingNeighbourhood / Façade Enhancement Program (65)
Policing at Community Events 9,730
Sports Tourism 15,200
One-time Grants 11,650
36,515$
Total Grant Funding for 2017 1,715,025$
APPENDIX “III”