craft in an age of change - crafts council · art, reading to dance, ... craft in an age of change...
TRANSCRIPT
Craft in an Age of Change
Crafts Council
Creative Scotland
Arts Council of Wales
Craft Northern Ireland
February 2012
ii
Contents
Acknowledgements .................................................. 1
Foreword ..................................................................... 2
1. Executive Summary ............................................... 3
1.1 Findings of the research .................................................................. 3
1.2 Makers and their businesses ......................................................... 3
1.3 Profiles of makers ............................................................................. 5
1.4 Overall size of sector ....................................................................... 5
1.5 Retailers’ businesses ....................................................................... 7
1.6 Educators, writers and curators .................................................... 7
1.7 Demographic profile of respondents ........................................... 7
1.8 Broader themes ................................................................................ 8
1.9 Conclusions ....................................................................................... 8
2. Introduction .......................................................... 11
2.1 Structure of the report.................................................................... 12
3. Background and Context ................................... 13
3.1 Sector definitions ........................................................................... 13
3.2 Understanding of practice ............................................................ 14
3.3 Economic prospects ..................................................................... 15
3.4 Role of higher education .............................................................. 15
3.5 Craft and the creative industries ................................................. 16
4. Findings: demographic and business
structure .................................................................... 18
4.1 Presentation of the findings ......................................................... 18
4.2 Demographic profile of respondents ......................................... 18
4.3 Makers and their businesses .......................................................21
4.4 Makers’ gross income .................................................................. 25
4.5 The four nations of the UK ........................................................... 29
4.6 Retailers’ businesses .................................................................... 30
4.7 Educators, writers and curators .................................................. 33
5. Findings: profiles of makers .............................. 35
6. Findings: four themes ......................................... 39
6.1 How are internet and digital technologies shaping craft
practice? ................................................................................................ 39
6.2 How does the global vs local debate play out in the sector? 40
6.3 To what extent are issues of sustainability affecting
practice in the craft sector? ............................................................... 43
6.4 Recent economic changes in the sector .................................. 44
7. Conclusions ..........................................................46
8. Appendix 1: Makers from England ...................49
8.1 Demographic profile ..................................................................... 49
8.2 Survey respondents ...................................................................... 49
8.3 Makers’ profiles.............................................................................. 50
8.4 Makers’ businesses ...................................................................... 50
8.5 Wider issues in the craft sector .................................................. 51
9. Appendix 2: Makers from Scotland .................. 77
9.1 Demographic profile ...................................................................... 77
9.2 Survey respondents ....................................................................... 77
9.3 Makers’ profiles...............................................................................78
9.4 Makers’ businesses .......................................................................78
iii
9.5 Wider issues in the craft sector ................................................... 79
10. Appendix 3: Makers from Wales .................. 105
10.1 Demographic profile ................................................................. 105
10.2 Survey respondents ................................................................. 105
10.3 Makers’ profiles ......................................................................... 106
10.4 Makers’ businesses .................................................................. 106
10.5 Wider issues in the craft sector ............................................... 107
11. Appendix 4: Makers from Northern Ireland 133
11.1 Demographic profile .................................................................. 133
11.2 Survey respondents ................................................................... 133
11.3 Makers’ profile .............................................................................134
11.4 Makers’ businesses ...................................................................134
11.5 Wider issues in the craft sector ............................................... 135
12. Appendix 5: Retailers ...................................... 161
13. Appendix 6: Educators, writers and curators177
14. Appendix 7: Literature review ....................... 189
14.1 Sector definitions ....................................................................... 189
14.2 Economic impact ....................................................................... 190
14.3 Maker characteristics ............................................................... 192
14.4 Business characteristics .......................................................... 194
14.5 Business activity breakdown .................................................. 195
14.6 Education and professional development ........................... 195
14.7 Selling and marketing ............................................................... 196
15. Appendix 8: Methodology ............................ 200
15.1 Number of interviews conducted and targets ..................... 203
15.2 Estimate of total population .................................................... 203
15.3 Calculation of GVA ..................................................................... 205
16. Appendix 9: Consultees ................................ 206
Cover: Studio Glithero, 2011. Photo by Joe Dilworth, courtesy of
Crafts Council.
1
Craft in an Age of Change
www.bop.co.uk Acknowledgements This project was carried out by Josephine Burns, Chris Gibbon and
Cristina Rosemberg of BOP Consulting, and their research associate, Dr
Karen Yair.
BOP Consulting and Dr Yair are grateful for the contributions made by all
those who participated in this work (a number of them are listed in
Appendix 9). In particular, we would like to thank the project’s steering
group for their valuable input and support throughout the research:
• Dr Helen Bennett, Portfolio Manager, Creative Scotland
• Rachel Brockhurst, Research and Information Officer, Crafts Council
• Nathalie Camus, Senior Applied Arts Officer, Arts Council of Wales
• Caroline Docherty, Portfolio Partnership Manager, Creative Scotland
• Alastair Evans, Development Partnership Officer, Creative Scotland
• Rosy Greenlees, Executive Director, Crafts Council
• Amanda Jones, Director of External Relations, Crafts Council
• Sarah Jones, Research Officer, Arts Council of Wales
• Joe Kelly, Director, Craft Northern Ireland
• Beatrice Mayfield, Maker Development Manager, Crafts Council
• Prof. Sara Selwood, Independent adviser
• Helena Ward, Portfolio Manager, Creative Scotland
• Claire West, Director of Programmes, Crafts Council
The commissioning partners would also like to acknowledge the support they receive from the following bodies. Crafts Council:
Arts Council England champions, develops and invests in artistic and
cultural experiences that enrich people’s lives. We support a range of
activities across the arts, museums and libraries – from theatre to digital
art, reading to dance, music to literature, and crafts to collections. Great
art and culture inspires us, brings us together and teaches us about
ourselves and the world around us. In short, it makes life better. Between
2011 and 2015, we will invest £1.4 billion of public money from
government and an estimated £0.85 billion from the National Lottery to
help create these experiences for as many people as possible across the
country. www.artscouncil.org.uk
Craft Northern Ireland:
ISBN-10 1903713315 ISBN-13 9781903713310
2
Craft in an Age of Change
www.bop.co.uk Foreword Craft in an Age of Change is a major survey of contemporary craft at the
beginning of the second decade of the 21st century. It examines the
place of craft in the creative economy and the working patterns of
makers and other craft professionals. It also looks at a number of
increasingly prominent issues, including the value of craft skills and
knowledge in an economy where skills are high on the agenda; the
impact of digital technology on a sector where ‘hand-made’ might be
seen as a de facto requirement; the increasing need for environmental
sensitivity; and the revaluing of the different facets of professional lives
in answer to the 21st century move towards portfolio careers.
While it builds on previous surveys conducted at intervals over the past
two decades, Craft in an Age of Change marks two very significant ‘firsts’
for surveys of the contemporary craft sector in the UK. It is the first
survey to be conducted simultaneously in England, Wales, Scotland and
Northern Ireland, building a truly UK-wide profile and, at the same time,
allowing national similarities and differences to be clearly seen.
Although it focuses on the makers at the heart of all craft practice, it also
differs from previous surveys in looking at the curators, gallery owners,
retailers, academics, educators and writers who all play vital roles in
shaping the current and future nature of the craft sector.
Commissioned from BOP Consulting by four partners – the Crafts
Council, Creative Scotland, the Arts Council of Wales and Craft Northern
Ireland – the survey provides a wealth of information and statistics. It
demonstrates that craft continues to develop and evolve in response to
the world around it, reacting to economic, cultural, technological and
social changes as they unfold, while retaining its core values and
purpose.
Up-to-date knowledge and robust data is crucial for informing policy to
support the craft sector, and we trust that policy-makers, funders, trade
organisations and the media, as well as craft professionals, will find the
report equally useful.
We thank the makers and craft professionals who participated in the
survey underpinning this report for giving their time and goodwill.
Rosy Greenlees, Executive Director, Crafts Council
Andrew Dixon, Chief Executive, Creative Scotland
Nick Capaldi, Chief Executive, Arts Council of Wales
Joe Kelly, Director, Craft Northern Ireland
3
Craft in an Age of Change
www.bop.co.uk 1. Executive Summary Early in 2011 BOP Consulting was commissioned to carry out a mapping
and impact study of the contemporary craft sector. This report – Craft in
an Age of Change – reviews the research that was conducted, and
explores its findings. It examines the profile of craftspeople and their
businesses, and considers the ways in which they are changing.
The research took a number of forms: a literature review, a series of
focus groups, interviews with experts, meetings with a steering group,
and a large phone survey of over 2,000 makers, retailers, educators and
curators. The literature review and the qualitative research (focus groups
and interviews) helped identify certain themes which were examined in
the phone survey.
‘Contemporary’ craft is clearly a term that is open to different
interpretations. For this reason, the survey did not attempt to impose a
rigid definition of the sector based on materials used or disciplines. The
approach of the research broadly follows that used in research carried
out in 20041: to identify people who were already on established ‘craft’
databases, and who therefore had self-selected themselves as crafts-
people, and then to ask them if they were commercially active in
‘contemporary’ craft. The survey did not include hobbyists and makers
of traditional or heritage craft.2
1 McAuley, A. and Fillis, I. (2004) Making it in the 21st Century: a socio-economic study of crafts activity in England and Wales, 2002 – 2003, Crafts Council, London. 2 The survey issued in Scotland was adjusted to make clear that makers who describe their work as ‘indigenous’ were to be included. Creative Scotland defines indigenous crafts as ‘those which have their origins in the cultures of Scotland’ – and wanted makers who are taking such practice forward and innovating to be included.
1.1 Findings of the research The survey suggests that, in many respects, the structure of the
contemporary craft sector is relatively stable. It remains dominated by
small, well-established businesses. The characteristics of makers have
changed relatively little since the early 2000s, although practice is
shifting to reflect the new possibilities of digital technology and
environmental and ethical concerns. Retailers reported that, on balance,
their sales had been fairly steady over the last three years. Both retailers
and makers were cautiously optimistic about the future at the time of the
survey (June/July 2011).
Nevertheless, the contemporary craft sector clearly faces challenges in
the years ahead. Insofar as it is possible to tell, given methodological
differences between this survey and previous ones, makers’ gross craft-
related incomes have declined moderately of late. Sales through the
majority of ‘real world’ selling channels have fallen, and while online
sales have grown, they have done so from a low base, and have only
partially compensated for losses elsewhere. There seems to have been
an increase in part-time working, though such workers are earning more
than part-timers in previous surveys were. Net profits remain modest
(more than half of makers report making less than £5,000 a year), and a
significant minority of makers feel they lack the general business skills
they need to grow, especially in marketing. Although the large majority
of makers have other craft-related income sources apart from designing
and making objects, these are, with the exception of teaching, relatively
small contributors to gross income. Craft sales remain locally focused,
with limited exports.
1.2 Makers and their businesses This section explores key characteristics of makers and their business
practices. The phone survey found that:
Education levels: 61% of makers had a degree in art, craft or design,
while 24% had other qualifications in these fields, such as formal
apprenticeships, A levels/O levels/GCSEs or adult education. Only 15%
had no craft-related qualifications.
4
Craft in an Age of Change
www.bop.co.uk
Second careers: For half of makers (50%), craft was a second career.
Business type: 88% of makers are sole traders.
The average gross income in 2010 (adding craft-related and non craft-
related income) was £23,485. (See section 4.4 for more detailed
explanations around gross income.) As most makers are sole traders,
the distinction between a maker as a business and as an individual is
often blurred in reality. Figure 1 attempts to make the various strands of
income clear. There are two elements. The first of these is the gross
income from all forms of a maker’s craft practice (whether that be the
making of objects or another form of practice, such as consultancy).
These strands are referred to in Figure 1 as the craft-related income from
a maker’s business.
However, many makers, as individuals, also receive income from non-
craft related sources, such as part-time jobs or pensions. This is part of a
craft-maker’s income, and indeed may be necessary in order to support
the maker’s practice, but it is not directly derived from that practice. It
has therefore been shown separately in Figure 1, as maker’s non-craft
related income. Taking the two constituents of gross income in turn:
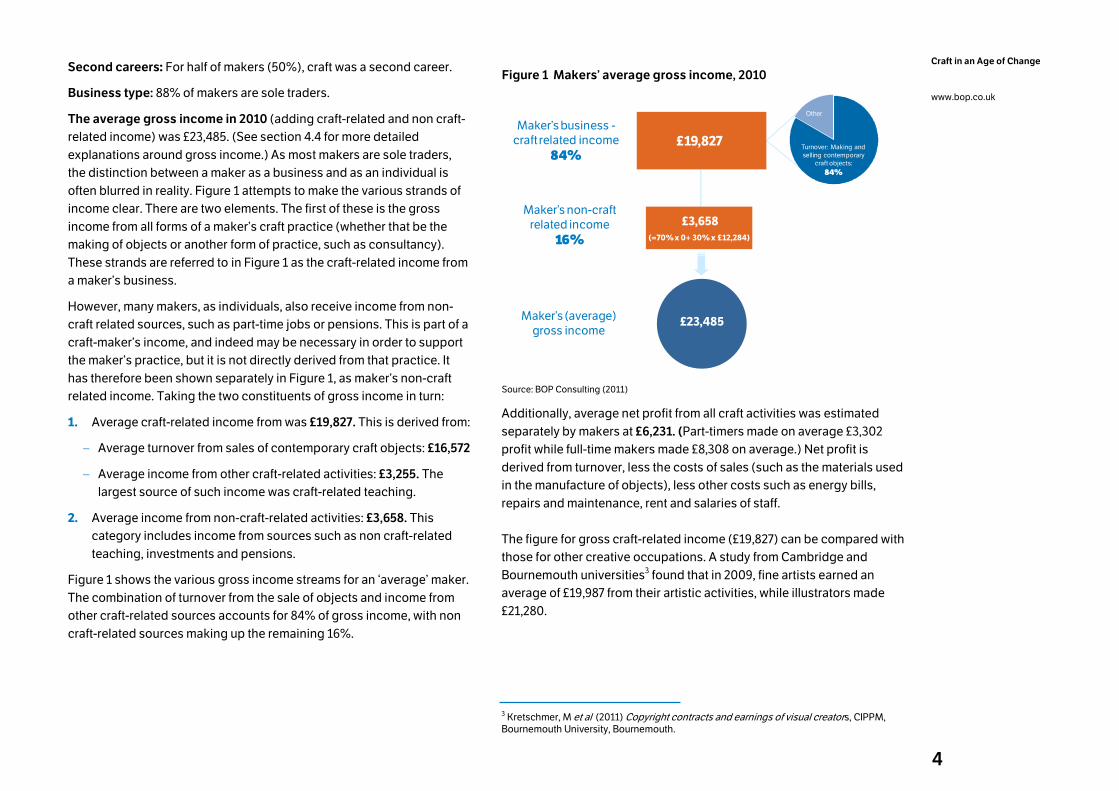
1. Average craft-related income from was £19,827. This is derived from:
– Average turnover from sales of contemporary craft objects: £16,572
– Average income from other craft-related activities: £3,255. The
largest source of such income was craft-related teaching.
2. Average income from non-craft-related activities: £3,658. This
category includes income from sources such as non craft-related
teaching, investments and pensions.
Figure 1 shows the various gross income streams for an ‘average’ maker.
The combination of turnover from the sale of objects and income from
other craft-related sources accounts for 84% of gross income, with non
craft-related sources making up the remaining 16%.
Figure 1 Makers’ average gross income, 2010
£23,485
Maker’s business -craft related income
84%
Maker’s non-craft related income
16%
£19,827
£3,658
(=70% x 0+ 30% x £12,284)
Turnover: Making and
selling contemporary craft objects:
84%
Other
Maker’s (average) gross income
Source: BOP Consulting (2011)
Additionally, average net profit from all craft activities was estimated
separately by makers at £6,231. (Part-timers made on average £3,302
profit while full-time makers made £8,308 on average.) Net profit is
derived from turnover, less the costs of sales (such as the materials used
in the manufacture of objects), less other costs such as energy bills,
repairs and maintenance, rent and salaries of staff.
The figure for gross craft-related income (£19,827) can be compared with
those for other creative occupations. A study from Cambridge and
Bournemouth universities3 found that in 2009, fine artists earned an
average of £19,987 from their artistic activities, while illustrators made
£21,280.
3 Kretschmer, M et al (2011) Copyright contracts and earnings of visual creators, CIPPM, Bournemouth University, Bournemouth.
5
Craft in an Age of Change
www.bop.co.uk
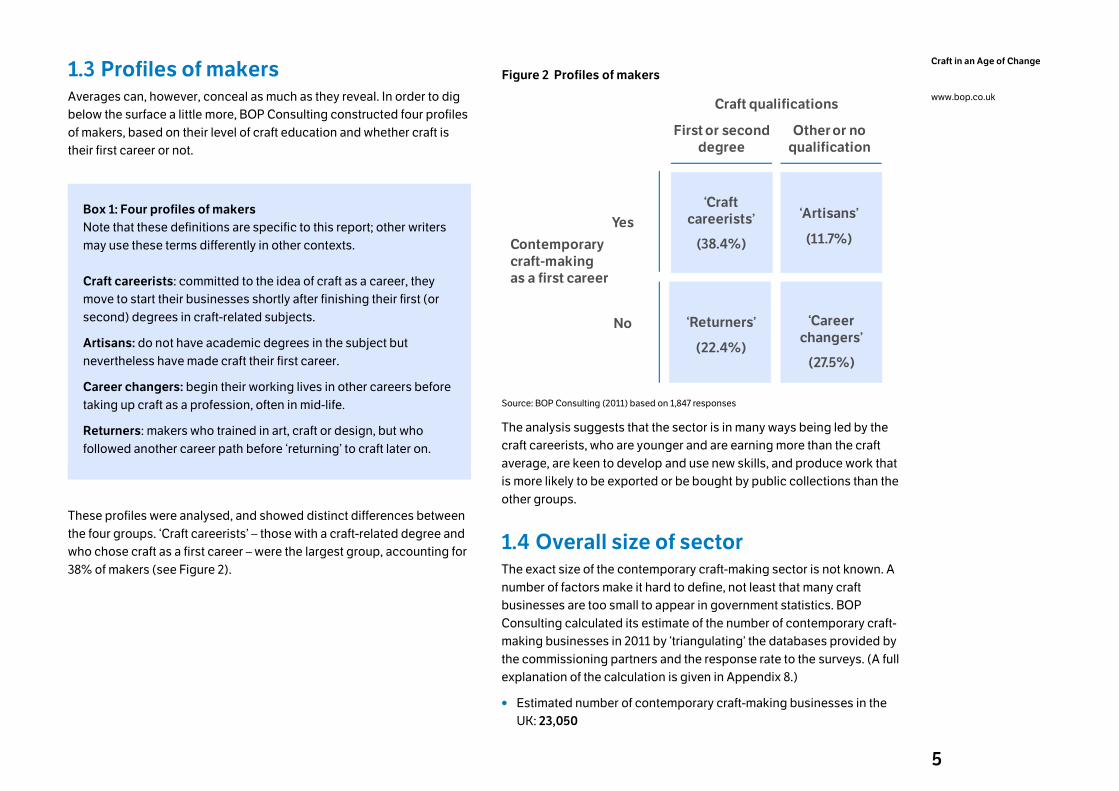
1.3 Profiles of makers Averages can, however, conceal as much as they reveaI. In order to dig
below the surface a little more, BOP Consulting constructed four profiles
of makers, based on their level of craft education and whether craft is
their first career or not.
Box 1: Four profiles of makers
Note that these definitions are specific to this report; other writers
may use these terms differently in other contexts.
Craft careerists: committed to the idea of craft as a career, they
move to start their businesses shortly after finishing their first (or
second) degrees in craft-related subjects.
Artisans: do not have academic degrees in the subject but
nevertheless have made craft their first career.
Career changers: begin their working lives in other careers before
taking up craft as a profession, often in mid-life.
Returners: makers who trained in art, craft or design, but who
followed another career path before ‘returning’ to craft later on.
These profiles were analysed, and showed distinct differences between
the four groups. ‘Craft careerists’ – those with a craft-related degree and
who chose craft as a first career – were the largest group, accounting for
38% of makers (see Figure 2).
Figure 2 Profiles of makers
Craft qualifications
First or second
degree
Other or no
qualification
Contemporary
craft-making
as a first career
Yes
No
‘Craft
careerists’
(38.4%)
‘Artisans’
(11.7%)
‘Returners’
(22.4%)
‘Career
changers’
(27.5%)
Source: BOP Consulting (2011) based on 1,847 responses
The analysis suggests that the sector is in many ways being led by the
craft careerists, who are younger and are earning more than the craft
average, are keen to develop and use new skills, and produce work that
is more likely to be exported or be bought by public collections than the
other groups.
1.4 Overall size of sector The exact size of the contemporary craft-making sector is not known. A
number of factors make it hard to define, not least that many craft
businesses are too small to appear in government statistics. BOP
Consulting calculated its estimate of the number of contemporary craft-
making businesses in 2011 by ‘triangulating’ the databases provided by
the commissioning partners and the response rate to the surveys. (A full
explanation of the calculation is given in Appendix 8.)
• Estimated number of contemporary craft-making businesses in the
UK: 23,050
6
Craft in an Age of Change
www.bop.co.uk
It is difficult to make direct comparisons between this figure and those
from other sectors, as methodologies and the basis of calculation differ.
Nevertheless, there is still value in looking at estimates from public
agencies of the number of professionals in other creative fields. Creative
& Cultural Skills, for example, has estimated that in 2008/09 there were
28,490 visual artists and 28,545 actors, singers, musicians and other
entertainers in the UK.
Multiplying the number of businesses by the average craft-related
income gives estimated total income for all contemporary craft-
making businesses of £457m. As points of comparison from other
creative industries, total revenues for London West End theatres were
£512m in 20104, while spending on music downloads in the UK was
£316m5 in the same year.
This figure for total craft-related income in the sector is lower than some
previous estimates. One explanation is methodological – in the current
survey, makers were asked to give a specific figure for their income,
rather than indicating a band into which their income fell. This approach
is likely to be more accurate than the ‘band’ one, but also to report lower
overall totals. The greater level of part-time working recorded in this
latest survey also explains a large part of the gap. This change may be
driven by the tough economic climate.
BOP Consulting also prepared a calculation of Gross Value Added
(GVA) – how much value craft-makers add by transforming their raw
materials into finished products and services.6 This was estimated at
£220m for 2011.
4 Figure from the Society of London Theatres, quoted in http://www.thestage.co.uk/news/newsstory.php/31087/theatreland-enjoys-golden-age-despite-ash- accessed 14 October 2011 5 Figure from BPI Annual Yearbook 2010 6 Details of the GVA calculation can be found in appendix 8.
Total craft-related income of makers by nation
This estimate of total income can be broken down by nation, based on
the estimated number of businesses:
• England: £339m from 17,150 businesses
• Scotland: £70m from 3,350 businesses
• Wales: £28m from 1,500 businesses
• Northern Ireland: £20m from 1,050 businesses
Differences between nations (makers)
The sample sizes for makers were large enough to allow for robust
results at the level of the four nations of the UK. Analysis indicated that
there are few statistically significant differences between makers in the
four countries, although there are small variations.
Makers in England have, on average, been in business a little longer
than those in the other three countries, and are more likely to have
relevant degrees. However, this does not translate into higher average
turnover in England. Tourism was less important to makers in England
than in the other three countries.
Makers in Scotland worked slightly longer hours than the UK average
and had the highest craft-related income of the four nations (though this
difference is not large enough to be statistically significant). Makers in
Scotland were also more likely to be using internet selling channels than
the UK average, and were also a little more optimistic about the next
three years.
Makers in Wales were more likely to be male, and had the highest
average age in the four nations. Wales was also the only country in
which ‘career changers’ made up the largest group among makers – in
the other three, it was ‘craft careerists’. Levels of sole trading were a little
lower in Wales than the UK average.
Makers in Northern Ireland were a little more likely to work away from
home, and to sell through commissioning, though were less likely to do
so through galleries and exhibitions and online routes than makers in
the UK as a whole. Makers were also more likely than those in other
7
Craft in an Age of Change
www.bop.co.uk
nations to report having had business training since they began their
professional careers.
1.5 Retailers’ businesses Craft is sold through a number of routes. Sometimes makers sell directly
to the public, through craft fairs, specialist street markets or by having
their work commissioned, for example. In many cases, though, craft is
sold on the makers’ behalf by a retailer. In order to understand this
element of the craft ‘value chain’, 128 craft retailers from across the UK
were spoken to as part of the phone survey. The retailers’ database from
which the interviewees were drawn included commercial galleries, sales
outlets within public galleries and museums, craft shops and online
retailers.
The sample of 128 is smaller than that for makers, and cannot be
considered to be as statistically robust. Nevertheless, the results are
indicative of the shape of the craft retail sector.
Their retail unit is typically a gallery or shop, though online selling
through a business website is important for a minority. Just under half
the retailers surveyed sold only contemporary craft objects (44%), while
the remainder also sold other items, most usually fine art or stationery,
gifts and cards. Jewellery, ceramics and textiles were the most
frequently sold craft disciplines, with jewellery being the main revenue-
earner for almost half of the retailers. A typical craft retail business has
been in existence for just under 20 years, and employs 4.5 people.
1.6 Educators, writers and curators The researchers also sought to speak to professionals who earn a living
from craft but who do not primarily make objects, including educators,
writers and curators. In all, 71 of these were interviewed, with
representation from all four nations of the UK. Once again, this sample is
too small to achieve the same level of statistical robustness as the
makers’ data, but the results can be treated as indicative.
Educators, writers and curators are in many cases pursuing portfolio
careers in which their income is derived from a mix of activities primarily
in craft or closely related fields (art and design).
• Most of those we spoke to (87%) taught formally, at least part of the
time, usually at a higher education institution.
• Almost 20% taught informally at venues such as community centres,
gallery spaces and colleges, to a wide mix of people.
• Almost 20% had income from writing about craft, typically on a
freelance basis, while 11% earned income from curating.
• Almost a third of them reported earning some money from the making
of contemporary craft objects, though this was not their main source
of income.
1.7 Demographic profile of respondents The demographic profile of all respondents shows that contemporary
craft is in many ways a diverse profession. While the percentage of black
or Asian professionals remains low, the sector is heavily female, with
proportions of foreign-born and dyslexic/disabled people that are above
the national averages.
• Gender: In all, 69% of respondents were female; 31% were male.
• Age: The estimated average age of respondents is 48.7 years.
• Dyslexia and Disability: 11.5% of respondents said they were
dyslexic, 4.1% said they were disabled (excluding dyslexia). (These
two groups include 0.5% who said they were both dyslexic and
disabled.)
• Ethnicity: 81.0% said they were White British, 2.4% were White Irish,
10.0% were Other White (a category that includes many Europeans
and North Americans), while 3.5% were from black, Asian, mixed and
Other backgrounds.
• Foreign-born: Over 12% of respondents were born overseas, with
the United States, Germany, South Africa, the Republic of Ireland and
8
Craft in an Age of Change
www.bop.co.uk
India being the most frequently mentioned places of birth outside the
UK.
1.8 Broader themes The contemporary craft sector has its own particular characteristics, but
it cannot be seen in isolation. As the title of this report suggests, the
current age is one marked by rapid change: in economics, the
environment, and in culture. The impact of these wider changes on craft
was explored in the literature review and the discussions with the focus
groups. From these, four themes emerged, which helped to shape the
phone survey. They were:
• How are internet and digital technologies shaping craft practice?
Well over half (57%) of makers were using digital technology in their
practice or production, with the majority of these doing so often or all the
time.
Makers reported moderate declines in their main selling channels,
especially gallery and exhibitions sales, and a shift towards online sales,
though these were still relatively small. Around 30% of makers were
selling through their own website, but only 3% were selling through
social media.
• How does the global vs local debate play out in the sector?
The majority of makers sell to the domestic market. Over 70% of makers
do not export their products; among those who do, exports account for
almost 20% of turnover.
Retailers too largely serve domestic markets. A large minority of retailers
sold work by overseas makers, but these made up only a small
proportion of their overall sales (6%). Just under 10% of retailers’ sales
were to customers from outside the UK.
• To what extent are issues of sustainability affecting practice in the
sector?
Just under a third (31%) of makers had changed their practice in the last
three years in response to environmental concerns. The most popular
change was to source more environmentally sustainable or sensitive
materials.
• How have recent economic changes affected the sector?
Both makers and retailers were cautiously optimistic about the future at
the time of the survey (June/July 2011). Retailers also said (on balance)
that their sales had been relatively steady over the last three years.
Most makers expected to have to respond to the economic climate by
changing their practice in various ways over time, predicting that they
would introduce new products and make increasing use of new
technology.
1.9 Conclusions It is clear that the contemporary craft sector is likely to come under
pressure from a number of directions in the coming years. This
document is a research report, and does not seek to make direct policy
or strategy recommendations. Nevertheless, the research has flagged
up a number of questions and issues for the future, which are worth
discussing in a little more depth.
• What will the rise of digital technologies do to the concept of
craft?
Digital technology has been on a ‘long march’ through the creative
industries, transforming business models as it goes. The music,
newspaper, photography and film industries have been radically altered,
and even sectors that initially seemed less likely to be affected, such as
book publishing, are now changing fast. Craft too is now being touched
by these developments. The unique, hand-made nature of craft objects
lies at the heart of the profession, reflecting core beliefs such as the
importance of authenticity and the value of workmanship. Yet if
technologies such as 3D printing become ubiquitous, and it becomes
possible to make distinctive objects at the touch of a button, what does
that imply for the whole notion of craft? Will the boundaries between
craft, fine art and design blur still further as a result? Is such a change a
threat to the identity of craft or an opportunity for exchanging ideas
9
Craft in an Age of Change
www.bop.co.uk
across artistic and wider agendas? What will being a craft professional
actually mean in these circumstances?
• What will the economic effects of the ‘age of austerity’ be?
The challenges that Britain’s economy faces over the next few years
suggest that domestic economic growth is likely to remain slow.
Globally, growth is likely to be concentrated in the emerging economies.
Most makers are sole traders, and most of them currently do not export.
How can they be encouraged and supported to find opportunities
overseas? Are there other ways in which makers can use their specialist
skills, knowledge of materials and experience of innovation and product
development to earn money in international markets?
Online sales represent the growth area in the domestic market, albeit
from a low base, but a significant minority of makers feel they lack
marketing skills (including in digital marketing). Currently many buyers
prefer to physically see and touch the object before purchase. How can
craft address this issue? What are the lessons from other art-forms, and
can they be applied to craft? And what are the implications for
commercial galleries?
The domestic market for low- and middle-end creative products of many
kinds (i.e. products other than craft) has been affected for several years
by imports of cheap goods of reasonable quality. The logic of
globalisation and greater competition suggests that the future market
for UK craft will become increasingly concentrated at the higher end,
where originality and aesthetic value count for more than cost and where
skills and knowledge can earn a premium. However, in tough economic
times consumers may cut back on expensive and ‘luxury’ purchases. Is
there a danger of a backlash against conspicuous consumption? How
should craft position itself in such a market?
Economic problems may also affect the type of people who enter the
profession. What will the effect of slow growth be on the career
changers and returners? Will increasing levels of redundancy and
unemployment lead more people to turn to craft as an alternative career,
or will economic uncertainty make people more reluctant to take the
gamble of changing direction?
Finally, will economic pressures accelerate the trend for portfolio
working, as people look to capitalise on their craft skills to bring in
income from a broader range of sources, or will it reduce the number of
opportunities, as other sectors cut back too? Are makers in particular
able to market themselves well enough to develop the profile required to
take up opportunities outside the immediate craft sector?
• What effect will changes to higher education have on craft?
Craft has become ‘professionalised’ in recent years, with first and
second degrees becoming a key pathway into the profession. Teaching
in higher education institutions is also an important source of income for
many craft professionals. Yet there have been signs for some years that
this picture is changing. More specialist craft courses have closed (for
reasons including cost, lack of demand, lack of space, and health and
safety issues) than have opened, while there has been a notable rise in
the number of interdisciplinary courses incorporating a craft element.
Fees are set to rise for university students in England and there is some
early (if incomplete) evidence that numbers applying for art and design
courses are falling as a result (though this follows a surge in 2010). What
do such changes imply for the structure of the craft sector? Will other
routes into the profession – apprenticeships, or working with more
experienced makers – revive, or will interdisciplinary courses and other
degree paths increase in prominence?
• What effect will budget cuts in the arts and cultural sector have?
Craft, like many of the creative industries, has a mixed private-
sector/public-sector economy. As part of the wider effort to restrain
public spending, cuts have been announced to the budget of the DCMS
(in England) and the departments of the devolved governments (in
Scotland, Wales and Northern Ireland) which cover the arts. Local
authorities too are reducing their spending on arts and culture. What will
be the implications for craft, both of the likely reduction in direct
spending on craft (through the purchase and commissioning of craft
work by public collections) and in the arts support infrastructure on
which a sizeable number of craft professionals draw? What will happen
in other commissioning areas where some makers were starting to sell
their services, such as healthcare?
10
Craft in an Age of Change
www.bop.co.uk
• Can craft respond to the growing concerns over environmental
and ethical issues?
Craft would seem, on the face of it, to be well-placed to benefit from
these wider shifts in the culture. Craft-making is often imagined as a
small-scale, ‘authentic’ form of production, rooted in natural materials,
and it is true that many makers have already responded to environmental
and ethical concerns. However, some of the most significant craft
disciplines, such as ceramics and glass, use methods (firing, glazing)
that are not environmentally friendly but which cannot readily be
replaced in current practice.
Can makers, given their often limited financial resources, find ways to
mitigate the potential damage such practices cause?
Closing thoughts
These questions and issues suggest contemporary craft may be facing a
period of unusual turbulence: there have rarely been so many challenges
on so many fronts simultaneously. However, craft has a range of factors
in its favour. It uses modern thinking and technology to build on skills,
knowledge and experience that have been tested over time, and speaks
to deep-seated human instincts: the value of distinctiveness, a pride in
quality and the worth of craftsmanship. Whatever changes may be
coming, the history of the sector suggests that craft professionals will
find ways to re-think and re-invent their practice to adapt to a changing
world, and to allow craft to flourish.
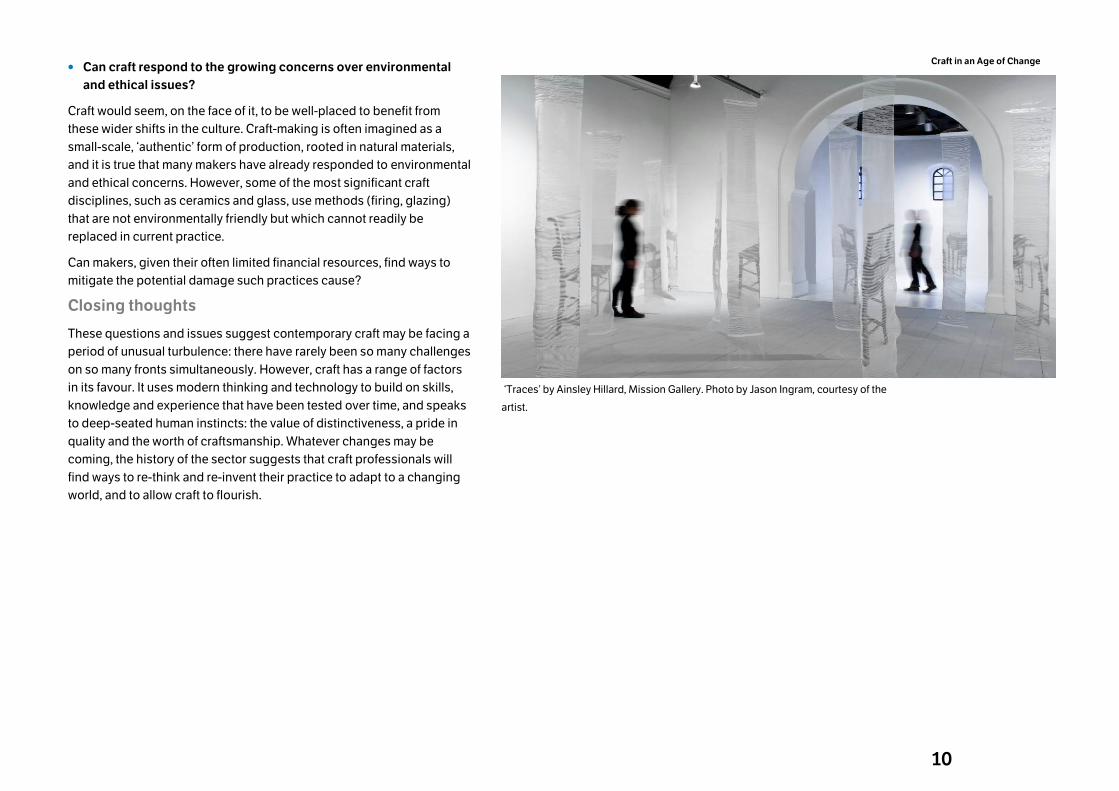
‘Traces’ by Ainsley Hillard, Mission Gallery. Photo by Jason Ingram, courtesy of the
artist.
11
Craft in an Age of Change
www.bop.co.uk 2. Introduction In recent years there has been a revival of cultural and political interest in
craft. From the Craft Council’s world-leading high-end craft fair,
COLLECT, to the ‘Craft Mafias’ which have sprung up in cities such as
Glasgow, Manchester and Leeds, the energy of contemporary craft is
apparent. Perhaps in reaction to an ever more screen–based
entertainment culture, there is a hunger for the authentic and the hand-
made. Within the wider culture this is expressed in a number of ways,
from Richard Sennett’s and Matthew B. Crawford’s well-received books
on the value of working with your hands, to the V & A/Craft Council’s
record-breaking Power of Making exhibition, or the way in which big
businesses such as Levis’ and Camper have tried to appropriate the
notion of craftwork for their own products. Political support too seems to
have grown across the four nations of the UK. Ed Vaizey, the Minister for
Culture, Communications and Creative Industries, went so far as to
declare that ‘craft was enjoying something of a Zeitgeist moment’.7
Craft has been counted as one of the ‘creative industries’ ever since the
term was first adopted by the British government in 1998. However, the
craft sector has always been difficult to measure. The Department for
Culture, Media and Sport (DCMS) produces a range of economic
estimates every year for the industries that fall into its remit, but is unable
to supply figures for the craft sector for many of its indicators. This is due
to the small size of most craft businesses and the difficulty of identifying
makers through the standard industrial and occupational classifications
– it is hard, for instance, to separate out ‘studio’ ceramics from more
industrial processes. Makers also often choose to define themselves by
a variety of terms, such as designer-maker or applied artist – indeed,
they may use different terms depending on the client they are dealing
with.8
7 Vaizey, E. (2010) Show of Hands, GQ magazine, December 2010 8 Schwarz, M. and Yair, K, (2010) Making Value: craft and the economic and social contribution of makers, Crafts Council, London.
In these circumstances it has largely been left to the agencies dealing
with craft to conduct research into the size, value and characteristics of
the sector. These bodies – the Crafts Council, Creative Scotland (the
successor to the Scottish Arts Council), the Arts Council of Wales and
Craft Northern Ireland – have periodically commissioned major studies
into the sector. The last such series of reports was completed between
2002 and 2006. This new report is the first such one to be commissioned
simultaneously by all four organisations. It focuses on contemporary
craft, but attempts to look at the whole ‘value chain’ within that sector:
not just makers but retailers, educators, curators and writers too. A
number of research methods were used to do this, including a literature
review, interviews with experts in craft and focus groups with makers,
academics, writers and retailers. The centrepiece of the study is a large
phone survey of over 2,000 makers, retailers, educators, curators and
writers. In this way the study hopes to provide the fullest picture to date
of Britain’s contemporary craft scene.
The report also explores some of the wider issues affecting the sector.
As the title of this report suggests, in the half-decade or more since the
last set of major studies of the craft sector was released the world
economy has seen considerable changes. Internet and digital
technologies have continued their inexorable spread, disrupting
established business models in industry after industry. Environmental
concerns continue to grow, driven by evidence of climate change.
Globalisation has opened up new markets and opportunities but has
also brought new competition. Meanwhile, the credit crunch and the
subsequent recession threaten to usher in a new era of austerity, in
which both private and public spending is curtailed by the need to pay
down debt.
These forces have had a huge impact on many of the creative industries.
Music, publishing, film, TV and the newspaper business have all been
radically affected by these changes. Where, though, does craft stand?
Have these wider forces transformed its business models too or has its
emphasis on skills, the value of the hand-made and the individuality of
its products allowed it to adapt to and benefit from this new world?
These questions make it a good time to examine what is happening to
the sector.
12
Craft in an Age of Change
www.bop.co.uk
2.1 Structure of the report This report summarises the full set of evidence gathered in the research
process. It begins with a background and context section, drawing on
the literature about contemporary craft. Next are the findings of the
phone survey. These have been split over three chapters. The first
provides a UK-wide profile of craft professionals and their businesses,
before briefly touching on similarities and differences between the four
UK nations. The second chapter considers four profiles BOP Consulting
has developed of ‘typical’ makers. It shows that there are differences
between types of makers connected to their education and career
choices. The third chapter reviews the evidence around four broader
themes that were highlighted in the qualitative research:
• How are internet and digital technologies shaping craft practice?
• How does the global vs local debate play out in the sector?
• To what extent are issues of sustainability affecting practice in the
sector?
• How have recent economic changes affected the sector?
These three ‘findings’ chapters are then followed by a conclusion,
pulling together the main threads of the research and posing some
questions to encourage further debate about the future of craft.
After the main report there is a series of appendices. The first four of
these show the full survey results for makers for each nation in turn. Each
appendix is prefaced by a short summary picking out some of the key
indicators for each country. There are further appendices showing the
full results for retailers and educators, curators and writers. These are
followed by two more appendices containing a full literature review and
a longer discussion of the research methodology and the calculation of
the population estimate. Finally there is a list of the people who were
consulted as part of the project’s research.
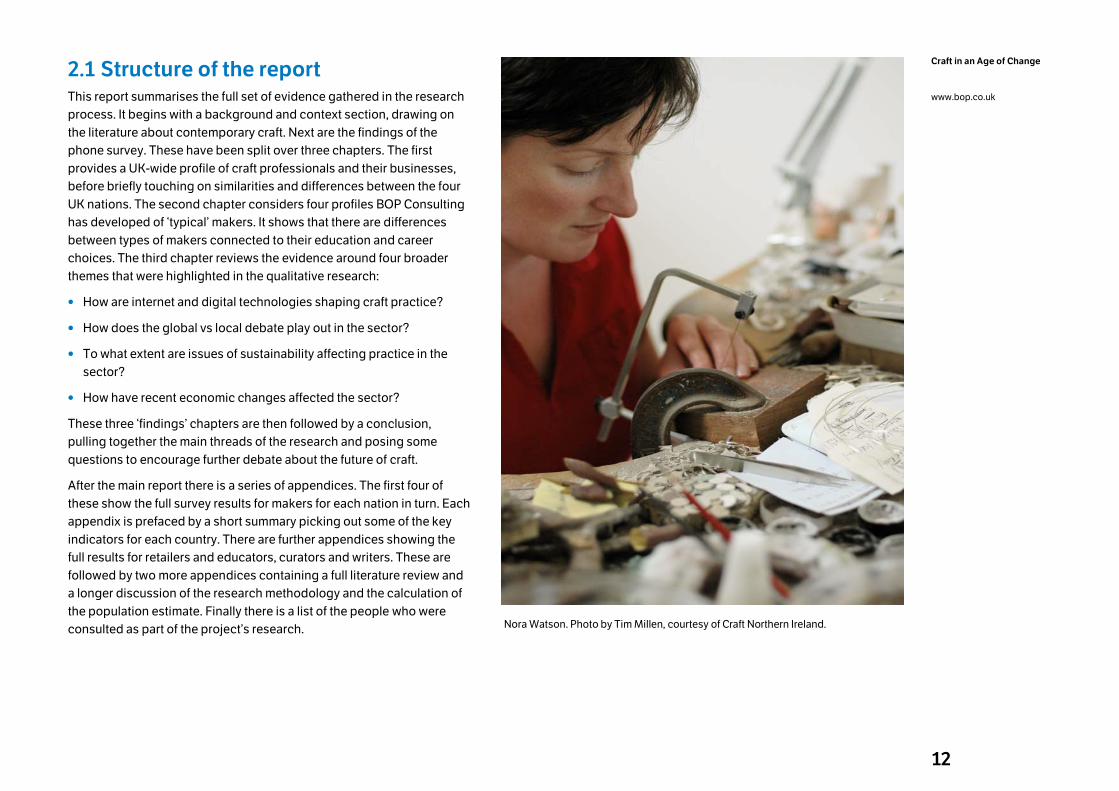
Nora Watson. Photo by Tim Millen, courtesy of Craft Northern Ireland.
13
Craft in an Age of Change
www.bop.co.uk 3. Background and Context This chapter presents the researchers’ understanding of the
contemporary craft sector, as a basis for explaining the methodological
choices made in the course of this study. The sector’s key
characteristics are outlined, and areas of differences in approach
between this study and its predecessors are pinpointed.
The chapter draws on the full literature review (included in this report as
appendix 7). Given the nature of the available literature, the review is
inevitably focused on makers, although evidence relating to the wider
craft sector is included where it exists.
Both this chapter and the literature review draw extensively on
quantitative socio-economic surveys commissioned by the Crafts
Council and the Arts Council of Wales9, a consortium of Scottish
organisations10 and Craft Northern Ireland,11 each conducted by
McAuley and Fillis between 2002 and 2006. These studies’
predecessors,12 13 commissioned by the Crafts Council and its partners,
are also examined, although differences in sector definitions and
methodologies generally preclude much longitudinal analysis between
these and the 2002-06 studies.
The chapter deals in turn with the definition of the sector, the
understanding of practice, the economic context and the role of higher
9 McAuley, A. and Fillis, I (2004) Making it in the 21st Century: a socio-economic study of crafts activity in England and Wales, 2002 – 2003, Crafts Council, London. 10 McAuley, A. and Fillis, I. (2002) Crafts Businesses in Scotland: a study, University of Stirling in partnership with Scottish Arts Council, Scottish Enterprise and Scottish Enterprise, Glasgow. 11 McAuley, A. and Fillis, I. (2006) A Future in the Making – socio-economic survey of the craft sector in Northern Ireland, Craft Northern Ireland, Belfast. 12 Bruce, A. and Filmer, P. (1983) (1983) Working in Crafts, Crafts Council, London.. 13 Knott, C. A. (1994) Crafts in the 1990s. A socio-economic study of craftspeople in England, Scotland and Wales, Crafts Council, London.
education. It concludes with a section looking at craft in a wider ‘creative
industries’ context.
3.1 Sector definitions Definitions of craft-making have evolved steadily since the first
quantitative study of makers working in Britain, published in 1983.14 This
first report, which was limited to England and Wales, focused on makers
who were thought to demonstrate ‘innovation, design and aesthetic
content, and technical competence,’ and whose work ‘occupies the
ground between the Arts Council and Design Council’.
The next study, published in 199415 and covering Scotland as well as
England and Wales, introduced a dual definition based on technical
competences and materials: makers needed both to be working in a
recognised material (e.g. glass, leather) and to be producing work from
within a defined typology (e.g. furniture, jewellery) in order to be
included. This study also introduced a focus on makers producing
‘original objects … in a commercial way’ but with ‘artistic control of their
work’ retained ‘from conception to completion’. Finally, it introduced
specific exclusions for makers in perishable materials (such as florists
and cake decorators) and building materials (e.g. thatchers).
Unlike their predecessors, the three studies conducted between 2002
and 2006 – and respectively covering Scotland,16 Northern Ireland,17 and
England and Wales18 – did not seek to impose a definition of
contemporary craft based on competencies or materials. Instead, they
included makers on the basis of their membership of databases held by
the commissioning bodies and their partners (primarily craft guilds,
societies and associations). In addition, they introduced new exclusions
of makers who were perceived as being not commercially active
(described as ‘hobbyists’) or who described the ‘subject or style’ of their
work as ‘traditional’.
14 Bruce, A. and Filmer, P. (1983) Op. cit. 15 Knott, C. A. (1994) Op. cit. 16 McAuley, A. and Fillis, I. (2002) Op. cit. 17 McAuley, A. and Fillis, I. (2006) Op. cit. 18 McAuley, A. and Fillis, I. (2004) Op. cit.
14
Craft in an Age of Change
www.bop.co.uk
The definition of contemporary craft used in the current study is broadly
comparable with its 2002 – 2006 predecessors, as explained in more
detail in Appendix 7. The overall parameters of this study have, however,
expanded in comparison with its predecessors. Whilst the 1983 – 2006
studies focused exclusively on makers, the current study encompasses
the whole contemporary craft sector, including retailers, writers, curators
and educators.
This new approach supports the commissioning bodies in recognising
both the economic impact and the inter-connectedness of different
parts of the craft sector. It is also consistent with what is known about
how individual craft businesses work. Makers, for example, may also
undertake work as educators or writers, or an arts administrator may
also work as a maker.19 20 For many, different forms of craft-related work
are connected on both commercial and creative levels – teaching, for
example, is as much a creative stimulus as it is a source of income.21 The
‘whole sector’ approach adopted by this study enables all craft-related
aspects of people’s work to be valued as part of their creative and
business practice.
3.2 Understanding of practice A second important point of difference between this study and those
preceding is its understanding of makers’ work, and its evolution in
response to economic, social, cultural and political influences.
Literature from the past two decades demonstrates that craft practice is
no longer exclusively focused on the making of objects, but also on the
development of knowledge-based services. In addition to (or instead of)
making, many makers apply their specialist knowledge, skills and
working methods in other ways.
For some makers this means developing time-limited work for gallery
exhibition, or exploring processes or systems rather than outcomes; the
19 Schwarz, M. and Yair, K. (2010) Op. cit. 20 Press, M. and Cusworth, A. (1998) New Lives in the Making. Art & Design Research Centre, Sheffield Hallam University, Sheffield and Crafts Council, London 21 Schwarz, M. and Yair, K. (2010) Op. cit. .
type of work that may result in, for example, a performance rather than an
exhibited object. For other makers, it may mean developing specialist,
craft-related consultancy and education services. Press and Cusworth22
indicated that craft graduates were applying craft skills and knowledge
to a range of creative and non-creative occupations. Later, Hunt et al 23
found individual makers developing portfolios of craft-related work,
applying craft knowledge and processes to the development of
consultancy and education services and intellectual property, as well as
to objects.
Examples of such use of skills included makers working in architectural,
interior and industrial design, in fashion, retail and advertising, and in
film and television. Makers were found to complement the work of other
professionals with their understanding of the dynamic between people,
materials and objects, as well as with their specialist knowledge – and
ability to stretch the capabilities of – materials and technical processes.
In education, Hunt et al found makers working in formal education
settings (schools and further and higher education institutions) in both
research and teaching roles.
Schwarz and Yair24 found that makers were also working in a range of
less formal education and community settings. These contract
opportunities range from the delivery of community and education
workshops led by regeneration agencies or children’s centres to the
curation of exhibitions and architectural consultancy on public building
projects such as healthcare centres and schools. Because these
services are contracted by local authorities and publicly funded
voluntary sector organisations, cuts to public sector funding are likely to
reduce demand for them in future in some parts of the UK.
22 Press, M. and Cusworth, A. (1998) Op. cit. 23 Hunt, W., Ball, L. and Pollard, E, (2010) Crafting Futures: a study of the early careers of crafts graduates from UK higher education institutions. Institute for Employment Studies, Brighton / University of the Arts London, London / The Crafts Council, London. 24 Schwarz, M. and Yair, K. (2010) Op. cit.
15
Craft in an Age of Change
www.bop.co.uk
Other research by Yair has focused on the contribution of makers
working in this way to the wellbeing,25 rural economy26 and
environmental sustainability27 agendas, as well as to science,
technology and engineering,28 and the digital world.29 In all these cases,
makers were found to be undertaking a wide range of roles, and to be
supplying other businesses as well as selling (both products and
services) direct to the consumer.
The increasing breadth of craft practice – with making at its heart – is
changing the ways in which makers connect with the marketplace.
Makers are increasingly working within a mixed economy, supplying
other businesses whilst marketing their own products and services, and
raising funding and other finance where possible for research and
development.
3.3 Economic prospects The effects of the credit crunch and subsequent recession on the craft
sector are not yet clear. It has been suggested that makers’ flexibility,
independence and capacity for developing multiple revenue streams
from different types of business activity may offer some degree of
protection from fluctuations in market demand.30 At the same time, the
dependence on a small number of routes to market – and relatively low
25 Yair, K. (2011) Craft and Wellbeing. Crafts Council, London. Online publication, accessed 07/10/2011. http://www.craftscouncil.org.uk/about-us/press-room/view/2011/craft-and-wellbeing?from=/about-us/press-room/ 26 Yair, K. (2011) Craft and Rural Development. Crafts Council, London. Online publication, accessed 07/10/2011. http://www.craftscouncil.org.uk/about-us/press-room/view/2011/craft-in-rural-communities?from=/about-us/press-room/ 27 Yair, K. (2010) Craft and Environmental Sustainability. Crafts Council, London. Online publication, accessed 07/10/2011. http://www.craftscouncil.org.uk/about-us/press-room/view/2011/craft-environmental-sustainability-201101261052-4d3ffd03de9c6?from=/about-us/press-room/ 28 Yair, K. (2011) Crafting Capital. Crafts Council. London. Online publication, accessed 05/12/11. http://www.craftscouncil.org.uk/files/download_iterator/8e562717f3d1a733/ crafting-capital_web-version.pdf 29 Yair, K. (2011) Craft and the Digital World, Crafts Council, London. Online publication, accessed 07/10/2011. http://www.craftscouncil.org.uk/about-us/press-room/view/2011/craft-the-digital-world?from=/about-us/press-room/ 30 Crafts Council (2009) The Crafts Sector Adapts to the Credit Crunch. Online publication, accessed 20/02/2011. http://www.craftscouncil.org.uk/professional-development/maker-development/credit-crunch-feature/crafts-sector-adapts/
levels of investment in continuing professional development (CPD) –
reported previously by McAuley and Fillis31 may present major
challenges.
A report from Morris Hargreaves McIntyre32 commissioned by the Crafts
Council suggested there was significant untapped market potential for
craft objects despite the economic downturn. It proposed reaching this
market by building on the positive values consumers associate with
craft, such as authenticity, craftsmanship, quality and intimacy. It also
suggested specific strategies for market development, including
connecting craft-specific lifestyle and cultural interests with leisure
making, eliciting the hidden stories behind the craft object, and
marketing craft as a more ethical alternative to luxury labels. Overall, it
suggested that market potential could be optimised despite the tough
economic climate, by understanding and acting on these types of
consumer values and preferences in the positioning of the craft object in
the marketplace.
The technology supporting craft retailing is also changing. Online sales
mechanisms may not offer the tactile experience of buying from a shop,
but they can supply the peer endorsement that Morris Hargreaves
McIntyre showed is important to new buyers. They can also create
opportunities for personalisation as well as providing the ‘back story’
that matters to buyers. In addition, they provide makers themselves with
cost-effective access to global markets.33
3.4 Role of higher education The role higher education (HE) plays in the craft sector is significant:
McAuley and Fillis’s work in the period 2002 – 2006 showed that a ‘full-
time art and design course’ was the most commonly reported craft
sector qualification.34 The picture here is complex, with considerable
differences across the UK nations (detailed in appendix 7) and between
31 McAuley, A. and Fillis, I. (2004) Op. cit. 32 Morris Hargreaves McIntyre (2010) Consuming Craft: the contemporary craft market in a changing economy. Crafts Council, London. 33 Ibid. 34 McAuley, A. and Fillis, I. (2004) Op. cit.
16
Craft in an Age of Change
www.bop.co.uk
men and women, and with evidence of higher education as part of a mix
of lifelong learning opportunities. However, unusually high levels of
education to first degree level – compared with both the general
population and the rest of the creative industries – have remained a key
sector characteristic. HE now provides the primary route into the craft
sector for new entrants, especially for women, who outnumber male
graduates but are less likely to enter the sector through informal
apprenticeships or self-directed learning.
Higher education also provides a key site for innovation in the craft
sector, which is valuable given the predominance of sole traders lacking
the necessary capital to invest heavily in R&D. Yair’s research
highlighting craft-makers’ engagement with the digital35 and
environmental sustainability36 agendas makes clear that practice-based
academic research is an important source of craft-based innovation.
Higher education institutions (HEIs), with their capacity to invest in
specialist equipment and facilities (such as digital manufacturing labs),
to nurture academic expertise and to broker cross-sector academic
partnerships (with the academic scientific community and
manufacturing industries, for example) have become drivers of
innovation and diversification within craft practice over the past decade.
HEIs also contribute to a CPD infrastructure which extends into the
public sector. McAuley and Fillis’s work suggested that CPD amongst
makers is often informal; although valued highly by makers, professional
development appears to be more commonly sourced through networks
and informal peer support than through formal training opportunities.
Yet, as Schwarz and Yair found,37 focused, time-limited CPD
interventions can play transformative roles in both creative and business
development; for example, by enabling the use of craft skills and
knowledge to leverage the development of new services, or by
establishing the focus needed to direct a portfolio career.
35 Yair, K. (2011) Craft and the Digital World. Op. cit. 36 Yair, K. (2010) Craft and Environmental Sustainability. Op. cit. 37 Schwarz, M. and Yair, K. (2010) Op cit.
3.5 Craft and the creative industries It is also worth explaining something of the wider ‘creative industries’
context in which the craft sector operates. Ever since the term was first
adopted by the government (in the form of the new Department for
Culture, Media and Sport) in 1998, the list of creative industries has
included craft. However, the small size of craft businesses and the
difficulty of identifying craftspeople through Standard Industrial or
Occupational Classifications (SIC and SOC codes), means that the
DCMS is not able to say much about craft in its annual Creative
Industries Economic Estimates. This current research is in part an
attempt to address this gap in the evidence.
The DCMS figures are calculated using a range of government statistics,
such as the Inter-Departmental Business Register.38 These figures count
only businesses and employees that are on the government’s ‘radar’, for
instance for paying VAT and PAYE. Very small businesses which fall
below the thresholds for such taxes may not be picked up in this data. It
is useful to look at the data for some of the smaller creative industries, to
put the figures reported in this study into some sort of wider context.
Business numbers
The DCMS’s figures indicate that there were 182,100 enterprises in the
creative industries in 2010. The following table shows selected creative
industries in terms of numbers of enterprises.
38 The DCMS collects figures for the UK or Great Britain, depending on the data sources available to it.
17
Craft in an Age of Change
www.bop.co.uk
Figure 3 Number of enterprises by creative industry, 2010
Creative industry
Design 14,200
Architecture 11,500
Film, Video and Photography 9.900
Publishing 7,700
TV and radio 7,700
Art and Antiques 2,700
Designer Fashion 900
Digital and Entertainment Media 200
Source: DCMS (2010)
These are businesses which appear on the government’s ‘radar’ usually
because they pay VAT. As an approximate comparison, the number of
craft businesses with a turnover of more than the VAT threshold of
£70,000 in 2010 can be calculated from this survey’s findings and the
population estimate. The survey found 4.0% of craft businesses had
such a turnover, which ‘translates’ to approximately 920 craft-making
businesses in our estimated population39 – around the same number as
designer fashion.
Gross Value Added
Another way to measure the contribution of craft is to estimate its Gross
Value Added (GVA) – how much value craft-makers add by transforming
their raw materials into finished products and services. BOP Consulting
has calculated that the GVA for contemporary craft was £220m. (The
detailed calculation can be seen in Appendix 8.)
39 Such businesses would be counted under ‘non-craft’ classifications in current government statistics.
GVA (Gross Value Added) for selected creative industries was:
Figure 4 GVA for selected creative industries, 2010
GVA for creative industries
Film, Video and Photography £2,700m
Art and Antiques £300m
Designer Fashion £100m
Digital and Entertainment Media £200m
Source: DCMS (2010)
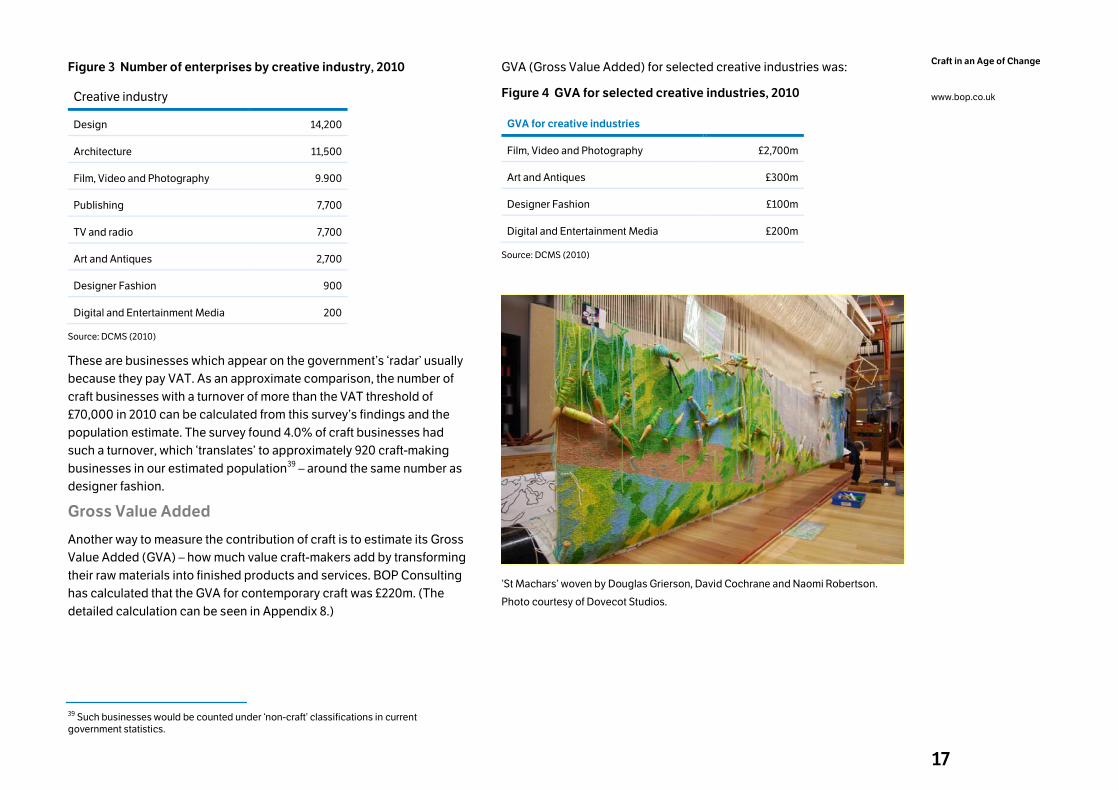
‘St Machars’ woven by Douglas Grierson, David Cochrane and Naomi Robertson.
Photo courtesy of Dovecot Studios.
18
Craft in an Age of Change
www.bop.co.uk 4. Findings: demographic and business structure The aim of this project is to understand the full range of activity in the
contemporary craft sector, and its economic impacts. As such, the
process was not simply confined to studying makers – other aspects of
the craft ‘business’, such as retailing and curation were also to be
explored. This contemporary craft mapping study is also the first major
one to be carried out simultaneously across England, Scotland, Wales
and Northern Ireland.
The centrepiece of the study is a phone survey of just over 2,000
makers, retailers and educators/curators/writers. This provides the
quantitative ‘core’ of this report, which is discussed in the next three
chapters and in the individual analyses by nation, shown in appendices 1
to 4. The sheer number of questions asked in the survey means that not
all the responses are discussed here – the full set is shown in the
appendices.
A full explanation of the methodology can be found in appendix 8.
4.1 Presentation of the findings In all, 2,046 interviews were carried out as part of the phone survey. The
findings for makers are more statistically robust than those for the other
categories due to their larger sample sizes.
Although 1,847 responses were collected from makers from across the
UK, simply combining all these results to obtain a UK figure would place
too much weight on the findings from the smaller UK nations at the
expense of England. The makers’ results for the UK as a whole have
therefore been weighted by nation using the estimate of 23,050
contemporary craft-making businesses calculated in appendix 8. The
results for each nation are shown separately in appendices 1 to 4.
The number of responses from retailers and educators, writers and
curators was smaller, and has not been weighted. They do, however,
include responses from all four nations of the UK.
In addition to collating and presenting the findings of the questionnaire,
BOP Consulting has also used a statistical analysis method known as
regression analysis to provide richer detail on the relationship between
variables (such as gender, age, materials used, and turnover). This
technique allows us to identify which factors have a significant effect on
the results, by ‘controlling’ for the effects of other variables. To give a
theoretical example: men may report higher turnover than women, but
also report being more likely to work with ceramics than textiles.
Regression analysis helps us understand whether gender is really
responsible for the difference in turnover, or whether it is women’s
greater likelihood of being textile-makers that is the driver (i.e. do
ceramicists of either gender have higher turnovers than textile makers).
This first chapter of findings gives a detailed profile of craftspeople and
their businesses, before concluding with a brief discussion of the
similarities and differences between makers in the four nations of the
UK.
4.2 Demographic profile of respondents The chapter begins with an overview of the demographics of the
respondents to the survey.
Gender
Overall, the survey respondents were 69% female, 31% male. The
percentage of women was slightly higher among retailers and educators
than among makers. This figure is a little higher than that recorded in
previous surveys, and confirms the trend seen over the last twenty years
of a steady rise in the percentage of women in the contemporary craft
workforce.
Analysis of the under-35s indicated that the proportion of women was
higher still among the younger age cohort, suggesting this increase in
19
Craft in an Age of Change
www.bop.co.uk
the female share of the craft community is likely to continue in the years
to come.
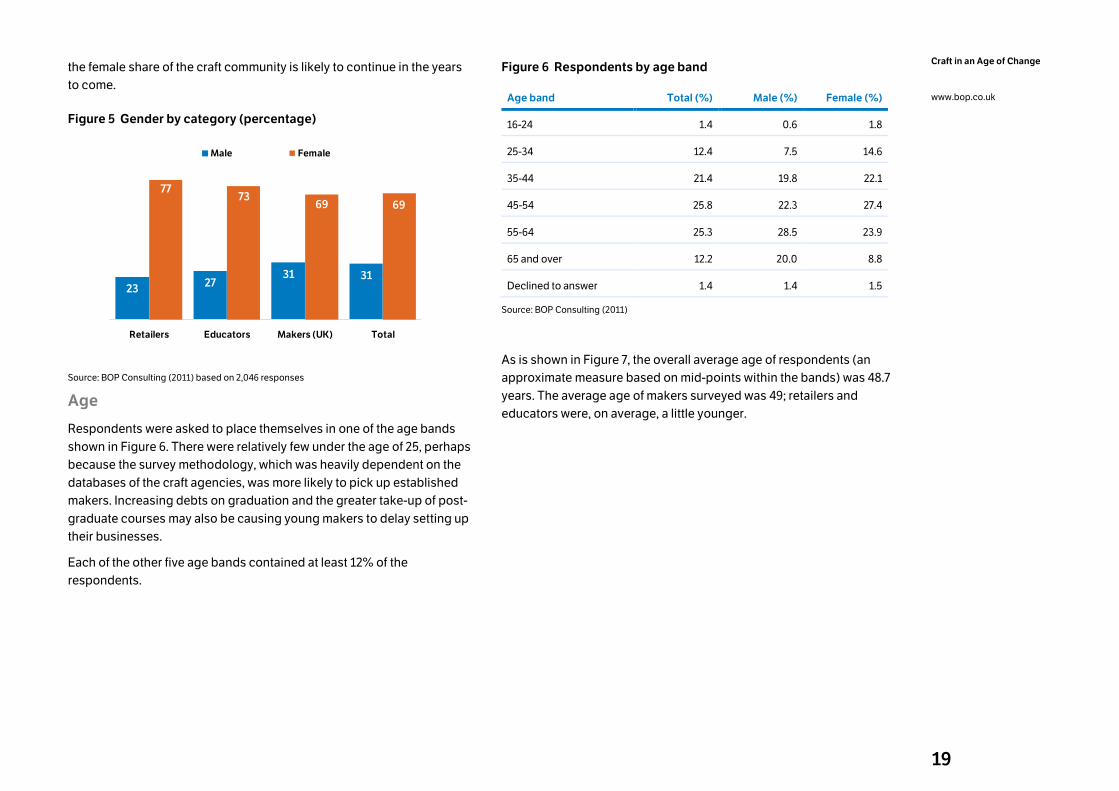
Figure 5 Gender by category (percentage)
2327
31 31
7773
69 69
Retailers Educators Makers (UK) Total
Male Female
Source: BOP Consulting (2011) based on 2,046 responses
Age
Respondents were asked to place themselves in one of the age bands
shown in Figure 6. There were relatively few under the age of 25, perhaps
because the survey methodology, which was heavily dependent on the
databases of the craft agencies, was more likely to pick up established
makers. Increasing debts on graduation and the greater take-up of post-
graduate courses may also be causing young makers to delay setting up
their businesses.
Each of the other five age bands contained at least 12% of the
respondents.
Figure 6 Respondents by age band
Age band Total (%) Male (%) Female (%)
16-24 1.4 0.6 1.8
25-34 12.4 7.5 14.6
35-44 21.4 19.8 22.1
45-54 25.8 22.3 27.4
55-64 25.3 28.5 23.9
65 and over 12.2 20.0 8.8
Declined to answer 1.4 1.4 1.5
Source: BOP Consulting (2011)
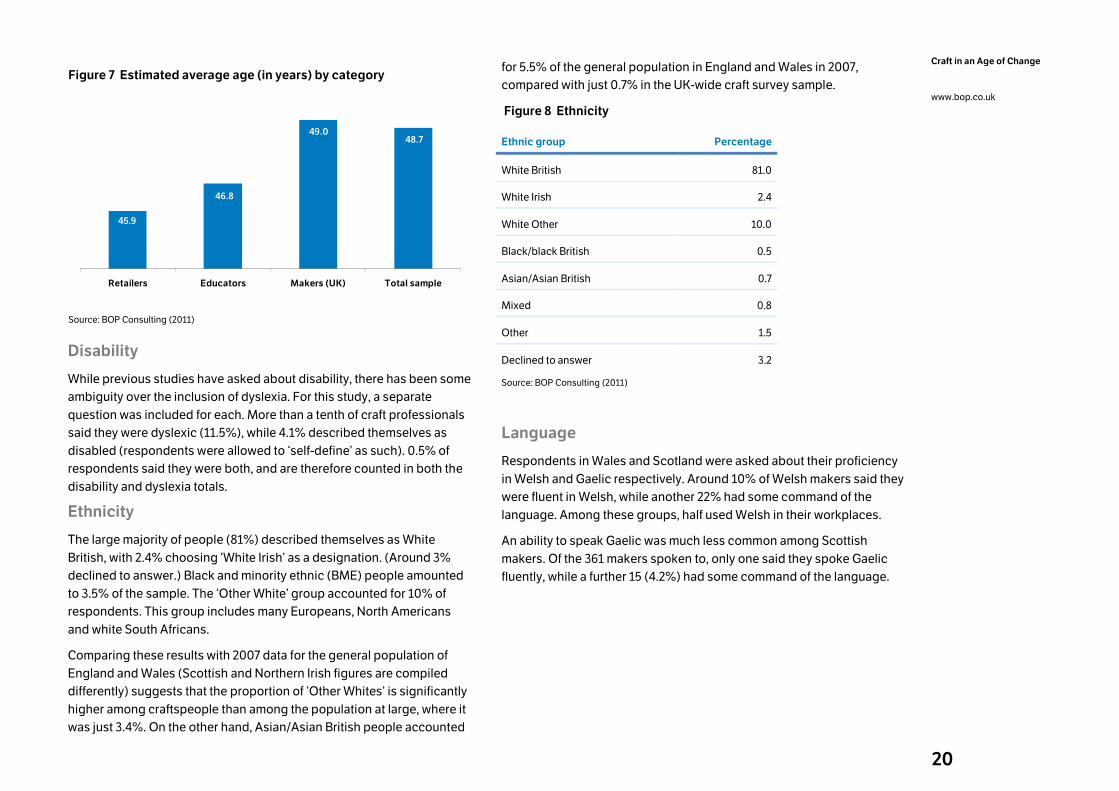
As is shown in Figure 7, the overall average age of respondents (an
approximate measure based on mid-points within the bands) was 48.7
years. The average age of makers surveyed was 49; retailers and
educators were, on average, a little younger.
20
Craft in an Age of Change
www.bop.co.uk
Figure 7 Estimated average age (in years) by category
48.749.0
46.8
45.9
Retailers Educators Makers (UK) Total sample
Source: BOP Consulting (2011)
Disability
While previous studies have asked about disability, there has been some
ambiguity over the inclusion of dyslexia. For this study, a separate
question was included for each. More than a tenth of craft professionals
said they were dyslexic (11.5%), while 4.1% described themselves as
disabled (respondents were allowed to ‘self-define’ as such). 0.5% of
respondents said they were both, and are therefore counted in both the
disability and dyslexia totals.
Ethnicity
The large majority of people (81%) described themselves as White
British, with 2.4% choosing ‘White Irish’ as a designation. (Around 3%
declined to answer.) Black and minority ethnic (BME) people amounted
to 3.5% of the sample. The ‘Other White’ group accounted for 10% of
respondents. This group includes many Europeans, North Americans
and white South Africans.
Comparing these results with 2007 data for the general population of
England and Wales (Scottish and Northern Irish figures are compiled
differently) suggests that the proportion of ‘Other Whites’ is significantly
higher among craftspeople than among the population at large, where it
was just 3.4%. On the other hand, Asian/Asian British people accounted
for 5.5% of the general population in England and Wales in 2007,
compared with just 0.7% in the UK-wide craft survey sample.
Figure 8 Ethnicity
Ethnic group Percentage
White British 81.0
White Irish 2.4
White Other 10.0
Black/black British 0.5
Asian/Asian British 0.7
Mixed 0.8
Other 1.5
Declined to answer 3.2
Source: BOP Consulting (2011)
Language
Respondents in Wales and Scotland were asked about their proficiency
in Welsh and Gaelic respectively. Around 10% of Welsh makers said they
were fluent in Welsh, while another 22% had some command of the
language. Among these groups, half used Welsh in their workplaces.
An ability to speak Gaelic was much less common among Scottish
makers. Of the 361 makers spoken to, only one said they spoke Gaelic
fluently, while a further 15 (4.2%) had some command of the language.
21
Craft in an Age of Change
www.bop.co.uk
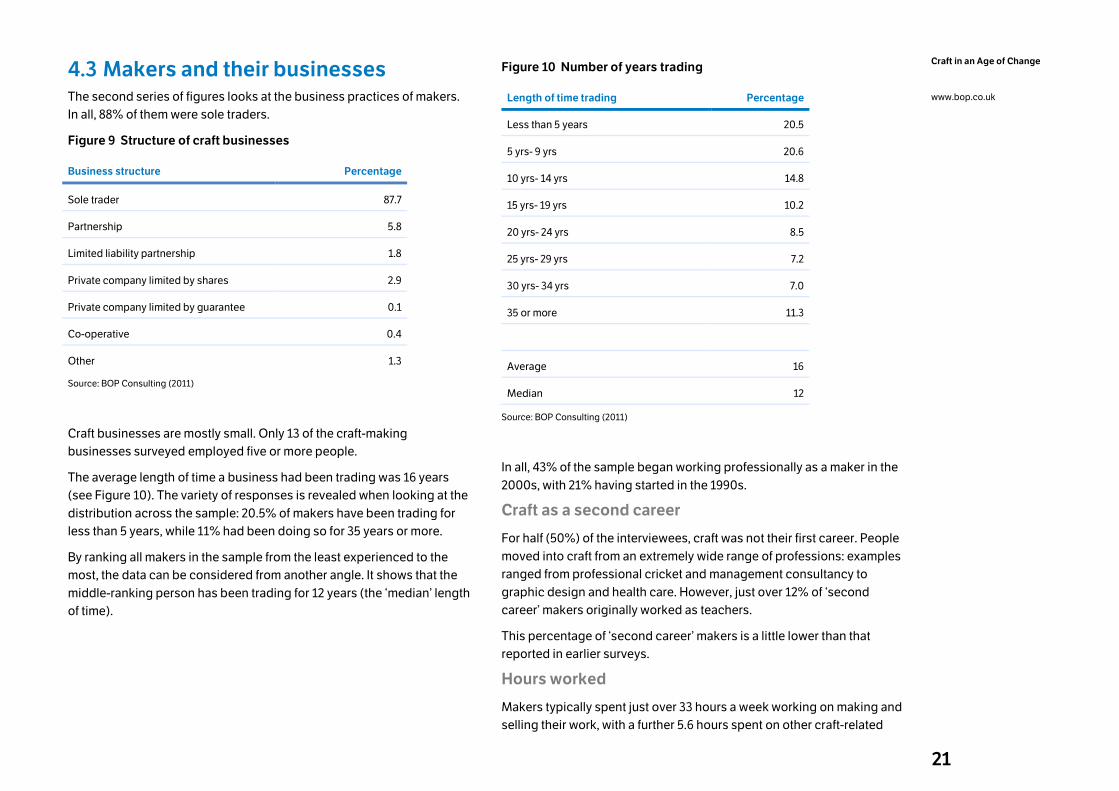
4.3 Makers and their businesses The second series of figures looks at the business practices of makers.
In all, 88% of them were sole traders.
Figure 9 Structure of craft businesses
Business structure Percentage
Sole trader 87.7
Partnership 5.8
Limited liability partnership 1.8
Private company limited by shares 2.9
Private company limited by guarantee 0.1
Co-operative 0.4
Other 1.3
Source: BOP Consulting (2011)
Craft businesses are mostly small. Only 13 of the craft-making
businesses surveyed employed five or more people.
The average length of time a business had been trading was 16 years
(see Figure 10). The variety of responses is revealed when looking at the
distribution across the sample: 20.5% of makers have been trading for
less than 5 years, while 11% had been doing so for 35 years or more.
By ranking all makers in the sample from the least experienced to the
most, the data can be considered from another angle. It shows that the
middle-ranking person has been trading for 12 years (the ‘median’ length
of time).
Figure 10 Number of years trading
Length of time trading Percentage
Less than 5 years 20.5
5 yrs- 9 yrs 20.6
10 yrs- 14 yrs 14.8
15 yrs- 19 yrs 10.2
20 yrs- 24 yrs 8.5
25 yrs- 29 yrs 7.2
30 yrs- 34 yrs 7.0
35 or more 11.3
Average 16
Median 12
Source: BOP Consulting (2011)
In all, 43% of the sample began working professionally as a maker in the
2000s, with 21% having started in the 1990s.
Craft as a second career
For half (50%) of the interviewees, craft was not their first career. People
moved into craft from an extremely wide range of professions: examples
ranged from professional cricket and management consultancy to
graphic design and health care. However, just over 12% of ‘second
career’ makers originally worked as teachers.
This percentage of ‘second career’ makers is a little lower than that
reported in earlier surveys.
Hours worked
Makers typically spent just over 33 hours a week working on making and
selling their work, with a further 5.6 hours spent on other craft-related
22
Craft in an Age of Change
www.bop.co.uk
activities (see Figure 11). This implies that, on average, craft-makers
spend just under 39 hours on all aspects of their craft practice40.
However, there was a wide variation in the number of hours reported,
with 43% spending 30 hours or less on their craft activities, which was
regarded as the threshold for part-time work in previous reports.
Regression analysis indicates that women are more likely to work part-
time (less than 30 hours per week) than men, even after controlling for
other factors. Makers who have a degree in a craft-related subject are
less likely to work part-time, compared with all other makers, which
implies these makers are more likely to be exclusively dedicated to their
craft business. Other characteristics such as years of experience and
age do not have statistically significant effects on hours worked.
Figure 11 Hours worked
Other: 5.6h
Selling: 6.6h
Designing and making:
26.7h
• 38.9h on average
• 43% part-time
(30h or less)
Source: BOP Consulting (2011)
40 Some makers reported working more than 90 hours a week, While such levels of activity are plausible for short periods, it was felt that they were unlikely to be sustained across the year (since it corresponds to more than 15 hours a day, six days a week). These answers were therefore excluded from the estimates.
Location of workplace
Almost two-thirds of makers work at home, most usually in a formal
workshop on their home premises. The majority of the remainder rent a
workspace. Of the makers who said they rented a workspace, 56% did
so within dedicated artists’ studios.
Figure 12 Location of primary workplace (percentage of makers)
7.7
5.0
0.7
3.5
17.3
21.3
44.6
Other
Shared workspace: owned
Shared workspace: rented
Individual workspace: owned
Individual workspace: rented
Space in room(s) in own home
Formal workshop on home premises
Away from home
At home
Source: BOP Consulting (2011)
Regression analysis allows us to say something about the
characteristics of workspace users. Makers from older cohorts are more
likely to work at home (when controlling for other factors), as are
women. There were also variations by materials used: textile makers
were more likely to work at home, for instance.
Selling channels
Figure 13 shows the variety of channels used by makers to sell their craft
objects. The most popular are commercial exhibitions and galleries,
used by 55% of makers. Around 47% of all makers received commissions
(from the general public, businesses and/or institutions) while more than
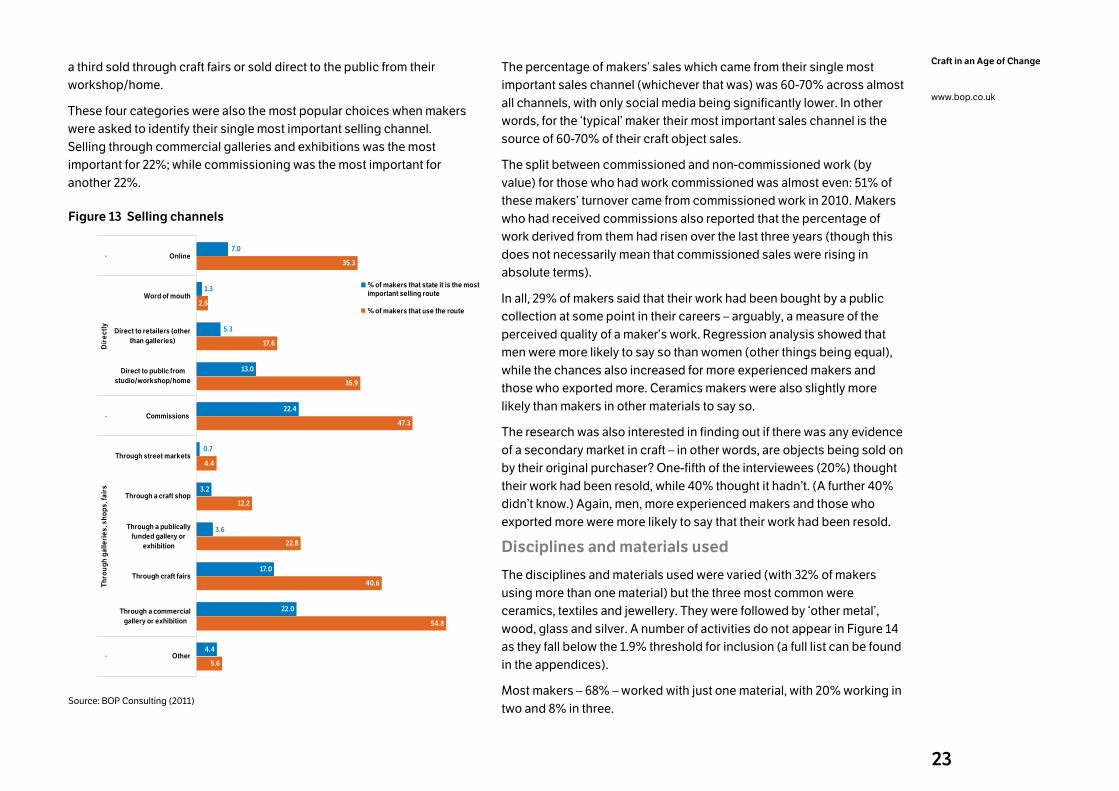
23
Craft in an Age of Change
www.bop.co.uk
a third sold through craft fairs or sold direct to the public from their
workshop/home.
These four categories were also the most popular choices when makers
were asked to identify their single most important selling channel.
Selling through commercial galleries and exhibitions was the most
important for 22%; while commissioning was the most important for
another 22%.
Figure 13 Selling channels
5.6
54.8
40.6
22.8
12.2
4.4
47.3
35.9
17.6
2.5
35.3
4.4
22.0
17.0
3.2
22.4
13.0
1.3
3.6
0.7
5.3
7.0
Other
Through a commercial
gallery or exhibition
Through craft fairs
Through a publically
funded gallery or
exhibition
Through a craft shop
Through street markets
Commissions
Direct to public from
studio/workshop/home
Direct to retailers (other
than galleries)
Word of mouth
Online
.Through galleries, shops, fairs
.Directly
.
% of makers that state it is the mostimportant selling route
% of makers that use the route
Source: BOP Consulting (2011)
The percentage of makers’ sales which came from their single most
important sales channel (whichever that was) was 60-70% across almost
all channels, with only social media being significantly lower. In other
words, for the ‘typical’ maker their most important sales channel is the
source of 60-70% of their craft object sales.
The split between commissioned and non-commissioned work (by
value) for those who had work commissioned was almost even: 51% of
these makers’ turnover came from commissioned work in 2010. Makers
who had received commissions also reported that the percentage of
work derived from them had risen over the last three years (though this
does not necessarily mean that commissioned sales were rising in
absolute terms).
In all, 29% of makers said that their work had been bought by a public
collection at some point in their careers – arguably, a measure of the
perceived quality of a maker’s work. Regression analysis showed that
men were more likely to say so than women (other things being equal),
while the chances also increased for more experienced makers and
those who exported more. Ceramics makers were also slightly more
likely than makers in other materials to say so.
The research was also interested in finding out if there was any evidence
of a secondary market in craft – in other words, are objects being sold on
by their original purchaser? One-fifth of the interviewees (20%) thought
their work had been resold, while 40% thought it hadn’t. (A further 40%
didn’t know.) Again, men, more experienced makers and those who
exported more were more likely to say that their work had been resold.
Disciplines and materials used
The disciplines and materials used were varied (with 32% of makers
using more than one material) but the three most common were
ceramics, textiles and jewellery. They were followed by ‘other metal’,
wood, glass and silver. A number of activities do not appear in Figure 14
as they fall below the 1.9% threshold for inclusion (a full list can be found
in the appendices).
Most makers – 68% – worked with just one material, with 20% working in
two and 8% in three.
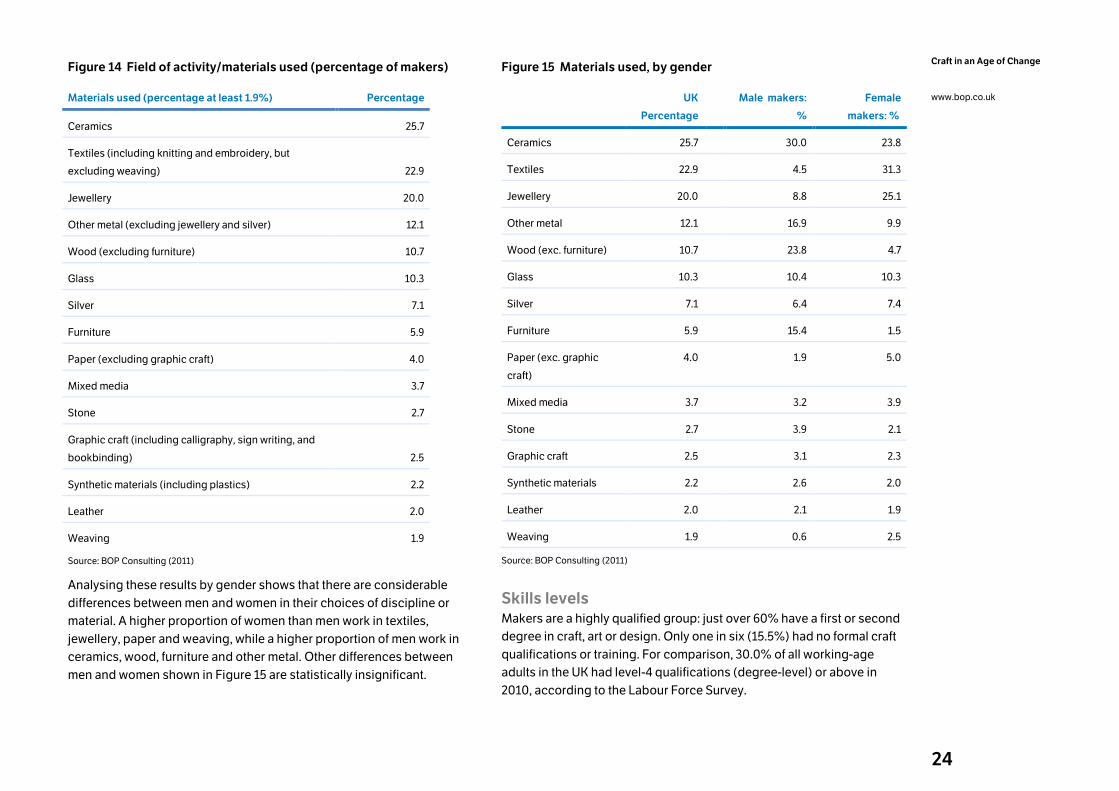
24
Craft in an Age of Change
www.bop.co.uk
Figure 14 Field of activity/materials used (percentage of makers)
Materials used (percentage at least 1.9%) Percentage
Ceramics 25.7
Textiles (including knitting and embroidery, but
excluding weaving) 22.9
Jewellery 20.0
Other metal (excluding jewellery and silver) 12.1
Wood (excluding furniture) 10.7
Glass 10.3
Silver 7.1
Furniture 5.9
Paper (excluding graphic craft) 4.0
Mixed media 3.7
Stone 2.7
Graphic craft (including calligraphy, sign writing, and
bookbinding) 2.5
Synthetic materials (including plastics) 2.2
Leather 2.0
Weaving 1.9
Source: BOP Consulting (2011)
Analysing these results by gender shows that there are considerable
differences between men and women in their choices of discipline or
material. A higher proportion of women than men work in textiles,
jewellery, paper and weaving, while a higher proportion of men work in
ceramics, wood, furniture and other metal. Other differences between
men and women shown in Figure 15 are statistically insignificant.
Figure 15 Materials used, by gender
UK
Percentage
Male makers:
%
Female
makers: %
Ceramics 25.7 30.0 23.8
Textiles 22.9 4.5 31.3
Jewellery 20.0 8.8 25.1
Other metal 12.1 16.9 9.9
Wood (exc. furniture) 10.7 23.8 4.7
Glass 10.3 10.4 10.3
Silver 7.1 6.4 7.4
Furniture 5.9 15.4 1.5
Paper (exc. graphic
craft)
4.0 1.9 5.0
Mixed media 3.7 3.2 3.9
Stone 2.7 3.9 2.1
Graphic craft 2.5 3.1 2.3
Synthetic materials 2.2 2.6 2.0
Leather 2.0 2.1 1.9
Weaving 1.9 0.6 2.5
Source: BOP Consulting (2011)
Skills levels Makers are a highly qualified group: just over 60% have a first or second
degree in craft, art or design. Only one in six (15.5%) had no formal craft
qualifications or training. For comparison, 30.0% of all working-age
adults in the UK had level-4 qualifications (degree-level) or above in
2010, according to the Labour Force Survey.
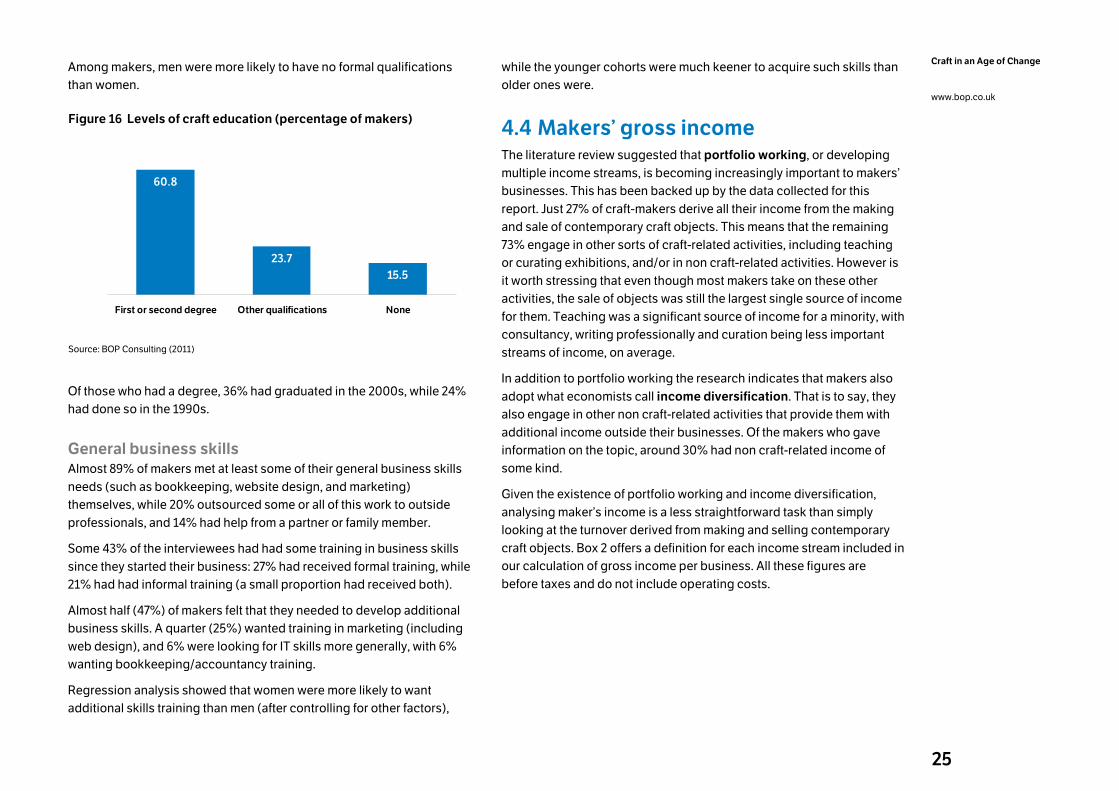
25
Craft in an Age of Change
www.bop.co.uk
Among makers, men were more likely to have no formal qualifications
than women.
Figure 16 Levels of craft education (percentage of makers)
60.8
23.7
15.5
First or second degree Other qualifications None
Source: BOP Consulting (2011)
Of those who had a degree, 36% had graduated in the 2000s, while 24%
had done so in the 1990s.
General business skills Almost 89% of makers met at least some of their general business skills
needs (such as bookkeeping, website design, and marketing)
themselves, while 20% outsourced some or all of this work to outside
professionals, and 14% had help from a partner or family member.
Some 43% of the interviewees had had some training in business skills
since they started their business: 27% had received formal training, while
21% had had informal training (a small proportion had received both).
Almost half (47%) of makers felt that they needed to develop additional
business skills. A quarter (25%) wanted training in marketing (including
web design), and 6% were looking for IT skills more generally, with 6%
wanting bookkeeping/accountancy training.
Regression analysis showed that women were more likely to want
additional skills training than men (after controlling for other factors),
while the younger cohorts were much keener to acquire such skills than
older ones were.
4.4 Makers’ gross income The literature review suggested that portfolio working, or developing
multiple income streams, is becoming increasingly important to makers’
businesses. This has been backed up by the data collected for this
report. Just 27% of craft-makers derive all their income from the making
and sale of contemporary craft objects. This means that the remaining
73% engage in other sorts of craft-related activities, including teaching
or curating exhibitions, and/or in non craft-related activities. However is
it worth stressing that even though most makers take on these other
activities, the sale of objects was still the largest single source of income
for them. Teaching was a significant source of income for a minority, with
consultancy, writing professionally and curation being less important
streams of income, on average.
In addition to portfolio working the research indicates that makers also
adopt what economists call income diversification. That is to say, they
also engage in other non craft-related activities that provide them with
additional income outside their businesses. Of the makers who gave
information on the topic, around 30% had non craft-related income of
some kind.
Given the existence of portfolio working and income diversification,
analysing maker’s income is a less straightforward task than simply
looking at the turnover derived from making and selling contemporary
craft objects. Box 2 offers a definition for each income stream included in
our calculation of gross income per business. All these figures are
before taxes and do not include operating costs.
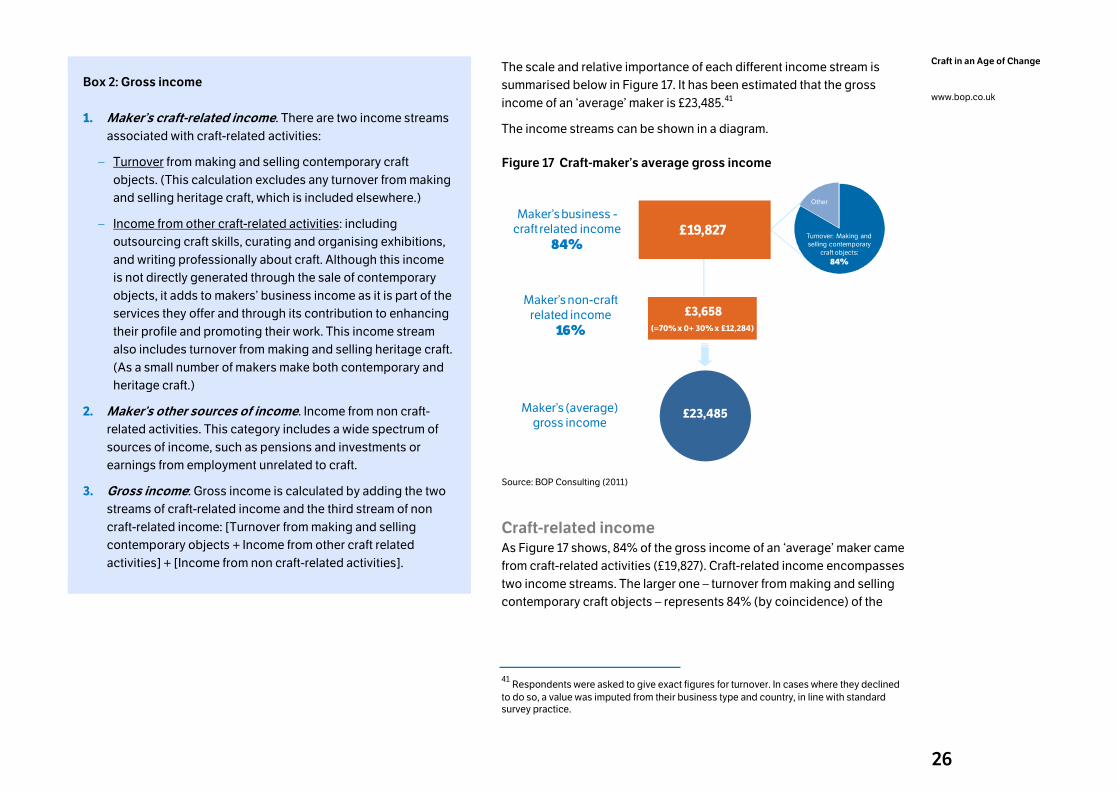
26
Craft in an Age of Change
www.bop.co.uk
Box 2: Gross income
1. Maker’s craft-related income. There are two income streams
associated with craft-related activities:
– Turnover from making and selling contemporary craft
objects. (This calculation excludes any turnover from making
and selling heritage craft, which is included elsewhere.)
– Income from other craft-related activities: including
outsourcing craft skills, curating and organising exhibitions,
and writing professionally about craft. Although this income
is not directly generated through the sale of contemporary
objects, it adds to makers’ business income as it is part of the
services they offer and through its contribution to enhancing
their profile and promoting their work. This income stream
also includes turnover from making and selling heritage craft.
(As a small number of makers make both contemporary and
heritage craft.)
2. Maker’s other sources of income. Income from non craft-
related activities. This category includes a wide spectrum of
sources of income, such as pensions and investments or
earnings from employment unrelated to craft.
3. Gross income: Gross income is calculated by adding the two
streams of craft-related income and the third stream of non
craft-related income: [Turnover from making and selling
contemporary objects + Income from other craft related
activities] + [Income from non craft-related activities].
The scale and relative importance of each different income stream is
summarised below in Figure 17. It has been estimated that the gross
income of an ‘average’ maker is £23,485.41
The income streams can be shown in a diagram.
Figure 17 Craft-maker’s average gross income
£23,485
Maker’s business -craft related income
84%
Maker’s non-craft related income
16%
£19,827
£3,658
(=70% x 0+ 30% x £12,284)
Turnover: Making and selling contemporary
craft objects:
84%
Other
Maker’s (average) gross income
Source: BOP Consulting (2011)
Craft-related income As Figure 17 shows, 84% of the gross income of an ‘average’ maker came
from craft-related activities (£19,827). Craft-related income encompasses
two income streams. The larger one – turnover from making and selling
contemporary craft objects – represents 84% (by coincidence) of the
41 Respondents were asked to give exact figures for turnover. In cases where they declined to do so, a value was imputed from their business type and country, in line with standard survey practice.
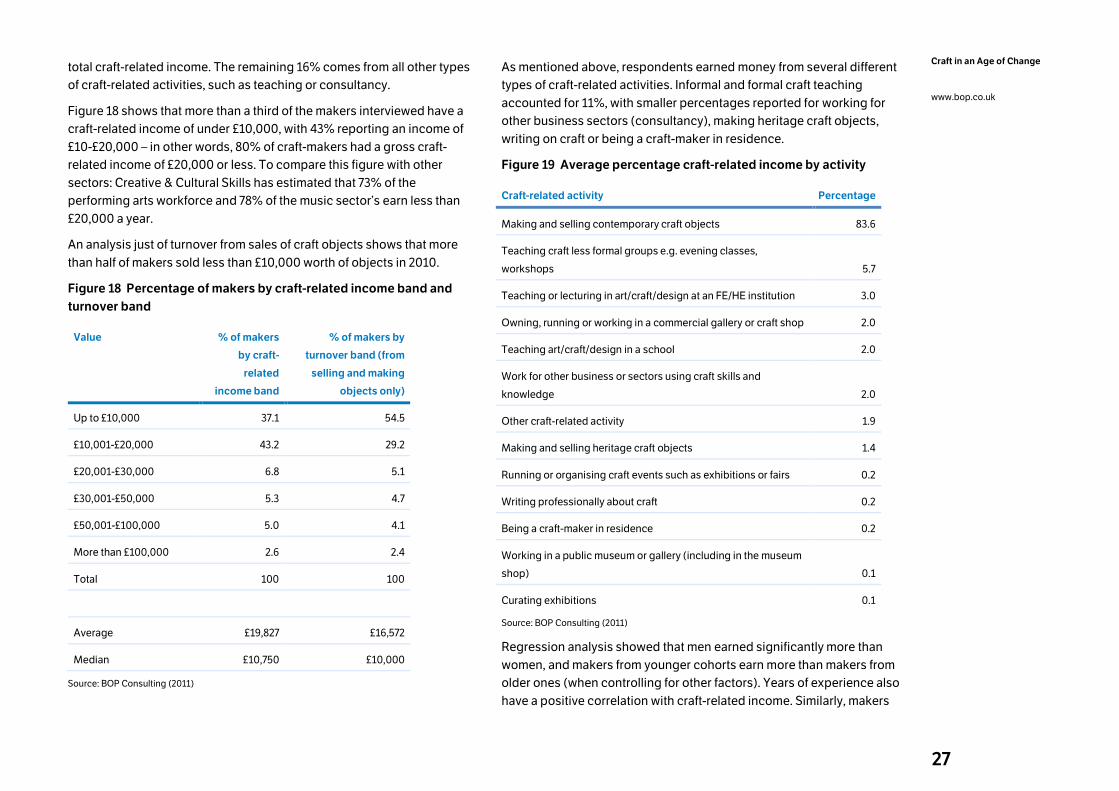
27
Craft in an Age of Change
www.bop.co.uk
total craft-related income. The remaining 16% comes from all other types
of craft-related activities, such as teaching or consultancy.
Figure 18 shows that more than a third of the makers interviewed have a
craft-related income of under £10,000, with 43% reporting an income of
£10-£20,000 – in other words, 80% of craft-makers had a gross craft-
related income of £20,000 or less. To compare this figure with other
sectors: Creative & Cultural Skills has estimated that 73% of the
performing arts workforce and 78% of the music sector’s earn less than
£20,000 a year.
An analysis just of turnover from sales of craft objects shows that more
than half of makers sold less than £10,000 worth of objects in 2010.
Figure 18 Percentage of makers by craft-related income band and
turnover band
Value % of makers
by craft-
related
income band
% of makers by
turnover band (from
selling and making
objects only)
Up to £10,000 37.1 54.5
£10,001-£20,000 43.2 29.2
£20,001-£30,000 6.8 5.1
£30,001-£50,000 5.3 4.7
£50,001-£100,000 5.0 4.1
More than £100,000 2.6 2.4
Total 100 100
Average £19,827 £16,572
Median £10,750 £10,000
Source: BOP Consulting (2011)
As mentioned above, respondents earned money from several different
types of craft-related activities. Informal and formal craft teaching
accounted for 11%, with smaller percentages reported for working for
other business sectors (consultancy), making heritage craft objects,
writing on craft or being a craft-maker in residence.
Figure 19 Average percentage craft-related income by activity
Craft-related activity Percentage
Making and selling contemporary craft objects 83.6
Teaching craft less formal groups e.g. evening classes,
workshops 5.7
Teaching or lecturing in art/craft/design at an FE/HE institution 3.0
Owning, running or working in a commercial gallery or craft shop 2.0
Teaching art/craft/design in a school 2.0
Work for other business or sectors using craft skills and
knowledge 2.0
Other craft-related activity 1.9
Making and selling heritage craft objects 1.4
Running or organising craft events such as exhibitions or fairs 0.2
Writing professionally about craft 0.2
Being a craft-maker in residence 0.2
Working in a public museum or gallery (including in the museum
shop) 0.1
Curating exhibitions 0.1
Source: BOP Consulting (2011)
Regression analysis showed that men earned significantly more than
women, and makers from younger cohorts earn more than makers from
older ones (when controlling for other factors). Years of experience also
have a positive correlation with craft-related income. Similarly, makers
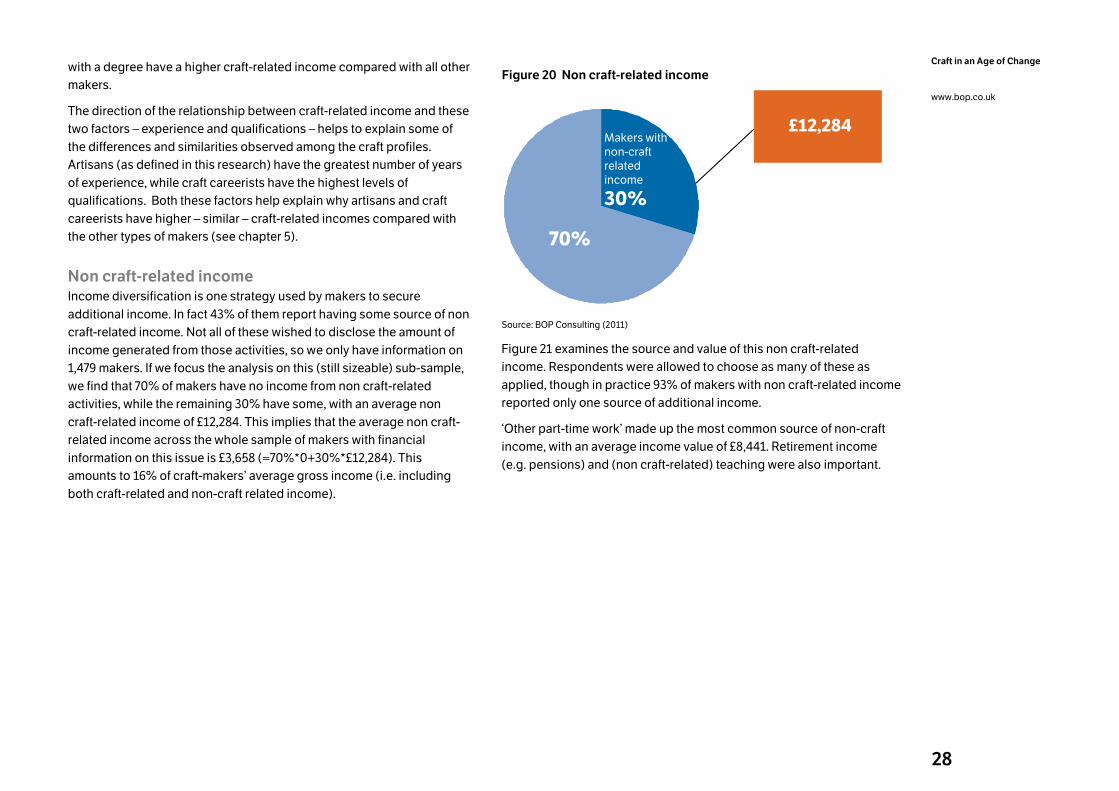
28
Craft in an Age of Change
www.bop.co.uk
with a degree have a higher craft-related income compared with all other
makers.
The direction of the relationship between craft-related income and these
two factors – experience and qualifications – helps to explain some of
the differences and similarities observed among the craft profiles.
Artisans (as defined in this research) have the greatest number of years
of experience, while craft careerists have the highest levels of
qualifications. Both these factors help explain why artisans and craft
careerists have higher – similar – craft-related incomes compared with
the other types of makers (see chapter 5).
Non craft-related income Income diversification is one strategy used by makers to secure
additional income. In fact 43% of them report having some source of non
craft-related income. Not all of these wished to disclose the amount of
income generated from those activities, so we only have information on
1,479 makers. If we focus the analysis on this (still sizeable) sub-sample,
we find that 70% of makers have no income from non craft-related
activities, while the remaining 30% have some, with an average non
craft-related income of £12,284. This implies that the average non craft-
related income across the whole sample of makers with financial
information on this issue is £3,658 (=70%*0+30%*£12,284). This
amounts to 16% of craft-makers’ average gross income (i.e. including
both craft-related and non-craft related income).
Figure 20 Non craft-related income
Ye
s:
£12,284Makers with non-craft related income
30%
70%
Ye
s:
£12,284Makers with non-craft related income
30%
70%
Source: BOP Consulting (2011)
Figure 21 examines the source and value of this non craft-related
income. Respondents were allowed to choose as many of these as
applied, though in practice 93% of makers with non craft-related income
reported only one source of additional income.
‘Other part-time work’ made up the most common source of non-craft
income, with an average income value of £8,441. Retirement income
(e.g. pensions) and (non craft-related) teaching were also important.
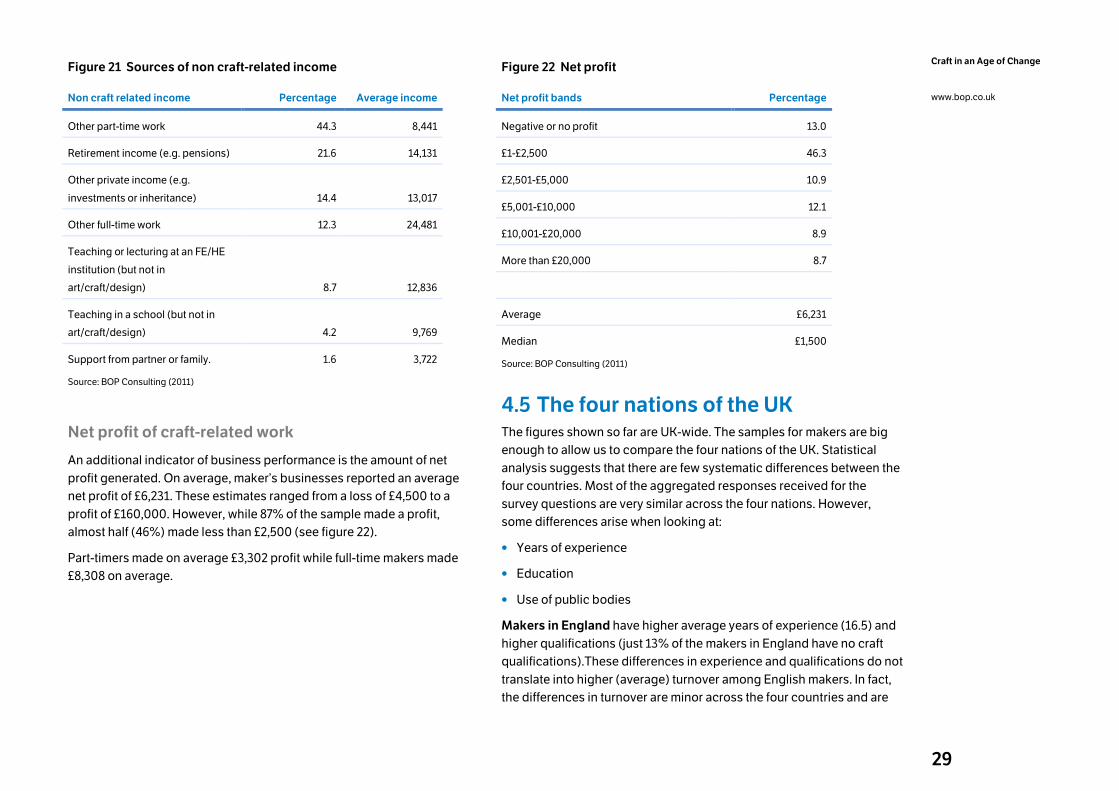
29
Craft in an Age of Change
www.bop.co.uk
Figure 21 Sources of non craft-related income
Non craft related income Percentage Average income
Other part-time work 44.3 8,441
Retirement income (e.g. pensions) 21.6 14,131
Other private income (e.g.
investments or inheritance) 14.4 13,017
Other full-time work 12.3 24,481
Teaching or lecturing at an FE/HE
institution (but not in
art/craft/design) 8.7 12,836
Teaching in a school (but not in
art/craft/design) 4.2 9,769
Support from partner or family. 1.6 3,722
Source: BOP Consulting (2011)
Net profit of craft-related work
An additional indicator of business performance is the amount of net
profit generated. On average, maker’s businesses reported an average
net profit of £6,231. These estimates ranged from a loss of £4,500 to a
profit of £160,000. However, while 87% of the sample made a profit,
almost half (46%) made less than £2,500 (see figure 22).
Part-timers made on average £3,302 profit while full-time makers made
£8,308 on average.
Figure 22 Net profit
Net profit bands Percentage
Negative or no profit 13.0
£1-£2,500 46.3
£2,501-£5,000 10.9
£5,001-£10,000 12.1
£10,001-£20,000 8.9
More than £20,000 8.7
Average £6,231
Median £1,500
Source: BOP Consulting (2011)
4.5 The four nations of the UK The figures shown so far are UK-wide. The samples for makers are big
enough to allow us to compare the four nations of the UK. Statistical
analysis suggests that there are few systematic differences between the
four countries. Most of the aggregated responses received for the
survey questions are very similar across the four nations. However,
some differences arise when looking at:
• Years of experience
• Education
• Use of public bodies
Makers in England have higher average years of experience (16.5) and
higher qualifications (just 13% of the makers in England have no craft
qualifications).These differences in experience and qualifications do not
translate into higher (average) turnover among English makers. In fact,
the differences in turnover are minor across the four countries and are
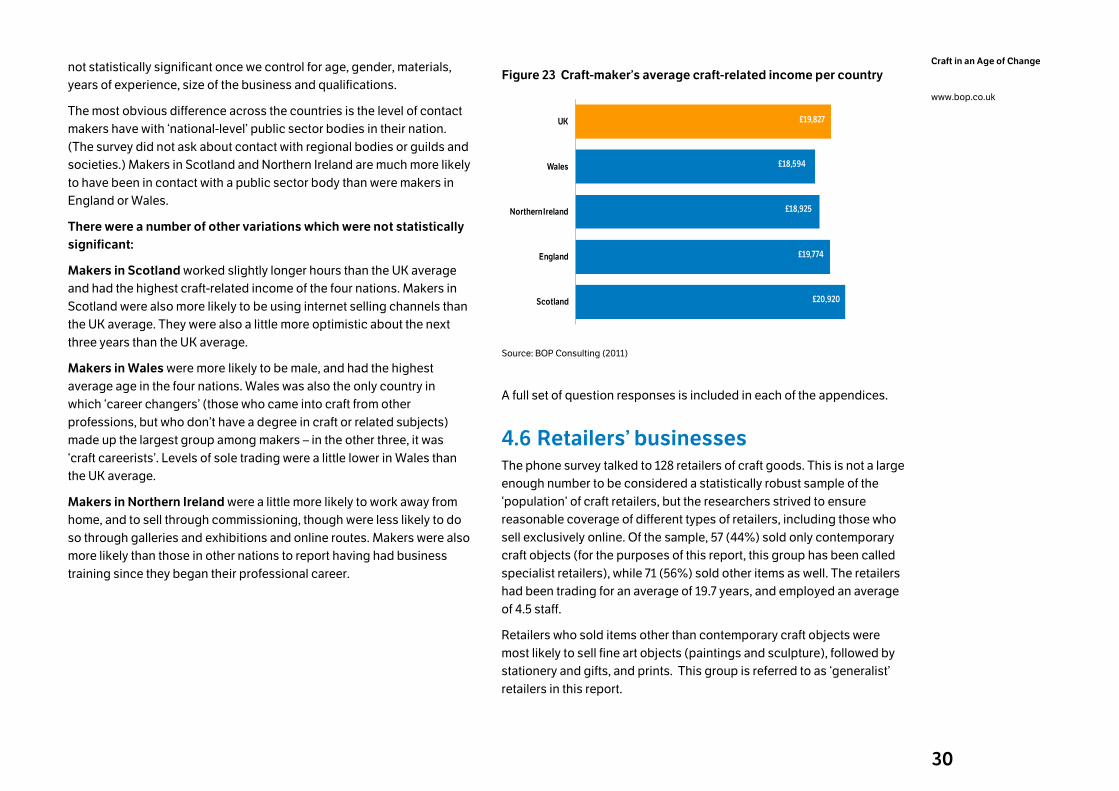
30
Craft in an Age of Change
www.bop.co.uk
not statistically significant once we control for age, gender, materials,
years of experience, size of the business and qualifications.
The most obvious difference across the countries is the level of contact
makers have with ‘national-level’ public sector bodies in their nation.
(The survey did not ask about contact with regional bodies or guilds and
societies.) Makers in Scotland and Northern Ireland are much more likely
to have been in contact with a public sector body than were makers in
England or Wales.
There were a number of other variations which were not statistically
significant:
Makers in Scotland worked slightly longer hours than the UK average
and had the highest craft-related income of the four nations. Makers in
Scotland were also more likely to be using internet selling channels than
the UK average. They were also a little more optimistic about the next
three years than the UK average.
Makers in Wales were more likely to be male, and had the highest
average age in the four nations. Wales was also the only country in
which ‘career changers’ (those who came into craft from other
professions, but who don’t have a degree in craft or related subjects)
made up the largest group among makers – in the other three, it was
‘craft careerists’. Levels of sole trading were a little lower in Wales than
the UK average.
Makers in Northern Ireland were a little more likely to work away from
home, and to sell through commissioning, though were less likely to do
so through galleries and exhibitions and online routes. Makers were also
more likely than those in other nations to report having had business
training since they began their professional career.
Figure 23 Craft-maker’s average craft-related income per country
£20,920
£19,774
£18,925
£18,594
£19,827
Scotland
England
Northern Ireland
Wales
UK
Source: BOP Consulting (2011)
A full set of question responses is included in each of the appendices.
4.6 Retailers’ businesses The phone survey talked to 128 retailers of craft goods. This is not a large
enough number to be considered a statistically robust sample of the
‘population’ of craft retailers, but the researchers strived to ensure
reasonable coverage of different types of retailers, including those who
sell exclusively online. Of the sample, 57 (44%) sold only contemporary
craft objects (for the purposes of this report, this group has been called
specialist retailers), while 71 (56%) sold other items as well. The retailers
had been trading for an average of 19.7 years, and employed an average
of 4.5 staff.
Retailers who sold items other than contemporary craft objects were
most likely to sell fine art objects (paintings and sculpture), followed by
stationery and gifts, and prints. This group is referred to as ‘generalist’
retailers in this report.
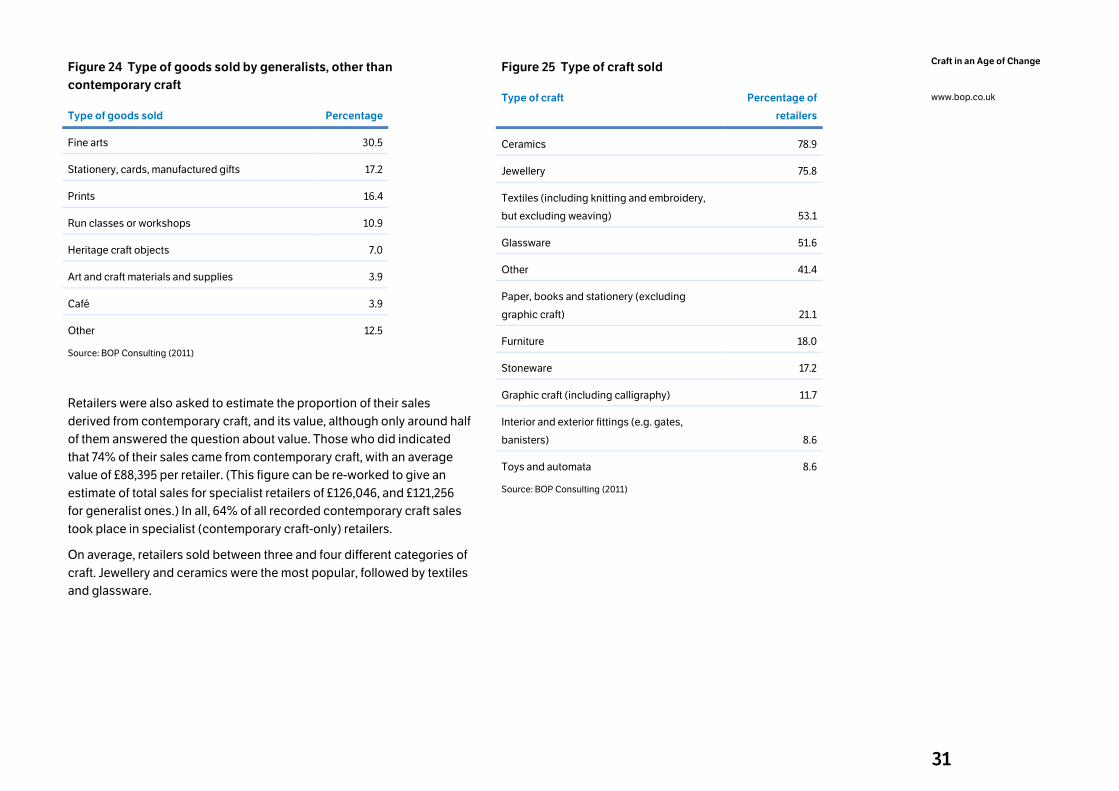
31
Craft in an Age of Change
www.bop.co.uk
Figure 24 Type of goods sold by generalists, other than
contemporary craft
Type of goods sold Percentage
Fine arts 30.5
Stationery, cards, manufactured gifts 17.2
Prints 16.4
Run classes or workshops 10.9
Heritage craft objects 7.0
Art and craft materials and supplies 3.9
Café 3.9
Other 12.5
Source: BOP Consulting (2011)
Retailers were also asked to estimate the proportion of their sales
derived from contemporary craft, and its value, although only around half
of them answered the question about value. Those who did indicated
that 74% of their sales came from contemporary craft, with an average
value of £88,395 per retailer. (This figure can be re-worked to give an
estimate of total sales for specialist retailers of £126,046, and £121,256
for generalist ones.) In all, 64% of all recorded contemporary craft sales
took place in specialist (contemporary craft-only) retailers.
On average, retailers sold between three and four different categories of
craft. Jewellery and ceramics were the most popular, followed by textiles
and glassware.
Figure 25 Type of craft sold
Type of craft Percentage of
retailers
Ceramics 78.9
Jewellery 75.8
Textiles (including knitting and embroidery,
but excluding weaving) 53.1
Glassware 51.6
Other 41.4
Paper, books and stationery (excluding
graphic craft) 21.1
Furniture 18.0
Stoneware 17.2
Graphic craft (including calligraphy) 11.7
Interior and exterior fittings (e.g. gates,
banisters) 8.6
Toys and automata 8.6
Source: BOP Consulting (2011)
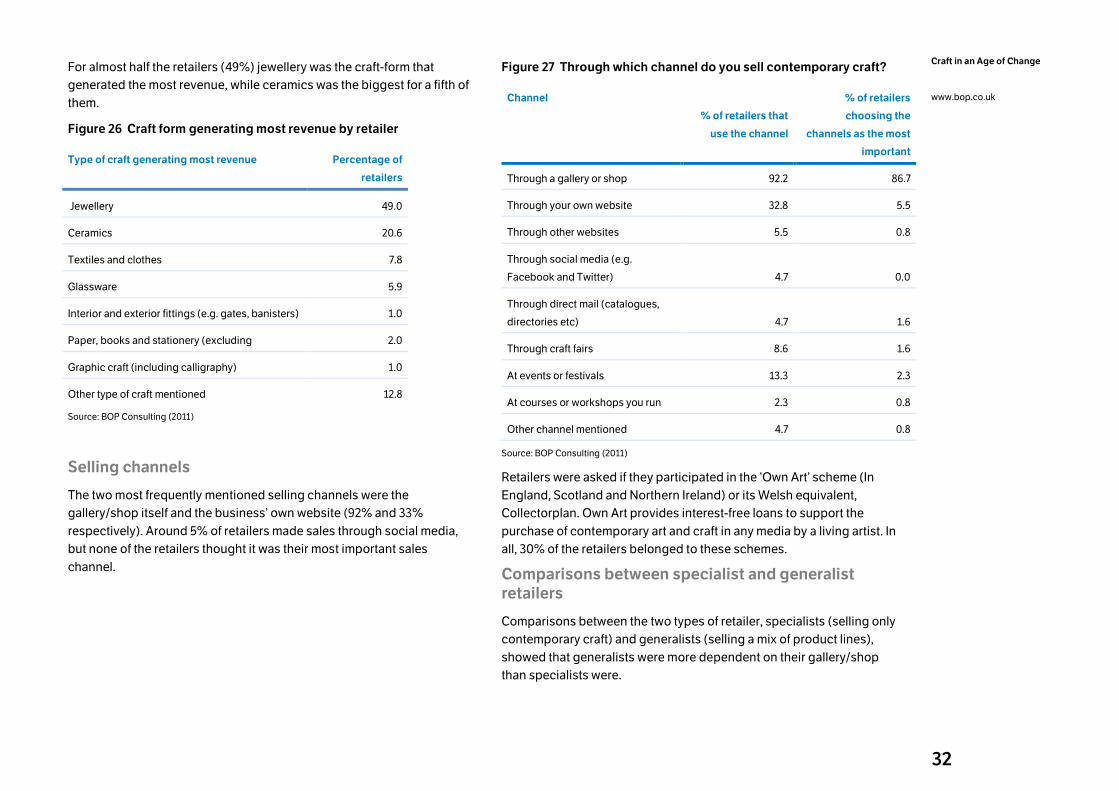
32
Craft in an Age of Change
www.bop.co.uk
For almost half the retailers (49%) jewellery was the craft-form that
generated the most revenue, while ceramics was the biggest for a fifth of
them.
Figure 26 Craft form generating most revenue by retailer
Type of craft generating most revenue Percentage of
retailers
Jewellery 49.0
Ceramics 20.6
Textiles and clothes 7.8
Glassware 5.9
Interior and exterior fittings (e.g. gates, banisters) 1.0
Paper, books and stationery (excluding 2.0
Graphic craft (including calligraphy) 1.0
Other type of craft mentioned 12.8
Source: BOP Consulting (2011)
Selling channels
The two most frequently mentioned selling channels were the
gallery/shop itself and the business’ own website (92% and 33%
respectively). Around 5% of retailers made sales through social media,
but none of the retailers thought it was their most important sales
channel.
Figure 27 Through which channel do you sell contemporary craft?
Channel
% of retailers that
use the channel
% of retailers
choosing the
channels as the most
important
Through a gallery or shop 92.2 86.7
Through your own website 32.8 5.5
Through other websites 5.5 0.8
Through social media (e.g.
Facebook and Twitter) 4.7 0.0
Through direct mail (catalogues,
directories etc) 4.7 1.6
Through craft fairs 8.6 1.6
At events or festivals 13.3 2.3
At courses or workshops you run 2.3 0.8
Other channel mentioned 4.7 0.8
Source: BOP Consulting (2011)
Retailers were asked if they participated in the ‘Own Art’ scheme (In
England, Scotland and Northern Ireland) or its Welsh equivalent,
Collectorplan. Own Art provides interest-free loans to support the
purchase of contemporary art and craft in any media by a living artist. In
all, 30% of the retailers belonged to these schemes.
Comparisons between specialist and generalist retailers
Comparisons between the two types of retailer, specialists (selling only
contemporary craft) and generalists (selling a mix of product lines),
showed that generalists were more dependent on their gallery/shop
than specialists were.
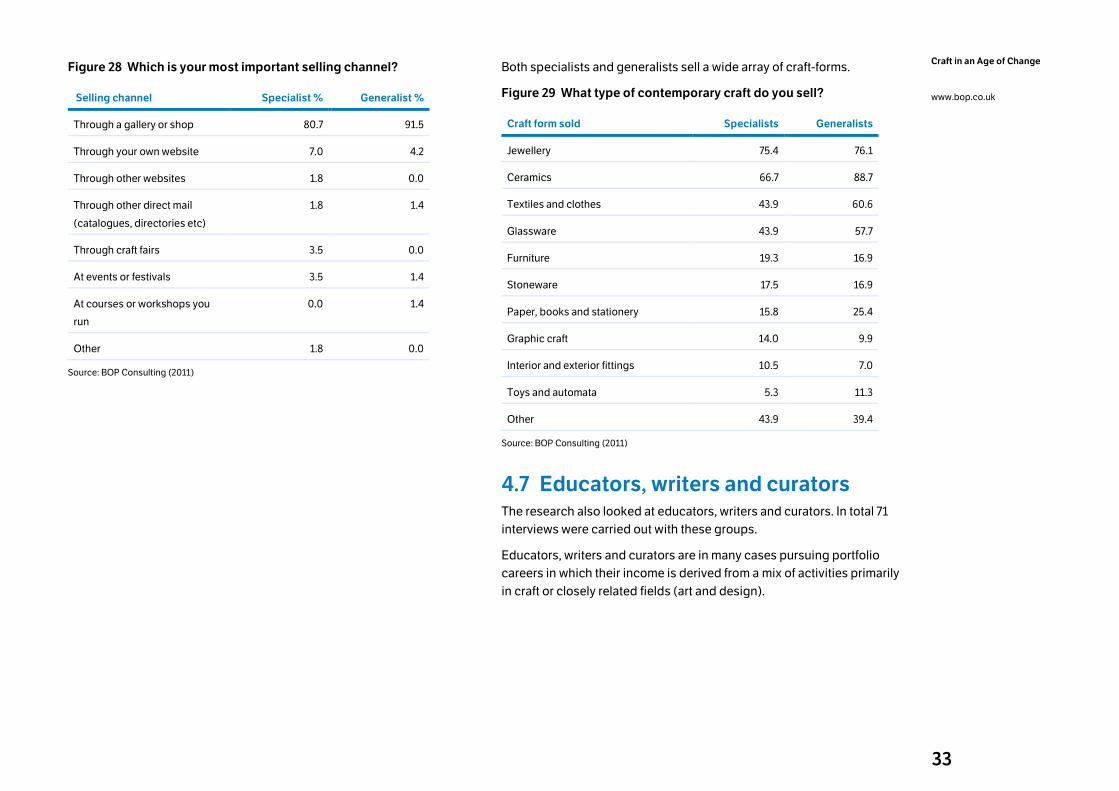
33
Craft in an Age of Change
www.bop.co.uk
Figure 28 Which is your most important selling channel?
Selling channel Specialist % Generalist %
Through a gallery or shop 80.7 91.5
Through your own website 7.0 4.2
Through other websites 1.8 0.0
Through other direct mail
(catalogues, directories etc)
1.8 1.4
Through craft fairs 3.5 0.0
At events or festivals 3.5 1.4
At courses or workshops you
run
0.0 1.4
Other 1.8 0.0
Source: BOP Consulting (2011)
Both specialists and generalists sell a wide array of craft-forms.
Figure 29 What type of contemporary craft do you sell?
Craft form sold Specialists Generalists
Jewellery 75.4 76.1
Ceramics 66.7 88.7
Textiles and clothes 43.9 60.6
Glassware 43.9 57.7
Furniture 19.3 16.9
Stoneware 17.5 16.9
Paper, books and stationery 15.8 25.4
Graphic craft 14.0 9.9
Interior and exterior fittings 10.5 7.0
Toys and automata 5.3 11.3
Other 43.9 39.4
Source: BOP Consulting (2011)
4.7 Educators, writers and curators The research also looked at educators, writers and curators. In total 71
interviews were carried out with these groups.
Educators, writers and curators are in many cases pursuing portfolio
careers in which their income is derived from a mix of activities primarily
in craft or closely related fields (art and design).
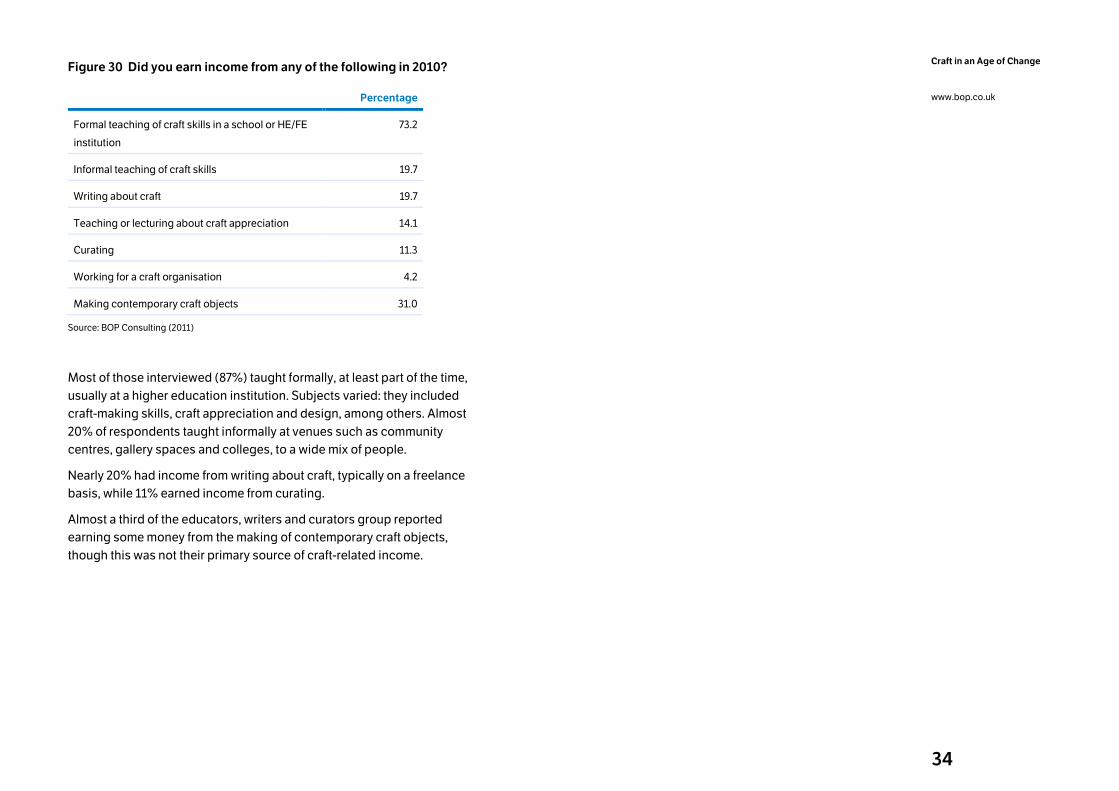
34
Craft in an Age of Change
www.bop.co.uk
Figure 30 Did you earn income from any of the following in 2010?
Percentage
Formal teaching of craft skills in a school or HE/FE
institution
73.2
Informal teaching of craft skills 19.7
Writing about craft 19.7
Teaching or lecturing about craft appreciation 14.1
Curating 11.3
Working for a craft organisation 4.2
Making contemporary craft objects 31.0
Source: BOP Consulting (2011)
Most of those interviewed (87%) taught formally, at least part of the time,
usually at a higher education institution. Subjects varied: they included
craft-making skills, craft appreciation and design, among others. Almost
20% of respondents taught informally at venues such as community
centres, gallery spaces and colleges, to a wide mix of people.
Nearly 20% had income from writing about craft, typically on a freelance
basis, while 11% earned income from curating.
Almost a third of the educators, writers and curators group reported
earning some money from the making of contemporary craft objects,
though this was not their primary source of craft-related income.
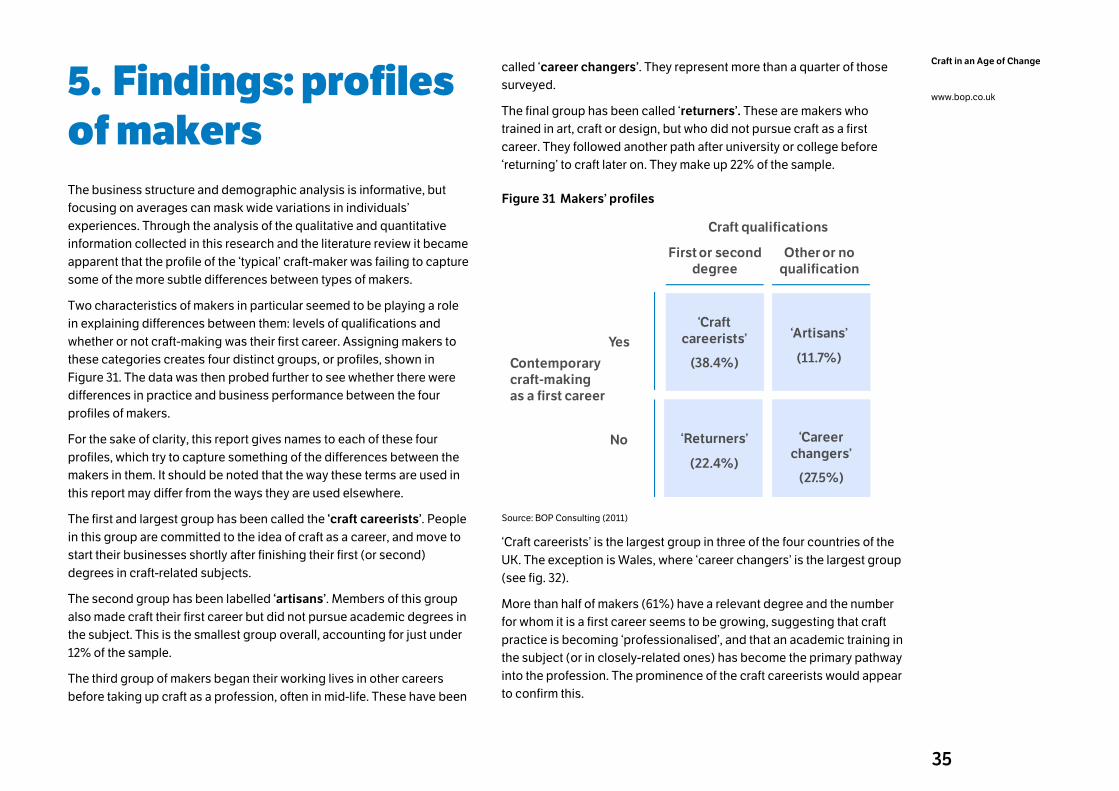
35
Craft in an Age of Change
www.bop.co.uk 5. Findings: profiles of makers The business structure and demographic analysis is informative, but
focusing on averages can mask wide variations in individuals’
experiences. Through the analysis of the qualitative and quantitative
information collected in this research and the literature review it became
apparent that the profile of the ‘typical’ craft-maker was failing to capture
some of the more subtle differences between types of makers.
Two characteristics of makers in particular seemed to be playing a role
in explaining differences between them: levels of qualifications and
whether or not craft-making was their first career. Assigning makers to
these categories creates four distinct groups, or profiles, shown in
Figure 31. The data was then probed further to see whether there were
differences in practice and business performance between the four
profiles of makers.
For the sake of clarity, this report gives names to each of these four
profiles, which try to capture something of the differences between the
makers in them. It should be noted that the way these terms are used in
this report may differ from the ways they are used elsewhere.
The first and largest group has been called the ‘craft careerists’. People
in this group are committed to the idea of craft as a career, and move to
start their businesses shortly after finishing their first (or second)
degrees in craft-related subjects.
The second group has been labelled ‘artisans’. Members of this group
also made craft their first career but did not pursue academic degrees in
the subject. This is the smallest group overall, accounting for just under
12% of the sample.
The third group of makers began their working lives in other careers
before taking up craft as a profession, often in mid-life. These have been
called ‘career changers’. They represent more than a quarter of those
surveyed.
The final group has been called ‘returners’. These are makers who
trained in art, craft or design, but who did not pursue craft as a first
career. They followed another path after university or college before
‘returning’ to craft later on. They make up 22% of the sample.
Figure 31 Makers’ profiles
Craft qualifications
First or second
degree
Other or no
qualification
Contemporary
craft-making
as a first career
Yes
No
‘Craft
careerists’
(38.4%)
‘Artisans’
(11.7%)
‘Returners’
(22.4%)
‘Career
changers’
(27.5%)
Source: BOP Consulting (2011)
‘Craft careerists’ is the largest group in three of the four countries of the
UK. The exception is Wales, where ‘career changers’ is the largest group
(see fig. 32).
More than half of makers (61%) have a relevant degree and the number
for whom it is a first career seems to be growing, suggesting that craft
practice is becoming ‘professionalised’, and that an academic training in
the subject (or in closely-related ones) has become the primary pathway
into the profession. The prominence of the craft careerists would appear
to confirm this.
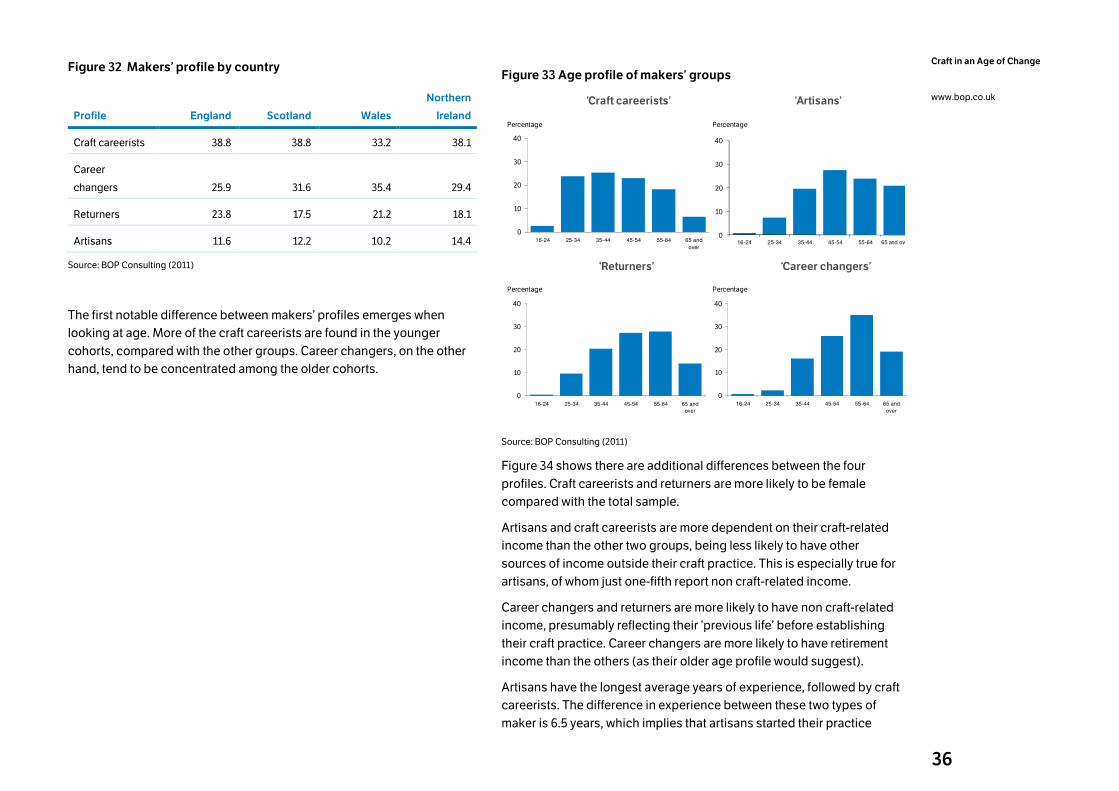
36
Craft in an Age of Change
www.bop.co.uk
Figure 32 Makers’ profile by country
Profile England Scotland Wales
Northern
Ireland
Craft careerists 38.8 38.8 33.2 38.1
Career
changers 25.9 31.6 35.4 29.4
Returners 23.8 17.5 21.2 18.1
Artisans 11.6 12.2 10.2 14.4
Source: BOP Consulting (2011)
The first notable difference between makers’ profiles emerges when
looking at age. More of the craft careerists are found in the younger
cohorts, compared with the other groups. Career changers, on the other
hand, tend to be concentrated among the older cohorts.
Figure 33 Age profile of makers’ groups
‘Craft careerists’ ‘Artisans’
‘Returners’ ‘Career changers’
0
10
20
30
40
16-24 25-34 35-44 45-54 55-64 65 and
over
0
10
20
30
40
16-24 25-34 35-44 45-54 55-64 65 and
over
0
10
20
30
40
16-24 25-34 35-44 45-54 55-64 65 and
over
0
10
20
30
40
16-24 25-34 35-44 45-54 55-64 65 and over
Percentage Percentage
Percentage Percentage
Source: BOP Consulting (2011)
Figure 34 shows there are additional differences between the four
profiles. Craft careerists and returners are more likely to be female
compared with the total sample.
Artisans and craft careerists are more dependent on their craft-related
income than the other two groups, being less likely to have other
sources of income outside their craft practice. This is especially true for
artisans, of whom just one-fifth report non craft-related income.
Career changers and returners are more likely to have non craft-related
income, presumably reflecting their ‘previous life’ before establishing
their craft practice. Career changers are more likely to have retirement
income than the others (as their older age profile would suggest).
Artisans have the longest average years of experience, followed by craft
careerists. The difference in experience between these two types of
maker is 6.5 years, which implies that artisans started their practice
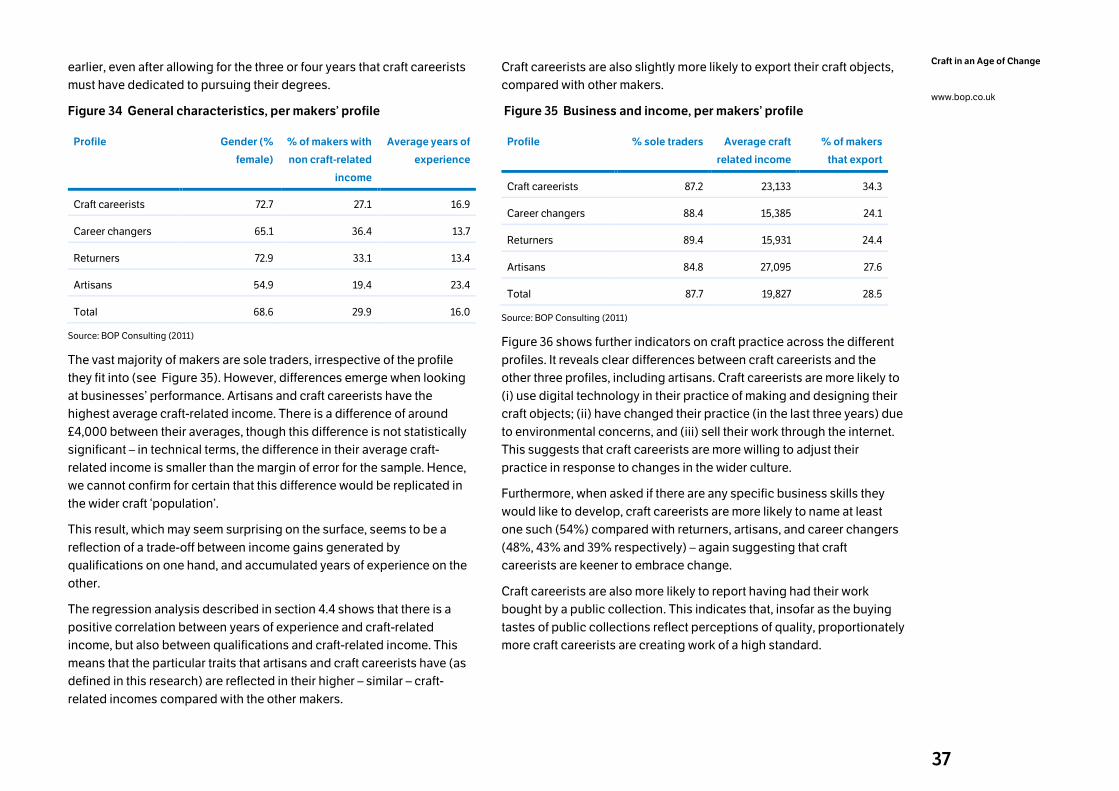
37
Craft in an Age of Change
www.bop.co.uk
earlier, even after allowing for the three or four years that craft careerists
must have dedicated to pursuing their degrees.
Figure 34 General characteristics, per makers’ profile
Profile Gender (%
female)
% of makers with
non craft-related
income
Average years of
experience
Craft careerists 72.7 27.1 16.9
Career changers 65.1 36.4 13.7
Returners 72.9 33.1 13.4
Artisans 54.9 19.4 23.4
Total 68.6 29.9 16.0
Source: BOP Consulting (2011)
The vast majority of makers are sole traders, irrespective of the profile
they fit into (see Figure 35). However, differences emerge when looking
at businesses’ performance. Artisans and craft careerists have the
highest average craft-related income. There is a difference of around
£4,000 between their averages, though this difference is not statistically
significant – in technical terms, the difference in their average craft-
related income is smaller than the margin of error for the sample. Hence,
we cannot confirm for certain that this difference would be replicated in
the wider craft ‘population’.
This result, which may seem surprising on the surface, seems to be a
reflection of a trade-off between income gains generated by
qualifications on one hand, and accumulated years of experience on the
other.
The regression analysis described in section 4.4 shows that there is a
positive correlation between years of experience and craft-related
income, but also between qualifications and craft-related income. This
means that the particular traits that artisans and craft careerists have (as
defined in this research) are reflected in their higher – similar – craft-
related incomes compared with the other makers.
Craft careerists are also slightly more likely to export their craft objects,
compared with other makers.
Figure 35 Business and income, per makers’ profile
Profile % sole traders Average craft
related income
% of makers
that export
Craft careerists 87.2 23,133 34.3
Career changers 88.4 15,385 24.1
Returners 89.4 15,931 24.4
Artisans 84.8 27,095 27.6
Total 87.7 19,827 28.5
Source: BOP Consulting (2011)
Figure 36 shows further indicators on craft practice across the different
profiles. It reveals clear differences between craft careerists and the
other three profiles, including artisans. Craft careerists are more likely to
(i) use digital technology in their practice of making and designing their
craft objects; (ii) have changed their practice (in the last three years) due
to environmental concerns, and (iii) sell their work through the internet.
This suggests that craft careerists are more willing to adjust their
practice in response to changes in the wider culture.
Furthermore, when asked if there are any specific business skills they
would like to develop, craft careerists are more likely to name at least
one such (54%) compared with returners, artisans, and career changers
(48%, 43% and 39% respectively) – again suggesting that craft
careerists are keener to embrace change.
Craft careerists are also more likely to report having had their work
bought by a public collection. This indicates that, insofar as the buying
tastes of public collections reflect perceptions of quality, proportionately
more craft careerists are creating work of a high standard.
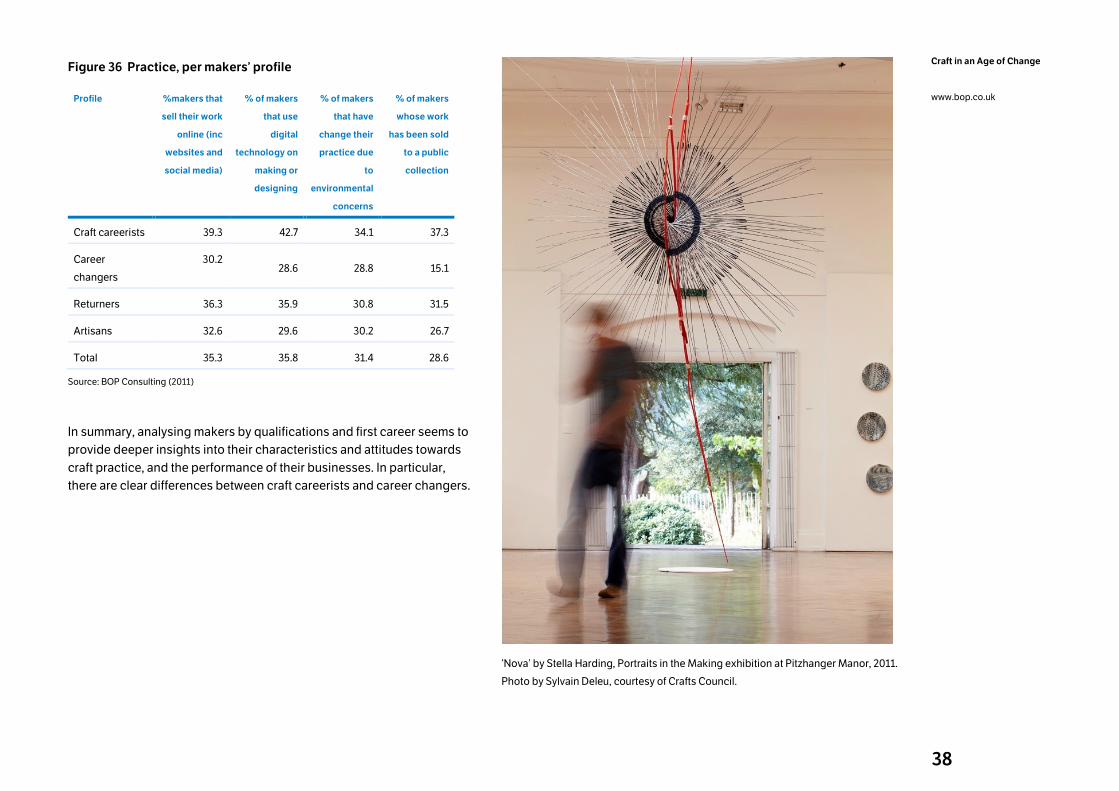
38
Craft in an Age of Change
www.bop.co.uk
Figure 36 Practice, per makers’ profile
Profile %makers that
sell their work
online (inc
websites and
social media)
% of makers
that use
digital
technology on
making or
designing
% of makers
that have
change their
practice due
to
environmental
concerns
% of makers
whose work
has been sold
to a public
collection
Craft careerists 39.3 42.7 34.1 37.3
Career
changers
30.2 28.6 28.8 15.1
Returners 36.3 35.9 30.8 31.5
Artisans 32.6 29.6 30.2 26.7
Total 35.3 35.8 31.4 28.6
Source: BOP Consulting (2011)
In summary, analysing makers by qualifications and first career seems to
provide deeper insights into their characteristics and attitudes towards
craft practice, and the performance of their businesses. In particular,
there are clear differences between craft careerists and career changers.
‘Nova’ by Stella Harding, Portraits in the Making exhibition at Pitzhanger Manor, 2011.
Photo by Sylvain Deleu, courtesy of Crafts Council.
39
Craft in an Age of Change
www.bop.co.uk 6. Findings: four themes The contemporary craft sector has its own particular characteristics, but
it cannot be seen in isolation. As the title of this report suggests, the
current age is one marked by rapid change: in economics, the
environment, and in culture. The impact of these wider changes on craft
was explored in the literature review and the discussions with the focus
groups. From these, four themes emerged, which helped to shape the
phone survey.
• How are internet and digital technologies shaping craft practice?
• How does the global vs local debate play out in the sector?
• To what extent are issues of sustainability affecting practice in the
sector?
• How have the recent economic difficulties affected the sector?
These areas are clearly interrelated. The spread of the internet has
spurred globalisation by creating greater opportunities for trade and by
speeding the transmission of new ideas, while the increased
consumption of resources by emerging economies stemming from
globalisation has helped focus attention on issues of sustainability.
These are hugely complex areas, which will continue to shape the
economic, political and cultural landscape for years to come. The phone
survey enabled us to gather some evidence on these long-term issues,
as they affect the contemporary craft sector. This chapter considers the
results from the survey that relate to these four themes.
6.1 How are internet and digital
technologies shaping craft practice? Internet and digital technologies have radically re-shaped many of the
creative industries, including music, publishing and film. These
technologies have greatly amplified the potential market for creative
products, by allowing producers to reach entirely new customer bases,
but have also opened up such industries to foreign competition and to
the risks of intellectual property theft.
Craft might seem to be relatively immune from such trends. The sector
emphasises the authenticity and uniqueness of its products and
services, and there is a widespread belief that people like to hold an
object in their hands before buying it – and that this physical experience
cannot be replicated online.
Yet cutting-edge technologies such as laser cutting and 3D printing
have opened up new possibilities for makers. Indeed, 3D printing, which
allows a blueprint on a computer to be ‘printed’ in materials such as
plastic or metal, has been described by The Economist as ‘the
manufacturing technology that will change the world’.42 While such
technologies are not necessarily widely used by the craft-making
population as a whole (though some mid-career makers have embraced
them), they are used in universities and colleges, and are therefore
shaping the next generation of craft-makers. These technologies also
make it much easier to replicate the work of makers.
The survey examined two areas which relate to this question: changes in
makers’ practice, and changes in their methods of selling.
Changing practice
The majority of makers were using digital technology in some form in
their practice or production: in all, 57% did so. Of all those who were
using digital technology in their practice or production, 57% (by
coincidence) did so all the time or often.
42 The Economist, Print me a Stradivarius, February 12-18, 2011, London.
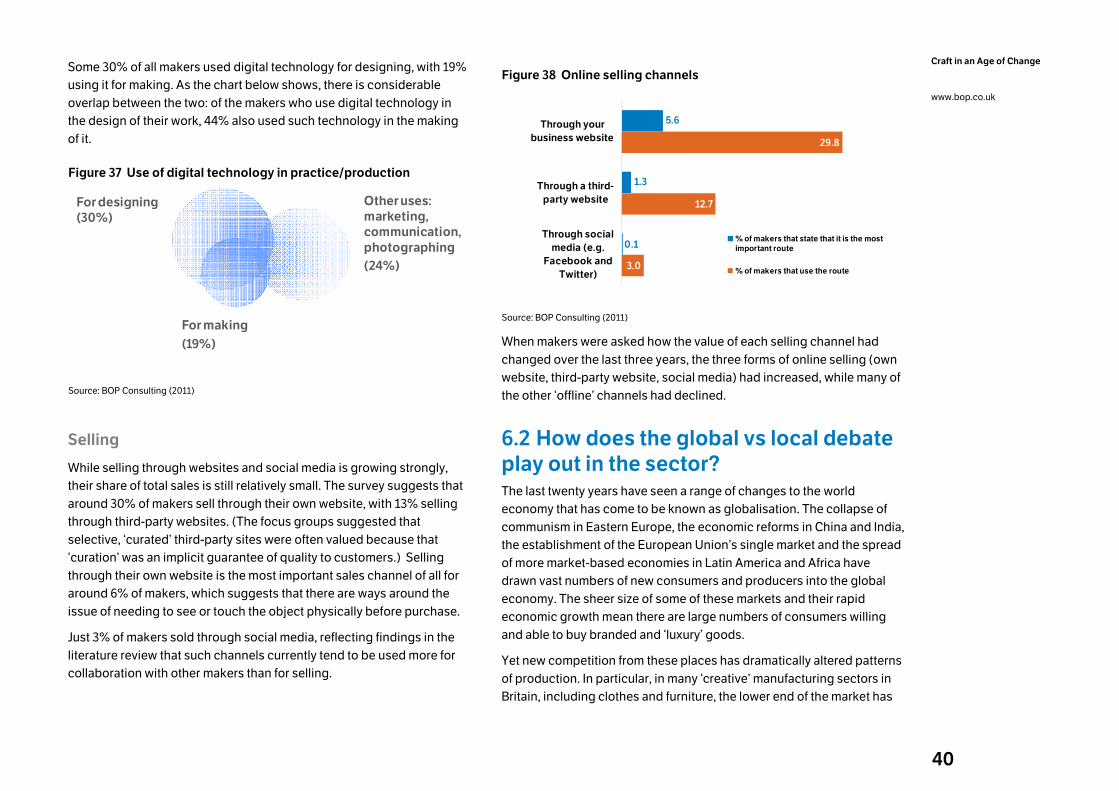
40
Craft in an Age of Change
www.bop.co.uk
Some 30% of all makers used digital technology for designing, with 19%
using it for making. As the chart below shows, there is considerable
overlap between the two: of the makers who use digital technology in
the design of their work, 44% also used such technology in the making
of it.
Figure 37 Use of digital technology in practice/production
For designing
(30%)
Other uses:
marketing,
communication,
photographing
(24%)
For making
(19%)
Source: BOP Consulting (2011)
Selling
While selling through websites and social media is growing strongly,
their share of total sales is still relatively small. The survey suggests that
around 30% of makers sell through their own website, with 13% selling
through third-party websites. (The focus groups suggested that
selective, ‘curated’ third-party sites were often valued because that
‘curation’ was an implicit guarantee of quality to customers.) Selling
through their own website is the most important sales channel of all for
around 6% of makers, which suggests that there are ways around the
issue of needing to see or touch the object physically before purchase.
Just 3% of makers sold through social media, reflecting findings in the
literature review that such channels currently tend to be used more for
collaboration with other makers than for selling.
Figure 38 Online selling channels
3.0
12.7
29.8
0.1
5.6
1.3
Through social
media (e.g.
Facebook and
Twitter)
Through a third-
party website
Through your
business website
% of makers that state that it is the most
important route
% of makers that use the route
Source: BOP Consulting (2011)
When makers were asked how the value of each selling channel had
changed over the last three years, the three forms of online selling (own
website, third-party website, social media) had increased, while many of
the other ‘offline’ channels had declined.
6.2 How does the global vs local debate
play out in the sector? The last twenty years have seen a range of changes to the world
economy that has come to be known as globalisation. The collapse of
communism in Eastern Europe, the economic reforms in China and India,
the establishment of the European Union’s single market and the spread
of more market-based economies in Latin America and Africa have
drawn vast numbers of new consumers and producers into the global
economy. The sheer size of some of these markets and their rapid
economic growth mean there are large numbers of consumers willing
and able to buy branded and ‘luxury’ goods.
Yet new competition from these places has dramatically altered patterns
of production. In particular, in many ‘creative’ manufacturing sectors in
Britain, including clothes and furniture, the lower end of the market has
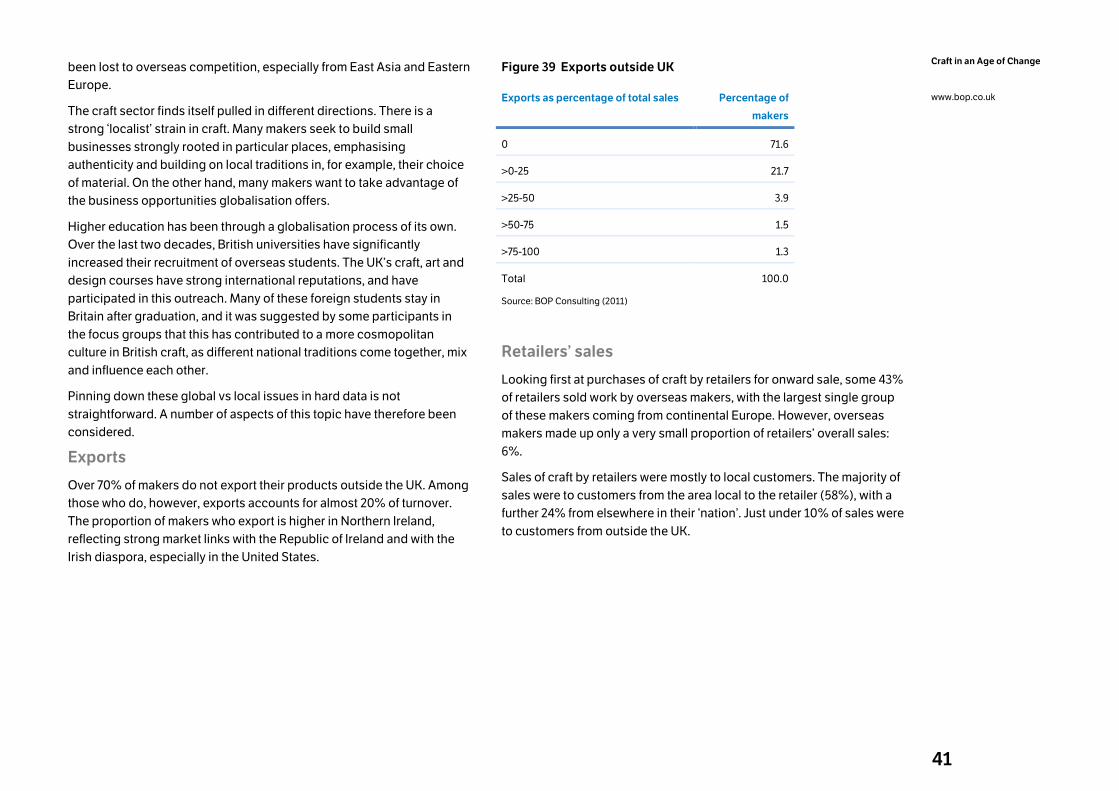
41
Craft in an Age of Change
www.bop.co.uk
been lost to overseas competition, especially from East Asia and Eastern
Europe.
The craft sector finds itself pulled in different directions. There is a
strong ‘localist’ strain in craft. Many makers seek to build small
businesses strongly rooted in particular places, emphasising
authenticity and building on local traditions in, for example, their choice
of material. On the other hand, many makers want to take advantage of
the business opportunities globalisation offers.
Higher education has been through a globalisation process of its own.
Over the last two decades, British universities have significantly
increased their recruitment of overseas students. The UK’s craft, art and
design courses have strong international reputations, and have
participated in this outreach. Many of these foreign students stay in
Britain after graduation, and it was suggested by some participants in
the focus groups that this has contributed to a more cosmopolitan
culture in British craft, as different national traditions come together, mix
and influence each other.
Pinning down these global vs local issues in hard data is not
straightforward. A number of aspects of this topic have therefore been
considered.
Exports
Over 70% of makers do not export their products outside the UK. Among
those who do, however, exports accounts for almost 20% of turnover.
The proportion of makers who export is higher in Northern Ireland,
reflecting strong market links with the Republic of Ireland and with the
Irish diaspora, especially in the United States.
Figure 39 Exports outside UK
Exports as percentage of total sales Percentage of
makers
0 71.6
>0-25 21.7
>25-50 3.9
>50-75 1.5
>75-100 1.3
Total 100.0
Source: BOP Consulting (2011)
Retailers’ sales
Looking first at purchases of craft by retailers for onward sale, some 43%
of retailers sold work by overseas makers, with the largest single group
of these makers coming from continental Europe. However, overseas
makers made up only a very small proportion of retailers’ overall sales:
6%.
Sales of craft by retailers were mostly to local customers. The majority of
sales were to customers from the area local to the retailer (58%), with a
further 24% from elsewhere in their ‘nation’. Just under 10% of sales were
to customers from outside the UK.
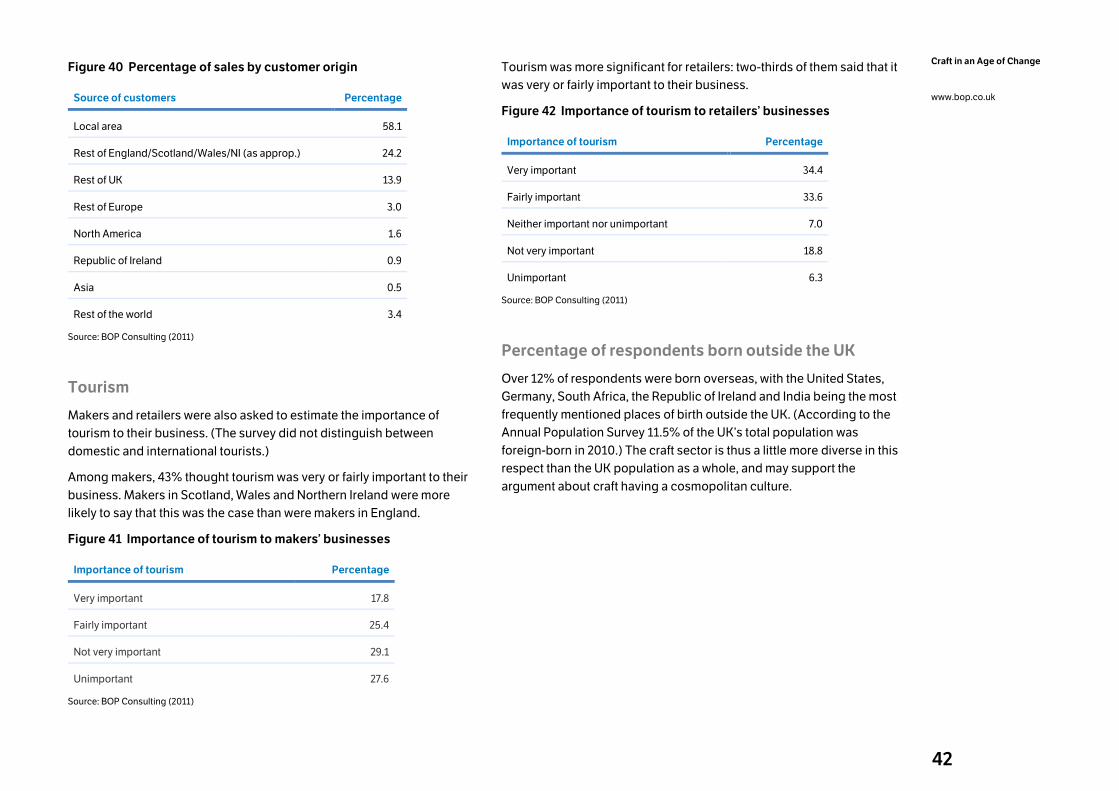
42
Craft in an Age of Change
www.bop.co.uk
Figure 40 Percentage of sales by customer origin
Source of customers Percentage
Local area 58.1
Rest of England/Scotland/Wales/NI (as approp.) 24.2
Rest of UK 13.9
Rest of Europe 3.0
North America 1.6
Republic of Ireland 0.9
Asia 0.5
Rest of the world 3.4
Source: BOP Consulting (2011)
Tourism
Makers and retailers were also asked to estimate the importance of
tourism to their business. (The survey did not distinguish between
domestic and international tourists.)
Among makers, 43% thought tourism was very or fairly important to their
business. Makers in Scotland, Wales and Northern Ireland were more
likely to say that this was the case than were makers in England.
Figure 41 Importance of tourism to makers’ businesses
Importance of tourism Percentage
Very important 17.8
Fairly important 25.4
Not very important 29.1
Unimportant 27.6
Source: BOP Consulting (2011)
Tourism was more significant for retailers: two-thirds of them said that it
was very or fairly important to their business.
Figure 42 Importance of tourism to retailers’ businesses
Importance of tourism Percentage
Very important 34.4
Fairly important 33.6
Neither important nor unimportant 7.0
Not very important 18.8
Unimportant 6.3
Source: BOP Consulting (2011)
Percentage of respondents born outside the UK
Over 12% of respondents were born overseas, with the United States,
Germany, South Africa, the Republic of Ireland and India being the most
frequently mentioned places of birth outside the UK. (According to the
Annual Population Survey 11.5% of the UK’s total population was
foreign-born in 2010.) The craft sector is thus a little more diverse in this
respect than the UK population as a whole, and may support the
argument about craft having a cosmopolitan culture.
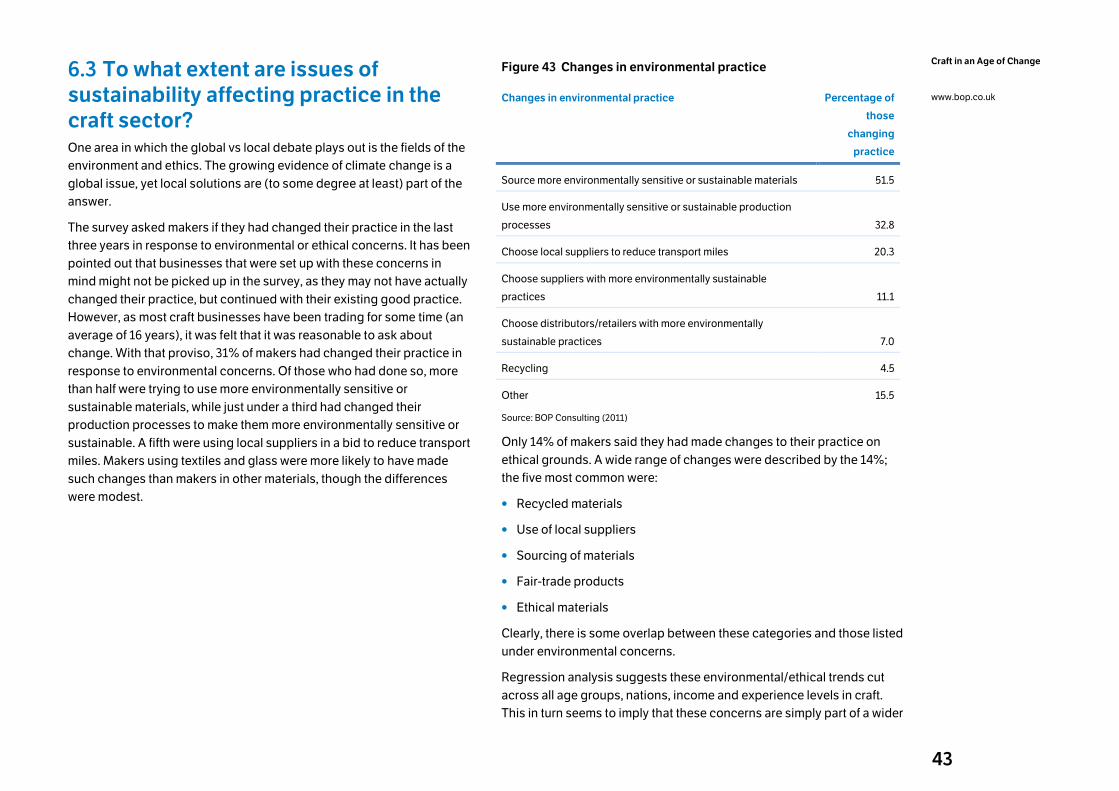
43
Craft in an Age of Change
www.bop.co.uk
6.3 To what extent are issues of
sustainability affecting practice in the
craft sector? One area in which the global vs local debate plays out is the fields of the
environment and ethics. The growing evidence of climate change is a
global issue, yet local solutions are (to some degree at least) part of the
answer.
The survey asked makers if they had changed their practice in the last
three years in response to environmental or ethical concerns. It has been
pointed out that businesses that were set up with these concerns in
mind might not be picked up in the survey, as they may not have actually
changed their practice, but continued with their existing good practice.
However, as most craft businesses have been trading for some time (an
average of 16 years), it was felt that it was reasonable to ask about
change. With that proviso, 31% of makers had changed their practice in
response to environmental concerns. Of those who had done so, more
than half were trying to use more environmentally sensitive or
sustainable materials, while just under a third had changed their
production processes to make them more environmentally sensitive or
sustainable. A fifth were using local suppliers in a bid to reduce transport
miles. Makers using textiles and glass were more likely to have made
such changes than makers in other materials, though the differences
were modest.
Figure 43 Changes in environmental practice
Changes in environmental practice Percentage of
those
changing
practice
Source more environmentally sensitive or sustainable materials 51.5
Use more environmentally sensitive or sustainable production
processes 32.8
Choose local suppliers to reduce transport miles 20.3
Choose suppliers with more environmentally sustainable
practices 11.1
Choose distributors/retailers with more environmentally
sustainable practices 7.0
Recycling 4.5
Other 15.5
Source: BOP Consulting (2011)
Only 14% of makers said they had made changes to their practice on
ethical grounds. A wide range of changes were described by the 14%;
the five most common were:
• Recycled materials
• Use of local suppliers
• Sourcing of materials
• Fair-trade products
• Ethical materials
Clearly, there is some overlap between these categories and those listed
under environmental concerns.
Regression analysis suggests these environmental/ethical trends cut
across all age groups, nations, income and experience levels in craft.
This in turn seems to imply that these concerns are simply part of a wider
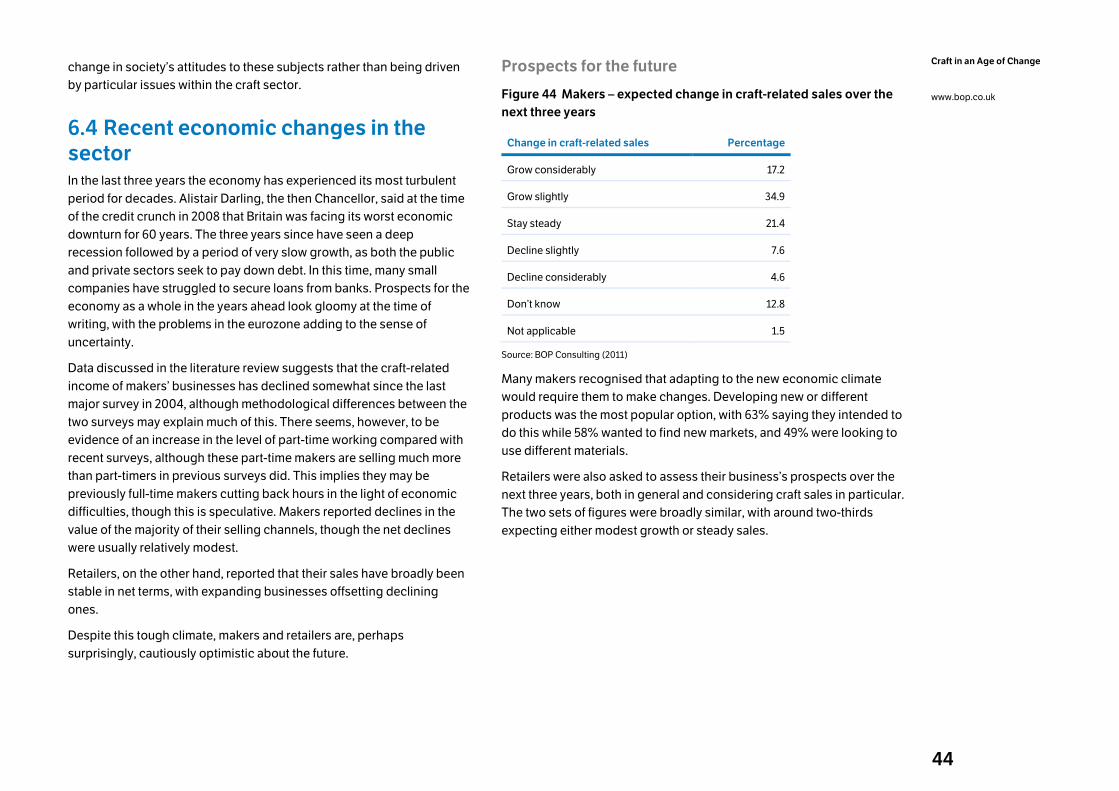
44
Craft in an Age of Change
www.bop.co.uk
change in society’s attitudes to these subjects rather than being driven
by particular issues within the craft sector.
6.4 Recent economic changes in the sector In the last three years the economy has experienced its most turbulent
period for decades. Alistair Darling, the then Chancellor, said at the time
of the credit crunch in 2008 that Britain was facing its worst economic
downturn for 60 years. The three years since have seen a deep
recession followed by a period of very slow growth, as both the public
and private sectors seek to pay down debt. In this time, many small
companies have struggled to secure loans from banks. Prospects for the
economy as a whole in the years ahead look gloomy at the time of
writing, with the problems in the eurozone adding to the sense of
uncertainty.
Data discussed in the literature review suggests that the craft-related
income of makers’ businesses has declined somewhat since the last
major survey in 2004, although methodological differences between the
two surveys may explain much of this. There seems, however, to be
evidence of an increase in the level of part-time working compared with
recent surveys, although these part-time makers are selling much more
than part-timers in previous surveys did. This implies they may be
previously full-time makers cutting back hours in the light of economic
difficulties, though this is speculative. Makers reported declines in the
value of the majority of their selling channels, though the net declines
were usually relatively modest.
Retailers, on the other hand, reported that their sales have broadly been
stable in net terms, with expanding businesses offsetting declining
ones.
Despite this tough climate, makers and retailers are, perhaps
surprisingly, cautiously optimistic about the future.
Prospects for the future
Figure 44 Makers – expected change in craft-related sales over the
next three years
Change in craft-related sales Percentage
Grow considerably 17.2
Grow slightly 34.9
Stay steady 21.4
Decline slightly 7.6
Decline considerably 4.6
Don’t know 12.8
Not applicable 1.5
Source: BOP Consulting (2011)
Many makers recognised that adapting to the new economic climate
would require them to make changes. Developing new or different
products was the most popular option, with 63% saying they intended to
do this while 58% wanted to find new markets, and 49% were looking to
use different materials.
Retailers were also asked to assess their business’s prospects over the
next three years, both in general and considering craft sales in particular.
The two sets of figures were broadly similar, with around two-thirds
expecting either modest growth or steady sales.
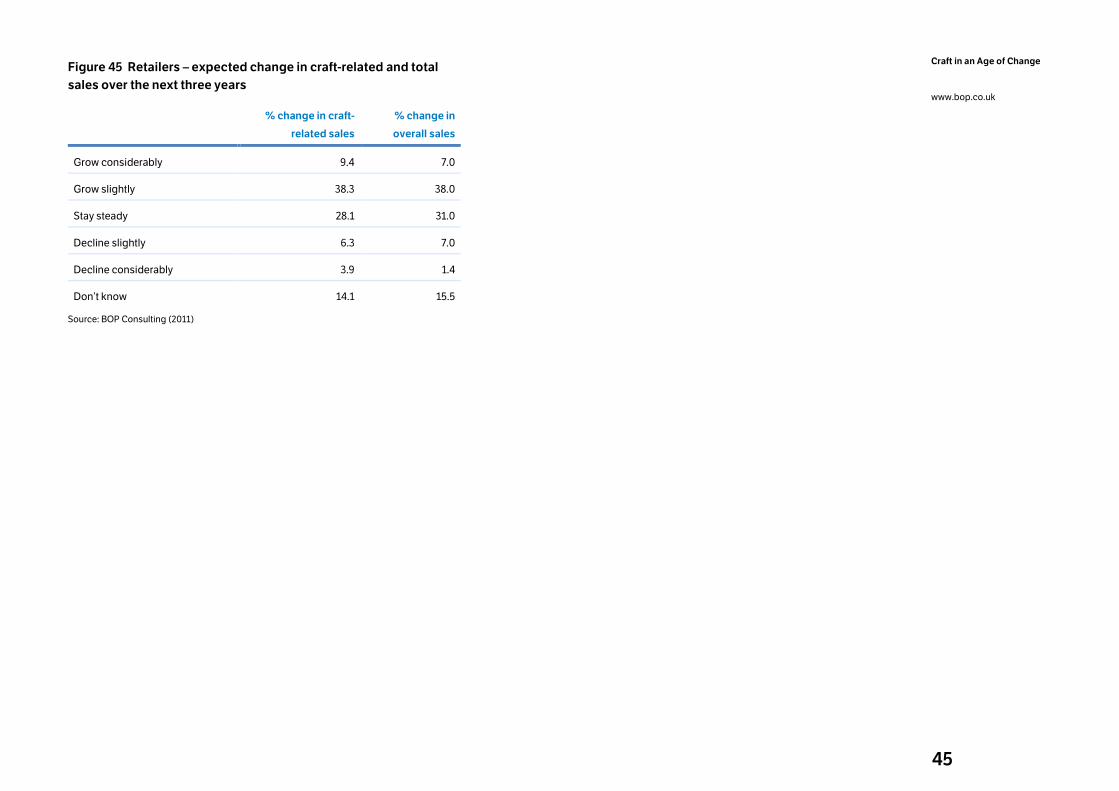
45
Craft in an Age of Change
www.bop.co.uk
Figure 45 Retailers – expected change in craft-related and total
sales over the next three years
% change in craft-
related sales
% change in
overall sales
Grow considerably 9.4 7.0
Grow slightly 38.3 38.0
Stay steady 28.1 31.0
Decline slightly 6.3 7.0
Decline considerably 3.9 1.4
Don’t know 14.1 15.5
Source: BOP Consulting (2011)
46
Craft in an Age of Change
www.bop.co.uk 7. Conclusions The survey suggests that, in many respects, the structure of the
contemporary craft sector is relatively stable. It remains dominated by
small, well-established businesses. The characteristics of makers have
changed relatively little since the early 2000s, although practice is
shifting to reflect the new possibilities of digital technology and
environmental and ethical concerns. Retailers reported that, on balance,
their sales had been fairly steady over the last three years. Both retailers
and makers were cautiously optimistic about the future at the time of the
survey (June/July 2011).
Nevertheless, the contemporary craft sector clearly faces challenges in
the years ahead. Insofar as it is possible to tell, given methodological
differences between this survey and previous ones, makers’ gross craft-
related incomes have declined moderately of late. Sales through the
majority of ‘real world’ selling channels have fallen, and while online
sales have grown, they have done so from a low base, and have only
partially compensated for losses elsewhere. There seems to have been
an increase in part-time working, though such workers are earning more
than part-timers in previous surveys were. Net profits remain modest
(more than half of makers report making less than £5,000 a year), and
many makers feel they lack the general business skills they need to
grow, especially in marketing. Although the large majority of makers
have other craft-related income sources apart from designing and
making objects, these are, with the exception of teaching, relatively
small contributors to gross income. Craft sales remain locally focused,
with limited exports.
BOP Consulting’s analysis of the four profiles of makers offers deeper
insights into the sector. It suggests that in many ways the sector is being
led by the craft careerists – highly educated and determined on a career
in craft – who are younger and are earning more than the craft average,
are keen to develop and use new skills, and produce work that is more
likely to be exported or be bought by public collections.
This document is a research report, and it is not its place to make policy
or strategy recommendations. Nevertheless, the research has flagged
up a number of questions and issues for the future, which are worth
discussing in a little more depth.
• What will the rise of digital technologies do to the concept of
craft?
Digital technology has been on a ‘long march’ through the creative
industries, transforming business models as it goes. The music,
newspaper, photography and film industries have been radically altered,
and even sectors that initially seemed less likely to be affected, such as
book publishing, are now changing fast. Craft too is now being touched
by these developments. The unique, hand-made nature of craft objects
lies at the heart of the profession, reflecting core beliefs such as the
importance of authenticity and the value of workmanship. Yet if
technologies such as 3D printing become ubiquitous, and it becomes
possible to make distinctive objects at the touch of a button, what does
that imply for the whole notion of craft? Will the boundaries between
craft, fine art and design blur still further as a result? Is such a change a
threat to the identity of craft or an opportunity for exchanging ideas
across artistic and wider agendas? What will being a craft professional
actually mean in these circumstances?
• What will the economic effects of the ‘age of austerity’ be?
The challenges that Britain’s economy faces over the next few years
suggest that domestic economic growth is likely to remain slow.
Globally, growth is likely to be concentrated in the emerging economies.
Most makers are sole traders, and most of them currently do not export.
How can they be encouraged and supported to find opportunities
overseas? Are there other ways in which makers can use their specialist
skills, knowledge of materials and experience of innovation and product
development to earn money in international markets?
Online sales represent the growth area in the domestic market, albeit
from a low base, but a significant minority of makers feel they lack
marketing skills (including in digital marketing). Currently many buyers
prefer to physically see and touch the object before purchase. How can
craft address this issue? What are the lessons from other art-forms, and
47
Craft in an Age of Change
www.bop.co.uk
can they be applied to craft? And what are the implications for
commercial galleries?
The domestic market for low- and middle-end creative products of many
kinds (i.e. products other than craft) has been affected for several years
by imports of cheap goods of reasonable quality. The logic of
globalisation and greater competition suggests that the future market
for UK craft will become increasingly concentrated at the higher end,
where originality and aesthetic value count for more than cost and where
skills and knowledge can earn a premium. However, in tough economic
times consumers may cut back on expensive and ‘luxury’ purchases. Is
there a danger of a backlash against conspicuous consumption? How
should craft position itself in such a market?
Economic problems may also affect the type of people who enter the
profession. What will the effect of slow growth be on the career
changers and returners? Will increasing levels of redundancy and
unemployment lead more people to turn to craft as an alternative career,
or will economic uncertainty make people more reluctant to take the
gamble of changing direction?
Finally, will economic pressures accelerate the trend for portfolio
working, as people look to capitalise on their craft skills to bring in
income from a broader range of sources, or will it reduce the number of
opportunities, as other sectors cut back too? Are makers in particular
able to market themselves well enough to develop the profile required to
take up opportunities outside the immediate craft sector?
• What effect will changes to higher education have on craft?
Craft has become ‘professionalised’ in recent years, with first and
second degrees becoming a key pathway into the profession. Teaching
in higher education institutions is also an important source of income for
many craft professionals. Yet there have been signs for some years that
this picture is changing. More specialist craft courses have closed (for
reasons including cost, lack of demand, lack of space, and health and
safety issues) than have opened, while there has been a notable rise in
the number of interdisciplinary courses incorporating a craft element.
Fees are set to rise for university students in England and there is some
early (if incomplete) evidence that numbers applying for art and design
courses are falling as a result (though this follows a surge in 2010). What
do such changes imply for the structure of the craft sector? Will other
routes into the profession – apprenticeships, or working with more
experienced makers – revive, or will interdisciplinary courses and other
degree paths increase in prominence?
• What effect will budget cuts in the arts and cultural sector have?
Craft, like many of the creative industries, has a mixed private-
sector/public-sector economy. As part of the wider effort to restrain
public spending, cuts have been announced to the budget of the DCMS
(in England) and the departments of the devolved governments (in
Scotland, Wales and Northern Ireland) which cover the arts. Local
authorities too are reducing their spending on arts and culture. What will
be the implications for craft, both of the likely reduction in direct
spending on craft (through the purchase and commissioning of craft
work by public collections) and in the arts support infrastructure on
which a sizeable number of craft professionals draw? What about other
commissioning areas where some makers were starting to sell their
services, such as healthcare?
• Can craft respond to the growing concerns over environmental
and ethical issues?
Craft would seem, on the face of it, to be well-placed to benefit from
these wider shifts in the culture. Craft-making is often imagined as a
small-scale, ‘authentic’ form of production, rooted in natural materials,
and it is true that many makers have already responded to environment
and ethical concerns. However, some of the most significant craft
disciplines, such as ceramics and glass, use methods (firing, glazing)
that are not environmentally friendly but which cannot readily be
replaced in current practice.
Can makers, given their often limited financial resources, find ways to
mitigate the potential damage such practices cause?
48
Craft in an Age of Change
www.bop.co.uk
Closing thoughts
These questions and issues suggest contemporary craft may be facing a
period of unusual turbulence: there have rarely been so many challenges
on so many fronts simultaneously. However, craft has a range of factors
in its favour. It uses modern thinking and technology to build on skills,
knowledge and experience that have been tested over time, and speaks
to deep-seated human instincts: the value of distinctiveness, a pride in
quality and the worth of craftsmanship. Whatever changes may be
coming, the history of the sector suggests that craft professionals will
find ways to re-think and re-invent their practice to adapt to a changing
world, and to allow craft to flourish.
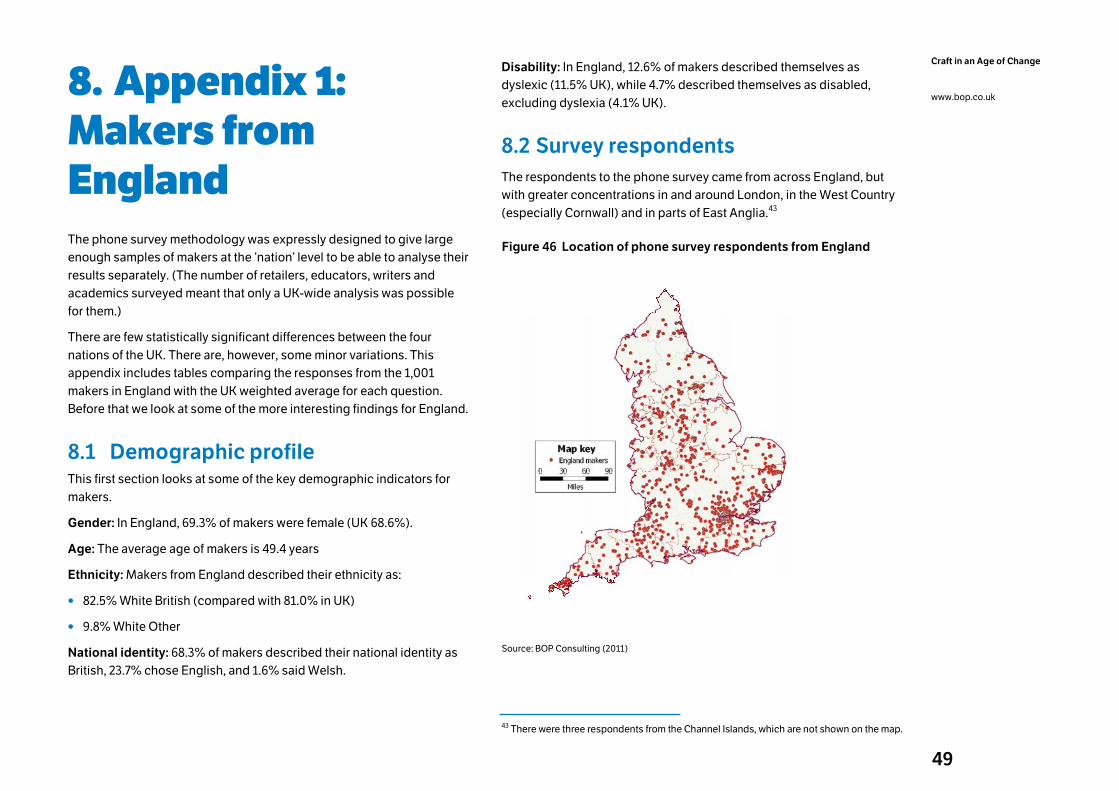
49
Craft in an Age of Change
www.bop.co.uk 8. Appendix 1: Makers from England The phone survey methodology was expressly designed to give large
enough samples of makers at the ‘nation’ level to be able to analyse their
results separately. (The number of retailers, educators, writers and
academics surveyed meant that only a UK-wide analysis was possible
for them.)
There are few statistically significant differences between the four
nations of the UK. There are, however, some minor variations. This
appendix includes tables comparing the responses from the 1,001
makers in England with the UK weighted average for each question.
Before that we look at some of the more interesting findings for England.
8.1 Demographic profile This first section looks at some of the key demographic indicators for
makers.
Gender: In England, 69.3% of makers were female (UK 68.6%).
Age: The average age of makers is 49.4 years
Ethnicity: Makers from England described their ethnicity as:
• 82.5% White British (compared with 81.0% in UK)
• 9.8% White Other
National identity: 68.3% of makers described their national identity as
British, 23.7% chose English, and 1.6% said Welsh.
Disability: In England, 12.6% of makers described themselves as
dyslexic (11.5% UK), while 4.7% described themselves as disabled,
excluding dyslexia (4.1% UK).
8.2 Survey respondents
The respondents to the phone survey came from across England, but
with greater concentrations in and around London, in the West Country
(especially Cornwall) and in parts of East Anglia.43
Figure 46 Location of phone survey respondents from England
Source: BOP Consulting (2011)
43 There were three respondents from the Channel Islands, which are not shown on the map.
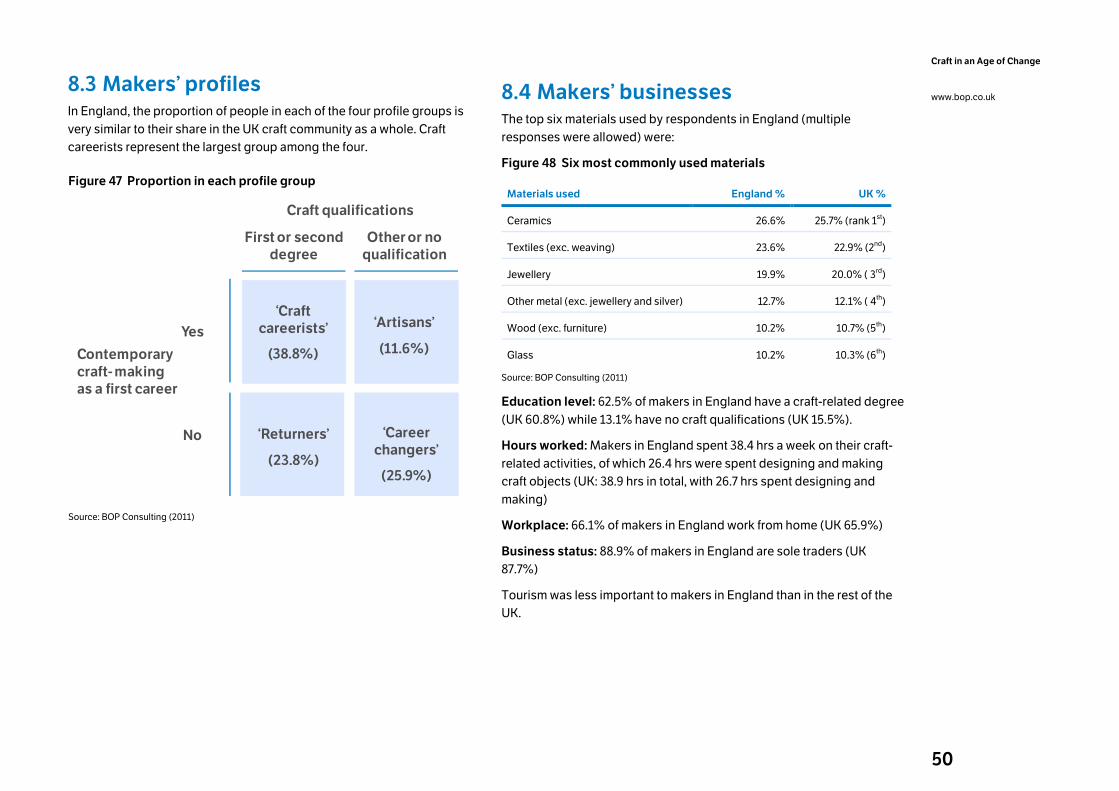
50
Craft in an Age of Change
www.bop.co.uk 8.3 Makers’ profiles In England, the proportion of people in each of the four profile groups is
very similar to their share in the UK craft community as a whole. Craft
careerists represent the largest group among the four.
Figure 47 Proportion in each profile group
Craft qualifications
First or second
degree
Other or no
qualification
Contemporary
craft-making
as a first career
Yes
No
‘Craft
careerists’
(38.8%)
‘Artisans’
(11.6%)
‘Returners’
(23.8%)
‘Career
changers’
(25.9%)
Source: BOP Consulting (2011)
8.4 Makers’ businesses The top six materials used by respondents in England (multiple
responses were allowed) were:
Figure 48 Six most commonly used materials
Materials used England % UK %
Ceramics 26.6% 25.7% (rank 1st)
Textiles (exc. weaving) 23.6% 22.9% (2nd)
Jewellery 19.9% 20.0% ( 3rd)
Other metal (exc. jewellery and silver) 12.7% 12.1% ( 4th)
Wood (exc. furniture) 10.2% 10.7% (5th)
Glass 10.2% 10.3% (6th)
Source: BOP Consulting (2011)
Education level: 62.5% of makers in England have a craft-related degree
(UK 60.8%) while 13.1% have no craft qualifications (UK 15.5%).
Hours worked: Makers in England spent 38.4 hrs a week on their craft-
related activities, of which 26.4 hrs were spent designing and making
craft objects (UK: 38.9 hrs in total, with 26.7 hrs spent designing and
making)
Workplace: 66.1% of makers in England work from home (UK 65.9%)
Business status: 88.9% of makers in England are sole traders (UK
87.7%)
Tourism was less important to makers in England than in the rest of the
UK.
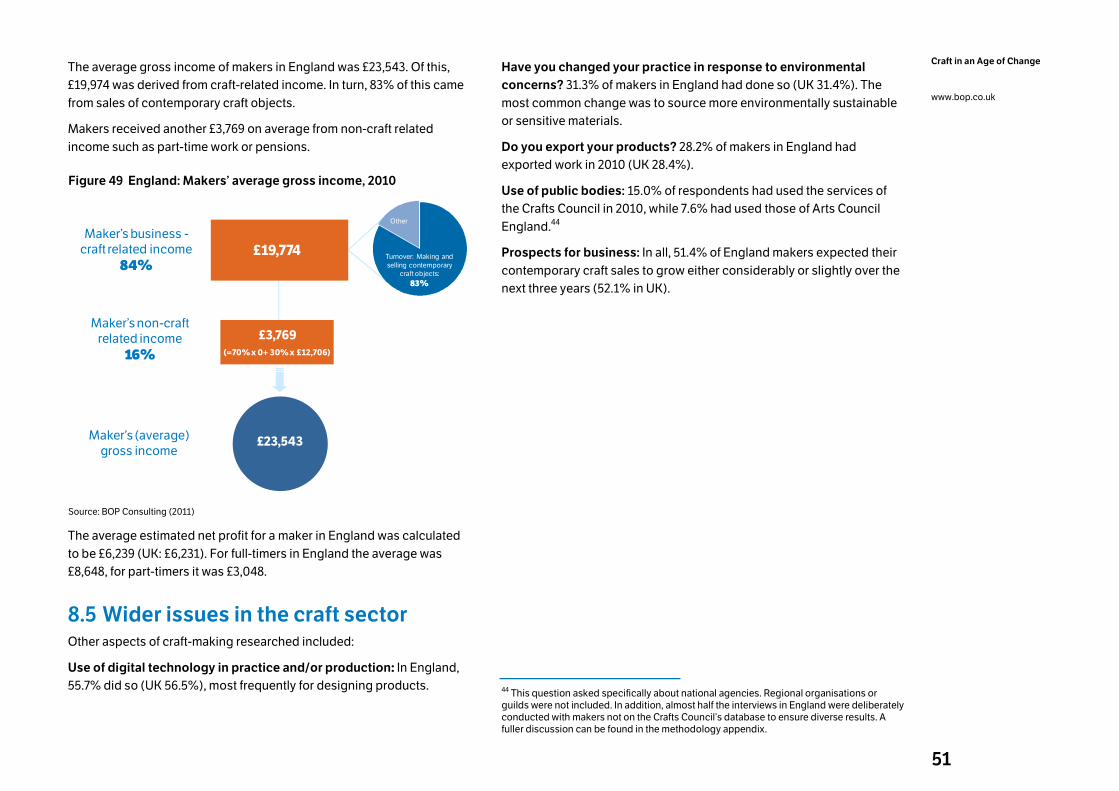
51
Craft in an Age of Change
www.bop.co.uk
The average gross income of makers in England was £23,543. Of this,
£19,974 was derived from craft-related income. In turn, 83% of this came
from sales of contemporary craft objects.
Makers received another £3,769 on average from non-craft related
income such as part-time work or pensions.
Figure 49 England: Makers’ average gross income, 2010
£23,543
Maker’s business -craft related income
84%
Maker’s non-craft related income
16%
£19,774
£3,769
(=70% x 0+ 30% x £12,706)
Turnover: Making and
selling contemporary craft objects:
83%
Other
Maker’s (average) gross income
Source: BOP Consulting (2011)
The average estimated net profit for a maker in England was calculated
to be £6,239 (UK: £6,231). For full-timers in England the average was
£8,648, for part-timers it was £3,048.
8.5 Wider issues in the craft sector Other aspects of craft-making researched included:
Use of digital technology in practice and/or production: In England,
55.7% did so (UK 56.5%), most frequently for designing products.
Have you changed your practice in response to environmental
concerns? 31.3% of makers in England had done so (UK 31.4%). The
most common change was to source more environmentally sustainable
or sensitive materials.
Do you export your products? 28.2% of makers in England had
exported work in 2010 (UK 28.4%).
Use of public bodies: 15.0% of respondents had used the services of
the Crafts Council in 2010, while 7.6% had used those of Arts Council
England.44
Prospects for business: In all, 51.4% of England makers expected their
contemporary craft sales to grow either considerably or slightly over the
next three years (52.1% in UK).
44 This question asked specifically about national agencies. Regional organisations or guilds were not included. In addition, almost half the interviews in England were deliberately conducted with makers not on the Crafts Council’s database to ensure diverse results. A fuller discussion can be found in the methodology appendix.
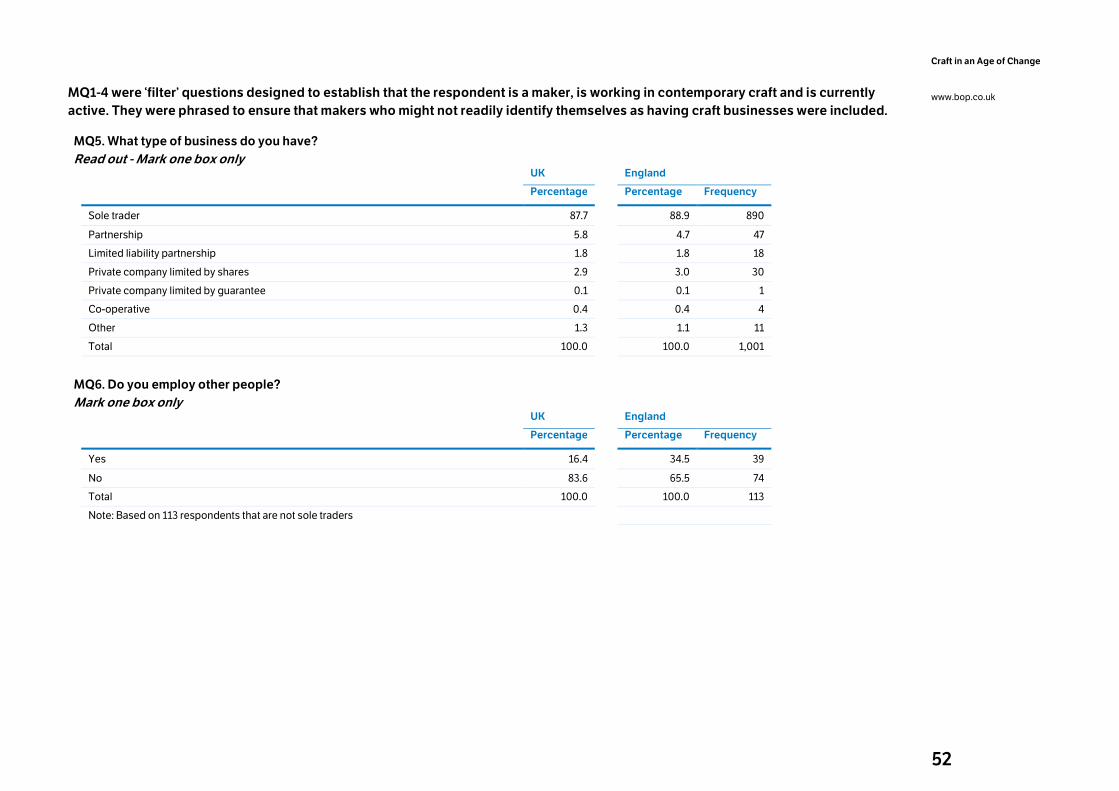
52
Craft in an Age of Change
www.bop.co.uk MQ1-4 were ‘filter’ questions designed to establish that the respondent is a maker, is working in contemporary craft and is currently
active. They were phrased to ensure that makers who might not readily identify themselves as having craft businesses were included.
MQ5. What type of business do you have?
Read out - Mark one box only
UK England
Percentage Percentage Frequency
Sole trader 87.7 88.9 890
Partnership 5.8 4.7 47
Limited liability partnership 1.8 1.8 18
Private company limited by shares 2.9 3.0 30
Private company limited by guarantee 0.1 0.1 1
Co-operative 0.4 0.4 4
Other 1.3 1.1 11
Total 100.0 100.0 1,001
MQ6. Do you employ other people?
Mark one box only
UK England
Percentage Percentage Frequency
Yes 16.4 34.5 39
No 83.6 65.5 74
Total 100.0 100.0 113
Note: Based on 113 respondents that are not sole traders
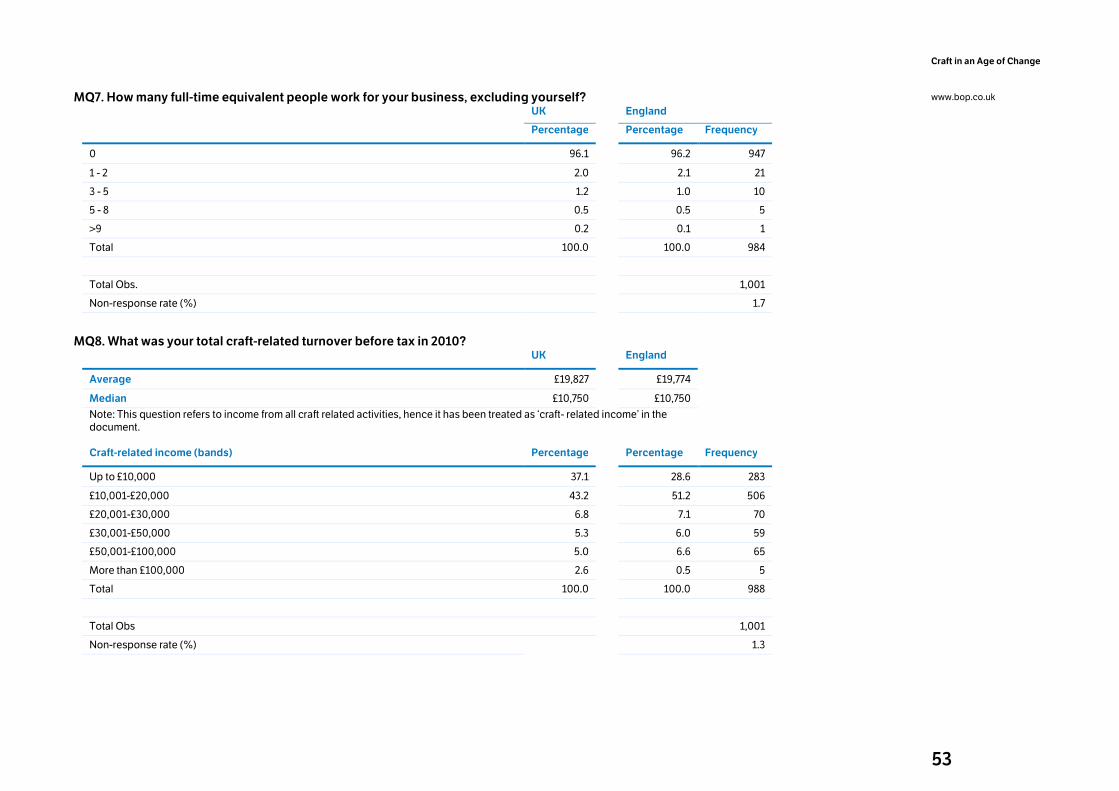
53
Craft in an Age of Change
www.bop.co.uk
MQ7. How many full-time equivalent people work for your business, excluding yourself?
UK
England
Percentage Percentage Frequency
0 96.1 96.2 947
1 - 2 2.0 2.1 21
3 - 5 1.2 1.0 10
5 - 8 0.5 0.5 5
>9 0.2 0.1 1
Total 100.0 100.0 984
Total Obs. 1,001
Non-response rate (%) 1.7
MQ8. What was your total craft-related turnover before tax in 2010?
UK England
Average £19,827 £19,774
Median £10,750 £10,750
Note: This question refers to income from all craft related activities, hence it has been treated as ‘craft- related income’ in the document.
Craft-related income (bands) Percentage Percentage Frequency
Up to £10,000 37.1 28.6 283
£10,001-£20,000 43.2 51.2 506
£20,001-£30,000 6.8 7.1 70
£30,001-£50,000 5.3 6.0 59
£50,001-£100,000 5.0 6.6 65
More than £100,000 2.6 0.5 5
Total 100.0 100.0 988
Total Obs 1,001
Non-response rate (%) 1.3
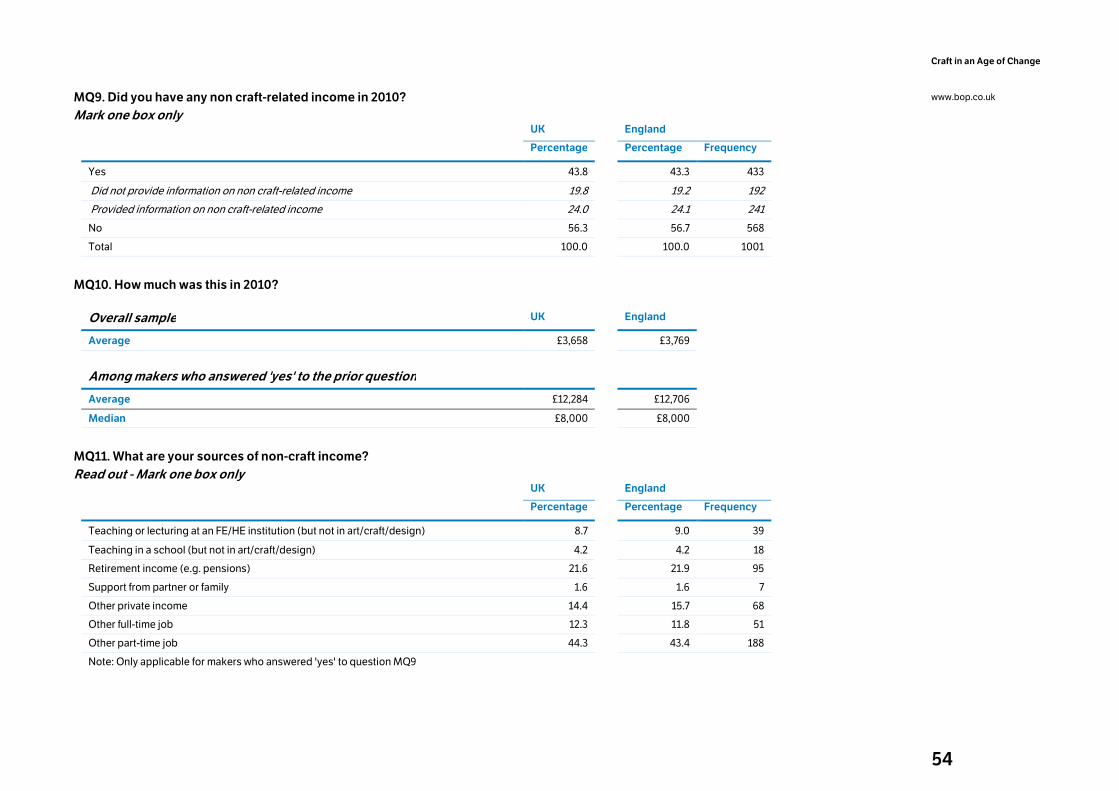
54
Craft in an Age of Change
www.bop.co.uk
MQ9. Did you have any non craft-related income in 2010?
Mark one box only
UK England
Percentage Percentage Frequency
Yes 43.8 43.3 433
Did not provide information on non craft-related income 19.8 19.2 192
Provided information on non craft-related income 24.0 24.1 241
No 56.3 56.7 568
Total 100.0 100.0 1001
MQ10. How much was this in 2010?
Overall sample UK England
Average £3,658 £3,769
Among makers who answered 'yes' to the prior question
Average £12,284 £12,706
Median £8,000 £8,000
MQ11. What are your sources of non-craft income?
Read out - Mark one box only
UK England
Percentage Percentage Frequency
Teaching or lecturing at an FE/HE institution (but not in art/craft/design) 8.7 9.0 39
Teaching in a school (but not in art/craft/design) 4.2 4.2 18
Retirement income (e.g. pensions) 21.6 21.9 95
Support from partner or family 1.6 1.6 7
Other private income 14.4 15.7 68
Other full-time job 12.3 11.8 51
Other part-time job 44.3 43.4 188
Note: Only applicable for makers who answered 'yes' to question MQ9
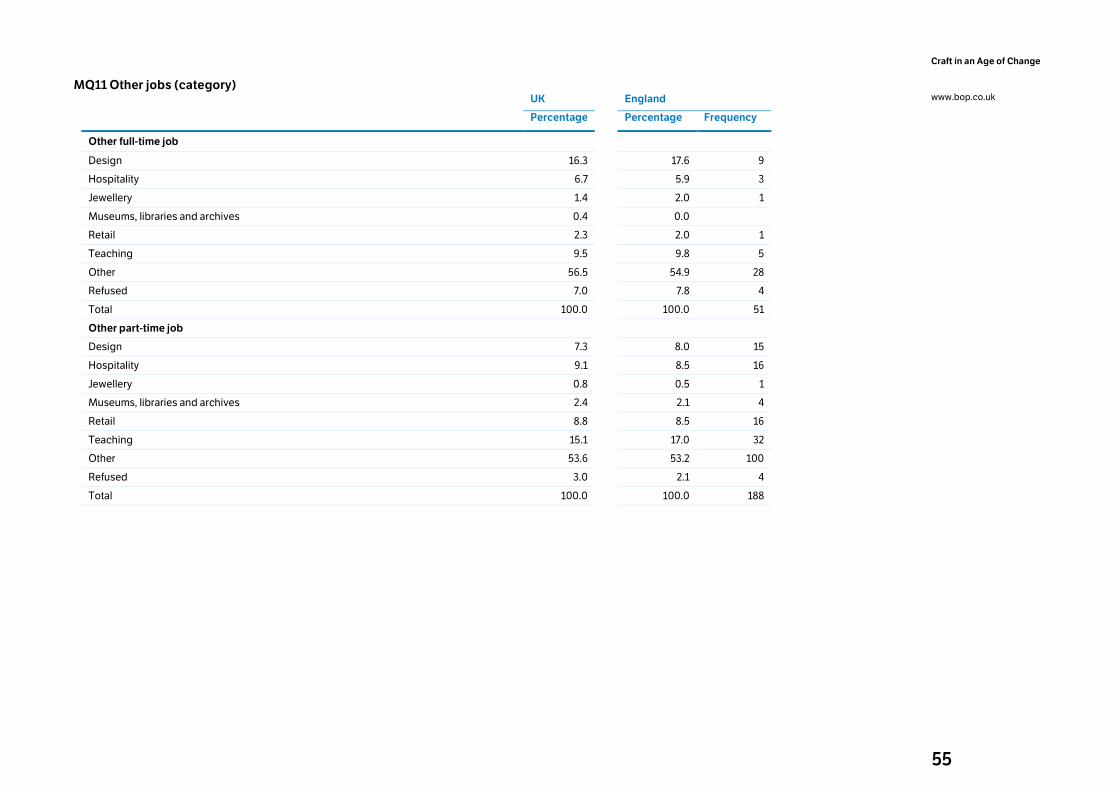
55
Craft in an Age of Change
www.bop.co.uk
MQ11 Other jobs (category)
UK England
Percentage Percentage Frequency
Other full-time job
Design 16.3 17.6 9
Hospitality 6.7 5.9 3
Jewellery 1.4 2.0 1
Museums, libraries and archives 0.4 0.0
Retail 2.3 2.0 1
Teaching 9.5 9.8 5
Other 56.5 54.9 28
Refused 7.0 7.8 4
Total 100.0 100.0 51
Other part-time job
Design 7.3 8.0 15
Hospitality 9.1 8.5 16
Jewellery 0.8 0.5 1
Museums, libraries and archives 2.4 2.1 4
Retail 8.8 8.5 16
Teaching 15.1 17.0 32
Other 53.6 53.2 100
Refused 3.0 2.1 4
Total 100.0 100.0 188
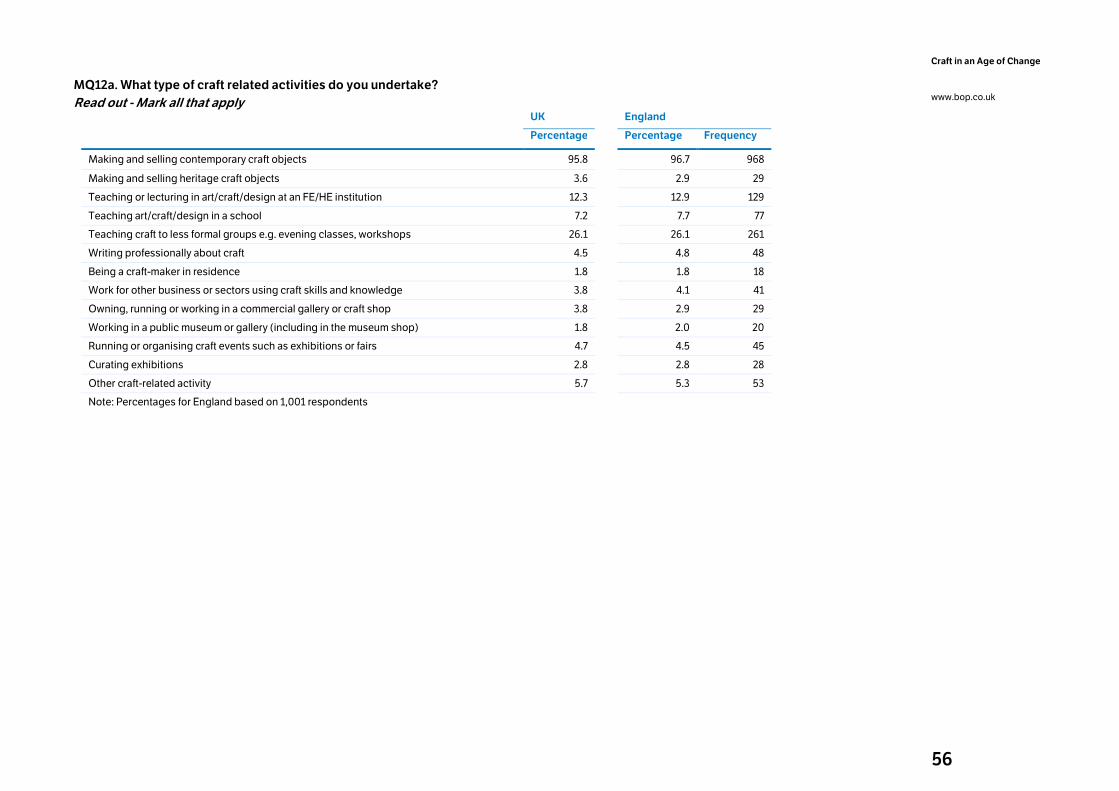
56
Craft in an Age of Change
www.bop.co.uk
MQ12a. What type of craft related activities do you undertake?
Read out - Mark all that apply
UK
England
Percentage Percentage Frequency
Making and selling contemporary craft objects 95.8 96.7 968
Making and selling heritage craft objects 3.6 2.9 29
Teaching or lecturing in art/craft/design at an FE/HE institution 12.3 12.9 129
Teaching art/craft/design in a school 7.2 7.7 77
Teaching craft to less formal groups e.g. evening classes, workshops 26.1 26.1 261
Writing professionally about craft 4.5 4.8 48
Being a craft-maker in residence 1.8 1.8 18
Work for other business or sectors using craft skills and knowledge 3.8 4.1 41
Owning, running or working in a commercial gallery or craft shop 3.8 2.9 29
Working in a public museum or gallery (including in the museum shop) 1.8 2.0 20
Running or organising craft events such as exhibitions or fairs 4.7 4.5 45
Curating exhibitions 2.8 2.8 28
Other craft-related activity 5.7 5.3 53
Note: Percentages for England based on 1,001 respondents
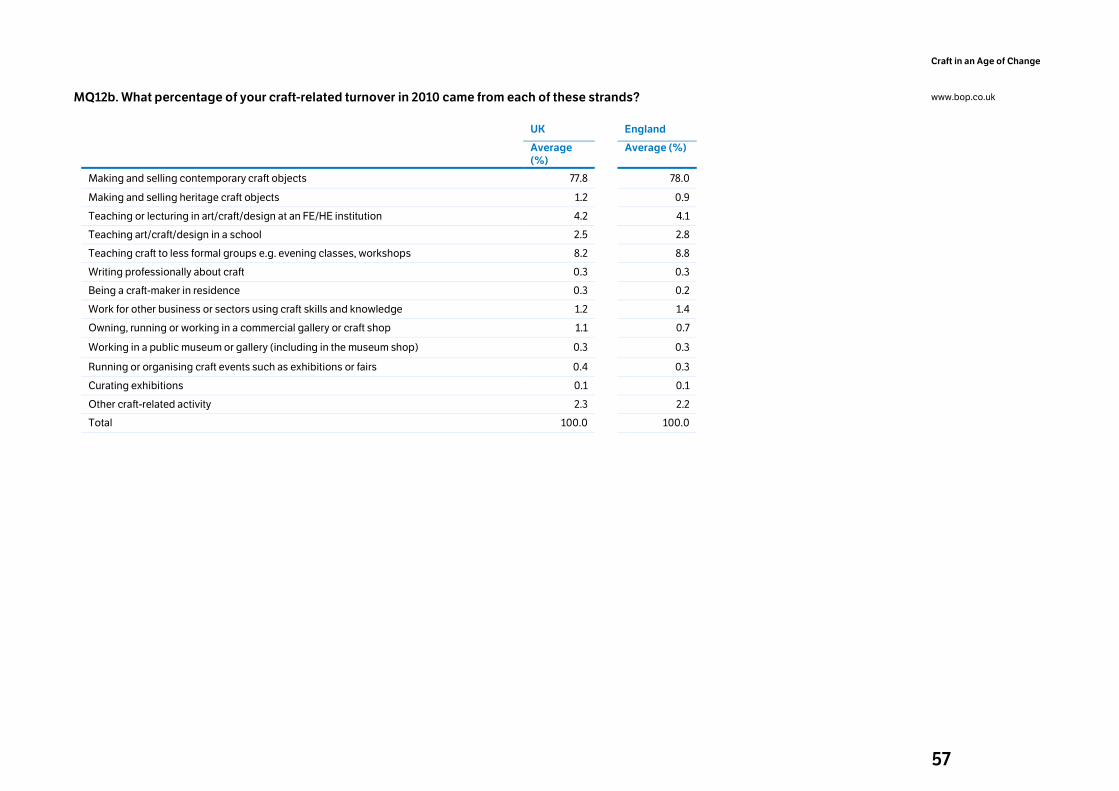
57
Craft in an Age of Change
www.bop.co.uk
MQ12b. What percentage of your craft-related turnover in 2010 came from each of these strands?
UK England
Average
(%) Average (%)
Making and selling contemporary craft objects 77.8 78.0
Making and selling heritage craft objects 1.2 0.9
Teaching or lecturing in art/craft/design at an FE/HE institution 4.2 4.1
Teaching art/craft/design in a school 2.5 2.8
Teaching craft to less formal groups e.g. evening classes, workshops 8.2 8.8
Writing professionally about craft 0.3 0.3
Being a craft-maker in residence 0.3 0.2
Work for other business or sectors using craft skills and knowledge 1.2 1.4
Owning, running or working in a commercial gallery or craft shop 1.1 0.7
Working in a public museum or gallery (including in the museum shop) 0.3 0.3
Running or organising craft events such as exhibitions or fairs 0.4 0.3
Curating exhibitions 0.1 0.1
Other craft-related activity 2.3 2.2
Total 100.0 100.0
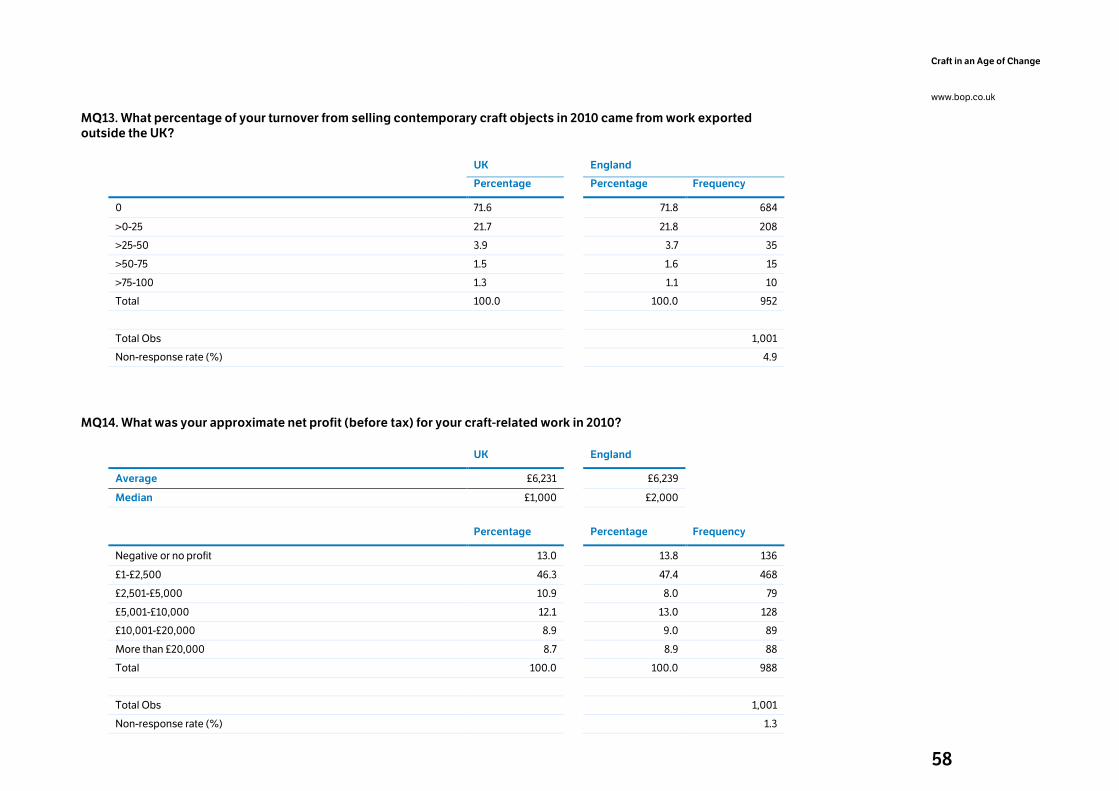
58
Craft in an Age of Change
www.bop.co.uk
MQ13. What percentage of your turnover from selling contemporary craft objects in 2010 came from work exported
outside the UK?
UK England
Percentage Percentage Frequency
0 71.6 71.8 684
>0-25 21.7 21.8 208
>25-50 3.9 3.7 35
>50-75 1.5 1.6 15
>75-100 1.3 1.1 10
Total 100.0 100.0 952
Total Obs 1,001
Non-response rate (%) 4.9
MQ14. What was your approximate net profit (before tax) for your craft-related work in 2010?
UK England
Average £6,231 £6,239
Median £1,000 £2,000
Percentage Percentage Frequency
Negative or no profit 13.0 13.8 136
£1-£2,500 46.3 47.4 468
£2,501-£5,000 10.9 8.0 79
£5,001-£10,000 12.1 13.0 128
£10,001-£20,000 8.9 9.0 89
More than £20,000 8.7 8.9 88
Total 100.0 100.0 988
Total Obs 1,001
Non-response rate (%) 1.3
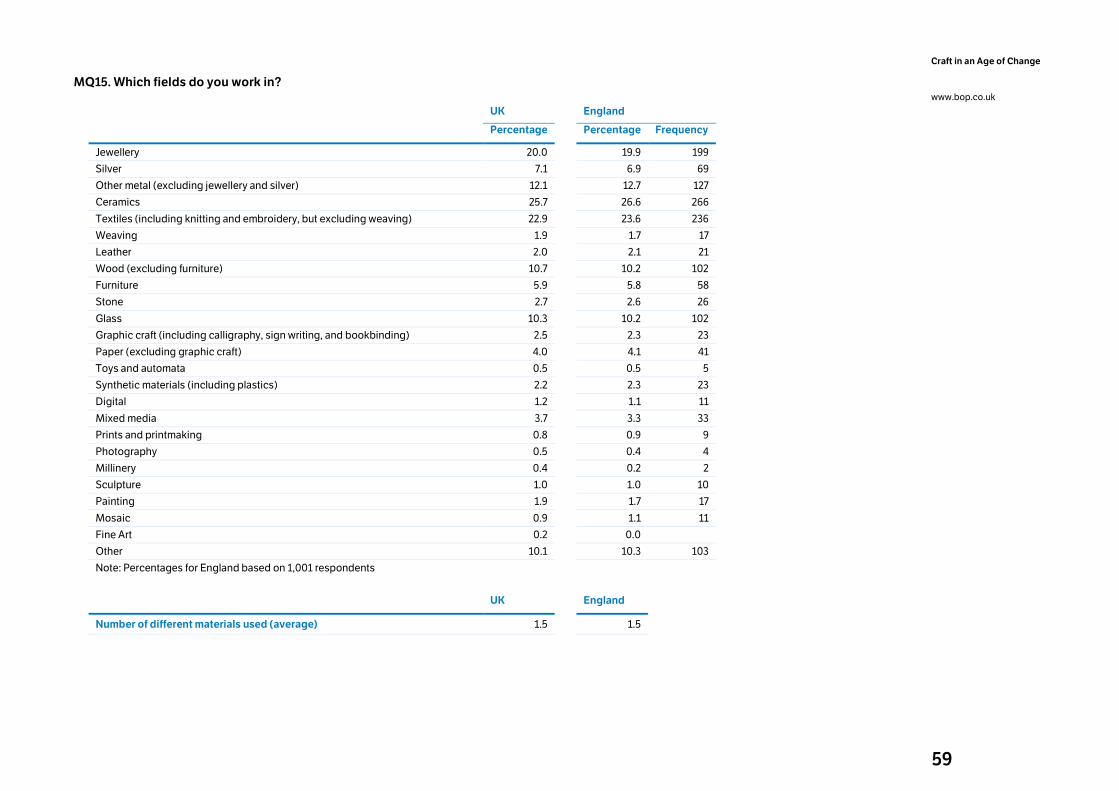
59
Craft in an Age of Change
www.bop.co.uk
MQ15. Which fields do you work in?
UK
England
Percentage Percentage Frequency
Jewellery 20.0 19.9 199
Silver 7.1 6.9 69
Other metal (excluding jewellery and silver) 12.1 12.7 127
Ceramics 25.7 26.6 266
Textiles (including knitting and embroidery, but excluding weaving) 22.9 23.6 236
Weaving 1.9 1.7 17
Leather 2.0 2.1 21
Wood (excluding furniture) 10.7 10.2 102
Furniture 5.9 5.8 58
Stone 2.7 2.6 26
Glass 10.3 10.2 102
Graphic craft (including calligraphy, sign writing, and bookbinding) 2.5 2.3 23
Paper (excluding graphic craft) 4.0 4.1 41
Toys and automata 0.5 0.5 5
Synthetic materials (including plastics) 2.2 2.3 23
Digital 1.2 1.1 11
Mixed media 3.7 3.3 33
Prints and printmaking 0.8 0.9 9
Photography 0.5 0.4 4
Millinery 0.4 0.2 2
Sculpture 1.0 1.0 10
Painting 1.9 1.7 17
Mosaic 0.9 1.1 11
Fine Art 0.2 0.0
Other 10.1 10.3 103
Note: Percentages for England based on 1,001 respondents
UK
England
Number of different materials used (average) 1.5 1.5
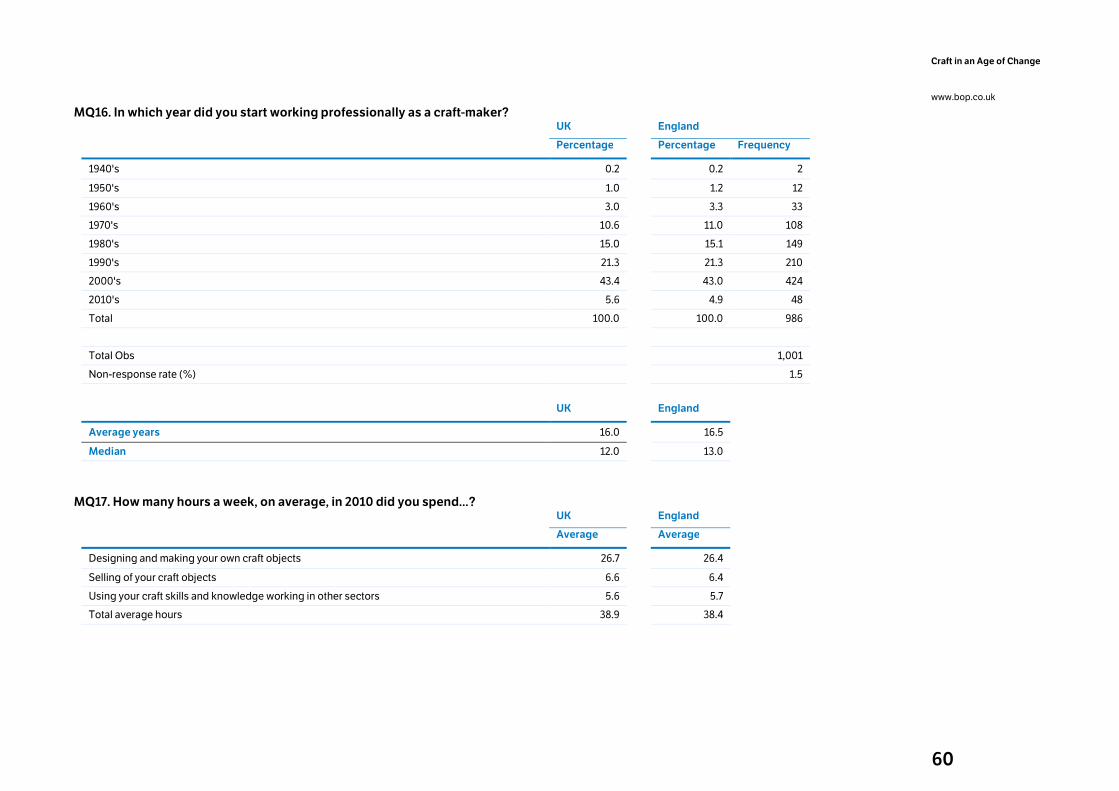
60
Craft in an Age of Change
www.bop.co.uk
MQ16. In which year did you start working professionally as a craft-maker?
UK
England
Percentage Percentage Frequency
1940's 0.2 0.2 2
1950's 1.0 1.2 12
1960's 3.0 3.3 33
1970's 10.6 11.0 108
1980's 15.0 15.1 149
1990's 21.3 21.3 210
2000's 43.4 43.0 424
2010's 5.6 4.9 48
Total 100.0 100.0 986
Total Obs 1,001
Non-response rate (%) 1.5
UK
England
Average years 16.0 16.5
Median 12.0 13.0
MQ17. How many hours a week, on average, in 2010 did you spend...?
UK
England
Average Average
Designing and making your own craft objects 26.7 26.4
Selling of your craft objects 6.6 6.4
Using your craft skills and knowledge working in other sectors 5.6 5.7
Total average hours 38.9 38.4
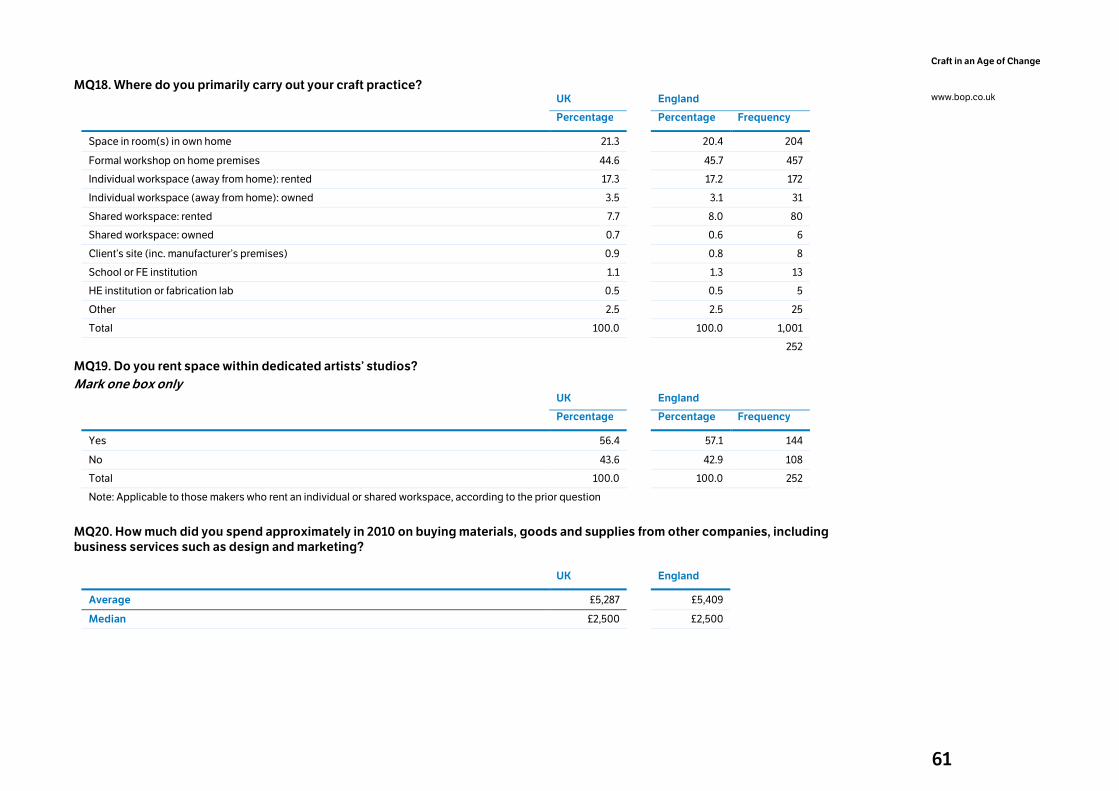
61
Craft in an Age of Change
www.bop.co.uk
MQ18. Where do you primarily carry out your craft practice?
UK England
Percentage Percentage Frequency
Space in room(s) in own home 21.3 20.4 204
Formal workshop on home premises 44.6 45.7 457
Individual workspace (away from home): rented 17.3 17.2 172
Individual workspace (away from home): owned 3.5 3.1 31
Shared workspace: rented 7.7 8.0 80
Shared workspace: owned 0.7 0.6 6
Client’s site (inc. manufacturer’s premises) 0.9 0.8 8
School or FE institution 1.1 1.3 13
HE institution or fabrication lab 0.5 0.5 5
Other 2.5 2.5 25
Total 100.0 100.0 1,001
252
MQ19. Do you rent space within dedicated artists’ studios?
Mark one box only
UK England
Percentage Percentage Frequency
Yes 56.4 57.1 144
No 43.6 42.9 108
Total 100.0 100.0 252
Note: Applicable to those makers who rent an individual or shared workspace, according to the prior question
MQ20. How much did you spend approximately in 2010 on buying materials, goods and supplies from other companies, including
business services such as design and marketing?
UK England
Average £5,287 £5,409
Median £2,500 £2,500
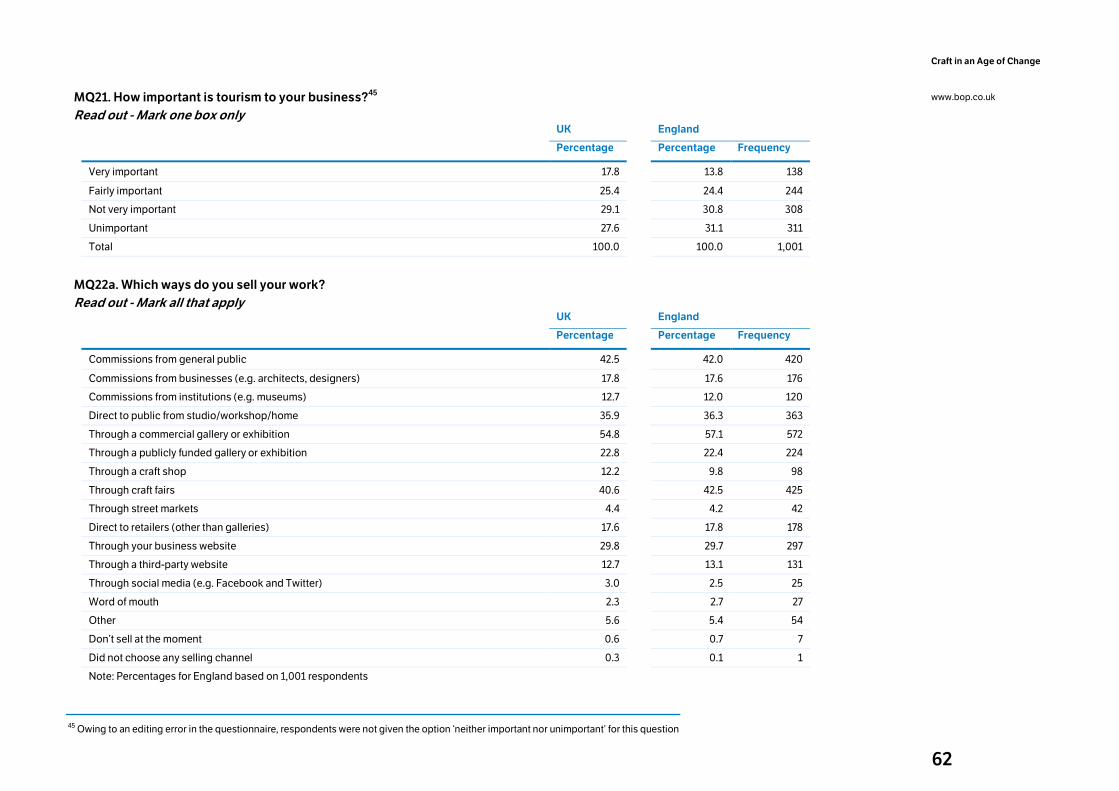
62
Craft in an Age of Change
www.bop.co.uk
MQ21. How important is tourism to your business?45
Read out - Mark one box only
UK England
Percentage Percentage Frequency
Very important 17.8 13.8 138
Fairly important 25.4 24.4 244
Not very important 29.1 30.8 308
Unimportant 27.6 31.1 311
Total 100.0 100.0 1,001
MQ22a. Which ways do you sell your work?
Read out - Mark all that apply
UK England
Percentage Percentage Frequency
Commissions from general public 42.5 42.0 420
Commissions from businesses (e.g. architects, designers) 17.8 17.6 176
Commissions from institutions (e.g. museums) 12.7 12.0 120
Direct to public from studio/workshop/home 35.9 36.3 363
Through a commercial gallery or exhibition 54.8 57.1 572
Through a publicly funded gallery or exhibition 22.8 22.4 224
Through a craft shop 12.2 9.8 98
Through craft fairs 40.6 42.5 425
Through street markets 4.4 4.2 42
Direct to retailers (other than galleries) 17.6 17.8 178
Through your business website 29.8 29.7 297
Through a third-party website 12.7 13.1 131
Through social media (e.g. Facebook and Twitter) 3.0 2.5 25
Word of mouth 2.3 2.7 27
Other 5.6 5.4 54
Don’t sell at the moment 0.6 0.7 7
Did not choose any selling channel 0.3 0.1 1
Note: Percentages for England based on 1,001 respondents
45 Owing to an editing error in the questionnaire, respondents were not given the option ‘neither important nor unimportant’ for this question
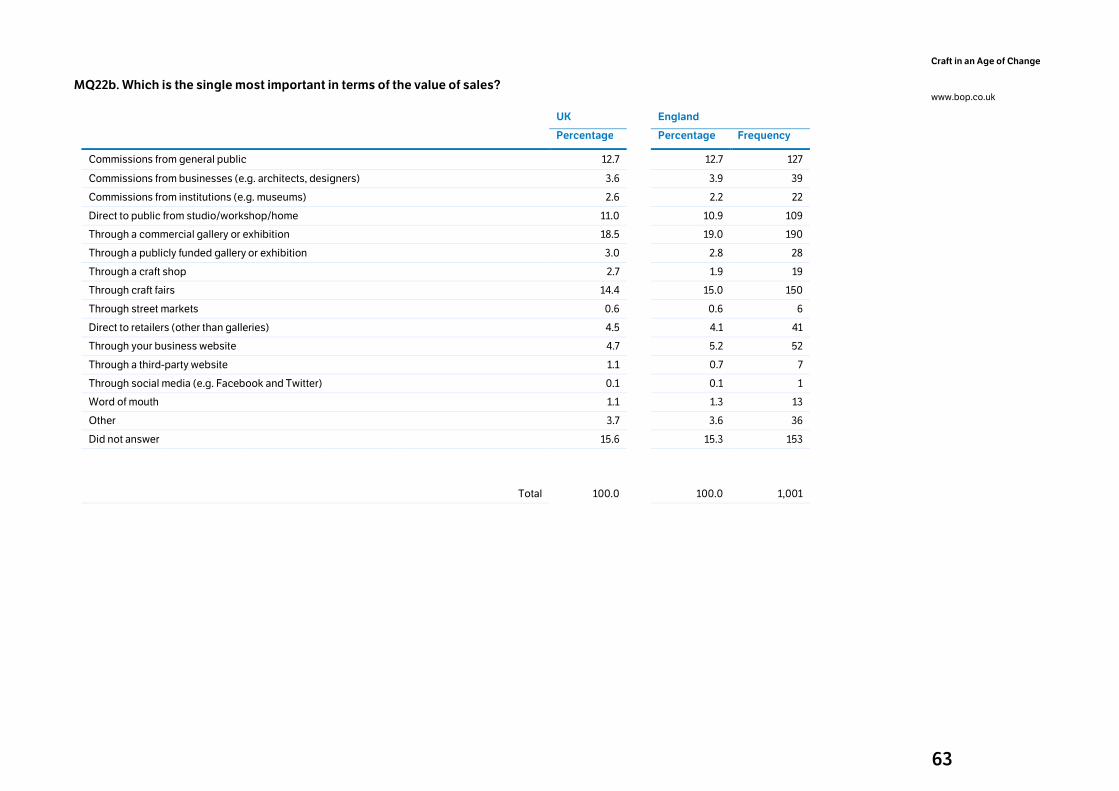
63
Craft in an Age of Change
www.bop.co.uk
MQ22b. Which is the single most important in terms of the value of sales?
UK
England
Percentage Percentage Frequency
Commissions from general public 12.7 12.7 127
Commissions from businesses (e.g. architects, designers) 3.6 3.9 39
Commissions from institutions (e.g. museums) 2.6 2.2 22
Direct to public from studio/workshop/home 11.0 10.9 109
Through a commercial gallery or exhibition 18.5 19.0 190
Through a publicly funded gallery or exhibition 3.0 2.8 28
Through a craft shop 2.7 1.9 19
Through craft fairs 14.4 15.0 150
Through street markets 0.6 0.6 6
Direct to retailers (other than galleries) 4.5 4.1 41
Through your business website 4.7 5.2 52
Through a third-party website 1.1 0.7 7
Through social media (e.g. Facebook and Twitter) 0.1 0.1 1
Word of mouth 1.1 1.3 13
Other 3.7 3.6 36
Did not answer 15.6 15.3 153
Total 100.0 100.0 1,001
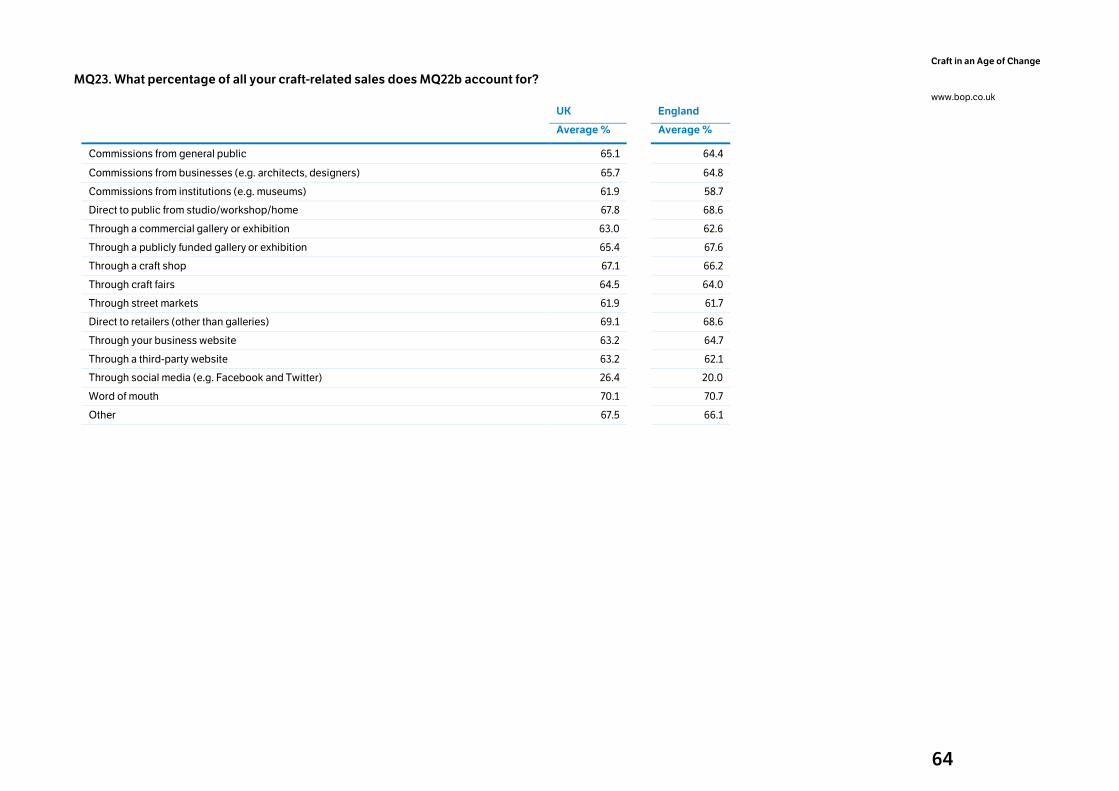
64
Craft in an Age of Change
www.bop.co.uk
MQ23. What percentage of all your craft-related sales does MQ22b account for?
UK
England
Average % Average %
Commissions from general public 65.1 64.4
Commissions from businesses (e.g. architects, designers) 65.7 64.8
Commissions from institutions (e.g. museums) 61.9 58.7
Direct to public from studio/workshop/home 67.8 68.6
Through a commercial gallery or exhibition 63.0 62.6
Through a publicly funded gallery or exhibition 65.4 67.6
Through a craft shop 67.1 66.2
Through craft fairs 64.5 64.0
Through street markets 61.9 61.7
Direct to retailers (other than galleries) 69.1 68.6
Through your business website 63.2 64.7
Through a third-party website 63.2 62.1
Through social media (e.g. Facebook and Twitter) 26.4 20.0
Word of mouth 70.1 70.7
Other 67.5 66.1
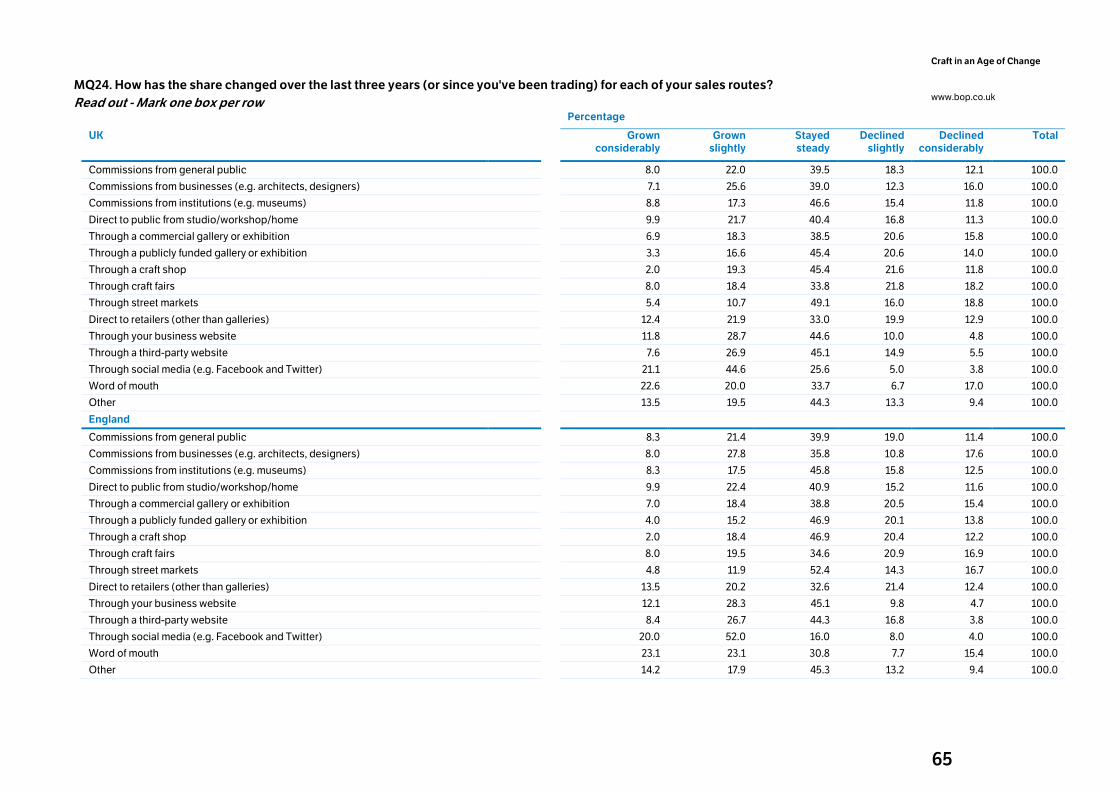
65
Craft in an Age of Change
www.bop.co.uk
MQ24. How has the share changed over the last three years (or since you've been trading) for each of your sales routes?
Read out - Mark one box per row
Percentage
UK Grown considerably
Grown slightly
Stayed steady
Declined slightly
Declined considerably
Total
Commissions from general public 8.0 22.0 39.5 18.3 12.1 100.0
Commissions from businesses (e.g. architects, designers) 7.1 25.6 39.0 12.3 16.0 100.0
Commissions from institutions (e.g. museums) 8.8 17.3 46.6 15.4 11.8 100.0
Direct to public from studio/workshop/home 9.9 21.7 40.4 16.8 11.3 100.0
Through a commercial gallery or exhibition 6.9 18.3 38.5 20.6 15.8 100.0
Through a publicly funded gallery or exhibition 3.3 16.6 45.4 20.6 14.0 100.0
Through a craft shop 2.0 19.3 45.4 21.6 11.8 100.0
Through craft fairs 8.0 18.4 33.8 21.8 18.2 100.0
Through street markets 5.4 10.7 49.1 16.0 18.8 100.0
Direct to retailers (other than galleries) 12.4 21.9 33.0 19.9 12.9 100.0
Through your business website 11.8 28.7 44.6 10.0 4.8 100.0
Through a third-party website 7.6 26.9 45.1 14.9 5.5 100.0
Through social media (e.g. Facebook and Twitter) 21.1 44.6 25.6 5.0 3.8 100.0
Word of mouth 22.6 20.0 33.7 6.7 17.0 100.0
Other 13.5 19.5 44.3 13.3 9.4 100.0
England
Commissions from general public 8.3 21.4 39.9 19.0 11.4 100.0
Commissions from businesses (e.g. architects, designers) 8.0 27.8 35.8 10.8 17.6 100.0
Commissions from institutions (e.g. museums) 8.3 17.5 45.8 15.8 12.5 100.0
Direct to public from studio/workshop/home 9.9 22.4 40.9 15.2 11.6 100.0
Through a commercial gallery or exhibition 7.0 18.4 38.8 20.5 15.4 100.0
Through a publicly funded gallery or exhibition 4.0 15.2 46.9 20.1 13.8 100.0
Through a craft shop 2.0 18.4 46.9 20.4 12.2 100.0
Through craft fairs 8.0 19.5 34.6 20.9 16.9 100.0
Through street markets 4.8 11.9 52.4 14.3 16.7 100.0
Direct to retailers (other than galleries) 13.5 20.2 32.6 21.4 12.4 100.0
Through your business website 12.1 28.3 45.1 9.8 4.7 100.0
Through a third-party website 8.4 26.7 44.3 16.8 3.8 100.0
Through social media (e.g. Facebook and Twitter) 20.0 52.0 16.0 8.0 4.0 100.0
Word of mouth 23.1 23.1 30.8 7.7 15.4 100.0
Other 14.2 17.9 45.3 13.2 9.4 100.0
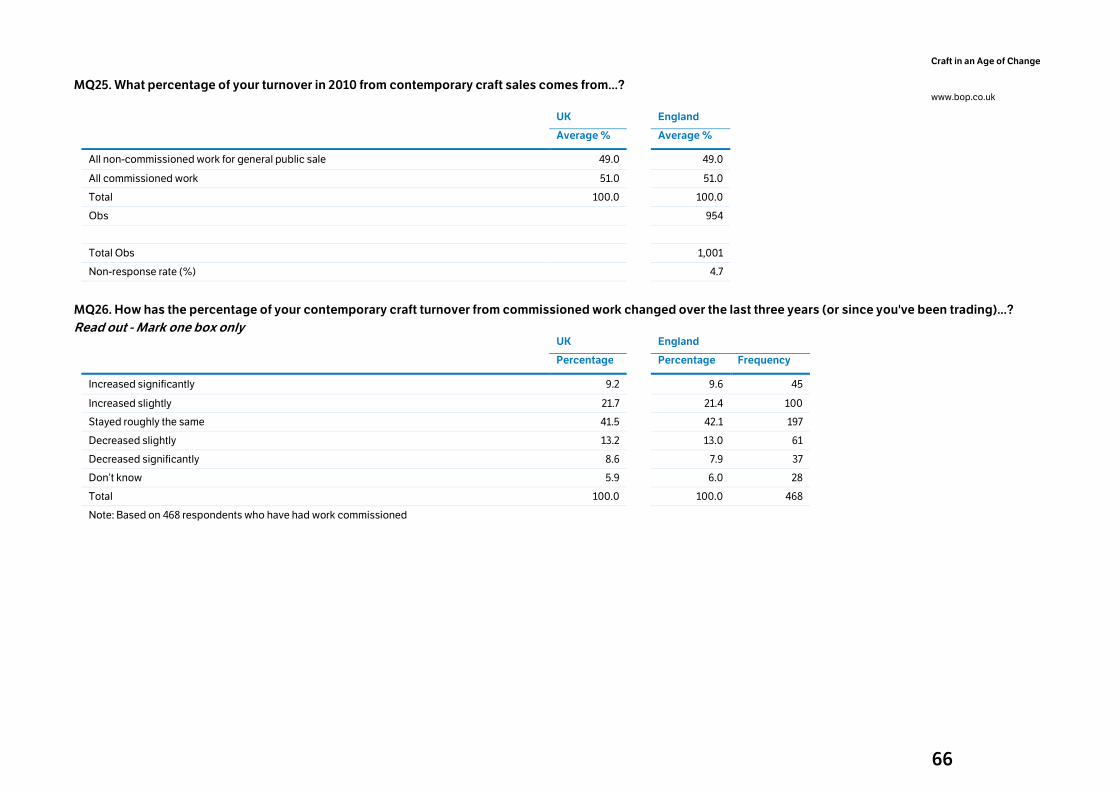
66
Craft in an Age of Change
www.bop.co.uk
MQ25. What percentage of your turnover in 2010 from contemporary craft sales comes from...?
UK
England
Average % Average %
All non-commissioned work for general public sale 49.0 49.0
All commissioned work 51.0 51.0
Total 100.0 100.0
Obs 954
Total Obs 1,001
Non-response rate (%) 4.7
MQ26. How has the percentage of your contemporary craft turnover from commissioned work changed over the last three years (or since you've been trading)...?
Read out - Mark one box only
UK
England
Percentage Percentage Frequency
Increased significantly 9.2 9.6 45
Increased slightly 21.7 21.4 100
Stayed roughly the same 41.5 42.1 197
Decreased slightly 13.2 13.0 61
Decreased significantly 8.6 7.9 37
Don’t know 5.9 6.0 28
Total 100.0 100.0 468
Note: Based on 468 respondents who have had work commissioned
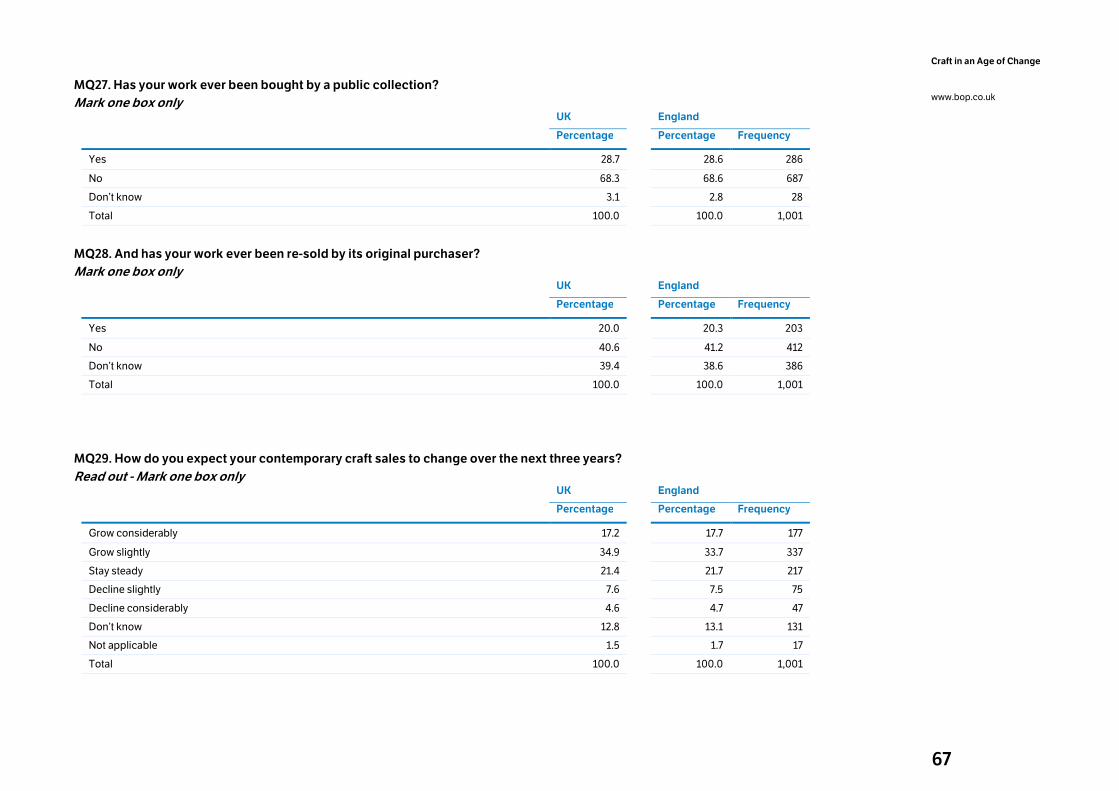
67
Craft in an Age of Change
www.bop.co.uk
MQ27. Has your work ever been bought by a public collection?
Mark one box only
UK
England
Percentage Percentage Frequency
Yes 28.7 28.6 286
No 68.3 68.6 687
Don’t know 3.1 2.8 28
Total 100.0 100.0 1,001
MQ28. And has your work ever been re-sold by its original purchaser?
Mark one box only
UK
England
Percentage Percentage Frequency
Yes 20.0 20.3 203
No 40.6 41.2 412
Don’t know 39.4 38.6 386
Total 100.0 100.0 1,001
MQ29. How do you expect your contemporary craft sales to change over the next three years?
Read out - Mark one box only
UK England
Percentage Percentage Frequency
Grow considerably 17.2 17.7 177
Grow slightly 34.9 33.7 337
Stay steady 21.4 21.7 217
Decline slightly 7.6 7.5 75
Decline considerably 4.6 4.7 47
Don’t know 12.8 13.1 131
Not applicable 1.5 1.7 17
Total 100.0 100.0 1,001
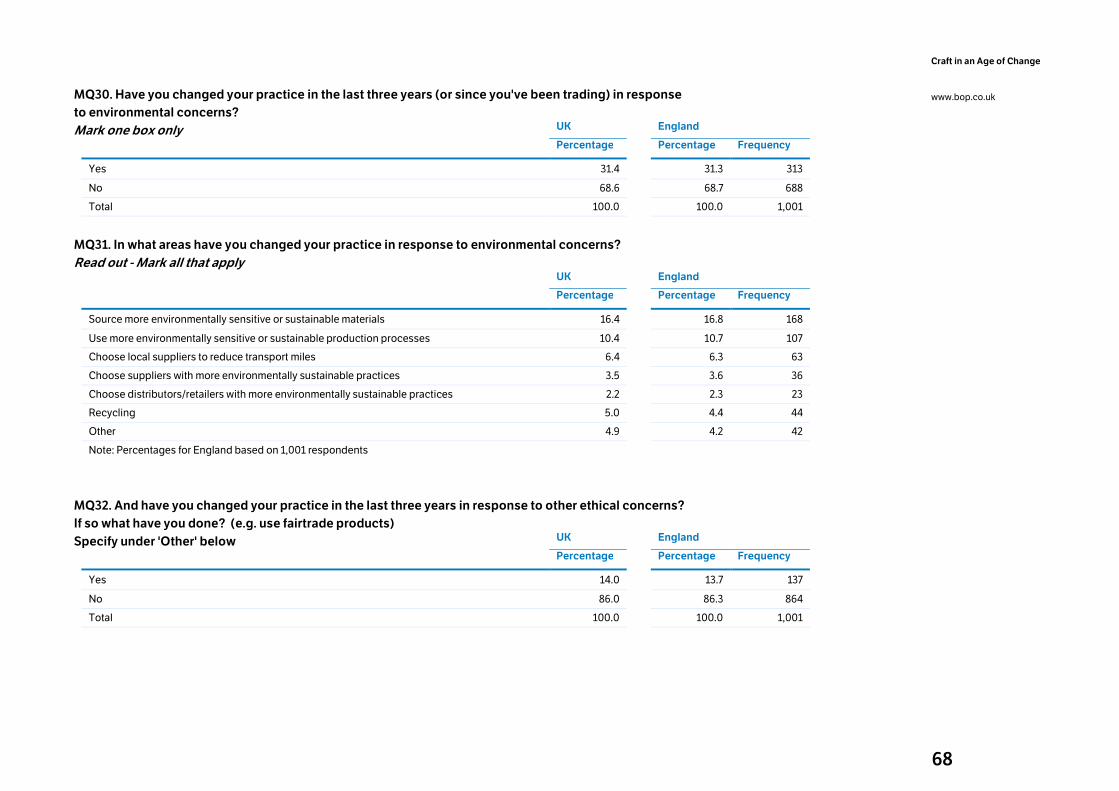
68
Craft in an Age of Change
www.bop.co.uk
MQ30. Have you changed your practice in the last three years (or since you've been trading) in response
to environmental concerns?
Mark one box only UK
England
Percentage Percentage Frequency
Yes 31.4 31.3 313
No 68.6 68.7 688
Total 100.0 100.0 1,001
MQ31. In what areas have you changed your practice in response to environmental concerns?
Read out - Mark all that apply
UK England
Percentage Percentage Frequency
Source more environmentally sensitive or sustainable materials 16.4 16.8 168
Use more environmentally sensitive or sustainable production processes 10.4 10.7 107
Choose local suppliers to reduce transport miles 6.4 6.3 63
Choose suppliers with more environmentally sustainable practices 3.5 3.6 36
Choose distributors/retailers with more environmentally sustainable practices 2.2 2.3 23
Recycling 5.0 4.4 44
Other 4.9 4.2 42
Note: Percentages for England based on 1,001 respondents
MQ32. And have you changed your practice in the last three years in response to other ethical concerns?
If so what have you done? (e.g. use fairtrade products)
Specify under 'Other' below UK
England
Percentage Percentage Frequency
Yes 14.0 13.7 137
No 86.0 86.3 864
Total 100.0 100.0 1,001
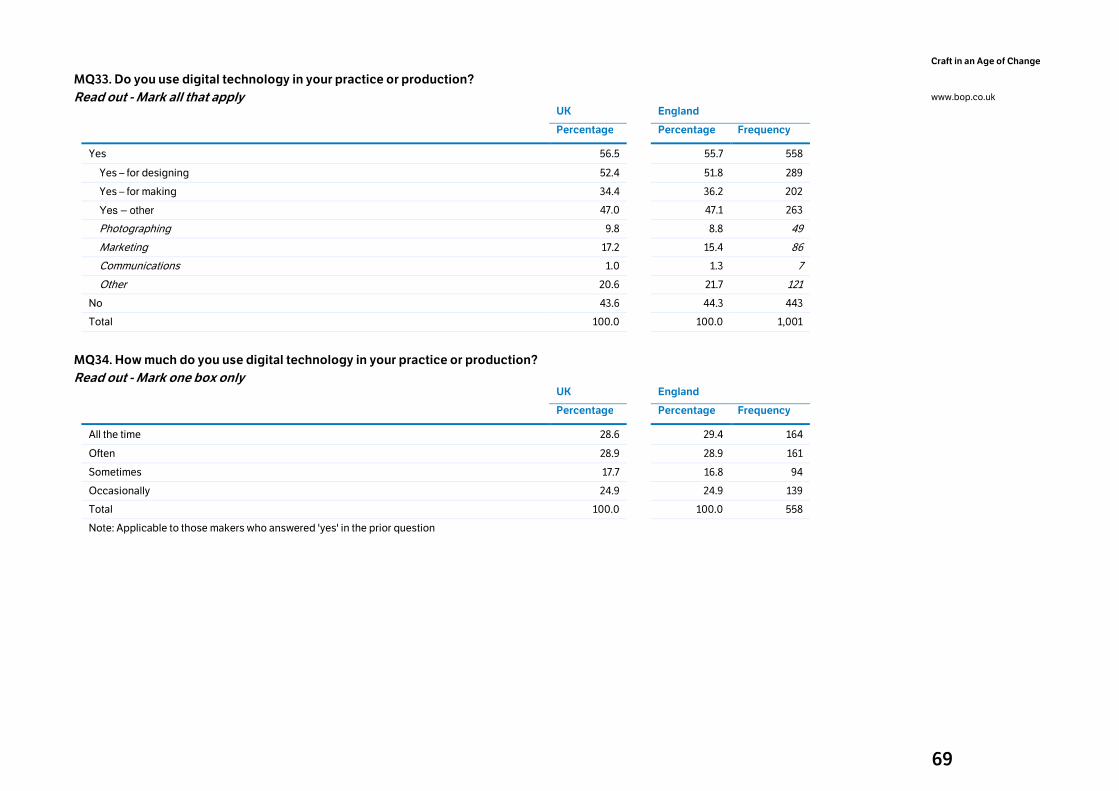
69
Craft in an Age of Change
www.bop.co.uk
MQ33. Do you use digital technology in your practice or production?
Read out - Mark all that apply
UK
England
Percentage Percentage Frequency
Yes 56.5 55.7 558
Yes – for designing 52.4 51.8 289
Yes – for making 34.4 36.2 202
Yes – other 47.0 47.1 263
Photographing 9.8 8.8 49
Marketing 17.2 15.4 86
Communications 1.0 1.3 7
Other 20.6 21.7 121
No 43.6 44.3 443
Total 100.0 100.0 1,001
MQ34. How much do you use digital technology in your practice or production?
Read out - Mark one box only
UK
England
Percentage Percentage Frequency
All the time 28.6 29.4 164
Often 28.9 28.9 161
Sometimes 17.7 16.8 94
Occasionally 24.9 24.9 139
Total 100.0 100.0 558
Note: Applicable to those makers who answered 'yes' in the prior question
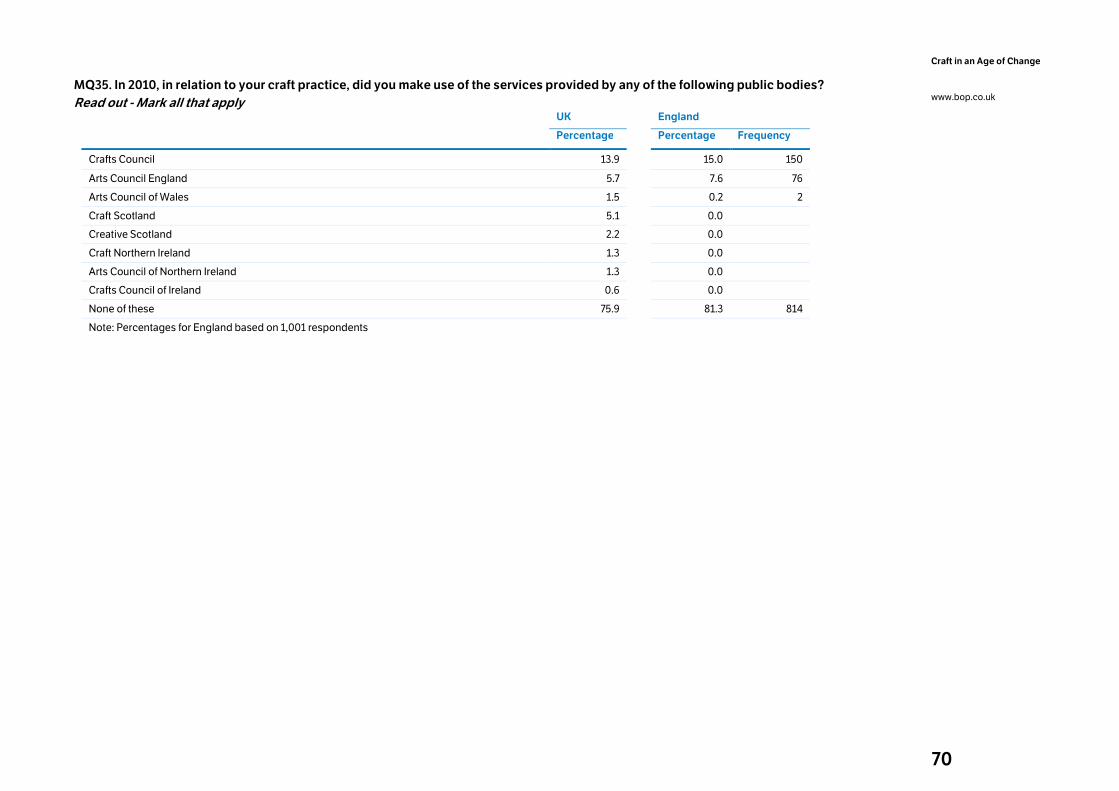
70
Craft in an Age of Change
www.bop.co.uk
MQ35. In 2010, in relation to your craft practice, did you make use of the services provided by any of the following public bodies?
Read out - Mark all that apply
UK
England
Percentage Percentage Frequency
Crafts Council 13.9 15.0 150
Arts Council England 5.7 7.6 76
Arts Council of Wales 1.5 0.2 2
Craft Scotland 5.1 0.0
Creative Scotland 2.2 0.0
Craft Northern Ireland 1.3 0.0
Arts Council of Northern Ireland 1.3 0.0
Crafts Council of Ireland 0.6 0.0
None of these 75.9 81.3 814
Note: Percentages for England based on 1,001 respondents
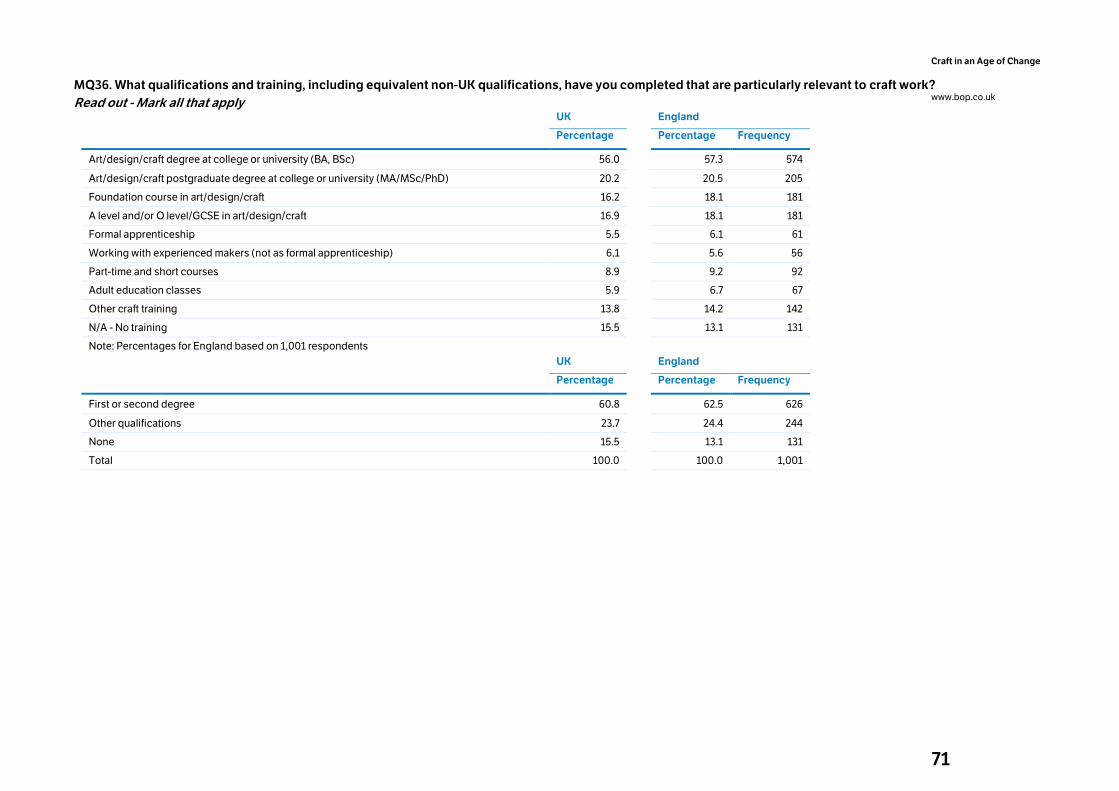
71
Craft in an Age of Change
www.bop.co.uk
MQ36. What qualifications and training, including equivalent non-UK qualifications, have you completed that are particularly relevant to craft work?
Read out - Mark all that apply
UK
England
Percentage Percentage Frequency
Art/design/craft degree at college or university (BA, BSc) 56.0 57.3 574
Art/design/craft postgraduate degree at college or university (MA/MSc/PhD) 20.2 20.5 205
Foundation course in art/design/craft 16.2 18.1 181
A level and/or O level/GCSE in art/design/craft 16.9 18.1 181
Formal apprenticeship 5.5 6.1 61
Working with experienced makers (not as formal apprenticeship) 6.1 5.6 56
Part-time and short courses 8.9 9.2 92
Adult education classes 5.9 6.7 67
Other craft training 13.8 14.2 142
N/A - No training 15.5 13.1 131
Note: Percentages for England based on 1,001 respondents
UK
England
Percentage Percentage Frequency
First or second degree 60.8 62.5 626
Other qualifications 23.7 24.4 244
None 15.5 13.1 131
Total 100.0 100.0 1,001
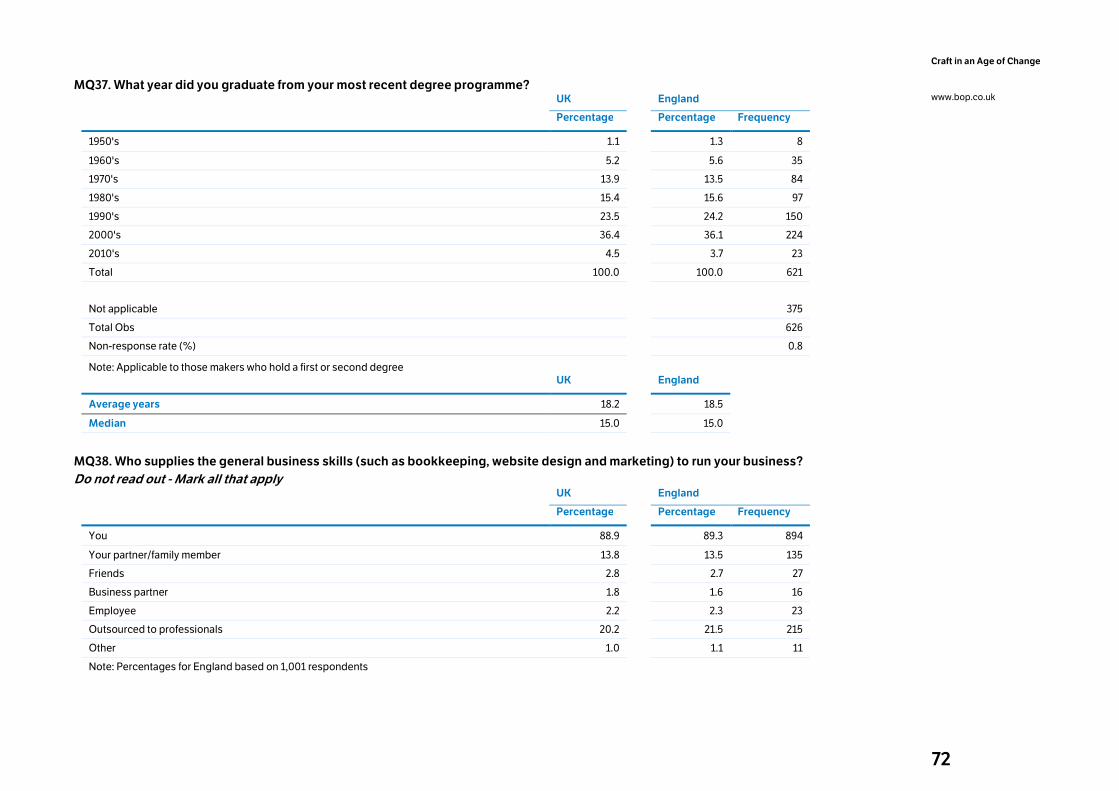
72
Craft in an Age of Change
www.bop.co.uk
MQ37. What year did you graduate from your most recent degree programme?
UK England
Percentage Percentage Frequency
1950's 1.1 1.3 8
1960's 5.2 5.6 35
1970's 13.9 13.5 84
1980's 15.4 15.6 97
1990's 23.5 24.2 150
2000's 36.4 36.1 224
2010's 4.5 3.7 23
Total 100.0 100.0 621
Not applicable 375
Total Obs 626
Non-response rate (%) 0.8
Note: Applicable to those makers who hold a first or second degree
UK
England
Average years 18.2 18.5
Median 15.0 15.0
MQ38. Who supplies the general business skills (such as bookkeeping, website design and marketing) to run your business?
Do not read out - Mark all that apply
UK
England
Percentage Percentage Frequency
You 88.9 89.3 894
Your partner/family member 13.8 13.5 135
Friends 2.8 2.7 27
Business partner 1.8 1.6 16
Employee 2.2 2.3 23
Outsourced to professionals 20.2 21.5 215
Other 1.0 1.1 11
Note: Percentages for England based on 1,001 respondents
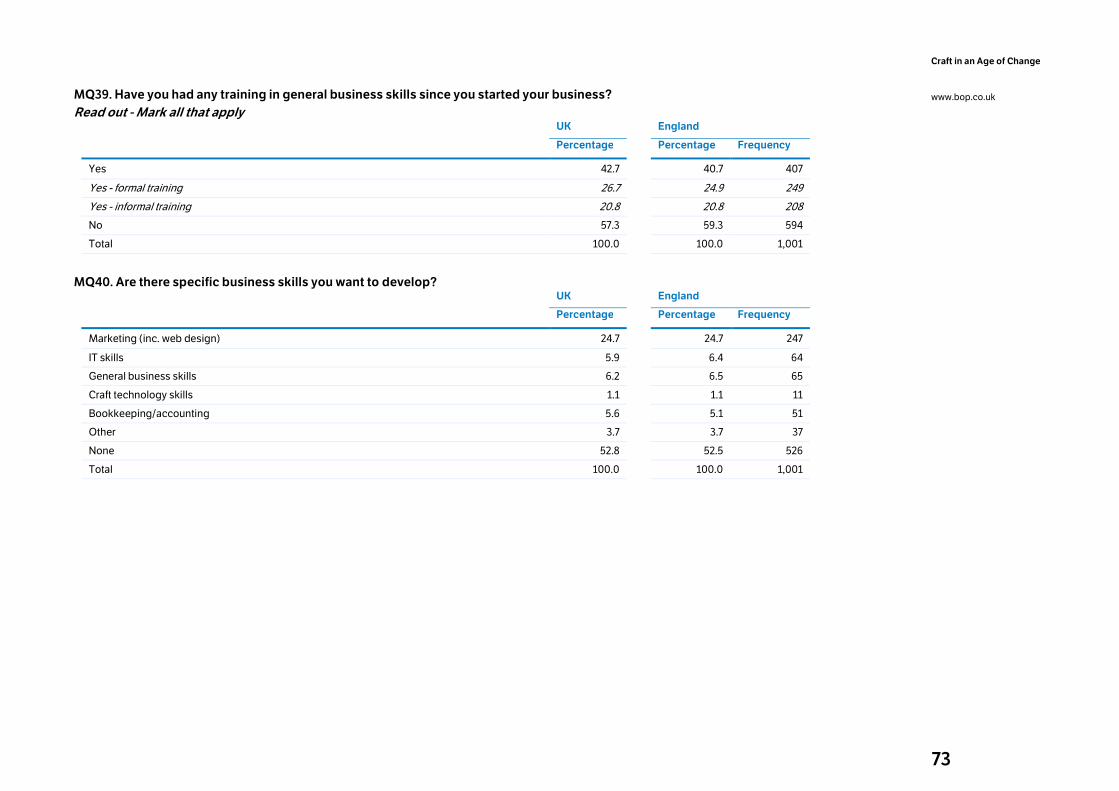
73
Craft in an Age of Change
www.bop.co.uk
MQ39. Have you had any training in general business skills since you started your business?
Read out - Mark all that apply
UK
England
Percentage Percentage Frequency
Yes 42.7 40.7 407
Yes - formal training 26.7 24.9 249
Yes - informal training 20.8 20.8 208
No 57.3 59.3 594
Total 100.0 100.0 1,001
MQ40. Are there specific business skills you want to develop?
UK England
Percentage Percentage Frequency
Marketing (inc. web design) 24.7 24.7 247
IT skills 5.9 6.4 64
General business skills 6.2 6.5 65
Craft technology skills 1.1 1.1 11
Bookkeeping/accounting 5.6 5.1 51
Other 3.7 3.7 37
None 52.8 52.5 526
Total 100.0 100.0 1,001
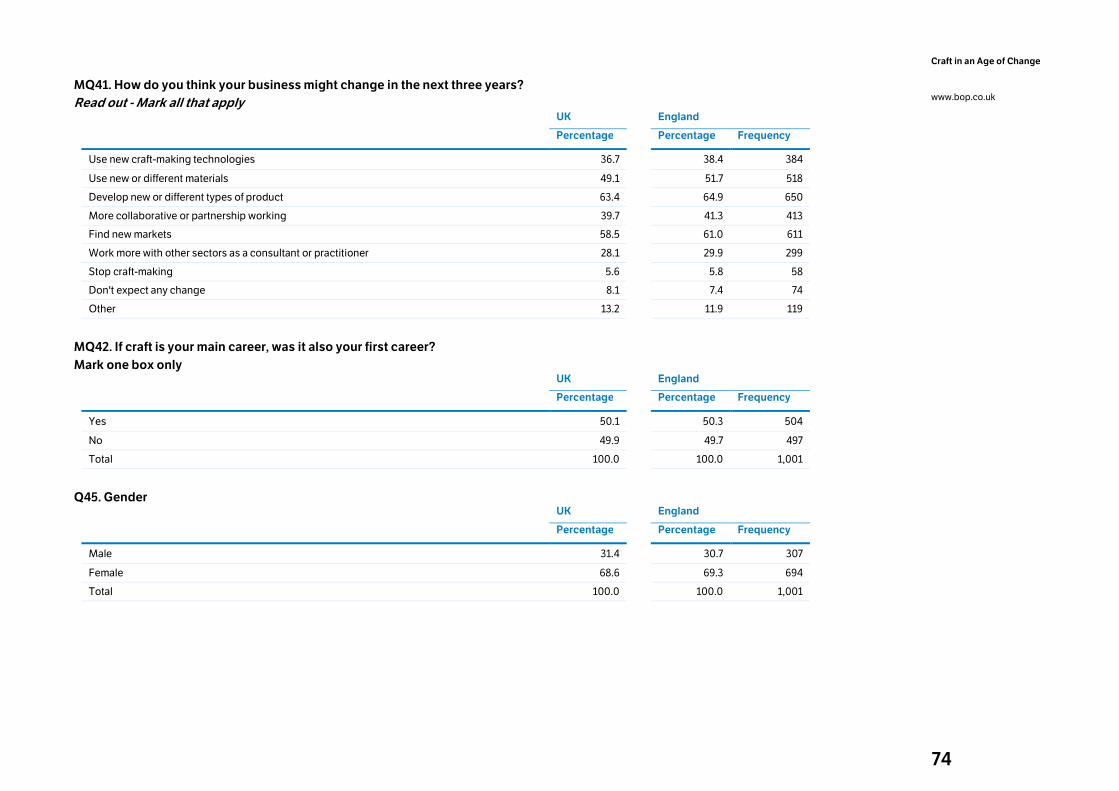
74
Craft in an Age of Change
www.bop.co.uk
MQ41. How do you think your business might change in the next three years?
Read out - Mark all that apply
UK
England
Percentage Percentage Frequency
Use new craft-making technologies 36.7 38.4 384
Use new or different materials 49.1 51.7 518
Develop new or different types of product 63.4 64.9 650
More collaborative or partnership working 39.7 41.3 413
Find new markets 58.5 61.0 611
Work more with other sectors as a consultant or practitioner 28.1 29.9 299
Stop craft-making 5.6 5.8 58
Don't expect any change 8.1 7.4 74
Other 13.2 11.9 119
MQ42. If craft is your main career, was it also your first career?
Mark one box only
UK England
Percentage Percentage Frequency
Yes 50.1 50.3 504
No 49.9 49.7 497
Total 100.0 100.0 1,001
Q45. Gender
UK England
Percentage Percentage Frequency
Male 31.4 30.7 307
Female 68.6 69.3 694
Total 100.0 100.0 1,001
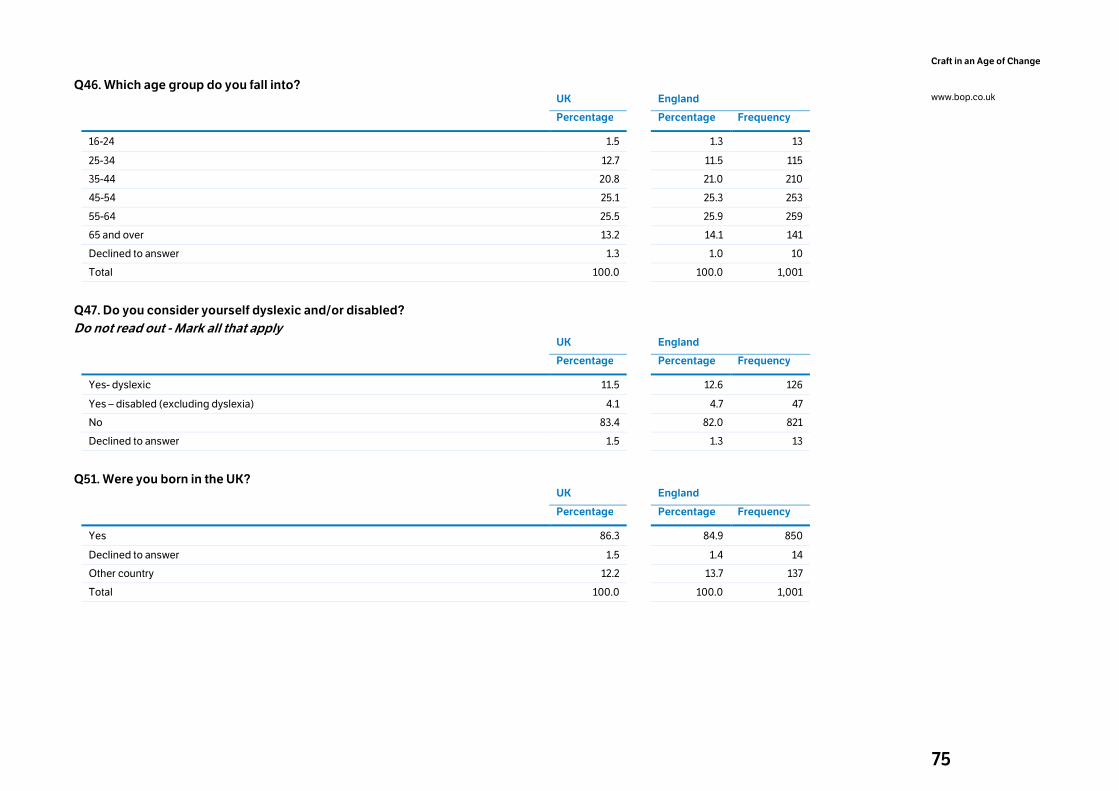
75
Craft in an Age of Change
www.bop.co.uk
Q46. Which age group do you fall into?
UK England
Percentage Percentage Frequency
16-24 1.5 1.3 13
25-34 12.7 11.5 115
35-44 20.8 21.0 210
45-54 25.1 25.3 253
55-64 25.5 25.9 259
65 and over 13.2 14.1 141
Declined to answer 1.3 1.0 10
Total 100.0 100.0 1,001
Q47. Do you consider yourself dyslexic and/or disabled?
Do not read out - Mark all that apply
UK England
Percentage Percentage Frequency
Yes- dyslexic 11.5 12.6 126
Yes – disabled (excluding dyslexia) 4.1 4.7 47
No 83.4 82.0 821
Declined to answer 1.5 1.3 13
Q51. Were you born in the UK?
UK
England
Percentage Percentage Frequency
Yes 86.3 84.9 850
Declined to answer 1.5 1.4 14
Other country 12.2 13.7 137
Total 100.0 100.0 1,001
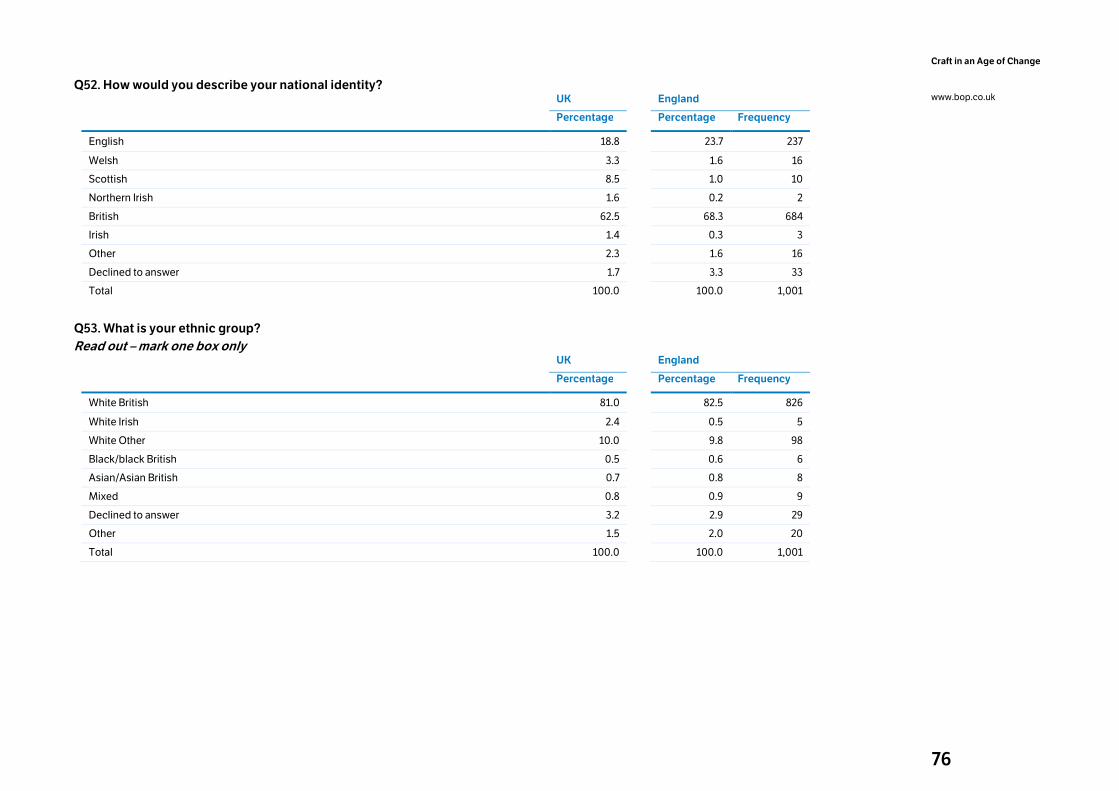
76
Craft in an Age of Change
www.bop.co.uk
Q52. How would you describe your national identity?
UK England
Percentage Percentage Frequency
English 18.8 23.7 237
Welsh 3.3 1.6 16
Scottish 8.5 1.0 10
Northern Irish 1.6 0.2 2
British 62.5 68.3 684
Irish 1.4 0.3 3
Other 2.3 1.6 16
Declined to answer 1.7 3.3 33
Total 100.0 100.0 1,001
Q53. What is your ethnic group?
Read out – mark one box only
UK
England
Percentage Percentage Frequency
White British 81.0 82.5 826
White Irish 2.4 0.5 5
White Other 10.0 9.8 98
Black/black British 0.5 0.6 6
Asian/Asian British 0.7 0.8 8
Mixed 0.8 0.9 9
Declined to answer 3.2 2.9 29
Other 1.5 2.0 20
Total 100.0 100.0 1,001
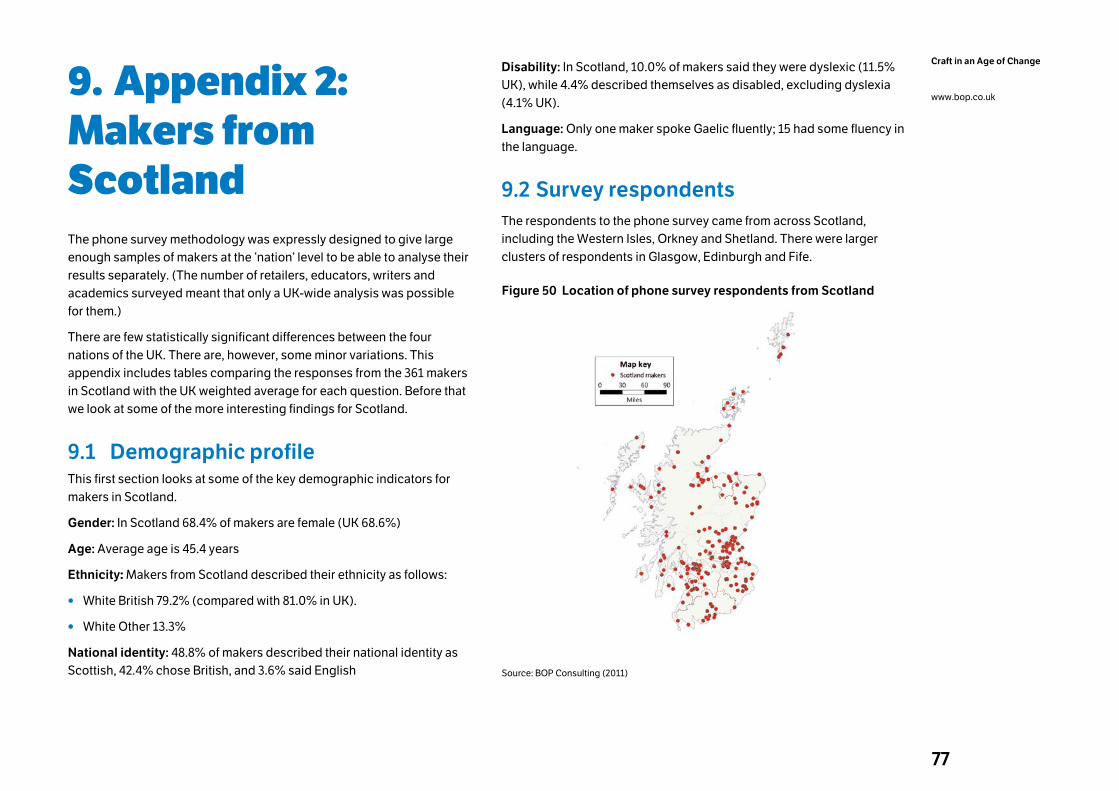
77
Craft in an Age of Change
www.bop.co.uk 9. Appendix 2: Makers from Scotland The phone survey methodology was expressly designed to give large
enough samples of makers at the ‘nation’ level to be able to analyse their
results separately. (The number of retailers, educators, writers and
academics surveyed meant that only a UK-wide analysis was possible
for them.)
There are few statistically significant differences between the four
nations of the UK. There are, however, some minor variations. This
appendix includes tables comparing the responses from the 361 makers
in Scotland with the UK weighted average for each question. Before that
we look at some of the more interesting findings for Scotland.
9.1 Demographic profile This first section looks at some of the key demographic indicators for
makers in Scotland.
Gender: In Scotland 68.4% of makers are female (UK 68.6%)
Age: Average age is 45.4 years
Ethnicity: Makers from Scotland described their ethnicity as follows:
• White British 79.2% (compared with 81.0% in UK).
• White Other 13.3%
National identity: 48.8% of makers described their national identity as
Scottish, 42.4% chose British, and 3.6% said English
Disability: In Scotland, 10.0% of makers said they were dyslexic (11.5%
UK), while 4.4% described themselves as disabled, excluding dyslexia
(4.1% UK).
Language: Only one maker spoke Gaelic fluently; 15 had some fluency in
the language.
9.2 Survey respondents
The respondents to the phone survey came from across Scotland,
including the Western Isles, Orkney and Shetland. There were larger
clusters of respondents in Glasgow, Edinburgh and Fife.
Figure 50 Location of phone survey respondents from Scotland
Source: BOP Consulting (2011)
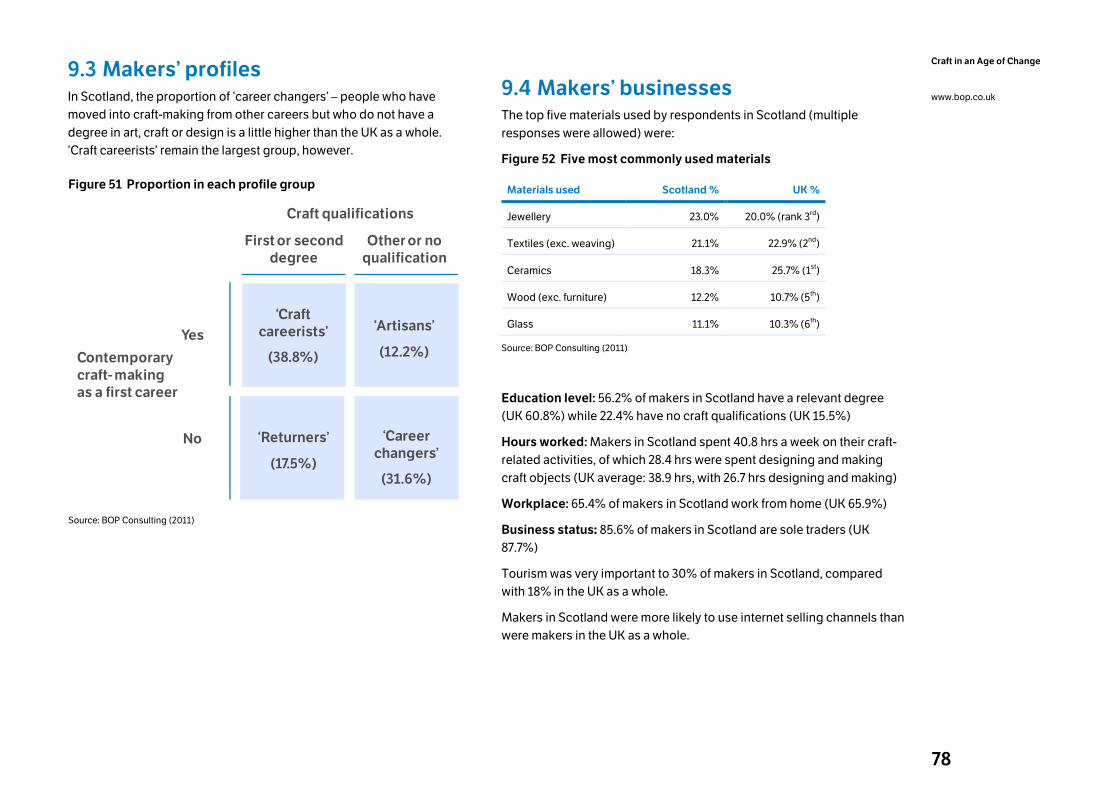
78
Craft in an Age of Change
www.bop.co.uk
9.3 Makers’ profiles In Scotland, the proportion of ‘career changers’ – people who have
moved into craft-making from other careers but who do not have a
degree in art, craft or design is a little higher than the UK as a whole.
‘Craft careerists’ remain the largest group, however.
Figure 51 Proportion in each profile group
Craft qualifications
First or second
degree
Other or no
qualification
Contemporary
craft-making
as a first career
Yes
No
‘Craft
careerists’
(38.8%)
‘Artisans’
(12.2%)
‘Returners’
(17.5%)
‘Career
changers’
(31.6%)
Source: BOP Consulting (2011)
9.4 Makers’ businesses The top five materials used by respondents in Scotland (multiple
responses were allowed) were:
Figure 52 Five most commonly used materials
Materials used Scotland % UK %
Jewellery 23.0% 20.0% (rank 3rd)
Textiles (exc. weaving) 21.1% 22.9% (2nd)
Ceramics 18.3% 25.7% (1st)
Wood (exc. furniture) 12.2% 10.7% (5th)
Glass 11.1% 10.3% (6th)
Source: BOP Consulting (2011)
Education level: 56.2% of makers in Scotland have a relevant degree
(UK 60.8%) while 22.4% have no craft qualifications (UK 15.5%)
Hours worked: Makers in Scotland spent 40.8 hrs a week on their craft-
related activities, of which 28.4 hrs were spent designing and making
craft objects (UK average: 38.9 hrs, with 26.7 hrs designing and making)
Workplace: 65.4% of makers in Scotland work from home (UK 65.9%)
Business status: 85.6% of makers in Scotland are sole traders (UK
87.7%)
Tourism was very important to 30% of makers in Scotland, compared
with 18% in the UK as a whole.
Makers in Scotland were more likely to use internet selling channels than
were makers in the UK as a whole.
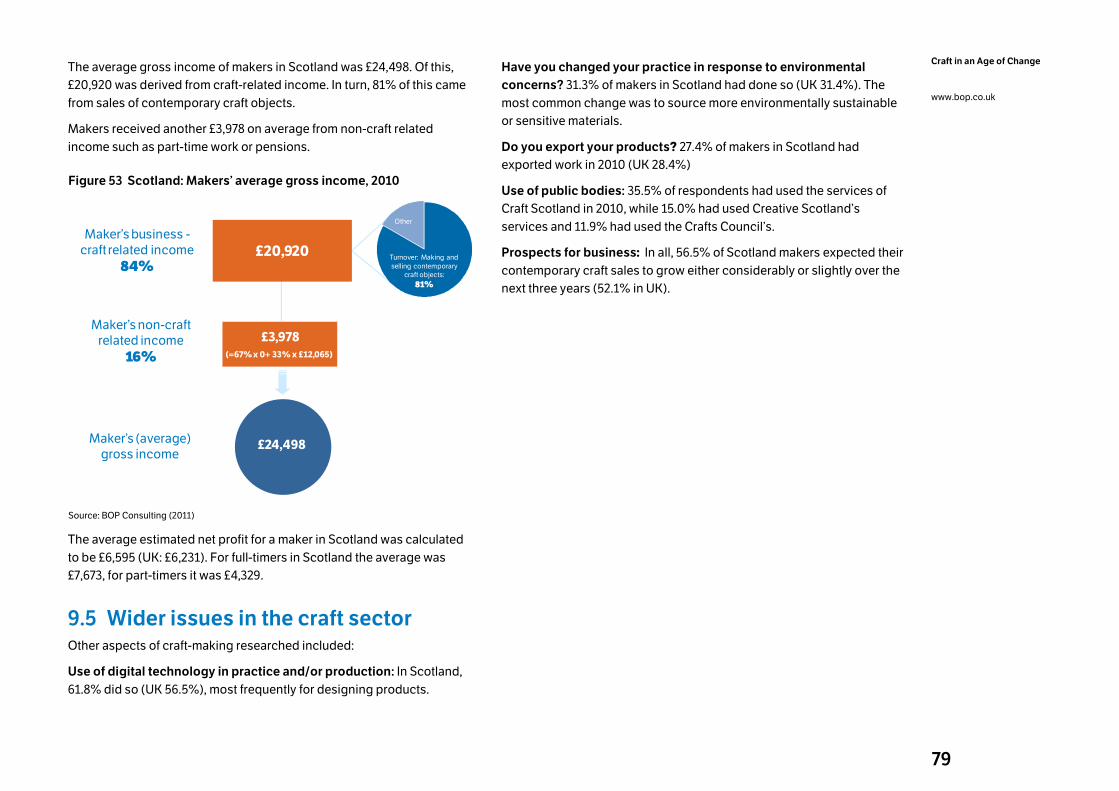
79
Craft in an Age of Change
www.bop.co.uk
The average gross income of makers in Scotland was £24,498. Of this,
£20,920 was derived from craft-related income. In turn, 81% of this came
from sales of contemporary craft objects.
Makers received another £3,978 on average from non-craft related
income such as part-time work or pensions.
Figure 53 Scotland: Makers’ average gross income, 2010
£24,498
Maker’s business -craft related income
84%
Maker’s non-craft related income
16%
£20,920
£3,978
(=67% x 0+ 33% x £12,065)
Turnover: Making and
selling contemporary craft objects:
81%
Other
Maker’s (average) gross income
Source: BOP Consulting (2011)
The average estimated net profit for a maker in Scotland was calculated
to be £6,595 (UK: £6,231). For full-timers in Scotland the average was
£7,673, for part-timers it was £4,329.
9.5 Wider issues in the craft sector Other aspects of craft-making researched included:
Use of digital technology in practice and/or production: In Scotland,
61.8% did so (UK 56.5%), most frequently for designing products.
Have you changed your practice in response to environmental
concerns? 31.3% of makers in Scotland had done so (UK 31.4%). The
most common change was to source more environmentally sustainable
or sensitive materials.
Do you export your products? 27.4% of makers in Scotland had
exported work in 2010 (UK 28.4%)
Use of public bodies: 35.5% of respondents had used the services of
Craft Scotland in 2010, while 15.0% had used Creative Scotland’s
services and 11.9% had used the Crafts Council’s.
Prospects for business: In all, 56.5% of Scotland makers expected their
contemporary craft sales to grow either considerably or slightly over the
next three years (52.1% in UK).
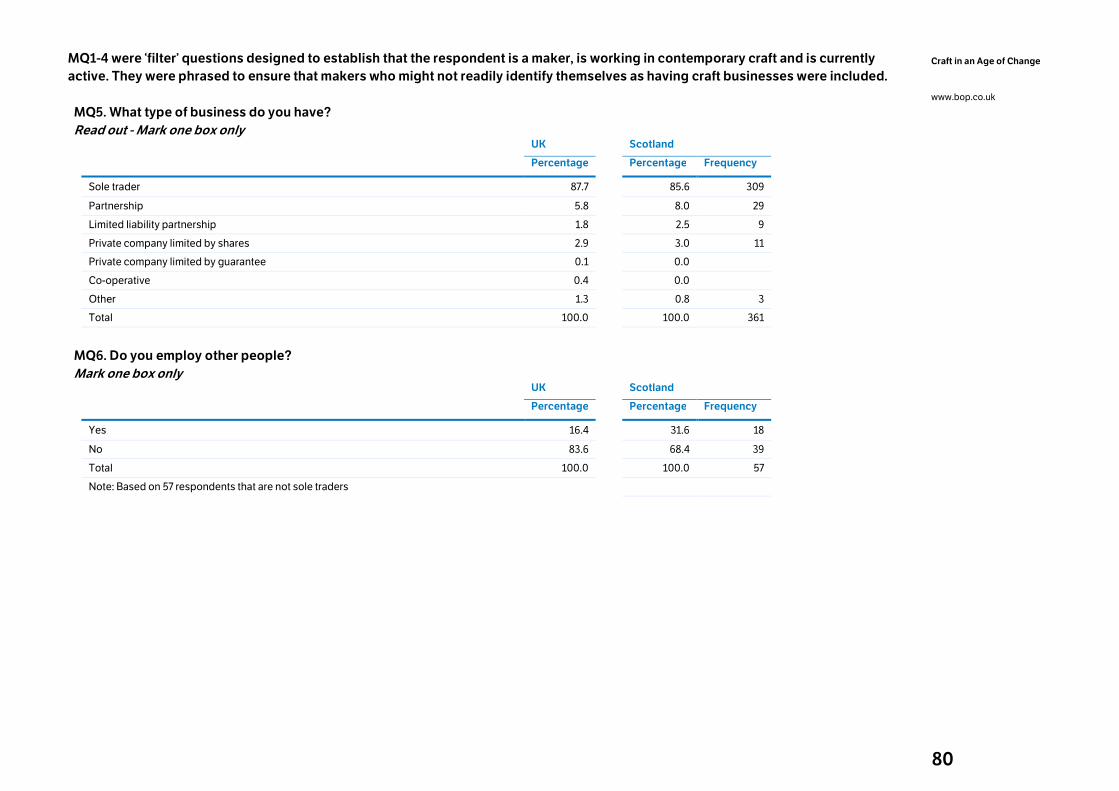
80
Craft in an Age of Change
www.bop.co.uk
MQ1-4 were ‘filter’ questions designed to establish that the respondent is a maker, is working in contemporary craft and is currently
active. They were phrased to ensure that makers who might not readily identify themselves as having craft businesses were included.
MQ5. What type of business do you have?
Read out - Mark one box only
UK
Scotland
Percentage Percentage Frequency
Sole trader 87.7 85.6 309
Partnership 5.8 8.0 29
Limited liability partnership 1.8 2.5 9
Private company limited by shares 2.9 3.0 11
Private company limited by guarantee 0.1 0.0
Co-operative 0.4 0.0
Other 1.3 0.8 3
Total 100.0 100.0 361
MQ6. Do you employ other people?
Mark one box only
UK
Scotland
Percentage Percentage Frequency
Yes 16.4 31.6 18
No 83.6 68.4 39
Total 100.0 100.0 57
Note: Based on 57 respondents that are not sole traders
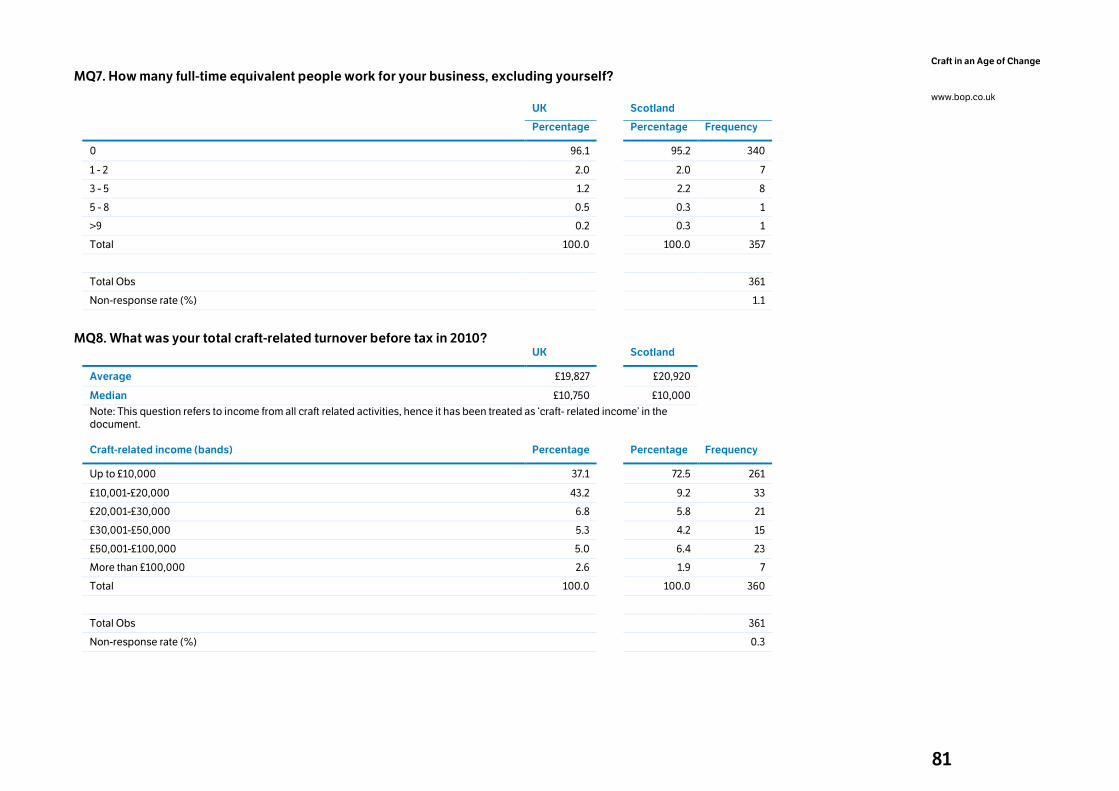
81
Craft in an Age of Change
www.bop.co.uk
MQ7. How many full-time equivalent people work for your business, excluding yourself?
UK
Scotland
Percentage Percentage Frequency
0 96.1 95.2 340
1 - 2 2.0 2.0 7
3 - 5 1.2 2.2 8
5 - 8 0.5 0.3 1
>9 0.2 0.3 1
Total 100.0 100.0 357
Total Obs 361
Non-response rate (%) 1.1
MQ8. What was your total craft-related turnover before tax in 2010?
UK Scotland
Average £19,827 £20,920
Median £10,750 £10,000
Note: This question refers to income from all craft related activities, hence it has been treated as ‘craft- related income’ in the document.
Craft-related income (bands) Percentage Percentage Frequency
Up to £10,000 37.1 72.5 261
£10,001-£20,000 43.2 9.2 33
£20,001-£30,000 6.8 5.8 21
£30,001-£50,000 5.3 4.2 15
£50,001-£100,000 5.0 6.4 23
More than £100,000 2.6 1.9 7
Total 100.0 100.0 360
Total Obs 361
Non-response rate (%) 0.3
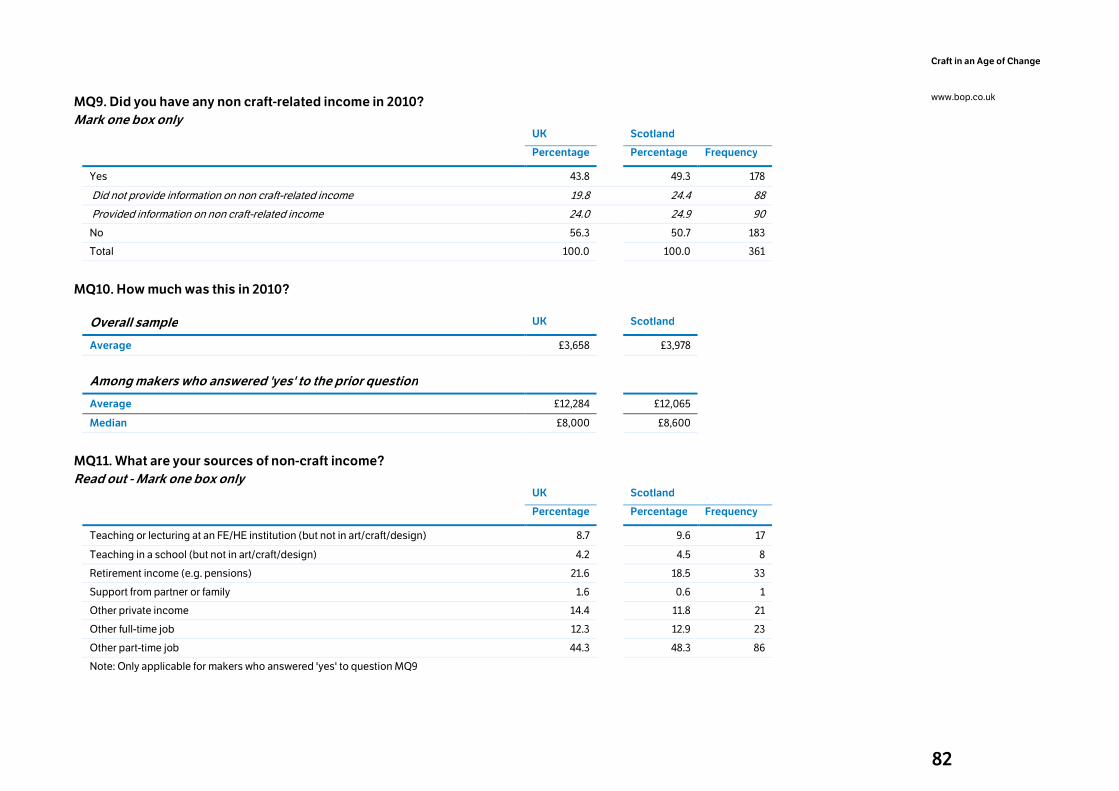
82
Craft in an Age of Change
www.bop.co.uk
MQ9. Did you have any non craft-related income in 2010?
Mark one box only
UK
Scotland
Percentage Percentage Frequency
Yes 43.8 49.3 178
Did not provide information on non craft-related income 19.8 24.4 88
Provided information on non craft-related income 24.0 24.9 90
No 56.3 50.7 183
Total 100.0 100.0 361
MQ10. How much was this in 2010?
Overall sample UK Scotland
Average £3,658 £3,978
Among makers who answered 'yes' to the prior question
Average £12,284 £12,065
Median £8,000 £8,600
MQ11. What are your sources of non-craft income?
Read out - Mark one box only
UK
Scotland
Percentage Percentage Frequency
Teaching or lecturing at an FE/HE institution (but not in art/craft/design) 8.7 9.6 17
Teaching in a school (but not in art/craft/design) 4.2 4.5 8
Retirement income (e.g. pensions) 21.6 18.5 33
Support from partner or family 1.6 0.6 1
Other private income 14.4 11.8 21
Other full-time job 12.3 12.9 23
Other part-time job 44.3 48.3 86
Note: Only applicable for makers who answered 'yes' to question MQ9
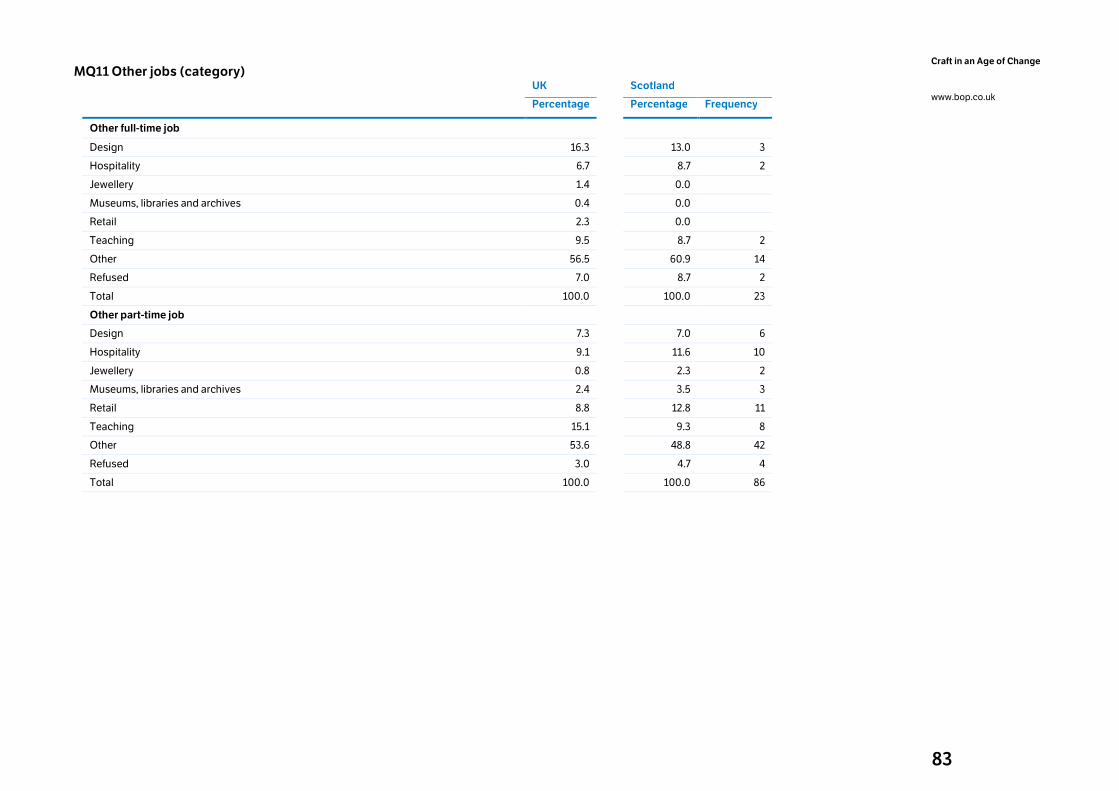
83
Craft in an Age of Change
www.bop.co.uk
MQ11 Other jobs (category)
UK Scotland
Percentage Percentage Frequency
Other full-time job
Design 16.3 13.0 3
Hospitality 6.7 8.7 2
Jewellery 1.4 0.0
Museums, libraries and archives 0.4 0.0
Retail 2.3 0.0
Teaching 9.5 8.7 2
Other 56.5 60.9 14
Refused 7.0 8.7 2
Total 100.0 100.0 23
Other part-time job
Design 7.3 7.0 6
Hospitality 9.1 11.6 10
Jewellery 0.8 2.3 2
Museums, libraries and archives 2.4 3.5 3
Retail 8.8 12.8 11
Teaching 15.1 9.3 8
Other 53.6 48.8 42
Refused 3.0 4.7 4
Total 100.0 100.0 86
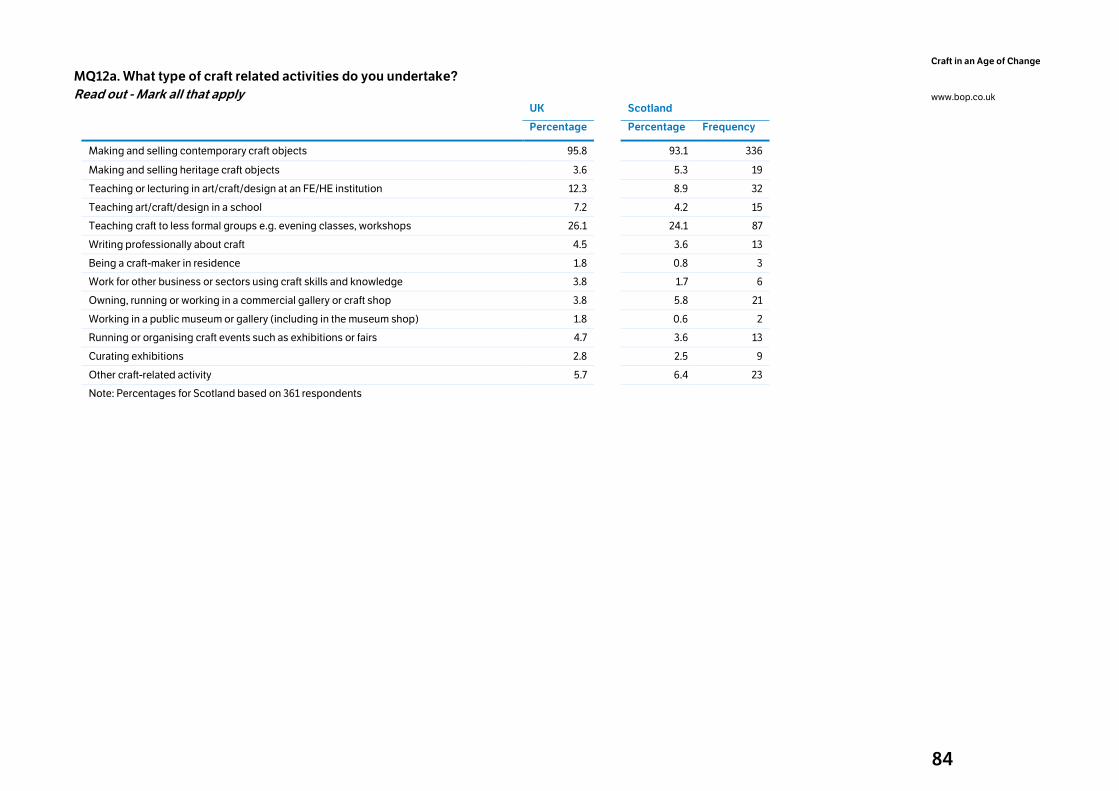
84
Craft in an Age of Change
www.bop.co.uk
MQ12a. What type of craft related activities do you undertake?
Read out - Mark all that apply
UK
Scotland
Percentage Percentage Frequency
Making and selling contemporary craft objects 95.8 93.1 336
Making and selling heritage craft objects 3.6 5.3 19
Teaching or lecturing in art/craft/design at an FE/HE institution 12.3 8.9 32
Teaching art/craft/design in a school 7.2 4.2 15
Teaching craft to less formal groups e.g. evening classes, workshops 26.1 24.1 87
Writing professionally about craft 4.5 3.6 13
Being a craft-maker in residence 1.8 0.8 3
Work for other business or sectors using craft skills and knowledge 3.8 1.7 6
Owning, running or working in a commercial gallery or craft shop 3.8 5.8 21
Working in a public museum or gallery (including in the museum shop) 1.8 0.6 2
Running or organising craft events such as exhibitions or fairs 4.7 3.6 13
Curating exhibitions 2.8 2.5 9
Other craft-related activity 5.7 6.4 23
Note: Percentages for Scotland based on 361 respondents
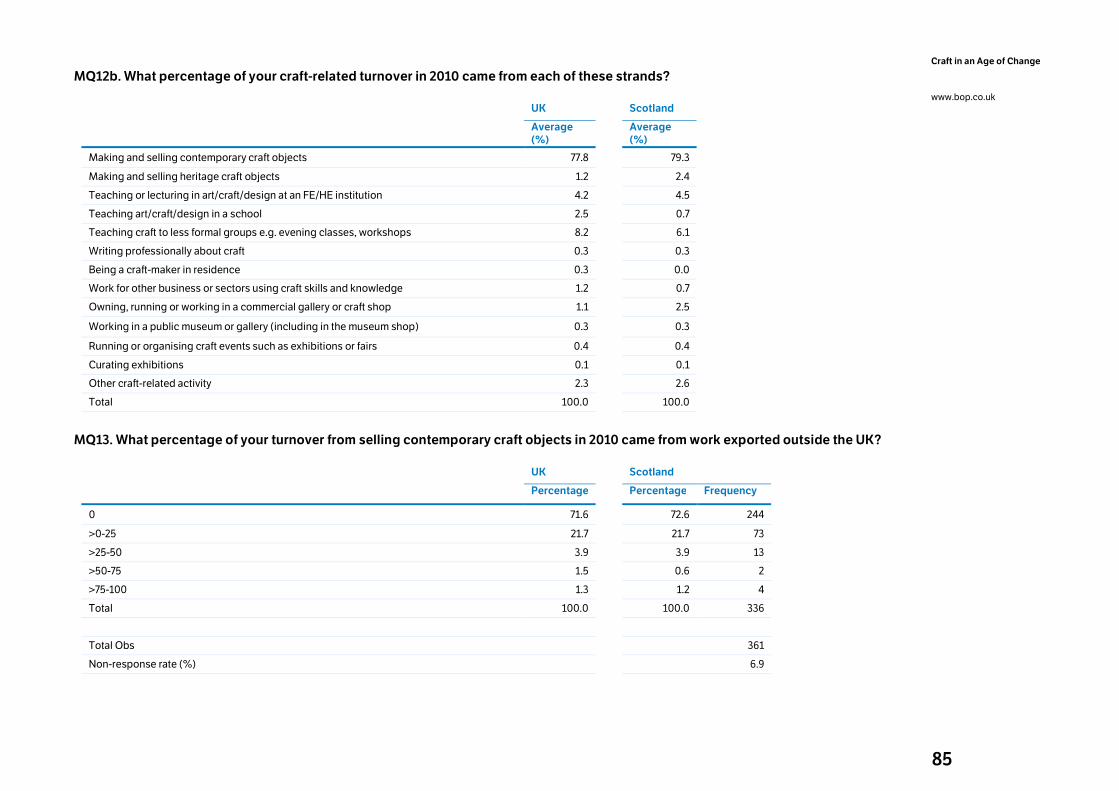
85
Craft in an Age of Change
www.bop.co.uk
MQ12b. What percentage of your craft-related turnover in 2010 came from each of these strands?
UK
Scotland
Average
(%) Average
(%)
Making and selling contemporary craft objects 77.8 79.3
Making and selling heritage craft objects 1.2 2.4
Teaching or lecturing in art/craft/design at an FE/HE institution 4.2 4.5
Teaching art/craft/design in a school 2.5 0.7
Teaching craft to less formal groups e.g. evening classes, workshops 8.2 6.1
Writing professionally about craft 0.3 0.3
Being a craft-maker in residence 0.3 0.0
Work for other business or sectors using craft skills and knowledge 1.2 0.7
Owning, running or working in a commercial gallery or craft shop 1.1 2.5
Working in a public museum or gallery (including in the museum shop) 0.3 0.3
Running or organising craft events such as exhibitions or fairs 0.4 0.4
Curating exhibitions 0.1 0.1
Other craft-related activity 2.3 2.6
Total 100.0 100.0
MQ13. What percentage of your turnover from selling contemporary craft objects in 2010 came from work exported outside the UK?
UK Scotland
Percentage Percentage Frequency
0 71.6 72.6 244
>0-25 21.7 21.7 73
>25-50 3.9 3.9 13
>50-75 1.5 0.6 2
>75-100 1.3 1.2 4
Total 100.0 100.0 336
Total Obs 361
Non-response rate (%) 6.9
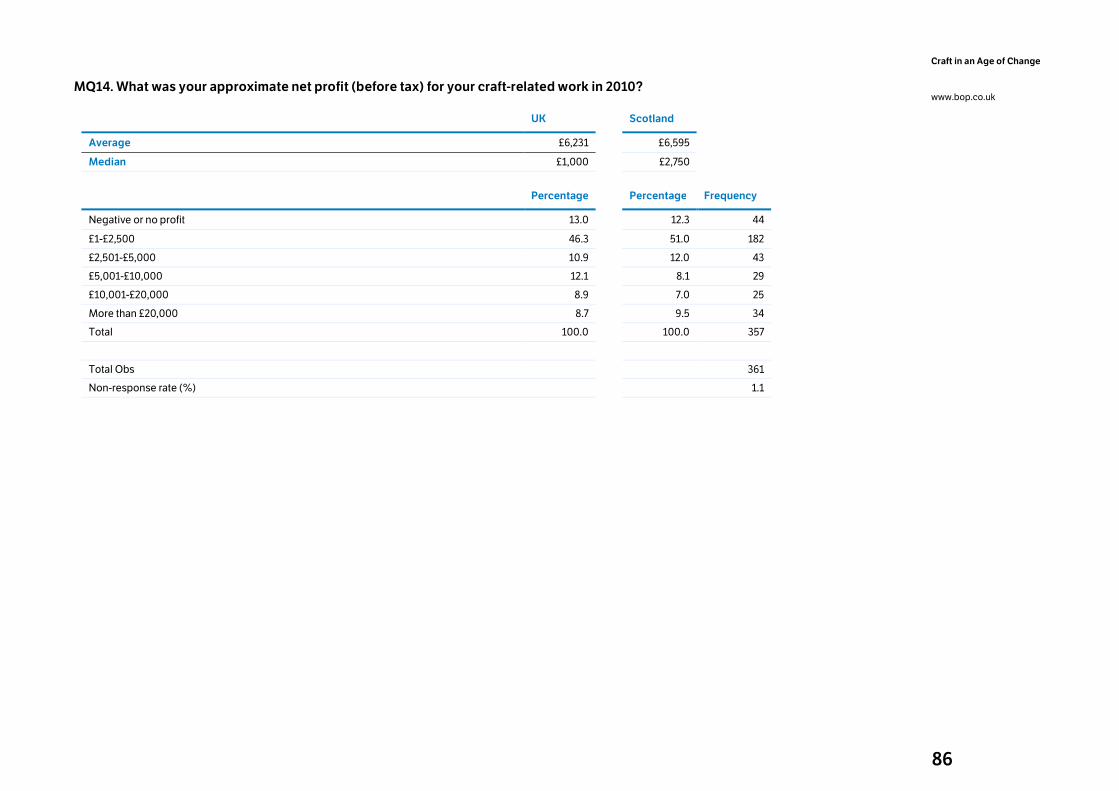
86
Craft in an Age of Change
www.bop.co.uk
MQ14. What was your approximate net profit (before tax) for your craft-related work in 2010?
UK Scotland
Average £6,231 £6,595
Median £1,000 £2,750
Percentage Percentage Frequency
Negative or no profit 13.0 12.3 44
£1-£2,500 46.3 51.0 182
£2,501-£5,000 10.9 12.0 43
£5,001-£10,000 12.1 8.1 29
£10,001-£20,000 8.9 7.0 25
More than £20,000 8.7 9.5 34
Total 100.0 100.0 357
Total Obs 361
Non-response rate (%) 1.1
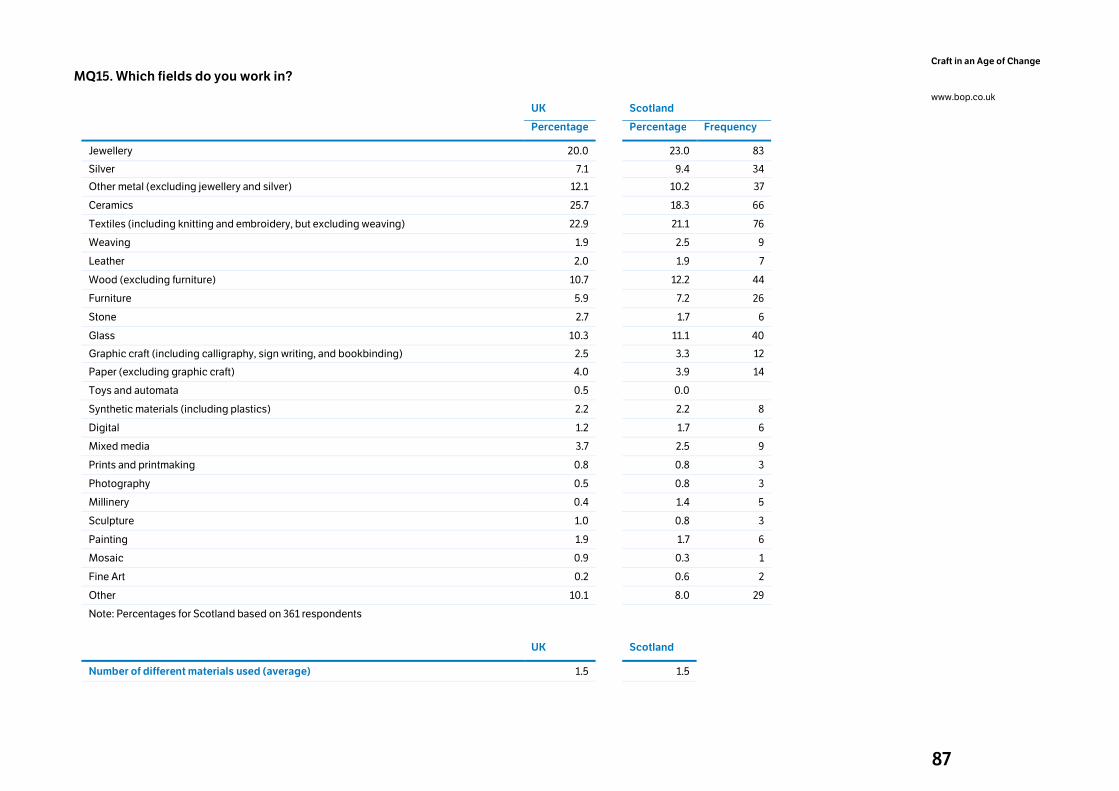
87
Craft in an Age of Change
www.bop.co.uk
MQ15. Which fields do you work in?
UK
Scotland
Percentage Percentage Frequency
Jewellery 20.0 23.0 83
Silver 7.1 9.4 34
Other metal (excluding jewellery and silver) 12.1 10.2 37
Ceramics 25.7 18.3 66
Textiles (including knitting and embroidery, but excluding weaving) 22.9 21.1 76
Weaving 1.9 2.5 9
Leather 2.0 1.9 7
Wood (excluding furniture) 10.7 12.2 44
Furniture 5.9 7.2 26
Stone 2.7 1.7 6
Glass 10.3 11.1 40
Graphic craft (including calligraphy, sign writing, and bookbinding) 2.5 3.3 12
Paper (excluding graphic craft) 4.0 3.9 14
Toys and automata 0.5 0.0
Synthetic materials (including plastics) 2.2 2.2 8
Digital 1.2 1.7 6
Mixed media 3.7 2.5 9
Prints and printmaking 0.8 0.8 3
Photography 0.5 0.8 3
Millinery 0.4 1.4 5
Sculpture 1.0 0.8 3
Painting 1.9 1.7 6
Mosaic 0.9 0.3 1
Fine Art 0.2 0.6 2
Other 10.1 8.0 29
Note: Percentages for Scotland based on 361 respondents
UK
Scotland
Number of different materials used (average) 1.5 1.5
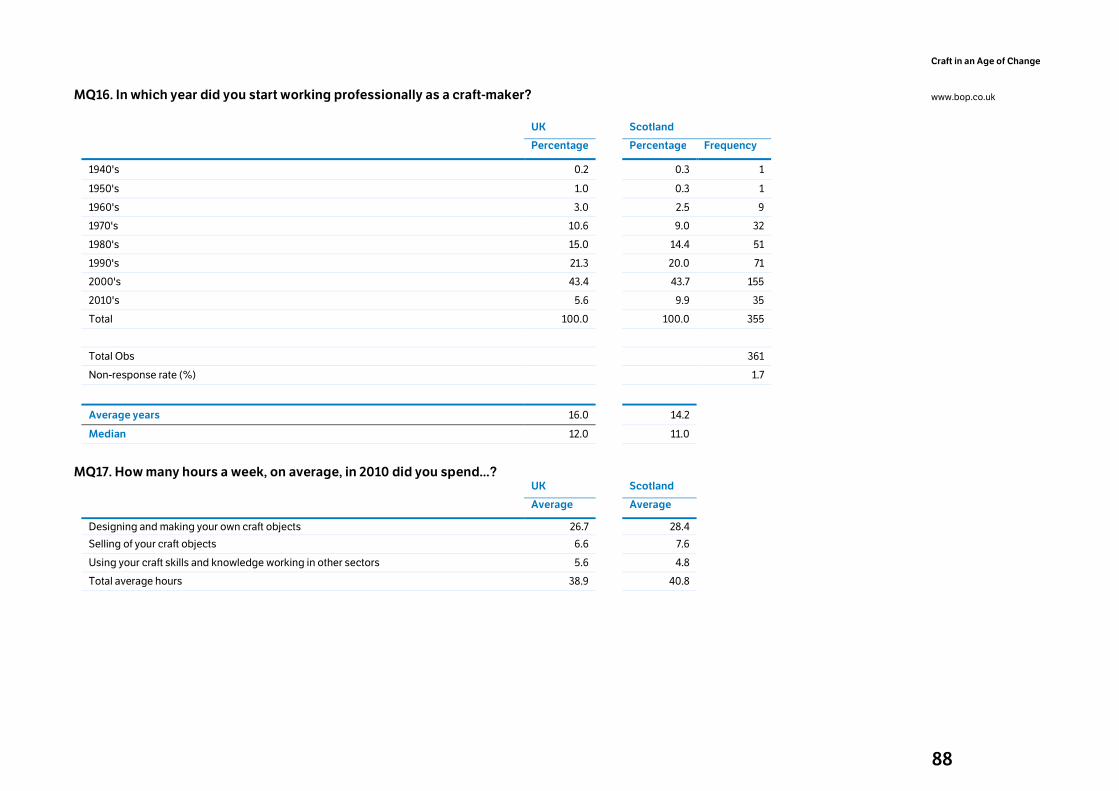
88
Craft in an Age of Change
www.bop.co.uk MQ16. In which year did you start working professionally as a craft-maker?
UK Scotland
Percentage Percentage Frequency
1940's 0.2 0.3 1
1950's 1.0 0.3 1
1960's 3.0 2.5 9
1970's 10.6 9.0 32
1980's 15.0 14.4 51
1990's 21.3 20.0 71
2000's 43.4 43.7 155
2010's 5.6 9.9 35
Total 100.0 100.0 355
Total Obs 361
Non-response rate (%) 1.7
Average years 16.0 14.2
Median 12.0 11.0
MQ17. How many hours a week, on average, in 2010 did you spend...?
UK Scotland
Average Average
Designing and making your own craft objects 26.7 28.4
Selling of your craft objects 6.6 7.6
Using your craft skills and knowledge working in other sectors 5.6 4.8
Total average hours 38.9 40.8
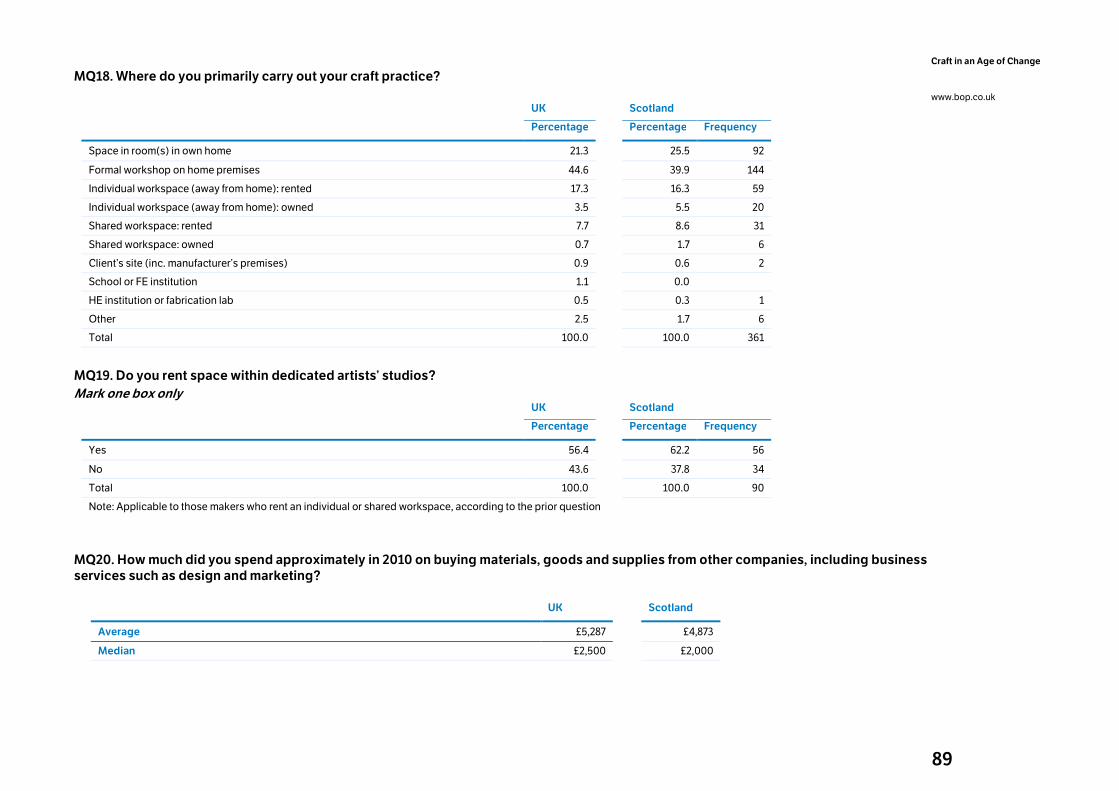
89
Craft in an Age of Change
www.bop.co.uk
MQ18. Where do you primarily carry out your craft practice?
UK
Scotland
Percentage Percentage Frequency
Space in room(s) in own home 21.3 25.5 92
Formal workshop on home premises 44.6 39.9 144
Individual workspace (away from home): rented 17.3 16.3 59
Individual workspace (away from home): owned 3.5 5.5 20
Shared workspace: rented 7.7 8.6 31
Shared workspace: owned 0.7 1.7 6
Client’s site (inc. manufacturer’s premises) 0.9 0.6 2
School or FE institution 1.1 0.0
HE institution or fabrication lab 0.5 0.3 1
Other 2.5 1.7 6
Total 100.0 100.0 361
MQ19. Do you rent space within dedicated artists’ studios?
Mark one box only
UK
Scotland
Percentage Percentage Frequency
Yes 56.4 62.2 56
No 43.6 37.8 34
Total 100.0 100.0 90
Note: Applicable to those makers who rent an individual or shared workspace, according to the prior question
MQ20. How much did you spend approximately in 2010 on buying materials, goods and supplies from other companies, including business
services such as design and marketing?
UK Scotland
Average £5,287 £4,873
Median £2,500 £2,000
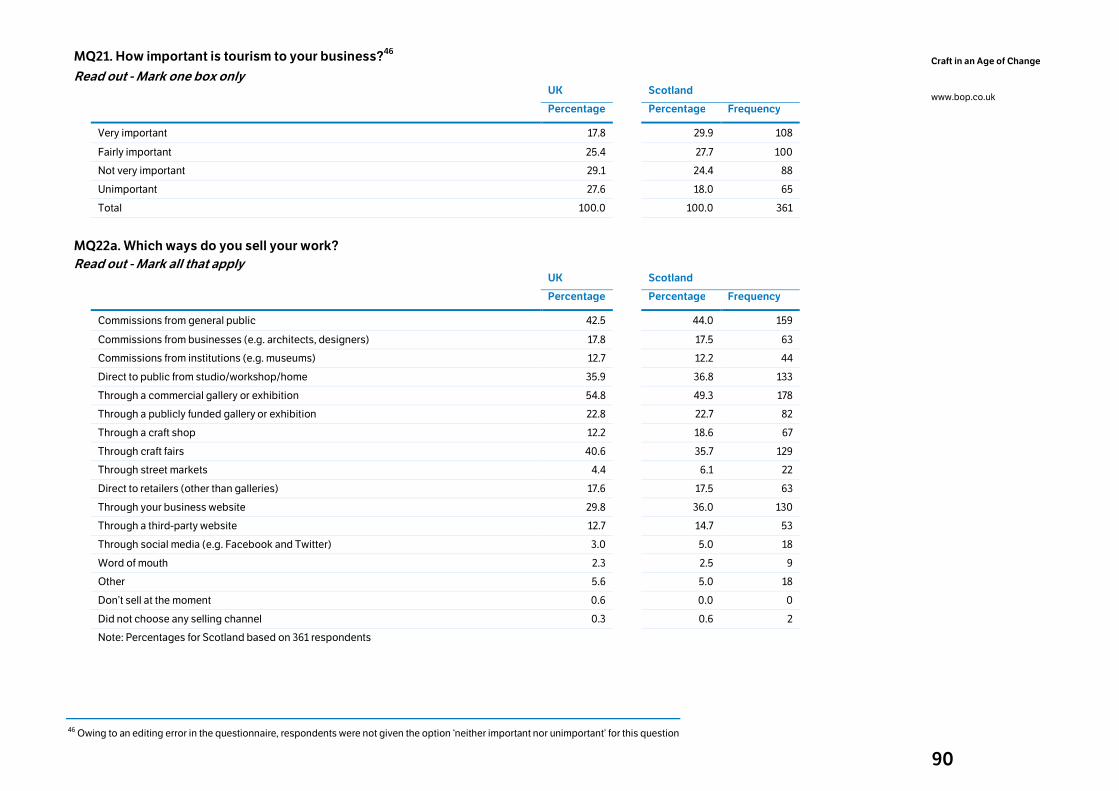
90
Craft in an Age of Change
www.bop.co.uk
MQ21. How important is tourism to your business?46
Read out - Mark one box only
UK Scotland
Percentage Percentage Frequency
Very important 17.8 29.9 108
Fairly important 25.4 27.7 100
Not very important 29.1 24.4 88
Unimportant 27.6 18.0 65
Total 100.0 100.0 361
MQ22a. Which ways do you sell your work?
Read out - Mark all that apply
UK Scotland
Percentage Percentage Frequency
Commissions from general public 42.5 44.0 159
Commissions from businesses (e.g. architects, designers) 17.8 17.5 63
Commissions from institutions (e.g. museums) 12.7 12.2 44
Direct to public from studio/workshop/home 35.9 36.8 133
Through a commercial gallery or exhibition 54.8 49.3 178
Through a publicly funded gallery or exhibition 22.8 22.7 82
Through a craft shop 12.2 18.6 67
Through craft fairs 40.6 35.7 129
Through street markets 4.4 6.1 22
Direct to retailers (other than galleries) 17.6 17.5 63
Through your business website 29.8 36.0 130
Through a third-party website 12.7 14.7 53
Through social media (e.g. Facebook and Twitter) 3.0 5.0 18
Word of mouth 2.3 2.5 9
Other 5.6 5.0 18
Don’t sell at the moment 0.6 0.0 0
Did not choose any selling channel 0.3 0.6 2
Note: Percentages for Scotland based on 361 respondents
46 Owing to an editing error in the questionnaire, respondents were not given the option ‘neither important nor unimportant’ for this question
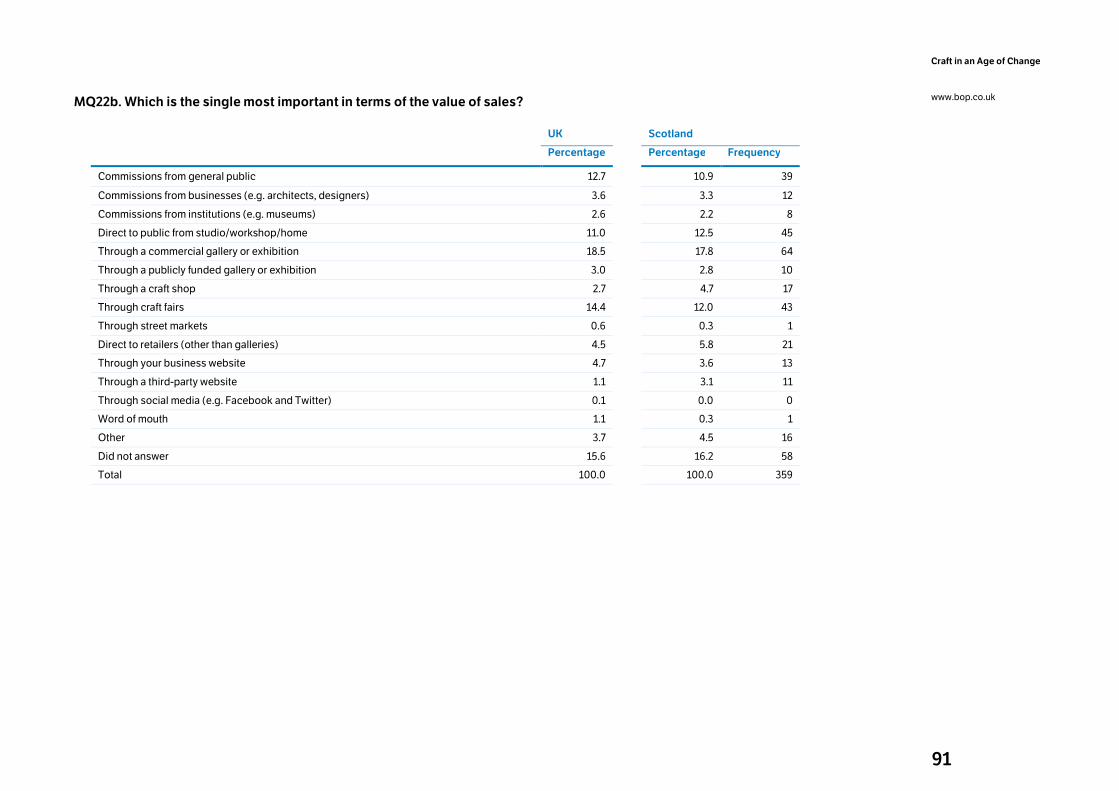
91
Craft in an Age of Change
www.bop.co.uk
MQ22b. Which is the single most important in terms of the value of sales?
UK
Scotland
Percentage Percentage Frequency
Commissions from general public 12.7 10.9 39
Commissions from businesses (e.g. architects, designers) 3.6 3.3 12
Commissions from institutions (e.g. museums) 2.6 2.2 8
Direct to public from studio/workshop/home 11.0 12.5 45
Through a commercial gallery or exhibition 18.5 17.8 64
Through a publicly funded gallery or exhibition 3.0 2.8 10
Through a craft shop 2.7 4.7 17
Through craft fairs 14.4 12.0 43
Through street markets 0.6 0.3 1
Direct to retailers (other than galleries) 4.5 5.8 21
Through your business website 4.7 3.6 13
Through a third-party website 1.1 3.1 11
Through social media (e.g. Facebook and Twitter) 0.1 0.0 0
Word of mouth 1.1 0.3 1
Other 3.7 4.5 16
Did not answer 15.6 16.2 58
Total 100.0 100.0 359
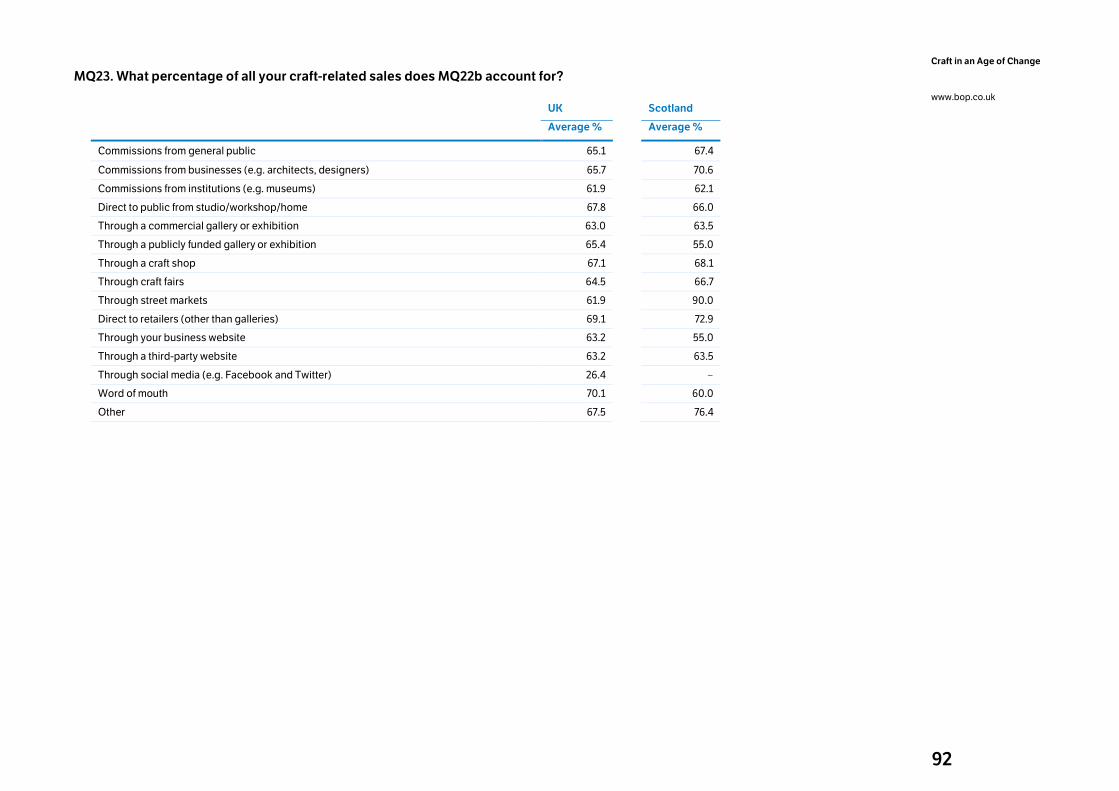
92
Craft in an Age of Change
www.bop.co.uk
MQ23. What percentage of all your craft-related sales does MQ22b account for?
UK
Scotland
Average % Average %
Commissions from general public 65.1 67.4
Commissions from businesses (e.g. architects, designers) 65.7 70.6
Commissions from institutions (e.g. museums) 61.9 62.1
Direct to public from studio/workshop/home 67.8 66.0
Through a commercial gallery or exhibition 63.0 63.5
Through a publicly funded gallery or exhibition 65.4 55.0
Through a craft shop 67.1 68.1
Through craft fairs 64.5 66.7
Through street markets 61.9 90.0
Direct to retailers (other than galleries) 69.1 72.9
Through your business website 63.2 55.0
Through a third-party website 63.2 63.5
Through social media (e.g. Facebook and Twitter) 26.4 -
Word of mouth 70.1 60.0
Other 67.5 76.4
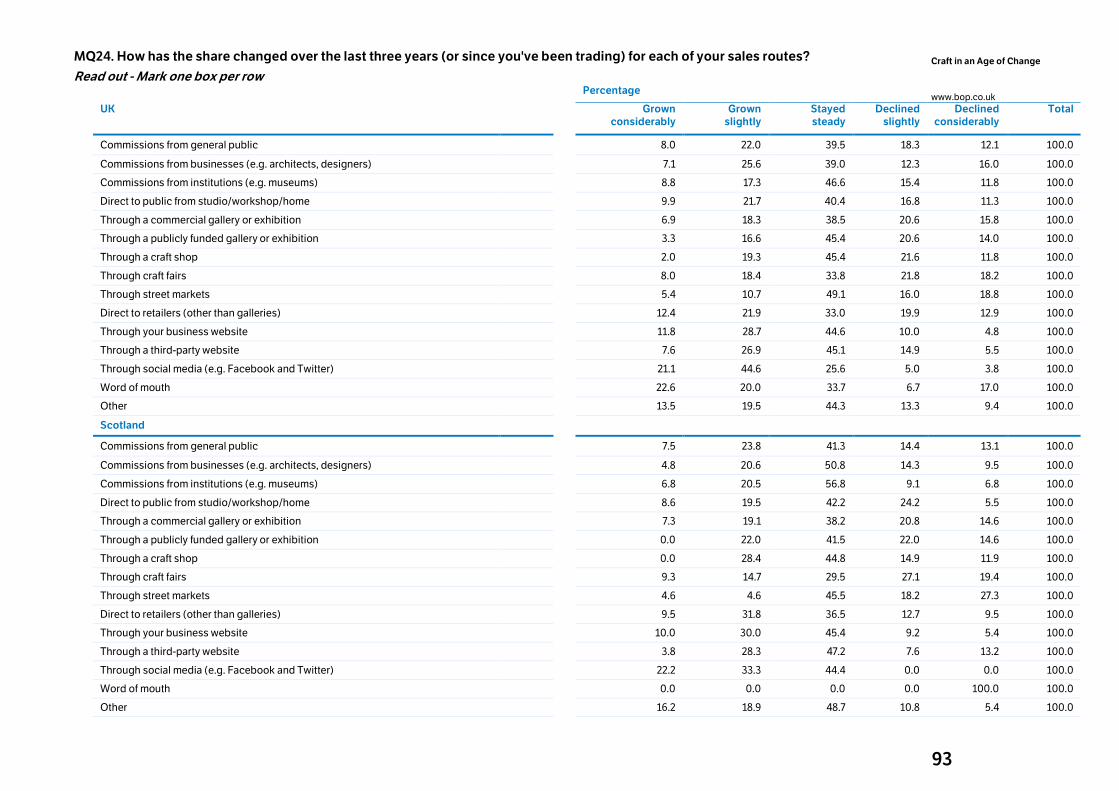
93
Craft in an Age of Change
www.bop.co.uk
MQ24. How has the share changed over the last three years (or since you've been trading) for each of your sales routes?
Read out - Mark one box per row
Percentage
UK Grown considerably
Grown slightly
Stayed steady
Declined slightly
Declined considerably
Total
Commissions from general public 8.0 22.0 39.5 18.3 12.1 100.0
Commissions from businesses (e.g. architects, designers) 7.1 25.6 39.0 12.3 16.0 100.0
Commissions from institutions (e.g. museums) 8.8 17.3 46.6 15.4 11.8 100.0
Direct to public from studio/workshop/home 9.9 21.7 40.4 16.8 11.3 100.0
Through a commercial gallery or exhibition 6.9 18.3 38.5 20.6 15.8 100.0
Through a publicly funded gallery or exhibition 3.3 16.6 45.4 20.6 14.0 100.0
Through a craft shop 2.0 19.3 45.4 21.6 11.8 100.0
Through craft fairs 8.0 18.4 33.8 21.8 18.2 100.0
Through street markets 5.4 10.7 49.1 16.0 18.8 100.0
Direct to retailers (other than galleries) 12.4 21.9 33.0 19.9 12.9 100.0
Through your business website 11.8 28.7 44.6 10.0 4.8 100.0
Through a third-party website 7.6 26.9 45.1 14.9 5.5 100.0
Through social media (e.g. Facebook and Twitter) 21.1 44.6 25.6 5.0 3.8 100.0
Word of mouth 22.6 20.0 33.7 6.7 17.0 100.0
Other 13.5 19.5 44.3 13.3 9.4 100.0
Scotland
Commissions from general public 7.5 23.8 41.3 14.4 13.1 100.0
Commissions from businesses (e.g. architects, designers) 4.8 20.6 50.8 14.3 9.5 100.0
Commissions from institutions (e.g. museums) 6.8 20.5 56.8 9.1 6.8 100.0
Direct to public from studio/workshop/home 8.6 19.5 42.2 24.2 5.5 100.0
Through a commercial gallery or exhibition 7.3 19.1 38.2 20.8 14.6 100.0
Through a publicly funded gallery or exhibition 0.0 22.0 41.5 22.0 14.6 100.0
Through a craft shop 0.0 28.4 44.8 14.9 11.9 100.0
Through craft fairs 9.3 14.7 29.5 27.1 19.4 100.0
Through street markets 4.6 4.6 45.5 18.2 27.3 100.0
Direct to retailers (other than galleries) 9.5 31.8 36.5 12.7 9.5 100.0
Through your business website 10.0 30.0 45.4 9.2 5.4 100.0
Through a third-party website 3.8 28.3 47.2 7.6 13.2 100.0
Through social media (e.g. Facebook and Twitter) 22.2 33.3 44.4 0.0 0.0 100.0
Word of mouth 0.0 0.0 0.0 0.0 100.0 100.0
Other 16.2 18.9 48.7 10.8 5.4 100.0
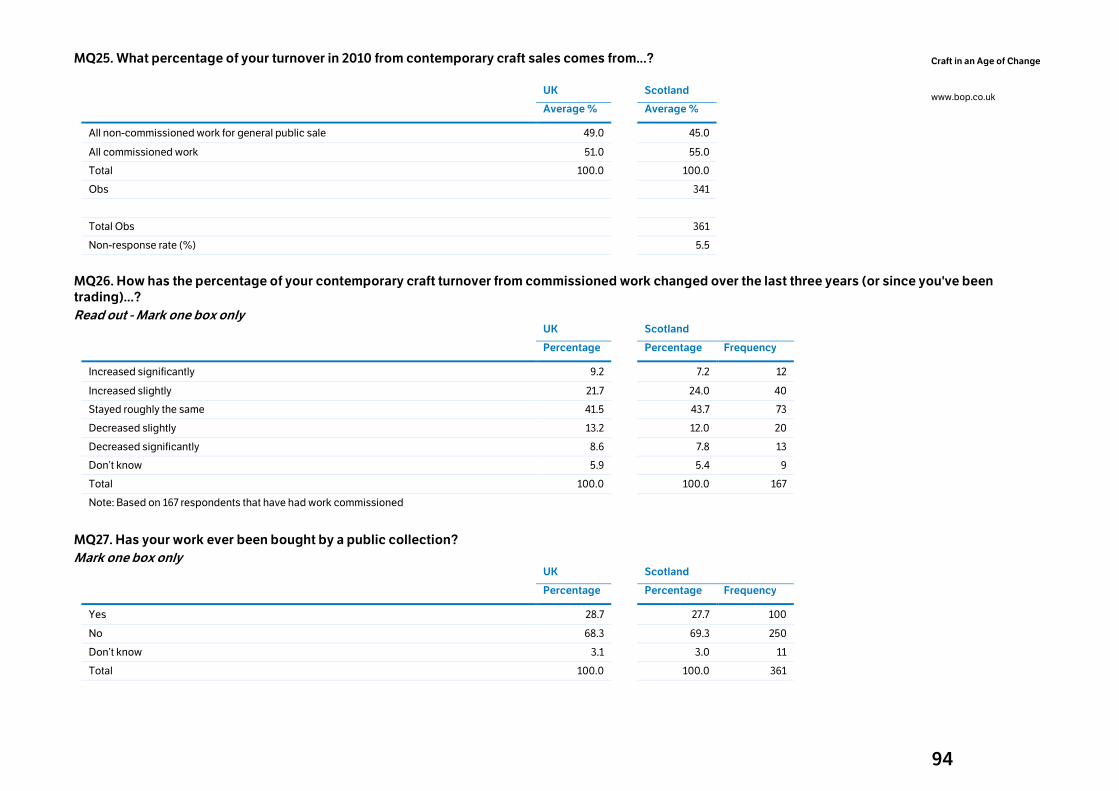
94
Craft in an Age of Change
www.bop.co.uk
MQ25. What percentage of your turnover in 2010 from contemporary craft sales comes from...?
UK Scotland
Average % Average %
All non-commissioned work for general public sale 49.0 45.0
All commissioned work 51.0 55.0
Total 100.0 100.0
Obs 341
Total Obs 361
Non-response rate (%) 5.5
MQ26. How has the percentage of your contemporary craft turnover from commissioned work changed over the last three years (or since you've been
trading)...?
Read out - Mark one box only
UK
Scotland
Percentage Percentage Frequency
Increased significantly 9.2 7.2 12
Increased slightly 21.7 24.0 40
Stayed roughly the same 41.5 43.7 73
Decreased slightly 13.2 12.0 20
Decreased significantly 8.6 7.8 13
Don’t know 5.9 5.4 9
Total 100.0 100.0 167
Note: Based on 167 respondents that have had work commissioned
MQ27. Has your work ever been bought by a public collection?
Mark one box only
UK
Scotland
Percentage Percentage Frequency
Yes 28.7 27.7 100
No 68.3 69.3 250
Don’t know 3.1 3.0 11
Total 100.0 100.0 361
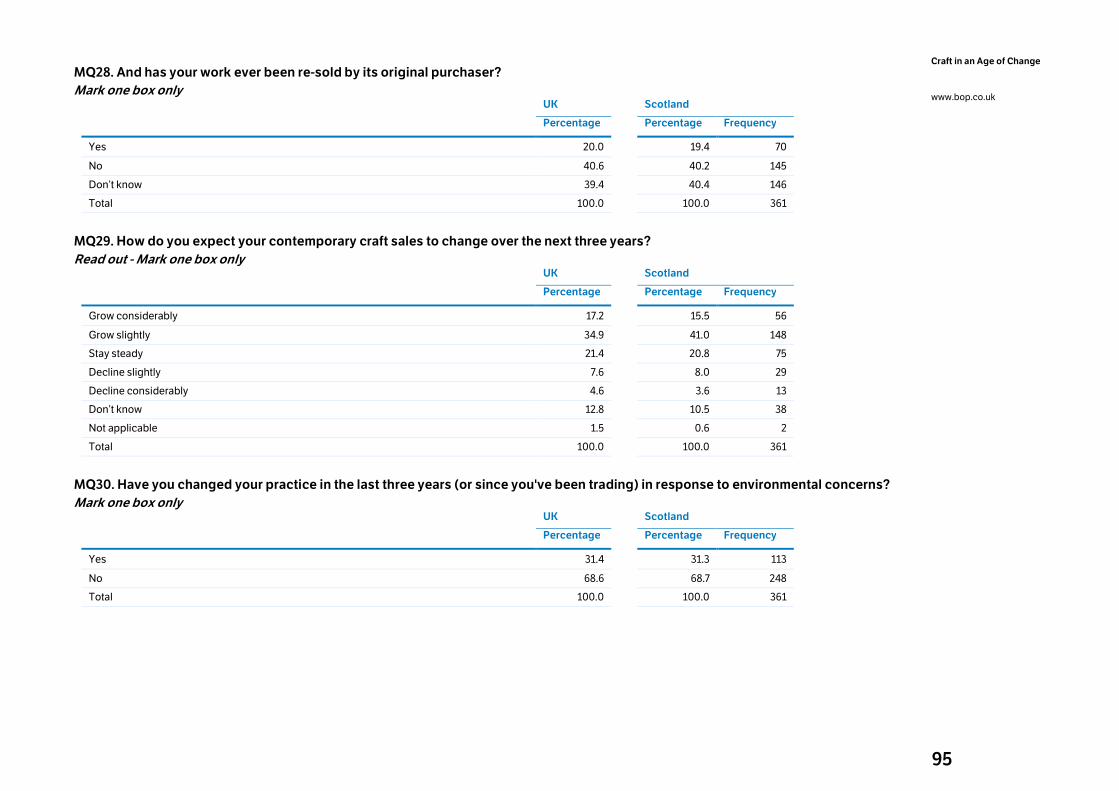
95
Craft in an Age of Change
www.bop.co.uk
MQ28. And has your work ever been re-sold by its original purchaser?
Mark one box only
UK
Scotland
Percentage Percentage Frequency
Yes 20.0 19.4 70
No 40.6 40.2 145
Don’t know 39.4 40.4 146
Total 100.0 100.0 361
MQ29. How do you expect your contemporary craft sales to change over the next three years?
Read out - Mark one box only
UK
Scotland
Percentage Percentage Frequency
Grow considerably 17.2 15.5 56
Grow slightly 34.9 41.0 148
Stay steady 21.4 20.8 75
Decline slightly 7.6 8.0 29
Decline considerably 4.6 3.6 13
Don’t know 12.8 10.5 38
Not applicable 1.5 0.6 2
Total 100.0 100.0 361
MQ30. Have you changed your practice in the last three years (or since you've been trading) in response to environmental concerns?
Mark one box only
UK
Scotland
Percentage Percentage Frequency
Yes 31.4 31.3 113
No 68.6 68.7 248
Total 100.0 100.0 361
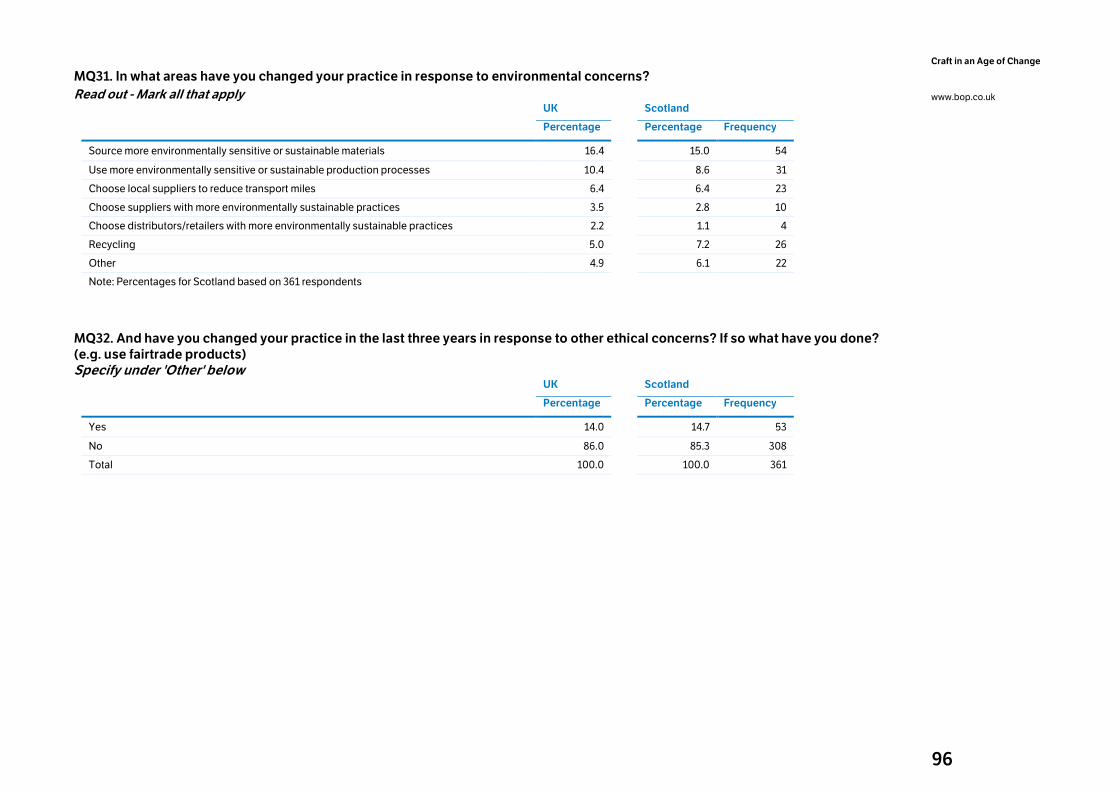
96
Craft in an Age of Change
www.bop.co.uk
MQ31. In what areas have you changed your practice in response to environmental concerns?
Read out - Mark all that apply
UK
Scotland
Percentage Percentage Frequency
Source more environmentally sensitive or sustainable materials 16.4 15.0 54
Use more environmentally sensitive or sustainable production processes 10.4 8.6 31
Choose local suppliers to reduce transport miles 6.4 6.4 23
Choose suppliers with more environmentally sustainable practices 3.5 2.8 10
Choose distributors/retailers with more environmentally sustainable practices 2.2 1.1 4
Recycling 5.0 7.2 26
Other 4.9 6.1 22
Note: Percentages for Scotland based on 361 respondents
MQ32. And have you changed your practice in the last three years in response to other ethical concerns? If so what have you done?
(e.g. use fairtrade products)
Specify under 'Other' below
UK
Scotland
Percentage Percentage Frequency
Yes 14.0 14.7 53
No 86.0 85.3 308
Total 100.0 100.0 361
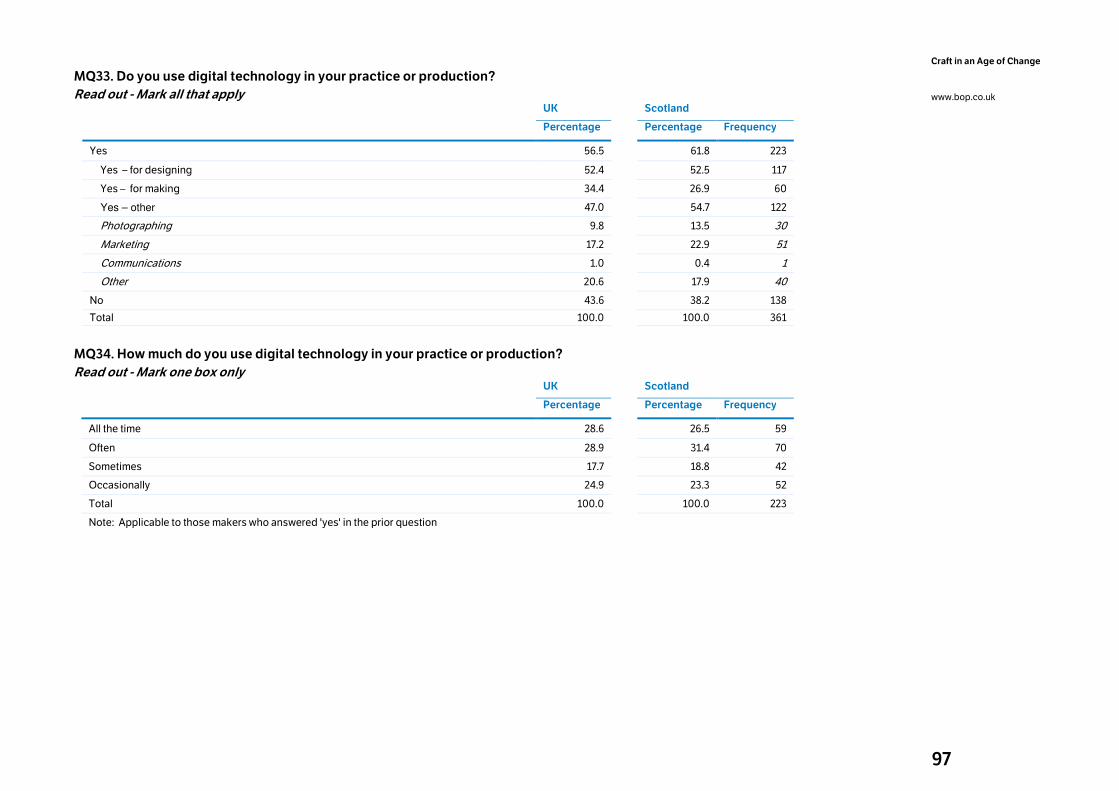
97
Craft in an Age of Change
www.bop.co.uk
MQ33. Do you use digital technology in your practice or production?
Read out - Mark all that apply
UK
Scotland
Percentage Percentage Frequency
Yes 56.5 61.8 223
Yes – for designing 52.4 52.5 117
Yes – for making 34.4 26.9 60
Yes – other 47.0 54.7 122
Photographing 9.8 13.5 30
Marketing 17.2 22.9 51
Communications 1.0 0.4 1
Other 20.6 17.9 40
No 43.6 38.2 138
Total 100.0 100.0 361
MQ34. How much do you use digital technology in your practice or production?
Read out - Mark one box only
UK
Scotland
Percentage Percentage Frequency
All the time 28.6 26.5 59
Often 28.9 31.4 70
Sometimes 17.7 18.8 42
Occasionally 24.9 23.3 52
Total 100.0 100.0 223
Note: Applicable to those makers who answered 'yes' in the prior question
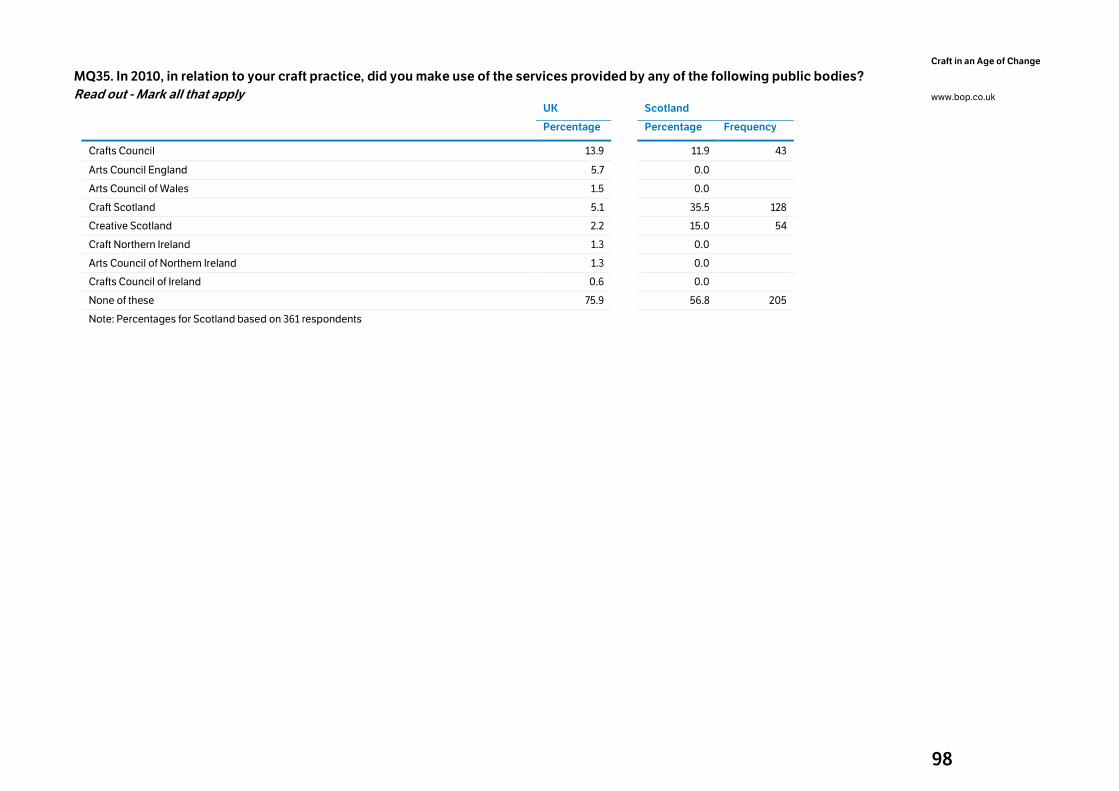
98
Craft in an Age of Change
www.bop.co.uk
MQ35. In 2010, in relation to your craft practice, did you make use of the services provided by any of the following public bodies?
Read out - Mark all that apply
UK
Scotland
Percentage Percentage Frequency
Crafts Council 13.9 11.9 43
Arts Council England 5.7 0.0
Arts Council of Wales 1.5 0.0
Craft Scotland 5.1 35.5 128
Creative Scotland 2.2 15.0 54
Craft Northern Ireland 1.3 0.0
Arts Council of Northern Ireland 1.3 0.0
Crafts Council of Ireland 0.6 0.0
None of these 75.9 56.8 205
Note: Percentages for Scotland based on 361 respondents
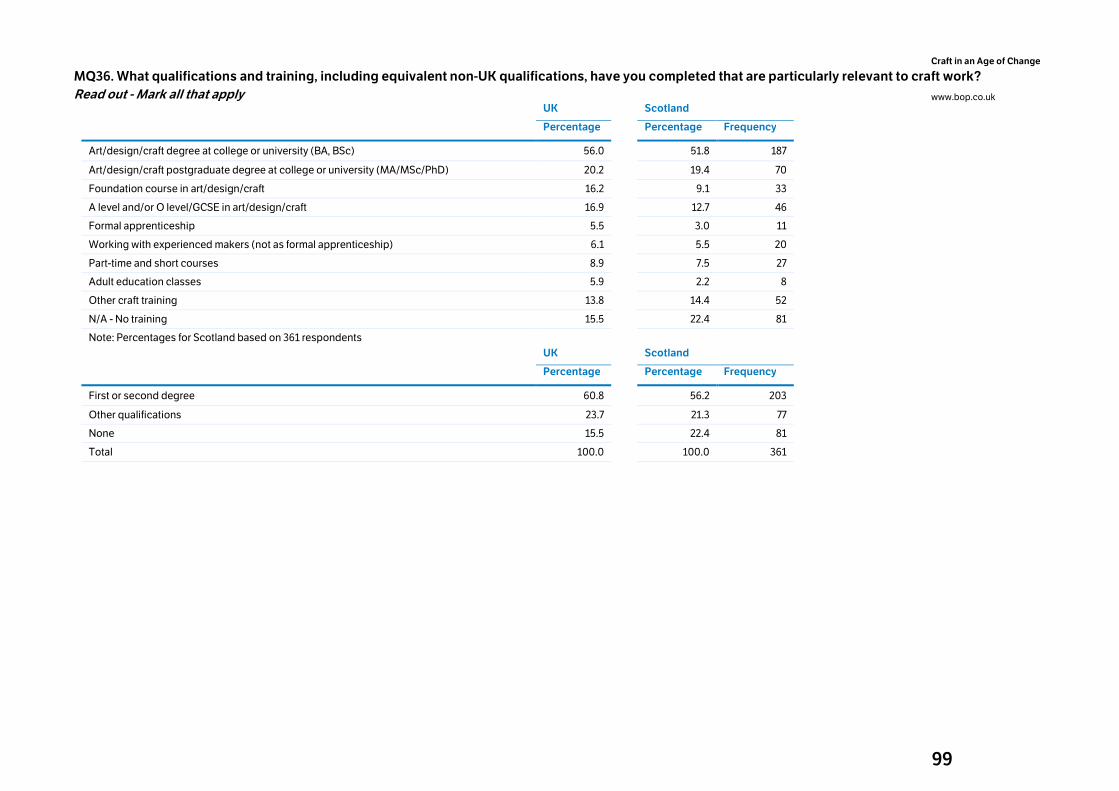
99
Craft in an Age of Change
www.bop.co.uk
MQ36. What qualifications and training, including equivalent non-UK qualifications, have you completed that are particularly relevant to craft work?
Read out - Mark all that apply
UK
Scotland
Percentage Percentage Frequency
Art/design/craft degree at college or university (BA, BSc) 56.0 51.8 187
Art/design/craft postgraduate degree at college or university (MA/MSc/PhD) 20.2 19.4 70
Foundation course in art/design/craft 16.2 9.1 33
A level and/or O level/GCSE in art/design/craft 16.9 12.7 46
Formal apprenticeship 5.5 3.0 11
Working with experienced makers (not as formal apprenticeship) 6.1 5.5 20
Part-time and short courses 8.9 7.5 27
Adult education classes 5.9 2.2 8
Other craft training 13.8 14.4 52
N/A - No training 15.5 22.4 81
Note: Percentages for Scotland based on 361 respondents
UK
Scotland
Percentage Percentage Frequency
First or second degree 60.8 56.2 203
Other qualifications 23.7 21.3 77
None 15.5 22.4 81
Total 100.0 100.0 361
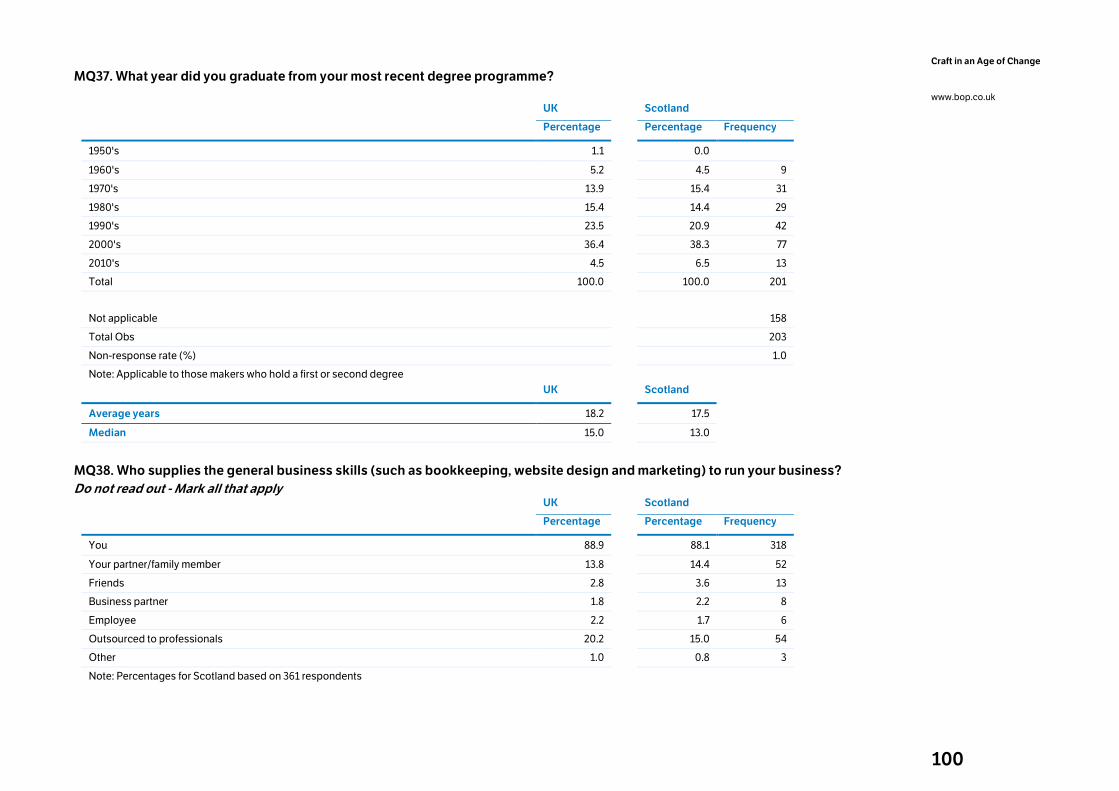
100
Craft in an Age of Change
www.bop.co.uk
MQ37. What year did you graduate from your most recent degree programme?
UK
Scotland
Percentage Percentage Frequency
1950's 1.1 0.0
1960's 5.2 4.5 9
1970's 13.9 15.4 31
1980's 15.4 14.4 29
1990's 23.5 20.9 42
2000's 36.4 38.3 77
2010's 4.5 6.5 13
Total 100.0 100.0 201
Not applicable 158
Total Obs 203
Non-response rate (%) 1.0
Note: Applicable to those makers who hold a first or second degree
UK
Scotland
Average years 18.2 17.5
Median 15.0 13.0
MQ38. Who supplies the general business skills (such as bookkeeping, website design and marketing) to run your business?
Do not read out - Mark all that apply
UK
Scotland
Percentage Percentage Frequency
You 88.9 88.1 318
Your partner/family member 13.8 14.4 52
Friends 2.8 3.6 13
Business partner 1.8 2.2 8
Employee 2.2 1.7 6
Outsourced to professionals 20.2 15.0 54
Other 1.0 0.8 3
Note: Percentages for Scotland based on 361 respondents
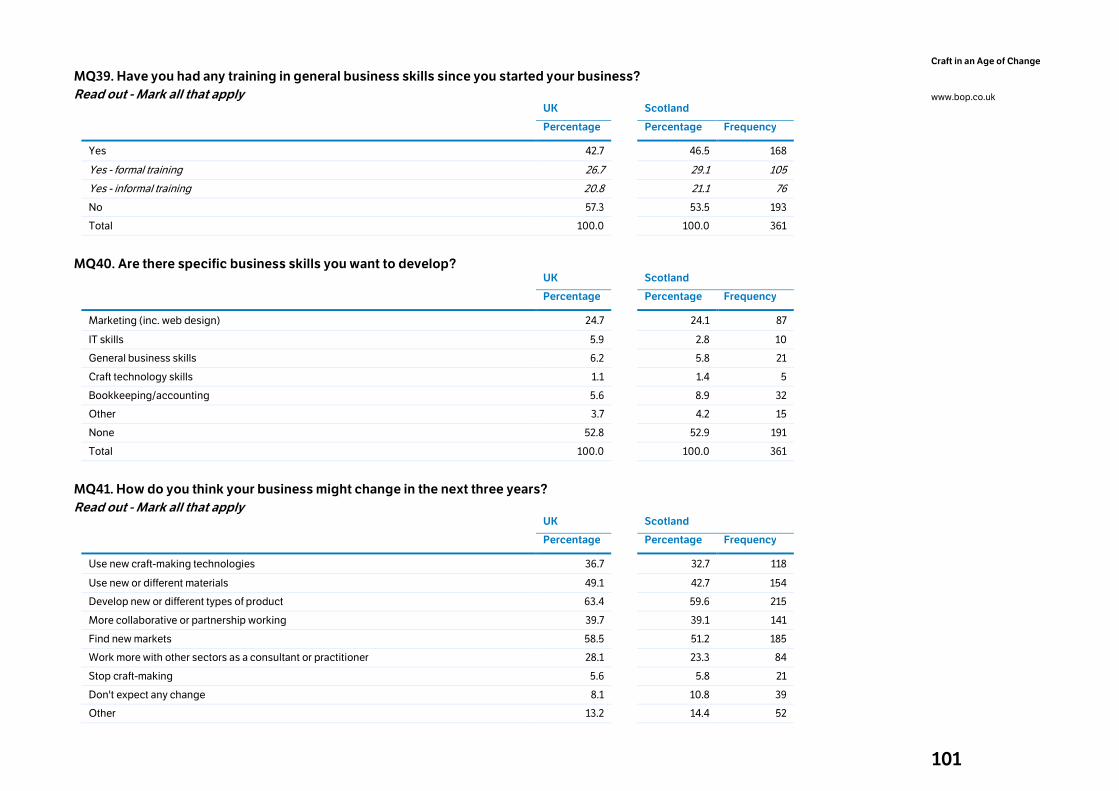
101
Craft in an Age of Change
www.bop.co.uk
MQ39. Have you had any training in general business skills since you started your business?
Read out - Mark all that apply
UK
Scotland
Percentage Percentage Frequency
Yes 42.7 46.5 168
Yes - formal training 26.7 29.1 105
Yes - informal training 20.8 21.1 76
No 57.3 53.5 193
Total 100.0 100.0 361
MQ40. Are there specific business skills you want to develop?
UK Scotland
Percentage Percentage Frequency
Marketing (inc. web design) 24.7 24.1 87
IT skills 5.9 2.8 10
General business skills 6.2 5.8 21
Craft technology skills 1.1 1.4 5
Bookkeeping/accounting 5.6 8.9 32
Other 3.7 4.2 15
None 52.8 52.9 191
Total 100.0 100.0 361
MQ41. How do you think your business might change in the next three years?
Read out - Mark all that apply
UK Scotland
Percentage Percentage Frequency
Use new craft-making technologies 36.7 32.7 118
Use new or different materials 49.1 42.7 154
Develop new or different types of product 63.4 59.6 215
More collaborative or partnership working 39.7 39.1 141
Find new markets 58.5 51.2 185
Work more with other sectors as a consultant or practitioner 28.1 23.3 84
Stop craft-making 5.6 5.8 21
Don't expect any change 8.1 10.8 39
Other 13.2 14.4 52
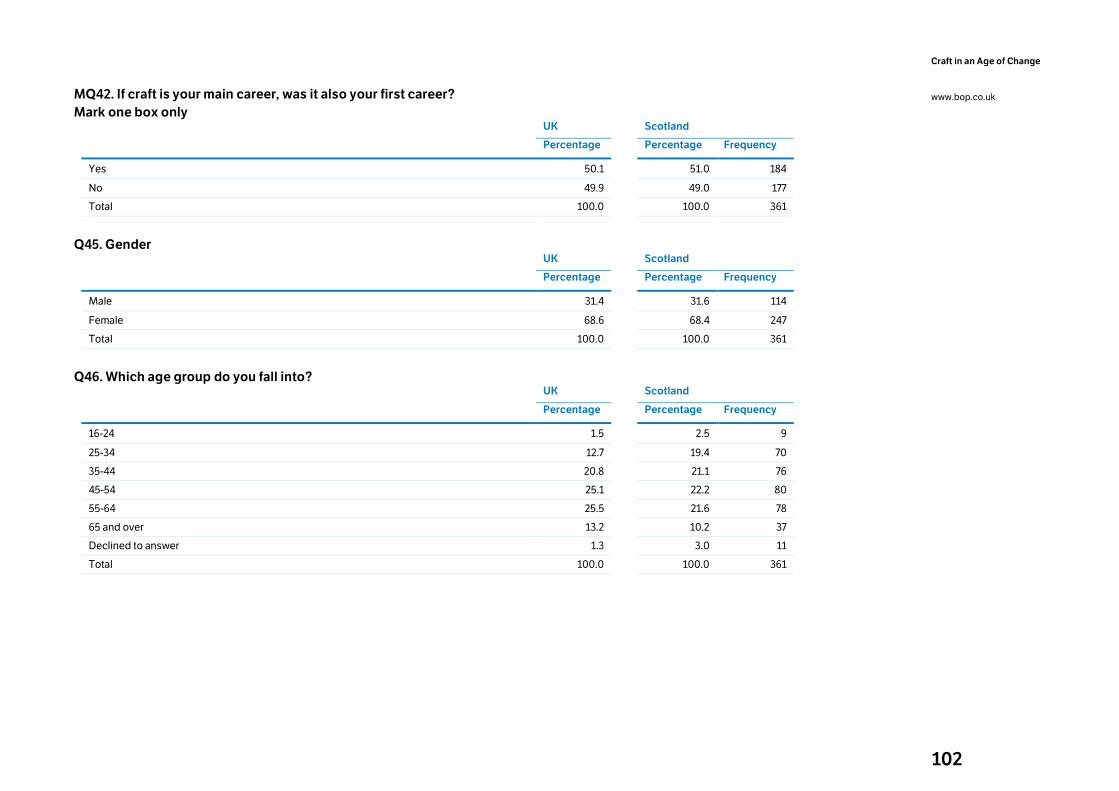
102
Craft in an Age of Change
www.bop.co.uk
MQ42. If craft is your main career, was it also your first career?
Mark one box only
UK Scotland
Percentage Percentage Frequency
Yes 50.1 51.0 184
No 49.9 49.0 177
Total 100.0 100.0 361
Q45. Gender
UK Scotland
Percentage Percentage Frequency
Male 31.4 31.6 114
Female 68.6 68.4 247
Total 100.0 100.0 361
Q46. Which age group do you fall into?
UK
Scotland
Percentage Percentage Frequency
16-24 1.5 2.5 9
25-34 12.7 19.4 70
35-44 20.8 21.1 76
45-54 25.1 22.2 80
55-64 25.5 21.6 78
65 and over 13.2 10.2 37
Declined to answer 1.3 3.0 11
Total 100.0 100.0 361
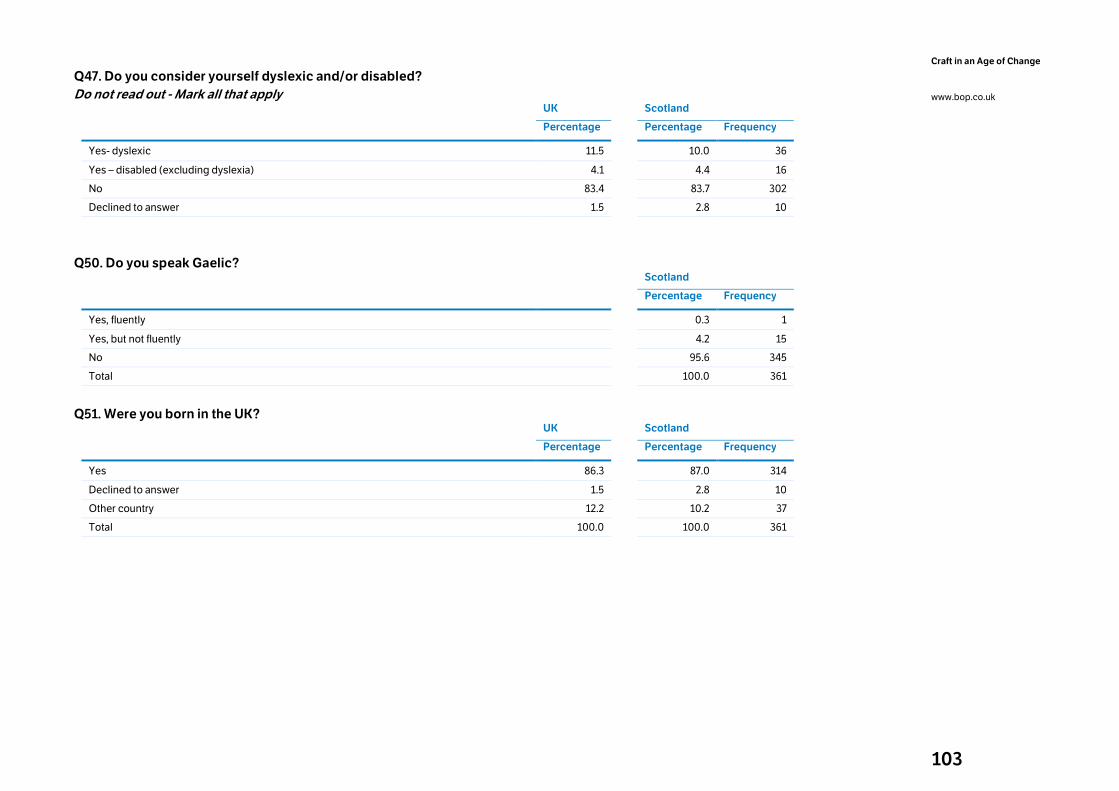
103
Craft in an Age of Change
www.bop.co.uk
Q47. Do you consider yourself dyslexic and/or disabled?
Do not read out - Mark all that apply
UK
Scotland
Percentage Percentage Frequency
Yes- dyslexic 11.5 10.0 36
Yes – disabled (excluding dyslexia) 4.1 4.4 16
No 83.4 83.7 302
Declined to answer 1.5 2.8 10
Q50. Do you speak Gaelic?
Scotland
Percentage Frequency
Yes, fluently 0.3 1
Yes, but not fluently 4.2 15
No 95.6 345
Total 100.0 361
Q51. Were you born in the UK?
UK
Scotland
Percentage Percentage Frequency
Yes 86.3 87.0 314
Declined to answer 1.5 2.8 10
Other country 12.2 10.2 37
Total 100.0 100.0 361
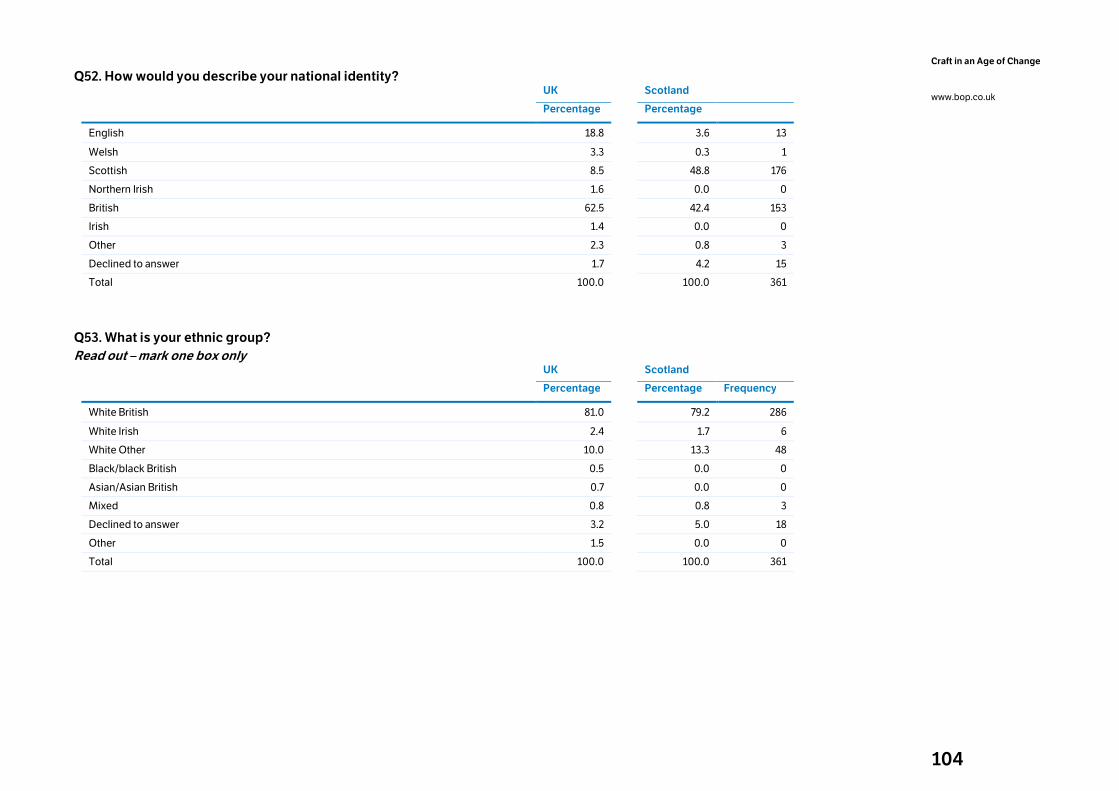
104
Craft in an Age of Change
www.bop.co.uk
Q52. How would you describe your national identity?
UK Scotland
Percentage
Percentage
English 18.8 3.6 13
Welsh 3.3 0.3 1
Scottish 8.5 48.8 176
Northern Irish 1.6 0.0 0
British 62.5 42.4 153
Irish 1.4 0.0 0
Other 2.3 0.8 3
Declined to answer 1.7 4.2 15
Total 100.0 100.0 361
Q53. What is your ethnic group?
Read out – mark one box only
UK Scotland
Percentage Percentage Frequency
White British 81.0 79.2 286
White Irish 2.4 1.7 6
White Other 10.0 13.3 48
Black/black British 0.5 0.0 0
Asian/Asian British 0.7 0.0 0
Mixed 0.8 0.8 3
Declined to answer 3.2 5.0 18
Other 1.5 0.0 0
Total 100.0 100.0 361
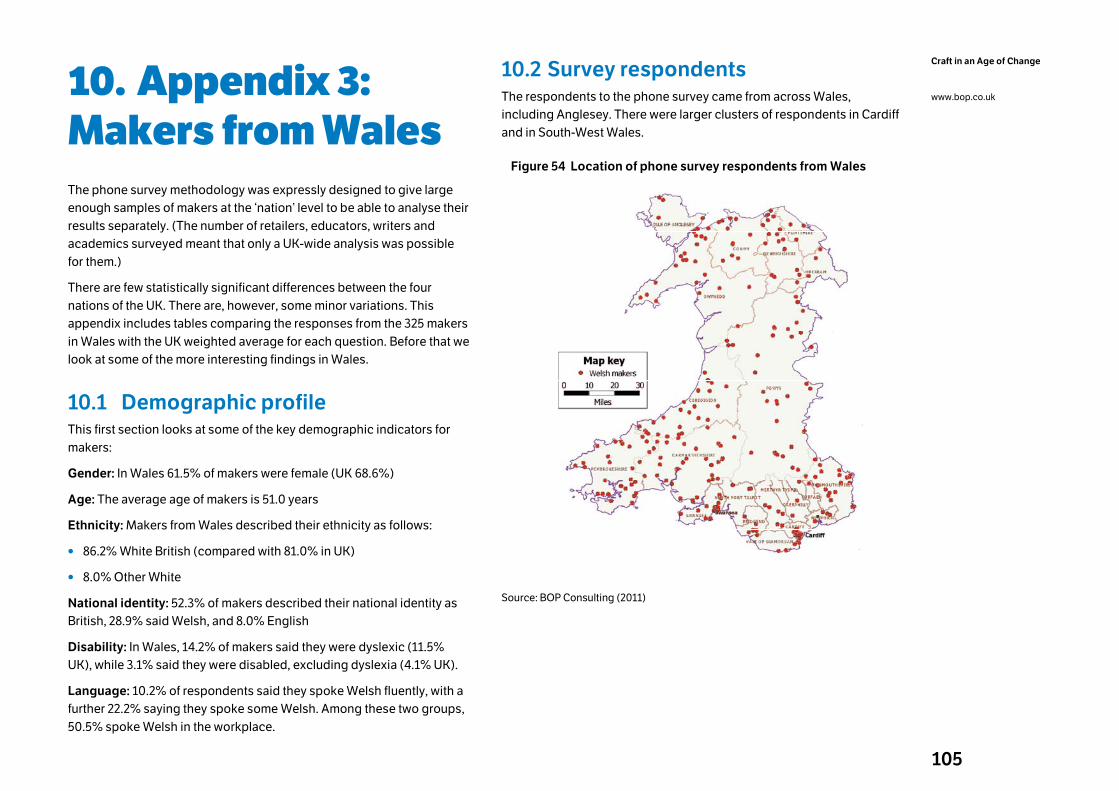
105
Craft in an Age of Change
www.bop.co.uk 10. Appendix 3: Makers from Wales The phone survey methodology was expressly designed to give large
enough samples of makers at the ‘nation’ level to be able to analyse their
results separately. (The number of retailers, educators, writers and
academics surveyed meant that only a UK-wide analysis was possible
for them.)
There are few statistically significant differences between the four
nations of the UK. There are, however, some minor variations. This
appendix includes tables comparing the responses from the 325 makers
in Wales with the UK weighted average for each question. Before that we
look at some of the more interesting findings in Wales.
10.1 Demographic profile This first section looks at some of the key demographic indicators for
makers:
Gender: In Wales 61.5% of makers were female (UK 68.6%)
Age: The average age of makers is 51.0 years
Ethnicity: Makers from Wales described their ethnicity as follows:
• 86.2% White British (compared with 81.0% in UK)
• 8.0% Other White
National identity: 52.3% of makers described their national identity as
British, 28.9% said Welsh, and 8.0% English
Disability: In Wales, 14.2% of makers said they were dyslexic (11.5%
UK), while 3.1% said they were disabled, excluding dyslexia (4.1% UK).
Language: 10.2% of respondents said they spoke Welsh fluently, with a
further 22.2% saying they spoke some Welsh. Among these two groups,
50.5% spoke Welsh in the workplace.
10.2 Survey respondents The respondents to the phone survey came from across Wales,
including Anglesey. There were larger clusters of respondents in Cardiff
and in South-West Wales.
Figure 54 Location of phone survey respondents from Wales
Source: BOP Consulting (2011)
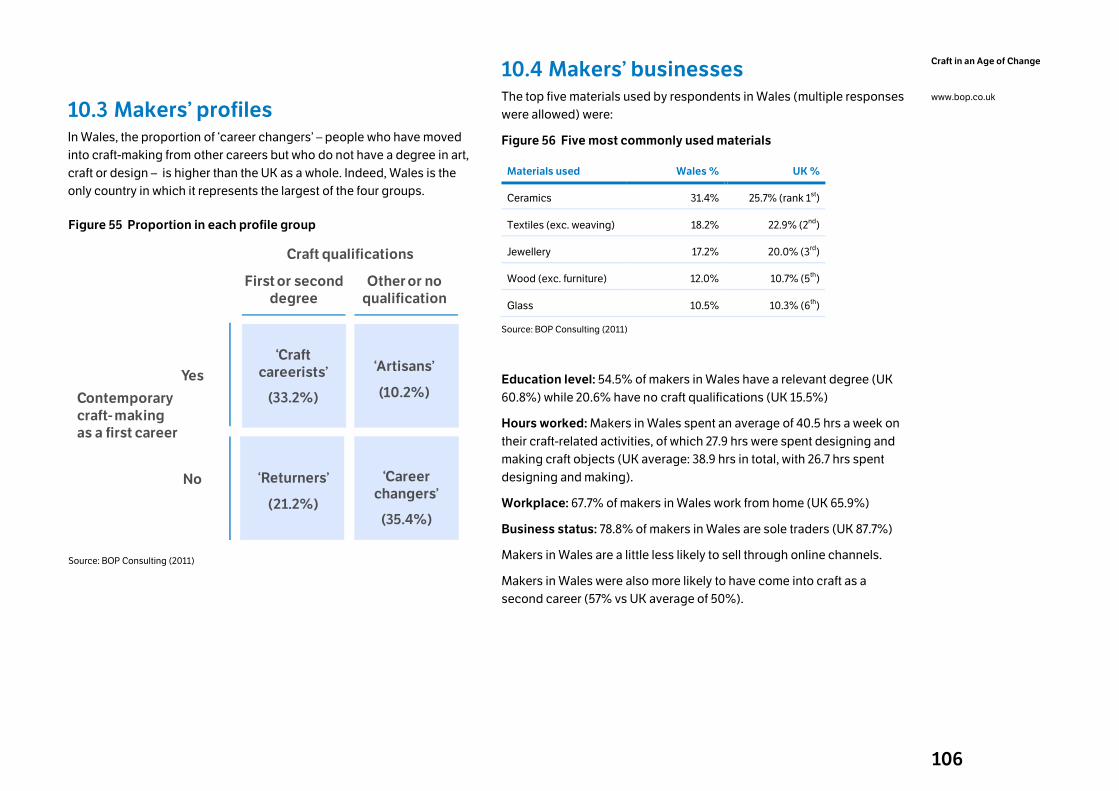
106
Craft in an Age of Change
www.bop.co.uk
10.3 Makers’ profiles In Wales, the proportion of ‘career changers’ – people who have moved
into craft-making from other careers but who do not have a degree in art,
craft or design – is higher than the UK as a whole. Indeed, Wales is the
only country in which it represents the largest of the four groups.
Figure 55 Proportion in each profile group
Craft qualifications
First or second
degree
Other or no
qualification
Contemporary
craft-making
as a first career
Yes
No
‘Craft
careerists’
(33.2%)
‘Artisans’
(10.2%)
‘Returners’
(21.2%)
‘Career
changers’
(35.4%)
Source: BOP Consulting (2011)
10.4 Makers’ businesses The top five materials used by respondents in Wales (multiple responses
were allowed) were:
Figure 56 Five most commonly used materials
Materials used Wales % UK %
Ceramics 31.4% 25.7% (rank 1st)
Textiles (exc. weaving) 18.2% 22.9% (2nd)
Jewellery 17.2% 20.0% (3rd)
Wood (exc. furniture) 12.0% 10.7% (5th)
Glass 10.5% 10.3% (6th)
Source: BOP Consulting (2011)
Education level: 54.5% of makers in Wales have a relevant degree (UK
60.8%) while 20.6% have no craft qualifications (UK 15.5%)
Hours worked: Makers in Wales spent an average of 40.5 hrs a week on
their craft-related activities, of which 27.9 hrs were spent designing and
making craft objects (UK average: 38.9 hrs in total, with 26.7 hrs spent
designing and making).
Workplace: 67.7% of makers in Wales work from home (UK 65.9%)
Business status: 78.8% of makers in Wales are sole traders (UK 87.7%)
Makers in Wales are a little less likely to sell through online channels.
Makers in Wales were also more likely to have come into craft as a
second career (57% vs UK average of 50%).
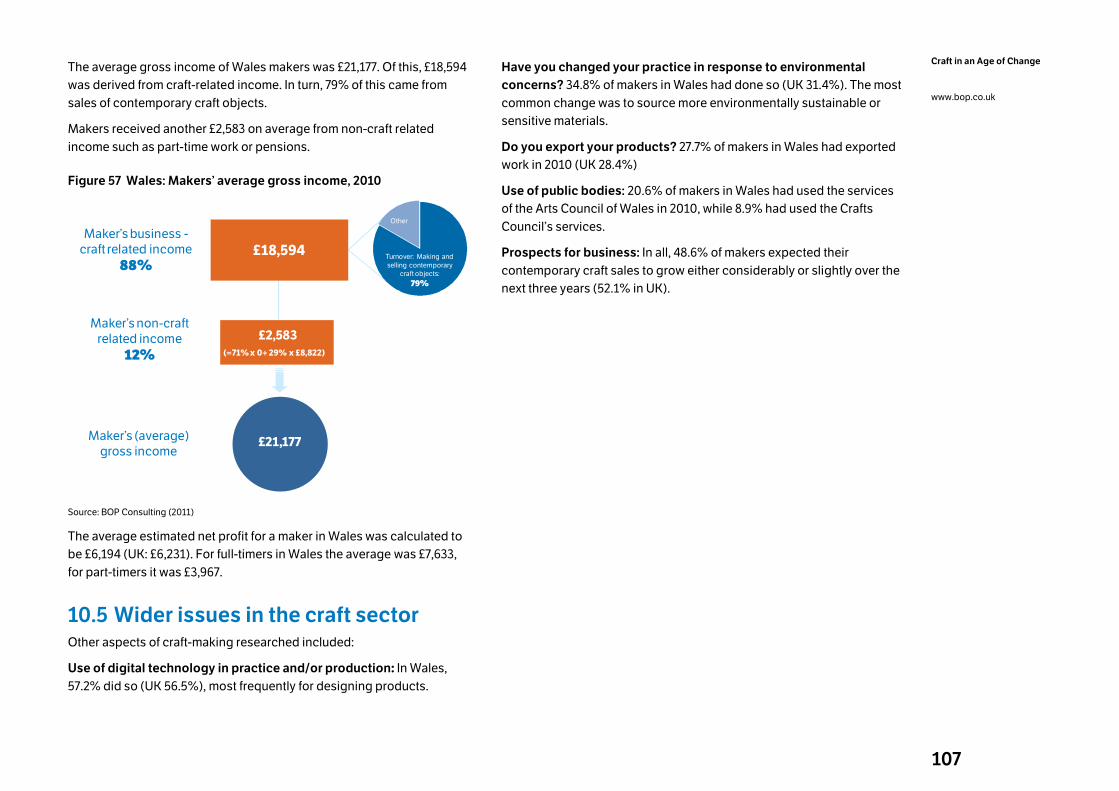
107
Craft in an Age of Change
www.bop.co.uk
The average gross income of Wales makers was £21,177. Of this, £18,594
was derived from craft-related income. In turn, 79% of this came from
sales of contemporary craft objects.
Makers received another £2,583 on average from non-craft related
income such as part-time work or pensions.
Figure 57 Wales: Makers’ average gross income, 2010
£21,177
Maker’s business -craft related income
88%
Maker’s non-craft related income
12%
£18,594
£2,583
(=71% x 0+ 29% x £8,822)
Turnover: Making and
selling contemporary craft objects:
79%
Other
Maker’s (average) gross income
Source: BOP Consulting (2011)
The average estimated net profit for a maker in Wales was calculated to
be £6,194 (UK: £6,231). For full-timers in Wales the average was £7,633,
for part-timers it was £3,967.
10.5 Wider issues in the craft sector Other aspects of craft-making researched included:
Use of digital technology in practice and/or production: In Wales,
57.2% did so (UK 56.5%), most frequently for designing products.
Have you changed your practice in response to environmental
concerns? 34.8% of makers in Wales had done so (UK 31.4%). The most
common change was to source more environmentally sustainable or
sensitive materials.
Do you export your products? 27.7% of makers in Wales had exported
work in 2010 (UK 28.4%)
Use of public bodies: 20.6% of makers in Wales had used the services
of the Arts Council of Wales in 2010, while 8.9% had used the Crafts
Council’s services.
Prospects for business: In all, 48.6% of makers expected their
contemporary craft sales to grow either considerably or slightly over the
next three years (52.1% in UK).
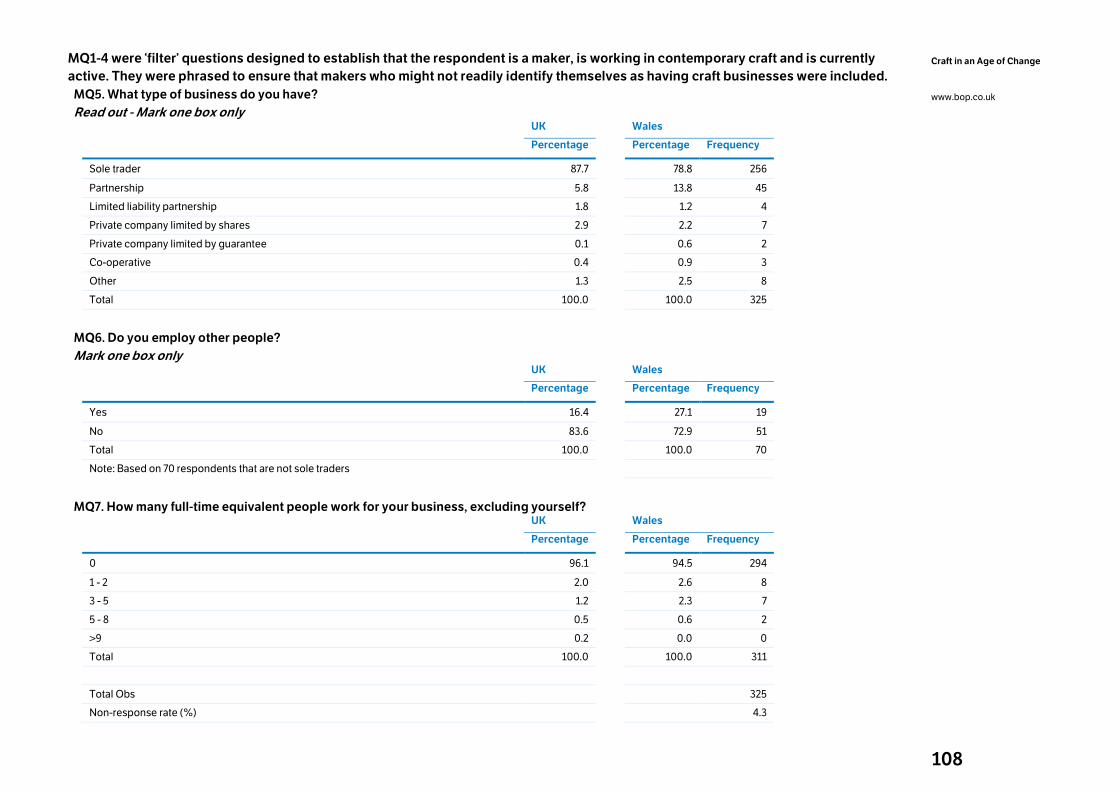
108
Craft in an Age of Change
www.bop.co.uk
MQ1-4 were ‘filter’ questions designed to establish that the respondent is a maker, is working in contemporary craft and is currently
active. They were phrased to ensure that makers who might not readily identify themselves as having craft businesses were included.
MQ5. What type of business do you have?
Read out - Mark one box only
UK Wales
Percentage Percentage Frequency
Sole trader 87.7 78.8 256
Partnership 5.8 13.8 45
Limited liability partnership 1.8 1.2 4
Private company limited by shares 2.9 2.2 7
Private company limited by guarantee 0.1 0.6 2
Co-operative 0.4 0.9 3
Other 1.3 2.5 8
Total 100.0 100.0 325
MQ6. Do you employ other people?
Mark one box only
UK Wales
Percentage Percentage Frequency
Yes 16.4 27.1 19
No 83.6 72.9 51
Total 100.0 100.0 70
Note: Based on 70 respondents that are not sole traders
MQ7. How many full-time equivalent people work for your business, excluding yourself?
UK
Wales
Percentage Percentage Frequency
0 96.1 94.5 294
1 - 2 2.0 2.6 8
3 - 5 1.2 2.3 7
5 - 8 0.5 0.6 2
>9 0.2 0.0 0
Total 100.0 100.0 311
Total Obs 325
Non-response rate (%) 4.3
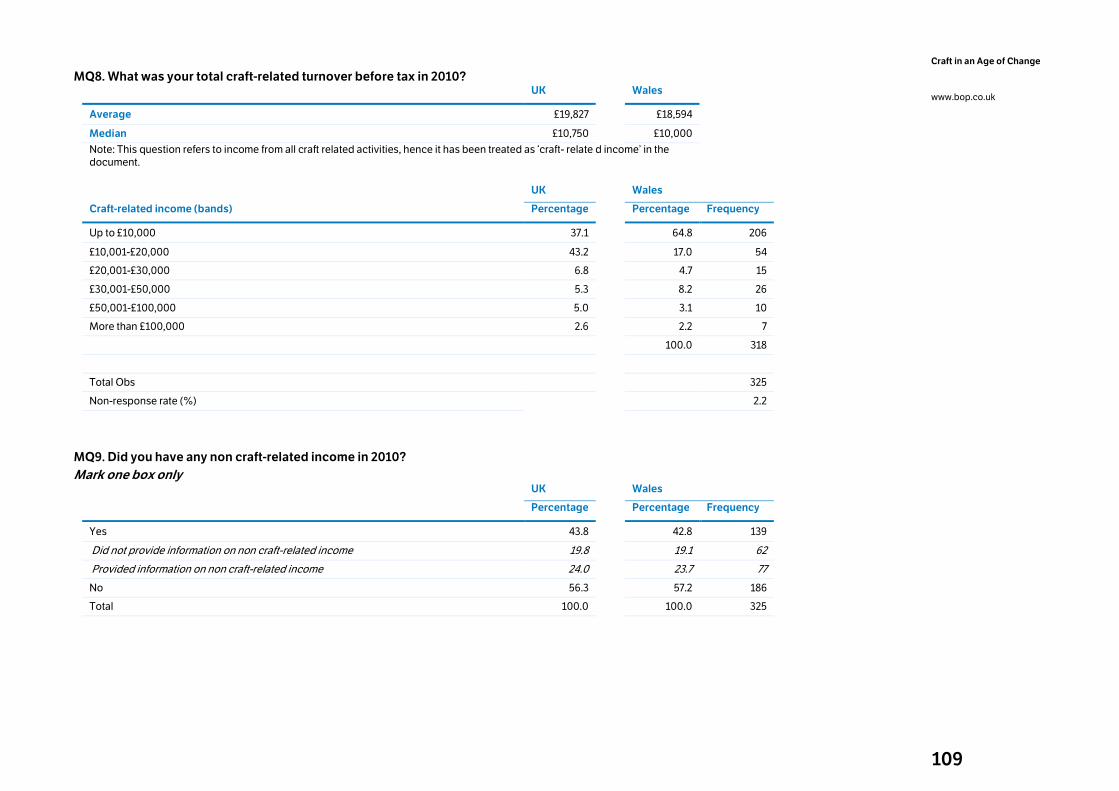
109
Craft in an Age of Change
www.bop.co.uk
MQ8. What was your total craft-related turnover before tax in 2010?
UK Wales
Average £19,827 £18,594
Median £10,750 £10,000
Note: This question refers to income from all craft related activities, hence it has been treated as ‘craft- relate d income’ in the document.
UK
Wales
Craft-related income (bands) Percentage Percentage Frequency
Up to £10,000 37.1 64.8 206
£10,001-£20,000 43.2 17.0 54
£20,001-£30,000 6.8 4.7 15
£30,001-£50,000 5.3 8.2 26
£50,001-£100,000 5.0 3.1 10
More than £100,000 2.6 2.2 7
100.0 318
Total Obs 325
Non-response rate (%) 2.2
MQ9. Did you have any non craft-related income in 2010?
Mark one box only
UK
Wales
Percentage Percentage Frequency
Yes 43.8 42.8 139
Did not provide information on non craft-related income 19.8 19.1 62
Provided information on non craft-related income 24.0 23.7 77
No 56.3 57.2 186
Total 100.0 100.0 325
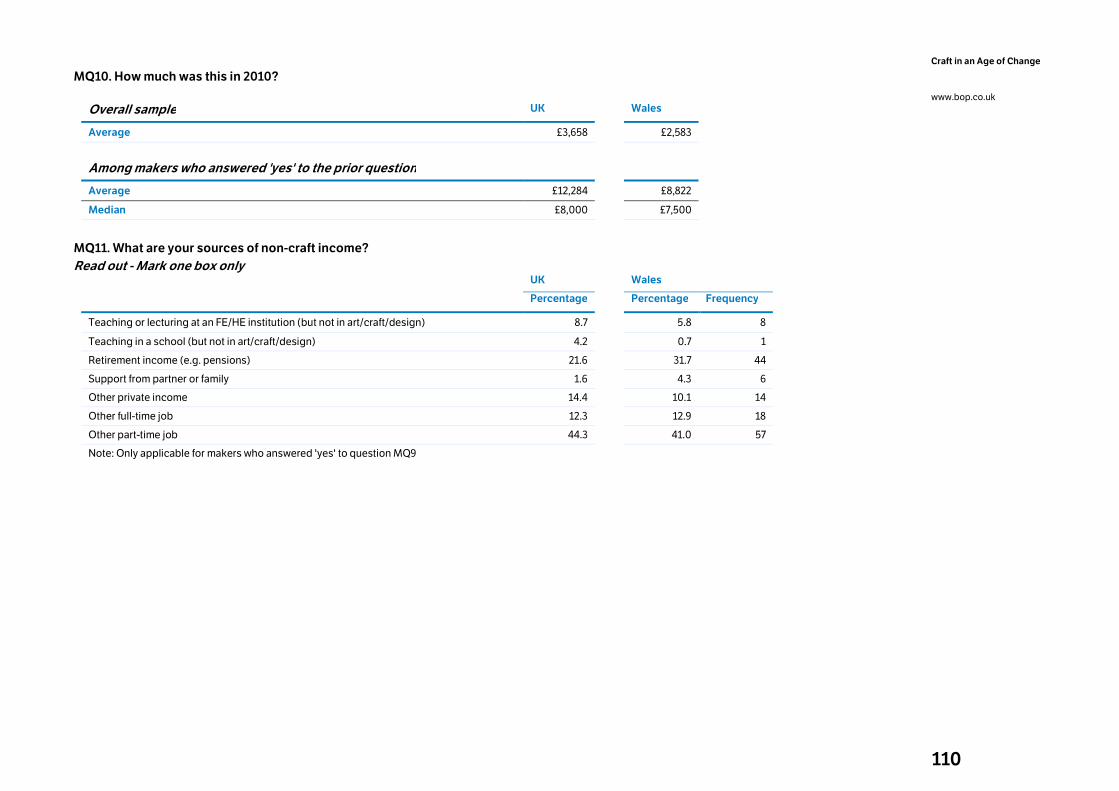
110
Craft in an Age of Change
www.bop.co.uk
MQ10. How much was this in 2010?
Overall sample UK Wales
Average £3,658 £2,583
Among makers who answered 'yes' to the prior question
Average £12,284 £8,822
Median £8,000 £7,500
MQ11. What are your sources of non-craft income?
Read out - Mark one box only
UK
Wales
Percentage Percentage Frequency
Teaching or lecturing at an FE/HE institution (but not in art/craft/design) 8.7 5.8 8
Teaching in a school (but not in art/craft/design) 4.2 0.7 1
Retirement income (e.g. pensions) 21.6 31.7 44
Support from partner or family 1.6 4.3 6
Other private income 14.4 10.1 14
Other full-time job 12.3 12.9 18
Other part-time job 44.3 41.0 57
Note: Only applicable for makers who answered 'yes' to question MQ9
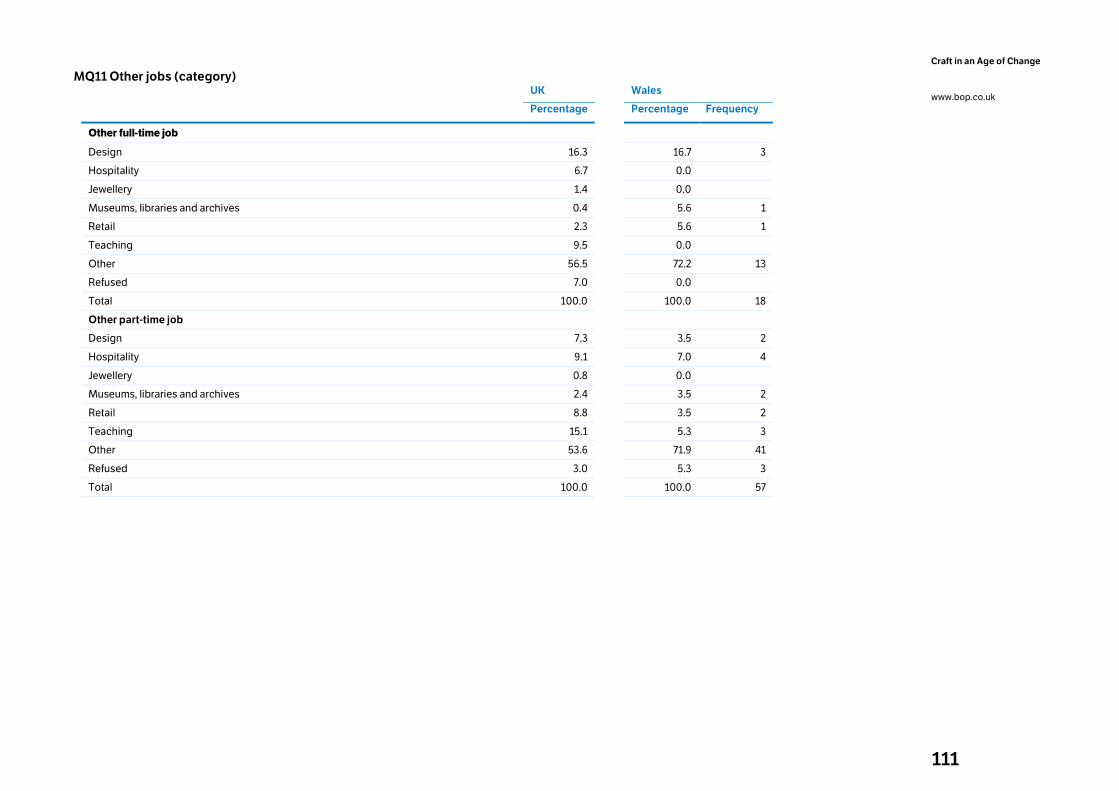
111
Craft in an Age of Change
www.bop.co.uk
MQ11 Other jobs (category)
UK Wales
Percentage Percentage Frequency
Other full-time job
Design 16.3 16.7 3
Hospitality 6.7 0.0
Jewellery 1.4 0.0
Museums, libraries and archives 0.4 5.6 1
Retail 2.3 5.6 1
Teaching 9.5 0.0
Other 56.5 72.2 13
Refused 7.0 0.0
Total 100.0 100.0 18
Other part-time job
Design 7.3 3.5 2
Hospitality 9.1 7.0 4
Jewellery 0.8 0.0
Museums, libraries and archives 2.4 3.5 2
Retail 8.8 3.5 2
Teaching 15.1 5.3 3
Other 53.6 71.9 41
Refused 3.0 5.3 3
Total 100.0 100.0 57

112
Craft in an Age of Change
www.bop.co.uk
MQ12a. What type of craft related activities do you undertake?
Read out - Mark all that apply
UK
Wales
Percentage Percentage Frequency
Making and selling contemporary craft objects 95.8 96.0 312
Making and selling heritage craft objects 3.6 6.5 21
Teaching or lecturing in art/craft/design at an FE/HE institution 12.3 12.3 40
Teaching art/craft/design in a school 7.2 7.4 24
Teaching craft to less formal groups e.g. evening classes, workshops 26.1 27.4 89
Writing professionally about craft 4.5 4.0 13
Being a craft-maker in residence 1.8 4.0 13
Work for other business or sectors using craft skills and knowledge 3.8 4.9 16
Owning, running or working in a commercial gallery or craft shop 3.8 9.8 32
Working in a public museum or gallery (including in the museum shop) 1.8 3.1 10
Running or organising craft events such as exhibitions or fairs 4.7 8.6 28
Curating exhibitions 2.8 3.7 12
Other craft-related activity 5.7 6.2 20
Note: Percentages for Wales based on 325 respondents
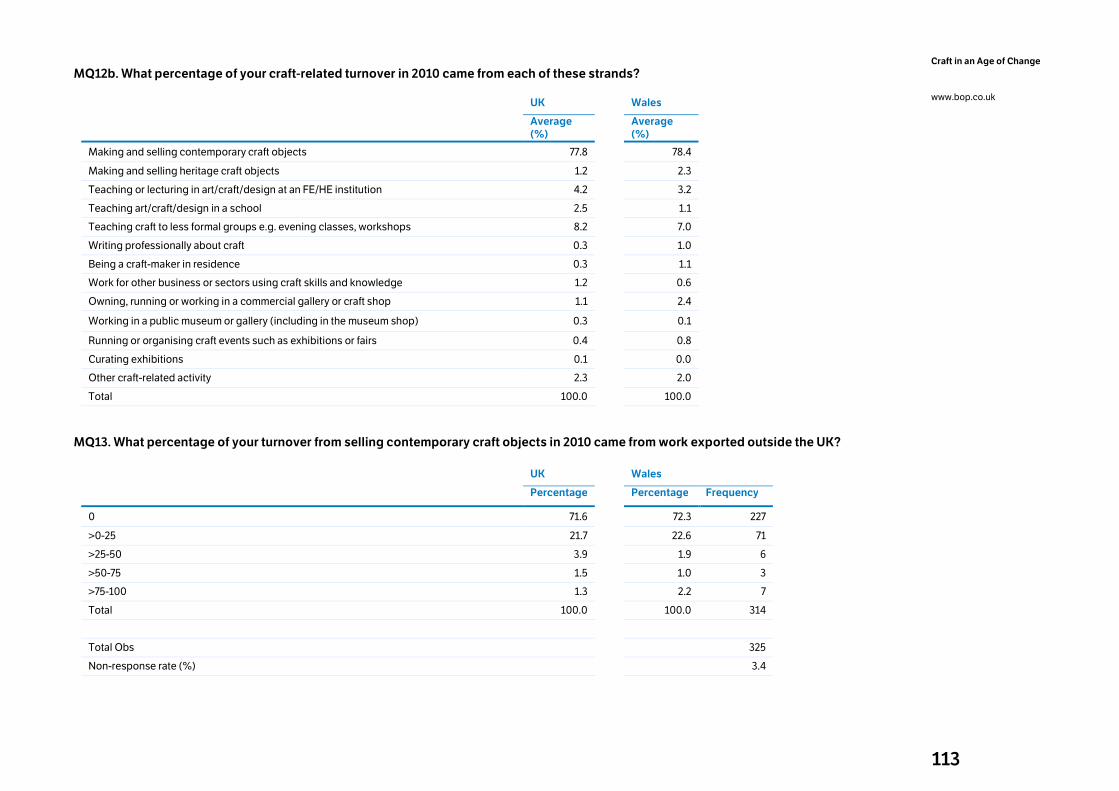
113
Craft in an Age of Change
www.bop.co.uk
MQ12b. What percentage of your craft-related turnover in 2010 came from each of these strands?
UK
Wales
Average
(%) Average
(%)
Making and selling contemporary craft objects 77.8 78.4
Making and selling heritage craft objects 1.2 2.3
Teaching or lecturing in art/craft/design at an FE/HE institution 4.2 3.2
Teaching art/craft/design in a school 2.5 1.1
Teaching craft to less formal groups e.g. evening classes, workshops 8.2 7.0
Writing professionally about craft 0.3 1.0
Being a craft-maker in residence 0.3 1.1
Work for other business or sectors using craft skills and knowledge 1.2 0.6
Owning, running or working in a commercial gallery or craft shop 1.1 2.4
Working in a public museum or gallery (including in the museum shop) 0.3 0.1
Running or organising craft events such as exhibitions or fairs 0.4 0.8
Curating exhibitions 0.1 0.0
Other craft-related activity 2.3 2.0
Total 100.0 100.0
MQ13. What percentage of your turnover from selling contemporary craft objects in 2010 came from work exported outside the UK?
UK
Wales
Percentage Percentage Frequency
0 71.6 72.3 227
>0-25 21.7 22.6 71
>25-50 3.9 1.9 6
>50-75 1.5 1.0 3
>75-100 1.3 2.2 7
Total 100.0 100.0 314
Total Obs 325
Non-response rate (%) 3.4
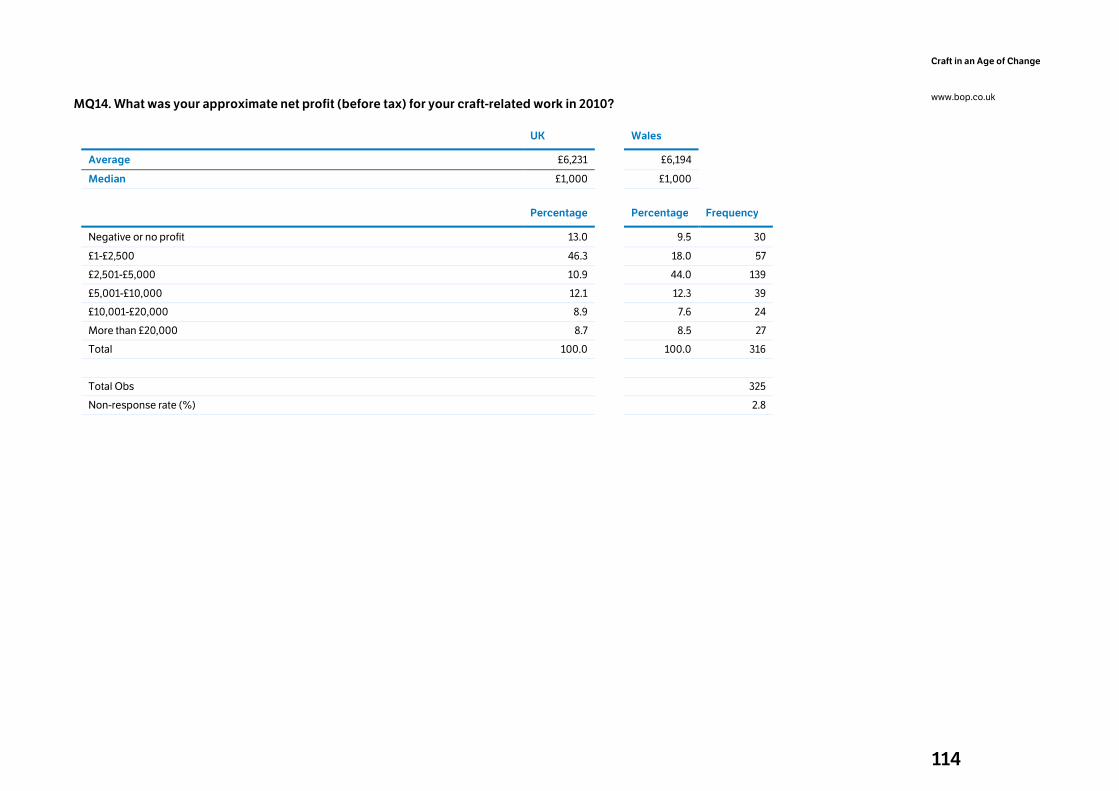
114
Craft in an Age of Change
www.bop.co.uk
MQ14. What was your approximate net profit (before tax) for your craft-related work in 2010?
UK Wales
Average £6,231 £6,194
Median £1,000 £1,000
Percentage Percentage Frequency
Negative or no profit 13.0 9.5 30
£1-£2,500 46.3 18.0 57
£2,501-£5,000 10.9 44.0 139
£5,001-£10,000 12.1 12.3 39
£10,001-£20,000 8.9 7.6 24
More than £20,000 8.7 8.5 27
Total 100.0 100.0 316
Total Obs 325
Non-response rate (%) 2.8
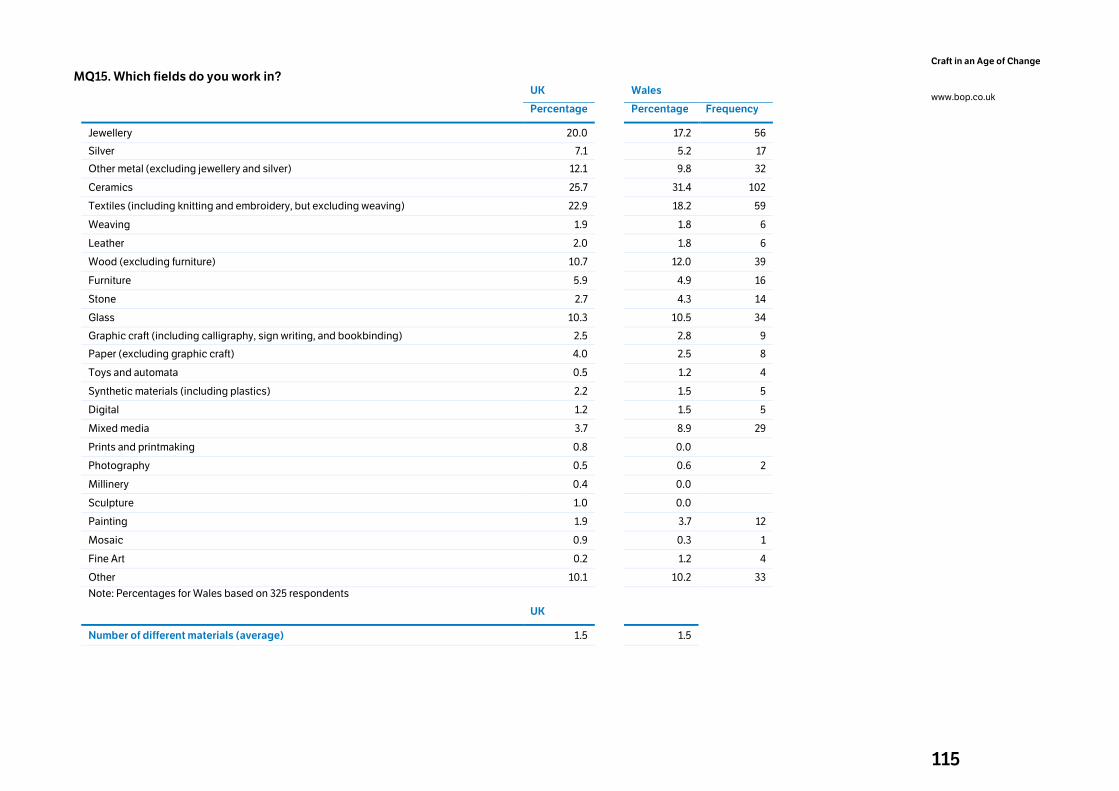
115
Craft in an Age of Change
www.bop.co.uk
MQ15. Which fields do you work in?
UK Wales
Percentage Percentage Frequency
Jewellery 20.0 17.2 56
Silver 7.1 5.2 17
Other metal (excluding jewellery and silver) 12.1 9.8 32
Ceramics 25.7 31.4 102
Textiles (including knitting and embroidery, but excluding weaving) 22.9 18.2 59
Weaving 1.9 1.8 6
Leather 2.0 1.8 6
Wood (excluding furniture) 10.7 12.0 39
Furniture 5.9 4.9 16
Stone 2.7 4.3 14
Glass 10.3 10.5 34
Graphic craft (including calligraphy, sign writing, and bookbinding) 2.5 2.8 9
Paper (excluding graphic craft) 4.0 2.5 8
Toys and automata 0.5 1.2 4
Synthetic materials (including plastics) 2.2 1.5 5
Digital 1.2 1.5 5
Mixed media 3.7 8.9 29
Prints and printmaking 0.8 0.0
Photography 0.5 0.6 2
Millinery 0.4 0.0
Sculpture 1.0 0.0
Painting 1.9 3.7 12
Mosaic 0.9 0.3 1
Fine Art 0.2 1.2 4
Other 10.1 10.2 33
Note: Percentages for Wales based on 325 respondents
UK
Number of different materials (average) 1.5 1.5
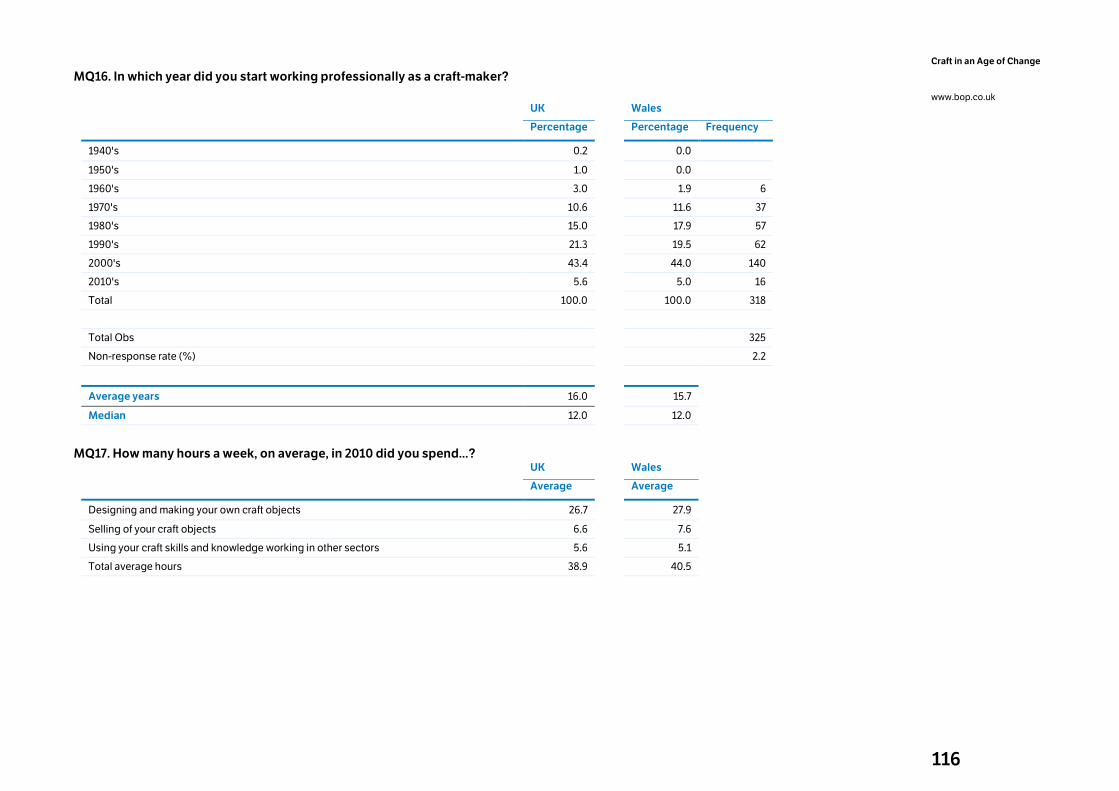
116
Craft in an Age of Change
www.bop.co.uk
MQ16. In which year did you start working professionally as a craft-maker?
UK
Wales
Percentage Percentage Frequency
1940's 0.2 0.0
1950's 1.0 0.0
1960's 3.0 1.9 6
1970's 10.6 11.6 37
1980's 15.0 17.9 57
1990's 21.3 19.5 62
2000's 43.4 44.0 140
2010's 5.6 5.0 16
Total 100.0 100.0 318
Total Obs 325
Non-response rate (%) 2.2
Average years 16.0 15.7
Median 12.0 12.0
MQ17. How many hours a week, on average, in 2010 did you spend...?
UK
Wales
Average Average
Designing and making your own craft objects 26.7 27.9
Selling of your craft objects 6.6 7.6
Using your craft skills and knowledge working in other sectors 5.6 5.1
Total average hours 38.9 40.5

117
Craft in an Age of Change
www.bop.co.uk
MQ18. Where do you primarily carry out your craft practice?
UK Wales
Percentage Percentage Frequency
Space in room(s) in own home 21.3 20.0 65
Formal workshop on home premises 44.6 47.7 155
Individual workspace (away from home): rented 17.3 15.4 50
Individual workspace (away from home): owned 3.5 4.0 13
Shared workspace: rented 7.7 4.6 15
Shared workspace: owned 0.7 0.3 1
Client’s site (inc. manufacturer’s premises) 0.9 1.5 5
School or FE institution 1.1 1.2 4
HE institution or fabrication lab 0.5 0.6 2
Other 2.5 4.6 15
Total 100.0 100.0 325
MQ19. Do you rent space within dedicated artists’ studios?
Mark one box only
UK Wales
Percentage Percentage Frequency
Yes 56.4 46.2 30
No 43.6 53.8 35
Total 100.0 100.0 65
Note: Applicable to those makers who rent an individual or shared workspace, according to the prior question
MQ20. How much did you spend approximately in 2010 on buying materials, goods and supplies from other companies,
including business services such as design and marketing?
UK
Wales
Average £5,287 £4,974
Median £2,500 £2,000
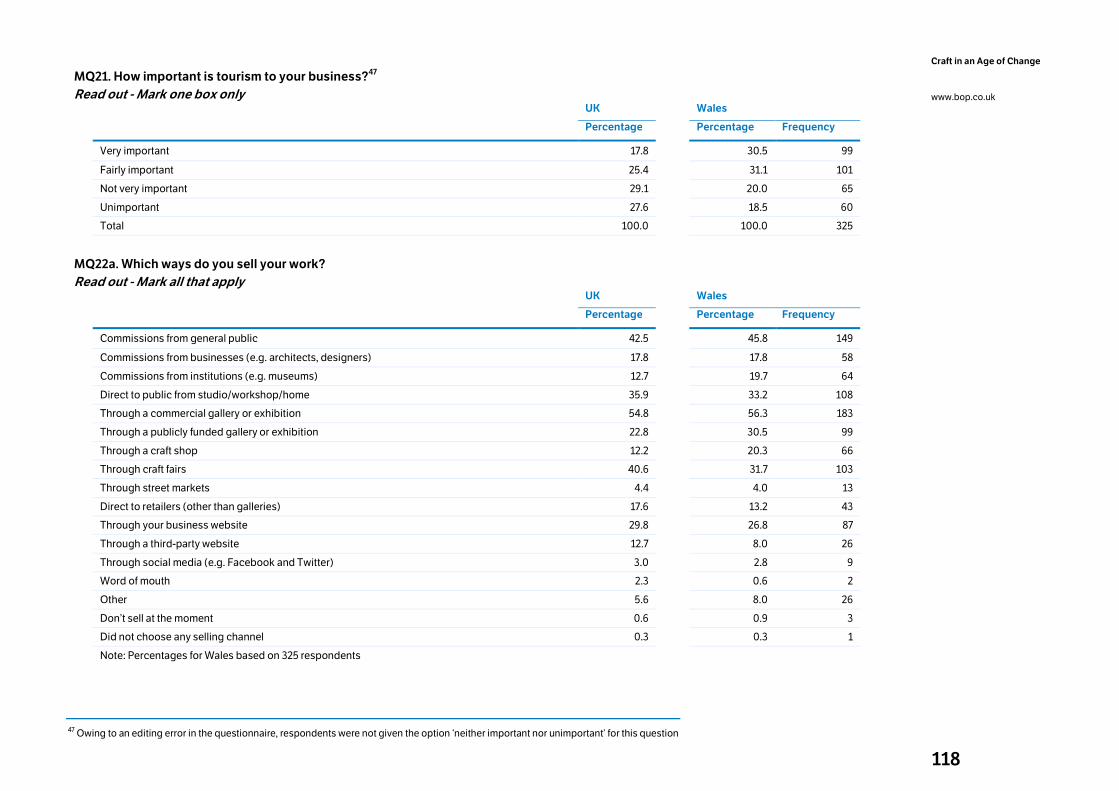
118
Craft in an Age of Change
www.bop.co.uk
MQ21. How important is tourism to your business?47
Read out - Mark one box only
UK
Wales
Percentage Percentage Frequency
Very important 17.8 30.5 99
Fairly important 25.4 31.1 101
Not very important 29.1 20.0 65
Unimportant 27.6 18.5 60
Total 100.0 100.0 325
MQ22a. Which ways do you sell your work?
Read out - Mark all that apply
UK
Wales
Percentage Percentage Frequency
Commissions from general public 42.5 45.8 149
Commissions from businesses (e.g. architects, designers) 17.8 17.8 58
Commissions from institutions (e.g. museums) 12.7 19.7 64
Direct to public from studio/workshop/home 35.9 33.2 108
Through a commercial gallery or exhibition 54.8 56.3 183
Through a publicly funded gallery or exhibition 22.8 30.5 99
Through a craft shop 12.2 20.3 66
Through craft fairs 40.6 31.7 103
Through street markets 4.4 4.0 13
Direct to retailers (other than galleries) 17.6 13.2 43
Through your business website 29.8 26.8 87
Through a third-party website 12.7 8.0 26
Through social media (e.g. Facebook and Twitter) 3.0 2.8 9
Word of mouth 2.3 0.6 2
Other 5.6 8.0 26
Don’t sell at the moment 0.6 0.9 3
Did not choose any selling channel 0.3 0.3 1
Note: Percentages for Wales based on 325 respondents
47 Owing to an editing error in the questionnaire, respondents were not given the option ‘neither important nor unimportant’ for this question
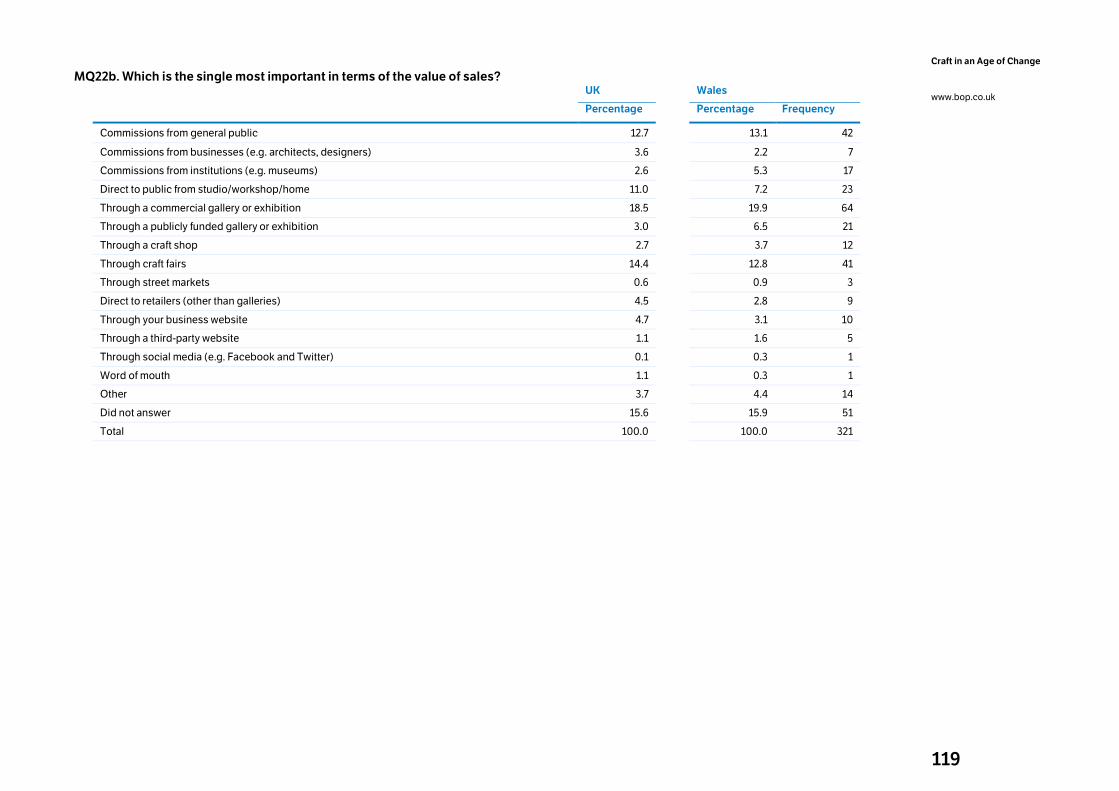
119
Craft in an Age of Change
www.bop.co.uk
MQ22b. Which is the single most important in terms of the value of sales?
UK Wales
Percentage Percentage Frequency
Commissions from general public 12.7 13.1 42
Commissions from businesses (e.g. architects, designers) 3.6 2.2 7
Commissions from institutions (e.g. museums) 2.6 5.3 17
Direct to public from studio/workshop/home 11.0 7.2 23
Through a commercial gallery or exhibition 18.5 19.9 64
Through a publicly funded gallery or exhibition 3.0 6.5 21
Through a craft shop 2.7 3.7 12
Through craft fairs 14.4 12.8 41
Through street markets 0.6 0.9 3
Direct to retailers (other than galleries) 4.5 2.8 9
Through your business website 4.7 3.1 10
Through a third-party website 1.1 1.6 5
Through social media (e.g. Facebook and Twitter) 0.1 0.3 1
Word of mouth 1.1 0.3 1
Other 3.7 4.4 14
Did not answer 15.6 15.9 51
Total 100.0 100.0 321
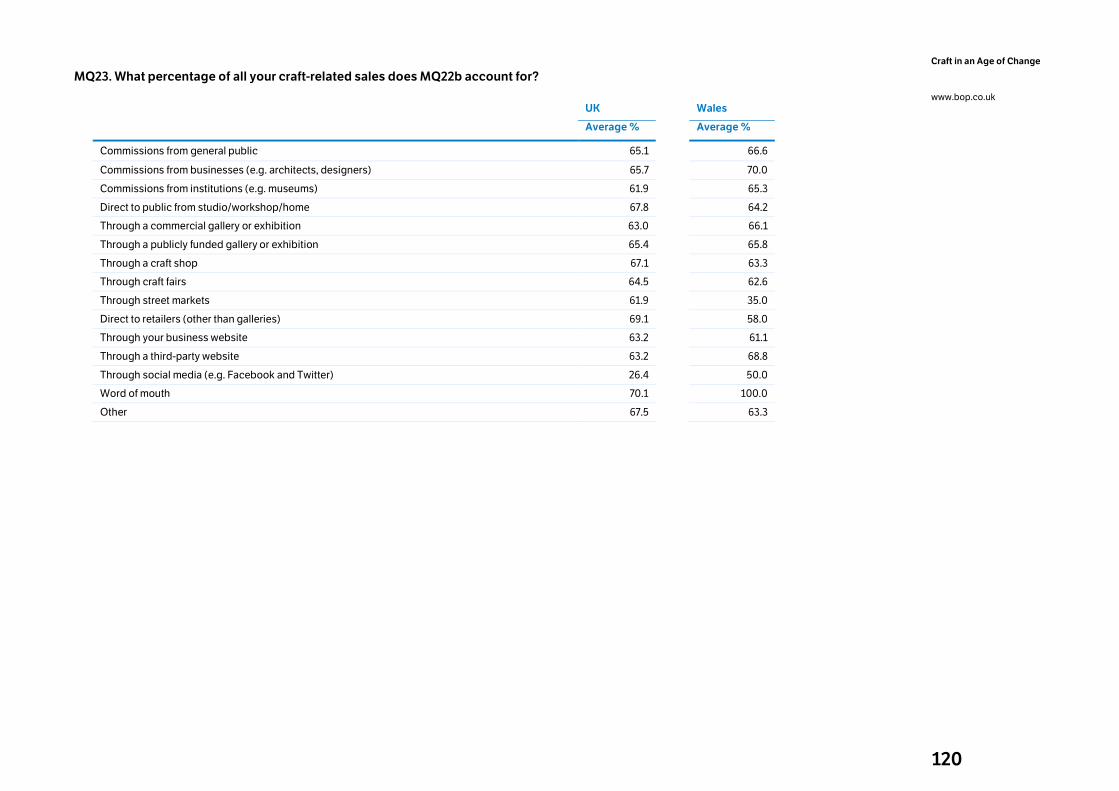
120
Craft in an Age of Change
www.bop.co.uk
MQ23. What percentage of all your craft-related sales does MQ22b account for?
UK
Wales
Average % Average %
Commissions from general public 65.1 66.6
Commissions from businesses (e.g. architects, designers) 65.7 70.0
Commissions from institutions (e.g. museums) 61.9 65.3
Direct to public from studio/workshop/home 67.8 64.2
Through a commercial gallery or exhibition 63.0 66.1
Through a publicly funded gallery or exhibition 65.4 65.8
Through a craft shop 67.1 63.3
Through craft fairs 64.5 62.6
Through street markets 61.9 35.0
Direct to retailers (other than galleries) 69.1 58.0
Through your business website 63.2 61.1
Through a third-party website 63.2 68.8
Through social media (e.g. Facebook and Twitter) 26.4 50.0
Word of mouth 70.1 100.0
Other 67.5 63.3
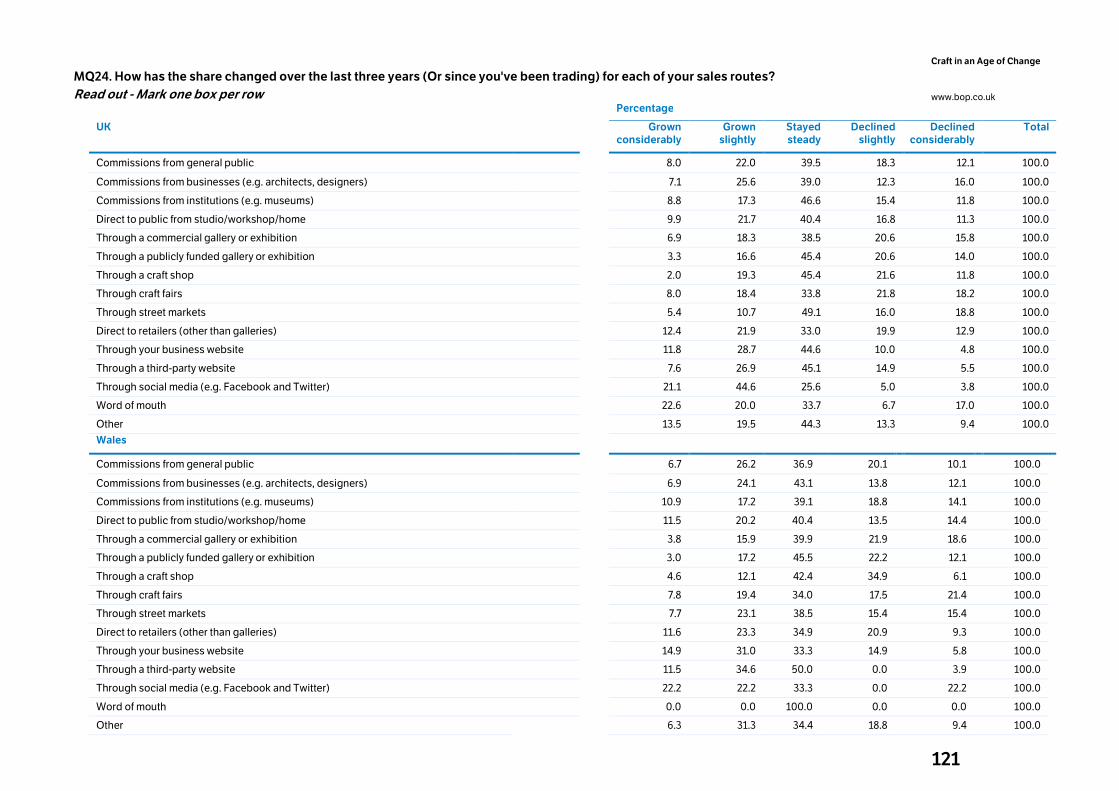
121
Craft in an Age of Change
www.bop.co.uk
MQ24. How has the share changed over the last three years (Or since you've been trading) for each of your sales routes?
Read out - Mark one box per row
Percentage
UK Grown considerably
Grown slightly
Stayed steady
Declined slightly
Declined considerably
Total
Commissions from general public 8.0 22.0 39.5 18.3 12.1 100.0
Commissions from businesses (e.g. architects, designers) 7.1 25.6 39.0 12.3 16.0 100.0
Commissions from institutions (e.g. museums) 8.8 17.3 46.6 15.4 11.8 100.0
Direct to public from studio/workshop/home 9.9 21.7 40.4 16.8 11.3 100.0
Through a commercial gallery or exhibition 6.9 18.3 38.5 20.6 15.8 100.0
Through a publicly funded gallery or exhibition 3.3 16.6 45.4 20.6 14.0 100.0
Through a craft shop 2.0 19.3 45.4 21.6 11.8 100.0
Through craft fairs 8.0 18.4 33.8 21.8 18.2 100.0
Through street markets 5.4 10.7 49.1 16.0 18.8 100.0
Direct to retailers (other than galleries) 12.4 21.9 33.0 19.9 12.9 100.0
Through your business website 11.8 28.7 44.6 10.0 4.8 100.0
Through a third-party website 7.6 26.9 45.1 14.9 5.5 100.0
Through social media (e.g. Facebook and Twitter) 21.1 44.6 25.6 5.0 3.8 100.0
Word of mouth 22.6 20.0 33.7 6.7 17.0 100.0
Other 13.5 19.5 44.3 13.3 9.4 100.0
Wales
Commissions from general public 6.7 26.2 36.9 20.1 10.1 100.0
Commissions from businesses (e.g. architects, designers) 6.9 24.1 43.1 13.8 12.1 100.0
Commissions from institutions (e.g. museums) 10.9 17.2 39.1 18.8 14.1 100.0
Direct to public from studio/workshop/home 11.5 20.2 40.4 13.5 14.4 100.0
Through a commercial gallery or exhibition 3.8 15.9 39.9 21.9 18.6 100.0
Through a publicly funded gallery or exhibition 3.0 17.2 45.5 22.2 12.1 100.0
Through a craft shop 4.6 12.1 42.4 34.9 6.1 100.0
Through craft fairs 7.8 19.4 34.0 17.5 21.4 100.0
Through street markets 7.7 23.1 38.5 15.4 15.4 100.0
Direct to retailers (other than galleries) 11.6 23.3 34.9 20.9 9.3 100.0
Through your business website 14.9 31.0 33.3 14.9 5.8 100.0
Through a third-party website 11.5 34.6 50.0 0.0 3.9 100.0
Through social media (e.g. Facebook and Twitter) 22.2 22.2 33.3 0.0 22.2 100.0
Word of mouth 0.0 0.0 100.0 0.0 0.0 100.0
Other 6.3 31.3 34.4 18.8 9.4 100.0
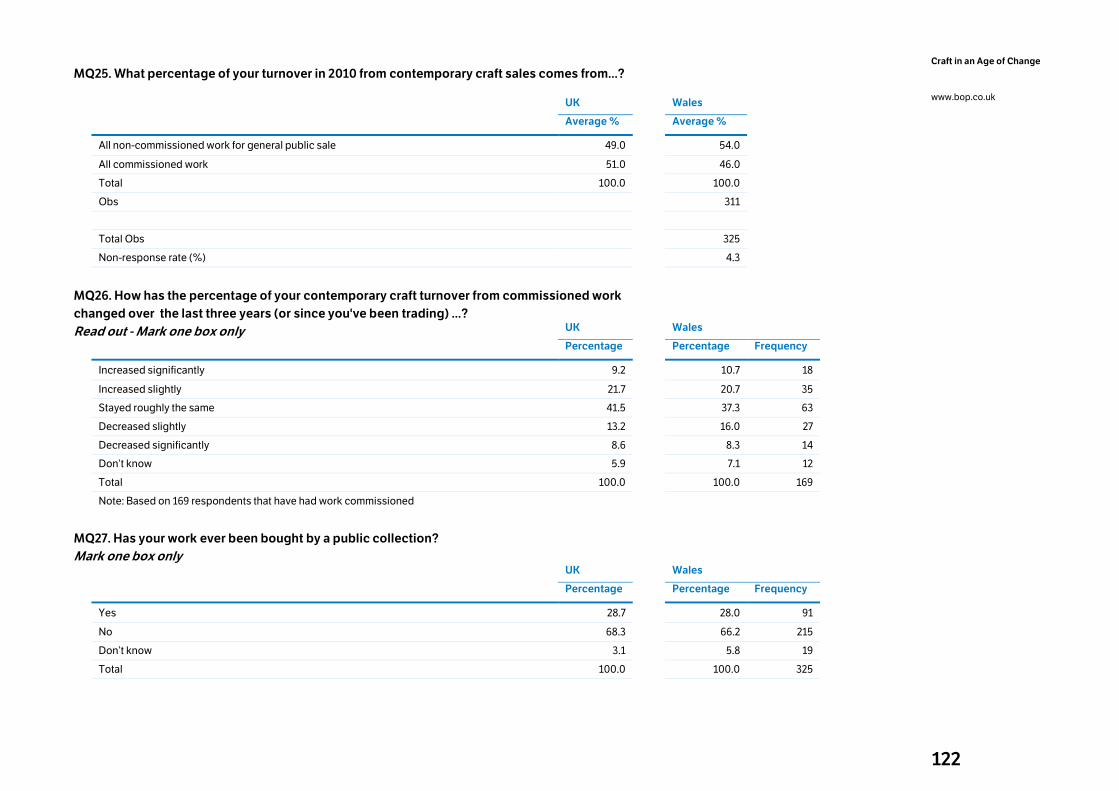
122
Craft in an Age of Change
www.bop.co.uk
MQ25. What percentage of your turnover in 2010 from contemporary craft sales comes from...?
UK
Wales
Average % Average %
All non-commissioned work for general public sale 49.0 54.0
All commissioned work 51.0 46.0
Total 100.0 100.0
Obs 311
Total Obs 325
Non-response rate (%) 4.3
MQ26. How has the percentage of your contemporary craft turnover from commissioned work
changed over the last three years (or since you've been trading) ...?
Read out - Mark one box only UK
Wales
Percentage Percentage Frequency
Increased significantly 9.2 10.7 18
Increased slightly 21.7 20.7 35
Stayed roughly the same 41.5 37.3 63
Decreased slightly 13.2 16.0 27
Decreased significantly 8.6 8.3 14
Don’t know 5.9 7.1 12
Total 100.0 100.0 169
Note: Based on 169 respondents that have had work commissioned
MQ27. Has your work ever been bought by a public collection?
Mark one box only
UK
Wales
Percentage Percentage Frequency
Yes 28.7 28.0 91
No 68.3 66.2 215
Don’t know 3.1 5.8 19
Total 100.0 100.0 325
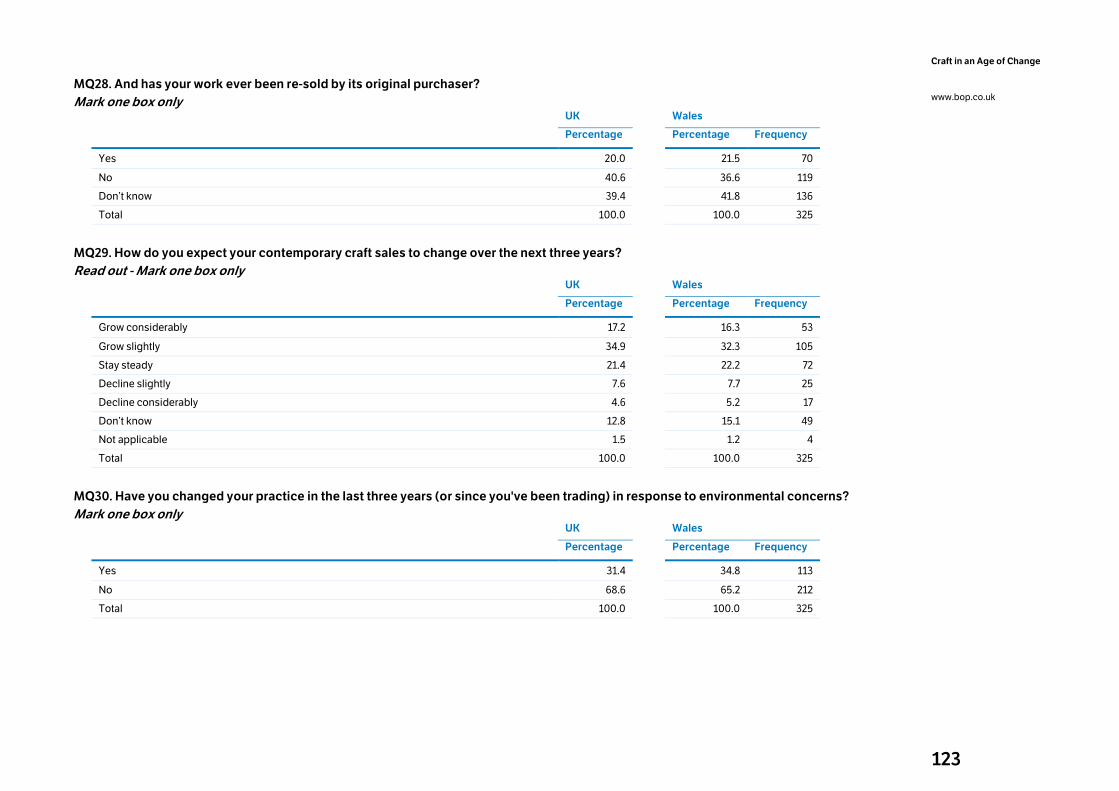
123
Craft in an Age of Change
www.bop.co.uk
MQ28. And has your work ever been re-sold by its original purchaser?
Mark one box only
UK Wales
Percentage Percentage Frequency
Yes 20.0 21.5 70
No 40.6 36.6 119
Don’t know 39.4 41.8 136
Total 100.0 100.0 325
MQ29. How do you expect your contemporary craft sales to change over the next three years?
Read out - Mark one box only
UK Wales
Percentage Percentage Frequency
Grow considerably 17.2 16.3 53
Grow slightly 34.9 32.3 105
Stay steady 21.4 22.2 72
Decline slightly 7.6 7.7 25
Decline considerably 4.6 5.2 17
Don’t know 12.8 15.1 49
Not applicable 1.5 1.2 4
Total 100.0 100.0 325
MQ30. Have you changed your practice in the last three years (or since you've been trading) in response to environmental concerns?
Mark one box only
UK Wales
Percentage Percentage Frequency
Yes 31.4 34.8 113
No 68.6 65.2 212
Total 100.0 100.0 325
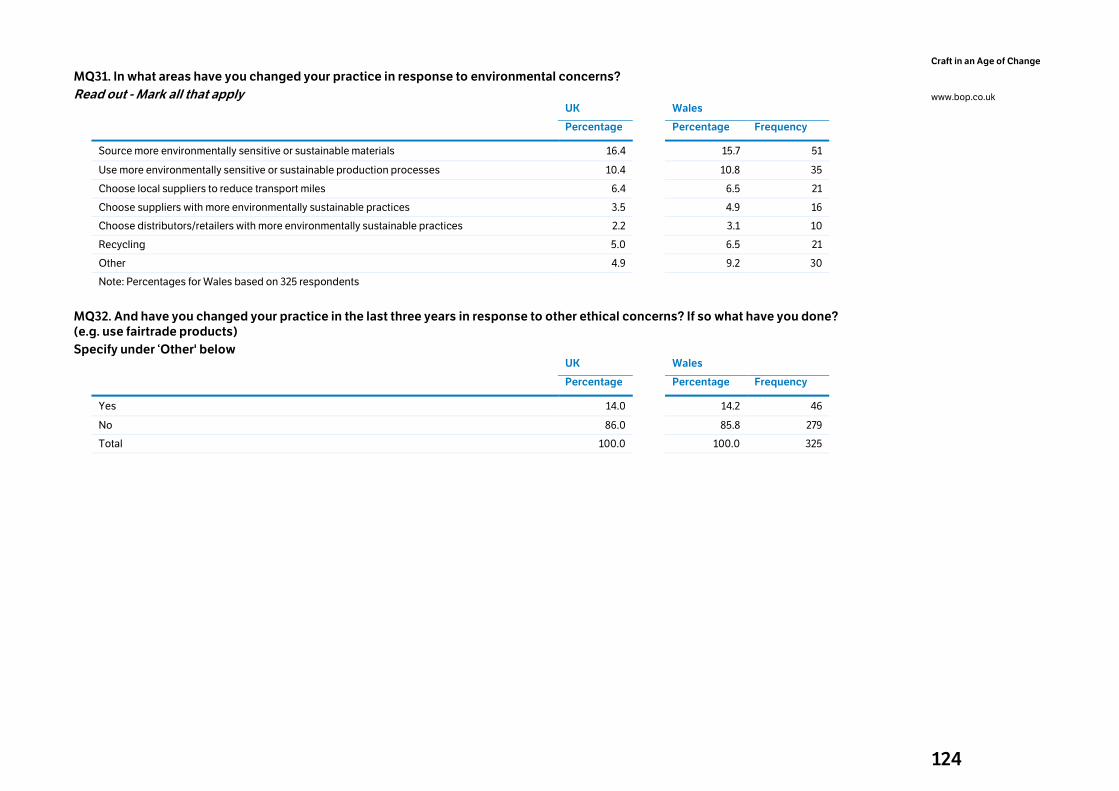
124
Craft in an Age of Change
www.bop.co.uk
MQ31. In what areas have you changed your practice in response to environmental concerns?
Read out - Mark all that apply
UK
Wales
Percentage Percentage Frequency
Source more environmentally sensitive or sustainable materials 16.4 15.7 51
Use more environmentally sensitive or sustainable production processes 10.4 10.8 35
Choose local suppliers to reduce transport miles 6.4 6.5 21
Choose suppliers with more environmentally sustainable practices 3.5 4.9 16
Choose distributors/retailers with more environmentally sustainable practices 2.2 3.1 10
Recycling 5.0 6.5 21
Other 4.9 9.2 30
Note: Percentages for Wales based on 325 respondents
MQ32. And have you changed your practice in the last three years in response to other ethical concerns? If so what have you done?
(e.g. use fairtrade products)
Specify under ‘Other' below
UK
Wales
Percentage Percentage Frequency
Yes 14.0 14.2 46
No 86.0 85.8 279
Total 100.0 100.0 325
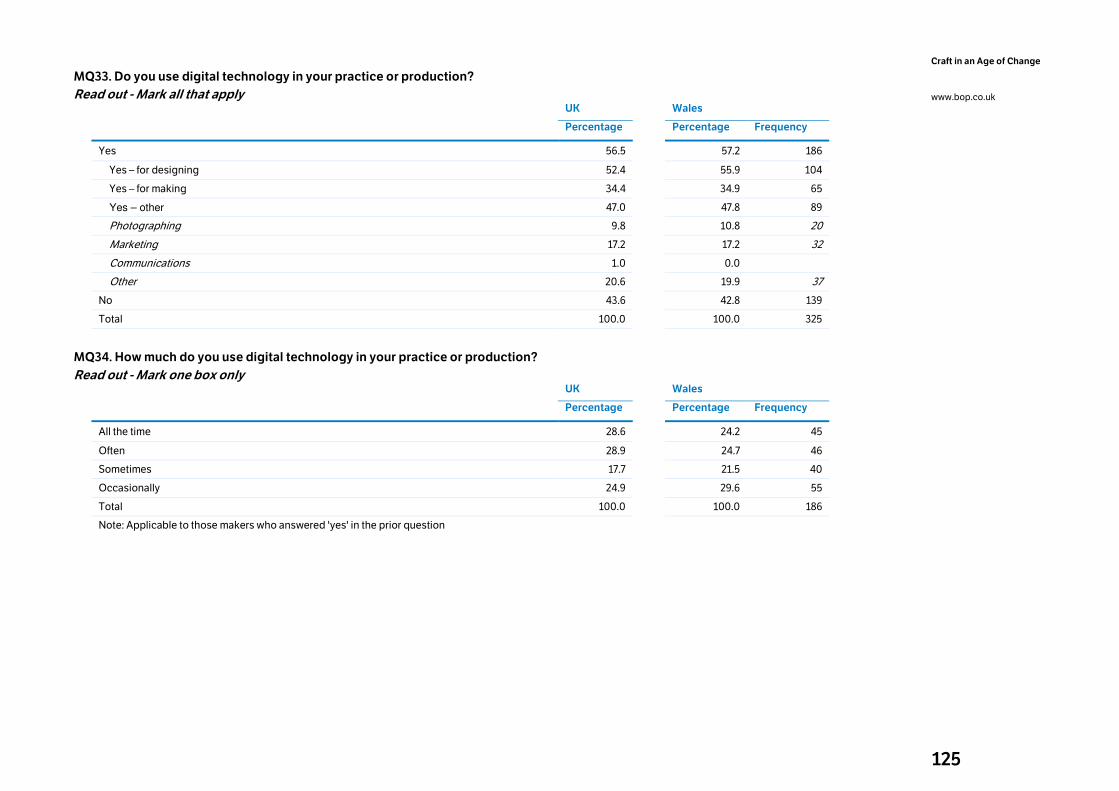
125
Craft in an Age of Change
www.bop.co.uk
MQ33. Do you use digital technology in your practice or production?
Read out - Mark all that apply
UK
Wales
Percentage Percentage Frequency
Yes 56.5 57.2 186
Yes – for designing 52.4 55.9 104
Yes – for making 34.4 34.9 65
Yes – other 47.0 47.8 89
Photographing 9.8 10.8 20
Marketing 17.2 17.2 32
Communications 1.0 0.0
Other 20.6 19.9 37
No 43.6 42.8 139
Total 100.0 100.0 325
MQ34. How much do you use digital technology in your practice or production?
Read out - Mark one box only
UK
Wales
Percentage Percentage Frequency
All the time 28.6 24.2 45
Often 28.9 24.7 46
Sometimes 17.7 21.5 40
Occasionally 24.9 29.6 55
Total 100.0 100.0 186
Note: Applicable to those makers who answered 'yes' in the prior question
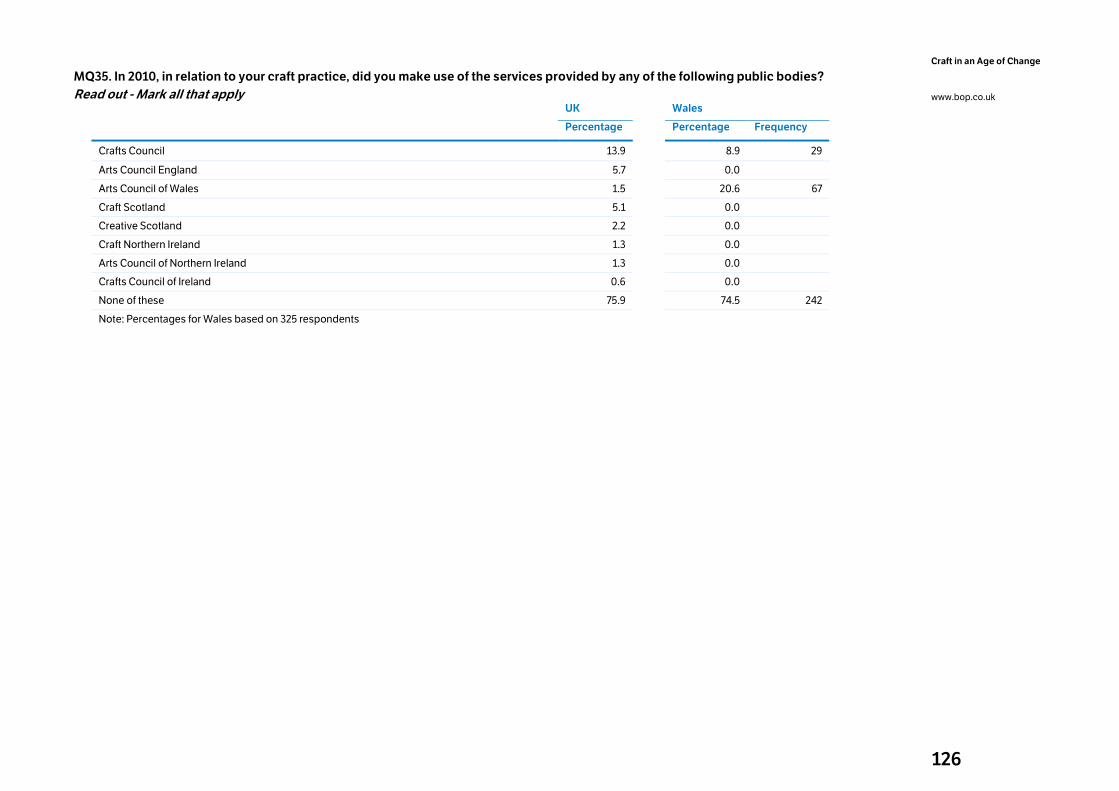
126
Craft in an Age of Change
www.bop.co.uk
MQ35. In 2010, in relation to your craft practice, did you make use of the services provided by any of the following public bodies?
Read out - Mark all that apply
UK
Wales
Percentage Percentage Frequency
Crafts Council 13.9 8.9 29
Arts Council England 5.7 0.0
Arts Council of Wales 1.5 20.6 67
Craft Scotland 5.1 0.0
Creative Scotland 2.2 0.0
Craft Northern Ireland 1.3 0.0
Arts Council of Northern Ireland 1.3 0.0
Crafts Council of Ireland 0.6 0.0
None of these 75.9 74.5 242
Note: Percentages for Wales based on 325 respondents
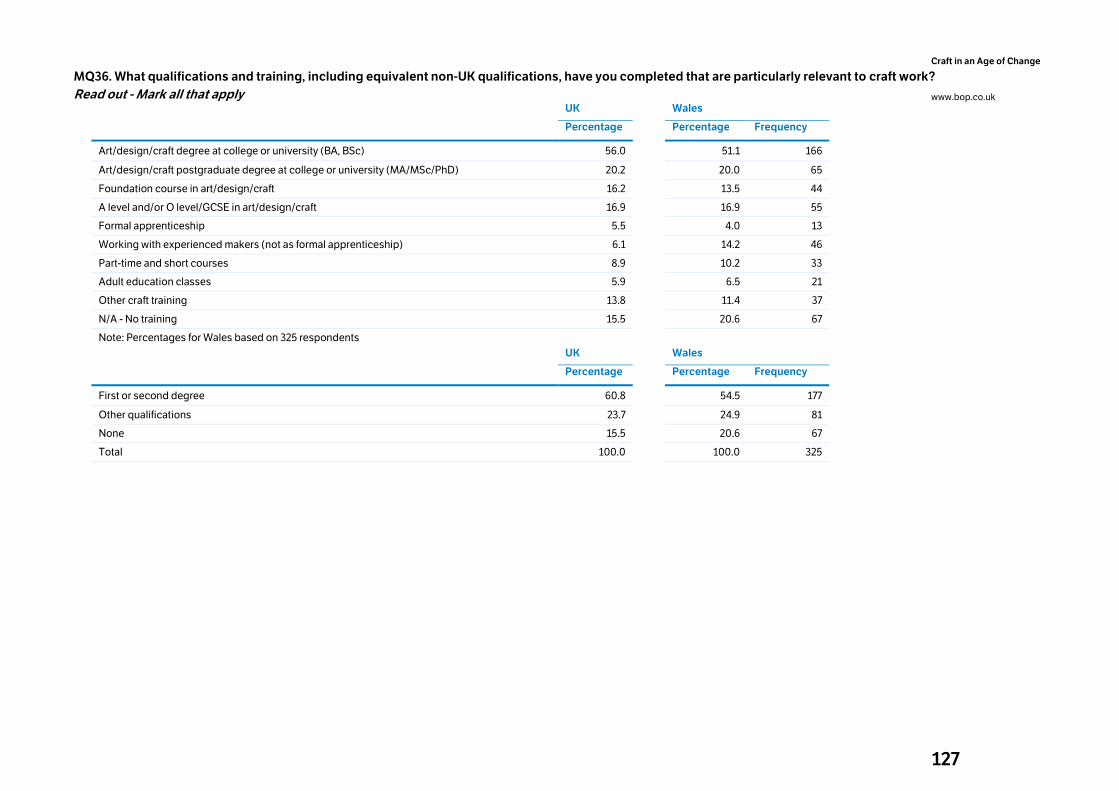
127
Craft in an Age of Change
www.bop.co.uk
MQ36. What qualifications and training, including equivalent non-UK qualifications, have you completed that are particularly relevant to craft work?
Read out - Mark all that apply
UK
Wales
Percentage Percentage Frequency
Art/design/craft degree at college or university (BA, BSc) 56.0 51.1 166
Art/design/craft postgraduate degree at college or university (MA/MSc/PhD) 20.2 20.0 65
Foundation course in art/design/craft 16.2 13.5 44
A level and/or O level/GCSE in art/design/craft 16.9 16.9 55
Formal apprenticeship 5.5 4.0 13
Working with experienced makers (not as formal apprenticeship) 6.1 14.2 46
Part-time and short courses 8.9 10.2 33
Adult education classes 5.9 6.5 21
Other craft training 13.8 11.4 37
N/A - No training 15.5 20.6 67
Note: Percentages for Wales based on 325 respondents
UK
Wales
Percentage Percentage Frequency
First or second degree 60.8 54.5 177
Other qualifications 23.7 24.9 81
None 15.5 20.6 67
Total 100.0 100.0 325
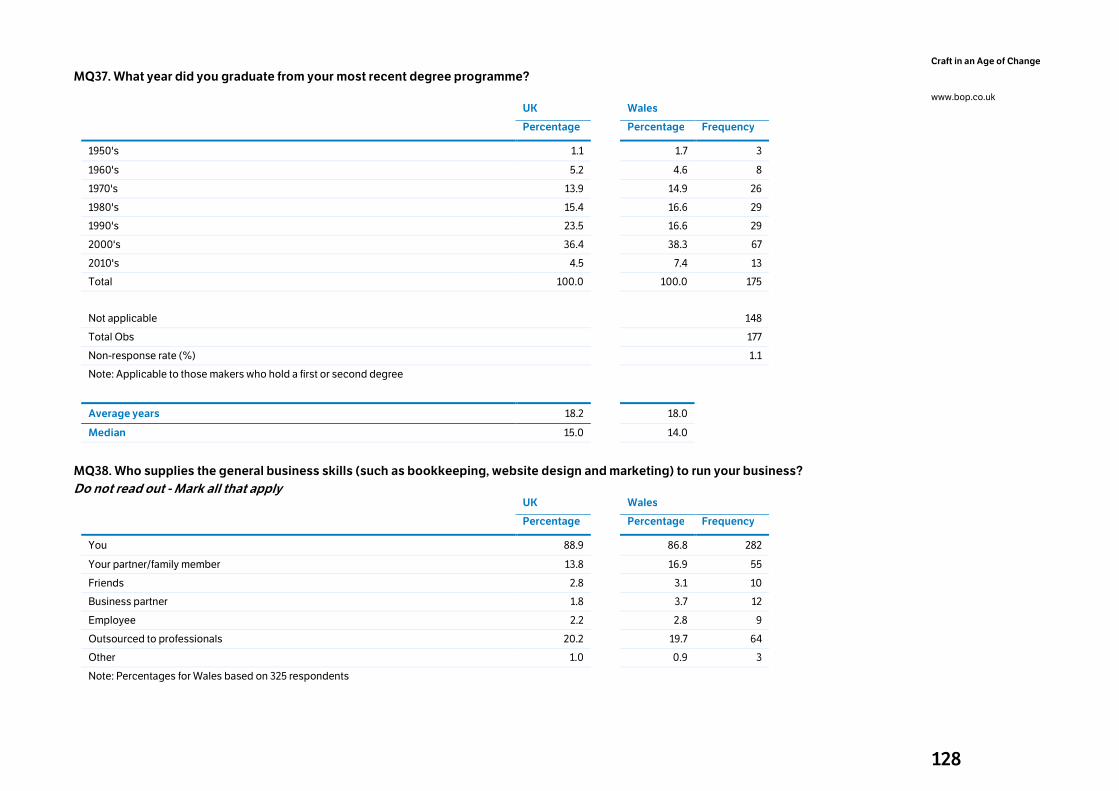
128
Craft in an Age of Change
www.bop.co.uk
MQ37. What year did you graduate from your most recent degree programme?
UK
Wales
Percentage Percentage Frequency
1950's 1.1 1.7 3
1960's 5.2 4.6 8
1970's 13.9 14.9 26
1980's 15.4 16.6 29
1990's 23.5 16.6 29
2000's 36.4 38.3 67
2010's 4.5 7.4 13
Total 100.0 100.0 175
Not applicable 148
Total Obs 177
Non-response rate (%) 1.1
Note: Applicable to those makers who hold a first or second degree
Average years 18.2 18.0
Median 15.0 14.0
MQ38. Who supplies the general business skills (such as bookkeeping, website design and marketing) to run your business?
Do not read out - Mark all that apply
UK
Wales
Percentage Percentage Frequency
You 88.9 86.8 282
Your partner/family member 13.8 16.9 55
Friends 2.8 3.1 10
Business partner 1.8 3.7 12
Employee 2.2 2.8 9
Outsourced to professionals 20.2 19.7 64
Other 1.0 0.9 3
Note: Percentages for Wales based on 325 respondents
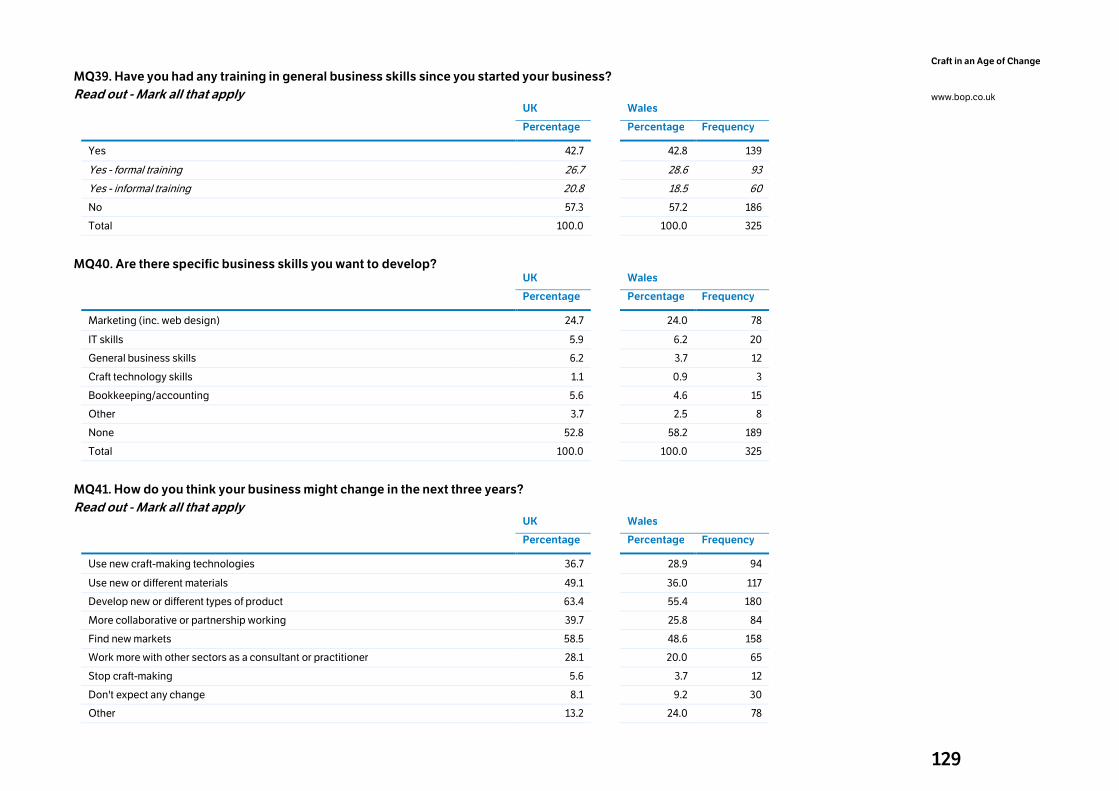
129
Craft in an Age of Change
www.bop.co.uk
MQ39. Have you had any training in general business skills since you started your business?
Read out - Mark all that apply
UK
Wales
Percentage Percentage Frequency
Yes 42.7 42.8 139
Yes - formal training 26.7 28.6 93
Yes - informal training 20.8 18.5 60
No 57.3 57.2 186
Total 100.0 100.0 325
MQ40. Are there specific business skills you want to develop?
UK Wales
Percentage Percentage Frequency
Marketing (inc. web design) 24.7 24.0 78
IT skills 5.9 6.2 20
General business skills 6.2 3.7 12
Craft technology skills 1.1 0.9 3
Bookkeeping/accounting 5.6 4.6 15
Other 3.7 2.5 8
None 52.8 58.2 189
Total 100.0 100.0 325
MQ41. How do you think your business might change in the next three years?
Read out - Mark all that apply
UK Wales
Percentage Percentage Frequency
Use new craft-making technologies 36.7 28.9 94
Use new or different materials 49.1 36.0 117
Develop new or different types of product 63.4 55.4 180
More collaborative or partnership working 39.7 25.8 84
Find new markets 58.5 48.6 158
Work more with other sectors as a consultant or practitioner 28.1 20.0 65
Stop craft-making 5.6 3.7 12
Don't expect any change 8.1 9.2 30
Other 13.2 24.0 78
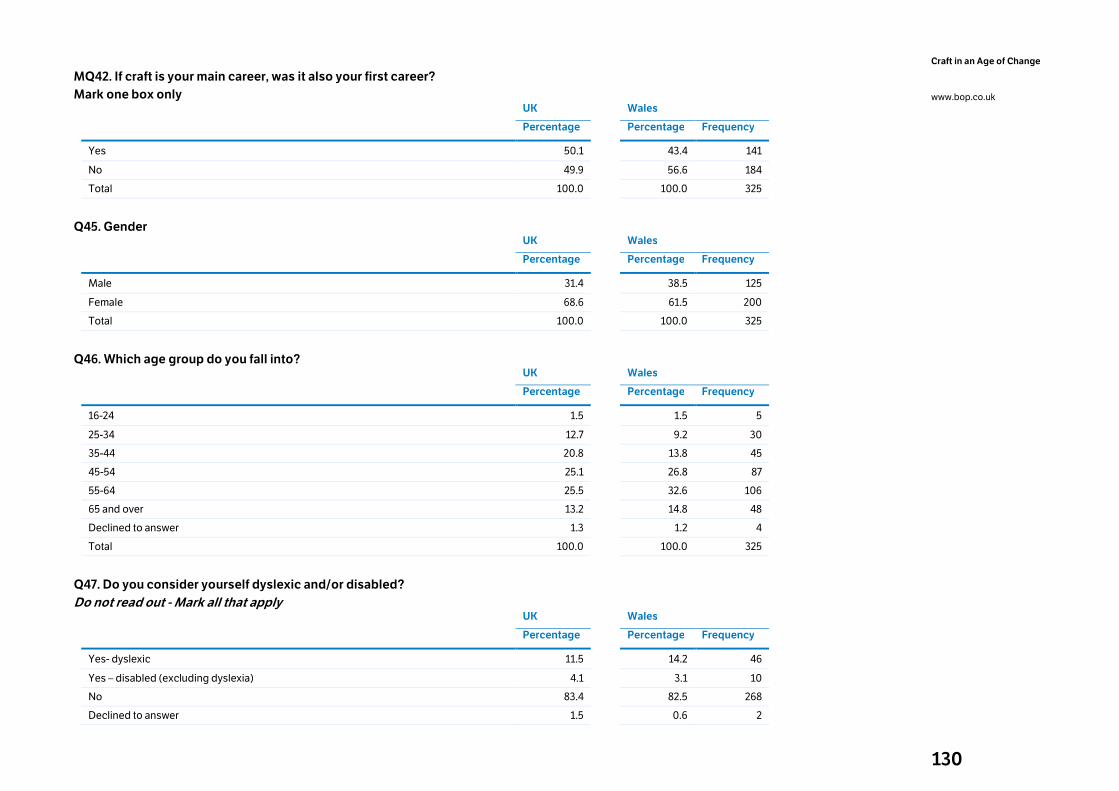
130
Craft in an Age of Change
www.bop.co.uk
MQ42. If craft is your main career, was it also your first career?
Mark one box only
UK
Wales
Percentage Percentage Frequency
Yes 50.1 43.4 141
No 49.9 56.6 184
Total 100.0 100.0 325
Q45. Gender
UK
Wales
Percentage Percentage Frequency
Male 31.4 38.5 125
Female 68.6 61.5 200
Total 100.0 100.0 325
Q46. Which age group do you fall into?
UK
Wales
Percentage Percentage Frequency
16-24 1.5 1.5 5
25-34 12.7 9.2 30
35-44 20.8 13.8 45
45-54 25.1 26.8 87
55-64 25.5 32.6 106
65 and over 13.2 14.8 48
Declined to answer 1.3 1.2 4
Total 100.0 100.0 325
Q47. Do you consider yourself dyslexic and/or disabled?
Do not read out - Mark all that apply
UK
Wales
Percentage Percentage Frequency
Yes- dyslexic 11.5 14.2 46
Yes – disabled (excluding dyslexia) 4.1 3.1 10
No 83.4 82.5 268
Declined to answer 1.5 0.6 2
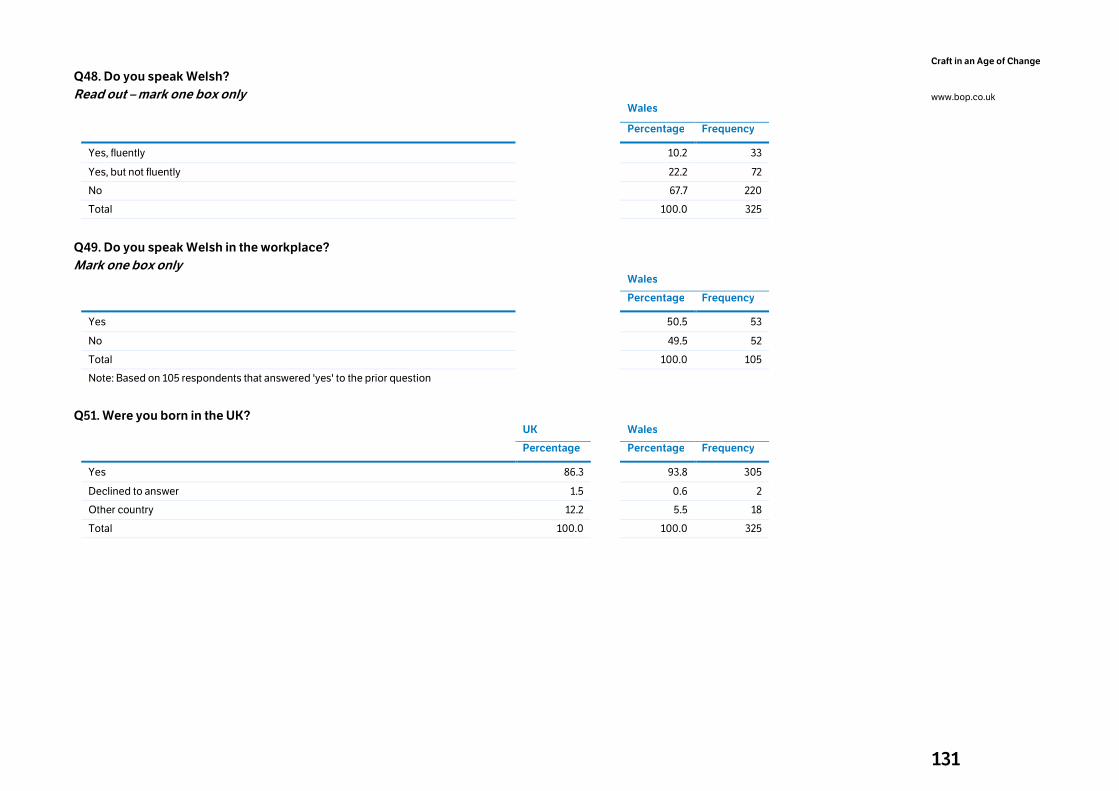
131
Craft in an Age of Change
www.bop.co.uk
Q48. Do you speak Welsh?
Read out – mark one box only
Wales
Percentage Frequency
Yes, fluently 10.2 33
Yes, but not fluently 22.2 72
No 67.7 220
Total 100.0 325
Q49. Do you speak Welsh in the workplace?
Mark one box only
Wales
Percentage Frequency
Yes 50.5 53
No 49.5 52
Total 100.0 105
Note: Based on 105 respondents that answered 'yes' to the prior question
Q51. Were you born in the UK?
UK Wales
Percentage Percentage Frequency
Yes 86.3 93.8 305
Declined to answer 1.5 0.6 2
Other country 12.2 5.5 18
Total 100.0 100.0 325
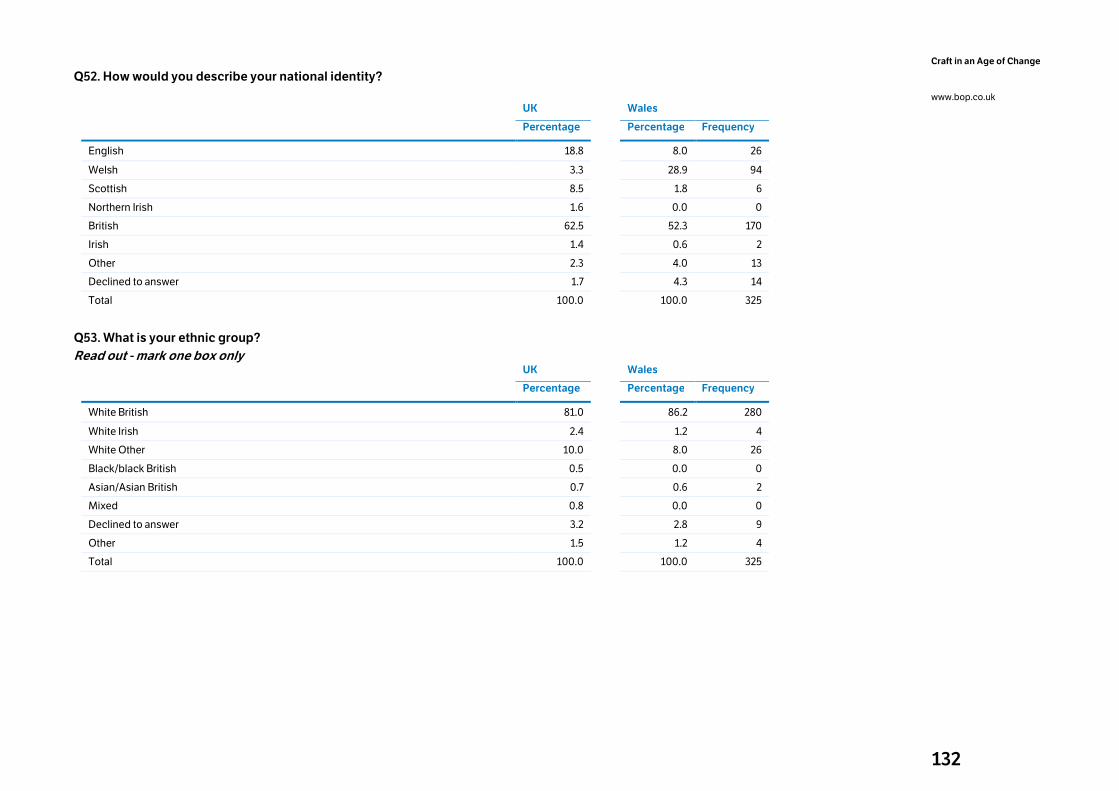
132
Craft in an Age of Change
www.bop.co.uk
Q52. How would you describe your national identity?
UK Wales
Percentage Percentage Frequency
English 18.8 8.0 26
Welsh 3.3 28.9 94
Scottish 8.5 1.8 6
Northern Irish 1.6 0.0 0
British 62.5 52.3 170
Irish 1.4 0.6 2
Other 2.3 4.0 13
Declined to answer 1.7 4.3 14
Total 100.0 100.0 325
Q53. What is your ethnic group?
Read out - mark one box only
UK Wales
Percentage
Percentage Frequency
White British 81.0 86.2 280
White Irish 2.4 1.2 4
White Other 10.0 8.0 26
Black/black British 0.5 0.0 0
Asian/Asian British 0.7 0.6 2
Mixed 0.8 0.0 0
Declined to answer 3.2 2.8 9
Other 1.5 1.2 4
Total 100.0 100.0 325
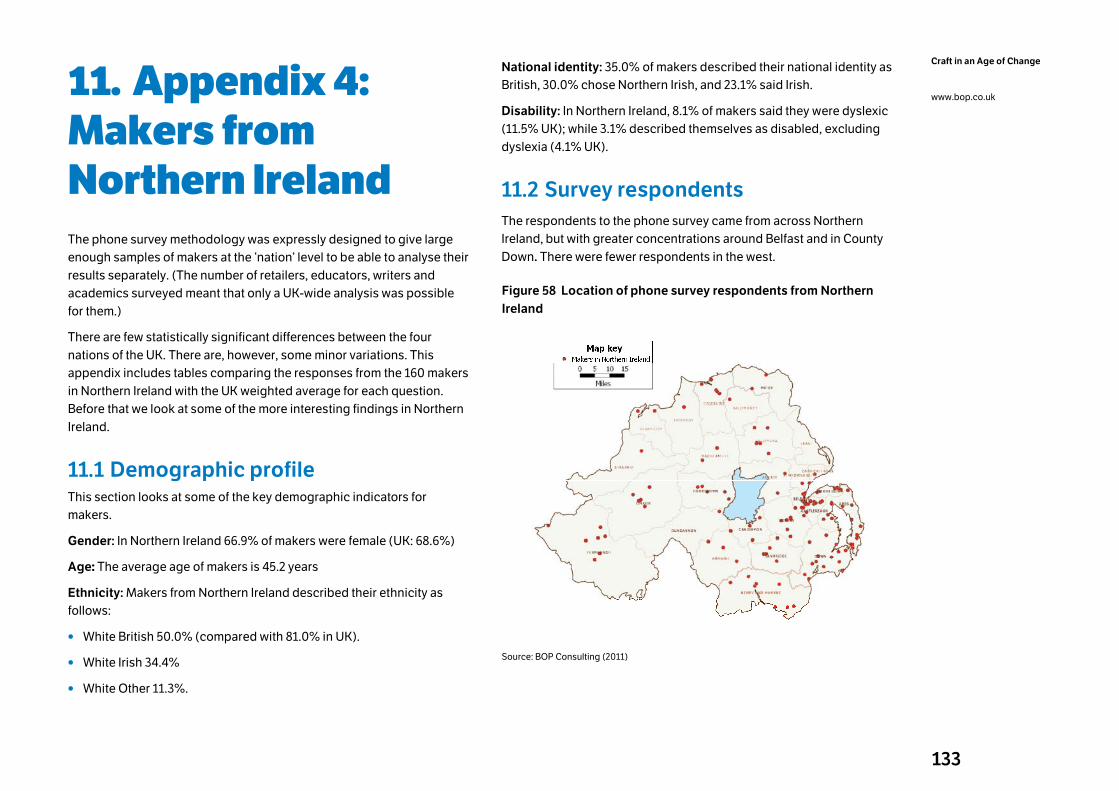
133
Craft in an Age of Change
www.bop.co.uk 11. Appendix 4: Makers from Northern Ireland The phone survey methodology was expressly designed to give large
enough samples of makers at the ‘nation’ level to be able to analyse their
results separately. (The number of retailers, educators, writers and
academics surveyed meant that only a UK-wide analysis was possible
for them.)
There are few statistically significant differences between the four
nations of the UK. There are, however, some minor variations. This
appendix includes tables comparing the responses from the 160 makers
in Northern Ireland with the UK weighted average for each question.
Before that we look at some of the more interesting findings in Northern
Ireland.
11.1 Demographic profile This section looks at some of the key demographic indicators for
makers.
Gender: In Northern Ireland 66.9% of makers were female (UK: 68.6%)
Age: The average age of makers is 45.2 years
Ethnicity: Makers from Northern Ireland described their ethnicity as
follows:
• White British 50.0% (compared with 81.0% in UK).
• White Irish 34.4%
• White Other 11.3%.
National identity: 35.0% of makers described their national identity as
British, 30.0% chose Northern Irish, and 23.1% said Irish.
Disability: In Northern Ireland, 8.1% of makers said they were dyslexic
(11.5% UK); while 3.1% described themselves as disabled, excluding
dyslexia (4.1% UK).
11.2 Survey respondents
The respondents to the phone survey came from across Northern
Ireland, but with greater concentrations around Belfast and in County
Down. There were fewer respondents in the west.
Figure 58 Location of phone survey respondents from Northern
Ireland
Source: BOP Consulting (2011)
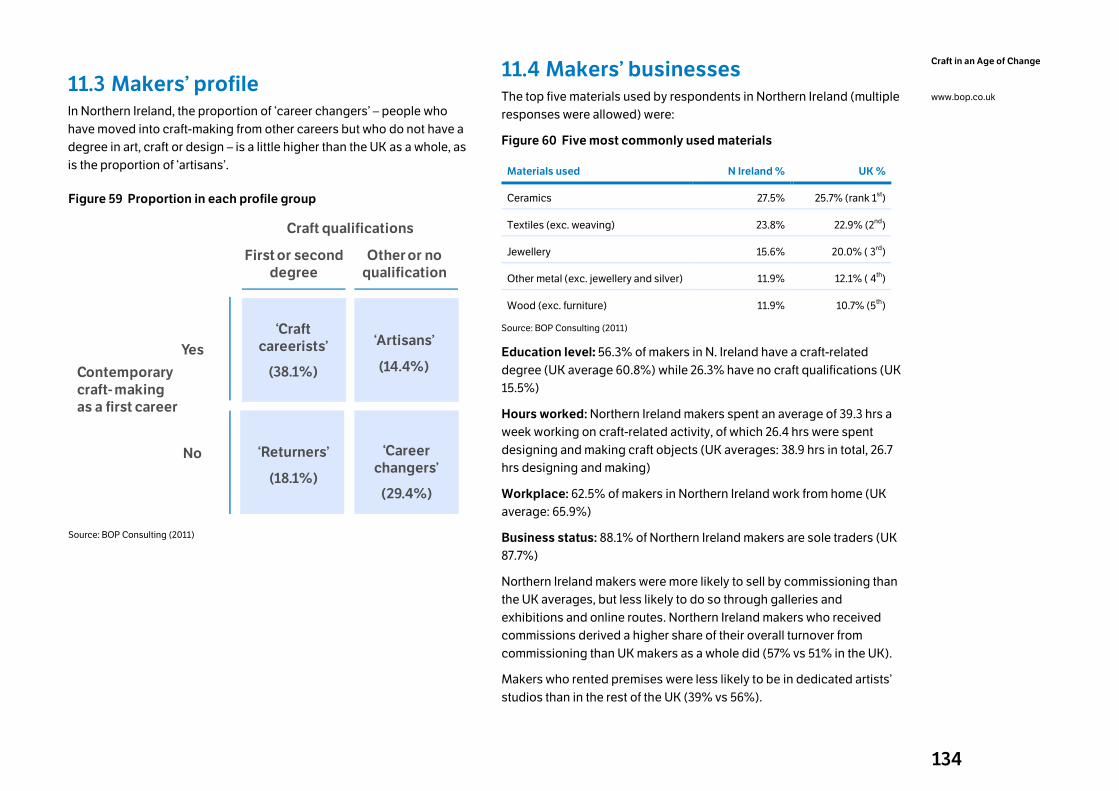
134
Craft in an Age of Change
www.bop.co.uk 11.3 Makers’ profile In Northern Ireland, the proportion of ‘career changers’ – people who
have moved into craft-making from other careers but who do not have a
degree in art, craft or design – is a little higher than the UK as a whole, as
is the proportion of ‘artisans’.
Figure 59 Proportion in each profile group
Craft qualifications
First or second
degree
Other or no
qualification
Contemporary
craft-making
as a first career
Yes
No
‘Craft
careerists’
(38.1%)
‘Artisans’
(14.4%)
‘Returners’
(18.1%)
‘Career
changers’
(29.4%)
Source: BOP Consulting (2011)
11.4 Makers’ businesses The top five materials used by respondents in Northern Ireland (multiple
responses were allowed) were:
Figure 60 Five most commonly used materials
Materials used N Ireland % UK %
Ceramics 27.5% 25.7% (rank 1st)
Textiles (exc. weaving) 23.8% 22.9% (2nd)
Jewellery 15.6% 20.0% ( 3rd)
Other metal (exc. jewellery and silver) 11.9% 12.1% ( 4th)
Wood (exc. furniture) 11.9% 10.7% (5th)
Source: BOP Consulting (2011)
Education level: 56.3% of makers in N. Ireland have a craft-related
degree (UK average 60.8%) while 26.3% have no craft qualifications (UK
15.5%)
Hours worked: Northern Ireland makers spent an average of 39.3 hrs a
week working on craft-related activity, of which 26.4 hrs were spent
designing and making craft objects (UK averages: 38.9 hrs in total, 26.7
hrs designing and making)
Workplace: 62.5% of makers in Northern Ireland work from home (UK
average: 65.9%)
Business status: 88.1% of Northern Ireland makers are sole traders (UK
87.7%)
Northern Ireland makers were more likely to sell by commissioning than
the UK averages, but less likely to do so through galleries and
exhibitions and online routes. Northern Ireland makers who received
commissions derived a higher share of their overall turnover from
commissioning than UK makers as a whole did (57% vs 51% in the UK).
Makers who rented premises were less likely to be in dedicated artists’
studios than in the rest of the UK (39% vs 56%).
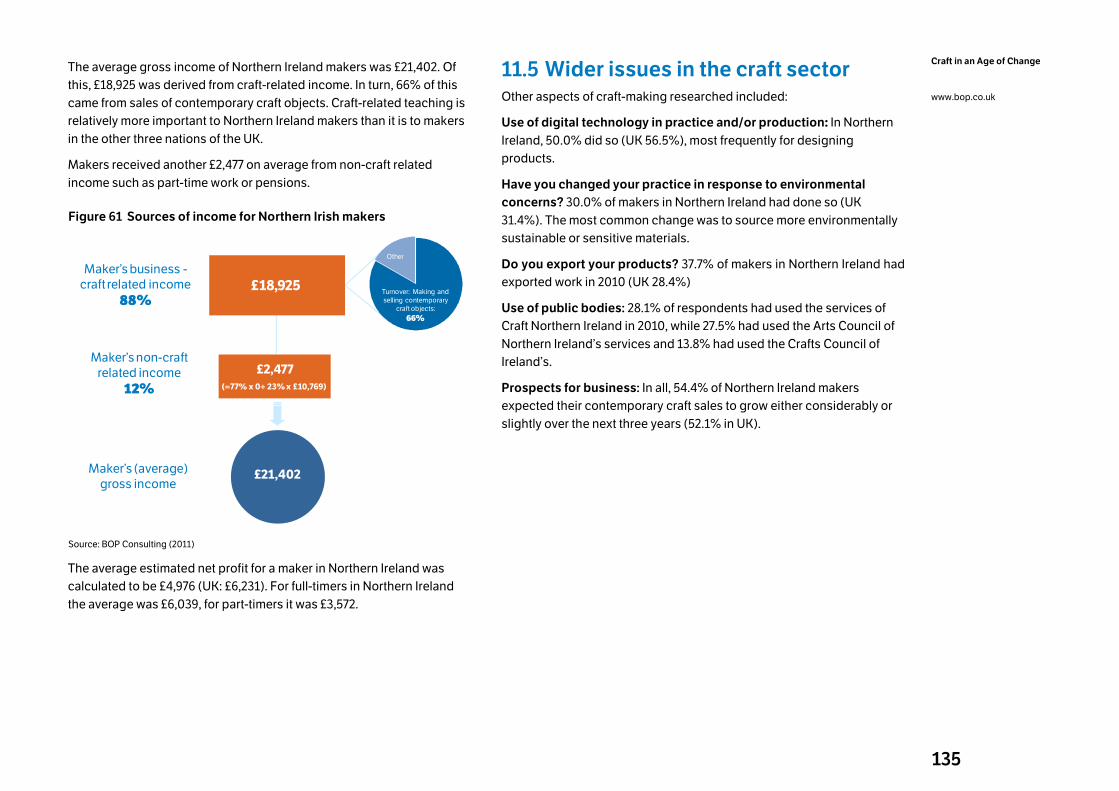
135
Craft in an Age of Change
www.bop.co.uk
The average gross income of Northern Ireland makers was £21,402. Of
this, £18,925 was derived from craft-related income. In turn, 66% of this
came from sales of contemporary craft objects. Craft-related teaching is
relatively more important to Northern Ireland makers than it is to makers
in the other three nations of the UK.
Makers received another £2,477 on average from non-craft related
income such as part-time work or pensions.
Figure 61 Sources of income for Northern Irish makers
£21,402
Maker’s business -craft related income
88%
Maker’s non-craft related income
12%
£18,925
£2,477
(=77% x 0+ 23% x £10,769)
Turnover: Making and
selling contemporary
craft objects:
66%
Other
Maker’s (average) gross income
Source: BOP Consulting (2011)
The average estimated net profit for a maker in Northern Ireland was
calculated to be £4,976 (UK: £6,231). For full-timers in Northern Ireland
the average was £6,039, for part-timers it was £3,572.
11.5 Wider issues in the craft sector Other aspects of craft-making researched included:
Use of digital technology in practice and/or production: In Northern
Ireland, 50.0% did so (UK 56.5%), most frequently for designing
products.
Have you changed your practice in response to environmental
concerns? 30.0% of makers in Northern Ireland had done so (UK
31.4%). The most common change was to source more environmentally
sustainable or sensitive materials.
Do you export your products? 37.7% of makers in Northern Ireland had
exported work in 2010 (UK 28.4%)
Use of public bodies: 28.1% of respondents had used the services of
Craft Northern Ireland in 2010, while 27.5% had used the Arts Council of
Northern Ireland’s services and 13.8% had used the Crafts Council of
Ireland’s.
Prospects for business: In all, 54.4% of Northern Ireland makers
expected their contemporary craft sales to grow either considerably or
slightly over the next three years (52.1% in UK).
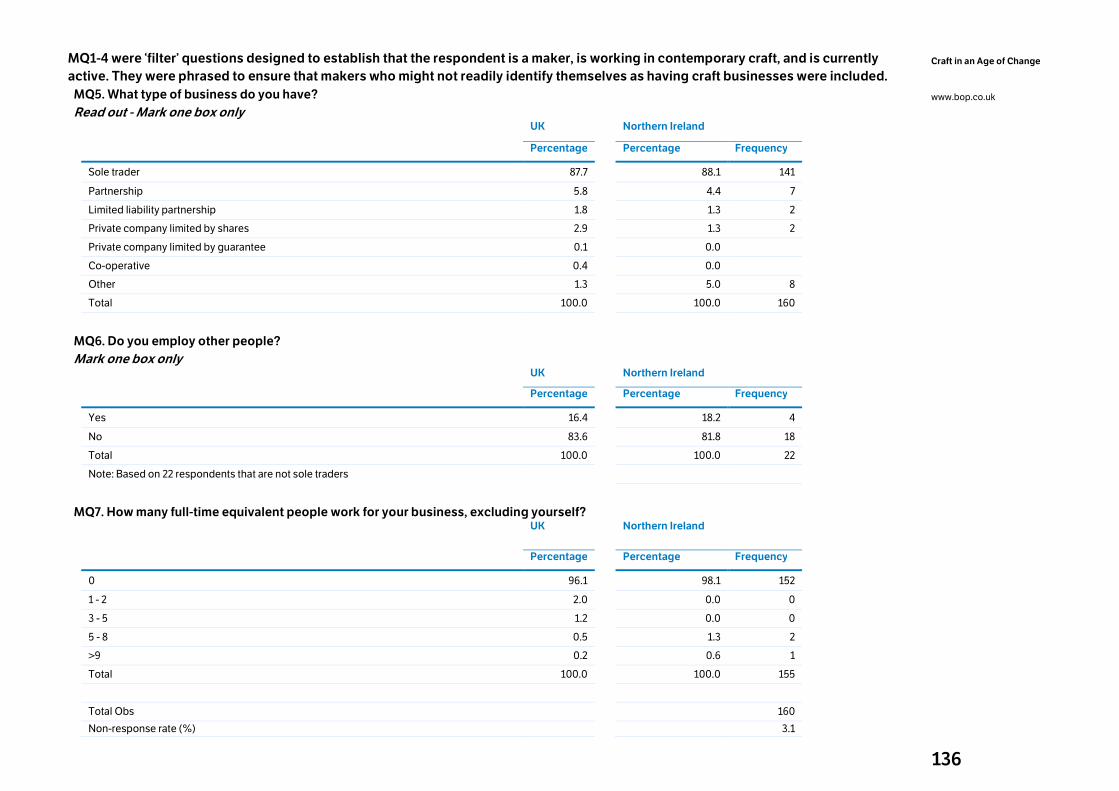
136
Craft in an Age of Change
www.bop.co.uk
MQ1-4 were ‘filter’ questions designed to establish that the respondent is a maker, is working in contemporary craft, and is currently
active. They were phrased to ensure that makers who might not readily identify themselves as having craft businesses were included.
MQ5. What type of business do you have?
Read out - Mark one box only
UK
Northern Ireland
Percentage Percentage Frequency
Sole trader 87.7 88.1 141
Partnership 5.8 4.4 7
Limited liability partnership 1.8 1.3 2
Private company limited by shares 2.9 1.3 2
Private company limited by guarantee 0.1 0.0
Co-operative 0.4 0.0
Other 1.3 5.0 8
Total 100.0 100.0 160
MQ6. Do you employ other people?
Mark one box only
UK
Northern Ireland
Percentage Percentage Frequency
Yes 16.4 18.2 4
No 83.6 81.8 18
Total 100.0 100.0 22
Note: Based on 22 respondents that are not sole traders
MQ7. How many full-time equivalent people work for your business, excluding yourself?
UK
Northern Ireland
Percentage Percentage Frequency
0 96.1 98.1 152
1 - 2 2.0 0.0 0
3 - 5 1.2 0.0 0
5 - 8 0.5 1.3 2
>9 0.2 0.6 1
Total 100.0 100.0 155
Total Obs 160
Non-response rate (%) 3.1
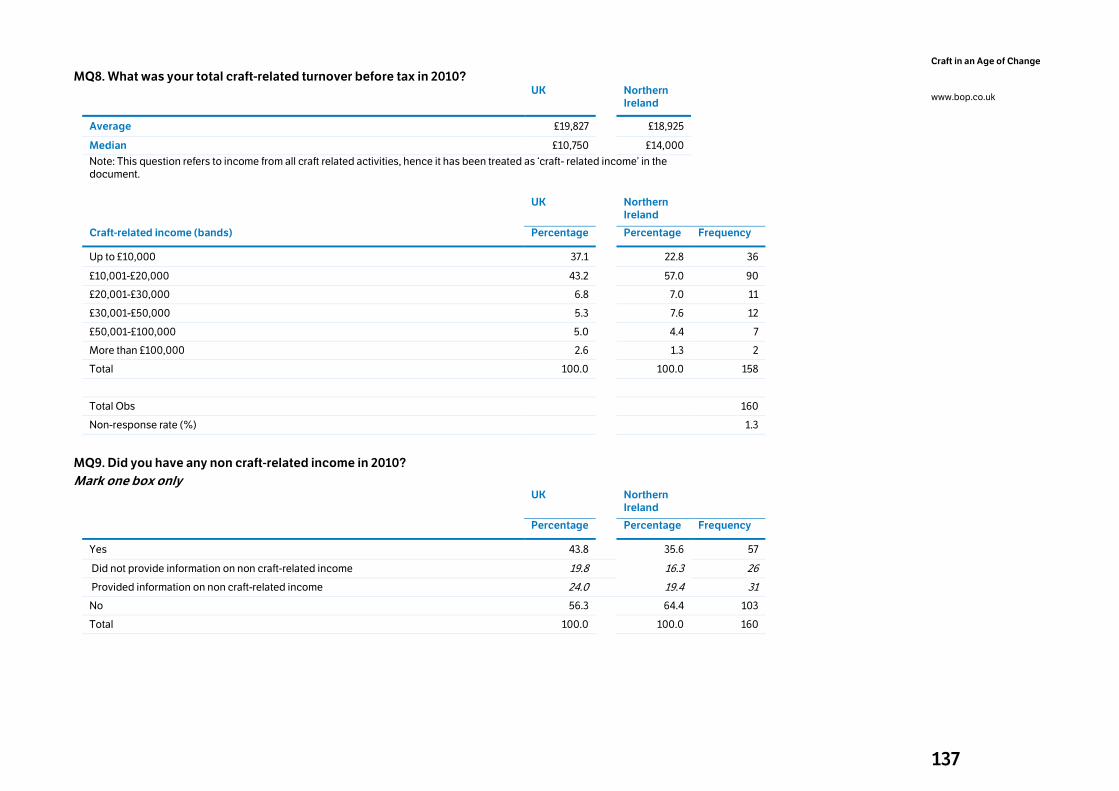
137
Craft in an Age of Change
www.bop.co.uk
MQ8. What was your total craft-related turnover before tax in 2010?
UK Northern Ireland
Average £19,827 £18,925
Median £10,750 £14,000
Note: This question refers to income from all craft related activities, hence it has been treated as ‘craft- related income’ in the document.
UK
Northern Ireland
Craft-related income (bands) Percentage Percentage Frequency
Up to £10,000 37.1 22.8 36
£10,001-£20,000 43.2 57.0 90
£20,001-£30,000 6.8 7.0 11
£30,001-£50,000 5.3 7.6 12
£50,001-£100,000 5.0 4.4 7
More than £100,000 2.6 1.3 2
Total 100.0 100.0 158
Total Obs 160
Non-response rate (%) 1.3
MQ9. Did you have any non craft-related income in 2010?
Mark one box only
UK
Northern Ireland
Percentage Percentage Frequency
Yes 43.8 35.6 57
Did not provide information on non craft-related income 19.8 16.3 26
Provided information on non craft-related income 24.0 19.4 31
No 56.3 64.4 103
Total 100.0 100.0 160
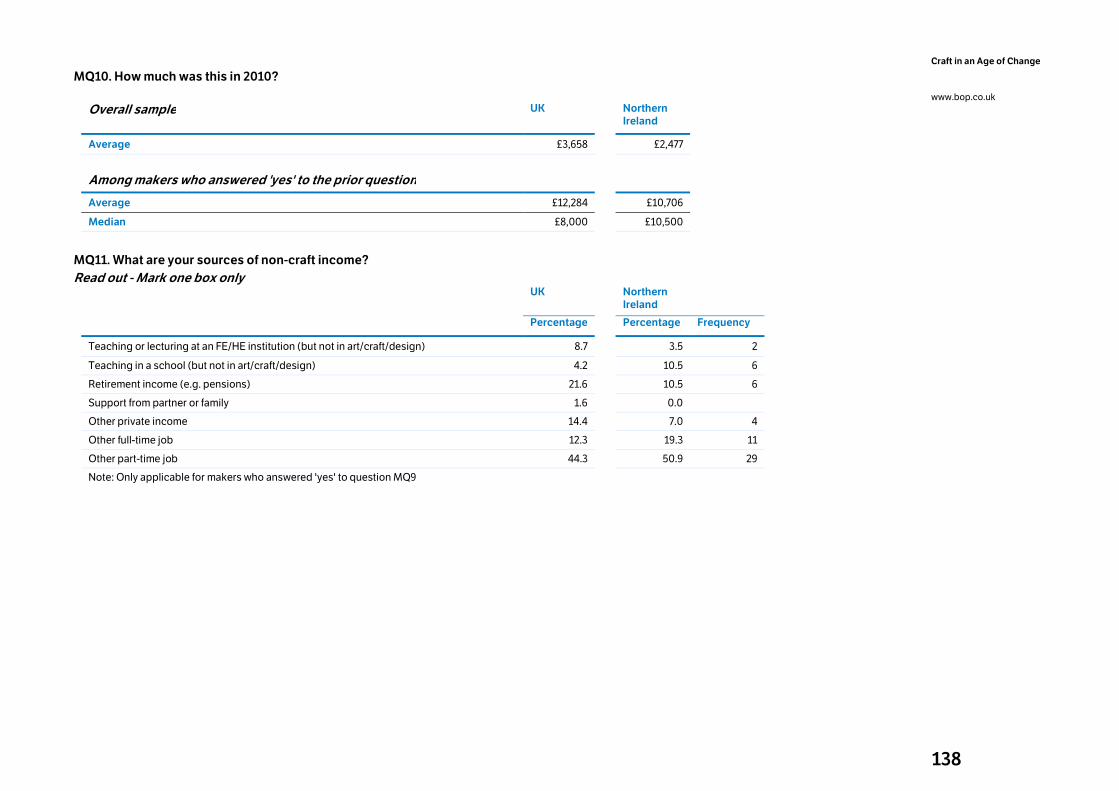
138
Craft in an Age of Change
www.bop.co.uk
MQ10. How much was this in 2010?
Overall sample UK Northern Ireland
Average £3,658 £2,477
Among makers who answered 'yes' to the prior question
Average £12,284 £10,706
Median £8,000 £10,500
MQ11. What are your sources of non-craft income?
Read out - Mark one box only
UK
Northern Ireland
Percentage Percentage Frequency
Teaching or lecturing at an FE/HE institution (but not in art/craft/design) 8.7 3.5 2
Teaching in a school (but not in art/craft/design) 4.2 10.5 6
Retirement income (e.g. pensions) 21.6 10.5 6
Support from partner or family 1.6 0.0
Other private income 14.4 7.0 4
Other full-time job 12.3 19.3 11
Other part-time job 44.3 50.9 29
Note: Only applicable for makers who answered 'yes' to question MQ9
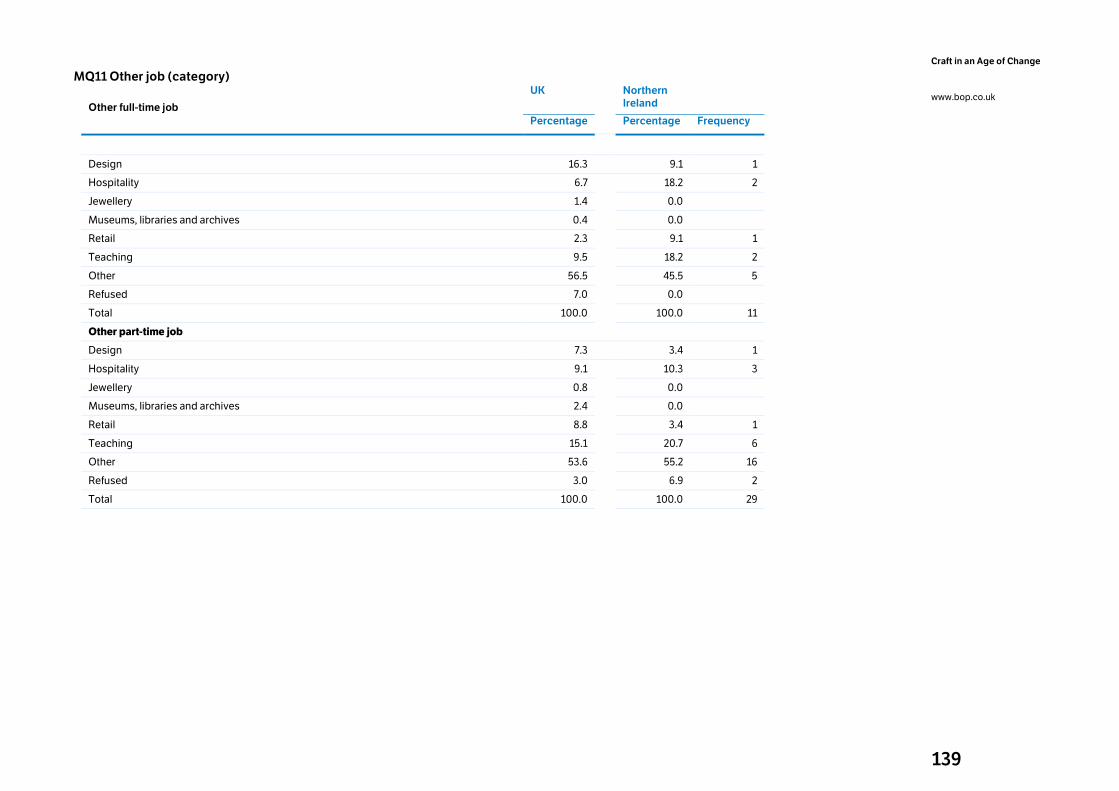
139
Craft in an Age of Change
www.bop.co.uk
MQ11 Other job (category)
Other full-time job
UK
Northern Ireland
Percentage Percentage Frequency
Design 16.3 9.1 1
Hospitality 6.7 18.2 2
Jewellery 1.4 0.0
Museums, libraries and archives 0.4 0.0
Retail 2.3 9.1 1
Teaching 9.5 18.2 2
Other 56.5 45.5 5
Refused 7.0 0.0
Total 100.0 100.0 11
Other part-time job
Design 7.3 3.4 1
Hospitality 9.1 10.3 3
Jewellery 0.8 0.0
Museums, libraries and archives 2.4 0.0
Retail 8.8 3.4 1
Teaching 15.1 20.7 6
Other 53.6 55.2 16
Refused 3.0 6.9 2
Total 100.0 100.0 29
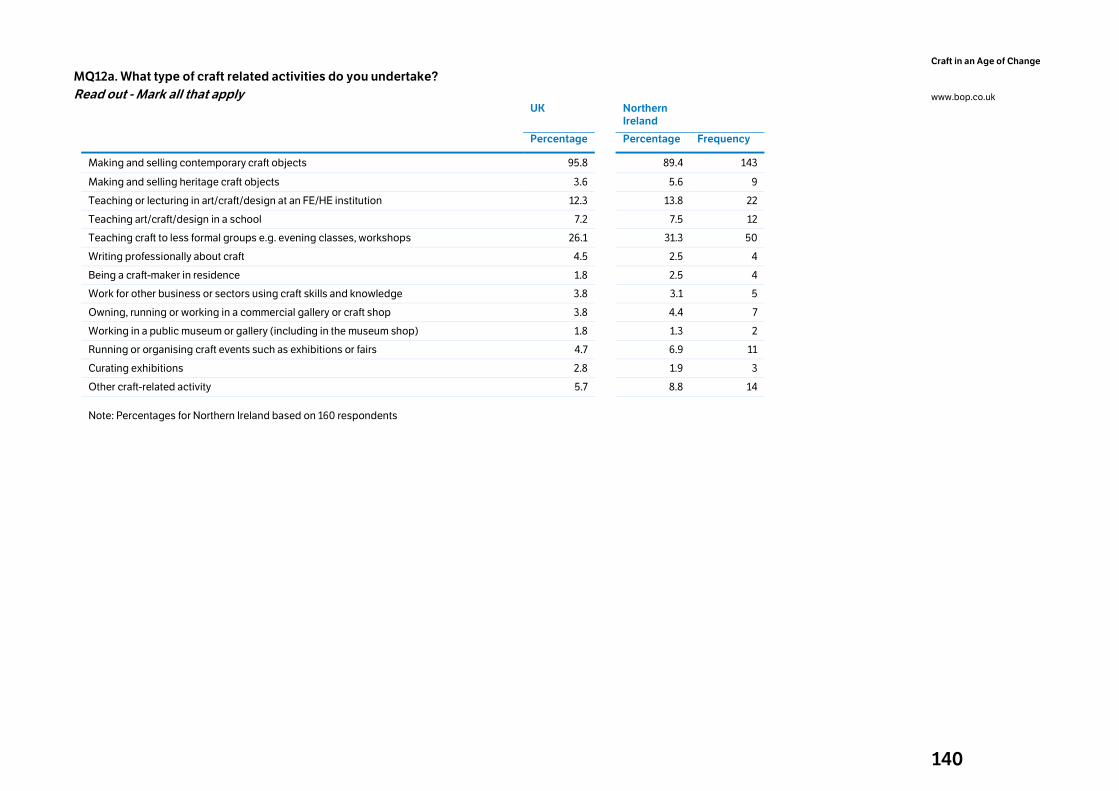
140
Craft in an Age of Change
www.bop.co.uk
MQ12a. What type of craft related activities do you undertake?
Read out - Mark all that apply
UK
Northern Ireland
Percentage Percentage Frequency
Making and selling contemporary craft objects 95.8 89.4 143
Making and selling heritage craft objects 3.6 5.6 9
Teaching or lecturing in art/craft/design at an FE/HE institution 12.3 13.8 22
Teaching art/craft/design in a school 7.2 7.5 12
Teaching craft to less formal groups e.g. evening classes, workshops 26.1 31.3 50
Writing professionally about craft 4.5 2.5 4
Being a craft-maker in residence 1.8 2.5 4
Work for other business or sectors using craft skills and knowledge 3.8 3.1 5
Owning, running or working in a commercial gallery or craft shop 3.8 4.4 7
Working in a public museum or gallery (including in the museum shop) 1.8 1.3 2
Running or organising craft events such as exhibitions or fairs 4.7 6.9 11
Curating exhibitions 2.8 1.9 3
Other craft-related activity 5.7 8.8 14
Note: Percentages for Northern Ireland based on 160 respondents
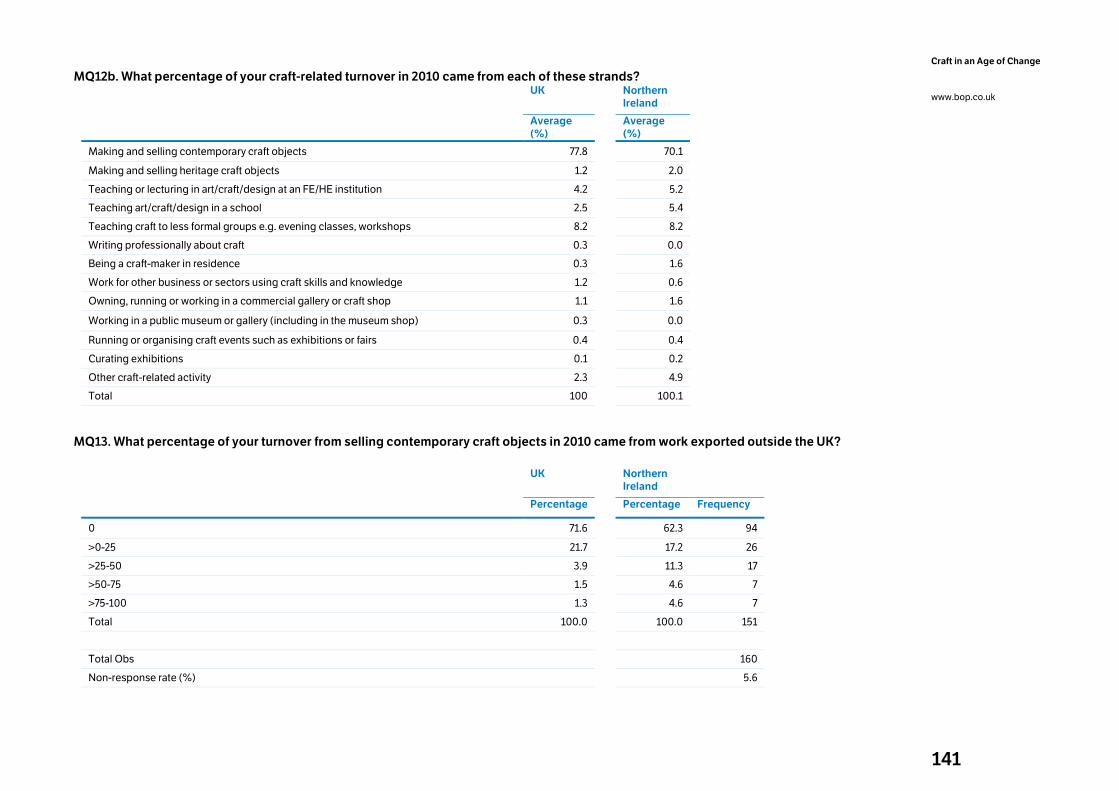
141
Craft in an Age of Change
www.bop.co.uk
MQ12b. What percentage of your craft-related turnover in 2010 came from each of these strands?
UK
Northern Ireland
Average
(%) Average
(%)
Making and selling contemporary craft objects 77.8 70.1
Making and selling heritage craft objects 1.2 2.0
Teaching or lecturing in art/craft/design at an FE/HE institution 4.2 5.2
Teaching art/craft/design in a school 2.5 5.4
Teaching craft to less formal groups e.g. evening classes, workshops 8.2 8.2
Writing professionally about craft 0.3 0.0
Being a craft-maker in residence 0.3 1.6
Work for other business or sectors using craft skills and knowledge 1.2 0.6
Owning, running or working in a commercial gallery or craft shop 1.1 1.6
Working in a public museum or gallery (including in the museum shop) 0.3 0.0
Running or organising craft events such as exhibitions or fairs 0.4 0.4
Curating exhibitions 0.1 0.2
Other craft-related activity 2.3 4.9
Total 100 100.1
MQ13. What percentage of your turnover from selling contemporary craft objects in 2010 came from work exported outside the UK?
UK
Northern Ireland
Percentage Percentage Frequency
0 71.6 62.3 94
>0-25 21.7 17.2 26
>25-50 3.9 11.3 17
>50-75 1.5 4.6 7
>75-100 1.3 4.6 7
Total 100.0 100.0 151
Total Obs 160
Non-response rate (%) 5.6
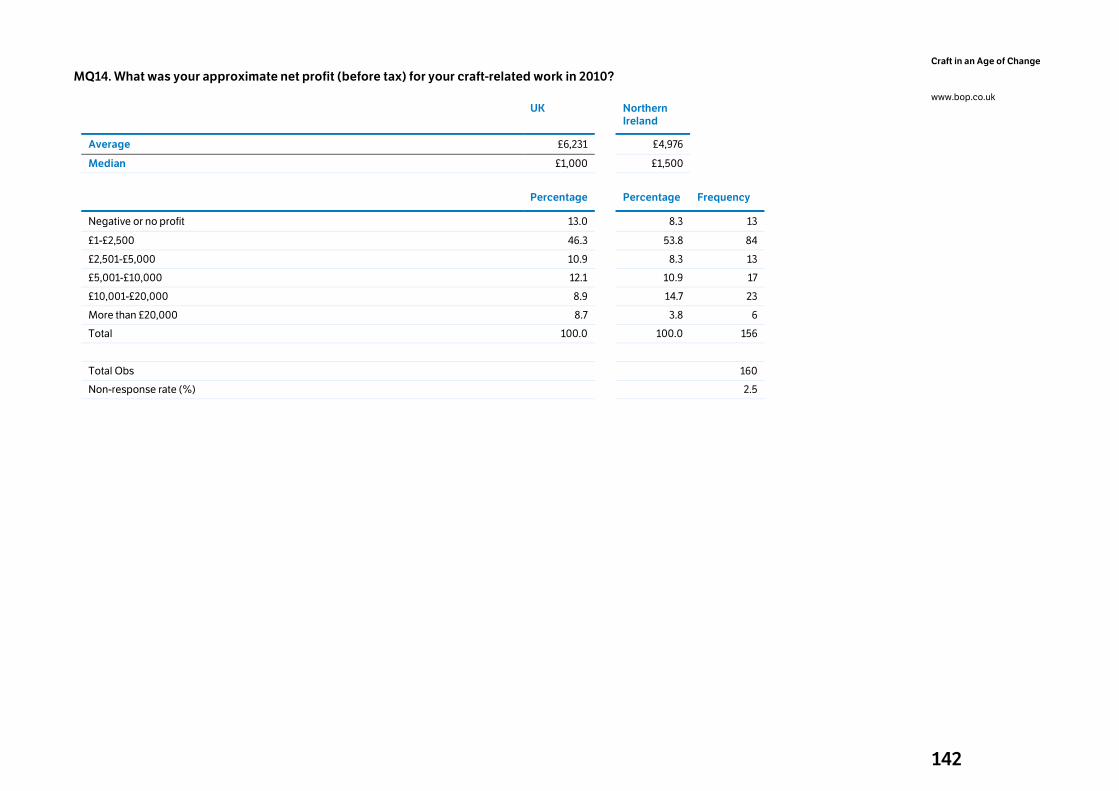
142
Craft in an Age of Change
www.bop.co.uk
MQ14. What was your approximate net profit (before tax) for your craft-related work in 2010?
UK Northern Ireland
Average £6,231 £4,976
Median £1,000 £1,500
Percentage Percentage Frequency
Negative or no profit 13.0 8.3 13
£1-£2,500 46.3 53.8 84
£2,501-£5,000 10.9 8.3 13
£5,001-£10,000 12.1 10.9 17
£10,001-£20,000 8.9 14.7 23
More than £20,000 8.7 3.8 6
Total 100.0 100.0 156
Total Obs 160
Non-response rate (%) 2.5
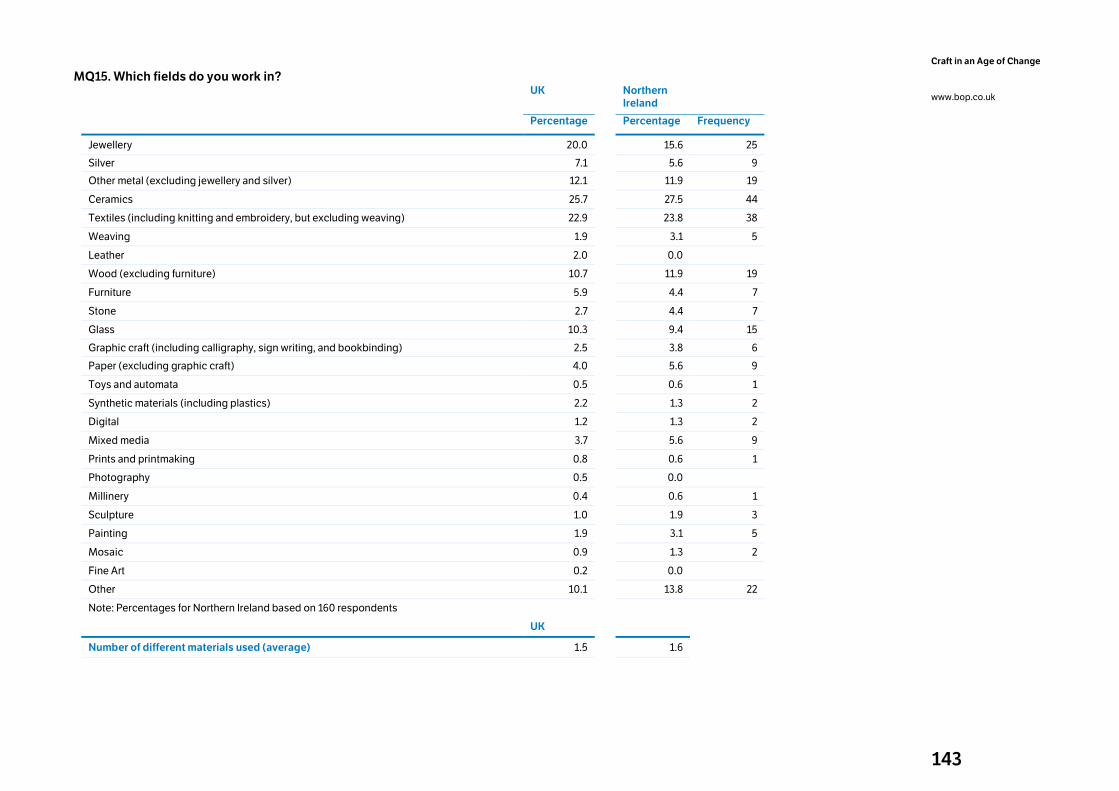
143
Craft in an Age of Change
www.bop.co.uk
MQ15. Which fields do you work in?
UK
Northern Ireland
Percentage Percentage Frequency
Jewellery 20.0 15.6 25
Silver 7.1 5.6 9
Other metal (excluding jewellery and silver) 12.1 11.9 19
Ceramics 25.7 27.5 44
Textiles (including knitting and embroidery, but excluding weaving) 22.9 23.8 38
Weaving 1.9 3.1 5
Leather 2.0 0.0
Wood (excluding furniture) 10.7 11.9 19
Furniture 5.9 4.4 7
Stone 2.7 4.4 7
Glass 10.3 9.4 15
Graphic craft (including calligraphy, sign writing, and bookbinding) 2.5 3.8 6
Paper (excluding graphic craft) 4.0 5.6 9
Toys and automata 0.5 0.6 1
Synthetic materials (including plastics) 2.2 1.3 2
Digital 1.2 1.3 2
Mixed media 3.7 5.6 9
Prints and printmaking 0.8 0.6 1
Photography 0.5 0.0
Millinery 0.4 0.6 1
Sculpture 1.0 1.9 3
Painting 1.9 3.1 5
Mosaic 0.9 1.3 2
Fine Art 0.2 0.0
Other 10.1 13.8 22
Note: Percentages for Northern Ireland based on 160 respondents
UK
Number of different materials used (average) 1.5 1.6
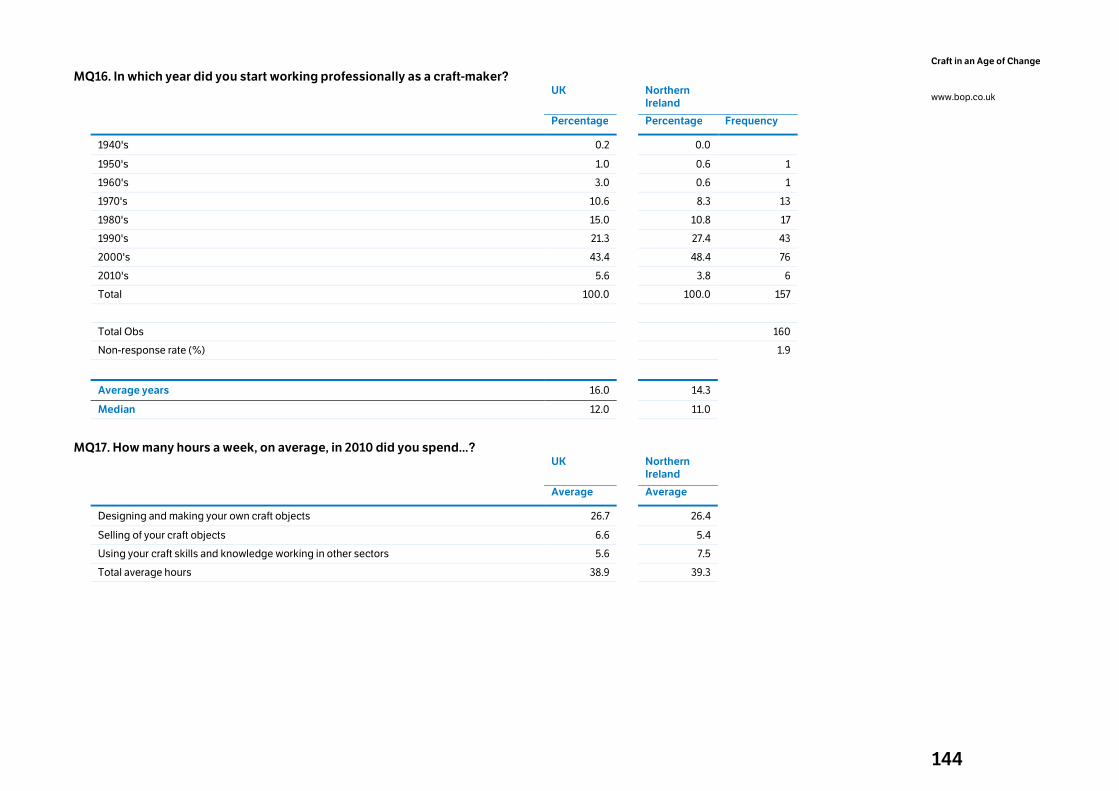
144
Craft in an Age of Change
www.bop.co.uk
MQ16. In which year did you start working professionally as a craft-maker?
UK
Northern Ireland
Percentage Percentage Frequency
1940's 0.2 0.0
1950's 1.0 0.6 1
1960's 3.0 0.6 1
1970's 10.6 8.3 13
1980's 15.0 10.8 17
1990's 21.3 27.4 43
2000's 43.4 48.4 76
2010's 5.6 3.8 6
Total 100.0 100.0 157
Total Obs 160
Non-response rate (%) 1.9
Average years 16.0 14.3
Median 12.0 11.0
MQ17. How many hours a week, on average, in 2010 did you spend...?
UK
Northern Ireland
Average Average
Designing and making your own craft objects 26.7 26.4
Selling of your craft objects 6.6 5.4
Using your craft skills and knowledge working in other sectors 5.6 7.5
Total average hours 38.9 39.3
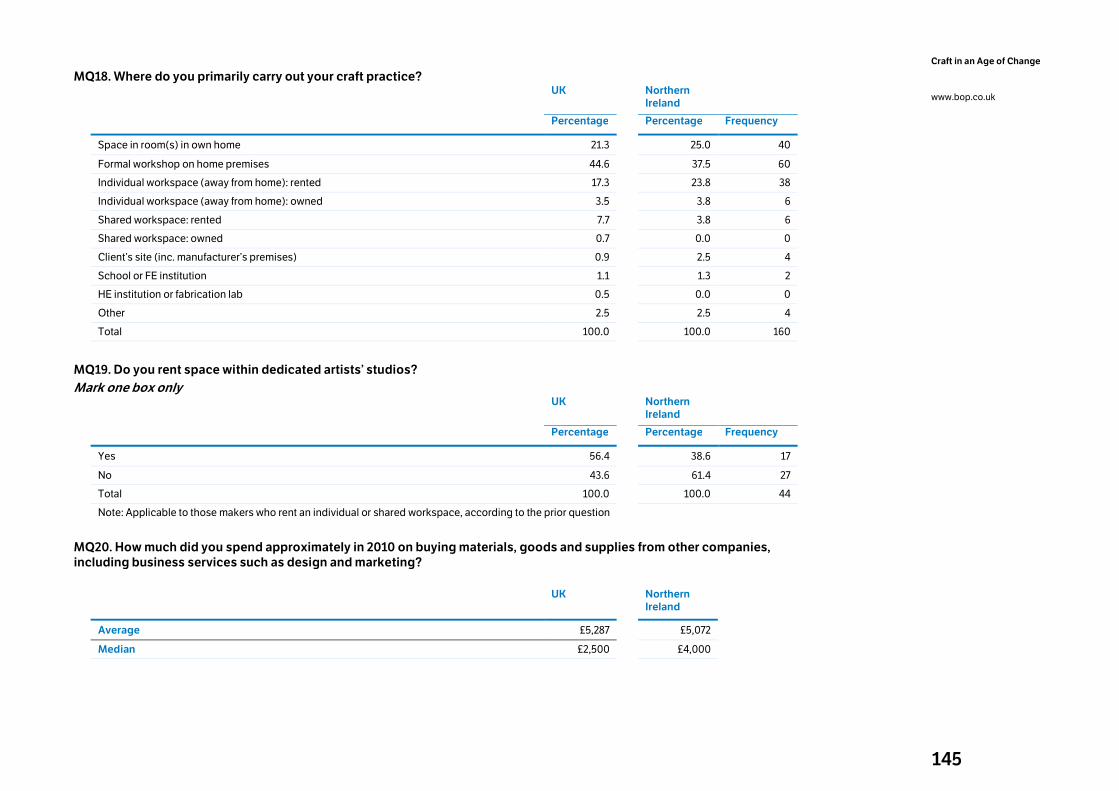
145
Craft in an Age of Change
www.bop.co.uk
MQ18. Where do you primarily carry out your craft practice?
UK
Northern Ireland
Percentage Percentage Frequency
Space in room(s) in own home 21.3 25.0 40
Formal workshop on home premises 44.6 37.5 60
Individual workspace (away from home): rented 17.3 23.8 38
Individual workspace (away from home): owned 3.5 3.8 6
Shared workspace: rented 7.7 3.8 6
Shared workspace: owned 0.7 0.0 0
Client’s site (inc. manufacturer’s premises) 0.9 2.5 4
School or FE institution 1.1 1.3 2
HE institution or fabrication lab 0.5 0.0 0
Other 2.5 2.5 4
Total 100.0 100.0 160
MQ19. Do you rent space within dedicated artists’ studios?
Mark one box only
UK
Northern Ireland
Percentage Percentage Frequency
Yes 56.4 38.6 17
No 43.6 61.4 27
Total 100.0 100.0 44
Note: Applicable to those makers who rent an individual or shared workspace, according to the prior question
MQ20. How much did you spend approximately in 2010 on buying materials, goods and supplies from other companies,
including business services such as design and marketing?
UK
Northern Ireland
Average £5,287 £5,072
Median £2,500 £4,000
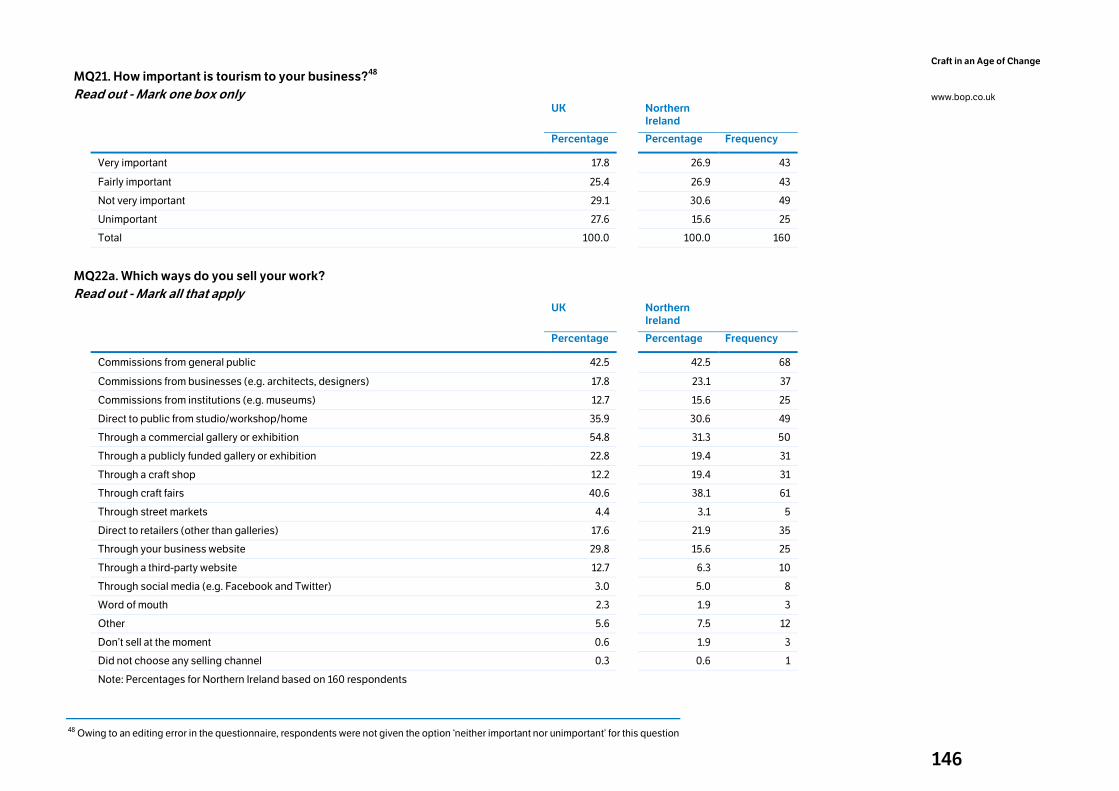
146
Craft in an Age of Change
www.bop.co.uk
MQ21. How important is tourism to your business?48
Read out - Mark one box only
UK
Northern Ireland
Percentage Percentage Frequency
Very important 17.8 26.9 43
Fairly important 25.4 26.9 43
Not very important 29.1 30.6 49
Unimportant 27.6 15.6 25
Total 100.0 100.0 160
MQ22a. Which ways do you sell your work?
Read out - Mark all that apply
UK
Northern Ireland
Percentage Percentage Frequency
Commissions from general public 42.5 42.5 68
Commissions from businesses (e.g. architects, designers) 17.8 23.1 37
Commissions from institutions (e.g. museums) 12.7 15.6 25
Direct to public from studio/workshop/home 35.9 30.6 49
Through a commercial gallery or exhibition 54.8 31.3 50
Through a publicly funded gallery or exhibition 22.8 19.4 31
Through a craft shop 12.2 19.4 31
Through craft fairs 40.6 38.1 61
Through street markets 4.4 3.1 5
Direct to retailers (other than galleries) 17.6 21.9 35
Through your business website 29.8 15.6 25
Through a third-party website 12.7 6.3 10
Through social media (e.g. Facebook and Twitter) 3.0 5.0 8
Word of mouth 2.3 1.9 3
Other 5.6 7.5 12
Don’t sell at the moment 0.6 1.9 3
Did not choose any selling channel 0.3 0.6 1
Note: Percentages for Northern Ireland based on 160 respondents
48 Owing to an editing error in the questionnaire, respondents were not given the option ‘neither important nor unimportant’ for this question
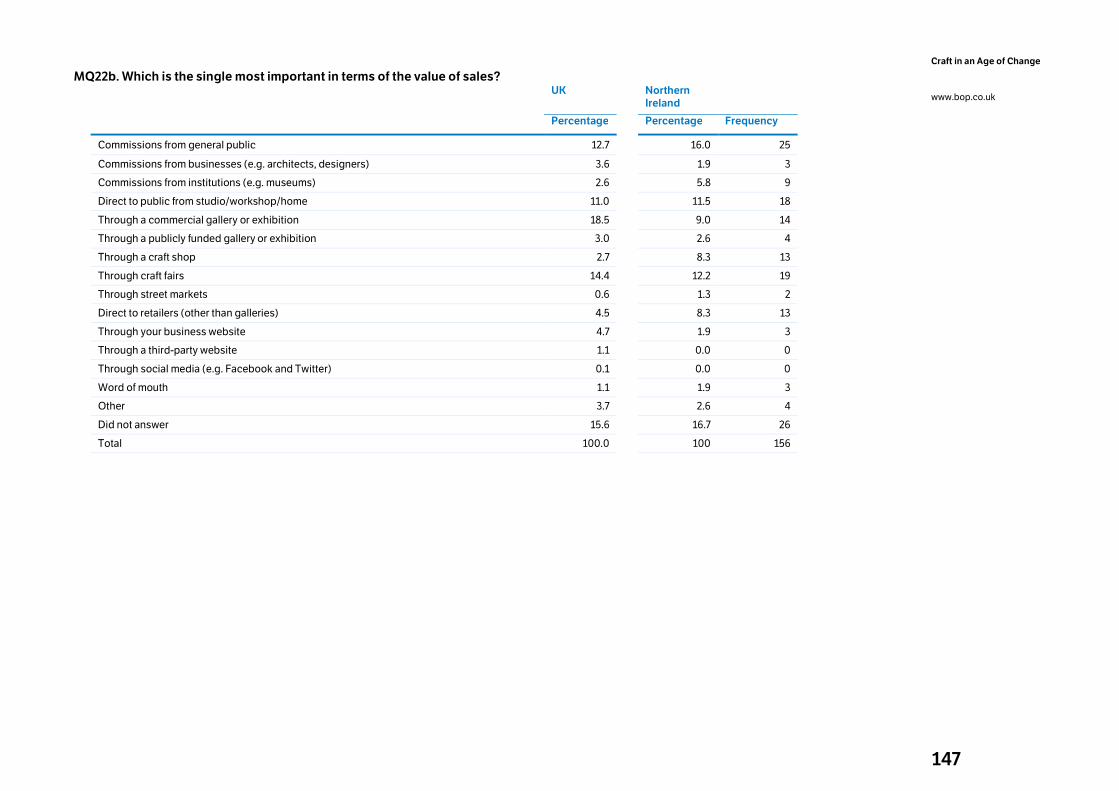
147
Craft in an Age of Change
www.bop.co.uk
MQ22b. Which is the single most important in terms of the value of sales?
UK
Northern Ireland
Percentage Percentage Frequency
Commissions from general public 12.7 16.0 25
Commissions from businesses (e.g. architects, designers) 3.6 1.9 3
Commissions from institutions (e.g. museums) 2.6 5.8 9
Direct to public from studio/workshop/home 11.0 11.5 18
Through a commercial gallery or exhibition 18.5 9.0 14
Through a publicly funded gallery or exhibition 3.0 2.6 4
Through a craft shop 2.7 8.3 13
Through craft fairs 14.4 12.2 19
Through street markets 0.6 1.3 2
Direct to retailers (other than galleries) 4.5 8.3 13
Through your business website 4.7 1.9 3
Through a third-party website 1.1 0.0 0
Through social media (e.g. Facebook and Twitter) 0.1 0.0 0
Word of mouth 1.1 1.9 3
Other 3.7 2.6 4
Did not answer 15.6 16.7 26
Total 100.0 100 156
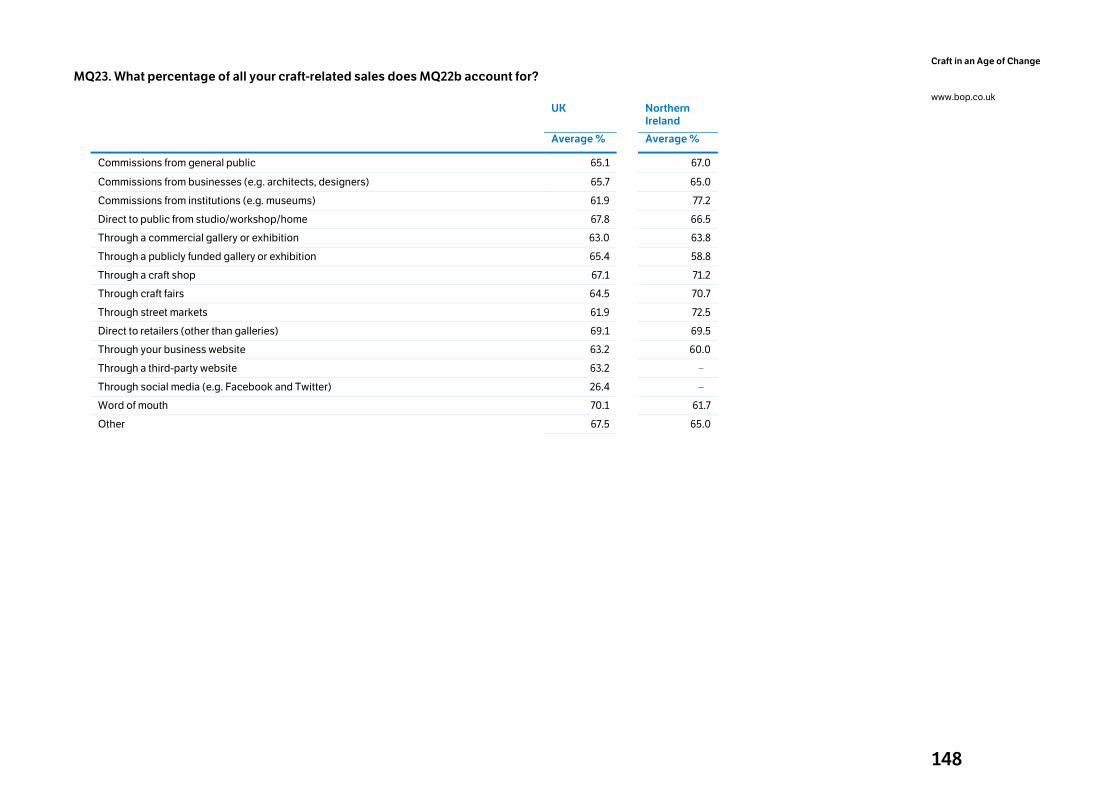
148
Craft in an Age of Change
www.bop.co.uk
MQ23. What percentage of all your craft-related sales does MQ22b account for?
UK
Northern Ireland
Average % Average %
Commissions from general public 65.1 67.0
Commissions from businesses (e.g. architects, designers) 65.7 65.0
Commissions from institutions (e.g. museums) 61.9 77.2
Direct to public from studio/workshop/home 67.8 66.5
Through a commercial gallery or exhibition 63.0 63.8
Through a publicly funded gallery or exhibition 65.4 58.8
Through a craft shop 67.1 71.2
Through craft fairs 64.5 70.7
Through street markets 61.9 72.5
Direct to retailers (other than galleries) 69.1 69.5
Through your business website 63.2 60.0
Through a third-party website 63.2 -
Through social media (e.g. Facebook and Twitter) 26.4 -
Word of mouth 70.1 61.7
Other 67.5 65.0
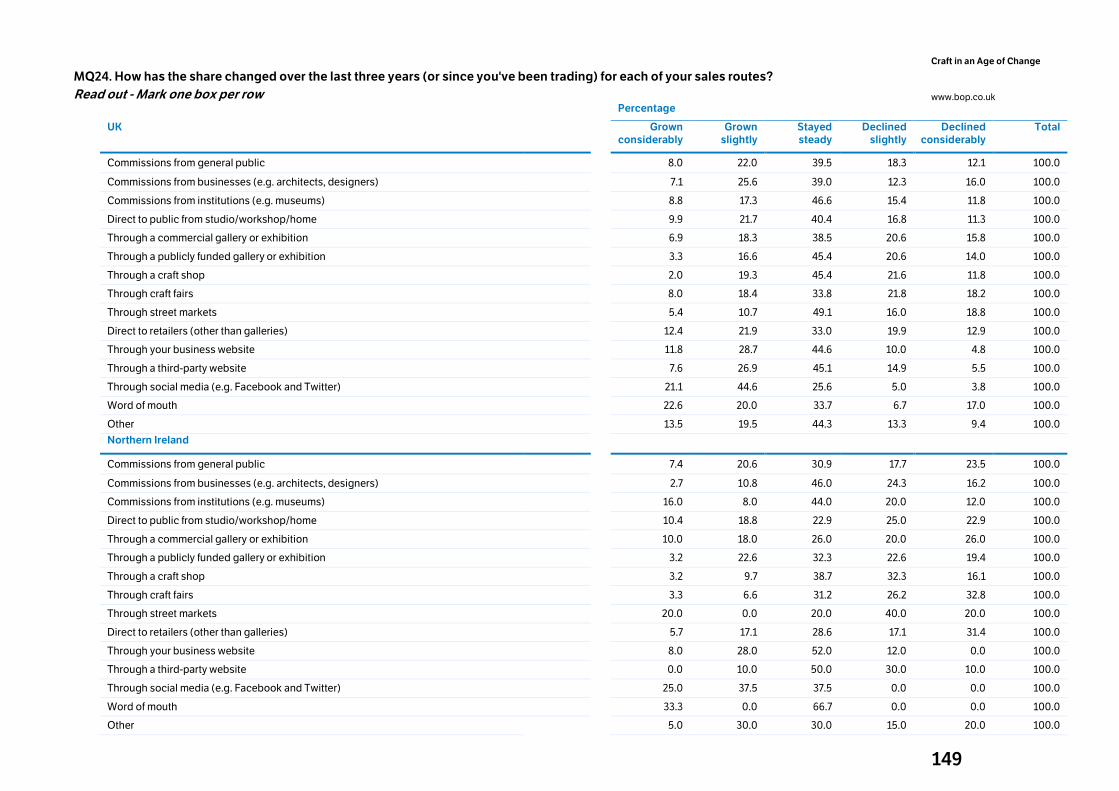
149
Craft in an Age of Change
www.bop.co.uk
MQ24. How has the share changed over the last three years (or since you've been trading) for each of your sales routes?
Read out - Mark one box per row
Percentage
UK Grown considerably
Grown slightly
Stayed steady
Declined slightly
Declined considerably
Total
Commissions from general public 8.0 22.0 39.5 18.3 12.1 100.0
Commissions from businesses (e.g. architects, designers) 7.1 25.6 39.0 12.3 16.0 100.0
Commissions from institutions (e.g. museums) 8.8 17.3 46.6 15.4 11.8 100.0
Direct to public from studio/workshop/home 9.9 21.7 40.4 16.8 11.3 100.0
Through a commercial gallery or exhibition 6.9 18.3 38.5 20.6 15.8 100.0
Through a publicly funded gallery or exhibition 3.3 16.6 45.4 20.6 14.0 100.0
Through a craft shop 2.0 19.3 45.4 21.6 11.8 100.0
Through craft fairs 8.0 18.4 33.8 21.8 18.2 100.0
Through street markets 5.4 10.7 49.1 16.0 18.8 100.0
Direct to retailers (other than galleries) 12.4 21.9 33.0 19.9 12.9 100.0
Through your business website 11.8 28.7 44.6 10.0 4.8 100.0
Through a third-party website 7.6 26.9 45.1 14.9 5.5 100.0
Through social media (e.g. Facebook and Twitter) 21.1 44.6 25.6 5.0 3.8 100.0
Word of mouth 22.6 20.0 33.7 6.7 17.0 100.0
Other 13.5 19.5 44.3 13.3 9.4 100.0
Northern Ireland
Commissions from general public 7.4 20.6 30.9 17.7 23.5 100.0
Commissions from businesses (e.g. architects, designers) 2.7 10.8 46.0 24.3 16.2 100.0
Commissions from institutions (e.g. museums) 16.0 8.0 44.0 20.0 12.0 100.0
Direct to public from studio/workshop/home 10.4 18.8 22.9 25.0 22.9 100.0
Through a commercial gallery or exhibition 10.0 18.0 26.0 20.0 26.0 100.0
Through a publicly funded gallery or exhibition 3.2 22.6 32.3 22.6 19.4 100.0
Through a craft shop 3.2 9.7 38.7 32.3 16.1 100.0
Through craft fairs 3.3 6.6 31.2 26.2 32.8 100.0
Through street markets 20.0 0.0 20.0 40.0 20.0 100.0
Direct to retailers (other than galleries) 5.7 17.1 28.6 17.1 31.4 100.0
Through your business website 8.0 28.0 52.0 12.0 0.0 100.0
Through a third-party website 0.0 10.0 50.0 30.0 10.0 100.0
Through social media (e.g. Facebook and Twitter) 25.0 37.5 37.5 0.0 0.0 100.0
Word of mouth 33.3 0.0 66.7 0.0 0.0 100.0
Other 5.0 30.0 30.0 15.0 20.0 100.0
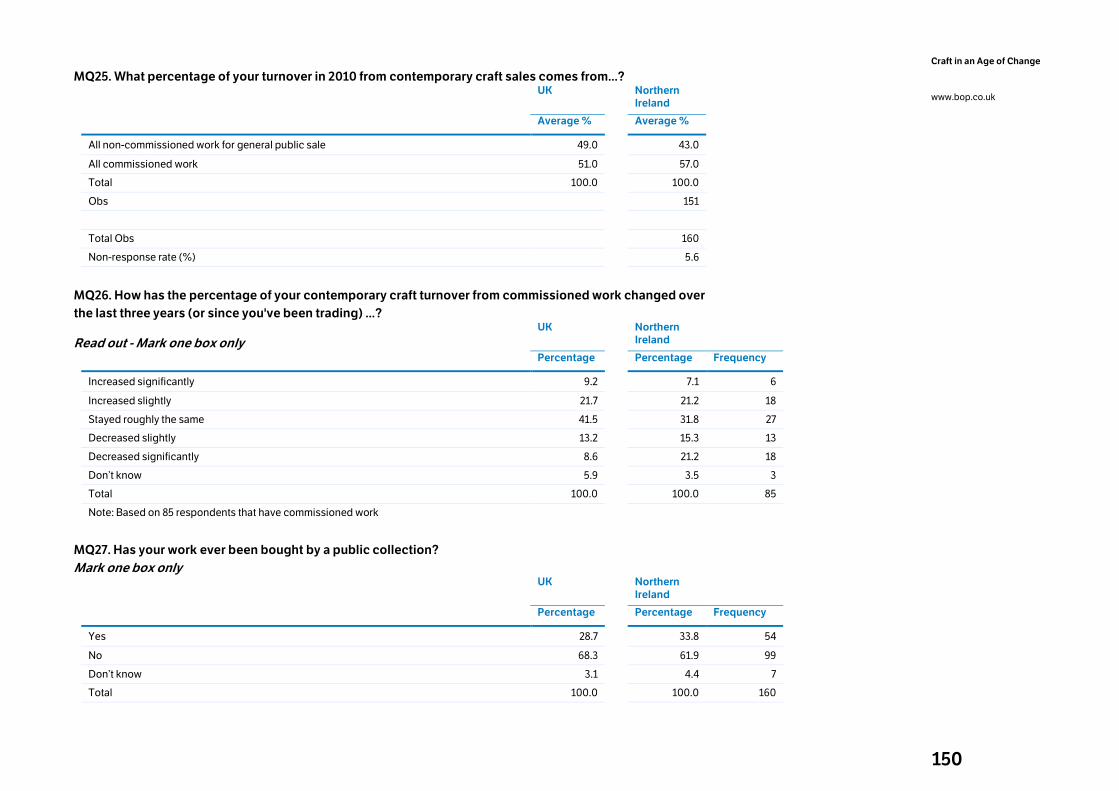
150
Craft in an Age of Change
www.bop.co.uk
MQ25. What percentage of your turnover in 2010 from contemporary craft sales comes from...?
UK
Northern Ireland
Average % Average %
All non-commissioned work for general public sale 49.0 43.0
All commissioned work 51.0 57.0
Total 100.0 100.0
Obs 151
Total Obs 160
Non-response rate (%) 5.6
MQ26. How has the percentage of your contemporary craft turnover from commissioned work changed over
the last three years (or since you've been trading) ...?
Read out - Mark one box only
UK
Northern Ireland
Percentage Percentage Frequency
Increased significantly 9.2 7.1 6
Increased slightly 21.7 21.2 18
Stayed roughly the same 41.5 31.8 27
Decreased slightly 13.2 15.3 13
Decreased significantly 8.6 21.2 18
Don’t know 5.9 3.5 3
Total 100.0 100.0 85
Note: Based on 85 respondents that have commissioned work
MQ27. Has your work ever been bought by a public collection?
Mark one box only
UK
Northern Ireland
Percentage Percentage Frequency
Yes 28.7 33.8 54
No 68.3 61.9 99
Don’t know 3.1 4.4 7
Total 100.0 100.0 160
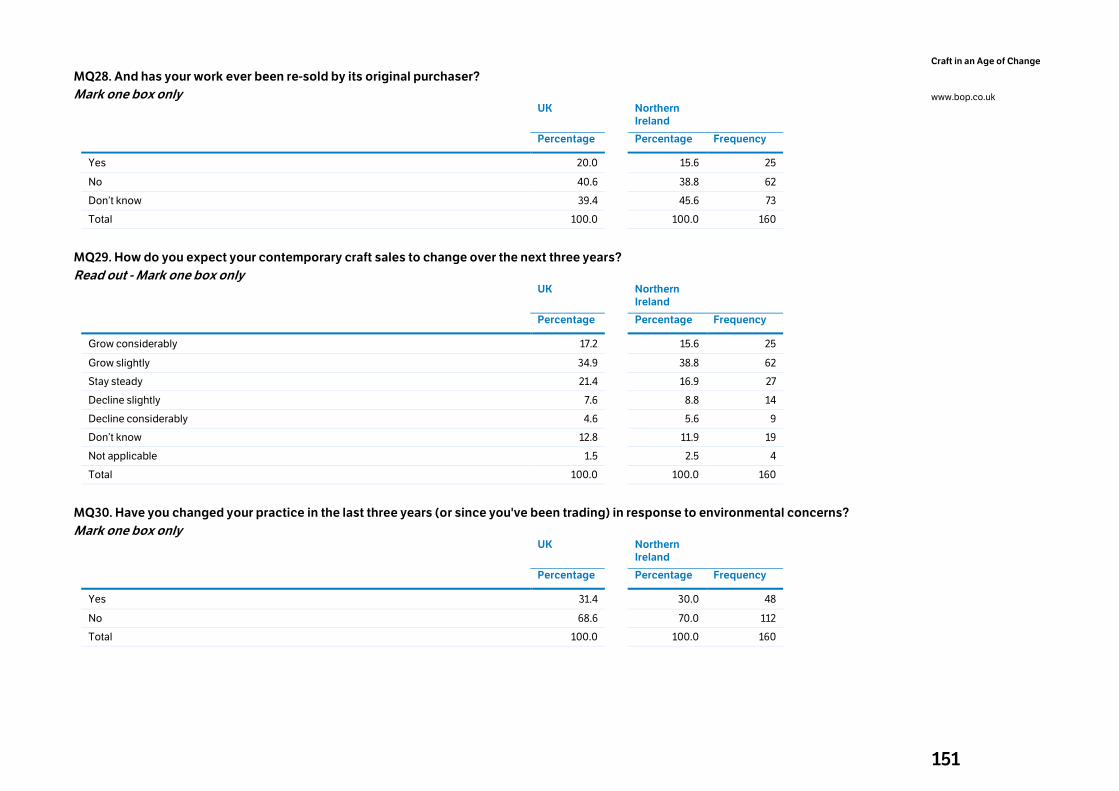
151
Craft in an Age of Change
www.bop.co.uk
MQ28. And has your work ever been re-sold by its original purchaser?
Mark one box only
UK
Northern Ireland
Percentage Percentage Frequency
Yes 20.0 15.6 25
No 40.6 38.8 62
Don’t know 39.4 45.6 73
Total 100.0 100.0 160
MQ29. How do you expect your contemporary craft sales to change over the next three years?
Read out - Mark one box only
UK
Northern Ireland
Percentage Percentage Frequency
Grow considerably 17.2 15.6 25
Grow slightly 34.9 38.8 62
Stay steady 21.4 16.9 27
Decline slightly 7.6 8.8 14
Decline considerably 4.6 5.6 9
Don’t know 12.8 11.9 19
Not applicable 1.5 2.5 4
Total 100.0 100.0 160
MQ30. Have you changed your practice in the last three years (or since you've been trading) in response to environmental concerns?
Mark one box only
UK
Northern Ireland
Percentage Percentage Frequency
Yes 31.4 30.0 48
No 68.6 70.0 112
Total 100.0 100.0 160
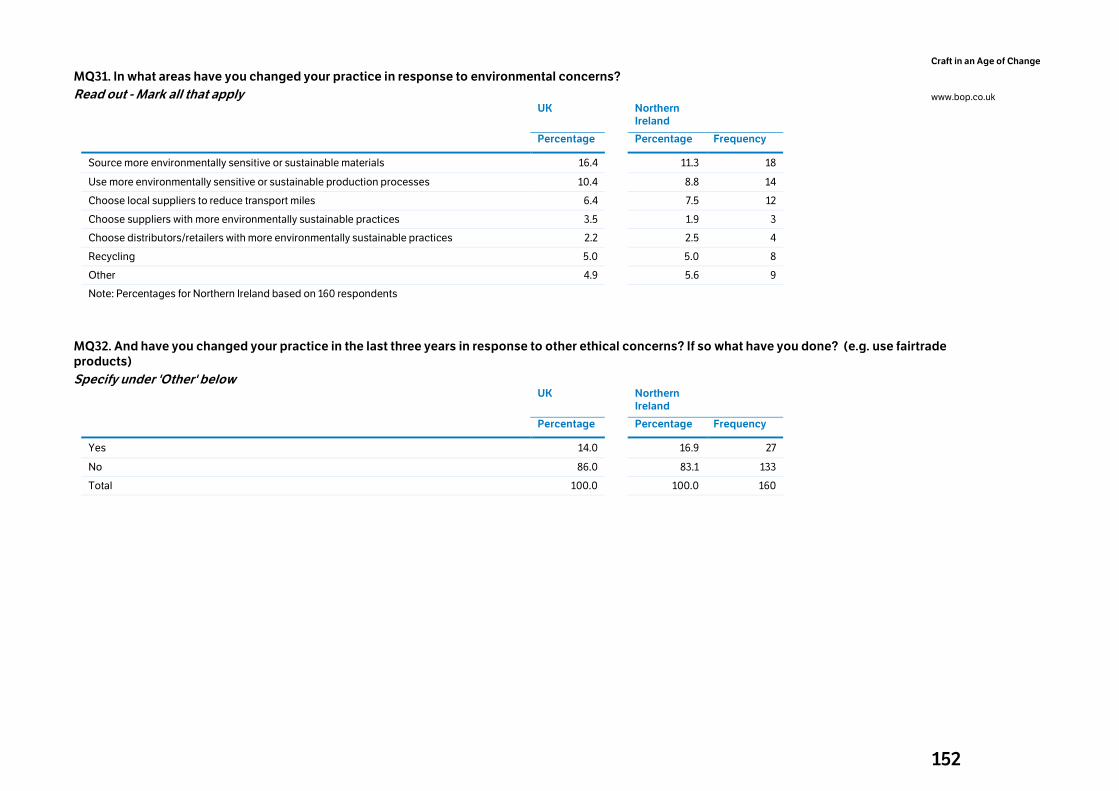
152
Craft in an Age of Change
www.bop.co.uk
MQ31. In what areas have you changed your practice in response to environmental concerns?
Read out - Mark all that apply
UK
Northern Ireland
Percentage Percentage Frequency
Source more environmentally sensitive or sustainable materials 16.4 11.3 18
Use more environmentally sensitive or sustainable production processes 10.4 8.8 14
Choose local suppliers to reduce transport miles 6.4 7.5 12
Choose suppliers with more environmentally sustainable practices 3.5 1.9 3
Choose distributors/retailers with more environmentally sustainable practices 2.2 2.5 4
Recycling 5.0 5.0 8
Other 4.9 5.6 9
Note: Percentages for Northern Ireland based on 160 respondents
MQ32. And have you changed your practice in the last three years in response to other ethical concerns? If so what have you done? (e.g. use fairtrade
products)
Specify under 'Other' below
UK
Northern Ireland
Percentage Percentage Frequency
Yes 14.0 16.9 27
No 86.0 83.1 133
Total 100.0 100.0 160
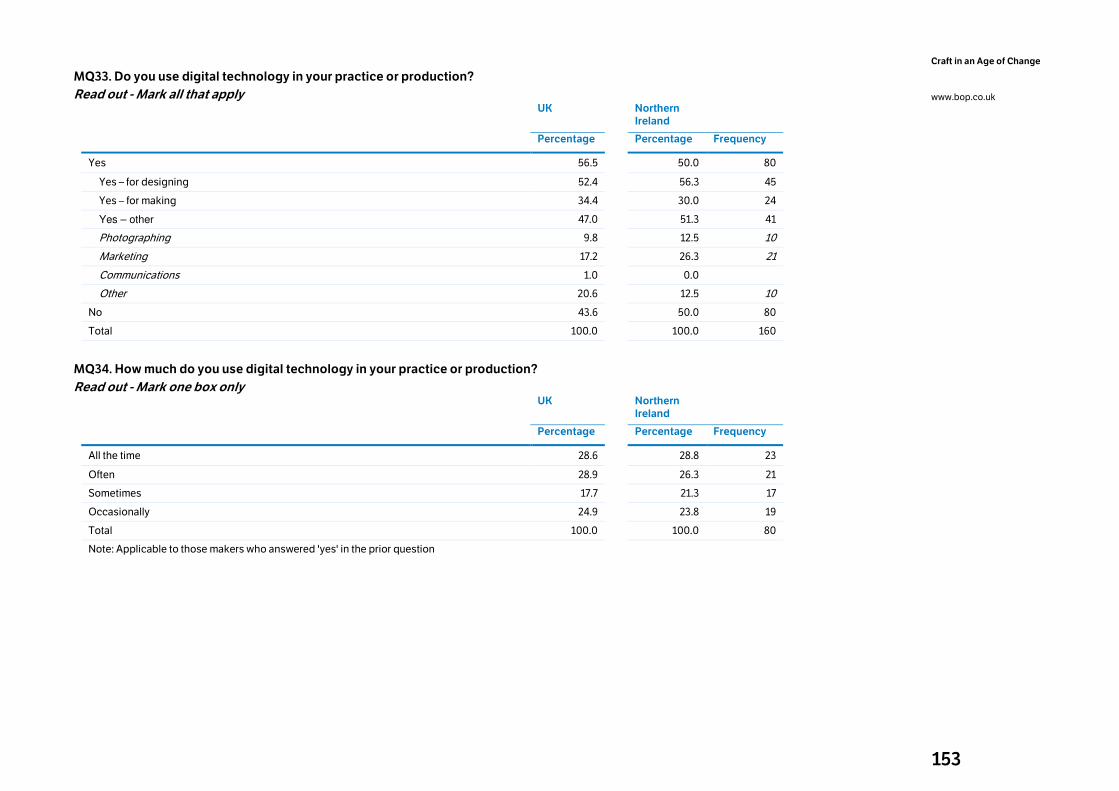
153
Craft in an Age of Change
www.bop.co.uk
MQ33. Do you use digital technology in your practice or production?
Read out - Mark all that apply
UK
Northern Ireland
Percentage Percentage Frequency
Yes 56.5 50.0 80
Yes – for designing 52.4 56.3 45
Yes – for making 34.4 30.0 24
Yes – other 47.0 51.3 41
Photographing 9.8 12.5 10
Marketing 17.2 26.3 21
Communications 1.0 0.0
Other 20.6 12.5 10
No 43.6 50.0 80
Total 100.0 100.0 160
MQ34. How much do you use digital technology in your practice or production?
Read out - Mark one box only
UK
Northern Ireland
Percentage Percentage Frequency
All the time 28.6 28.8 23
Often 28.9 26.3 21
Sometimes 17.7 21.3 17
Occasionally 24.9 23.8 19
Total 100.0 100.0 80
Note: Applicable to those makers who answered 'yes' in the prior question
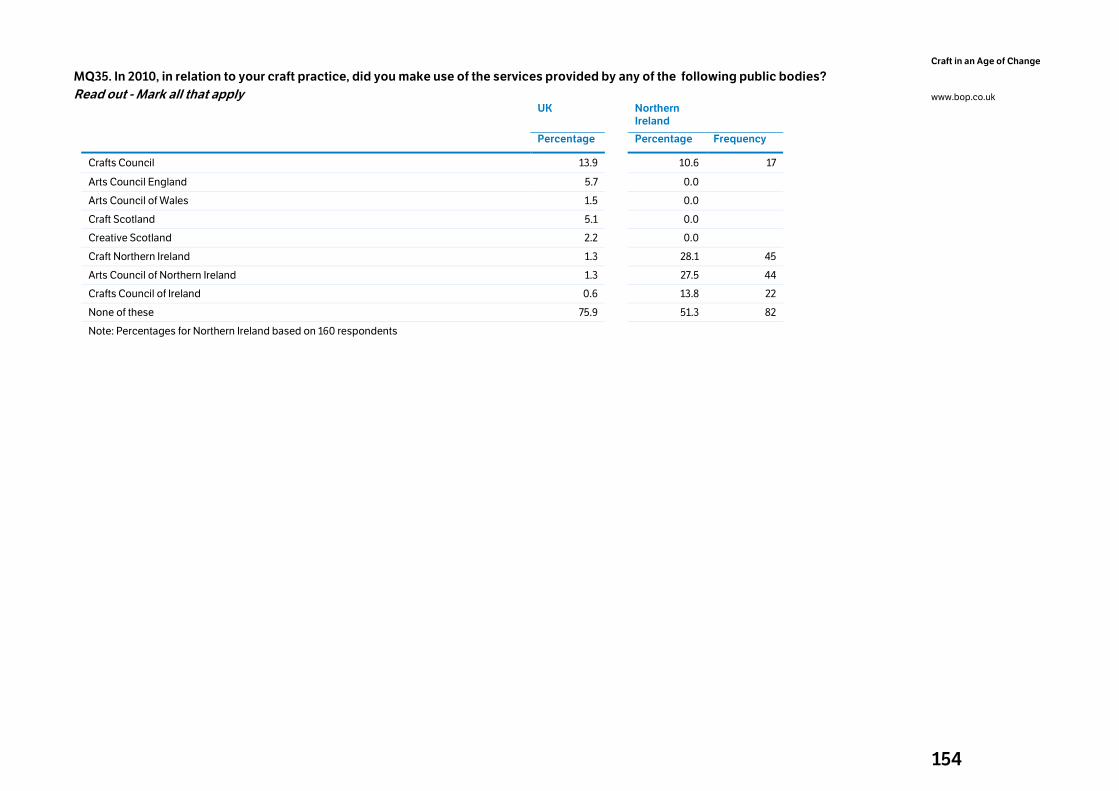
154
Craft in an Age of Change
www.bop.co.uk
MQ35. In 2010, in relation to your craft practice, did you make use of the services provided by any of the following public bodies?
Read out - Mark all that apply
UK
Northern Ireland
Percentage Percentage Frequency
Crafts Council 13.9 10.6 17
Arts Council England 5.7 0.0
Arts Council of Wales 1.5 0.0
Craft Scotland 5.1 0.0
Creative Scotland 2.2 0.0
Craft Northern Ireland 1.3 28.1 45
Arts Council of Northern Ireland 1.3 27.5 44
Crafts Council of Ireland 0.6 13.8 22
None of these 75.9 51.3 82
Note: Percentages for Northern Ireland based on 160 respondents
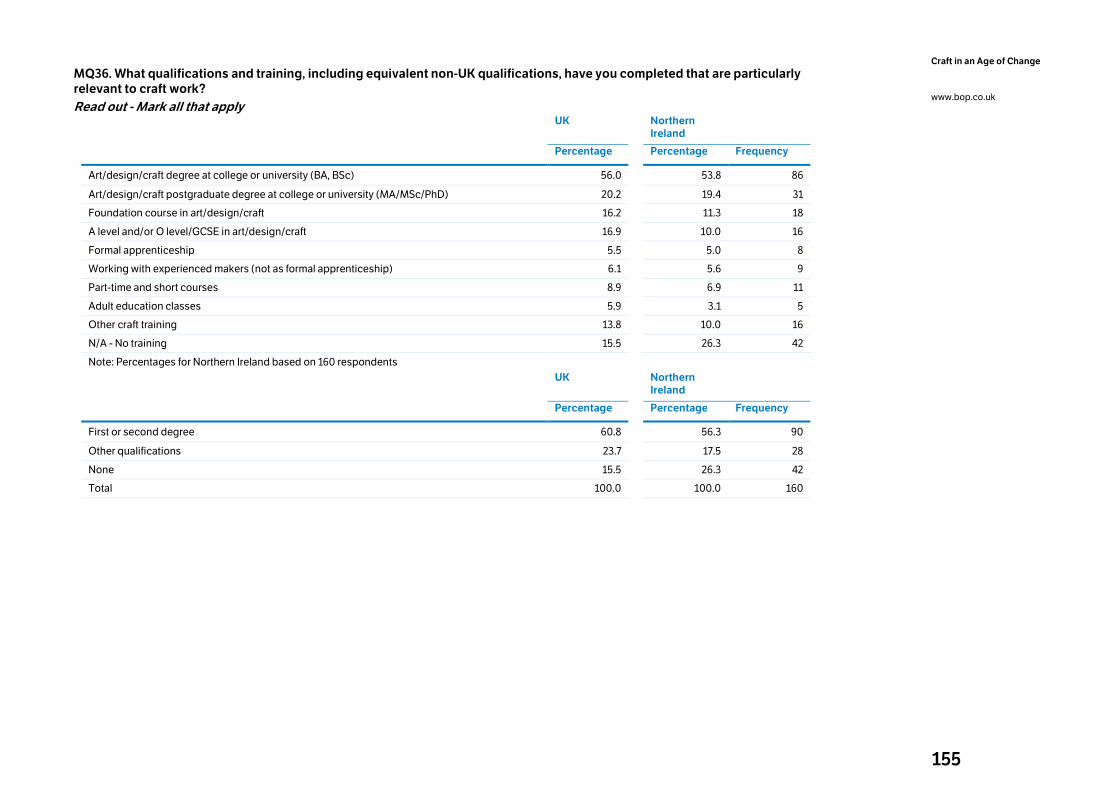
155
Craft in an Age of Change
www.bop.co.uk
MQ36. What qualifications and training, including equivalent non-UK qualifications, have you completed that are particularly
relevant to craft work?
Read out - Mark all that apply
UK
Northern Ireland
Percentage Percentage Frequency
Art/design/craft degree at college or university (BA, BSc) 56.0 53.8 86
Art/design/craft postgraduate degree at college or university (MA/MSc/PhD) 20.2 19.4 31
Foundation course in art/design/craft 16.2 11.3 18
A level and/or O level/GCSE in art/design/craft 16.9 10.0 16
Formal apprenticeship 5.5 5.0 8
Working with experienced makers (not as formal apprenticeship) 6.1 5.6 9
Part-time and short courses 8.9 6.9 11
Adult education classes 5.9 3.1 5
Other craft training 13.8 10.0 16
N/A - No training 15.5 26.3 42
Note: Percentages for Northern Ireland based on 160 respondents
UK
Northern Ireland
Percentage Percentage Frequency
First or second degree 60.8 56.3 90
Other qualifications 23.7 17.5 28
None 15.5 26.3 42
Total 100.0 100.0 160
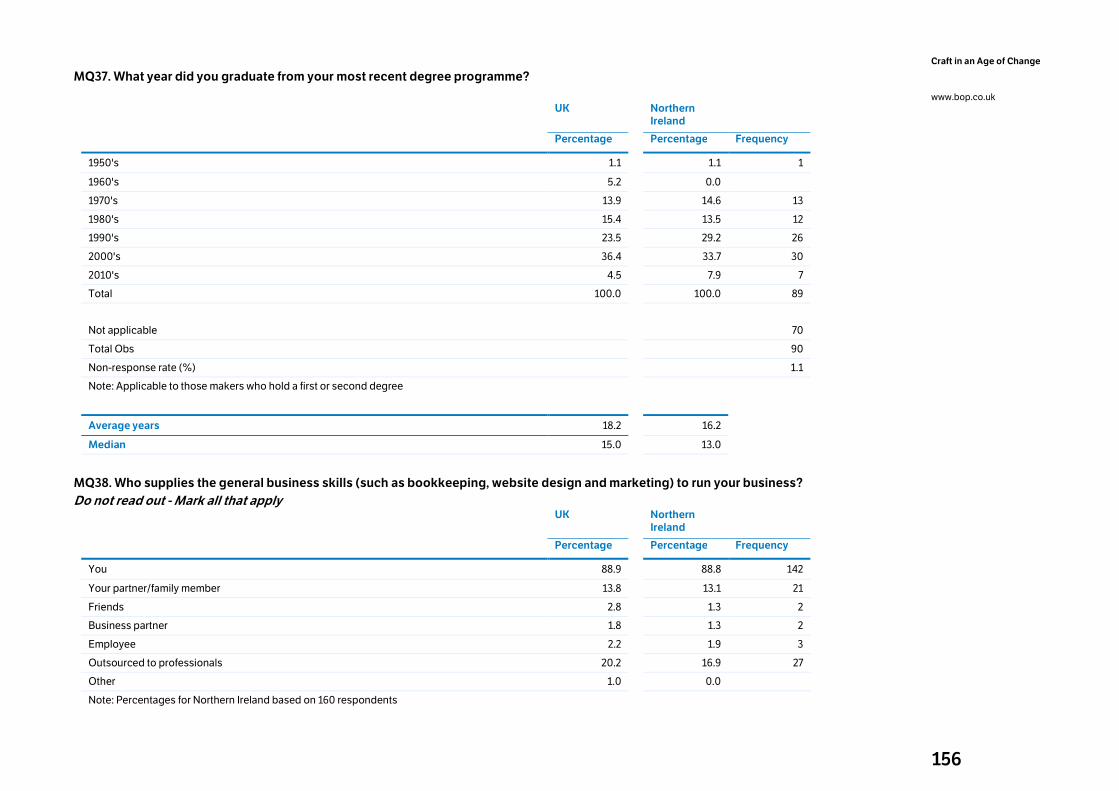
156
Craft in an Age of Change
www.bop.co.uk
MQ37. What year did you graduate from your most recent degree programme?
UK
Northern Ireland
Percentage Percentage Frequency
1950's 1.1 1.1 1
1960's 5.2 0.0
1970's 13.9 14.6 13
1980's 15.4 13.5 12
1990's 23.5 29.2 26
2000's 36.4 33.7 30
2010's 4.5 7.9 7
Total 100.0 100.0 89
Not applicable 70
Total Obs 90
Non-response rate (%) 1.1
Note: Applicable to those makers who hold a first or second degree
Average years 18.2 16.2
Median 15.0 13.0
MQ38. Who supplies the general business skills (such as bookkeeping, website design and marketing) to run your business?
Do not read out - Mark all that apply
UK
Northern Ireland
Percentage Percentage Frequency
You 88.9 88.8 142
Your partner/family member 13.8 13.1 21
Friends 2.8 1.3 2
Business partner 1.8 1.3 2
Employee 2.2 1.9 3
Outsourced to professionals 20.2 16.9 27
Other 1.0 0.0
Note: Percentages for Northern Ireland based on 160 respondents
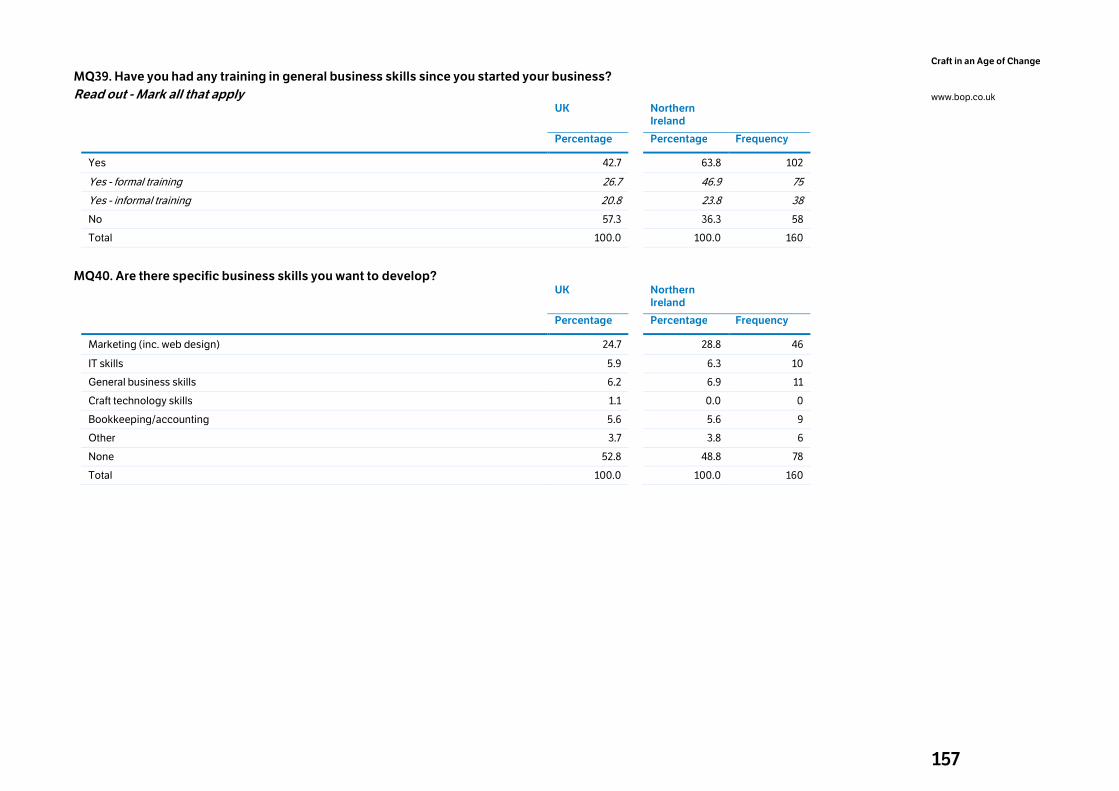
157
Craft in an Age of Change
www.bop.co.uk
MQ39. Have you had any training in general business skills since you started your business?
Read out - Mark all that apply
UK
Northern Ireland
Percentage Percentage Frequency
Yes 42.7 63.8 102
Yes - formal training 26.7 46.9 75
Yes - informal training 20.8 23.8 38
No 57.3 36.3 58
Total 100.0 100.0 160
MQ40. Are there specific business skills you want to develop?
UK
Northern Ireland
Percentage Percentage Frequency
Marketing (inc. web design) 24.7 28.8 46
IT skills 5.9 6.3 10
General business skills 6.2 6.9 11
Craft technology skills 1.1 0.0 0
Bookkeeping/accounting 5.6 5.6 9
Other 3.7 3.8 6
None 52.8 48.8 78
Total 100.0 100.0 160
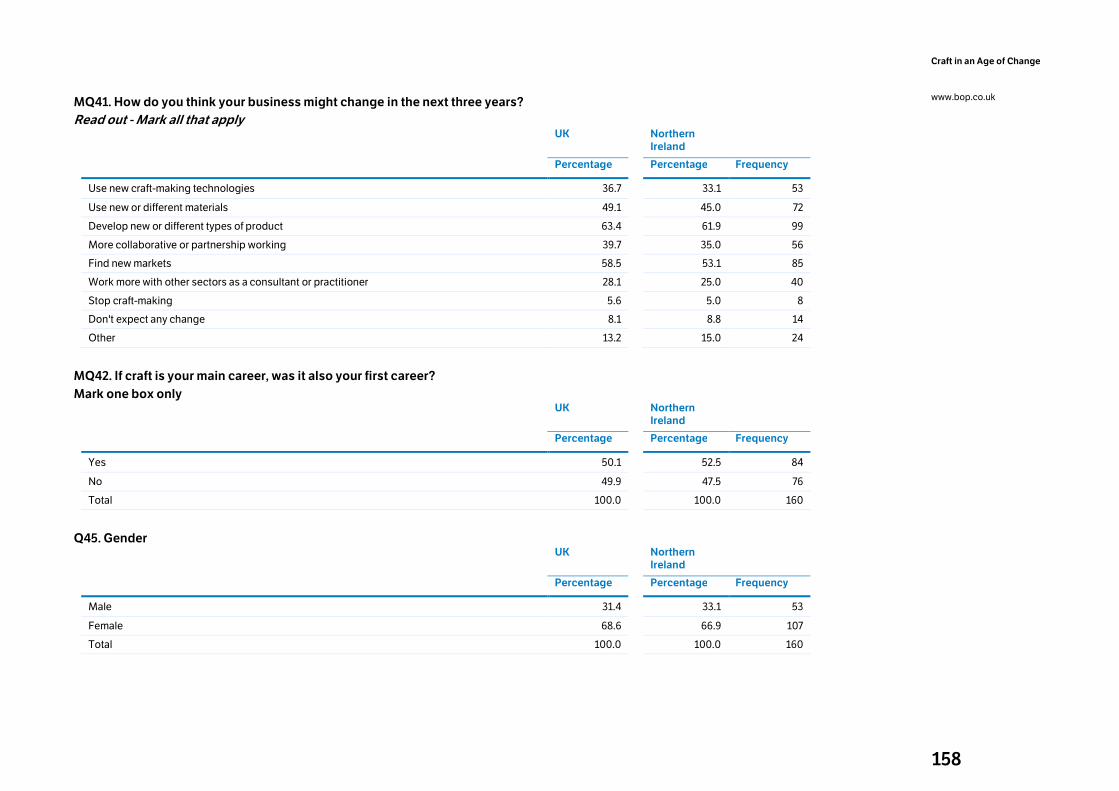
158
Craft in an Age of Change
www.bop.co.uk
MQ41. How do you think your business might change in the next three years?
Read out - Mark all that apply
UK
Northern Ireland
Percentage Percentage Frequency
Use new craft-making technologies 36.7 33.1 53
Use new or different materials 49.1 45.0 72
Develop new or different types of product 63.4 61.9 99
More collaborative or partnership working 39.7 35.0 56
Find new markets 58.5 53.1 85
Work more with other sectors as a consultant or practitioner 28.1 25.0 40
Stop craft-making 5.6 5.0 8
Don't expect any change 8.1 8.8 14
Other 13.2 15.0 24
MQ42. If craft is your main career, was it also your first career?
Mark one box only
UK
Northern Ireland
Percentage Percentage Frequency
Yes 50.1 52.5 84
No 49.9 47.5 76
Total 100.0 100.0 160
Q45. Gender
UK
Northern Ireland
Percentage Percentage Frequency
Male 31.4 33.1 53
Female 68.6 66.9 107
Total 100.0 100.0 160
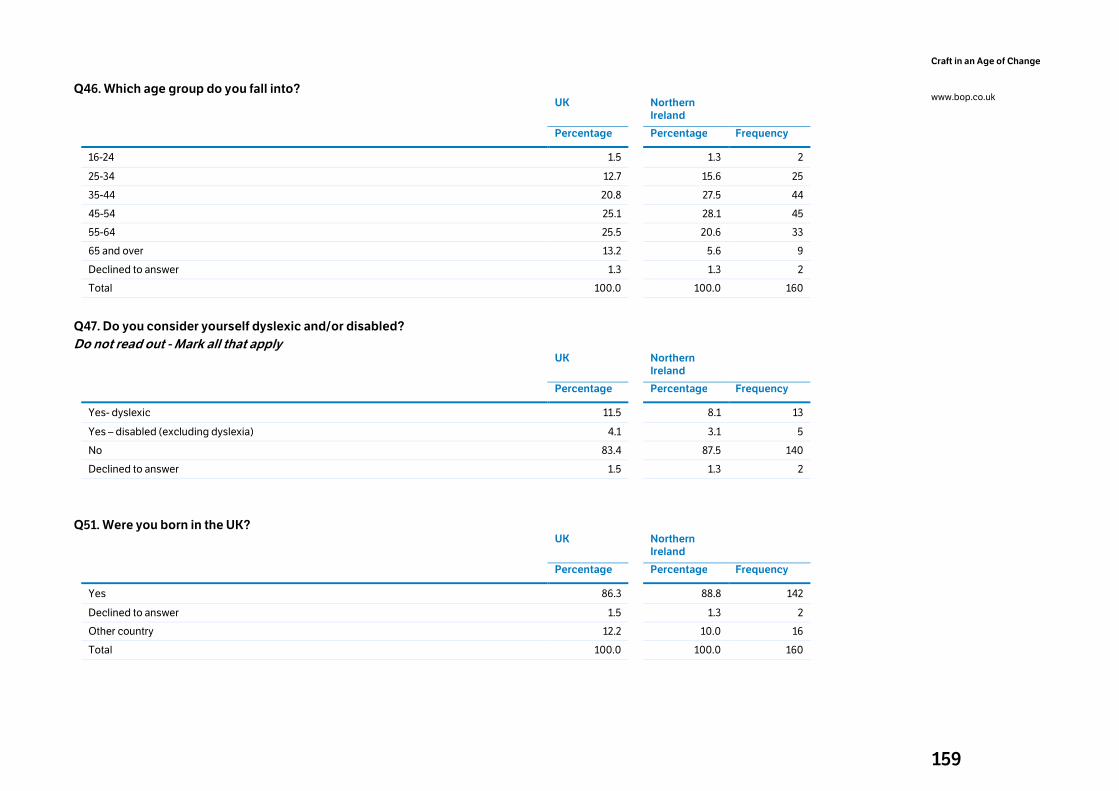
159
Craft in an Age of Change
www.bop.co.uk
Q46. Which age group do you fall into?
UK
Northern Ireland
Percentage Percentage Frequency
16-24 1.5 1.3 2
25-34 12.7 15.6 25
35-44 20.8 27.5 44
45-54 25.1 28.1 45
55-64 25.5 20.6 33
65 and over 13.2 5.6 9
Declined to answer 1.3 1.3 2
Total 100.0 100.0 160
Q47. Do you consider yourself dyslexic and/or disabled?
Do not read out - Mark all that apply
UK
Northern Ireland
Percentage Percentage Frequency
Yes- dyslexic 11.5 8.1 13
Yes – disabled (excluding dyslexia) 4.1 3.1 5
No 83.4 87.5 140
Declined to answer 1.5 1.3 2
Q51. Were you born in the UK?
UK
Northern Ireland
Percentage Percentage Frequency
Yes 86.3 88.8 142
Declined to answer 1.5 1.3 2
Other country 12.2 10.0 16
Total 100.0 100.0 160
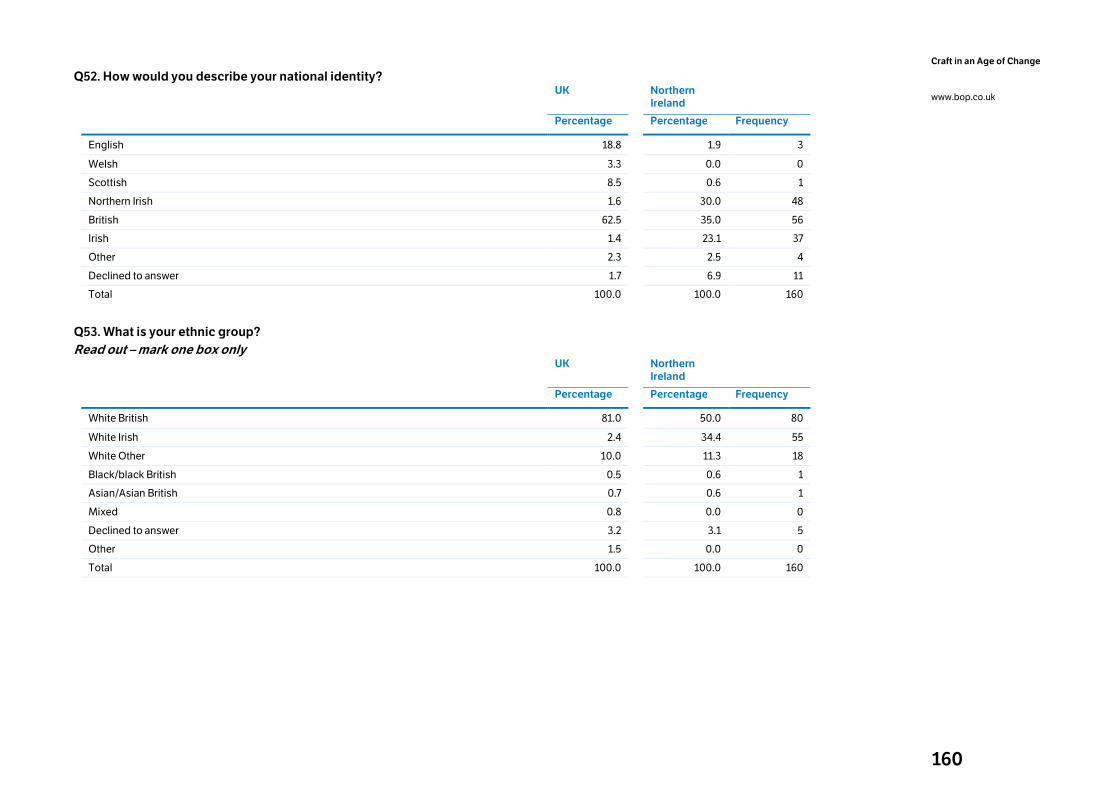
160
Craft in an Age of Change
www.bop.co.uk
Q52. How would you describe your national identity?
UK
Northern Ireland
Percentage Percentage Frequency
English 18.8 1.9 3
Welsh 3.3 0.0 0
Scottish 8.5 0.6 1
Northern Irish 1.6 30.0 48
British 62.5 35.0 56
Irish 1.4 23.1 37
Other 2.3 2.5 4
Declined to answer 1.7 6.9 11
Total 100.0 100.0 160
Q53. What is your ethnic group?
Read out – mark one box only
UK
Northern Ireland
Percentage
Percentage Frequency
White British 81.0 50.0 80
White Irish 2.4 34.4 55
White Other 10.0 11.3 18
Black/black British 0.5 0.6 1
Asian/Asian British 0.7 0.6 1
Mixed 0.8 0.0 0
Declined to answer 3.2 3.1 5
Other 1.5 0.0 0
Total 100.0 100.0 160
161
Craft in an Age of Change
www.bop.co.uk
12. Appendix 5: Retailers In all, 128 retailers were spoken to. This is not a large enough sample for
the results to be considered robust in a formal statistical sense, but the
researchers strived to obtain a broad selection of retailers from across
the UK. Those contacted included commercial galleries, sales outlets
within public galleries and museums, craft shops and online retailers.
The 128 came from:
• England: 86
• Scotland: 27
• Wales: 7
• Northern Ireland: 8
Some of the results of the survey of retailers have been discussed earlier
in chapters 4 and 6. Here we highlight some of the more interesting
points.
Just over half the respondents (53%) owned their retail outlet, either
outright or with others, while a quarter (24%) were managers of the
outlet. A quarter (24%) held another senior position in their company.
Key findings:
57 (44%) of the respondents sold only contemporary craft objects (these
retailers are referred to as ‘specialists’), 71 (56%) sold a mix of goods
(these are referred to as ‘generalists’). For these ‘generalist’ retailers
contemporary craft accounted for almost half of their revenues (48%).
• Estimated average revenue of specialist retailers: £126,046
• Estimated average revenue of generalist retailers: £121,256.
Craft sales were thought to have remained broadly stable over the last
three years. Retailers thought they had been selling more through their
websites, which had offset the reported fall in gallery/shop sales.
Specialists were a little less dependent on their gallery/shop sales than
generalist retailers were. There was little difference in the importance of
tourism between the two types of retailer.
Other findings:
• Two thirds of retailers (66%) had staff who were practising makers.
• Around 40% of respondents received support from public bodies.
Local authorities were the most frequently mentioned source of such
help.
• Almost half (47%) of the retailers ran an education or outreach
programme related to craft.
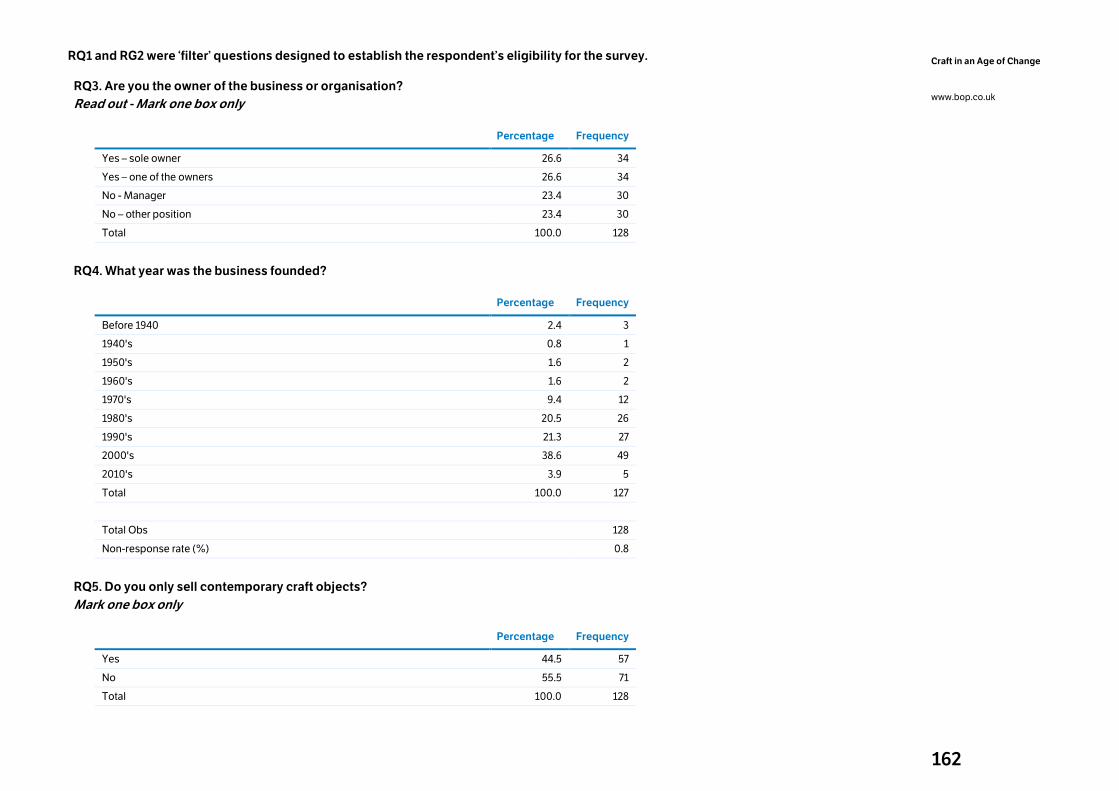
162
Craft in an Age of Change
www.bop.co.uk
RQ1 and RG2 were ‘filter’ questions designed to establish the respondent’s eligibility for the survey.
RQ3. Are you the owner of the business or organisation?
Read out - Mark one box only
Percentage Frequency
Yes – sole owner 26.6 34
Yes – one of the owners 26.6 34
No - Manager 23.4 30
No – other position 23.4 30
Total 100.0 128
RQ4. What year was the business founded?
Percentage Frequency
Before 1940 2.4 3
1940's 0.8 1
1950's 1.6 2
1960's 1.6 2
1970's 9.4 12
1980's 20.5 26
1990's 21.3 27
2000's 38.6 49
2010's 3.9 5
Total 100.0 127
Total Obs 128
Non-response rate (%) 0.8
RQ5. Do you only sell contemporary craft objects?
Mark one box only
Percentage Frequency
Yes 44.5 57
No 55.5 71
Total 100.0 128
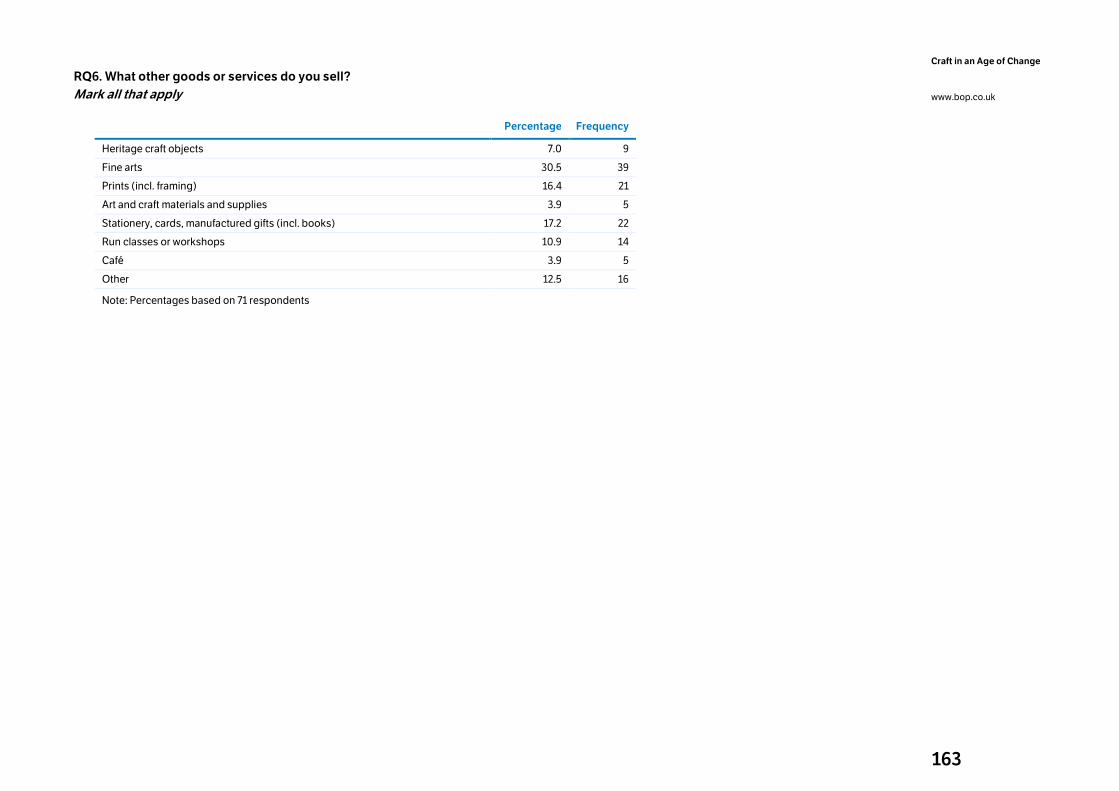
163
Craft in an Age of Change
www.bop.co.uk
RQ6. What other goods or services do you sell?
Mark all that apply
Percentage Frequency
Heritage craft objects 7.0 9
Fine arts 30.5 39
Prints (incl. framing) 16.4 21
Art and craft materials and supplies 3.9 5
Stationery, cards, manufactured gifts (incl. books) 17.2 22
Run classes or workshops 10.9 14
Café 3.9 5
Other 12.5 16
Note: Percentages based on 71 respondents
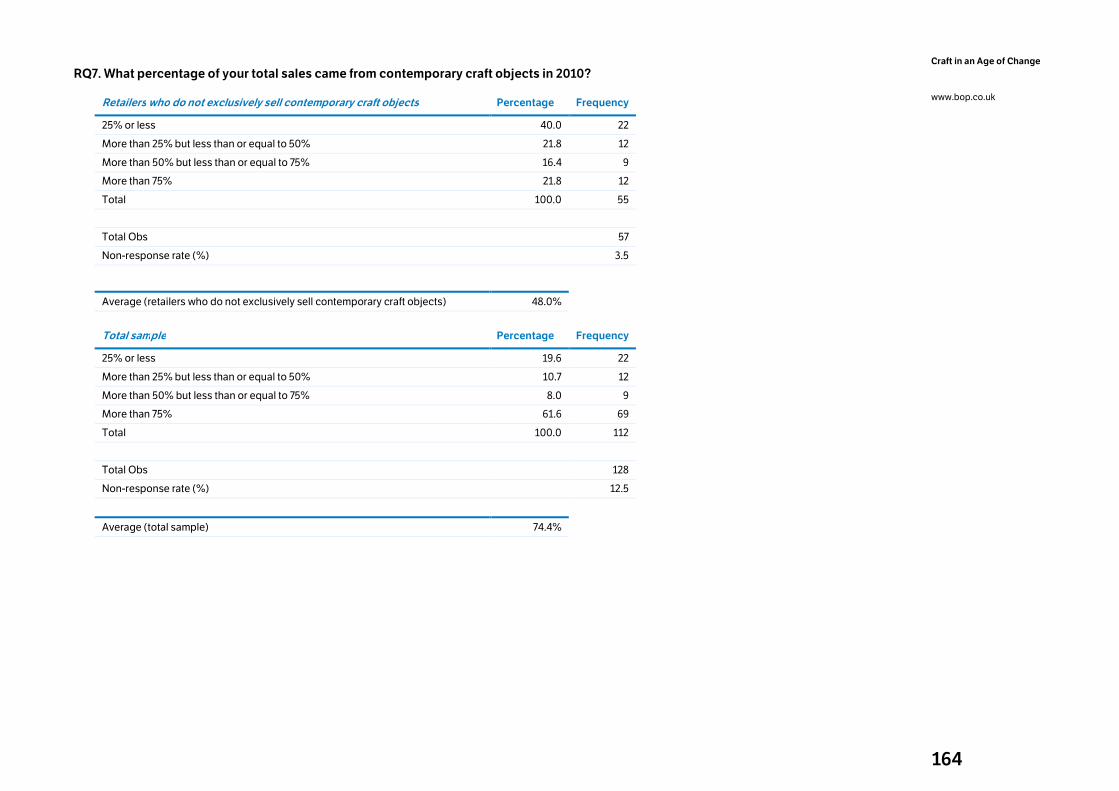
164
Craft in an Age of Change
www.bop.co.uk
RQ7. What percentage of your total sales came from contemporary craft objects in 2010?
Retailers who do not exclusively sell contemporary craft objects Percentage Frequency
25% or less 40.0 22
More than 25% but less than or equal to 50% 21.8 12
More than 50% but less than or equal to 75% 16.4 9
More than 75% 21.8 12
Total 100.0 55
Total Obs 57
Non-response rate (%) 3.5
Average (retailers who do not exclusively sell contemporary craft objects) 48.0%
Total sample Percentage Frequency
25% or less 19.6 22
More than 25% but less than or equal to 50% 10.7 12
More than 50% but less than or equal to 75% 8.0 9
More than 75% 61.6 69
Total 100.0 112
Total Obs 128
Non-response rate (%) 12.5
Average (total sample) 74.4%
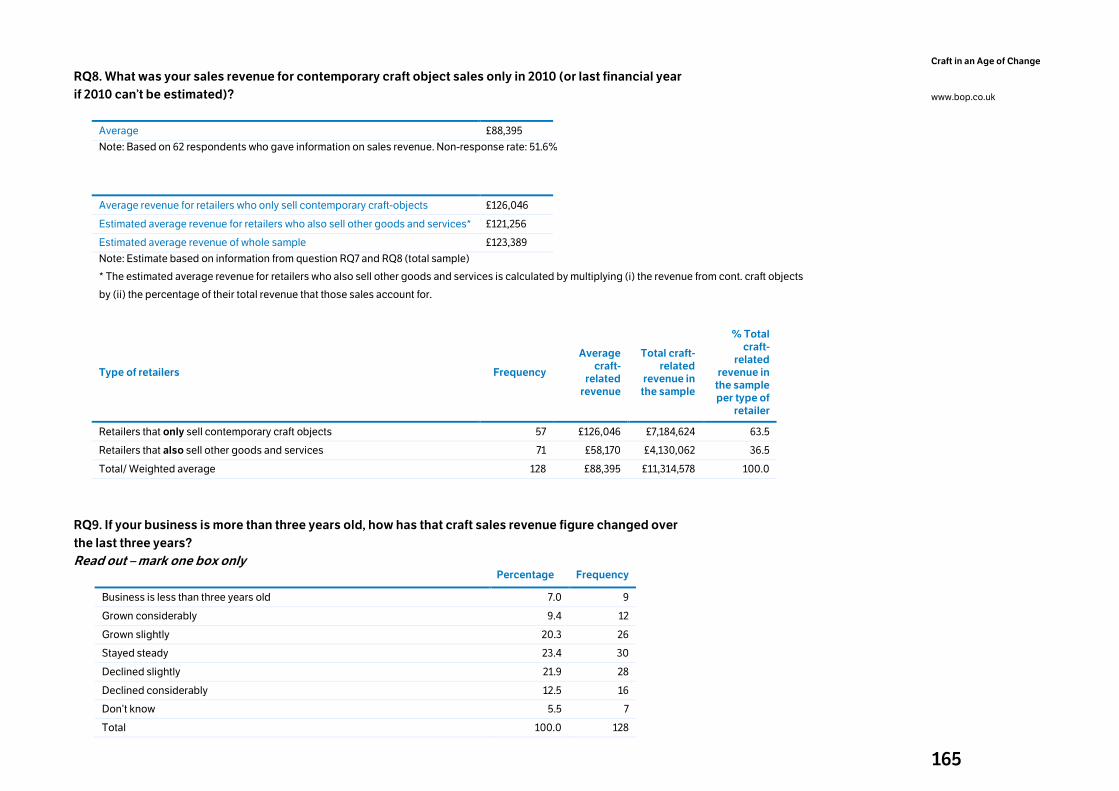
165
Craft in an Age of Change
www.bop.co.uk
RQ8. What was your sales revenue for contemporary craft object sales only in 2010 (or last financial year
if 2010 can’t be estimated)?
Average £88,395
Note: Based on 62 respondents who gave information on sales revenue. Non-response rate: 51.6%
Average revenue for retailers who only sell contemporary craft-objects £126,046
Estimated average revenue for retailers who also sell other goods and services* £121,256
Estimated average revenue of whole sample £123,389
Note: Estimate based on information from question RQ7 and RQ8 (total sample)
* The estimated average revenue for retailers who also sell other goods and services is calculated by multiplying (i) the revenue from cont. craft objects
by (ii) the percentage of their total revenue that those sales account for.
Type of retailers Frequency
Average craft-
related revenue
Total craft-related
revenue in the sample
% Total craft-
related revenue in the sample per type of
retailer
Retailers that only sell contemporary craft objects 57 £126,046 £7,184,624 63.5
Retailers that also sell other goods and services 71 £58,170 £4,130,062 36.5
Total/ Weighted average 128 £88,395 £11,314,578 100.0
RQ9. If your business is more than three years old, how has that craft sales revenue figure changed over
the last three years?
Read out – mark one box only
Percentage Frequency
Business is less than three years old 7.0 9
Grown considerably 9.4 12
Grown slightly 20.3 26
Stayed steady 23.4 30
Declined slightly 21.9 28
Declined considerably 12.5 16
Don’t know 5.5 7
Total 100.0 128
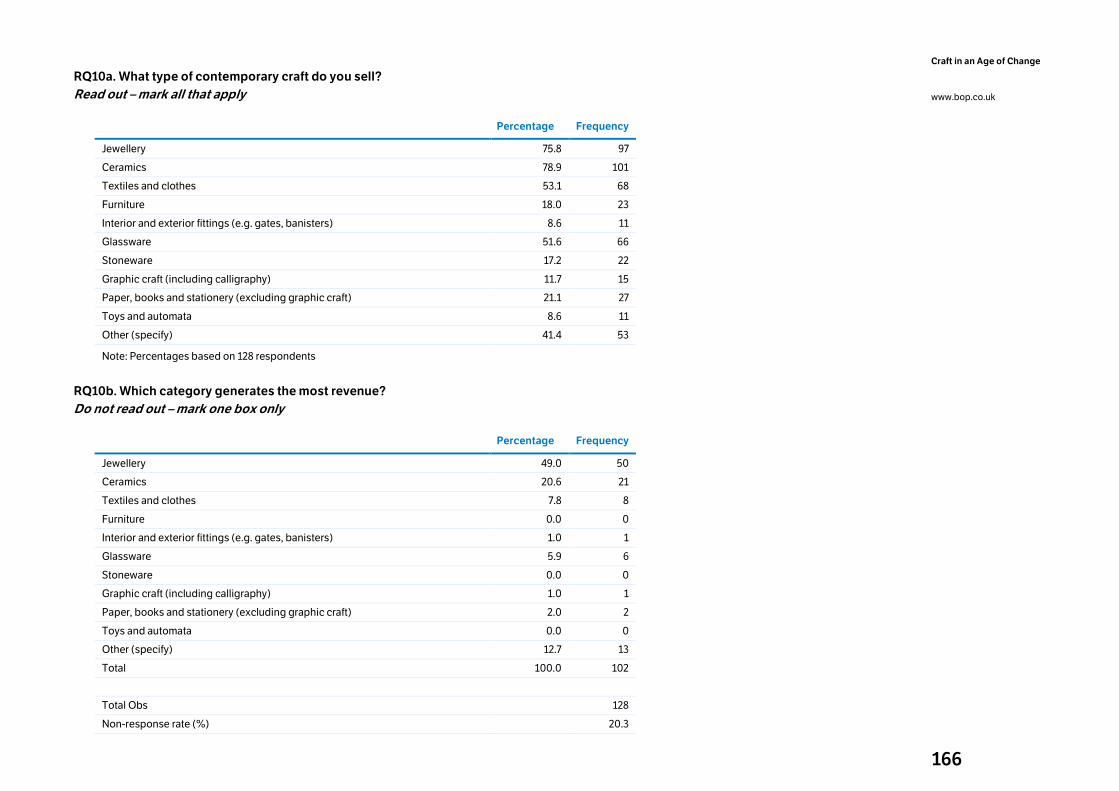
166
Craft in an Age of Change
www.bop.co.uk
RQ10a. What type of contemporary craft do you sell?
Read out – mark all that apply
Percentage Frequency
Jewellery 75.8 97
Ceramics 78.9 101
Textiles and clothes 53.1 68
Furniture 18.0 23
Interior and exterior fittings (e.g. gates, banisters) 8.6 11
Glassware 51.6 66
Stoneware 17.2 22
Graphic craft (including calligraphy) 11.7 15
Paper, books and stationery (excluding graphic craft) 21.1 27
Toys and automata 8.6 11
Other (specify) 41.4 53
Note: Percentages based on 128 respondents
RQ10b. Which category generates the most revenue?
Do not read out – mark one box only
Percentage Frequency
Jewellery 49.0 50
Ceramics 20.6 21
Textiles and clothes 7.8 8
Furniture 0.0 0
Interior and exterior fittings (e.g. gates, banisters) 1.0 1
Glassware 5.9 6
Stoneware 0.0 0
Graphic craft (including calligraphy) 1.0 1
Paper, books and stationery (excluding graphic craft) 2.0 2
Toys and automata 0.0 0
Other (specify) 12.7 13
Total 100.0 102
Total Obs 128
Non-response rate (%) 20.3
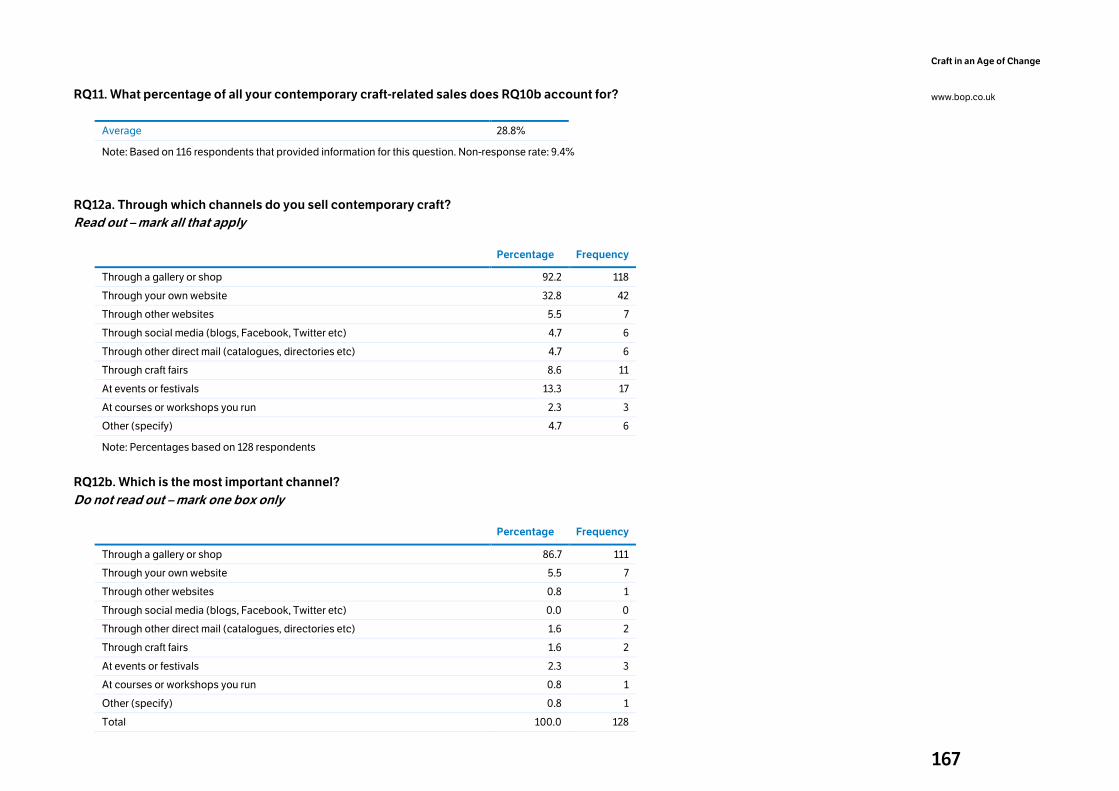
167
Craft in an Age of Change
www.bop.co.uk
RQ11. What percentage of all your contemporary craft-related sales does RQ10b account for?
Average 28.8%
Note: Based on 116 respondents that provided information for this question. Non-response rate: 9.4%
RQ12a. Through which channels do you sell contemporary craft?
Read out – mark all that apply
Percentage Frequency
Through a gallery or shop 92.2 118
Through your own website 32.8 42
Through other websites 5.5 7
Through social media (blogs, Facebook, Twitter etc) 4.7 6
Through other direct mail (catalogues, directories etc) 4.7 6
Through craft fairs 8.6 11
At events or festivals 13.3 17
At courses or workshops you run 2.3 3
Other (specify) 4.7 6
Note: Percentages based on 128 respondents
RQ12b. Which is the most important channel?
Do not read out – mark one box only
Percentage Frequency
Through a gallery or shop 86.7 111
Through your own website 5.5 7
Through other websites 0.8 1
Through social media (blogs, Facebook, Twitter etc) 0.0 0
Through other direct mail (catalogues, directories etc) 1.6 2
Through craft fairs 1.6 2
At events or festivals 2.3 3
At courses or workshops you run 0.8 1
Other (specify) 0.8 1
Total 100.0 128
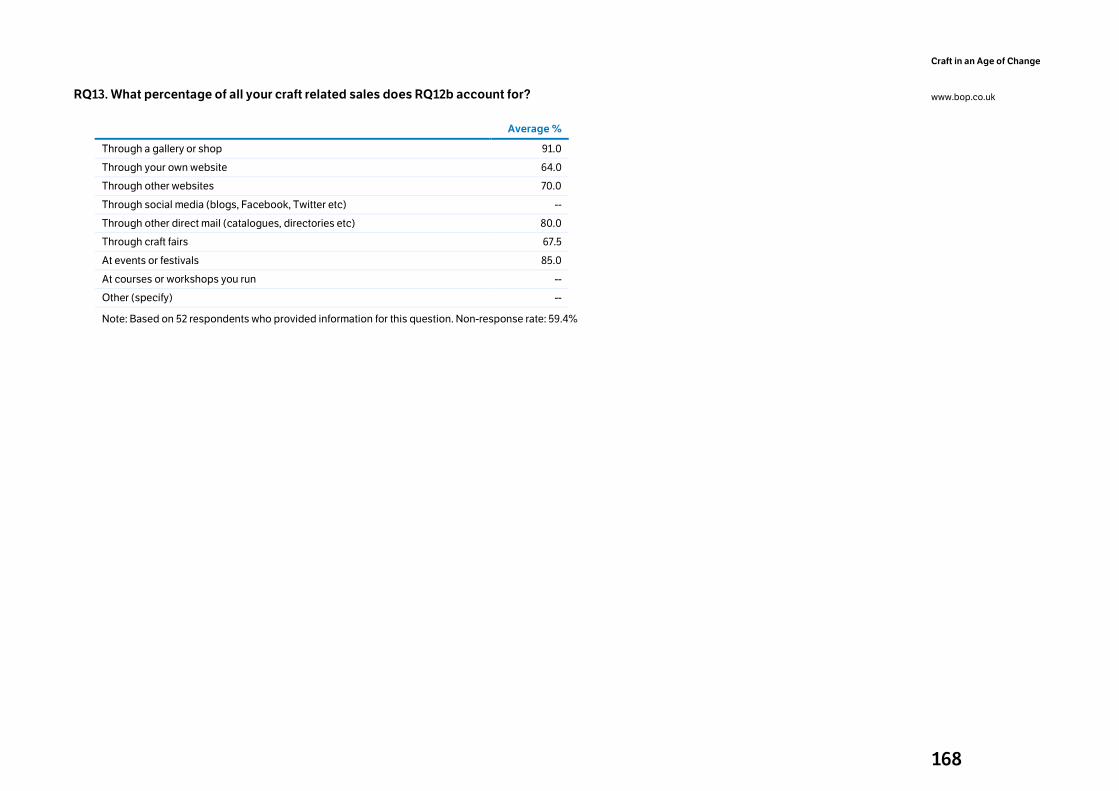
168
Craft in an Age of Change
www.bop.co.uk
RQ13. What percentage of all your craft related sales does RQ12b account for?
Average %
Through a gallery or shop 91.0
Through your own website 64.0
Through other websites 70.0
Through social media (blogs, Facebook, Twitter etc) --
Through other direct mail (catalogues, directories etc) 80.0
Through craft fairs 67.5
At events or festivals 85.0
At courses or workshops you run --
Other (specify) --
Note: Based on 52 respondents who provided information for this question. Non-response rate: 59.4%
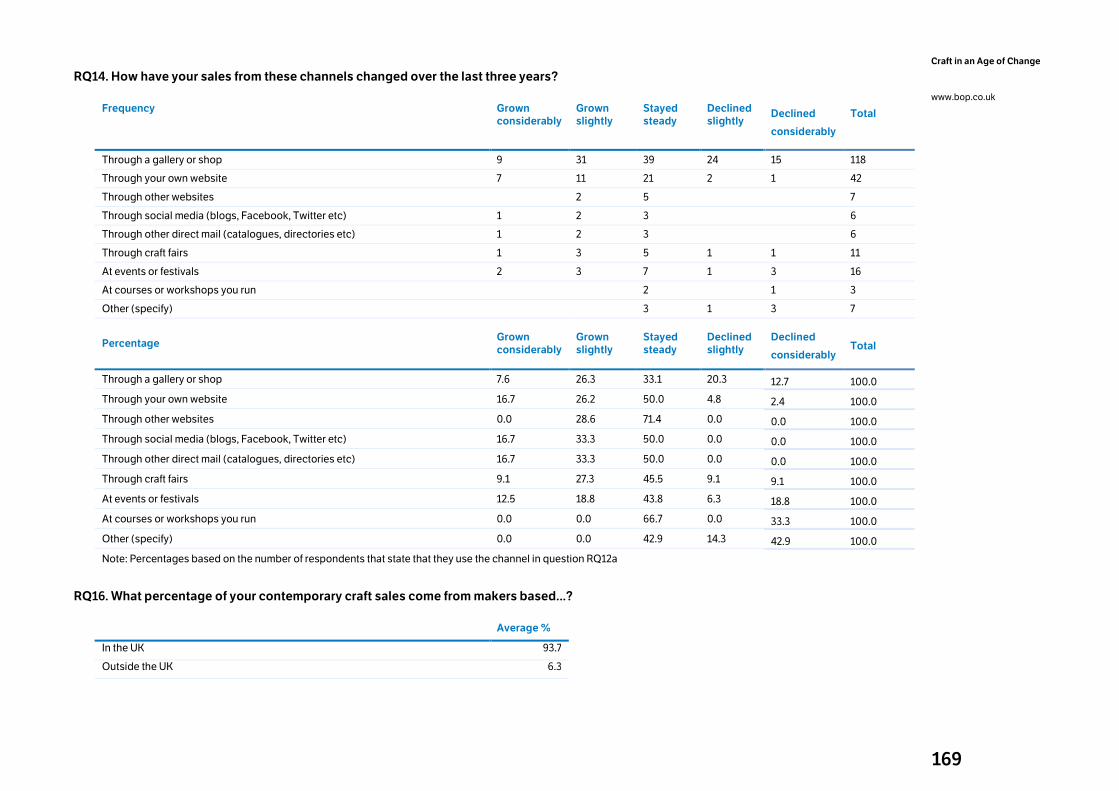
169
Craft in an Age of Change
www.bop.co.uk
RQ14. How have your sales from these channels changed over the last three years?
Frequency Grown considerably
Grown slightly
Stayed steady
Declined slightly
Declined
considerably
Total
Through a gallery or shop 9 31 39 24 15 118
Through your own website 7 11 21 2 1 42
Through other websites 2 5 7
Through social media (blogs, Facebook, Twitter etc) 1 2 3 6
Through other direct mail (catalogues, directories etc) 1 2 3 6
Through craft fairs 1 3 5 1 1 11
At events or festivals 2 3 7 1 3 16
At courses or workshops you run 2 1 3
Other (specify) 3 1 3 7
Percentage Grown considerably
Grown slightly
Stayed steady
Declined slightly
Declined
considerably Total
Through a gallery or shop 7.6 26.3 33.1 20.3 12.7 100.0
Through your own website 16.7 26.2 50.0 4.8 2.4 100.0
Through other websites 0.0 28.6 71.4 0.0 0.0 100.0
Through social media (blogs, Facebook, Twitter etc) 16.7 33.3 50.0 0.0 0.0 100.0
Through other direct mail (catalogues, directories etc) 16.7 33.3 50.0 0.0 0.0 100.0
Through craft fairs 9.1 27.3 45.5 9.1 9.1 100.0
At events or festivals 12.5 18.8 43.8 6.3 18.8 100.0
At courses or workshops you run 0.0 0.0 66.7 0.0 33.3 100.0
Other (specify) 0.0 0.0 42.9 14.3 42.9 100.0
Note: Percentages based on the number of respondents that state that they use the channel in question RQ12a
RQ16. What percentage of your contemporary craft sales come from makers based...?
Average %
In the UK 93.7
Outside the UK 6.3
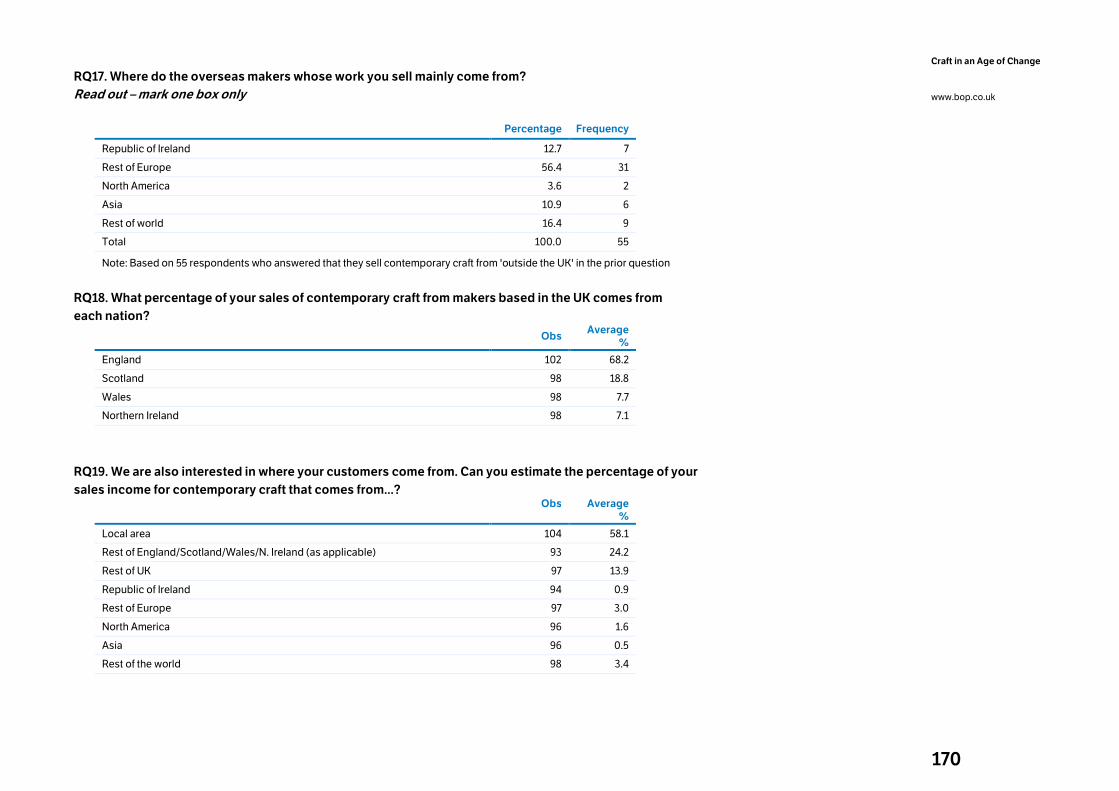
170
Craft in an Age of Change
www.bop.co.uk
RQ17. Where do the overseas makers whose work you sell mainly come from?
Read out – mark one box only
Percentage Frequency
Republic of Ireland 12.7 7
Rest of Europe 56.4 31
North America 3.6 2
Asia 10.9 6
Rest of world 16.4 9
Total 100.0 55
Note: Based on 55 respondents who answered that they sell contemporary craft from 'outside the UK' in the prior question
RQ18. What percentage of your sales of contemporary craft from makers based in the UK comes from
each nation?
Obs Average
%
England 102 68.2
Scotland 98 18.8
Wales 98 7.7
Northern Ireland 98 7.1
RQ19. We are also interested in where your customers come from. Can you estimate the percentage of your
sales income for contemporary craft that comes from...?
Obs Average
%
Local area 104 58.1
Rest of England/Scotland/Wales/N. Ireland (as applicable) 93 24.2
Rest of UK 97 13.9
Republic of Ireland 94 0.9
Rest of Europe 97 3.0
North America 96 1.6
Asia 96 0.5
Rest of the world 98 3.4
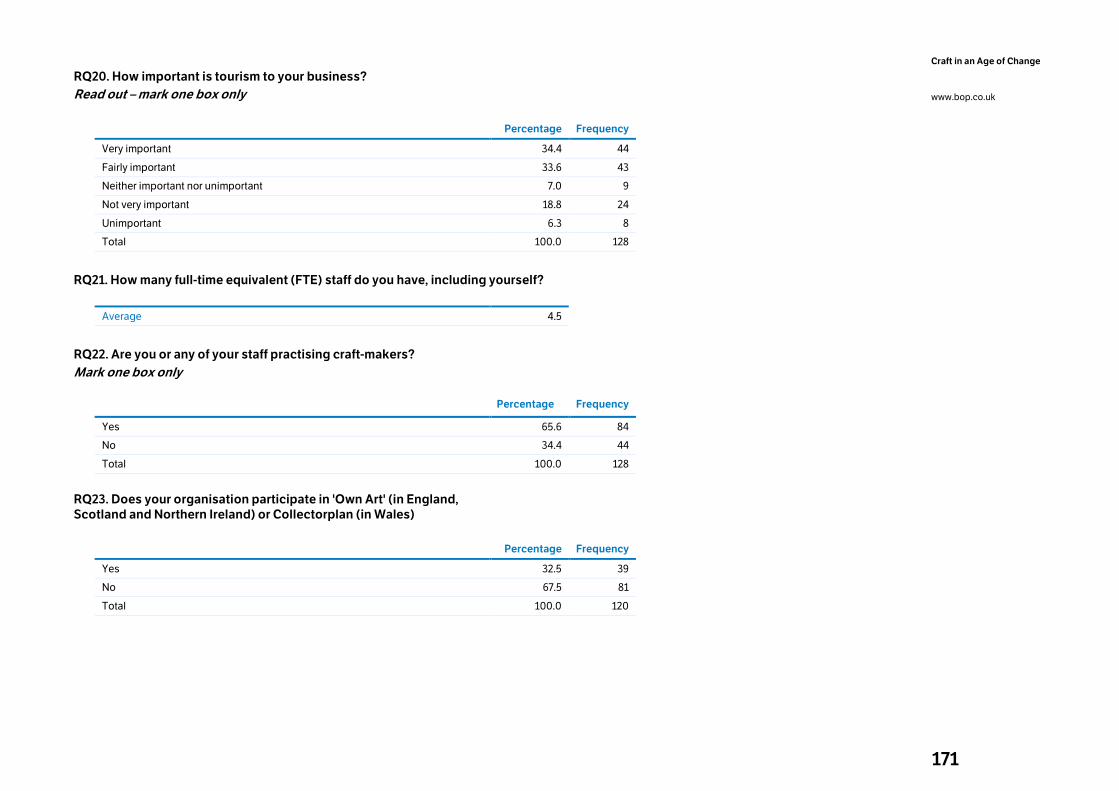
171
Craft in an Age of Change
www.bop.co.uk
RQ20. How important is tourism to your business?
Read out – mark one box only
Percentage Frequency
Very important 34.4 44
Fairly important 33.6 43
Neither important nor unimportant 7.0 9
Not very important 18.8 24
Unimportant 6.3 8
Total 100.0 128
RQ21. How many full-time equivalent (FTE) staff do you have, including yourself?
Average 4.5
RQ22. Are you or any of your staff practising craft-makers?
Mark one box only
Percentage Frequency
Yes 65.6 84
No 34.4 44
Total 100.0 128
RQ23. Does your organisation participate in 'Own Art' (in England,
Scotland and Northern Ireland) or Collectorplan (in Wales)
Percentage Frequency
Yes 32.5 39
No 67.5 81
Total 100.0 120
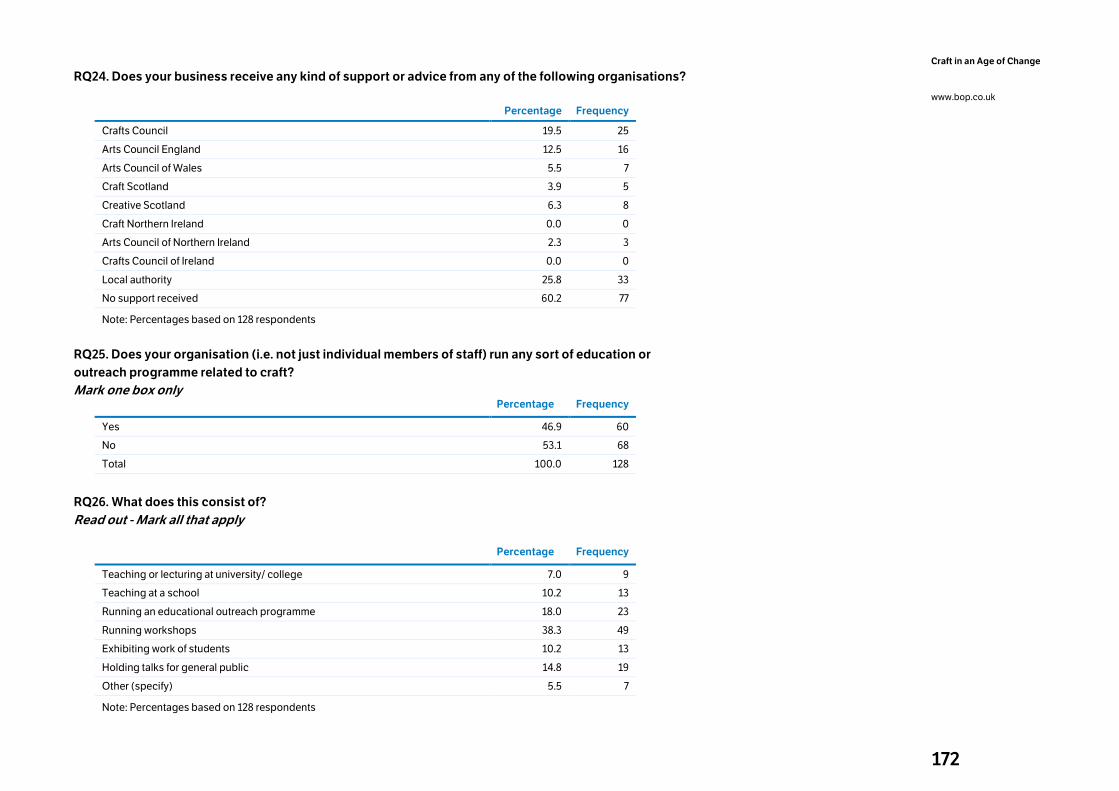
172
Craft in an Age of Change
www.bop.co.uk
RQ24. Does your business receive any kind of support or advice from any of the following organisations?
Percentage Frequency
Crafts Council 19.5 25
Arts Council England 12.5 16
Arts Council of Wales 5.5 7
Craft Scotland 3.9 5
Creative Scotland 6.3 8
Craft Northern Ireland 0.0 0
Arts Council of Northern Ireland 2.3 3
Crafts Council of Ireland 0.0 0
Local authority 25.8 33
No support received 60.2 77
Note: Percentages based on 128 respondents
RQ25. Does your organisation (i.e. not just individual members of staff) run any sort of education or
outreach programme related to craft?
Mark one box only
Percentage Frequency
Yes 46.9 60
No 53.1 68
Total 100.0 128
RQ26. What does this consist of?
Read out - Mark all that apply
Percentage Frequency
Teaching or lecturing at university/ college 7.0 9
Teaching at a school 10.2 13
Running an educational outreach programme 18.0 23
Running workshops 38.3 49
Exhibiting work of students 10.2 13
Holding talks for general public 14.8 19
Other (specify) 5.5 7
Note: Percentages based on 128 respondents
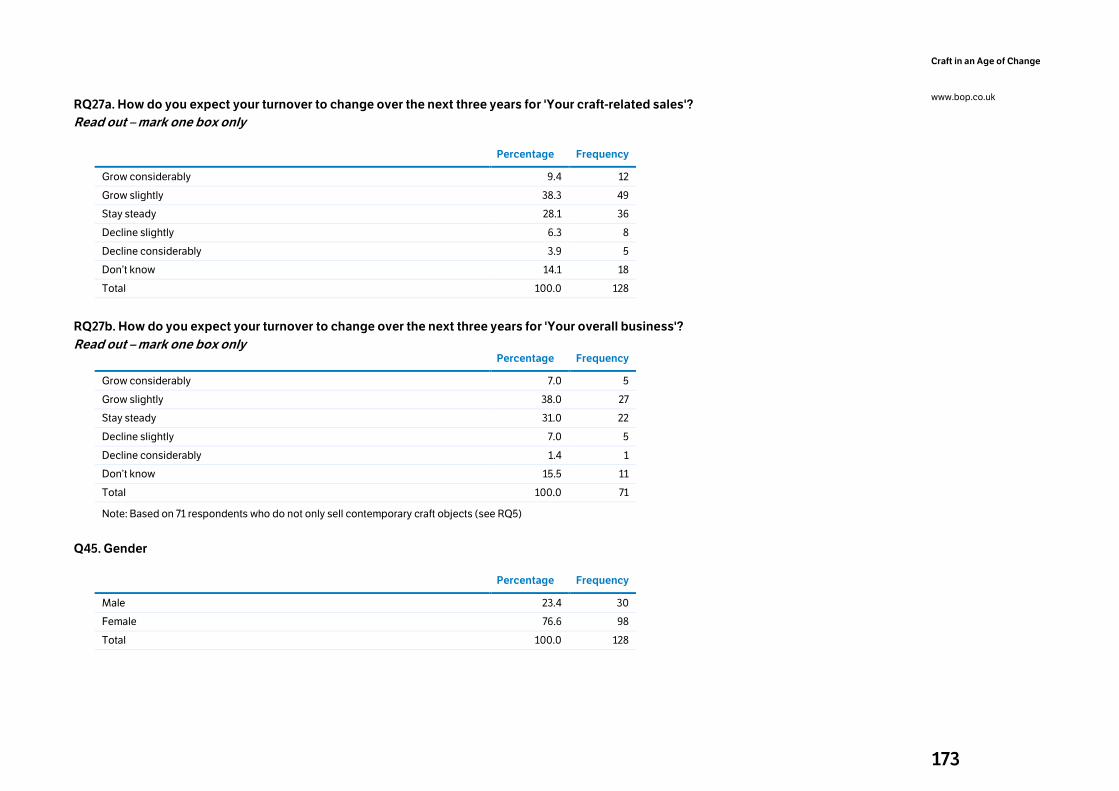
173
Craft in an Age of Change
www.bop.co.uk
RQ27a. How do you expect your turnover to change over the next three years for 'Your craft-related sales'?
Read out – mark one box only
Percentage Frequency
Grow considerably 9.4 12
Grow slightly 38.3 49
Stay steady 28.1 36
Decline slightly 6.3 8
Decline considerably 3.9 5
Don’t know 14.1 18
Total 100.0 128
RQ27b. How do you expect your turnover to change over the next three years for 'Your overall business'?
Read out – mark one box only
Percentage Frequency
Grow considerably 7.0 5
Grow slightly 38.0 27
Stay steady 31.0 22
Decline slightly 7.0 5
Decline considerably 1.4 1
Don’t know 15.5 11
Total 100.0 71
Note: Based on 71 respondents who do not only sell contemporary craft objects (see RQ5)
Q45. Gender
Percentage Frequency
Male 23.4 30
Female 76.6 98
Total 100.0 128
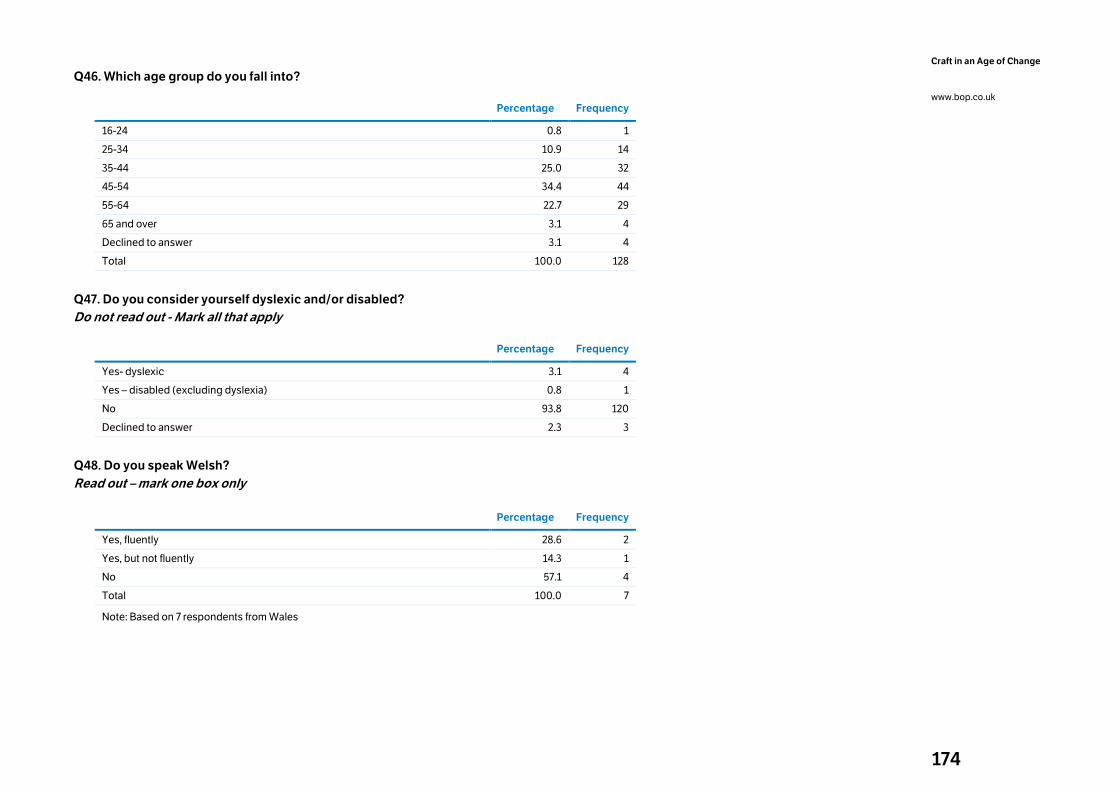
174
Craft in an Age of Change
www.bop.co.uk
Q46. Which age group do you fall into?
Percentage Frequency
16-24 0.8 1
25-34 10.9 14
35-44 25.0 32
45-54 34.4 44
55-64 22.7 29
65 and over 3.1 4
Declined to answer 3.1 4
Total 100.0 128
Q47. Do you consider yourself dyslexic and/or disabled?
Do not read out - Mark all that apply
Percentage Frequency
Yes- dyslexic 3.1 4
Yes – disabled (excluding dyslexia) 0.8 1
No 93.8 120
Declined to answer 2.3 3
Q48. Do you speak Welsh?
Read out – mark one box only
Percentage Frequency
Yes, fluently 28.6 2
Yes, but not fluently 14.3 1
No 57.1 4
Total 100.0 7
Note: Based on 7 respondents from Wales
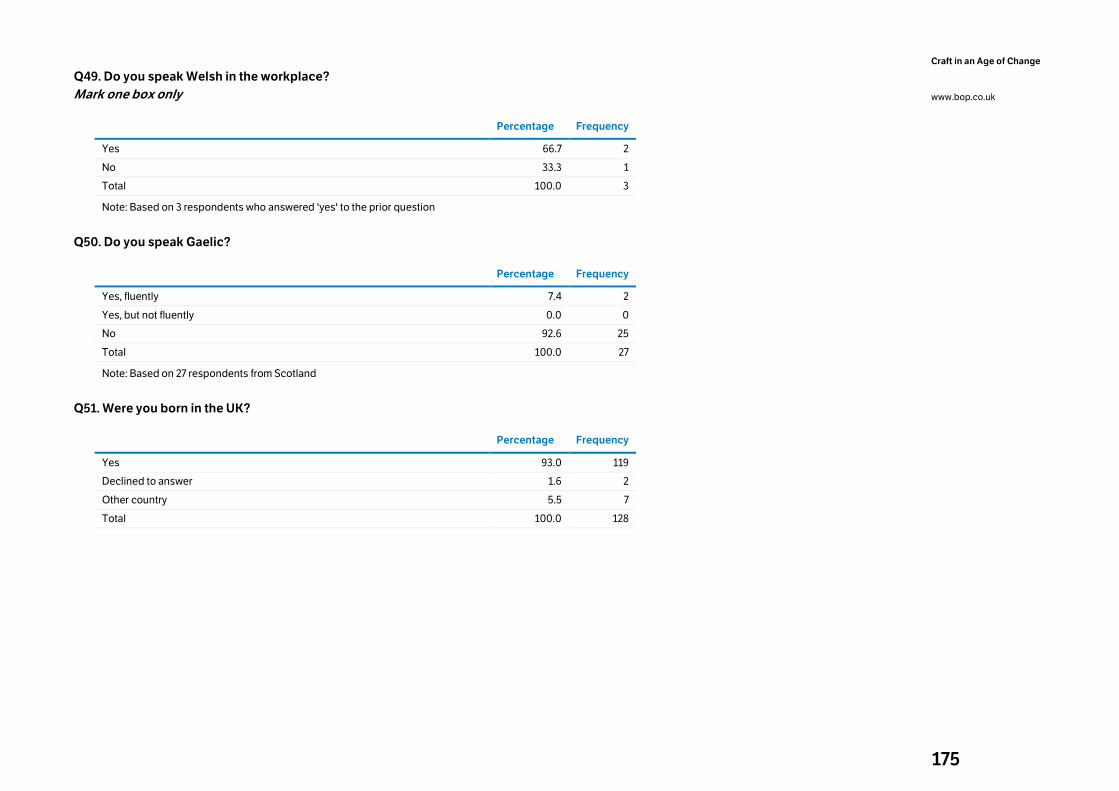
175
Craft in an Age of Change
www.bop.co.uk
Q49. Do you speak Welsh in the workplace?
Mark one box only
Percentage Frequency
Yes 66.7 2
No 33.3 1
Total 100.0 3
Note: Based on 3 respondents who answered 'yes' to the prior question
Q50. Do you speak Gaelic?
Percentage Frequency
Yes, fluently 7.4 2
Yes, but not fluently 0.0 0
No 92.6 25
Total 100.0 27
Note: Based on 27 respondents from Scotland
Q51. Were you born in the UK?
Percentage Frequency
Yes 93.0 119
Declined to answer 1.6 2
Other country 5.5 7
Total 100.0 128
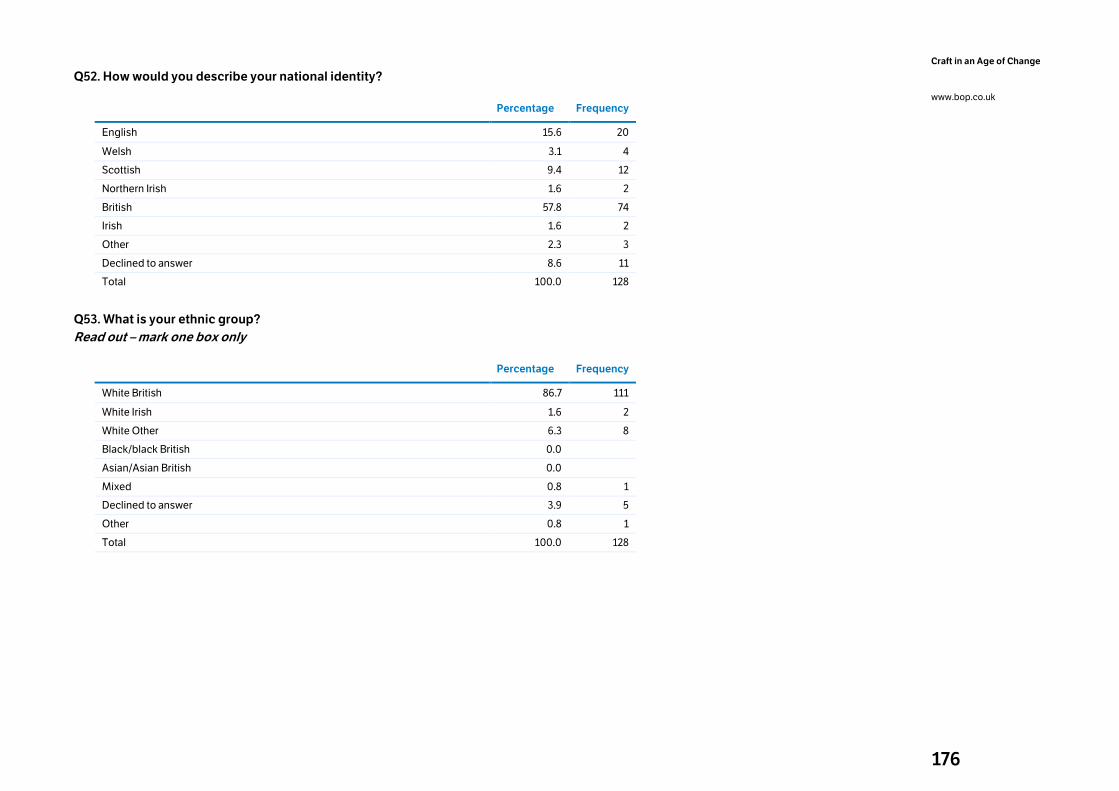
176
Craft in an Age of Change
www.bop.co.uk
Q52. How would you describe your national identity?
Percentage Frequency
English 15.6 20
Welsh 3.1 4
Scottish 9.4 12
Northern Irish 1.6 2
British 57.8 74
Irish 1.6 2
Other 2.3 3
Declined to answer 8.6 11
Total 100.0 128
Q53. What is your ethnic group?
Read out – mark one box only
Percentage Frequency
White British 86.7 111
White Irish 1.6 2
White Other 6.3 8
Black/black British 0.0
Asian/Asian British 0.0
Mixed 0.8 1
Declined to answer 3.9 5
Other 0.8 1
Total 100.0 128

177
Craft in an Age of Change
www.bop.co.uk
13. Appendix 6: Educators, writers and curators In all, 71 educators, writers and curators were spoken to. This is not a
large enough sample for the results to be considered robust in a formal
statistical sense, but the researchers strived to obtain a reasonable
selection of retailers from across the UK. The 71 came from:
• England: 53
• Scotland: 11
• Wales: 3
• Northern Ireland: 4
Key findings:
Educators, writers and curators are in many cases pursuing portfolio
careers in which their income is derived from a mix of activities primarily
in craft or closely related fields (art and design).
• Most of those we spoke to (87%) taught formally, at least part of the
time, usually at a higher education institution. Subjects varied: they
included craft-making skills, craft appreciation and design.
• Almost 20% of respondents taught informally at venues such as
community centres, gallery spaces and colleges, to a wide mix of
people.
• Almost 20% had income from writing about craft, typically on a
freelance basis, while 11% earned income from curating.
• Almost a third of them reported earning some money from the making
of contemporary craft objects, though this was not their main source
of income.
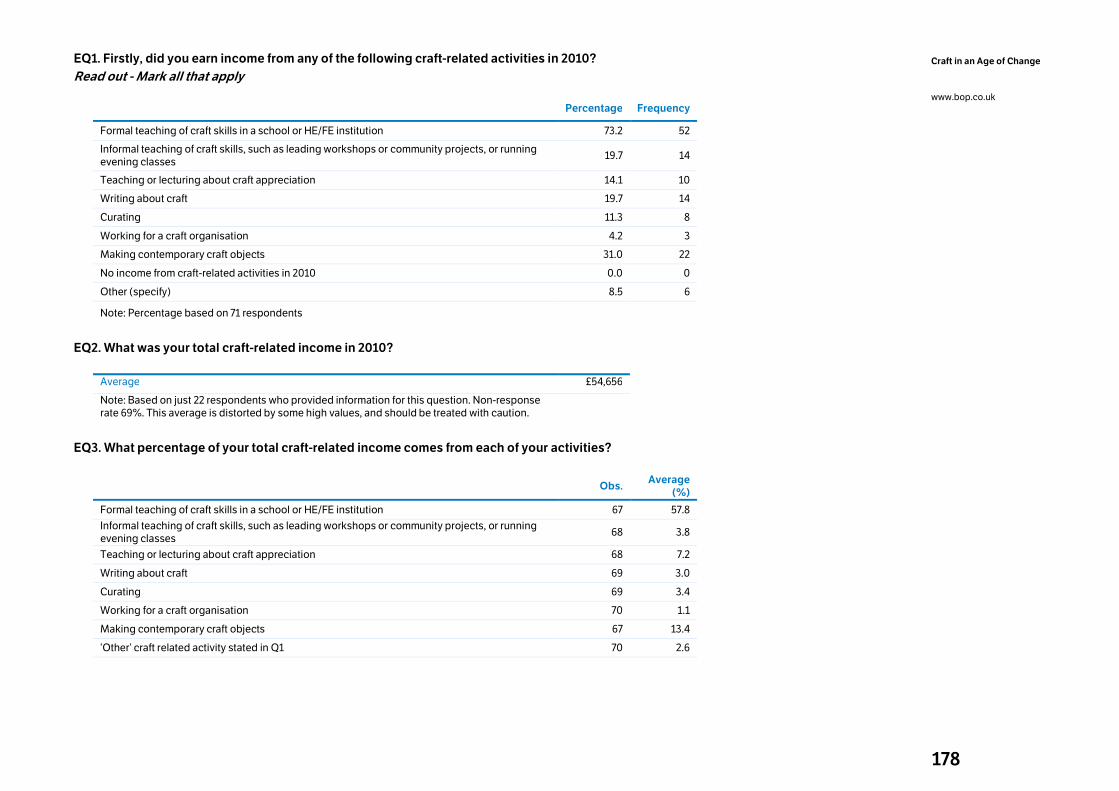
178
Craft in an Age of Change
www.bop.co.uk
EQ1. Firstly, did you earn income from any of the following craft-related activities in 2010?
Read out - Mark all that apply
Percentage Frequency Formal teaching of craft skills in a school or HE/FE institution 73.2 52 Informal teaching of craft skills, such as leading workshops or community projects, or running
evening classes 19.7 14
Teaching or lecturing about craft appreciation 14.1 10 Writing about craft 19.7 14 Curating 11.3 8 Working for a craft organisation 4.2 3 Making contemporary craft objects 31.0 22 No income from craft-related activities in 2010 0.0 0 Other (specify) 8.5 6
Note: Percentage based on 71 respondents
EQ2. What was your total craft-related income in 2010?
Average £54,656
Note: Based on just 22 respondents who provided information for this question. Non-response rate 69%. This average is distorted by some high values, and should be treated with caution.
EQ3. What percentage of your total craft-related income comes from each of your activities?
Obs. Average
(%)
Formal teaching of craft skills in a school or HE/FE institution 67 57.8
Informal teaching of craft skills, such as leading workshops or community projects, or running evening classes
68 3.8
Teaching or lecturing about craft appreciation 68 7.2
Writing about craft 69 3.0
Curating 69 3.4
Working for a craft organisation 70 1.1
Making contemporary craft objects 67 13.4
‘Other’ craft related activity stated in Q1 70 2.6
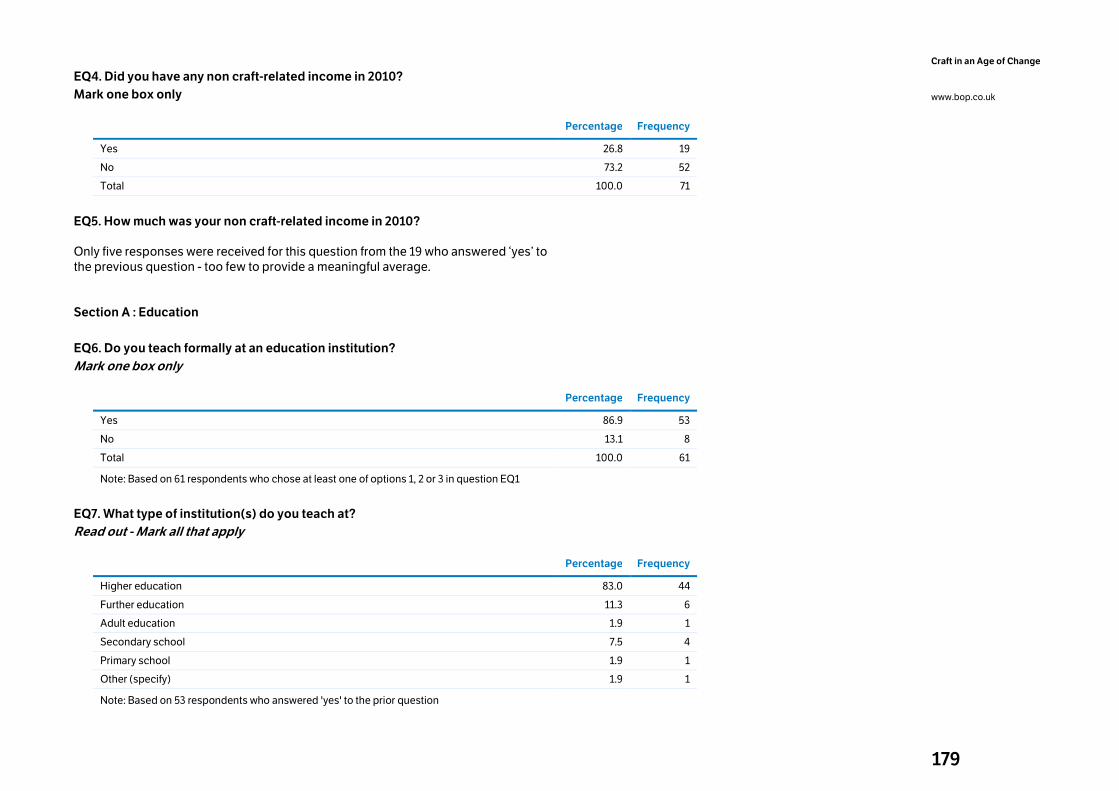
179
Craft in an Age of Change
www.bop.co.uk
EQ4. Did you have any non craft-related income in 2010?
Mark one box only
Percentage Frequency
Yes 26.8 19
No 73.2 52
Total 100.0 71
EQ5. How much was your non craft-related income in 2010?
Only five responses were received for this question from the 19 who answered ‘yes’ to the previous question - too few to provide a meaningful average.
Section A : Education
EQ6. Do you teach formally at an education institution?
Mark one box only
Percentage Frequency
Yes 86.9 53
No 13.1 8
Total 100.0 61
Note: Based on 61 respondents who chose at least one of options 1, 2 or 3 in question EQ1
EQ7. What type of institution(s) do you teach at?
Read out - Mark all that apply
Percentage Frequency
Higher education 83.0 44
Further education 11.3 6
Adult education 1.9 1
Secondary school 7.5 4
Primary school 1.9 1
Other (specify) 1.9 1
Note: Based on 53 respondents who answered 'yes' to the prior question
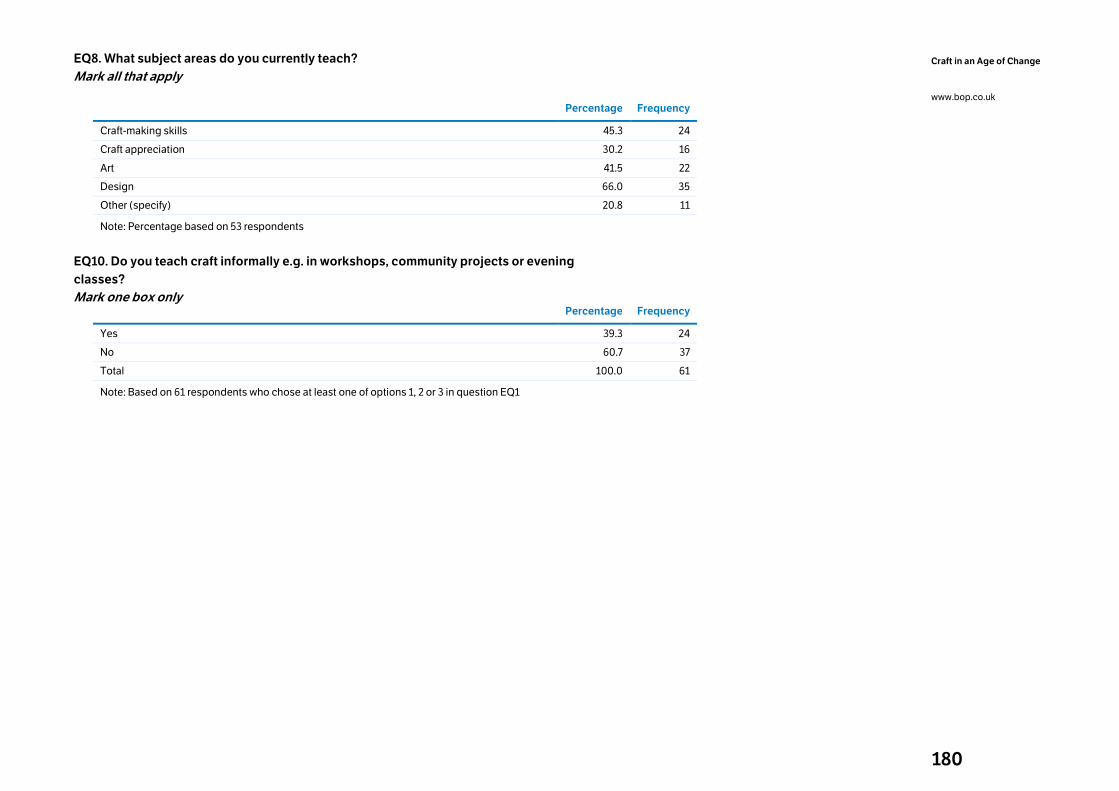
180
Craft in an Age of Change
www.bop.co.uk
EQ8. What subject areas do you currently teach?
Mark all that apply
Percentage Frequency
Craft-making skills 45.3 24
Craft appreciation 30.2 16
Art 41.5 22
Design 66.0 35
Other (specify) 20.8 11
Note: Percentage based on 53 respondents
EQ10. Do you teach craft informally e.g. in workshops, community projects or evening
classes?
Mark one box only
Percentage Frequency
Yes 39.3 24
No 60.7 37
Total 100.0 61
Note: Based on 61 respondents who chose at least one of options 1, 2 or 3 in question EQ1
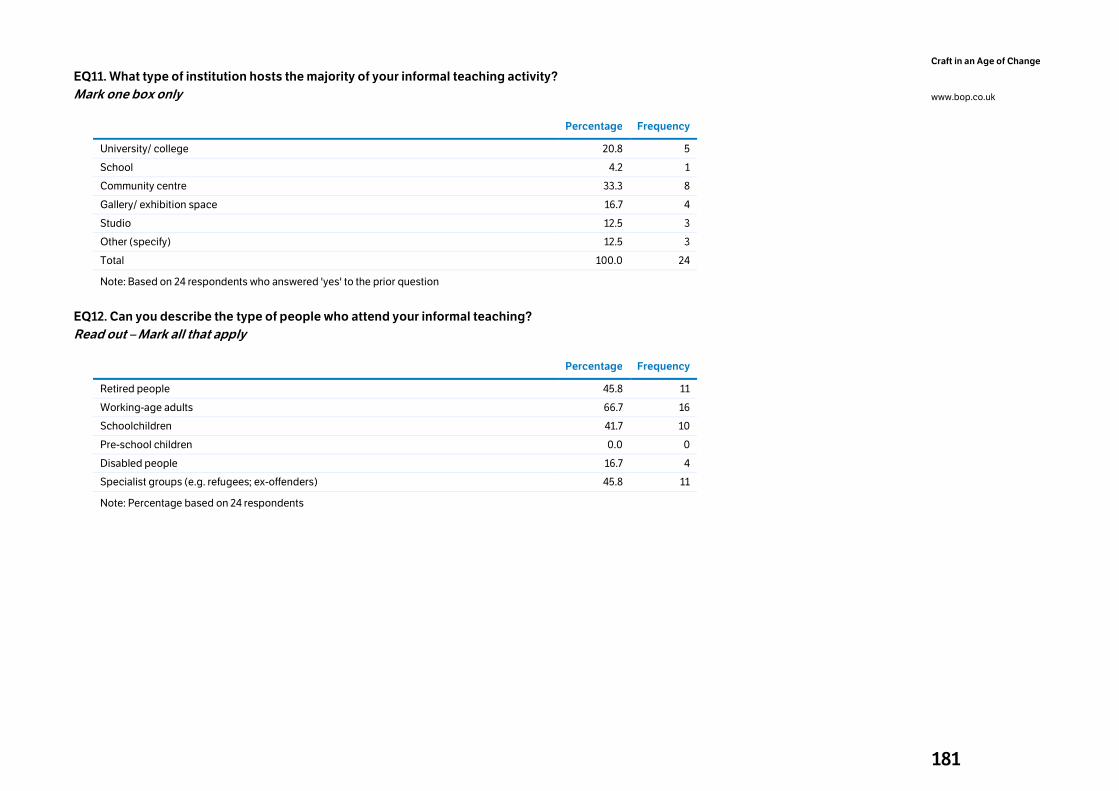
181
Craft in an Age of Change
www.bop.co.uk
EQ11. What type of institution hosts the majority of your informal teaching activity?
Mark one box only
Percentage Frequency
University/ college 20.8 5
School 4.2 1
Community centre 33.3 8
Gallery/ exhibition space 16.7 4
Studio 12.5 3
Other (specify) 12.5 3
Total 100.0 24
Note: Based on 24 respondents who answered 'yes' to the prior question
EQ12. Can you describe the type of people who attend your informal teaching?
Read out – Mark all that apply
Percentage Frequency
Retired people 45.8 11
Working-age adults 66.7 16
Schoolchildren 41.7 10
Pre-school children 0.0 0
Disabled people 16.7 4
Specialist groups (e.g. refugees; ex-offenders) 45.8 11
Note: Percentage based on 24 respondents
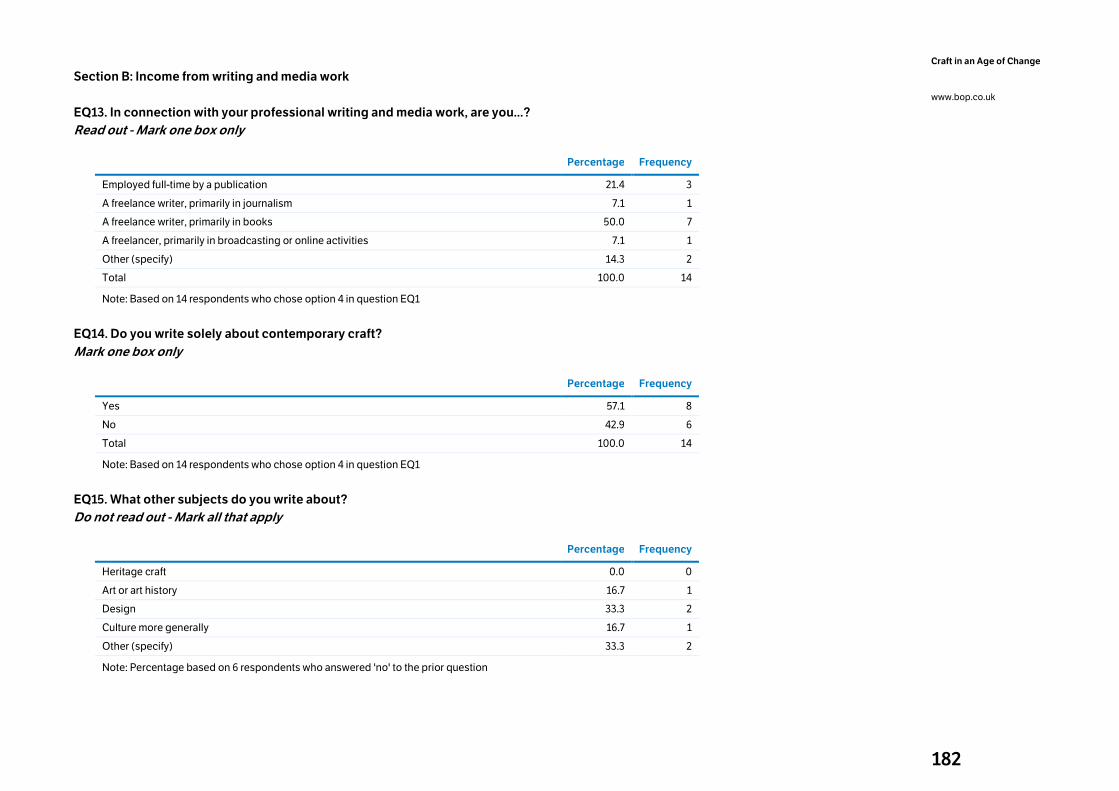
182
Craft in an Age of Change
www.bop.co.uk
Section B: Income from writing and media work
EQ13. In connection with your professional writing and media work, are you...?
Read out - Mark one box only
Percentage Frequency
Employed full-time by a publication 21.4 3
A freelance writer, primarily in journalism 7.1 1
A freelance writer, primarily in books 50.0 7
A freelancer, primarily in broadcasting or online activities 7.1 1
Other (specify) 14.3 2
Total 100.0 14
Note: Based on 14 respondents who chose option 4 in question EQ1
EQ14. Do you write solely about contemporary craft?
Mark one box only
Percentage Frequency
Yes 57.1 8
No 42.9 6
Total 100.0 14
Note: Based on 14 respondents who chose option 4 in question EQ1
EQ15. What other subjects do you write about?
Do not read out - Mark all that apply
Percentage Frequency
Heritage craft 0.0 0
Art or art history 16.7 1
Design 33.3 2
Culture more generally 16.7 1
Other (specify) 33.3 2
Note: Percentage based on 6 respondents who answered 'no' to the prior question
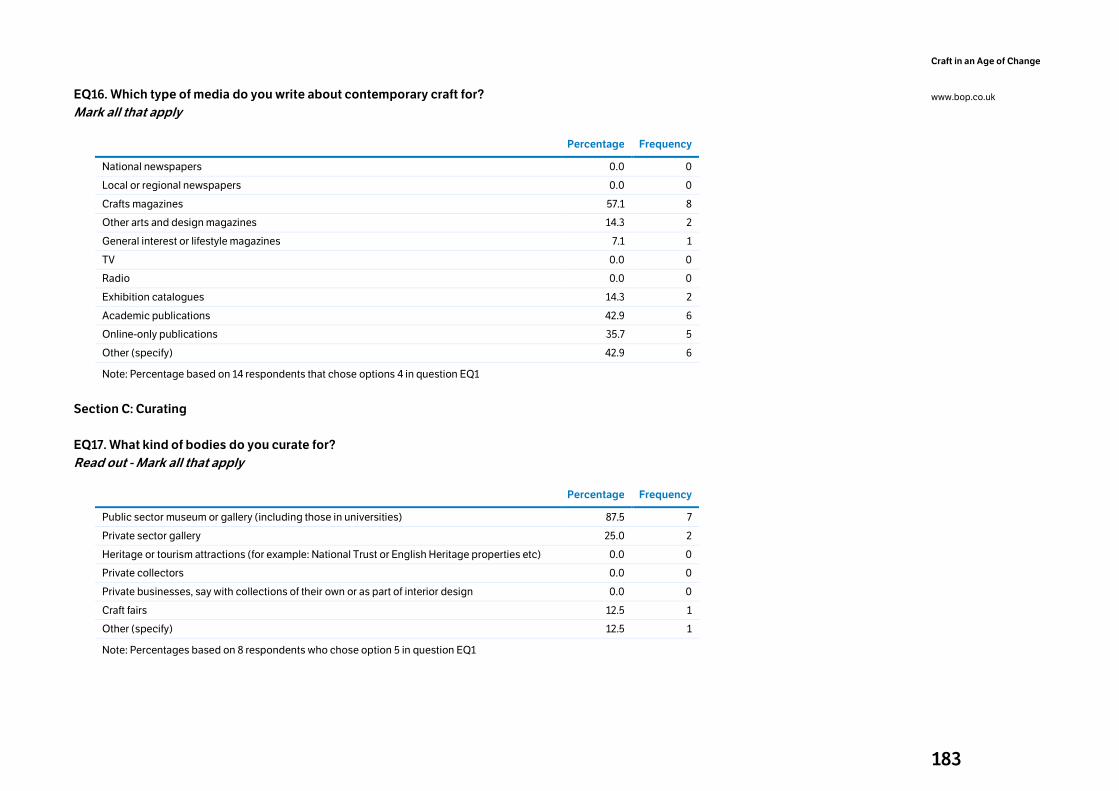
183
Craft in an Age of Change
www.bop.co.uk
EQ16. Which type of media do you write about contemporary craft for?
Mark all that apply
Percentage Frequency
National newspapers 0.0 0
Local or regional newspapers 0.0 0
Crafts magazines 57.1 8
Other arts and design magazines 14.3 2
General interest or lifestyle magazines 7.1 1
TV 0.0 0
Radio 0.0 0
Exhibition catalogues 14.3 2
Academic publications 42.9 6
Online-only publications 35.7 5
Other (specify) 42.9 6
Note: Percentage based on 14 respondents that chose options 4 in question EQ1
Section C: Curating
EQ17. What kind of bodies do you curate for?
Read out - Mark all that apply
Percentage Frequency
Public sector museum or gallery (including those in universities) 87.5 7
Private sector gallery 25.0 2
Heritage or tourism attractions (for example: National Trust or English Heritage properties etc) 0.0 0
Private collectors 0.0 0
Private businesses, say with collections of their own or as part of interior design 0.0 0
Craft fairs 12.5 1
Other (specify) 12.5 1
Note: Percentages based on 8 respondents who chose option 5 in question EQ1
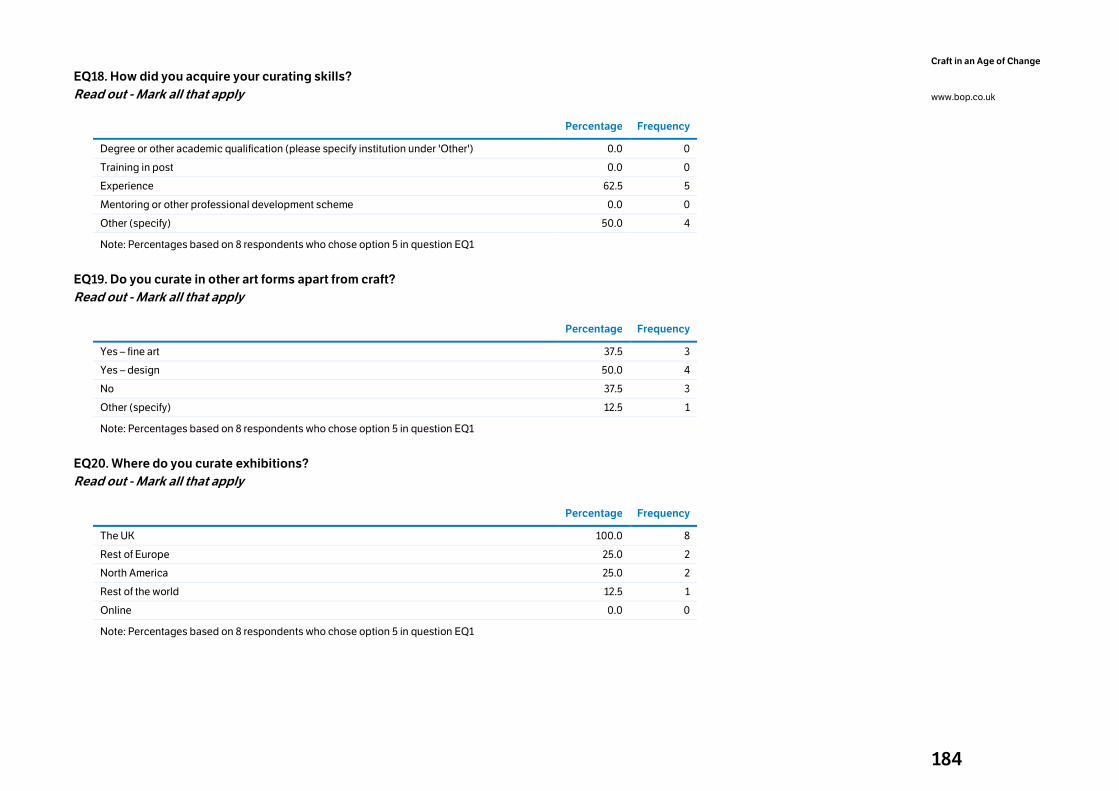
184
Craft in an Age of Change
www.bop.co.uk
EQ18. How did you acquire your curating skills?
Read out - Mark all that apply
Percentage Frequency
Degree or other academic qualification (please specify institution under 'Other') 0.0 0
Training in post 0.0 0
Experience 62.5 5
Mentoring or other professional development scheme 0.0 0
Other (specify) 50.0 4
Note: Percentages based on 8 respondents who chose option 5 in question EQ1
EQ19. Do you curate in other art forms apart from craft?
Read out - Mark all that apply
Percentage Frequency
Yes – fine art 37.5 3
Yes – design 50.0 4
No 37.5 3
Other (specify) 12.5 1
Note: Percentages based on 8 respondents who chose option 5 in question EQ1
EQ20. Where do you curate exhibitions?
Read out - Mark all that apply
Percentage Frequency
The UK 100.0 8
Rest of Europe 25.0 2
North America 25.0 2
Rest of the world 12.5 1
Online 0.0 0
Note: Percentages based on 8 respondents who chose option 5 in question EQ1
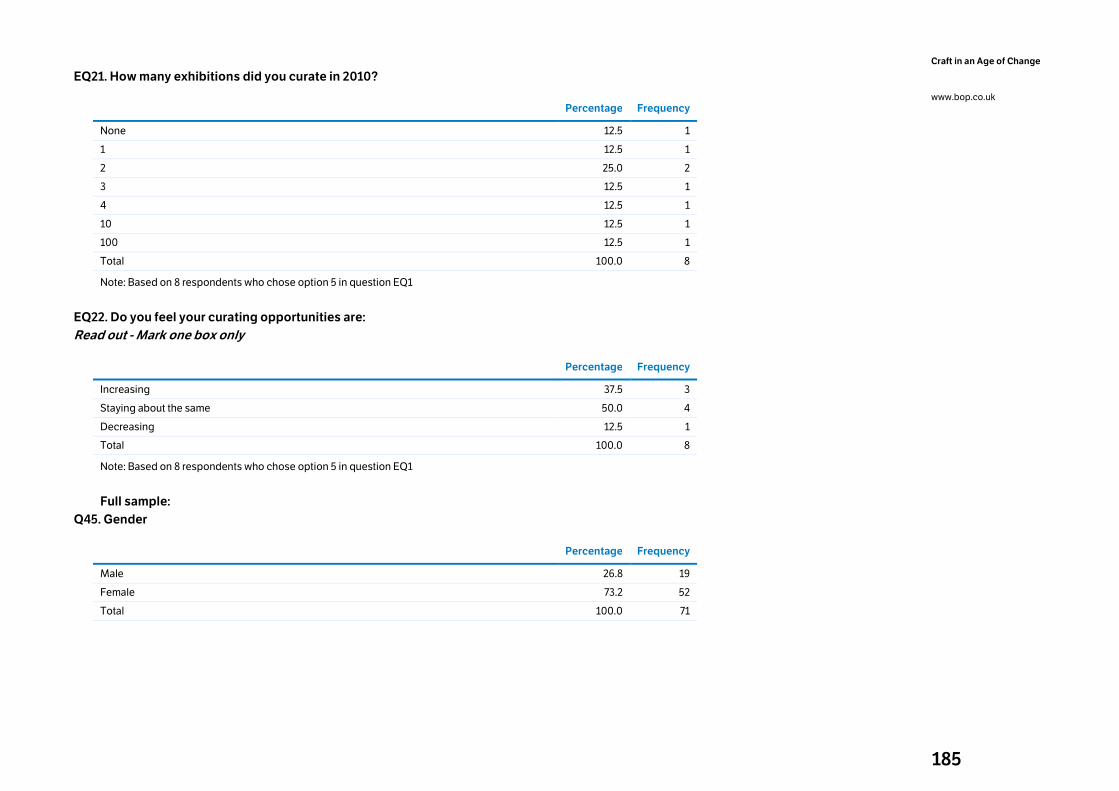
185
Craft in an Age of Change
www.bop.co.uk
EQ21. How many exhibitions did you curate in 2010?
Percentage Frequency
None 12.5 1
1 12.5 1
2 25.0 2
3 12.5 1
4 12.5 1
10 12.5 1
100 12.5 1
Total 100.0 8
Note: Based on 8 respondents who chose option 5 in question EQ1
EQ22. Do you feel your curating opportunities are:
Read out - Mark one box only
Percentage Frequency
Increasing 37.5 3
Staying about the same 50.0 4
Decreasing 12.5 1
Total 100.0 8
Note: Based on 8 respondents who chose option 5 in question EQ1
Full sample:
Q45. Gender
Percentage Frequency
Male 26.8 19
Female 73.2 52
Total 100.0 71
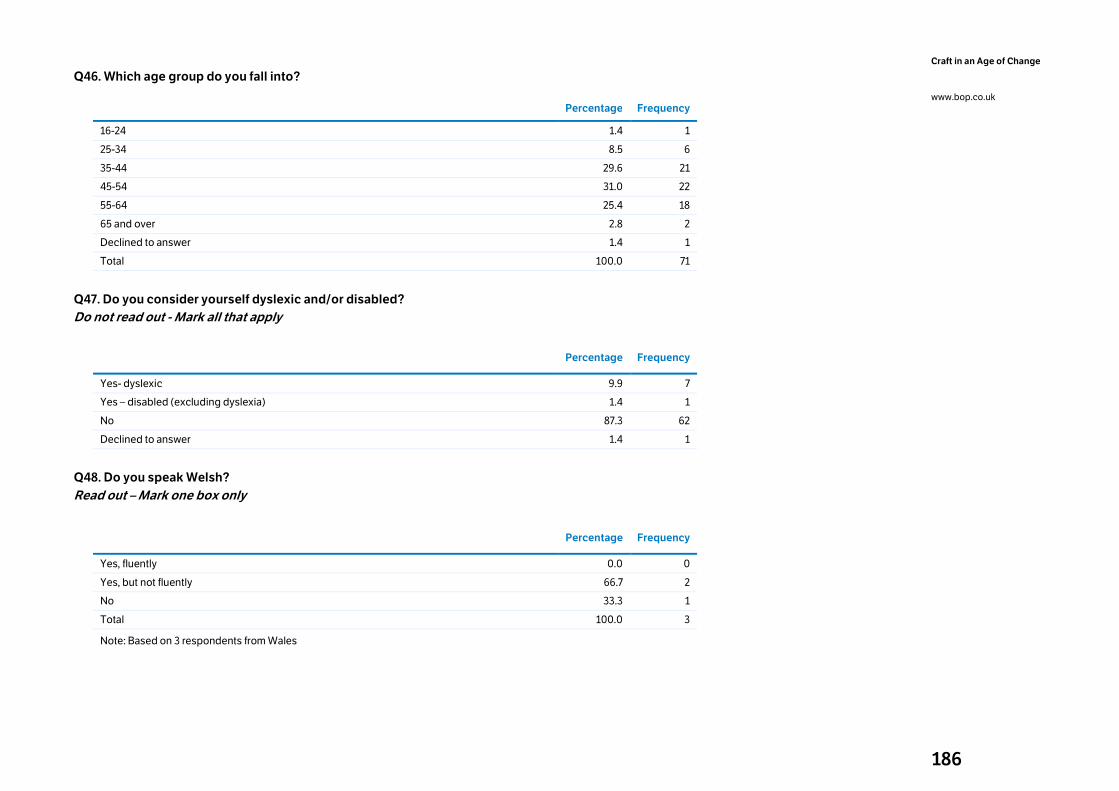
186
Craft in an Age of Change
www.bop.co.uk
Q46. Which age group do you fall into?
Percentage Frequency
16-24 1.4 1
25-34 8.5 6
35-44 29.6 21
45-54 31.0 22
55-64 25.4 18
65 and over 2.8 2
Declined to answer 1.4 1
Total 100.0 71
Q47. Do you consider yourself dyslexic and/or disabled?
Do not read out - Mark all that apply
Percentage Frequency
Yes- dyslexic 9.9 7
Yes – disabled (excluding dyslexia) 1.4 1
No 87.3 62
Declined to answer 1.4 1
Q48. Do you speak Welsh?
Read out – Mark one box only
Percentage Frequency
Yes, fluently 0.0 0
Yes, but not fluently 66.7 2
No 33.3 1
Total 100.0 3
Note: Based on 3 respondents from Wales
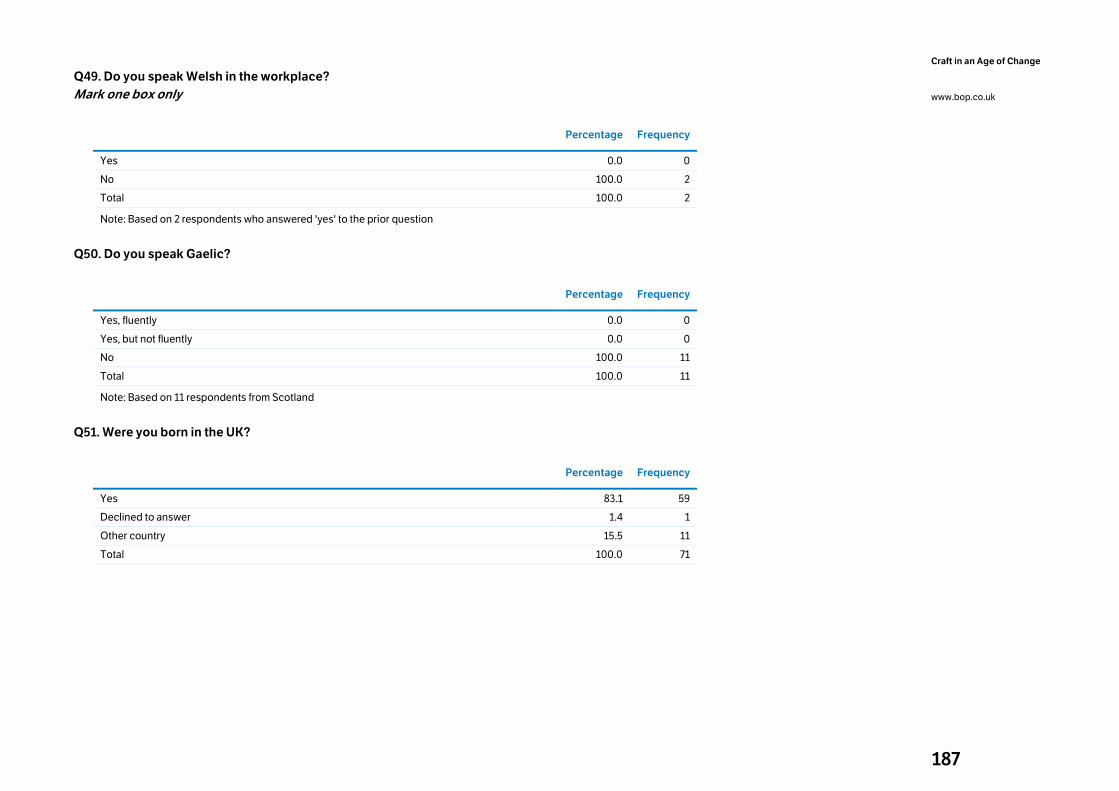
187
Craft in an Age of Change
www.bop.co.uk
Q49. Do you speak Welsh in the workplace?
Mark one box only
Percentage Frequency
Yes 0.0 0
No 100.0 2
Total 100.0 2
Note: Based on 2 respondents who answered 'yes' to the prior question
Q50. Do you speak Gaelic?
Percentage Frequency
Yes, fluently 0.0 0
Yes, but not fluently 0.0 0
No 100.0 11
Total 100.0 11
Note: Based on 11 respondents from Scotland
Q51. Were you born in the UK?
Percentage Frequency
Yes 83.1 59
Declined to answer 1.4 1
Other country 15.5 11
Total 100.0 71
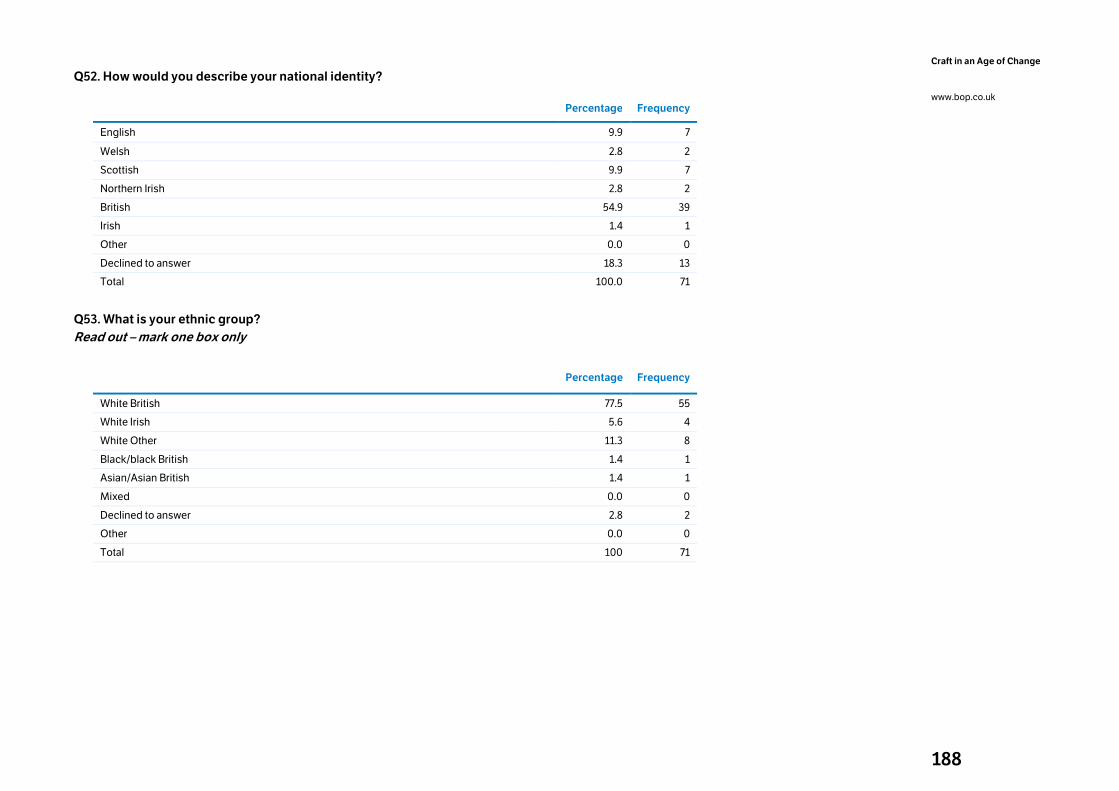
188
Craft in an Age of Change
www.bop.co.uk
Q52. How would you describe your national identity?
Percentage Frequency
English 9.9 7
Welsh 2.8 2
Scottish 9.9 7
Northern Irish 2.8 2
British 54.9 39
Irish 1.4 1
Other 0.0 0
Declined to answer 18.3 13
Total 100.0 71
Q53. What is your ethnic group?
Read out – mark one box only
Percentage Frequency
White British 77.5 55
White Irish 5.6 4
White Other 11.3 8
Black/black British 1.4 1
Asian/Asian British 1.4 1
Mixed 0.0 0
Declined to answer 2.8 2
Other 0.0 0
Total 100 71
189
Craft in an Age of Change
www.bop.co.uk
14. Appendix 7: Literature review This section summarises what is already known about the contemporary
craft sector’s economic impact and characteristics. Earlier studies are
also examined, to determine possible areas of comparability.
The literature review draws extensively on three reports commissioned
respectively by the Crafts Council and the Arts Council of Wales,49 a
consortium of Scottish organisations,50 and Craft Northern Ireland,51 all
of which were conducted by McAuley and Fillis of the University of
Stirling between 2002 and 2006.
Each of these studies set out to ‘explore the socio-economic situation of
craft-makers, and to contextualise this with information on the wider
crafts economy’. Given their common remit, scope, authorship and
research methodology, these three reports can be considered broadly
comparable. However, because England and Wales are typically
analysed as a single unit, disaggregation and comparison cannot always
be undertaken at the ‘nation’ level.
The review also looks to these studies’ predecessors, published by the
Crafts Council and its partners in 198352 and 1994.53 These studies were
undertaken with similar remits to the three studies in the 2000s. Given
differences in sector definitions and methodologies, however, they
cannot generally be considered comparable for robust, longitudinal
analysis.
49 McAuley, A. and Fillis, I. (2004) Making it in the 21st Century: a socio-economic study of crafts activity in England and Wales, 2002 – 2003, Crafts Council, London. 50 McAuley, A. and Fillis, I. (2002) Crafts Businesses in Scotland: a study’, University of Stirling in partnership with Scottish Arts Council, Scottish Enterprise and Scottish Enterprise, Glasgow. 51 McAuley, A. and Fillis, I. (2006) A Future in the Making – socio-economic survey of the craft sector in Northern Ireland, Craft Northern Ireland, Belfast. 52 Bruce, A. and Filmer, P. (1983) Working in Crafts, Crafts Council, London. 53 Knott, C. A. (1994) Crafts in the 1990s.A socio-economic study of craftspeople in England, Scotland and Wales, Crafts Council, London.
All these studies differ from the current one in two significant respects.
First, each of these previous studies limited its analysis of the craft
sector to makers. No quantitative analysis of the craft workforce as a
whole – including retailers and gallery owners, critics, curators,
educators, support agencies and workspace providers – was made.
Second, each of the previous studies focuses on the origination, making
and sale of craft objects, and on teaching in formal education settings.
Other craft-related activities undertaken by makers, such as
consultancy, design and workshop leadership, were not included.
The remainder of this review explores these reports (and others) by
theme.
14.1 Sector definitions Definitions of craft-makers – as reported in the previous studies
conducted between 1983 and 2004 – have evolved alongside the
priorities of the studies’ commissioning bodies and wider shifts in the
cultural and policy landscapes.
The 1983 study focused on makers demonstrating ‘innovation, design
and aesthetic content, and technical competence,’ in work that
‘occupies the ground between the Arts Council and Design Council.’
The 1994 study introduced a dual definition based on technical
competences and materials: individuals needed both to be working in a
recognised material (e.g. glass, leather) and to be producing work from
within a defined typology (e.g. furniture, jewellery) in order to be
regarded as makers. This report also introduced a focus on makers
producing ‘original objects ... in a commercial way’ but with ‘artistic
control of their work’ retained ‘from conception to completion’. In
addition, it introduced specific exclusions for makers working in
perishable materials (e.g. florists, cake decorators) and building
materials (e.g. thatchers).
The three 2000s studies by McAuley and Fillis did not seek to include or
exclude individual businesses from their definition of contemporary craft
in the same way as their predecessors, but instead included makers on
the basis of their membership of databases held by the commissioning
bodies and their partners (primarily craft guilds, societies and
190
Craft in an Age of Change
www.bop.co.uk
associations). In addition, they introduced exclusions of makers who
were perceived as not being commercially active (described as
‘hobbyists’) and / or who described the ‘subject or style’ of their work as
‘traditional’.
The focus on sales of craft objects across each of these studies
influenced the questions put to makers and the analysis of their
responses. Makers spending less than 30 hours per week on making
work and teaching were categorised as ‘part-time’, regardless of
whether or not they were undertaking other craft-related work. The
inclusion or exclusion of business management, marketing and
administration from this 30 hour allocation was not made clear.
Relatedly, the three reports by McAuley and Fillis recognised portfolio
working amongst an estimated one-third of all makers, but defined this
as ‘a mix of part-time craft and non craft-related jobs’, rather than as the
mix of craft-related (and possibly non craft-related) jobs recognised by
other research.54 55
This focus on the sale of craft objects also has implications for the way
that business turnover and profit were estimated in these reports:
income from craft-related activities such as design, consultancy and
workshop leadership was excluded.
14.2 Economic impact The contemporary craft sector is at best under-represented in
government business performance data. Incompatibility issues with
Standard Industry and Occupational Classifications are common within
the creative industries. However, craft is also disadvantaged by the high
proportion of freelancers working in the sector, who are often not
represented on the business databases most often interrogated for
government statistics. As a consequence, craft is the only creative
54 Press, M. and Cusworth, A. (1998) New Lives in the Making. Art and Design Research Centre, Sheffield Hallam University, Sheffield, and Crafts Council, London. 55 Hunt, W., Ball, L. and Pollard, E. (2010) Crafting Futures: a study of the early careers of crafts graduates from UK higher education institutions. Institute for Employment Studies, Brighton / University of the Arts London, London / The Crafts Council, London.
.
industry sector recognised by the Department for Culture, Media and
Sport that is largely excluded from the Department’s own economic
estimates.
Quantitative ‘footprint’ analyses of the craft workforce undertaken by
Creative & Cultural Skills (CCS), the sector skills council with
responsibility for craft, take a different view of craft from that of the
national sector development agencies. CCS’s statistics exclude retail
and education but include small-scale manufacturing and specialist
materials suppliers, as well as heritage and rural crafts. Whilst Creative &
Cultural Skills has made a calculation of GVA for craft (equating to 12% of
the creative industries sector’s GVA in 200856), its sector definition is not
comparable with that of the current study.
The series of studies commissioned since the mid 1980s by the national
development agencies for contemporary craft in England, Wales,
Scotland and Northern Ireland therefore provides the most useful
baseline evidence of economic impact.
Size of workforce
McAuley and Fillis’ work indicated a UK craft workforce of almost
35,800,57 comprising 29,400 makers in England in 2004, 2,600 in Wales
in 2004, 3,500 in Scotland in 2002 and 300 in Northern Ireland in 2006.
This workforce included only makers who had agreed that their work
was ‘contemporary in style’ (not ‘traditional in style’) and who agreed
that they worked ‘full-time’, ‘part-time’ or ‘occasionally for sale’ (not ‘as a
hobby’ or ‘as a student or trainee’).
These estimates suggested a very substantial increase in the craft
workforce since 1994, when just under 17,000 makers had been
identified in England, Scotland and Wales; and again since 1983 when
the workforce had been estimated as being somewhere between 10,000
and 30,000 in England and Wales. However, as mentioned earlier,
interpretation of these estimates is subject to shifts in research scope
and methodology.
56 Creative & Cultural Skills (2009) The Craft Blueprint: A workforce development plan for craft in the UK,Creative & Cultural Skills, London. 57 Exact figures are 35,776 in total, comprising 29,440 makers in England (82% of the UK total), 2,560 in Wales (7%), 3,476 in Scotland (10%) and 300 in Northern Ireland (less than 1%).
191
Craft in an Age of Change
www.bop.co.uk
Turnover
McAuley and Fillis’ research reports estimated a UK sector turnover total
of around £1bn, comprising £826m attributable to makers in England and
Wales, between £95m and £151m to those in Scotland, and £8m to those
in Northern Ireland.
The value of this sector turnover was calculated to have more than
doubled between 1994 and 2004 in England and Wales, from £307m58 to
between £826m and £845m, a figure which corresponds reasonably with
a market value of £913m estimated for the UK craft market in 2010.59
In 2004, the average turnover of individual businesses (from sales of
objects alone) was thought to average £25,826 in England and Wales,
and was very slightly less in Northern Ireland (in 2006). No directly
comparable data was available for Scotland.
Individual business turnover was shown to vary greatly around this
average. In particular, all studies demonstrated gender discrepancies
regardless of the maker’s full-time or part-time work status: across
England and Wales, men averaged almost twice the sales revenue of
women. Overall, McAuley and Fillis found that turnover averaged less
than £10,000 per annum for almost half of all makers across the UK
nations: 42% in England and Wales in 2004, 47% in Scotland in 2002 and
48% in Northern Ireland in 2006. More recent figures have suggested a
worsening of this situation in Scotland, where 55% reported a turnover
of less than £10,000 in 2007.60
Methodological differences between the 1983, 1994 and 2004 reports
prevent robust longitudinal analysis of turnover at the individual
business level. However, statements of opinion give some insight into
trends in economic activity. 36% of makers in England and Wales (in
2004) and 30% of makers in Northern Ireland (in 2006) reported making
‘all or nearly all’ of their income from ‘selling craftwork’, and 48% of those
in Scotland reported (in 2002) that turnover was growing. On the other
58 Though note that Knott does not supply a direct figure in her report. 59 Morris Hargreaves McIntyre (2010) Consuming Craft: The contemporary craft market in a changing economy. Crafts Council, London. 60 Craft Scotland maker survey (2007), quoted in Scottish Arts Council (2009) Futurefocus: Developing Audiences for Scottish Craft, HI-Arts, Glasgow Grows Audiences and The Audience Business, Edinburgh.
hand, 29% of makers in England and Wales (in 2004) agreed that their
‘customer base is not growing’, and 56% reported difficulties in selling
their work. Similarly, 65% of makers in Scotland (in 2002) saw ‘achieving
sales’ as their most significant challenge.
Profit
Profit and gross value added (GVA) levels have not been reported at a
sector level in the previous research reports.
At the individual business level, profit on sales of craft objects cannot be
disaggregated from the available data. The three 2000s studies from
McAuley and Fillis use income percentages and broad profit bandings,
from which it is not always possible to make mid-range calculations, but
which can provide some broad indication of individual business profit.
The most commonly ‘ticked’ profit band was for profits of under £2,500:
28% of makers in England and Wales in 2004 and 17% in Northern
Ireland in 2006 assigned themselves to this category. Comparable data
was not available for Scotland. (Note that these percentages do not
include those people reporting losses.)
Exports
Export of craft objects from English and Welsh makers were reported at
£43m in 2004. The proportion of makers exporting from Northern Ireland
was far higher: in 2006, over two-thirds of makers from Northern Ireland
were said to be exporting beyond the UK, compared with just 18% of
those in England and Wales. Strikingly, most (almost two-thirds) of these
Northern Irish businesses were reported to be commencing export
activity within one year of start-up.
In Scotland 29% of makers were reported to be selling outside the UK in
2002. This proportion had grown to 43% in 2007.61
Indirect economic impact
It has been suggested that the craft sector’s economic impact is
underestimated, even within the craft literature.62 Three main points have
been made in this argument.
61 Craft Scotland maker survey (2007), quoted in Scottish Arts Council (2009) Op. cit. 62 Crafts Council (2010) Craft Sector Profile and Analysis, Crafts Council, London.
192
Craft in an Age of Change
www.bop.co.uk
First, all available statistics focus on craft production: the craft sector’s
stated economic value has focused on makers to the exclusion of craft
professionals working at other stages in the value chain, including
retailers and gallery owners, critics, curators, educators, and workspace
providers.
Second, ‘spillover’ benefits – or the economic benefits inadvertently
derived by one sector from another – are as difficult to capture for craft
as they are for other creative and cultural sectors.63 Schwarz and Yair
have demonstrated that craft professionals make a direct contribution to
sectors ranging from architecture and product design to retail and
advertising, film and television, cultural heritage and fashion.64 However,
the value of this contribution is difficult to quantify beyond isolated
examples, such as the licensing value of a specific patent or the
additional visitors attracted to a specific place by a craft event.
Third, and in common with other creative sectors rich in ‘expressive
value’ such as dance and visual arts, contemporary craft has an
economic role in catalysing new thinking in other, perhaps more
economically powerful creative industries. Similarly, the craft-related
work undertaken by many makers in a wide range of education and
community settings makes an indirect contribution to economic growth
by developing the employability of others.65 These types of intangible
economic contribution resist quantification, but are significant
nonetheless.
14.3 Maker characteristics McAuley and Fillis’ studies produced analyses of business
characteristics and attitudes with some degree of comparability, which
are summarised here, along with Schwarz and Yair’s work looking into
the nature and economic and social contribution of portfolio working in
craft.
63 Frontier Economics (2007) Creative Industry Spillovers: understanding their impact on the wider economy. Department for Culture, Media and Sport, London. 64 Schwarz, M. and Yair, K. (2010) Making Value: craft and the economic and social contribution of makers, Crafts Council, London. 65 Ibid.
Maker demographics
Within the existing craft literature, maker demographics have been
analysed by age, gender, ethnicity and disability. Limited diversity has
been identified as a barrier to the development of the sector’s capacity
for innovation and market diversification.66
Gender
McAuley and Fillis showed that women have generally been much better
represented in the craft workforce (at 61% in Scotland in 2002, 66% in
England and Wales in 2004 and 68% in Northern Ireland in 2006), than in
the UK population as a whole (51%).67
The incidence of female entrepreneurship in England and Wales has
been reported to be more than twice as high in the craft sector than
across the UK working population as a whole.68 However, women seem
to earn less than men: statistics indicate lower revenues from sales of
craft objects in all four nations and exports (in Northern Ireland)
compared with men.
Longitudinal data is not available across the UK, but in England and
Wales a notable increase in female representation – from 57% to 66% –
was reported between 1994 and 2004. The findings of the 2006 Northern
Ireland survey and a 2010 study of graduate career paths69 suggest that
both younger makers and craft graduates are more likely to be female,
implying that female representation will increase still further across the
UK.
This predominance of women is sometimes overlooked in the debate
about diversity, and is particularly significant in the context of a sector
where poor diversity has been identified as a barrier to innovation and
market diversification.
66 Creative & Cultural Skills (2009) Op. cit. 67 McAuley, A. and Fillis, I. (2004) Op. cit. 68 Ibid. 69 Hunt, W., Ball, L. and Pollard, E, (2010) Op. cit.
193
Craft in an Age of Change
www.bop.co.uk
Socio-demographic grouping
Analysis of socio-demographic groupings in the literature is limited. In
Hunt et al’s study of craft graduates,70 however, the educational level of
respondents’ parents was used as a proxy for socio-economic group.
The study found that more than half of all respondents were the first in
their families to be educated to degree level, and that this had no
adverse impact on early career success or satisfaction.
Age
The most common age bracket for makers in the McAuley and Fillis
reports was ‘late forties’, with the exception of Northern Ireland, where
the age profile of respondents to the 2006 survey was weighted towards
the early thirties. Almost three-quarters of makers in all nations were
found to be aged between 30 and 59 during the period of the mid 2000s
reports. In 2004, however, the number of young people working in the
sector in England and Wales was reported to be increasing.
Ethnic diversity
Whilst remaining unrepresentative of the overall ethnic population, it
was noted in 2004 that the craft sector’s ethnic diversity in England and
Wales appeared to have improved over the previous decade, with the
percentage of ‘non white British’ respondents climbing from 1.2% in
England, Scotland and Wales in 1994 to 3.9% in England and Wales in
2004. It should be noted, though, that people answering ‘Other’ made up
much the largest single constituent of this 3.9%.
Scotland, which was not included in the 2004 statistics above, reported
in 2002 that 2.1% of respondents were ‘non white British,’ whilst the 2006
Northern Ireland survey found no non-white respondents.
In 2010, an analysis of UK craft degree students graduating in 2002,
2003 and 2004 suggested a greater ethnic diversity amongst younger,
degree-educated makers, with 7% of respondents identifying
themselves as being ‘from black, minority and ethnic backgrounds’.71
70 Hunt, W., Ball, L. and Pollard, E. (2010) Op. cit. 71 Ibid.
Disability
The sector’s diversity was found to have improved more markedly in
terms of self-identified disability than in terms of ethnicity between 1994
and 2004: in England and Wales the proportion of survey respondents
describing themselves as disabled rose from 1.5% to 9% during this
time.72 In Scotland, the percentage of respondents saying they were
disabled was reported at 2% in 2002, although higher levels of disability
– 10% in 2006 – were recorded in Northern Ireland.
Distinctions between different forms of disability have not been made by
the previous UK sector reports. However, a specific investigation into
dyslexia was made within a 2010 graduate survey. Demonstrating
dyslexia levels of 10% amongst recent craft graduates73 (compared with
the 3% saying they were disabled), this report indicated that dyslexia
could be twice as common amongst craft graduates as in the UK
population as a whole.74
72 McAuley, A. and Fillis, I. (2004) Op. cit. 73 Hunt, W., Ball, L. and Pollard, E. (2010) Op. cit. 74 http://www.dyslexiaaction.org.uk/Pages/FAQs/ accessed 02/01/2010.
194
Craft in an Age of Change
www.bop.co.uk
14.4 Business characteristics Business location
Both the 1994 and 2004 surveys found a broad concentration of makers
located in the South East and South West regions of England, and in
London. In 2004, McAuley and Fillis found around 18% of all makers
were based in each of these three areas, in contrast to just 1.6% found in
the North East of England. Other business location data is limited, and
no regional breakdown of the data for Scotland is available.
Business locations have not been profiled or analysed for factors such
as rurality or deprivation; the identification of ‘rural clusters’ in the South
West of England and in Wales (within the 2004 report) is based on
assumptions of rurality in the regions in which they were situated.
Recent research by NESTA into creative industry clusters does not offer
a useful basis for comparison in this respect, as it is based on the
DCMS’s selection of Standard Industrial Classifications, which are
unable to measure the craft sector.75
Although London was the base for almost one-fifth of all makers in the
2004 study, Cardiff and Belfast did not appear to be exerting similar
influences on business location in Wales and Northern Ireland. In 2004,
two-thirds of all makers in Wales were located within the mainly rural
area of ‘Mid and West Wales’, with only one in six in South Wales
(including Cardiff and Swansea). In Northern Ireland in 2006 twice as
many makers were reported to be based in County Down as in the
predominantly rural County Antrim. Comparable data was not available
for Scotland.
Business size
The predominance of one- and two-person micro-enterprises in the
contemporary craft sector has been well documented, with 88% of
makers in England and Wales (in 2004) and 86% of those in Scotland (in
2002) identifying their business as being ‘organised as a sole tradership’
75 Chapain, C., Cooke, P., De Propris, L.,, MacNeill, S. and Mateos-Garcia, J. (2010): Creative Clusters and Innovation: putting creativity on the map, National Endowment for Science, Technology and the Arts, London.
rather than as a partnership, limited company or co-operative. Sole
trading appeared, in 2006, to have been slightly less prevalent in
Northern Ireland, with 78% of businesses organised in this way and a
correspondingly higher incidence of business partnerships.
Businesses in Scotland and Northern Ireland appeared to be slightly
larger, on average, than those in England and Wales. A higher proportion
of businesses in Scotland identified themselves as partnerships in 2002,
and a higher proportion of those in Northern Ireland (in 2006) stated that
they employed two people or more, full-time.
Employment by craft businesses in Scotland appeared at this time to be
higher than elsewhere: 60% of businesses in Scotland identified
themselves as employers (in 2002), compared with 30% in Northern
Ireland in 2006 and 5% in England and Wales in 2004, although these
figures may have reflected some confusion between definitions of
employment.
There is no real evidence of any trend either towards or away from sole
trading. Whilst at first glance the literature suggests an overall increase
from 76% in 1994 to 88% in 2004, this can partly be accounted for by the
lower levels of sole trading evident in Scotland, which was not included
in the 2004 study.
Business longevity
Research has suggested that craft businesses tend to sustain yet evolve
over time, to accommodate changing life circumstances such as
parenthood or caring for elderly relatives, and to allow time for new
learning activities.76 77
Makers’ business survival rates have been shown to be strong in
comparison with the creative industries and wider economy. In 2004,
58.9% of businesses in England and Wales had survived for ten years,
compared to a five year survival rate (across the UK, in 2011) of 49.7% in
the creative industries and 46.9% in the economy overall.78 Ten-year
survival rates have been found to be slightly weaker in Scotland (at 42%
76 Hunt, W., Ball, L. and Pollard, E. (2010) Op. cit. 77 Press, M. and Cusworth, A. (1998) Op.cit. 78 Burrows, H. and Ussher, K. (2011) Risky Business, Demos, London.
195
Craft in an Age of Change
www.bop.co.uk
in 2002) than in England and Wales, and much weaker in Northern
Ireland (27% in 2006).
Workspace
Working from home was found to be common in the three 2000s
surveys: 63% of makers in England and Wales, 69% of those in Scotland
and 74% of those in Northern Ireland reported working in this way,
figures which, for England, Wales and Scotland, had not changed
substantially from the 1994 study. One-third of survey respondents in
England and Wales agreed with the statement that ‘my workspace is
inadequate’, and almost half agreed with the statement that ‘there is a
lack of affordable studio space,’ although only 7% identified a lack of
space as a factor constraining business growth. Comparable data was
not available for Scotland.
14.5 Business activity breakdown Between one-quarter and one-third of makers were identified as working
part-time by the three McAuley and Fillis studies (30% in England and
Wales, 28% in Northern Ireland and 22% in Scotland), where ‘part-time’
equated to less than thirty hours’ making per week.
These figures adopt a relatively tight definition of ‘work’ as excluding
craft-related activity beyond the making, exhibition, sale and restoration
of craft objects, and the teaching of craft. In all, 42% of the 2004
respondents in England and Wales reported undertaking these types of
craft-related work.
Type of materials used
The range of makers’ work was categorised in previous studies by
material (e.g. wood) and discipline (e.g. jewellery), and showed a
consistent focus between 1994 and the three 2000s studies on textiles,
ceramics and jewellery.
In 2004, 34% of contemporary makers in England and Wales reported
working in textiles, 30% in ceramics and 21% in jewellery. The
proportions are broadly similar among makers in Scotland in 2002 and in
Northern Ireland in 2006. Both wood and paper were used more often in
Scotland and Northern Ireland than in England and Wales, with a higher
incidence of jewellery and musical-instrument making in Northern
Ireland being offset by lower proportions of makers working in glass and
metal.
The focus of newer businesses (established since 2000) indicated a
shift towards textiles and jewellery in England and Wales in 2004,
together with fashion accessories and millinery. At the same time, the
number of makers working in ceramics had declined slightly, while the
numbers working with wood, stone carving, lettering and mosaic, toys
and musical instruments had decreased more dramatically. Comparable
data was not available for Scotland.
The craft landscape, as defined by these materials and discipline-based
categories, is necessarily a limited one, as it excludes newer forms of
craft practice (such as digital making and performative practices) as well
as consultancy and other craft-related work undertaken by makers.
14.6 Education and professional development Higher Education
High levels of higher education qualifications among makers are well
documented in the literature.
A ‘full-time art and design course’ was the most commonly reported
qualification in most of the UK nations, with 64% of 2004 England and
Wales-based survey respondents and 56% of those in Northern Ireland
(in 2006) following this route. The literature reported a growth in higher
education qualifications in England and Wales (from 42% in 1994),
although in Scotland it was found that only 35% of respondents held
such a qualification (in 2002).
There is some ambiguity in the use of terminologies to describe
qualifications and learning experiences. However, the high qualification
levels overall are just as common among makers for whom craft is a
second career. These makers represented more than half (56%) of
respondents to the England and Wales study, 69% of the Scotland study
and 62% of the Northern Ireland study.

196
Craft in an Age of Change
www.bop.co.uk
Despite the popularity of degree level qualifications, most makers
across all the UK nations have cited a range of ‘qualifications held’,
including short and part-time courses, and working with experienced
makers. In addition, many makers (more than half in Scotland in 2002
and Northern Ireland in 2006, just over one-third in England and Wales in
2004) considered themselves to be ‘mainly self taught’, despite the
multiple qualifications they held.
In England and Wales and in Northern Ireland, female makers have been
found to be far more likely than male makers to have engaged in formal
education to HE level. Men were more likely to have gained
qualifications through apprenticeships, government training schemes,
or to have taught themselves: they constituted the majority of the 35% of
makers in England and Wales describing themselves in 2004 as ‘mainly
self taught’. Comparable data was not available for Scotland.
Continuing Professional Development
Self-reported investment by makers in training and other forms of
continuing professional development (CPD) has varied widely across
studies, although this may partly reflect confusion around the term CPD
and its definition, and in particular the inclusion or exclusion of informal
and peer-based learning, research and development, and active
learning opportunities such as knowledge transfer initiatives.
With this caveat, 43% of makers in England and Wales in 2004
undertook no CPD at all in 2004, with 23% reporting between two and
five days of CPD per year, and 16% 11 days or more. Comparable data
was not available for Scotland or Northern Ireland. Other research
indicates that UK makers on average spend 41 days each year
developing new work, itself arguably a form of CPD.79
Makers in England and Wales were positive about furthering their
creative and commercial development. In the 2004 survey 50% agreed
with the statement that ‘I enjoy developing my business skills’, and
almost all respondents agreed that ‘it is important to me to develop my
creative and professional practice’.80
79 Creative & Cultural Skills (2009) Op. cit. 80 McAuley, A. and Fillis, I. (2004) Op. cit.
Schwarz and Yair’s research backed up this positive attitude towards
CPD, suggesting that successful makers were entrepreneurial in
developing their own CPD opportunities. As well as researching and
accessing both generic and specialist public sector support, they were
also investing time in developing their own peer-learning networks and
development opportunities.81 It was found that CPD opportunities
including knowledge transfer programmes and structured mentoring
could play particularly transformative roles in business and creative
development, helping with the diversification and management of
portfolio careers.
In the 2002 Scotland study, makers were asked to consider the impact of
previous CPD initiatives on business and creative development. Of the
available options (which did not include mentoring or networking),
those considered significant by the greatest percentage of makers were
start-up grants, specialist business skills and ‘advanced skills’.
14.7 Selling and marketing Routes to market
The craft sector features multiple possible routes to market, yet in 2004
close to half (41%) of all makers in England and Wales reported using
just one or two routes for the sale of craft objects. A 2007 Scottish Arts
Council report referred to the ‘relatively unsophisticated and untargeted
tactics’ deployed by makers, including reliance on word of mouth and
existing showcasing opportunities.82
Quantitative data was not available for Scotland in the 2002 study, but in
Northern Ireland makers were reported in 2006 to be selling across a
wider range of platforms: 19% of makers here were reported to be using
one or two routes to market, but a similar proportion to be using three,
four or five routes.
In 2004, commissioning was (as in 1994) the most popular reported
route to market amongst makers selling craft objects. For the 70% of
81 Schwarz, M. and Yair, K. (2010) Op. cit. 82 Craft Scotland maker survey (2007), quoted in Scottish Arts Council (2009) Futurefocus: Developing Audiences for Scottish Craft, HI-Arts, Glasgow Grows Audiences and The Audience Business, Edinburgh.
197
Craft in an Age of Change
www.bop.co.uk
makers in England and Wales selling in this way (72% in Northern Ireland
in 2006 and 65% in Scotland in 2002), commissioning produced nearly
50% of all sales revenue. Selling craft objects direct from the workshop
had also remained a popular route to market. 50% of makers in England
and Wales were selling in this way (51% in Scotland and 63% in Northern
Ireland), generating 35% of their sales revenue.
In 2004 temporary exhibitions and galleries generated 40% of sales
revenue (42% in Scotland in 2002) for the 58% of makers in England and
Wales selling in this way. Whilst this figure represented an increase
since the 1994 study, domestic selling at craft fairs and markets had
dropped in popularity amongst makers based in England and Wales,
from 42% in 1994 to 38% in 2004. Nonetheless, the contribution of this
route to market for those employing it had remained significant, at 37%
of sales income.
In all, 19% of makers in England and Wales reported selling from
between six and ten permanent shop or gallery outlets in 2004, but two-
thirds of makers had a retail base of five outlets or fewer. Comparable
data was not available for Scotland or Northern Ireland.
Business-to-business sales were reported to be less common than
business-to-consumer sales in England and Wales in 2004. Despite this,
direct sales to retailers and through trade fairs produced around one
third of all sales income for the 31% and 13% (respectively) of makers
selling in these ways. Business-to-business sales were reported to be
made by a higher percentage of makers in Scotland in 2002, where 44%
were selling to retailers and 24% through trade fairs, and a slightly lower
percentage in Northern Ireland in 2006, where 26% were selling to
retailers and 15% to wholesalers.
Online selling was not tracked in McAuley and Fillis’ reports, although
26% of makers in England and Wales stated that they anticipated
undertaking ‘sales and marketing’ work online in future.
Marketing
Multiple marketing strategies appeared to be common in the mid 2000s,
although it is not clear with what frequency makers were employing the
full range of marketing activities they listed. In 2004, 18% of makers in
England and Wales (and 28% of makers in Northern Ireland in 2006)
reported using one or two marketing methods; 29% (and 36% in
Northern Ireland) reported using three or four; and 25% reported using
five or six. In 2004 28% of makers in England and Wales reported using
seven or more marketing methods, while 35% in Northern Ireland in
2006 reported using five or more. No comparable data was available for
Scotland.
In 2004, 42% of makers in England and Wales (and a similar percentage
in the other UK nations) reported marketing their work online. However,
a significantly higher percentage reported marketing by producing
printed literature (63% in England and Wales in 2004, 66% in Scotland in
2002, and 70% in Northern Ireland in 2006) and listing their work on
registers and slide indexes (54% in England and Wales, 45% in Scotland
and 34% in Northern Ireland).
Clearly, the 2004 report pre-dates the diversification of web-based
marketing opportunities around social networking and other forms of
user-generated content, and does not therefore distinguish between
different types of online marketing activity – brand-building through
social media, for example.
A significant proportion of makers working in the mid 2000s considered
selling activities to be marketing opportunities in themselves:
exhibitions, personal selling, craft fairs and open workshops functioned
in this way for 57%, 55%, 31% and 25% of respondents respectively in
England and Wales. In terms of media, advertising in newspapers and
magazines was used by 14% of makers (in England, Wales and Northern
Ireland), although around twice as many (32% in England and Wales,
29% in Northern Ireland) reported editorial coverage of their work as a
marketing tool. Again, no comparable data was available for Scotland.
Business aspirations
Growth aspirations amongst craft businesses have generally been found
to be widespread but usually modest, and concentrated among women.
In 2004, 71% of craft businesses in England and Wales83 (80% in
Northern Ireland in 2006) wanted to grow, an increase on the 54% who,
in 1994, wished to ‘increase production’. Growth aspirations tended to
83 McAuley, A. and Fillis, I. (2004) Op. cit.
198
Craft in an Age of Change
www.bop.co.uk
be ‘moderate’ rather than ‘substantial’ (for 56% of respondents to the
2004 survey), although an aspiration for growth among women was
found to be significantly higher than among men. Figures for Scotland in
2002 were similar, but not analysed by gender.
Only 5% of respondents in England and Wales were seeking (in 2004) to
fulfil their growth aspirations by working internationally (although 63% of
makers in Scotland in 2002 wished to sell internationally). Still smaller
numbers were looking to specified niche markets such as architects,
designers, tourists, public bodies and corporate clients for growth. 22%
wished to target ‘affluent, discerning, educated people’, 15% private
collectors, and 10% exhibitions, galleries and craft events.
Networks
Makers have typically been found to enjoy the independence associated
with sole trading, yet also to value interaction, peer support and
collaboration. Schwarz and Yair84 found makers positioning themselves
within a network of other creative professionals, which groups and
regroups to meet the needs of different clients, to develop new work,
and to gain and reciprocate professional support. Gauntlett85 has
suggested that, as online technologies become increasingly
sophisticated, creativity – and making in particular – is likely to become
an increasingly collaborative activity.
In 2004, McAuley and Fillis reported that almost one-third of
respondents in England and Wales were working collaboratively,
predominantly with another maker (44%) or with a manufacturing /
production company (37%). The majority (68%) of those not working
collaboratively stated they ‘would be willing’ to do so, and a still higher
proportion of all respondents (79%) said that they enjoy interacting with
other craftspeople despite also enjoying working on their own.
There was no comparable data available for Scotland, but collaboration
in Northern Ireland appears to be still more common: here, almost three-
quarters of makers in 2006 worked in collaboration with others, most
often on production (32%) or design / production (23%), and 79% of
those working alone stated they would be willing to collaborate.
84 Schwarz, M. and Yair, K. (2010) Op. cit. 85 Gauntlett, D. (2011) Making is Connecting, Polity Press, Cambridge.
It was suggested in the 2006 Northern Ireland report that collaboration
could be one solution to the capacity issues blocking business growth
mentioned earlier. Schwarz and Yair, however, suggest that
collaboration between makers often serves to stimulate ideas and
generate new creative opportunities, encouraging growth in terms of
intellectual property rather than increasing capacity.
Their work also suggested that many makers’ networks and
collaborations are informal, and that achieving a balance between time
spent working alone and collaboration can be beneficial to creativity.
This flexible, networked approach, combined with low levels of capital
investment and low dependency on extended supply chains, has been
said to provide some resilience to economic downturn.86 At the same
time, it is thought to enable innovation by drawing together disparate yet
complementary knowledge and skill sets whilst extending core business
and creative capabilities.87
In Northern Ireland, the need for networking has been reflected in
relatively high levels of membership of formal craft associations: 40% of
makers in 2006 were members of local or regional groups, and 6% were
members of national guilds. In England and Wales in 2004, membership
of formal associations was found to be less common, at 27% of makers,
perhaps reflecting the informal, peer-led nature of many networks and
collaborations.
86 Crafts Council (2009) The Crafts Sector Adapts to the Credit Crunch. Online publication, accessed 20/02/2011. http://www.craftscouncil.org.uk/professional-development/maker-development/credit-crunch-feature/crafts-sector-adapts/ 87 Crafts Council (2009) Crafts Council Profile and Analysis. Online publication: www.craftscouncil.org.uk/files/.../craft-sector-profile-and-analysis.pdf... , accessed 20/02/2011
199
Craft in an Age of Change
www.bop.co.uk
Bibliography
Blueprint Development Consultancy (2000) A Review of the Craft Sector
in Northern Ireland, Arts Council of Northern Ireland, Belfast.
Bruce, A. and Filmer, P. (1983) Working in Crafts, Crafts Council, London.
Burrows, H. and Ussher, K. (2011) Risky Business. Demos, London.
Bryan, A. and Aigas Associates (2007) Crafts Development – A Scoping
Study, Hi-Arts and Scottish Arts Council, Beauly.
Chapain, C., Cooke, P., De Propris, L., MacNeill, S. and Mateos-Garcia, J.
(2010) Creative Clusters and Innovation: putting creativity on the map,
National Endowment for Science, Technology and the Arts, London.
Crafts Council (2009) The Crafts Sector Adapts to the Credit Crunch,
online publication, accessed 20/02/2011.
http://www.craftscouncil.org.uk/professional-development/maker-
development/credit-crunch-feature/crafts-sector-adapts/
Crafts Council (2009) Crafts Council Profile and Analysis, online
publication, accessed 20/02/2011.
www.craftscouncil.org.uk/files/.../craft-sector-profile-and-analysis.pdf
Crafts Council (2010) Craft Sector Profile and Analysis, Crafts Council,
London.
Craft Scotland maker survey (2007), quoted in Scottish Arts Council
(2009) Futurefocus: Developing Audiences for Scottish Craft, Hi-Arts,
Glasgow Grows Audiences and The Audience Business.
Creative & Cultural Skills (2009) The Craft Blueprint: A workforce
development plan for craft in the UK, Creative & Cultural Skills, London.
Ferris, M. (ed.) (2009) Making Futures: the crafts in the context of
emerging global sustainability agendas Vol. 1: i-vi, online publication,
accessed 07/10/2011:
http://makingfutures.plymouthart.ac.uk/journalvol1/
Frontier Economics (2007) Creative Industry Spillovers: understanding
their impact on the wider economy, Department for Culture, Media and
Sport, London.
Gauntlett, D. (2011) Making is Connecting, Polity Press, Cambridge.
Hunt, W., Ball, L. and Pollard, E. (2010) Crafting Futures: a study of the
early careers of crafts graduates from UK higher education institutions,
Institute for Employment Studies, Brighton / University of the Arts
London, London / The Crafts Council, London.
Knott, C.A. (1994) Crafts in the 1990s: A socio-economic study of
craftspeople in England, Scotland and Wales, Crafts Council, London.
Leeke, D. (1994) Audit of the Craft Sector in Northern Ireland, Craftworks
NI (Ltd), quoted in McAuley, A. and Fillis, I. (2004) Op. cit.
McAuley, A. and Fillis, I. (2002) Crafts Businesses in Scotland: a study,
University of Stirling in partnership with Scottish Arts Council, Scottish
Enterprise and Scottish Enterprise, Glasgow.
McAuley, A. and Fillis, I. (2004) Making it in the 21st Century: a socio-
economic study of crafts activity in England and Wales, 2002 – 2003,
Crafts Council, London.
McAuley, A. and Fillis, I. (2006) A Future in the Making – socio-economic
survey of the craft sector in Northern Ireland, Craft Northern Ireland,
Belfast.
Morris Hargreaves McIntyre (2010) Consuming Craft: The contemporary
craft market in a changing economy. Crafts Council, London.
Press, M. and Cusworth, A. (1998) New Lives in the Making. Art & Design
Research Centre, Sheffield Hallam University, Sheffield and Crafts
Council, London.
Schwarz, M. and Yair, K. (2010) Making Value: craft and the economic
and social contribution of makers, Crafts Council, London
200
Craft in an Age of Change
www.bop.co.uk
15. Appendix 8: Methodology The aim of this project was to understand the full range of activity in the
contemporary craft sector, and its economic impacts. As such, the
process was not simply confined to studying makers – other aspects of
the craft ‘business’, such as retailing and curation were also to be
explored. This contemporary craft mapping study is also the first major
one to be carried out simultaneously across England, Scotland, Wales
and Northern Ireland.
The centrepiece of the exercise was a large phone survey of more than
2,000 respondents. However, before the survey could be conducted the
researchers needed to familiarise themselves with the current issues in
the sector. This process took place in a number of ways. The first of
these was a detailed literature review (included as appendix 7). It raised
a number of issues which were dealt with in the following ways.
Definitions of the contemporary craft sector
Following the line taken by the three studies carried out in the 2000s, the
decision was made in this research to let survey respondents self-define
the work they make, sell or write about as ‘contemporary’ (or not).88 The
databases on which the survey drew were labelled as ‘craft’ databases in
one form or another, so a degree of self-selection among potential
respondents had already taken place.
The researchers also allowed for a wide variety of self-descriptions
alongside the term ‘craft-maker’. Individuals not identifying themselves
as ‘makers’ but instead as applied artists, designer-makers or another
relevant term were asked if other people might consider them to be
craft-makers. Those responding positively were included in the survey.
88 The survey issued in Scotland was adjusted to make clear that makers who describe their work as ‘indigenous’ were to be included. Creative Scotland defines indigenous crafts as ‘those which have their origins in the cultures of Scotland’ – and wanted makers who are taking such practice forward and innovating to be included.
This methodological choice is consistent with research showing that
makers often adopt flexible identities, altering the way they describe
themselves and their work to suit different roles and clients.
‘Whole sector’ approach
This research also looked at the whole sector, enabling all craft-related
aspects of people’s work to be valued as part of their creative and
business practice. This involved:
• The introduction of detailed questionnaires for retailers and for
educators, writers and curators, as well as for makers.
• The introduction of a retailers, curators and educators focus group, in
recognition of the thinner evidence base in these areas.
Focus groups
The researchers were able to examine issues in the contemporary craft
sector further in the second stage of the research process: the focus
groups.
These were held with a wide range of representatives of the craft sector.
The first took place in London, with a mixed group of academics, writers,
curators and retailers. The second took place with CraftNet, a group of
representatives from craft organisations across England. The
researchers met again with the CraftNet group in London some months
later for a further meeting.
There were also two focus groups for makers. The first of these was held
in Edinburgh, and involved makers from Scotland and the North East of
England. The second was held in Birmingham, with makers from Wales
and the Midlands. The aim of these two sessions was to get the opinions
of practising makers to augment the views of the other interest groups.89
These focus groups were arranged to try and draw on as wide a
spectrum of opinion as possible. However, the timing and location of the
focus groups inevitably meant that there were some people who were
not able to take part. To capture their views the researchers also carried
out a number of interviews with academics, gallery owners (or
89 It was agreed in the original contract that it would not be possible to hold a focus group involving Northern Ireland makers on cost grounds.
201
Craft in an Age of Change
www.bop.co.uk
managers) and curators, especially from Scotland, Wales and Northern
Ireland (who were not able to take part in the first focus group because
of timing issues).
The focus groups and in-depth interviews were backed up by a steering
group made up of representatives from all four nations of the UK from
the sponsoring organisations,90 together with an independent adviser to
offer an outside perspective. The researchers and the steering group
met regularly to discuss and review progress and to confirm the
direction of the project.
Diverse practice
The literature review and the focus groups suggested that there has
been a diversification of craft practice in recent years. To reflect this, the
following approaches were integrated into the survey questionnaire.
• A redefinition of ‘portfolio working’, from the ‘mix of part-time craft and
non craft-related jobs’ described in previous studies, to a range of
craft-related (and possibly non craft-related) work.
• An analysis which considers craft-related business-to-business work,
retail, education and other consultancy services, CPD and business
management/ administration as elements of the maker’s professional
practice, alongside the making of craft objects.
• The collecting of fine-grained data around craft-related and non craft-
related roles, and the proportion of income gained from / time spent
on each, to support this analysis.
• The investigation of a range of roles – including curatorship, writing,
design and private tuition – within the two makers’ focus groups.
• The careful wording of surveys and focus group questions to be
inclusive of a wide range of practices. For example, the terms ‘digital
media’ and ‘mixed media’ are added to the list of more conventional
material specialisms (e.g. ‘glass’, ‘leather’) carried over from previous
surveys.
90 Crafts Council, Creative Scotland, the Arts Council of Wales and Craft Northern Ireland. Apart from Creative Scotland these organisations are the public bodies with primary responsibility for contemporary craft in their various countries. In Scotland, Craft Scotland fulfils that role – their database formed the basis for the Scottish phone interviews.
• A distinction was made between the use of digital technologies for
practice and production, and their use for business, networking and
marketing purposes.
• Introducing survey and focus group questions relating to business
skills development and other forms of public sector support.
• Introducing survey and focus group questions drawing out makers’
work as consultants (for both the private and public sectors).
• Creating a distinction in the surveys between teaching in both formal
and informal education settings, which ensured that both are
captured. This is different from earlier studies, which defined teaching
work solely in terms of formal education ‘in schools and colleges’.
The surveys were also designed to provide a more fine-grained analysis
of selling routes. Direct selling (from maker to consumer) and online
marketing were thought to have become more important; questions
were devised to explore this in more detail. For example, distinctions
were made between online sales conducted on a business’ own website
and those on third-party websites or via social networks.
Phone survey questionnaires
There were three questionnaires in all - one for those who saw
themselves primarily as makers, one for those who saw themselves
primarily as retailers, and one for those who saw themselves as
educators, writers or curators. The questionnaires were drafted by BOP
Consulting, drawing on the interviews and focus groups, as well as the
questions asked in the previous studies in 2004 and 1994 (to enable
some comparisons to be made across time). The questionnaire drafts
were shared with the steering group, who passed on their comments
and thoughts. This process went through a number of iterations, with
each re-draft being shared with the steering group.
Once the questionnaires had been agreed, pilot interviews were
conducted to test the effectiveness and ‘understandability’ of the
questionnaires. The results of the pilots led to some minor adjustments
being made to the questionnaire structure.
202
Craft in an Age of Change
www.bop.co.uk
Welsh translations of the questionnaires were then prepared for
respondents from that country.
Survey databases
The project brief did not extend to producing a comprehensive database
of craft businesses in the UK (for both time and budgetary reasons). The
following approaches were agreed with the commissioning agencies in
each country.
England:
In England, the Crafts Council supplied a database of 7,275 makers.
However, it was keen for makers who were not ‘on their radar’ to be
picked up. As part of the project brief, BOP therefore agreed to create its
own database of business names from which approximately half the
phone interviews for England were to be drawn.
This second database was built by BOP Consulting from desk and web
research, drawing on publicly available records from associations,
guilds, societies, and third-party craft websites, among others. It was
designed to have good regional coverage across England. A team of
researchers spent a number of weeks compiling this database. In all,
3,044 records were collected in this way.
This database was collected independently of the Crafts Council’s
database in order that the ‘overlap’ between the two could be used to
make an estimate of the total population of makers in England. A full
discussion of the way this was done can be found in section 15.2.
The Crafts Council’s database also included some records of makers
from Scotland, Wales and Northern Ireland. These were checked against
the records of other partners in the project, and used as part of the
additional records supplied for those countries.
Scotland:
It was agreed with Creative Scotland that the database of Craft Scotland
would be used as the primary database for assessing makers in
Scotland. However, it became clear that this database on its own was
unlikely to achieve the target number of interview responses (350). BOP
Consulting therefore carried out further web searches to locate
additional records.
In all, the additional records supplied by BOP were responsible for:
• 27 out of the 361 Scottish makers business interviews (7%)
Wales:
For Wales too, it had initially been agreed that the Arts Council of Wales
would supply the database of makers. However, again BOP
supplemented this with additional records once it became clear that the
database supplied was unlikely to be sufficient in its own right to meet
the proposed target (250).
In all, the additional records supplied by BOP were responsible for:
• 74 out of the 325 Welsh makers business interviews (23%)
Northern Ireland:
Craft Northern Ireland supplied the database for the Northern Ireland
research. Once again, it was initially agreed that this would be the only
source of data used to try and meet the target of 200 interviews, but BOP
supplemented it with further desk research of its own.
In all, the additional records supplied by BOP were responsible for:
• 32 out of the 160 Northern Ireland makers business interviews (20%)
Retailers and educators:
The project also required two specialist databases, one for retailers and
one for educators/writers/curators. The Crafts Council, whose reach in
these fields of activity again stretches beyond England, supplied initial
lists for both of these. BOP Consulting then supplemented these with
desk and web research, focusing particularly on Scotland, Wales and
Northern Ireland, where the Crafts Council’s database coverage was
thought likely to be weaker.
It should be noted that the number of interviews conducted in these
categories was smaller than the samples for makers, and the findings
should therefore be regarded as less statistically robust, and treated as
indicative. Furthermore, the phone survey was conducted in June and
July, when some educators may already have started their summer
vacation, and been out of contact.
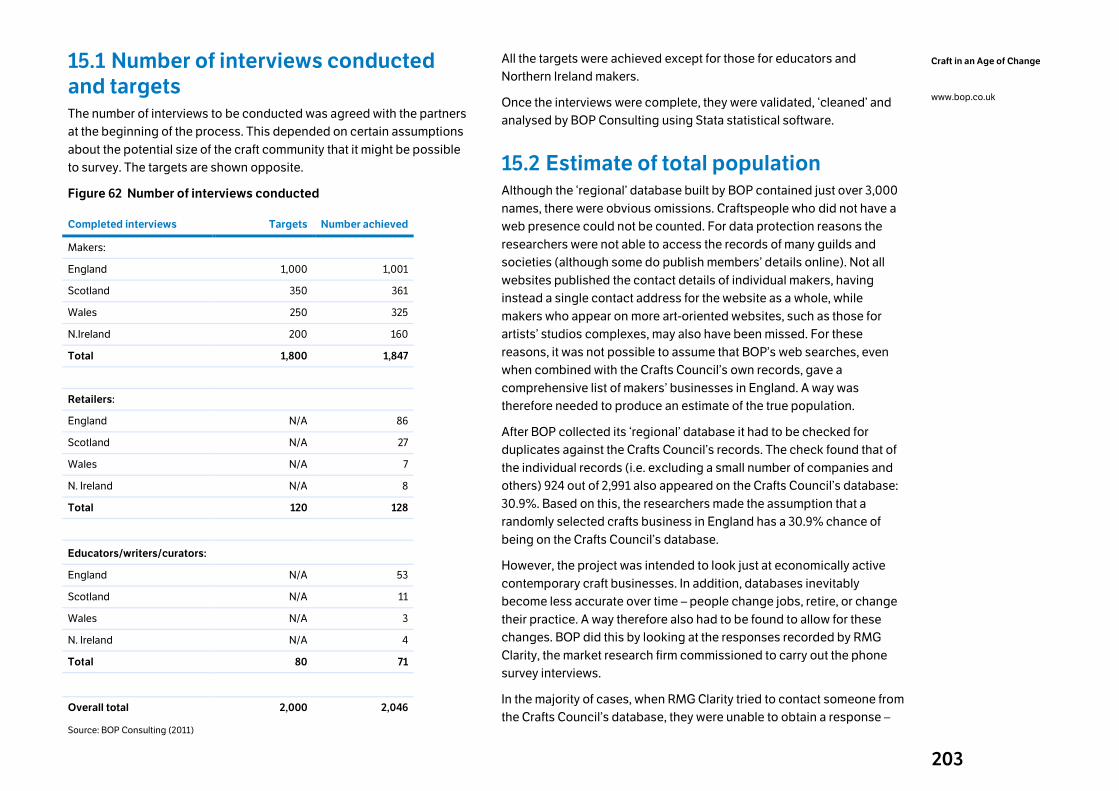
203
Craft in an Age of Change
www.bop.co.uk
15.1 Number of interviews conducted
and targets The number of interviews to be conducted was agreed with the partners
at the beginning of the process. This depended on certain assumptions
about the potential size of the craft community that it might be possible
to survey. The targets are shown opposite.
Figure 62 Number of interviews conducted
Completed interviews Targets Number achieved
Makers:
England 1,000 1,001
Scotland 350 361
Wales 250 325
N.Ireland 200 160
Total 1,800 1,847
Retailers:
England N/A 86
Scotland N/A 27
Wales N/A 7
N. Ireland N/A 8
Total 120 128
Educators/writers/curators:
England N/A 53
Scotland N/A 11
Wales N/A 3
N. Ireland N/A 4
Total 80 71
Overall total 2,000 2,046
Source: BOP Consulting (2011)
All the targets were achieved except for those for educators and
Northern Ireland makers.
Once the interviews were complete, they were validated, ‘cleaned’ and
analysed by BOP Consulting using Stata statistical software.
15.2 Estimate of total population Although the ‘regional’ database built by BOP contained just over 3,000
names, there were obvious omissions. Craftspeople who did not have a
web presence could not be counted. For data protection reasons the
researchers were not able to access the records of many guilds and
societies (although some do publish members’ details online). Not all
websites published the contact details of individual makers, having
instead a single contact address for the website as a whole, while
makers who appear on more art-oriented websites, such as those for
artists’ studios complexes, may also have been missed. For these
reasons, it was not possible to assume that BOP’s web searches, even
when combined with the Crafts Council’s own records, gave a
comprehensive list of makers’ businesses in England. A way was
therefore needed to produce an estimate of the true population.
After BOP collected its ‘regional’ database it had to be checked for
duplicates against the Crafts Council’s records. The check found that of
the individual records (i.e. excluding a small number of companies and
others) 924 out of 2,991 also appeared on the Crafts Council’s database:
30.9%. Based on this, the researchers made the assumption that a
randomly selected crafts business in England has a 30.9% chance of
being on the Crafts Council’s database.
However, the project was intended to look just at economically active
contemporary craft businesses. In addition, databases inevitably
become less accurate over time – people change jobs, retire, or change
their practice. A way therefore also had to be found to allow for these
changes. BOP did this by looking at the responses recorded by RMG
Clarity, the market research firm commissioned to carry out the phone
survey interviews.
In the majority of cases, when RMG Clarity tried to contact someone from
the Crafts Council’s database, they were unable to obtain a response –
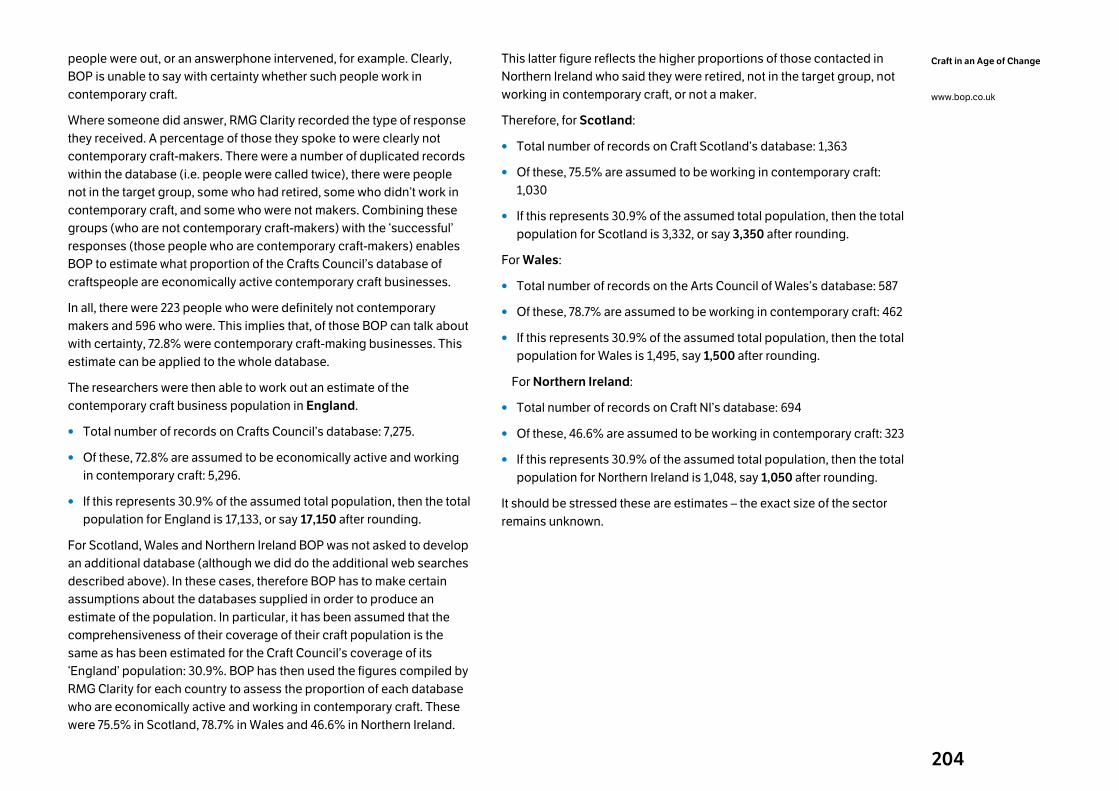
204
Craft in an Age of Change
www.bop.co.uk
people were out, or an answerphone intervened, for example. Clearly,
BOP is unable to say with certainty whether such people work in
contemporary craft.
Where someone did answer, RMG Clarity recorded the type of response
they received. A percentage of those they spoke to were clearly not
contemporary craft-makers. There were a number of duplicated records
within the database (i.e. people were called twice), there were people
not in the target group, some who had retired, some who didn’t work in
contemporary craft, and some who were not makers. Combining these
groups (who are not contemporary craft-makers) with the ‘successful’
responses (those people who are contemporary craft-makers) enables
BOP to estimate what proportion of the Crafts Council’s database of
craftspeople are economically active contemporary craft businesses.
In all, there were 223 people who were definitely not contemporary
makers and 596 who were. This implies that, of those BOP can talk about
with certainty, 72.8% were contemporary craft-making businesses. This
estimate can be applied to the whole database.
The researchers were then able to work out an estimate of the
contemporary craft business population in England.
• Total number of records on Crafts Council’s database: 7,275.
• Of these, 72.8% are assumed to be economically active and working
in contemporary craft: 5,296.
• If this represents 30.9% of the assumed total population, then the total
population for England is 17,133, or say 17,150 after rounding.
For Scotland, Wales and Northern Ireland BOP was not asked to develop
an additional database (although we did do the additional web searches
described above). In these cases, therefore BOP has to make certain
assumptions about the databases supplied in order to produce an
estimate of the population. In particular, it has been assumed that the
comprehensiveness of their coverage of their craft population is the
same as has been estimated for the Craft Council’s coverage of its
‘England’ population: 30.9%. BOP has then used the figures compiled by
RMG Clarity for each country to assess the proportion of each database
who are economically active and working in contemporary craft. These
were 75.5% in Scotland, 78.7% in Wales and 46.6% in Northern Ireland.
This latter figure reflects the higher proportions of those contacted in
Northern Ireland who said they were retired, not in the target group, not
working in contemporary craft, or not a maker.
Therefore, for Scotland:
• Total number of records on Craft Scotland’s database: 1,363
• Of these, 75.5% are assumed to be working in contemporary craft:
1,030
• If this represents 30.9% of the assumed total population, then the total
population for Scotland is 3,332, or say 3,350 after rounding.
For Wales:
• Total number of records on the Arts Council of Wales’s database: 587
• Of these, 78.7% are assumed to be working in contemporary craft: 462
• If this represents 30.9% of the assumed total population, then the total
population for Wales is 1,495, say 1,500 after rounding.
For Northern Ireland:
• Total number of records on Craft NI’s database: 694
• Of these, 46.6% are assumed to be working in contemporary craft: 323
• If this represents 30.9% of the assumed total population, then the total
population for Northern Ireland is 1,048, say 1,050 after rounding.
It should be stressed these are estimates – the exact size of the sector
remains unknown.
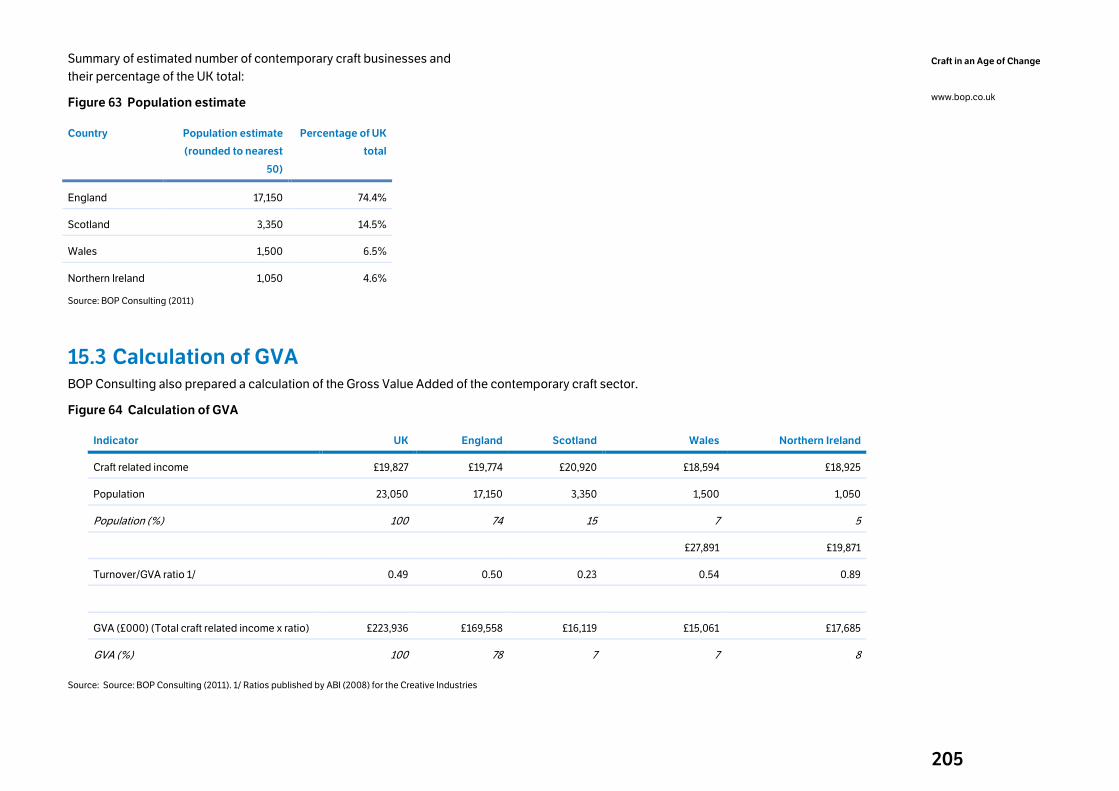
205
Craft in an Age of Change
www.bop.co.uk
Summary of estimated number of contemporary craft businesses and
their percentage of the UK total:
Figure 63 Population estimate
Country Population estimate
(rounded to nearest
50)
Percentage of UK
total
England 17,150 74.4%
Scotland 3,350 14.5%
Wales 1,500 6.5%
Northern Ireland 1,050 4.6%
Source: BOP Consulting (2011)
15.3 Calculation of GVA BOP Consulting also prepared a calculation of the Gross Value Added of the contemporary craft sector.
Figure 64 Calculation of GVA
Indicator UK England Scotland Wales Northern Ireland
Craft related income £19,827 £19,774 £20,920 £18,594 £18,925
Population 23,050 17,150 3,350 1,500 1,050
Population (%) 100 74 15 7 5
£27,891 £19,871
Turnover/GVA ratio 1/ 0.49 0.50 0.23 0.54 0.89
GVA (£000) (Total craft related income x ratio) £223,936 £169,558 £16,119 £15,061 £17,685
GVA (%) 100 78 7 7 8
Source: Source: BOP Consulting (2011). 1/ Ratios published by ABI (2008) for the Creative Industries
206
Craft in an Age of Change
www.bop.co.uk
16. Appendix 9: Consultees Many people contributed to this report through their participation in
focus groups, interviews, steering group meetings and CraftNet
meetings. BOP Consulting would like to thank them all for their help.
Steering group:
Dr Helen Bennett, Portfolio Manager, Creative Scotland
Rachel Brockhurst, Research and Information Officer, Crafts Council
Nathalie Camus, Senior Applied Arts Officer, Arts Council of Wales
Caroline Docherty, Portfolio Partnership Manager, Creative Scotland
Alastair Evans, Development Partnership Officer, Creative Scotland
Rosy Greenlees, Executive Director, Crafts Council
Amanda Jones, Director of External Relations, Crafts Council
Sarah Jones, Research Officer, Arts Council of Wales
Joe Kelly, Director, Craft Northern Ireland
Prof. Sara Selwood, Independent adviser
Helena Ward, Portfolio Manager, Creative Scotland
Claire West, Director of Programmes, Crafts Council
Administrative support was provided by Rachel Brockhurst and Jennie
Andersson of the Crafts Council.
Interviewees:
Philip Hughes, Director, Ruthin Craft Centre
Prof. Georgina Follett, Deputy Principal, University of Dundee
Dr Elizabeth Goring, former Principal Curator, National Museums
Scotland
Robert Livingston, Director. HI Arts
Dr Joseph McBrinn, Lecturer in History and Theory of Design, University
of Ulster
Kim Mawhinney, Head of Art, National Museums Northern Ireland
Andrew Renton, Head of Applied Art, National Museum of Wales
Ralph Turner, freelance curator working in Wales (formerly Crafts
Council)
Prof. Moira Vincentelli, Professor of Art History and Curator of Ceramics,
Aberystwyth University
Emma Walker, Chief Executive, Craft Scotland
Focus group with writers, academics, curators, gallerists (London)
Pamela Buxton, Journalist and editor of BD Reviews
Lesley Craze, Owner, Lesley Craze Gallery
Janis Jefferies, Professor of Visual Arts, University of London, Goldsmiths
Martina Margetts, Senior Tutor in Critical and Historical Studies, Royal
College of Art
Kathleen Slater, Assistant Director of Contemporary at Adrian Sassoon
(Gallery)
Timothy Wilson, Keeper of Western Art, Ashmolean Museum, Oxford
Focus group with makers from Scotland and the North East of
England (Edinburgh)
Catriona Baird, Curator of craft exhibitions
Jo Barker, Tapestry weaver
Stephen Bottomley, Jewellery maker (and academic)
Mhairi Corr, Creates sculptures and figurines in paper pulp
Lorna Fraser, Maker in ceramics
Maureen Hodge, Tapestry weaver
Dorothy Hogg, Jewellery maker
207
Craft in an Age of Change
www.bop.co.uk
Tessa Holland, Jewellery maker
Anna King, Sculptor in paper and fibres
Helena Seget, Maker in ceramics
Fiona Thompson, Maker in ceramics
Sue Woolhouse, Glass artist
Focus group with makers from Wales and the Midlands
(Birmingham)
Angus Eickhoff, Metal worker/artist and blacksmith
Clare Gage, Maker in textiles
Amber Hiscott, Glass artist
Lucy Le Feuvre, Maker of installation/sculptural pieces
Cathy Miles, Maker working in metal and wire
Pea Restall, Maker in ceramics
Teresinha Roberts, Artist and sculptress
Miranda Sharpe, Jewellery maker
Owen Thorpe, Maker in ceramics
Gizella Warburton, Maker in textiles and mixed media
Michele White, Jewellery maker
David Wright, Potter
CraftNet group (meetings in Birmingham and London)
Liz Cooper, Craft Development Curator, Smiths Row
Kate Day, Director, Manchester Craft and Design Centre
Deirdre Figueiredo, Director, Craftspace
Jackie Lee, Relationship Manager Visual Arts (Crafts and Workspace
Development), Arts Council England
Izzy McDonald Booth, Craft and Design Retail Manager, National Glass
Centre
Simon Olding, Director, Crafts Study Centre
Alison Plumridge, Director, Smiths Row
Tina Searle, Chief Executive, Craft Central
Erica Steer, Director, Devon Guild of Craftsmen
Kate Stoddart, Independent curator