craft: the climate resilience analysis framework and tools · what is the climate resilience...
TRANSCRIPT

CRAFT: Climate Resilience Analysis Framework and Tools
Goyder Forum 2017
Project team: Seth Westra (UoA), Lu Zhang (CSIRO), Bree Bennett (UoA), Nick Potter (CSIRO), Marie Ekstrom (CSIRO), Mark Thyer (UoA), Holger Maier (UoA)
Additional in-kind contributions from: Francis Chiew (CSIRO) and Sam Culley (UoA)
What is the Climate Resilience Analysis Framework?
2
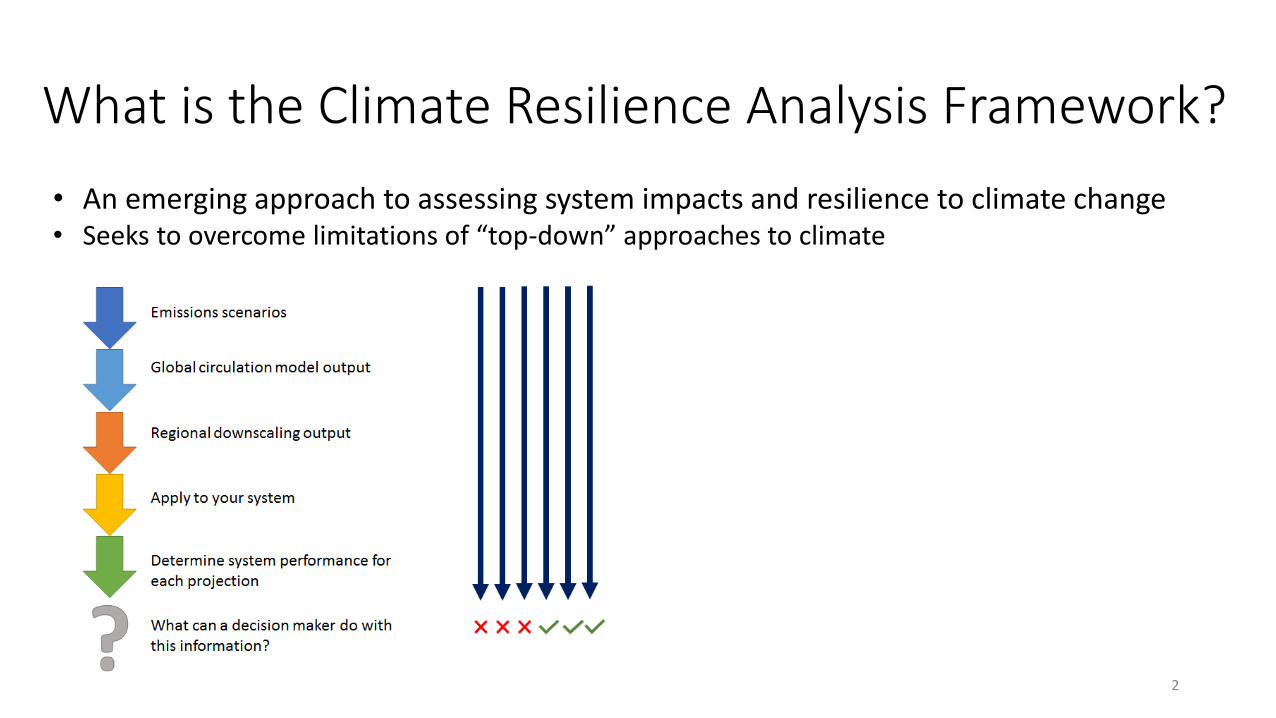
• An emerging approach to assessing system impacts and resilience to climate change • Seeks to overcome limitations of “top-down” approaches to climate
What is the Climate Resilience Analysis Framework?
3
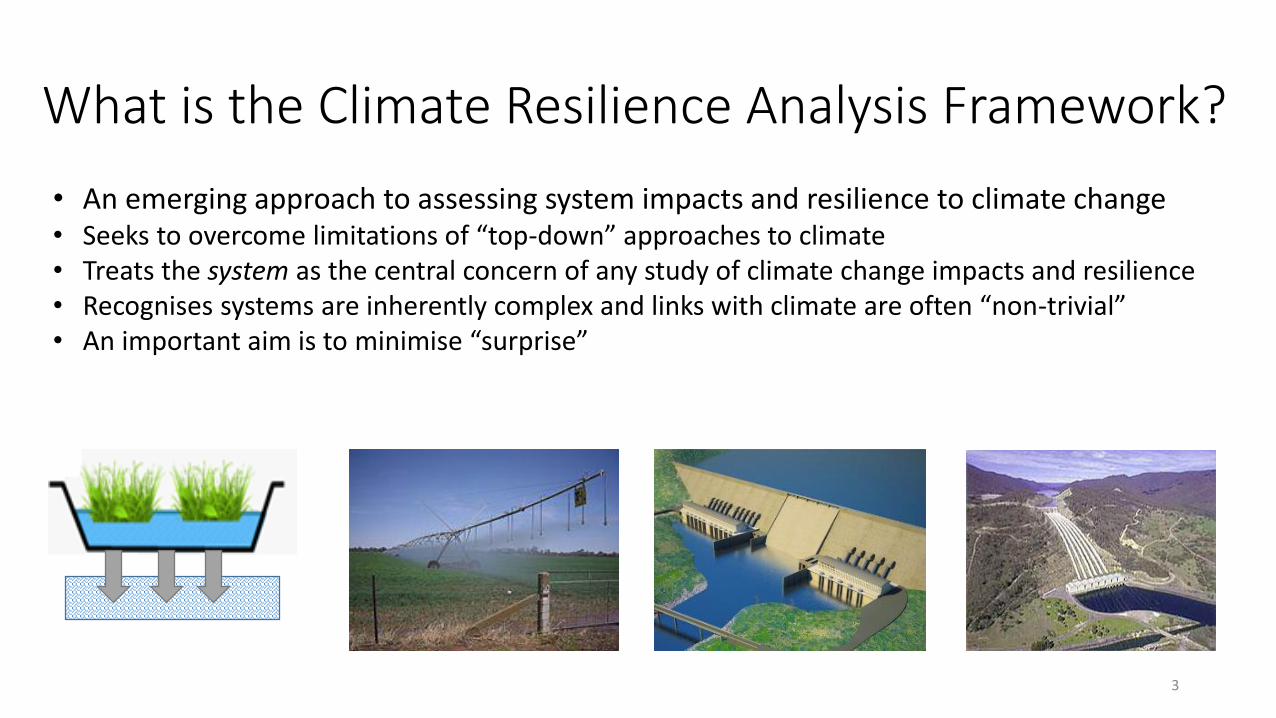
• An emerging approach to assessing system impacts and resilience to climate change • Seeks to overcome limitations of “top-down” approaches to climate• Treats the system as the central concern of any study of climate change impacts and resilience • Recognises systems are inherently complex and links with climate are often “non-trivial”• An important aim is to minimise “surprise”
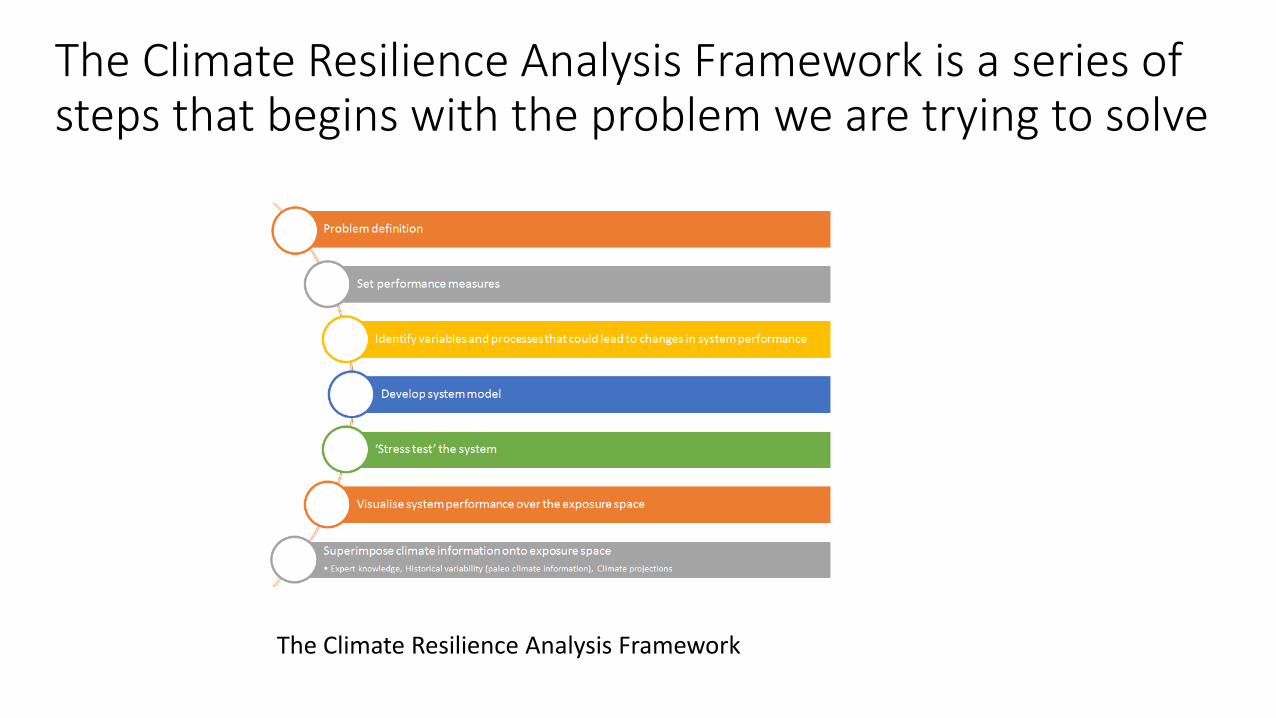
The Climate Resilience Analysis Framework is a series of steps that begins with the problem we are trying to solve
The Climate Resilience Analysis Framework
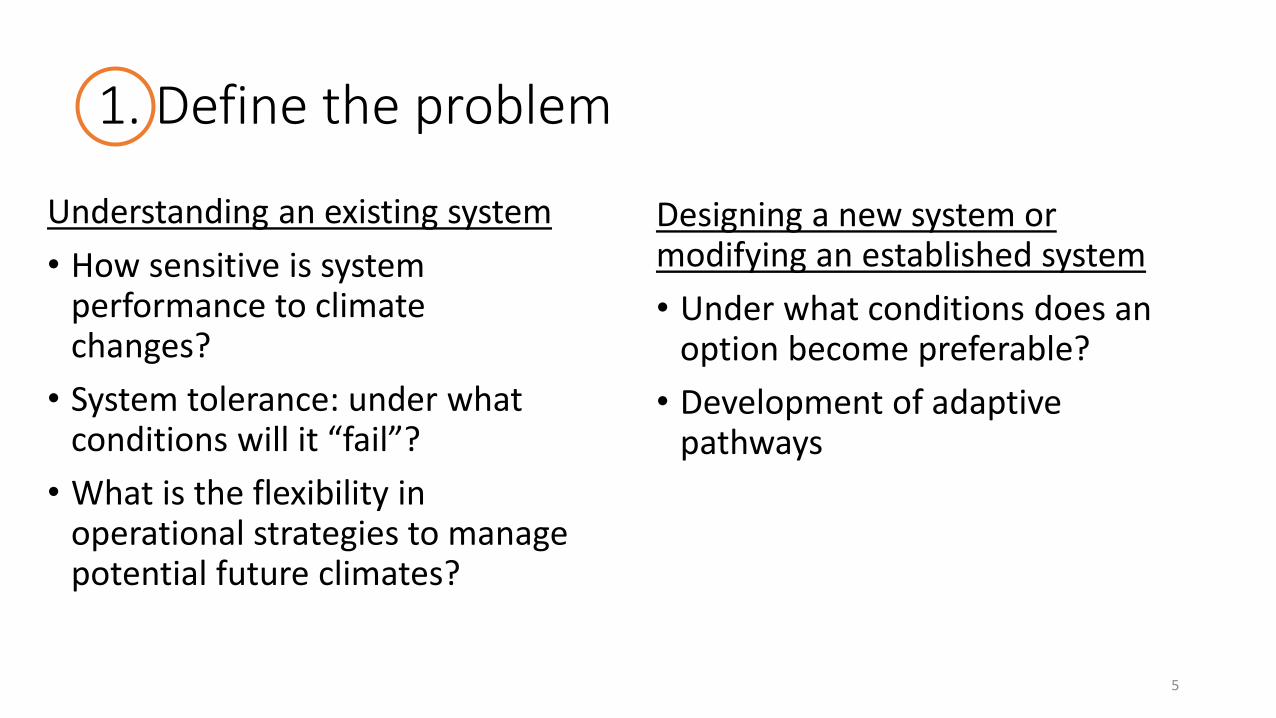
1. Define the problem
Understanding an existing system
• How sensitive is system performance to climate changes?
• System tolerance: under what conditions will it “fail”?
• What is the flexibility in operational strategies to manage potential future climates?
Designing a new system or modifying an established system
• Under what conditions does an option become preferable?
• Development of adaptive pathways
5
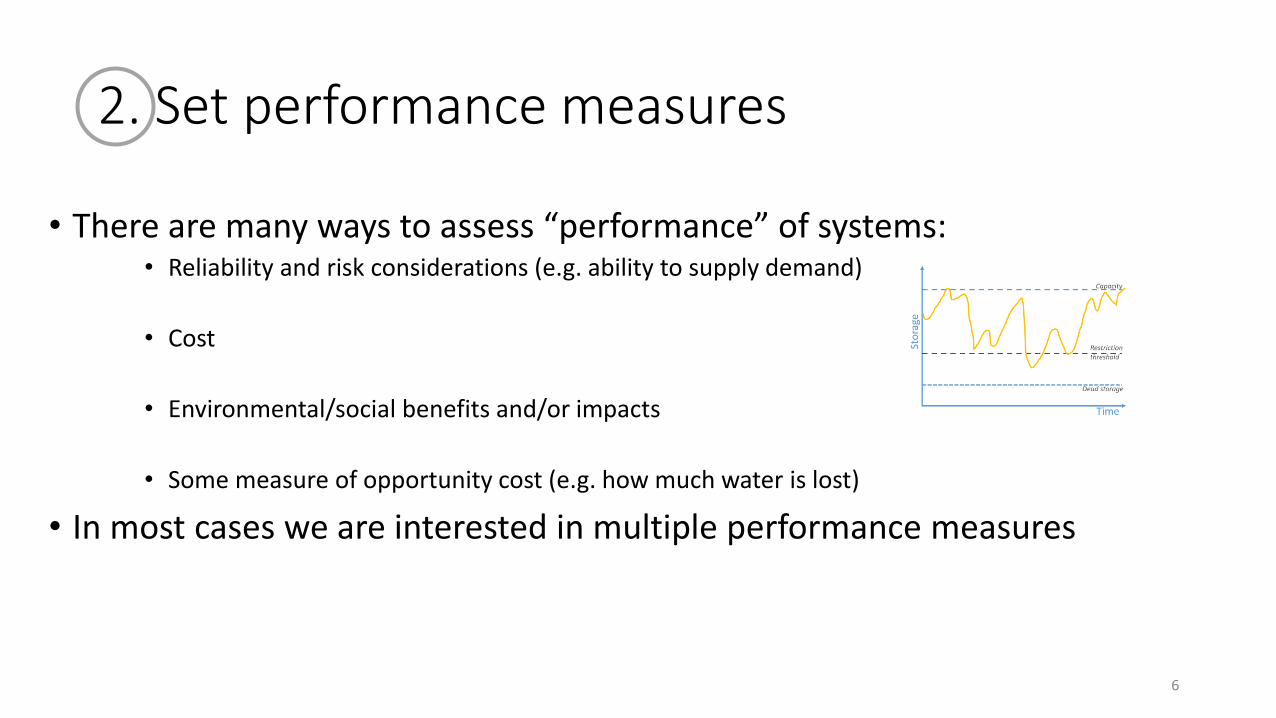
2. Set performance measures
• There are many ways to assess “performance” of systems:• Reliability and risk considerations (e.g. ability to supply demand)
• Cost
• Environmental/social benefits and/or impacts
• Some measure of opportunity cost (e.g. how much water is lost)
• In most cases we are interested in multiple performance measures
6
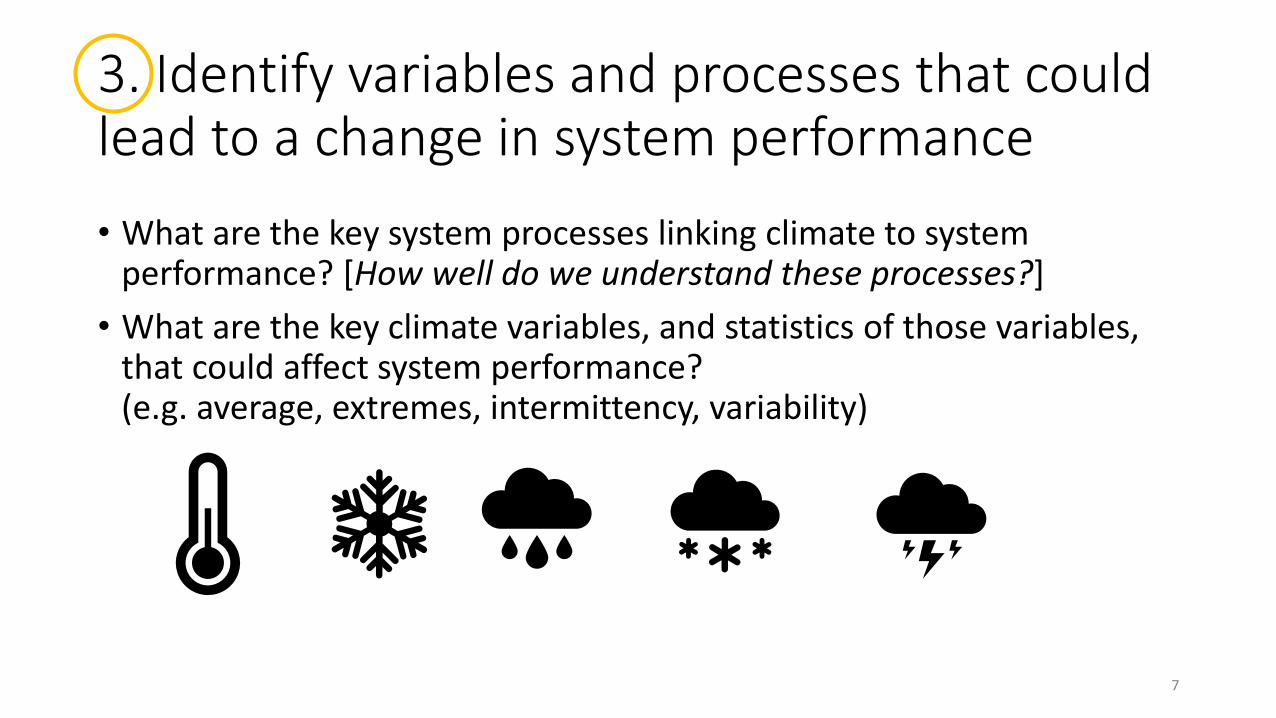
3. Identify variables and processes that could lead to a change in system performance
• What are the key system processes linking climate to system performance? [How well do we understand these processes?]
• What are the key climate variables, and statistics of those variables, that could affect system performance?(e.g. average, extremes, intermittency, variability)
7
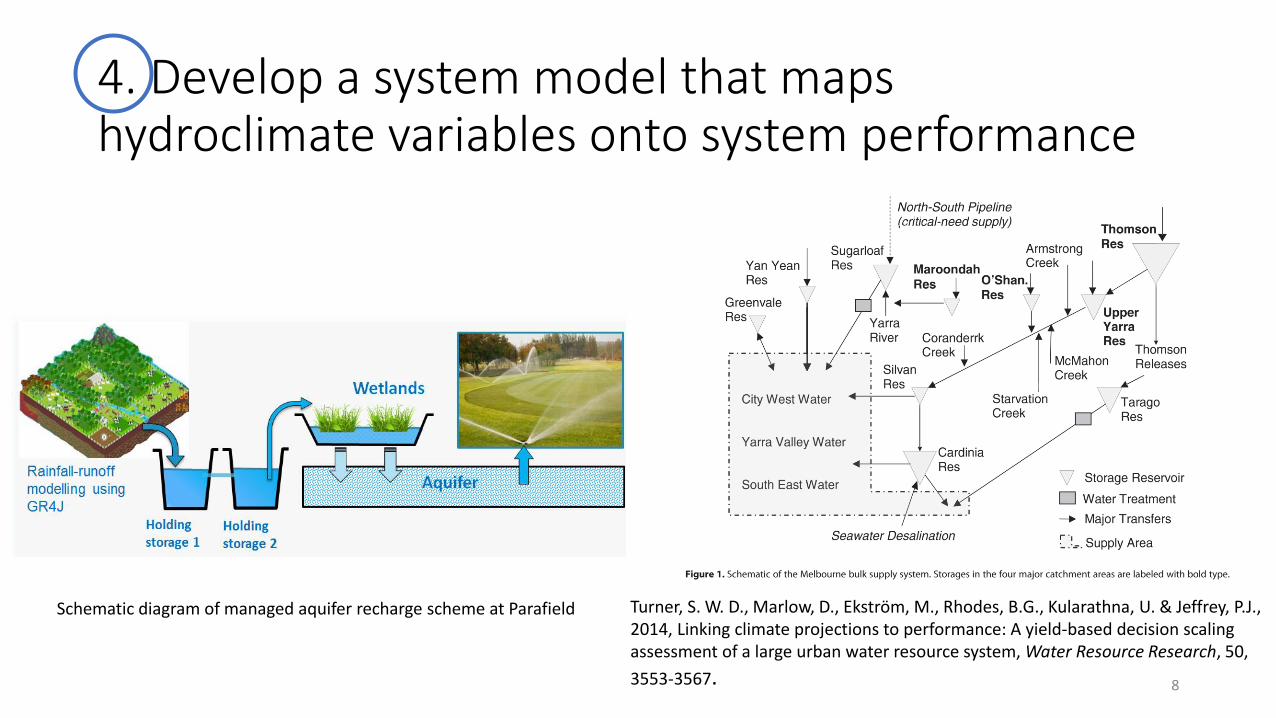
4. Develop a system model that maps hydroclimate variables onto system performance
8
Turner, S. W. D., Marlow, D., Ekström, M., Rhodes, B.G., Kularathna, U. & Jeffrey, P.J., 2014, Linking climate projections to performance: A yield-based decision scaling assessment of a large urban water resource system, Water Resource Research, 50,
3553-3567.
Schematic diagram of managed aquifer recharge scheme at Parafield
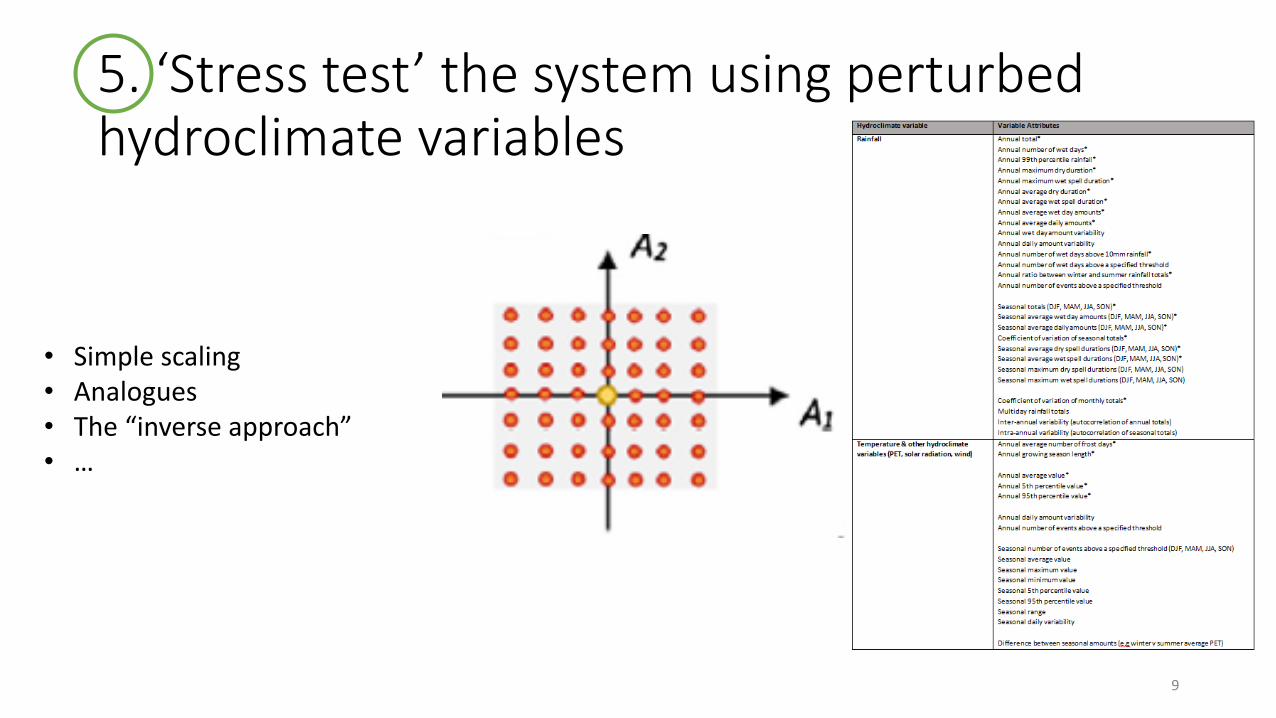
5. ‘Stress test’ the system using perturbed hydroclimate variables
9
• Simple scaling• Analogues• The “inverse approach”• …
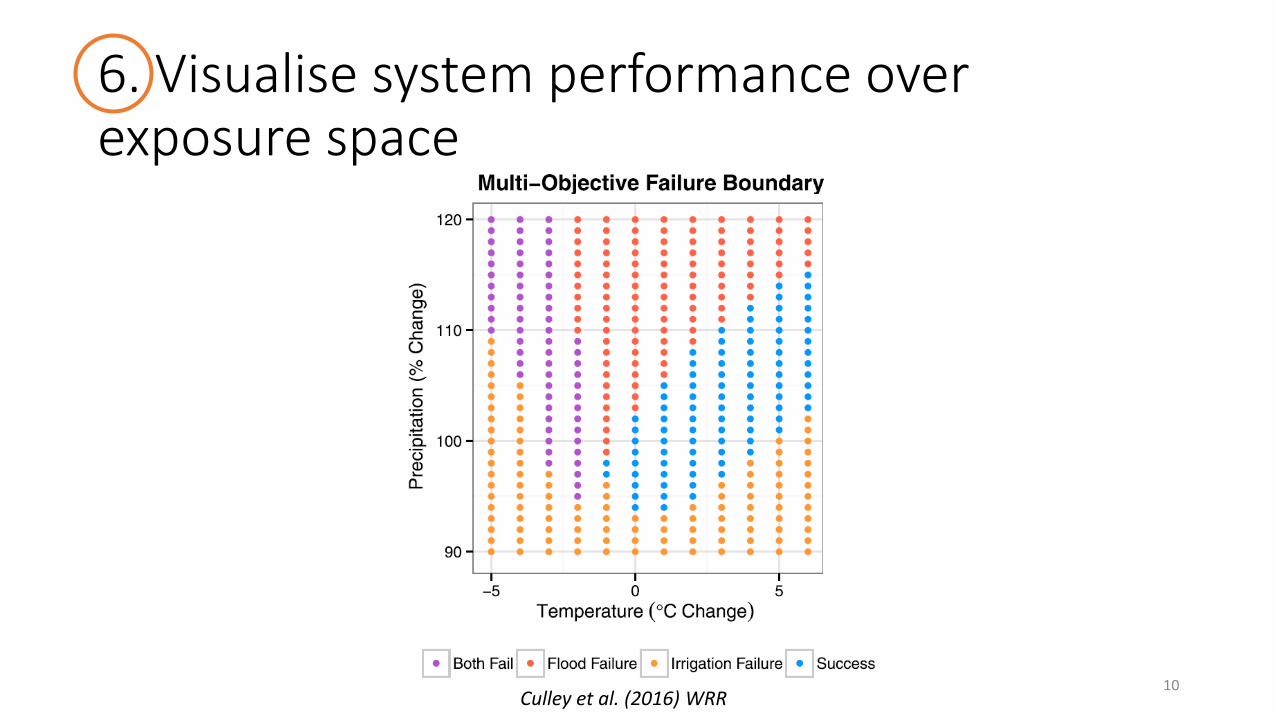
6. Visualise system performance over exposure space
10Culley et al. (2016) WRR
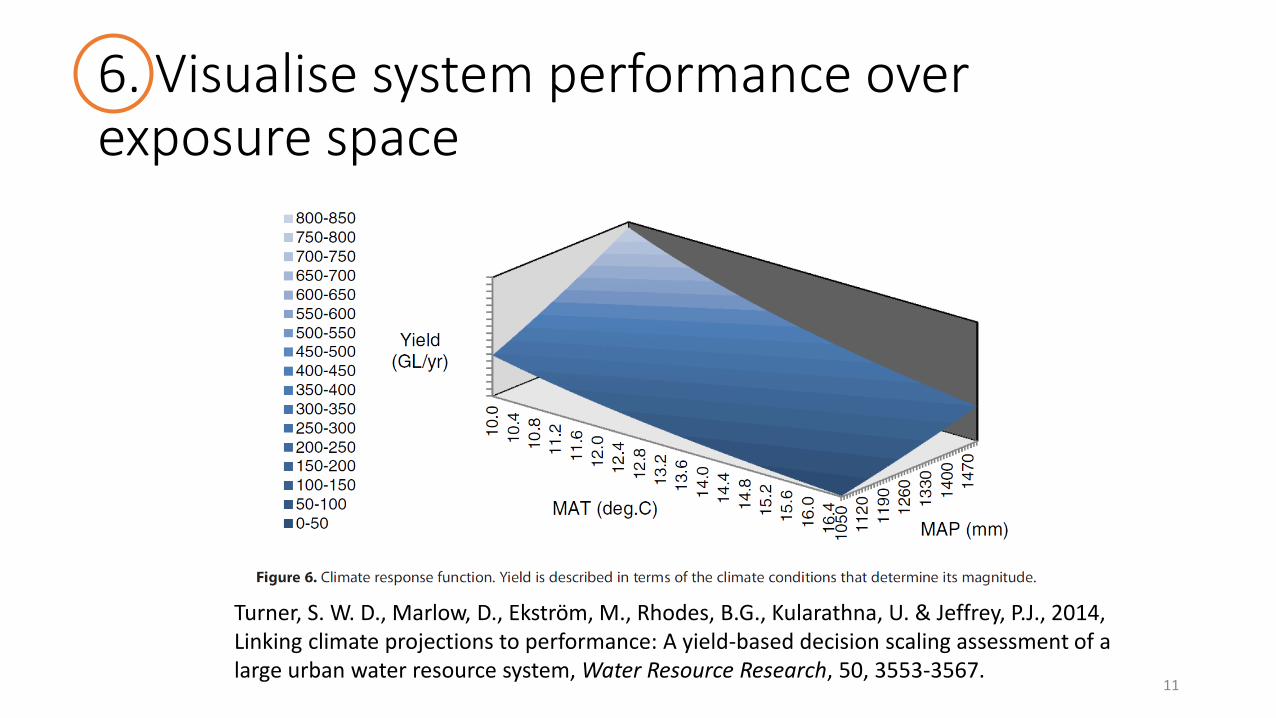
6. Visualise system performance over exposure space
11
Turner, S. W. D., Marlow, D., Ekström, M., Rhodes, B.G., Kularathna, U. & Jeffrey, P.J., 2014, Linking climate projections to performance: A yield-based decision scaling assessment of a large urban water resource system, Water Resource Research, 50, 3553-3567.

6. Visualise system performance over exposure space
12Decision-scaling schematic: different optimal decisions depending on climate information. Brown et al. (2012) WRR
13
Mean Rainfall
Mea
n T
emp
erat
ure
5th percentile temperature
Mea
n T
emp
era
ture
99 percentile Rainfall
Mea
n W
et s
pel
l len
gth
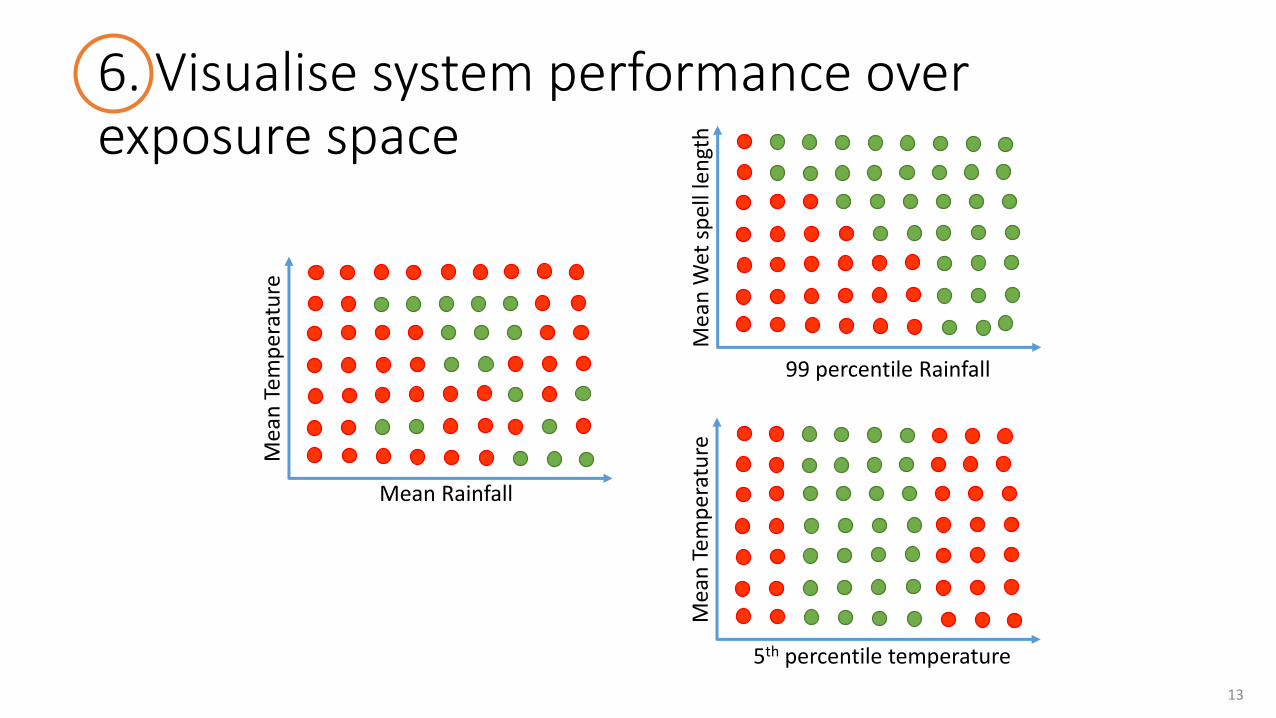
6. Visualise system performance over exposure space

7. Superimpose climate information onto exposure space
14
15
99 percentile Rainfall
Mea
n W
et s
pel
l len
gth
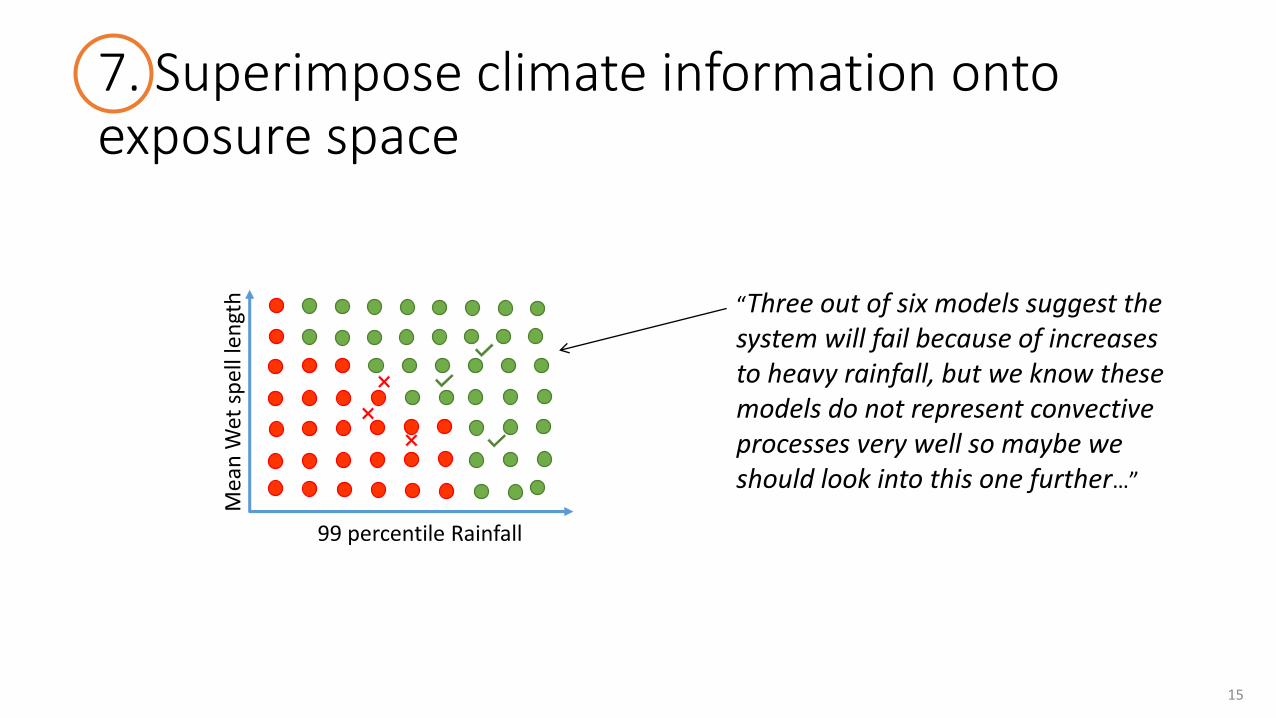
7. Superimpose climate information onto exposure space
“Three out of six models suggest the system will fail because of increases to heavy rainfall, but we know these models do not represent convective processes very well so maybe we should look into this one further…”
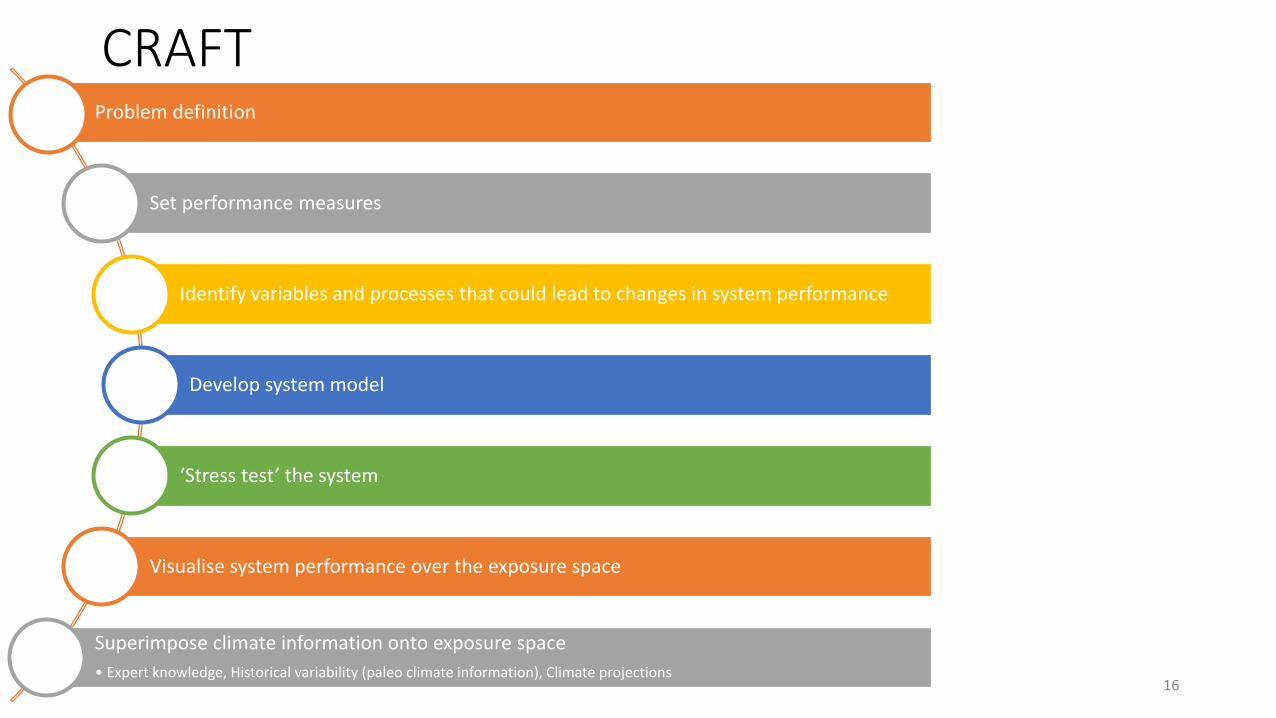
16
Problem definition
Set performance measures
Identify variables and processes that could lead to changes in system performance
Develop system model
‘Stress test’ the system
Visualise system performance over the exposure space
Superimpose climate information onto exposure space
• Expert knowledge, Historical variability (paleo climate information), Climate projections
CRAFT
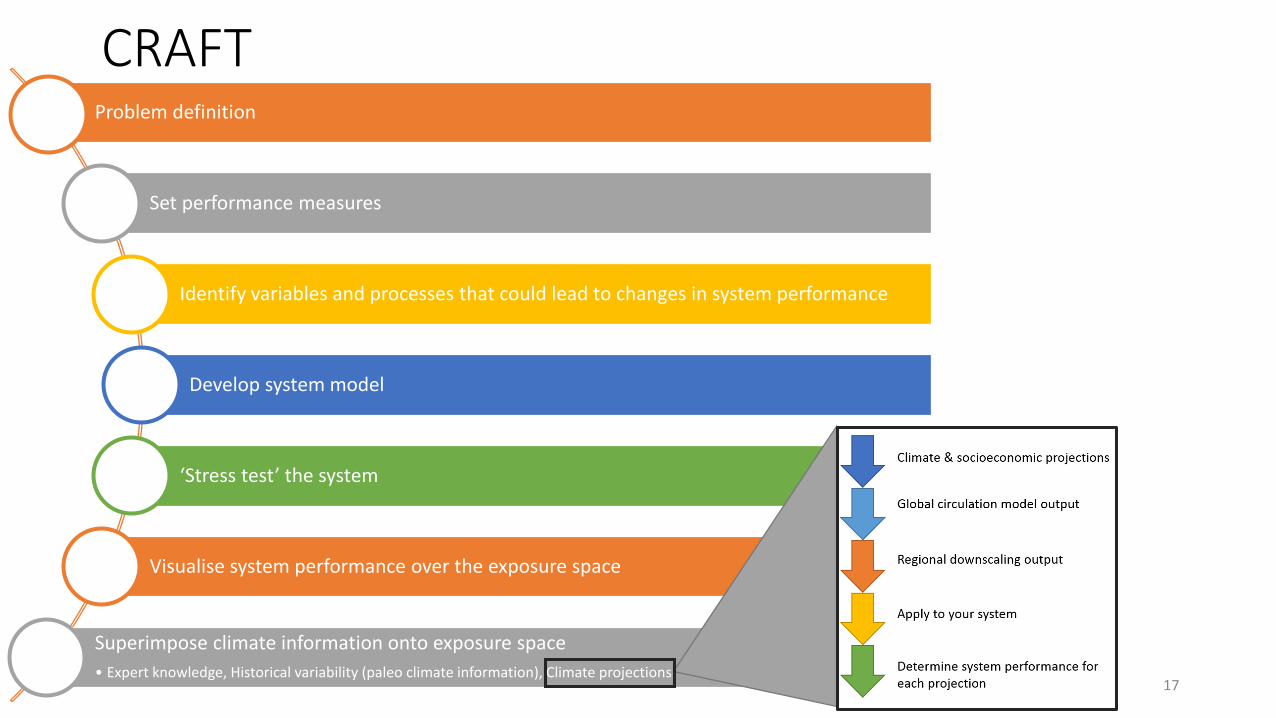
Problem definition
Set performance measures
Identify variables and processes that could lead to changes in system performance
Develop system model
‘Stress test’ the system
Visualise system performance over the exposure space
Superimpose climate information onto exposure space
• Expert knowledge, Historical variability (paleo climate information), Climate projections17
CRAFT
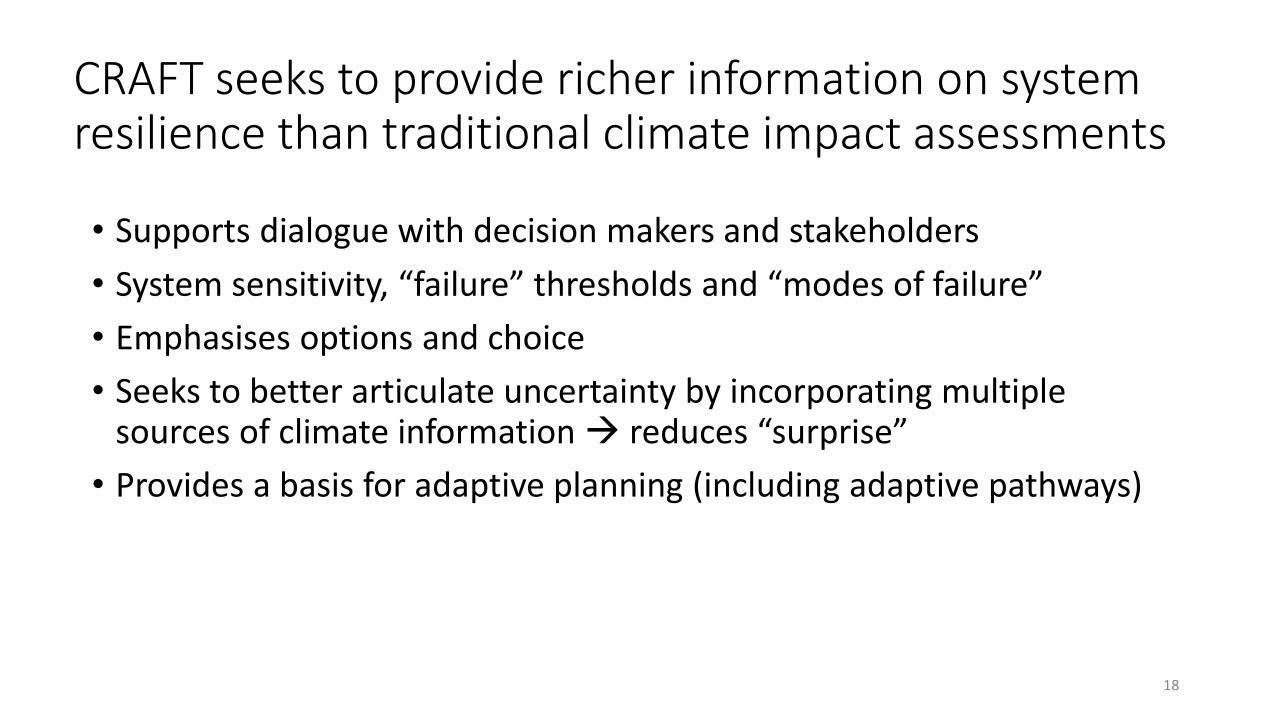
• Supports dialogue with decision makers and stakeholders
• System sensitivity, “failure” thresholds and “modes of failure”
• Emphasises options and choice
• Seeks to better articulate uncertainty by incorporating multiple sources of climate information reduces “surprise”
• Provides a basis for adaptive planning (including adaptive pathways)
CRAFT seeks to provide richer information on system resilience than traditional climate impact assessments
18
CRAFT
19
Acknowledgements:
This work undertaken as part of the Goyder Institute ‘Climate resilienceanalysis framework and tools’ project (project number CA.16.01)