craig handicap assessment & reporting technique · susan charlifue, m.a. kenneth a. gerhart,...
TRANSCRIPT
CraigHandicapAssessment &ReportingTechnique

GUIDE FOR USE OF THE CHART:
CRAIG HANDICAP ASSESSMENTAND REPORTING TECHNIQUE
by:
Gale G. Whiteneck, Ph.D.CA Brooks, MSHA
Susan Charlifue, M.A.Kenneth A. Gerhart, R.P.T., M.S.
David Mellick, MADrew Overholser, M.A.
George N. Richardson, M.R.C.
CRAIG HOSPITAL
For further information contact:
David Mellick, MACraig Hospital
3425 South ClarksonEnglewood, CO 80110Phone: (303) 789-8202
Email :[email protected]
© Copyright 1988, 1992 Craig Hospital

iii
TABLE OF CONTENTS
THEORETICAL BACKGROUND ......................................................................................................................................................5STRATEGY FOR DEVELOPMENT.....................................................................................................................................................5CHARACTERISTICS: DIMENSIONS OF HANDICAP .....................................................................................................................7USE OF THE INSTRUMENT................................................................................................................................................................8SCORING OVERVIEW ....................................................................................................................................................................8FACTORS INFLUENCING CHART SCORES..................................................................................................................................12CHART SCORING GUIDELINES AND INSTRUCTIONS ................................................................................................................12
PHYSICAL INDEPENDENCE SCORE .........................................................................................................................................12COGNITIVE INDEPENDENCE SCORE ......................................................................................................................................13MOBILITY SCORE .......................................................................................................................................................................13OCCUPATION SCORE ..............................................................................................................................................................13SOCIAL INTEGRATION SCORE.................................................................................................................................................14ECONOMIC SELF-SUFFICIENCY SCORE .................................................................................................................................14
CODING GUIDELINES AND CONVENTIONS .............................................................................................................................16CHART References ......................................................................................................................................................................19CHART Short Form........................................................................................................................................................................20RESULTS AND CONCLUSIONS .....................................................................................................................................................20TABLES AND GRAPHS – CHART SF..............................................................................................................................................21Behavioral Risk Factor Surveillance System (BRFSS) Analysis of CHART SF ..........................................................................28APPENDIX A - CHART Long Form...............................................................................................................................................30APPENDIX B - CHART Long Form Scoring .................................................................................................................................34APPENDIX C - CHART Short Form - Interview ...........................................................................................................................41APPENDIX D - CHART Short Form - Paper.................................................................................................................................44APPENDIX E - CHART Short Form Scoring ................................................................................................................................47

iv
INDEX OF TABLES
Table 1: Percentile Distribution of Physical Independence Scores by ASIA Score .............................................................9Table 2: Percentile Distribution of Mobility Scores by ASIA Score ..........................................................................................9Table 3: Percentile Distribution of Occupation Scores by ASIA Score ..................................................................................9Table 4: Percentile Distribution of Social Integration Scores by ASIA Score.........................................................................9Table 5: Percentile Distribution of Economic Self-Sufficiency Scores by ASIA Score ........................................................10Table 6: Percentile Distribution of Total CHART Scores by ASIA Score ................................................................................10Table 7 : Percentile Distribution of Physical Independence Scores by Impairment Group ............................................10Table 8: Percentile Distribution of Cognitive Independence Scores by Impairment Group...........................................10Table 9 : Percentile Distribution of Mobility Scores by Impairment Group .........................................................................10Table 10 : Percentile Distribution of Social Integration Scores by Impairment Group......................................................11Table 11 : Percentile Distribution of Occupation Scores by Impairment Group ...............................................................11Table 12 : Percentile Distribution of Economic Self-Sufficiency Scores by Impairment Group .......................................11Table 13 : Percentile Distribution of CHART Scores by Impairment Group .........................................................................11Physical Independence Table and Graph.............................................................................................................................22Mobility Table and Graph..........................................................................................................................................................23Cognitive Table and Graph ......................................................................................................................................................24Occupation Table and Graph..................................................................................................................................................25Social Integration Table and Graph ........................................................................................................................................26Economic Self Sufficiency Table and Graph..........................................................................................................................27Descriptive information for CHART SF subscales by Activity Limitation ...............................................................................29

5
THEORETICAL BACKGROUND
The model of disablement suggested by the WorldHealth Organization (WHO) has provided usefulconceptual distinctions for impairment, disability,and handicap. In practical terms, impairmentoccurs at the organ level, representing any loss orabnormality of psychological, physiological, oranatomical structure or function. Disability occurs atthe time the persons level, demonstrated as anyrestriction or lack of ability (resulting from animpairment) to perform any activity in the manner orwithin the range considered normal for a humanbeing. Handicap occurs at the societal level. It is adisadvantage for a given individual, resulting froman impairment or a disability, that limits or preventsthe fulfillment of a role that is normal (depending onage, sex, and social and cultural factors) for thatindividual.
According to the WHO, handicap describes thetotal effects and interplay of all the consequencesof disability: social, economic, cultural, andenvironmental.
The WHO has identified six dimensions by which theextent of a person’s handicap can be described: 1)orientation, 2) physical independence, 3) mobility, 4)occupation, 5) social integration, and 6) economicself-sufficiency.
A great deal of work has been done in developingtools to measure and document impairment and
disability; however, limited attempts have focusedon the measurement and assessment of long-termhandicap, despite the fact that psychosocialadjustment is clearly regarded as the ultimateoutcome of rehabilitation.
The Craig Handicap Assessment and ReportingTechnique (CHART) was developed to assess theWHO dimensions of handicap. The instrument wasdesigned to provide a simple, objective measure ofthe degree to which impairments and disabilitiesresult in handicaps in the years after initialrehabilitation. A copy of the instrument is attachedas Appendix A.
STRATEGY FOR DEVELOPMENT
In planning the design of a handicap measurementtool for people with disabilities, several questionswere raised. First, was there any existing index ofhandicap as a whole or of any WHO defineddimension of handicap? Second, what items wouldneed to be included on a questionnaire, and howwould they be quantified such that indices of thevarious dimensions of handicap could bedeveloped? Third, could the measurement tool bedesigned so that minor modifications would make itof more global value in measuring handicap fordifferent types of disabilities? Fourth, can theinstrument be shortened in length while stillmaintaining a certain degree of comparability withthe original score?

6
Regarding the first question, while issues relating tothe concept of handicap are included in a numberof research studies, no single instrument addressedall handicap dimensions or produced an index ofhandicap using a scoring technique.
To address the second question, a team ofrehabilitation and research professionals metregularly to discuss items for inclusion on thequestionnaire and, finally, to select those itemswhich would best measure the dimensions ofhandicap. Decisions also had to be maderegarding quantification of the various items. As aresult, the CHART includes items which focus onobjectively observable criteria which are less likely tobe open to subjective interpretation. Thus, CHARTitems identify behaviors rather than perceptions orattitudes. Based on the WHO model of handicapthe original CHART included five of the six WHOdomains. A pilot test was carried out with a sampleof people with spinal cord injuries (SCI) in order tocalibrate the scoring procedures for each of thedimension sub-scales, validate that significantdifferences in handicap existed between non-disabled persons and those with SCI, and determinethe extent of handicap for the persons with SCI.Reliability and validity testing of CHART as well asanalysis of the individual item weighting has beenconducted, establishing the psychometricsoundness of this instrument.
The efforts described above have resulted in a 100-point subscale for each dimension of handicap,which can be interpreted individually or, when
totaled, give an overall index of handicap. Whileinitially developed for persons with SCI, the CHARTwas later tested with the additional WHO domain oforientation among persons with various impairments.Reliability and validity testing for the new domain"Orientation" has been completed, while ongoinganalysis of validity for differing impairment groupscontinue.
In 1999, analysis of CHART resulted in the creation ofthe CHART Short Form (CHART SF). Analysis of CHART-SF has been conducted on various disabilitypopulations including spinal cord injury, traumaticbrain injury, stroke, MS, burn and amputeepopulations. Results indicate that there exists a highcorrelation between all the CHART-SF subscales andthe CHART counterparts. Additionally, CHART-SFyielded reasonable estimates of PhysicalIndependence, Cognitive Independence, Mobility,Social Integration and Occupation sub-scores in allimpairment categories. A copy of the instrument isattached as Appendix C.

7
CHARACTERISTICS: DIMENSIONS OFHANDICAP
Each CHART dimension of handicap ischaracterized by directly observable qualities whichlend themselves to easy quantification. While aninfinite number of factors might have been includedto keep the instrument to a practical length. Thefollowing dimensions have been operationalizedbased on the WHO definitions.
Physical Independence is the individual’s ability tosustain a customarily effective independentexistence. The major component of this sub-scale isthe number of hours per day someone is needed toprovide routine or occasional assistance (whetherpaid or unpaid). Individuals are viewed assomewhat less handicapped if they take primaryresponsibility for instructing and directing peoplewho are providing assistance to them.Cognitive Independence is the individual's ability tosustain a customary level of independence withoutthe need for supervision. The factors included in thissubscale reflect the amount of hours that a personneeds supervision both inside and outside the home,as well as the amount of difficulty an individual hasin remembering, communicating and managingmoney.Mobility is the individual’s ability to move abouteffectively in his/her surroundings and isdemonstrated by the hours per day out of bed, daysper week out of the house, nights per year spent
away from home, accessibility of the home, andtransportation utilization.Occupation is the individual’s ability to occupy timein the manner customary to that person’s sex, age,and culture. The time spent in various activities isused to measure this dimension. The relative valuesociety places on different activities is used toweight the time in each category. Although therewas a potential for subjective bias based on valuejudgments in developing the scale in this dimension,priority has been give to gainfully employment,schooling, and active homemaking andmaintenance, and this prioritization has beensupported by validity and reliability testing. Otherelements documented include volunteer work,recreational pursuits, and self-improvementactivities.Social Integration is the individual’s ability toparticipate in and maintain customary socialrelationships. The factors included in this sub-scaleinclude household composition; romanticinvolvement; the number of relatives, businessassociates, and friends with whom regular written ororal contract is maintained; and the frequency ofinitiating conversations with strangers.Economic Self-Sufficiency is the individual’s ability tosustain customary socio-economic activity andindependence. This dimension is defined as theremaining disposable household family income afternon-reimbursed medical expenses have beenexcluded.

8
USE OF THE INSTRUMENT
The CHART is designed as an interview tool, whichcan be administered face-to-face or by telephone.Each item on the instrument has been carefully andconcisely worded to minimize ambiguity ofinterpretation. It is possible to use the instrument as amailed questionnaire, although some valuable datapotentially would be lost in the absence ofinteraction with an interviewer providing consistentprompts.
There is no set time period for administering theCHART; however, it is recommended that multiplemeasurements be taken over the course of aperson’s lifetime to assess changes with adaptationto the disability and to gain insight into changes inhandicap which may occur over time.
SCORING OVERVIEW
A major asset of the CHART is that it produces anindex of handicap. There are a number of ways fora person with a disability to demonstrate theabsence of handicap, and the scoring proceduresof the CHART give credit to these various behaviors.However, the instrument is designed to measurehandicap, not to identify the characteristics sharedby ‘super-achievers.’ Therefore, although it ispossible to score more than 100 on most of the sub-scales, a maximum of 100 points has been allowed,as a score of 100 would indicate no handicap inthat dimension.
It is recognized that value judgments are critical tothe actual scoring of many items. These valuejudgments reflect the expectations of society fornon-disabled persons, and a pilot test of the CHARTon non-disabled persons was used to calibrate thescoring. The vast majority of non-disabled personsreceived a score of 100 on each dimension whilescores below 100 were common among individualswith spinal cord injury. The scoring guidelines andstep-by-step instructions will be described later.
The data in the following tables are based on ananalysis of nearly 500 individuals with SCI for whomCHART information is available. These individualscompleted CHART while the cognitive domain wasstill being tested. Nevertheless, the tables areprovided to illustrate the types of scores you mayexpect for people with various levels of disabilities.For example, in the ‘Percentile Distribution ofPhysical Independence Scores’ table, 10% of the‘Cervical-MIS =0’ group achieved a score of 4 orless, while 25% achieved a score of 28 or less.
The motor index score, developed by the AmericanSpinal Injuries Association, provides a numericalsystem to evaluate strength in ten key upper andlower extremity muscles. The scores for each muscleare added together to create a motor index scorefor an individual. In the following tables, the grouplabeled ‘Cervical-MIS =0’ represents persons withcervical level injuries and motor index scores of 0.These are individuals with high level neurologicallycomplete quadriplegia. The ‘Cervical-MIS = 1-49’group represents persons with cervical level injuries

9
and motor index scores between 1 and 49. The‘Cervical-MIS .49’ group scores greater than 49,including those with quadriparesis. The grouplabeled ‘Thoracolumbar-MIS =50’ representsindividuals with neurologically complete paraplegia.The group labeled ‘Thoracolumbar-MIS .50’represents persons with neurologically incomplete orlow level paraplegia.
The groups represented in the following tables are ofvarying sizes. The percentile distributions of thelarger groups are presumed to be more accurate.
Table 1: Percentile Distribution of PhysicalIndependence Scores by ASIA Score
Interdecile RangeInterquartile Range
Median10th 25th 50th 75th 90th
Cervical-MIS=0 (N=29) 4 28 57 85 94Cervical-MIS 1-49 (N=131) 28 76 88 94 100Cervical-MIS >49 (N=44) 89 96 100 100 100Thoracolumbar-MIS=50 (N=105) 95 99 100 100 100Thoracolumbar-MIS >50 (N=33) 88 100 100 100 100Nondisabled (N=88) 100 100 100 100 100
Table 2: Percentile Distribution of Mobility Scores byASIA Score
Interdecile RangeInterquartile Range
Median10th 25th 50th 75th 90th
Cervical-MIS=0 (N=29) 28 51 71 85 96Cervical-MIS 1-49 (N=131) 41 72 89 100 100Cervical-MIS >49 (N=44) 68 88 100 100 100Thoracolumbar-MIS=50 (N=105) 79 92 100 100 100Thoracolumbar-MIS >50 (N=33) 94 100 100 100 100Nondisabled (N=88) 100 100 100 100 100
Table 3: Percentile Distribution of Occupation Scoresby ASIA Score
Interdecile RangeInterquartile Range
Median10th 25th 50th 75th 90th
Cervical-MIS=0 (N=29) 3 10 22 53 63Cervical-MIS 1-49 (N=131) 10 25 48 95 100Cervical-MIS >49 (N=44) 19 32 62 100 100Thoracolumbar-MIS=50 (N=105) 23 42 78 100 100Thoracolumbar-MIS >50 (N=33) 29 57 85 100 100Nondisabled (N=88) 70 98 100 100 100
Table 4: Percentile Distribution of Social IntegrationScores by ASIA Score
Interdecile RangeInterquartile Range
Median10th 25th 50th 75th 90th
Cervical-MIS=0 (N=29) 30 65 85 100 100Cervical-MIS 1-49 (N=131) 55 82 96 100 100Cervical-MIS >49 (N=44) 65 85 100 100 100Thoracolumbar-MIS=50 (N=105) 62 88 100 100 100Thoracolumbar-MIS >50 (N=33) 75 94 100 100 100Nondisabled (N=88) 93 100 100 100 100

10
Table 5: Percentile Distribution of Economic Self-Sufficiency Scores by ASIA Score
Interdecile RangeInterquartile Range
Median10th 25th 50th 75th 90th
Cervical-MIS=0 (N=29) 25 50 75 100 100Cervical-MIS 1-49 (N=131) 25 50 100 100 100Cervical-MIS >49 (N=44) 25 75 100 100 100Thoracolumbar-MIS=50 (N=105) 25 75 100 100 100Thoracolumbar-MIS >50 (N=33) 50 75 100 100 100Nondisabled (N=88) 75 100 100 100 100
Table 6: Percentile Distribution of Total CHART Scoresby ASIA Score
Interdecile RangeInterquartile Range
Median10th 25th 50th 75th 90th
Cervical-MIS=0 (N=29) 232 260 358 364 435Cervical-MIS 1-49 (N=131) 227 334 410 457 491Cervical-MIS >49 (N=44) 345 390 420 495 500Thoracolumbar-MIS=50 (N=105) 345 399 449 489 500Thoracolumbar-MIS >50 (N=33) 357 450 472 492 500Nondisabled (N=88) 425 468 500 500 500
Tables 7-13 provide the characteristics of CHART asthe scores relate to persons with differingImpairments. Persons with spinal cord injury (SCI),traumatic brain injury (TBI), Stroke, MS, Burn andAmputees were administered the CHART. Whilecaution should be used in comparing thehandicappedness of various impairments, the datashow that the use of CHART across impairmentgroups is supported by its ability to differentiateassistance needs in a manner consistent with thoseneeds that are associated with a certain disability.
Table 7 : Percentile Distribution of PhysicalIndependence Scores by Impairment Group
Interdecile RangeInterquartile Range
Median10th 25th 50th 75th 90th
SCI 50 80 93 100 100TBI 88 99 100 100 100MS 88 97 99 100 100Stroke 4 86 99 100 100Amputee 94 99 100 100 100Burn 99 100 100 100 100
Table 8: Percentile Distribution of CognitiveIndependence Scores by Impairment Group
Interdecile RangeInterquartile Range
Median10th 25th 50th 75th 90th
SCI 82 94 100 100 100TBI 34 63 88 100 100MS 62 88 94 100 100Stroke 26 52 88 100 100Amputee 88 100 100 100 100Burn 92 96 100 100 100
Table 9 : Percentile Distribution of Mobility Scores byImpairment Group
Interdecile RangeInterquartile Range
Median10th 25th 50th 75th 90th
SCI 51 65 81 95 100TBI 54 73 90 97 100MS 47 67 82 95 100Stroke 31 52 68 89 97Amputee 70 87 95 99 100Burn 72 92 97 100 100

11
Table 10 : Percentile Distribution of Social IntegrationScores by Impairment Group
Interdecile RangeInterquartile Range
Median10th 25th 50th 75th 90th
SCI 45 70 85 100 100TBI 30 90 80 100 100MS 50 70 90 100 100Stroke 20 40 61 84 98Amputee 46 70 93 100 100Burn 42 68 95 100 100
Table 11 : Percentile Distribution of OccupationScores by Impairment Group
Interdecile RangeInterquartile Range
Median10th 25th 50th 75th 90th
SCI 16 37 79 100 100TBI 15 35 88 100 100MS 19 39 82 100 100Stroke 2 9 31 55 90Amputee 38 67 99 100 100Burn 48 76 100 100 100
Table 12 : Percentile Distribution of Economic Self-Sufficiency Scores by Impairment Group
Interdecile RangeInterquartile Range
Median10th 25th 50th 75th 90th
SCI 25 50 100 100 100TBI 25 63 100 100 100MS 28 75 100 100 100Stroke 25 50 100 100 100Amputee 25 25 88 100 100Burn 25 31 100 100 100
Table 13 : Percentile Distribution of CHART Scores byImpairment Group
Interdecile RangeInterquartile Range
Median10th 25th 50th 75th 90th
SCI 394 438 493 539 586TBI 361 460 517 571 590MS 387 457 521 568 594Stroke 241 366 454 510 558Amputee 450 492 536 579 597Burn 415 498 550 594 599
The tables presented are intended to be used asguidelines. It is unlikely that your own testing resultswill exactly match the data in the tables. It ishoped, however, that this information will help you inidentifying trends in CHART scores obtained fromother individuals.
12
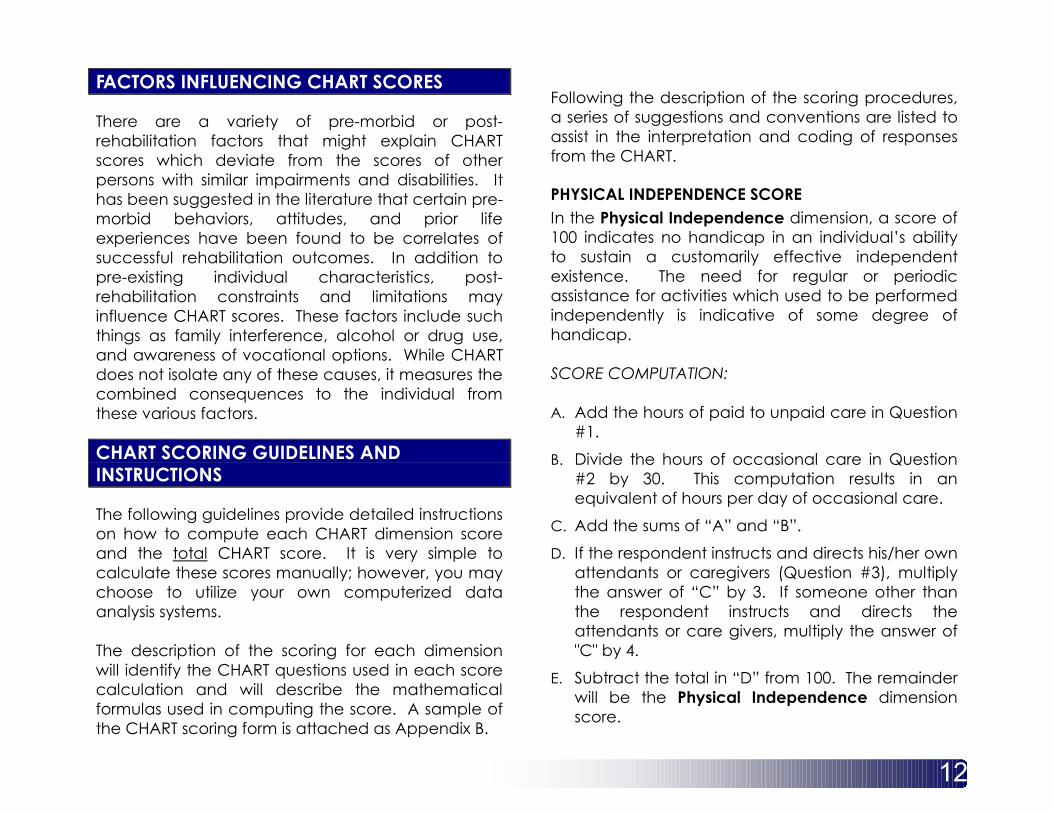
FACTORS INFLUENCING CHART SCORES
There are a variety of pre-morbid or post-rehabilitation factors that might explain CHARTscores which deviate from the scores of otherpersons with similar impairments and disabilities. Ithas been suggested in the literature that certain pre-morbid behaviors, attitudes, and prior lifeexperiences have been found to be correlates ofsuccessful rehabilitation outcomes. In addition topre-existing individual characteristics, post-rehabilitation constraints and limitations mayinfluence CHART scores. These factors include suchthings as family interference, alcohol or drug use,and awareness of vocational options. While CHARTdoes not isolate any of these causes, it measures thecombined consequences to the individual fromthese various factors.
CHART SCORING GUIDELINES ANDINSTRUCTIONS
The following guidelines provide detailed instructionson how to compute each CHART dimension scoreand the total CHART score. It is very simple tocalculate these scores manually; however, you maychoose to utilize your own computerized dataanalysis systems.
The description of the scoring for each dimensionwill identify the CHART questions used in each scorecalculation and will describe the mathematicalformulas used in computing the score. A sample ofthe CHART scoring form is attached as Appendix B.
Following the description of the scoring procedures,a series of suggestions and conventions are listed toassist in the interpretation and coding of responsesfrom the CHART.
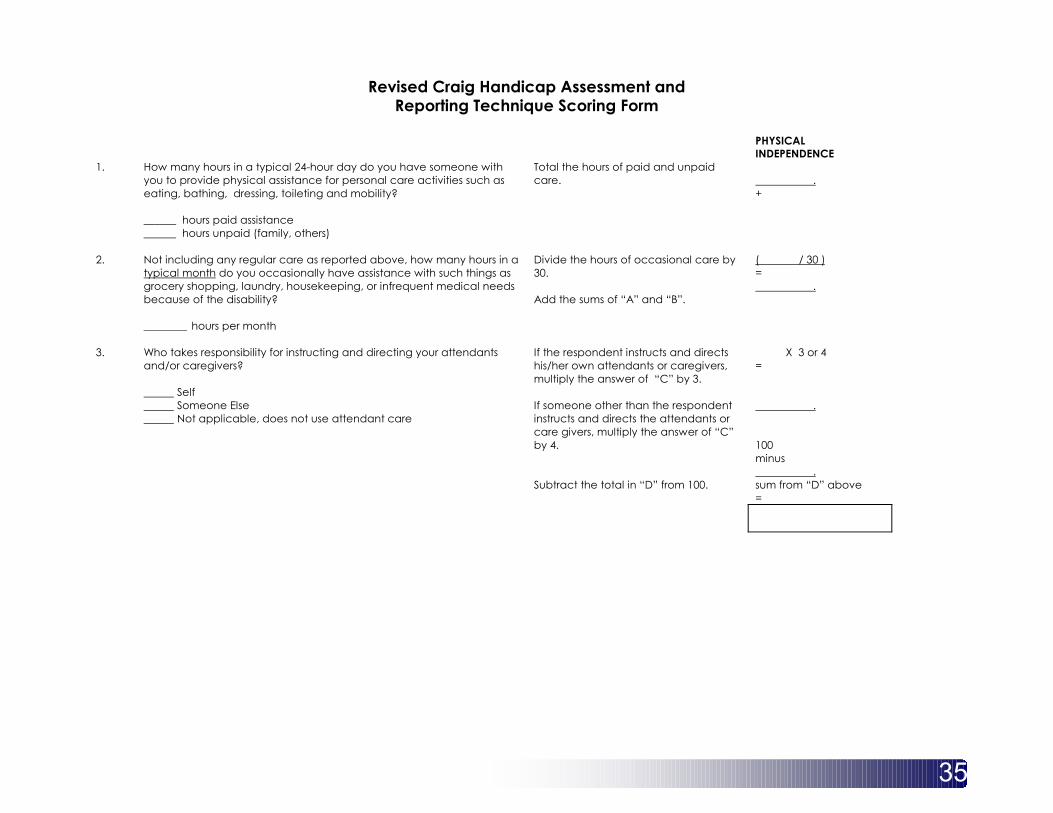
PHYSICAL INDEPENDENCE SCOREIn the Physical Independence dimension, a score of100 indicates no handicap in an individual’s abilityto sustain a customarily effective independentexistence. The need for regular or periodicassistance for activities which used to be performedindependently is indicative of some degree ofhandicap.
SCORE COMPUTATION:
A. Add the hours of paid to unpaid care in Question#1.
B. Divide the hours of occasional care in Question#2 by 30. This computation results in anequivalent of hours per day of occasional care.
C. Add the sums of “A” and “B”.
D. If the respondent instructs and directs his/her ownattendants or caregivers (Question #3), multiplythe answer of “C” by 3. If someone other thanthe respondent instructs and directs theattendants or care givers, multiply the answer of"C" by 4.
E. Subtract the total in “D” from 100. The remainderwill be the Physical Independence dimensionscore.
13
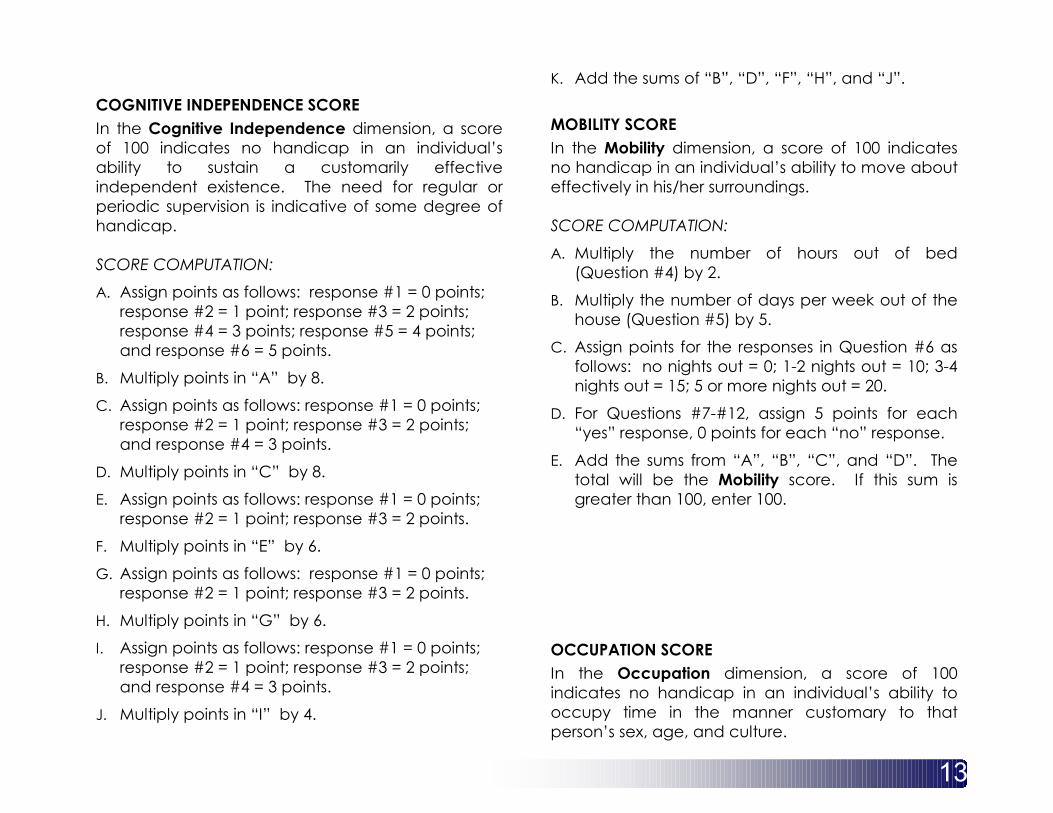
COGNITIVE INDEPENDENCE SCOREIn the Cognitive Independence dimension, a scoreof 100 indicates no handicap in an individual’sability to sustain a customarily effectiveindependent existence. The need for regular orperiodic supervision is indicative of some degree ofhandicap.
SCORE COMPUTATION:
A. Assign points as follows: response #1 = 0 points;response #2 = 1 point; response #3 = 2 points;response #4 = 3 points; response #5 = 4 points;and response #6 = 5 points.
B. Multiply points in “A” by 8.
C. Assign points as follows: response #1 = 0 points;response #2 = 1 point; response #3 = 2 points;and response #4 = 3 points.
D. Multiply points in “C” by 8.
E. Assign points as follows: response #1 = 0 points;response #2 = 1 point; response #3 = 2 points.
F. Multiply points in “E” by 6.
G. Assign points as follows: response #1 = 0 points;response #2 = 1 point; response #3 = 2 points.
H. Multiply points in “G” by 6.
I. Assign points as follows: response #1 = 0 points;response #2 = 1 point; response #3 = 2 points;and response #4 = 3 points.
J. Multiply points in “I” by 4.
K. Add the sums of “B”, “D”, “F”, “H”, and “J”.
MOBILITY SCOREIn the Mobility dimension, a score of 100 indicatesno handicap in an individual’s ability to move abouteffectively in his/her surroundings.
SCORE COMPUTATION:
A. Multiply the number of hours out of bed(Question #4) by 2.
B. Multiply the number of days per week out of thehouse (Question #5) by 5.
C. Assign points for the responses in Question #6 asfollows: no nights out = 0; 1-2 nights out = 10; 3-4nights out = 15; 5 or more nights out = 20.
D. For Questions #7-#12, assign 5 points for each“yes” response, 0 points for each “no” response.
E. Add the sums from “A”, “B”, “C”, and “D”. Thetotal will be the Mobility score. If this sum isgreater than 100, enter 100.
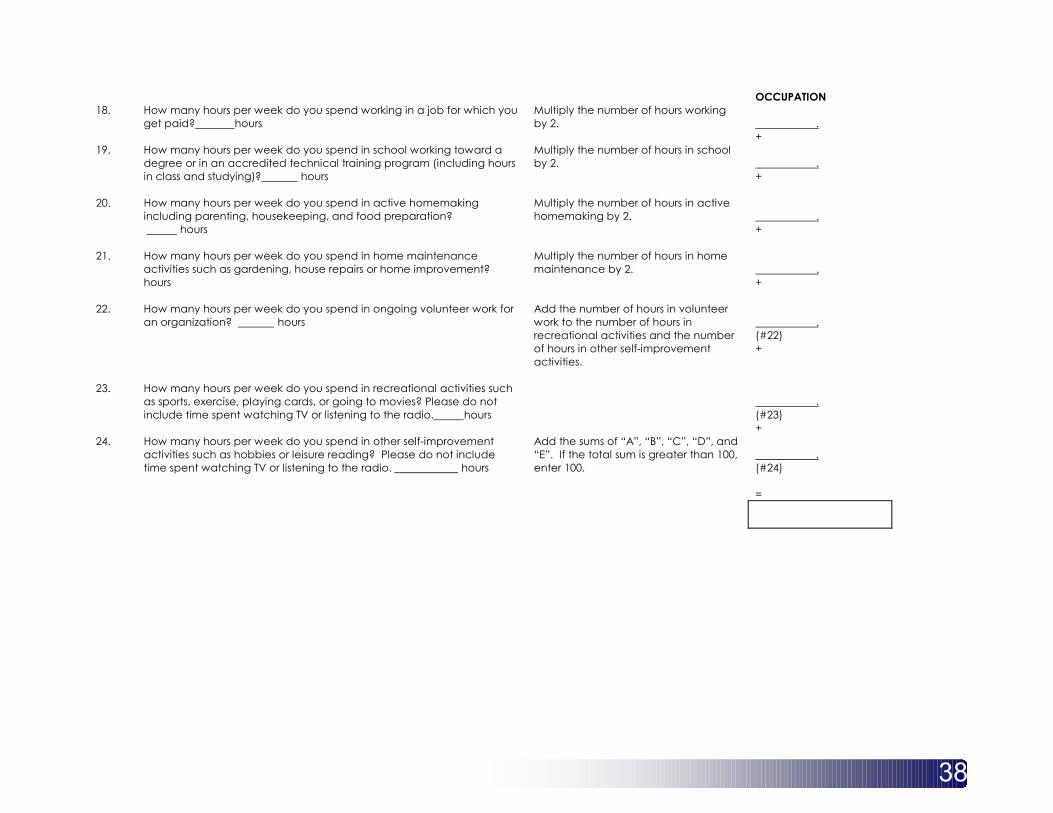
OCCUPATION SCOREIn the Occupation dimension, a score of 100indicates no handicap in an individual’s ability tooccupy time in the manner customary to thatperson’s sex, age, and culture.

14
SCORE COMPUTATION:
A. Multiply the number of hours working (Question#13) by 2.
B. Multiply the number of hours in school (Question#14) by 2.
C. Multiply the number of hours in activehomemaking (Question #15) by 2.
D. Multiply the number of hours in homemaintenance (Question #16) by 2.
E. Add the number of hours in volunteer work(Question #17) to the number of hours inrecreational activities (Question #18) and thenumber of hours in other self-improvement(Question #19).
F. Add the sums of “A”, “B”, “C”, “D”, and “E”. Thetotal will be the Occupation score. If the sum isgreater than 100, enter 100.
SOCIAL INTEGRATION SCOREIn the Social Integration dimension, a score of 100indicates no handicap in an individual’s ability toparticipate in and maintain customary socialrelationships.
SCORE COMPUTATION:
A. Assign 30 points if living with a spouse orsignificant other (Question #20) OR assign 20points if living with an unrelated roommateand/or an attendant. (NOTE: if living with more
than one roommate, do not assign points foreach person).
B. Assign 20 points if involved in a romanticrelationship, unless points are assigned in “A”. Ifinvolved in a romantic relationship and points areassigned in “A”, then “B” equals 30 minus “A”.
C. Add the number of children in the householdand the number of other relatives in thehousehold (Question #20) to the number ofrelatives contacted monthly (Question #22).Multiply this sum by 5. A maximum score for thiscomponent is 25 points.
D. If living with more than one attendant, add theextra attendants to the number of business ororganizational associates contacted monthly(Question #23). Multiply this total by 2. Amaximum score for this component is 50 points.
E. For the number of conversations initiated withstrangers (Question #25), assign points as follows:none=0 points; 1 or 2=10 points; 3 to 5=15 points; 6or more=20 points.
F. Add the sums from “A”, “B”, “C”, “D”, “E”, and“F”. The total will be the Social Integration score.If the sum is greater than 100, enter 100.
ECONOMIC SELF-SUFFICIENCY SCOREIn the Economic Self-Sufficiency dimension, a scoreof 100 indicates no handicap in an individual’sability to sustain customary socio-economic activityand independence.
15
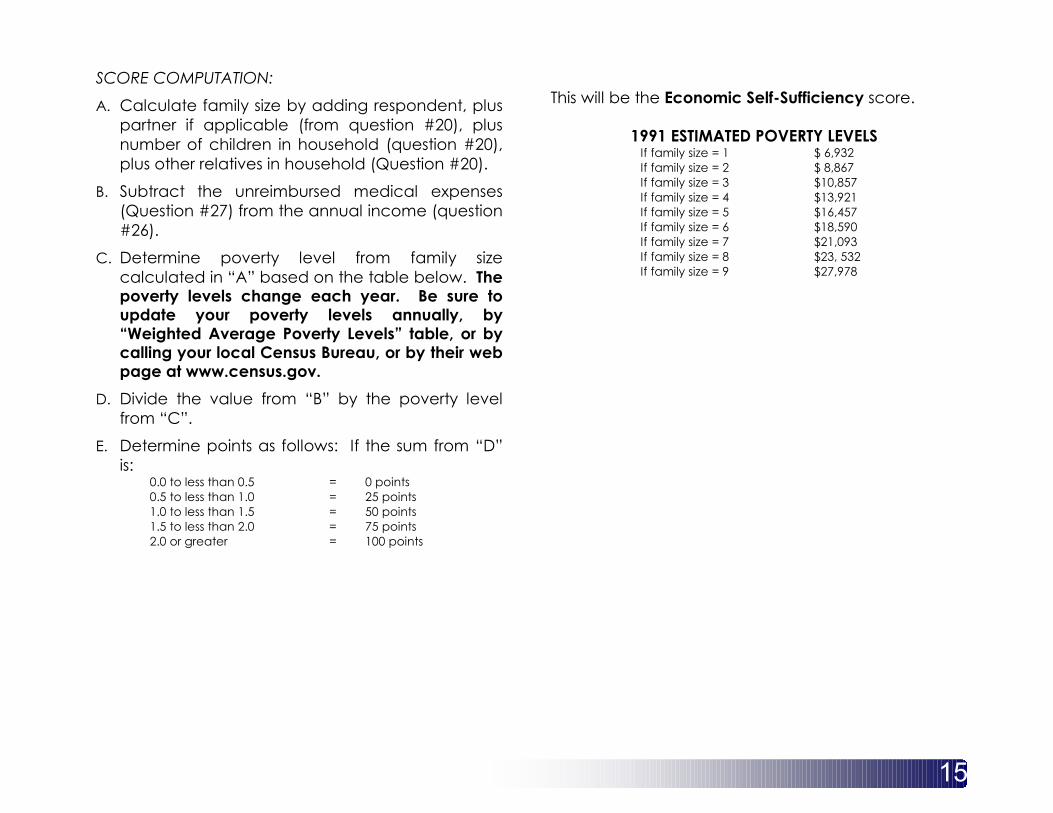
SCORE COMPUTATION:
A. Calculate family size by adding respondent, pluspartner if applicable (from question #20), plusnumber of children in household (question #20),plus other relatives in household (Question #20).
B. Subtract the unreimbursed medical expenses(Question #27) from the annual income (question#26).
C. Determine poverty level from family sizecalculated in “A” based on the table below. Thepoverty levels change each year. Be sure toupdate your poverty levels annually, by“Weighted Average Poverty Levels” table, or bycalling your local Census Bureau, or by their webpage at www.census.gov.
D. Divide the value from “B” by the poverty levelfrom “C”.
E. Determine points as follows: If the sum from “D”is:
0.0 to less than 0.5 = 0 points 0.5 to less than 1.0 = 25 points 1.0 to less than 1.5 = 50 points1.5 to less than 2.0 = 75 points2.0 or greater = 100 points
This will be the Economic Self-Sufficiency score.
1991 ESTIMATED POVERTY LEVELSIf family size = 1 $ 6,932If family size = 2 $ 8,867If family size = 3 $10,857If family size = 4 $13,921If family size = 5 $16,457If family size = 6 $18,590If family size = 7 $21,093If family size = 8 $23, 532If family size = 9 $27,978

16
CODING GUIDELINES AND CONVENTIONS
At times there may be some difficulty interpreting aCHART question response. The following guidelinesare provided to assist you in making decisionsregarding which values to assign to apparentlyambiguous responses.
The number of each guideline refers to the numberof the CHART question. For those CHART questionswhich are unlikely to have questionableinterpretation, no specific guidelines have beenprovided.
If you come up with responses that don’t seem to beadequately addressed by the guidelines andconventions listed below, please contact the CHARTdesigners to discuss your problems and questions.These issues and their responses will be shared withall CHART users in order to insure uniform scoring.
1. If a person has a disability that would typicallyresult in a high level of dependency, andindicates no attendant care is used, probe thisa bit further. The respondent may notunderstand that assistance with dressing,grooming, bowel and bladder care, etc. is tobe considered attendant care.
1. If an individual has various hours of assistanceon different days of the week, ask therespondent to average the total number ofhours of assistance per week, then divide that
number by 7 to come up with a dailyestimate.
2. Some individuals may state that they havehelp with regular household chores, but thatmay not be a change from their pre-injurystatus. For someone who never typically didthings like ironing, grocery shopping, etc.,he/she should not be penalized for not doingthose activities post-injury. The key is to lookfor change in the level of assistance neededbecause of the injury.
3. If a person who has only occasional help isresponsible for arranging that assistance andproviding at least an equal portion of theinstruction, he/she should be considered theperson taking responsibility for directing care.
3. If instructing and directing care providers is ashared responsibility between the respondentand a spouse or parent (for example), youmay need to probe further to determine whoassumes main responsibility.
10. The responses to this question may varyaccording to season, weather, etc. Forexample, many people are out daily in thesummer, but only one or two days a week inthe winter. Ask the respondent to use his/herjudgment, based on the climate in whichhe/she lives, to estimate the average numberof days out per week throughout the year.Being out of the house and going somewhere
17
means that the person leaves his/her own‘property’. Being out in the garden or yarddoes not qualify as ‘going somewhere’.
11. Any night spent away from a person’s usualsleeping environment is considered a nightaway from home. Visiting family or friendsand spending the night at someone else’shouse, therefore, is a night away from home.
12. Independence into and out of one’shome/living environment means totalindependence; i.e., locking, unlocking,opening, and closing doors, pushing manualwheelchair or operating motorized wheelchair(if applicable) through doorways, and goingup/down ramps or steps leading into and outof the house must all be accomplishedindependently.
12. If a person does not have independentaccess to ALL of the locations and items listed,the response must be coded “NO”.
14-17. The respondents to Question #14-17 refer toan individual using transportation outside thehome. Specifically, these items refer to usingcars, vans, other private vehicles and publictransportation. However, in cases where aperson uses a wheelchair and states that thewheelchair is the primary form oftransportation outside the home (i.e., does notuse a car, van, or other vehicle), the scoringremains the same.
18. Respondents must be working in jobs for whichthey are paid in order to get points for thisquestion. If a person is working but not gettingpaid, consider this voluntary activity andcalculate the points based on the instructionsfor question #22.
20. Active homemaking, parenting,housekeeping, etc. is exactly what it means.Being at home with the children at night witheveryone asleep is not considered ‘active’parenting. Helping children with homework,playing or supervising play, however, areactive. In addition, ‘active’ can implysupervising housework and food preparation.If someone is developing the householdmenus, arranging for housework to be done,or overseeing other individuals performingthose activities, there is active involvement;therefore, count the time spent in theseplanning/supervising activities. However,don’t credit someone with doing (forexample) eight hours of yard work, if his/heronly ‘active’ involvement was arranging andinstructing the work needing to be done. This‘active’ role might, in fact, take an hour, socredit for 1 hour is appropriate.
21. Hours spent in active home maintenance mayvary with season and with weather. Use samelogic employed in “#10” in estimating hours.

18
22. Consider all organized volunteer work; forexample, that which is associated withchurches or clubs. Also consider any time‘working’ with no monetary compensation.
NOTE: For questions 18-22, do not duplicateresponses in categories. For example, if someone‘plays’ with the children and considers it sports orexercise, as well as active parenting, that individualcan only receive credit in one category. In anotherexample, a person who gardens as a hobby maydescribe spending 20 hours a week in homemaintenance, then states that gardening is a hobby.When in doubt, allow the respondent to choose thecategory which best describes an activity.
27-30. Remember to count the number of peoplecontacted, not the actual number of times aperson is contacted. For example, someonemay talk with a particular business associateon a daily basis – that is considered onecontact, not five (typical working days of theweek).
28. Don’t worry about getting exact counts ofbusiness associates, if a person indicates “lots”or “dozens” of people are contacted.Remember, this category allows for amaximum of 10 contacts.
Again, be careful that you don’t double countpeople in different categories!
31. Some respondents are unwilling to divulgeinformation relating to their financial status. In
such cases, ask if the respondent is willing toindicate a range between which the annualincome falls. When providing ranges, it will bemost helpful to know the family size and thepoverty level. You may then ask if the incomeis between two amounts.
31. Some people may indicate there is nothousehold income from any source. Probethis, because there must be money fromsomewhere, whether it is from a charitablesource, government funds, other familysupport, or something else.
REMEMBER: A dimension score can be calculatedonly if ALL the questions in that dimension havebeen answered. A total CHART score can becalculated only if there is a score for eachdimension.

19
CHART References
1. Boninger, M., et al. (1998) Postural changes with aging intetraplegia: effects on life satisfaction and pain. Arch PhysMed Rehabil., 79, 1577.
2. Brooks, C., Gabella, B., Hoffman, R., Sosin, D., Whiteneck, G.(1997) Traumatic brain injury: designing and implementinga population-based follow-up system. Arch Phys MedRehabil., 78, S26-30.
3. Corrigan, J., et al. (1998) Outcomes in the first five yearsafter traumatic brain injury. Arch Phys Med Rehabil., 79,298-305.
4. Cusick, C.P., Brooks, C.A., Whiteneck, G.G. Use of proxies indisability outcome research: an assessment of participant-proxy agreement across disability types. Manuscript indevelopment.
5. Dijkers, M. (1991). Scoring CHART: survey and sensitivityanalysis. J Amer Paraplegia Soc., 14, 85-86.
6. Hall, K.M., Dijkers, M., Whiteneck, G., Brooks, C.A., Krause,J.S. (1998). The Craig handicap assessment and reportingtechnique (CHART): metric properties and scoring. TopSpinal Cord Inj Rehabil, 4(1), 16-30.
7. Mellick, D., Walker, N., Brooks, C.A., Whiteneck, G. (1999).Incorporating the cognitive independence domain intoCHART. J Rehabil Outcomes Meas, 3(3), 12-21.
8. The National Spinal Cord Injury Statistical Center. (1995) TheModel Spinal Cord Injury Care Systems Data CollectionSyllabus for the National Spinal Cord Injury Database.Birmingham, AL: The University of Alabama at Birmingham.
9. Segal, M.E., Schall, R.R. (1995). Assessing handicap of strokesurvivors. A validation study of the Craig HandicapAssessment and Reporting Technique. Amer J Phys MedRehabil., 74, 276-286.
10. Vogel, L. (1998) Long-term outcomes and life satisfaction ofadults who had pediatric spinal cord injuries. Arch PhysMed Rehabil., 79, 1496-1503.
11. Waters, R. (1998) Postrehabilitation outcomes after spinalcord injury caused by firearms and motor vehicle crashamong ethnically diverse groups. Arch Phys Med Rehabil.,79, 1237-1243.
12. Whiteneck, G.G., Charlifue, S.W., Gerhart, K.A., Overhosler,J.D., Richardson, G.N. (1992). Quantifying handicap: a newmeasure of long-term rehabilitation outcomes. Arch PhysMed Rehabil., 73, 519-26.
13. Whiteneck, G.G. (1996). Evaluating outcome after spinalcord injury: what determines success? 1996 Munro Lecture.J Spinal Cord Med., 20(2), 179-185.
14. Whiteneck, G.G., Brooks, C.A., Mellick, D.C. (1997).Handicap assessment - final report. Rehabilitation Researchand Training Center on Functional Assessment andEvaluation of Rehabilitation Outcomes, Buffalo, NY: StateUniversity of New York.
15. Whiteneck, G.G., Fougeyrolles, P., Gerhart, K.A. (1997).Elaborating the model of disablement. In: Fuhrer, M, ed.Assessing Medical Rehabilitation Practices: The Promise ofOutcomes Research. Baltimore: Paul H. Brooks PublishingCo.
16. Whiteneck, G., Tate, D., Charlifue, S. (1999). Predictingcommunity reintegration after spinal cord injury fromdemographic and injury characteristics.
17. Whiteneck, G.G., Mellick, D., Walker, N., Brooks, C.A.,Gerhart, K. Measuring handicap across impairment groupsusing CHART. Manuscript in development.
18. World Health Organization. (1980) InternationalClassification of Impairments, Disabilities and Handicaps: AManual of Classification Relating to the Consequences ofDisease. Geneva: World Health Organization.
19. World Health Organization. (1997) InternationalClassification of Impairments, Activities, and Participation: AManual of Dimensions of Disablement and Functioning,Beta-1 Draft. Geneva: World Health Organization.
20
CHART Short Form
To reduce the number of questions in CHART a multidimensional analysis plan was designed. First, usingdata already gathered from a previous study, item-scale and item-total correlation coefficients werecalculated for each scale. Second, regressionanalysis was performed on each subscale with thedependent measure being the scale score and thevariables contributing to the subscale acting as thepredictor variables. It was hypothesized that eachsubscale score could be accurately be predictedby fewer items. With two exceptions, the onlyvariables that were selected to be in a subscalewere those that entered into a stepwise regressionmodel together explaining over 90% of the variance.Third, once the items had been selected for eachsubscale, the items were re-scored. Each subscalewas computed to have a maximum score of 100,which indicates no handicap in that domain.Furthermore, efforts were made to keep all of thescore weightings of the variables proportionate tothe original weightings. Fourth, the CHART ShortForm items and scoring will be evaluated on 1800persons that will contribute to the Behavioral RiskFactor Surveillance System's survey of Coloradoresidents.
RESULTS AND CONCLUSIONS
All CHART subscale scores could be reduced byfewer questions to reach 90% explained varianceexcept Economic Self-Sufficiency, which using the
main variables could only explain 45%. A possibleexplanation for the lack of predictive ability for theEconomic subscale was the alarmingly high rate ofrefusal for economic questions. 40% of the peoplefailed to respond to either the question aboutincome or expenditures not covered by insurance.In light of the missing data, it was determined thatthose questions would change with the addition ofresponse categories rather than open endedquestions. These overall findings show that:
♦ Using the fewest number of items to predict thelargest amount of variation explained is areasonable method for shortening aquestionnaire.
♦ CHART-SF sub-scales closely approximate thescores of the subscales gathered by the OriginalCHART.
♦ CHART-SF takes less time to administer than theOriginal CHART
CHART-SF is a valuable tool for determininghandicap for populations in which time is at aminimum. Although using a tool with fewer itemsmay decrease the precision for smaller groups, theuse of CHART-SF in larger populations will obviatethe lack of precision by the change in confidenceintervals
21
TABLES AND GRAPHS – CHART SF
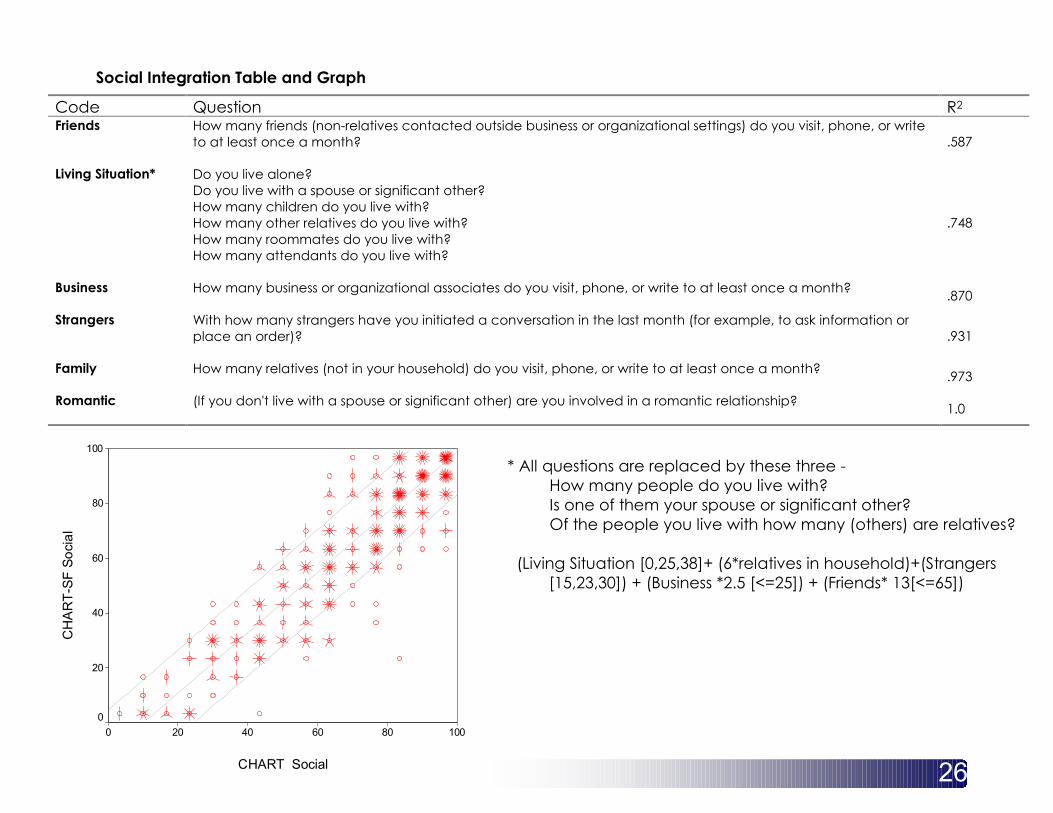
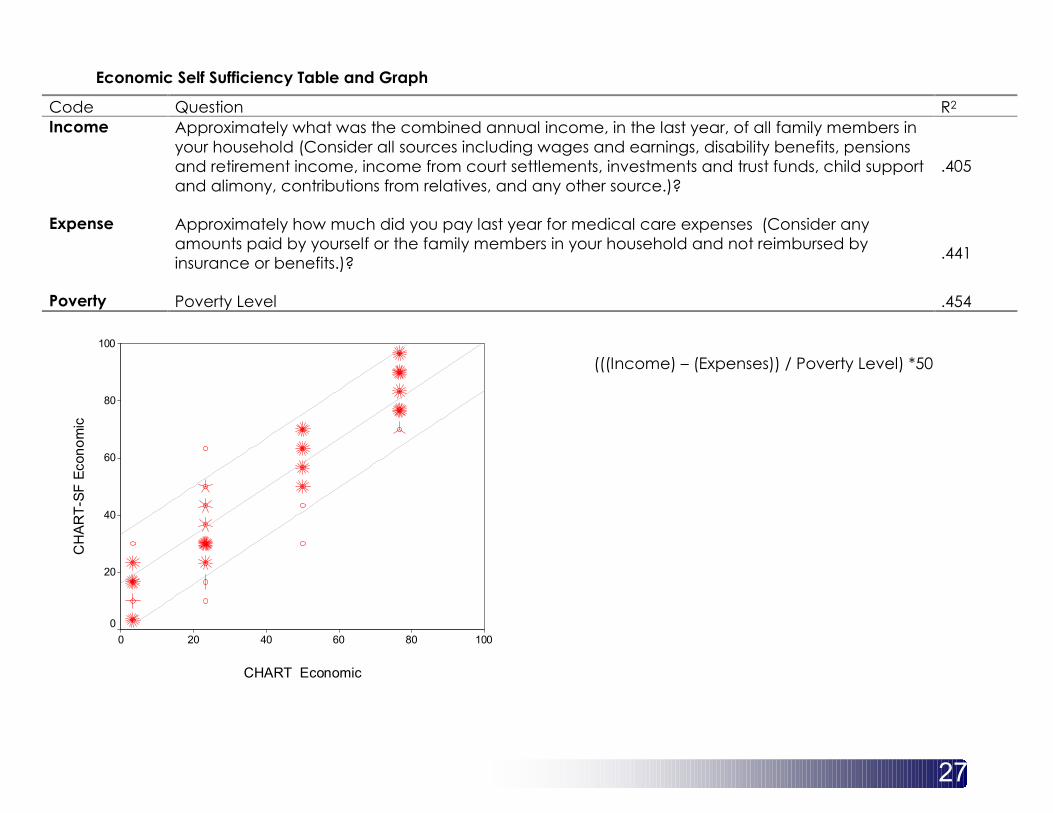
The following tables represents all the questionsasked as a part of CHART by sub-scale and enteredinto the regression model. The order of the questionsrepresents the order the variables entered in theregression, meaning the most predictive questionsare listed first. The percent explained variance islocated on the right side of the tables by R2. Each ofthe CHART-SF scoring for the indicated variable islocated in between the table and the graph for therespective subscale. Below each of the tables is ascatter plot of the Original CHART subscale score bythe CHART Short Form subscale score. A ‘sunflower’in which each petal represents one case markseach point. Additionally, a regression line is shownalong with 95% confidence intervals.

22
Physical Independence Table and Graph
Code Question R2
Hours Paid How many hours in a typical 24-hour day do you have someone with you to provide physical assistance forpersonal care activities such as eating, bathing, dressing, toileting and mobility? .520
Hours Unpaid How many hours in a typical 24-hour day do you have someone with you to provide physical assistance forpersonal care activities such as eating, bathing, dressing, toileting and mobility? .942
Hours perMonth
Not including any regular care as reported above, how many hours in a typical month do you occasionally haveassistance with such things as grocery shopping, laundry, housekeeping, or infrequent medical needs because ofthe disability?
.956
Who Trains Who takes responsibility for instructing and directing your attendants and/or caregivers?.956
CHART Physical
100806040200
CH
ART-
SF P
hysi
cal
100
80
60
40
20
0
100-((Hours Paid + Hours Unpaid)*4)

23CHART Mobility
100806040200
CH
ART-
SF M
obilit
y
100
80
60
40
20
0
Mobility Table and Graph
Code Question R2
Days out of house In a typical week, how many days do you get out of your house and go somewhere?.720
Nights away from home In the last year, how many nights have you spent away from your home (excludinghospitalizations)? .871
Hours out of bed On a typical day, how many hours are you out of bed? .947Transportation whenever Does your transportation let you get out whenever you want?
.974
Enter and exit house Can you enter and exit your home without any assistance from someone?.984
Transportation without notice Can you use your transportation with little or no advance notice?.991
Independent access In your home, do you have independent access to your sleeping area, kitchen, bathroom,telephone, and TV (or radio)? .995
Transportation allow you to getall places
Does your transportation allow you to get to all the places you would like to go?.998
Transportation independence Can you use your transportation independently?1.00
(Days out of the house *7) + (Hours out of bed *3) + (Nightsaway from home [10,15,20])

24
Cognitive Table and Graph
Code Question R2
Home Assistance How much time is someone with you in your home to assist you with activities that require remembering,decision making, or judgment? .834
Outside Assistance How much of the time is someone with you to help you with remembering, decision making, or judgmentwhen you go away from your home? .912
Remembering How often do you have difficulty remembering important things that you must do?.960
Money How much of your money do you control?.983
Communication How often do you have difficulty communicating with other people?1.00
CHART Cognitive
100806040200
CH
ART-
SF C
ogni
ve
100
80
60
40
20
0
(Assistance in the home *11) + (Assistance outside the home *15)
25
Occupation Table and Graph
Code Question R2
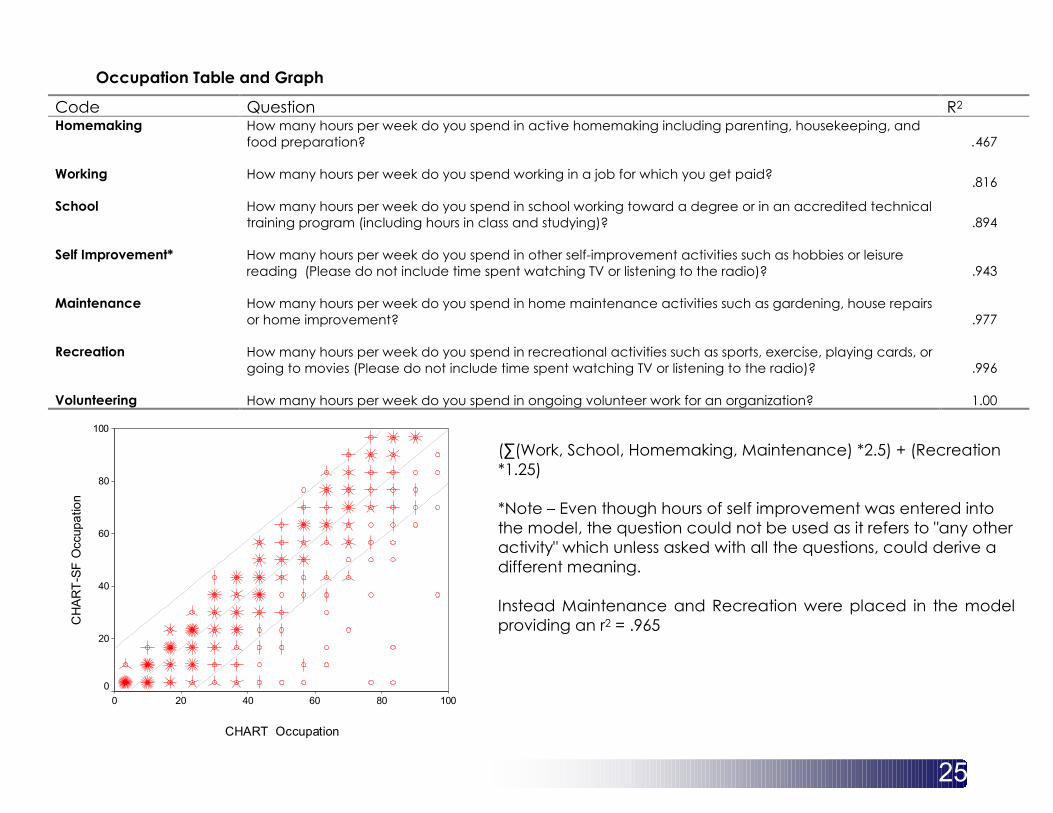
Homemaking How many hours per week do you spend in active homemaking including parenting, housekeeping, andfood preparation? .467
Working How many hours per week do you spend working in a job for which you get paid?.816
School How many hours per week do you spend in school working toward a degree or in an accredited technicaltraining program (including hours in class and studying)? .894
Self Improvement* How many hours per week do you spend in other self-improvement activities such as hobbies or leisurereading (Please do not include time spent watching TV or listening to the radio)? .943
Maintenance How many hours per week do you spend in home maintenance activities such as gardening, house repairsor home improvement? .977
Recreation How many hours per week do you spend in recreational activities such as sports, exercise, playing cards, orgoing to movies (Please do not include time spent watching TV or listening to the radio)? .996
Volunteering How many hours per week do you spend in ongoing volunteer work for an organization? 1.00
CHART Occupation
100806040200
CH
ART-
SF O
ccup
atio
n
100
80
60
40
20
0
(∑(Work, School, Homemaking, Maintenance) *2.5) + (Recreation*1.25)
*Note – Even though hours of self improvement was entered intothe model, the question could not be used as it refers to "any otheractivity" which unless asked with all the questions, could derive adifferent meaning.
Instead Maintenance and Recreation were placed in the modelproviding an r2 = .965
26
Social Integration Table and Graph
Code Question R2
Friends How many friends (non-relatives contacted outside business or organizational settings) do you visit, phone, or writeto at least once a month? .587
Living Situation* Do you live alone?Do you live with a spouse or significant other?How many children do you live with?How many other relatives do you live with?How many roommates do you live with?How many attendants do you live with?
.748
Business How many business or organizational associates do you visit, phone, or write to at least once a month?.870
Strangers With how many strangers have you initiated a conversation in the last month (for example, to ask information orplace an order)? .931
Family How many relatives (not in your household) do you visit, phone, or write to at least once a month?.973
Romantic (If you don't live with a spouse or significant other) are you involved in a romantic relationship?1.0
CHART Social
100806040200
CH
ART-
SF S
ocia
l
100
80
60
40
20
0
* All questions are replaced by these three -How many people do you live with?Is one of them your spouse or significant other?Of the people you live with how many (others) are relatives?
(Living Situation [0,25,38]+ (6*relatives in household)+(Strangers[15,23,30]) + (Business *2.5 [<=25]) + (Friends* 13[<=65])
27
Economic Self Sufficiency Table and Graph
Code Question R2
Income Approximately what was the combined annual income, in the last year, of all family members inyour household (Consider all sources including wages and earnings, disability benefits, pensionsand retirement income, income from court settlements, investments and trust funds, child supportand alimony, contributions from relatives, and any other source.)?
.405
Expense Approximately how much did you pay last year for medical care expenses (Consider anyamounts paid by yourself or the family members in your household and not reimbursed byinsurance or benefits.)?
.441
Poverty Poverty Level .454
CHART Economic
100806040200
CH
ART-
SF E
cono
mic
100
80
60
40
20
0
(((Income) – (Expenses)) / Poverty Level) *50
28
Behavioral Risk Factor Surveillance System(BRFSS) Analysis of CHART SF
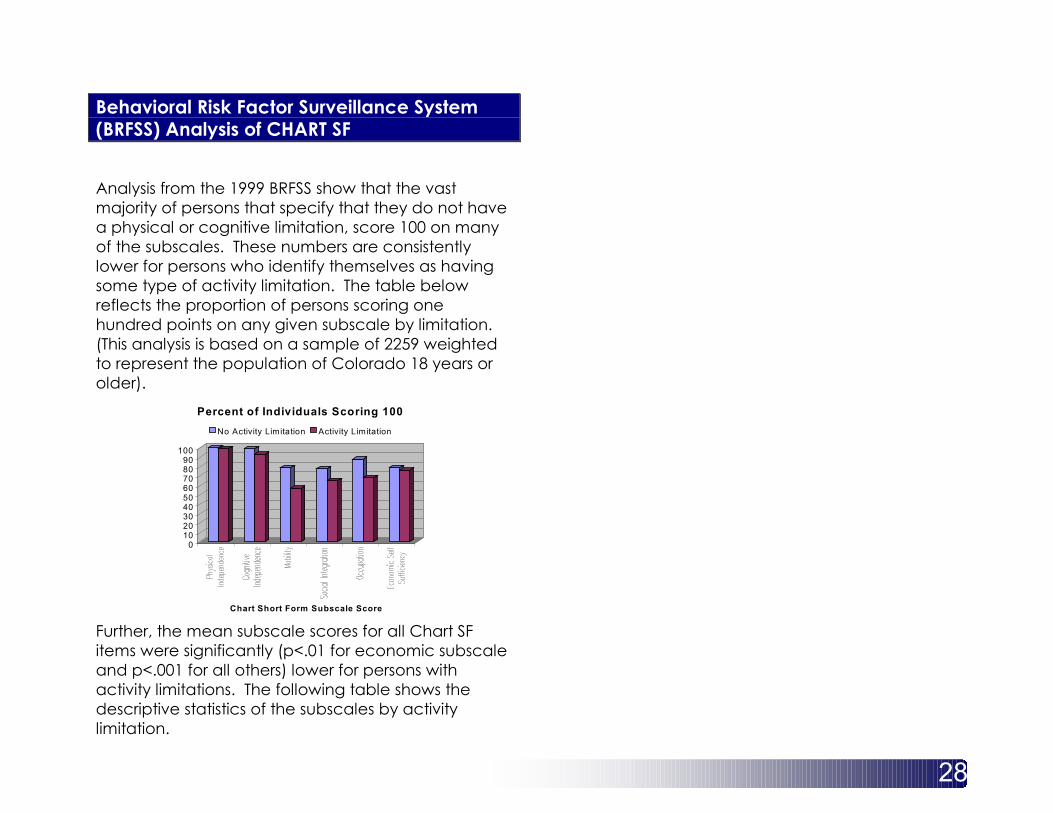
Analysis from the 1999 BRFSS show that the vastmajority of persons that specify that they do not havea physical or cognitive limitation, score 100 on manyof the subscales. These numbers are consistentlylower for persons who identify themselves as havingsome type of activity limitation. The table belowreflects the proportion of persons scoring onehundred points on any given subscale by limitation.(This analysis is based on a sample of 2259 weightedto represent the population of Colorado 18 years orolder).
0102030405060708090
100
Chart Short Form Subscale Score
Percent of Individuals Scoring 100No Activity Limitation Activity Limitation
Further, the mean subscale scores for all Chart SFitems were significantly (p<.01 for economic subscaleand p<.001 for all others) lower for persons withactivity limitations. The following table shows thedescriptive statistics of the subscales by activitylimitation.

29
Descriptive information for CHART SF subscales by Activity Limitation
N Mean Std.Deviation
95% ConfidenceInterval for Mean
Minimum
Maximum
no 1783 100.00 .00 .00 100.00 100.00 100.00yes 461 99.41 5.71 98.88 99.93 28.00 100.00
PhysicalIndependence
Total 2245 99.88 2.60 99.77 99.99 28.00 100.00no 1784 99.57 3.88 99.39 99.75 45.00 100.00yes 466 95.97 15.56 94.55 97.39 15.00 100.00
CognitiveIndependence
Total 2250 98.82 8.01 98.49 99.16 15.00 100.00no 1777 97.02 8.02 96.65 97.39 38.00 100.00yes 477 91.43 14.46 90.13 92.73 16.00 100.00
Mobility
Total 2254 95.84 10.01 95.42 96.25 16.00 100.00no 1727 94.79 13.26 94.17 95.42 .00 100.00yes 462 89.90 18.03 88.26 91.55 .00 100.00
SocialIntegration
Total 2189 93.76 14.53 93.15 94.37 .00 100.00no 1711 95.77 14.28 95.10 96.45 .00 100.00yes 454 80.27 32.41 77.28 83.26 .00 100.00
Occupation
Total 2165 92.53 20.51 91.66 93.39 .00 100.00no 1578 92.50 18.65 91.58 93.42 .00 100.00yes 411 91.35 19.33 89.48 93.23 .00 100.00
Economic Self-Sufficiency
Total 1989 92.27 18.79 91.44 93.09 .00 100.00
APPENDIX A - CHART Long Form
S A M P L ECHART Long Form
Craig Handicap Assessment
and Reporting Technique
Blank copies of this form are available from:
Craig HospitalResearch Department
3425 South Clarkson StreetEnglewood, Colorado 80110
(303) 789-8202

31
CHART – Long Form
WHAT ASSISTANCE DO YOU NEED?People with disabilities often need assistance. We would like todifferentiate between personal care for physical disabilities andsupervision for cognitive problems. First, focus on physical"hands on" assistance: This includes help with eating, grooming,bathing, dressing, management of a ventilator or otherequipment, transfers etc. Keeping in mind these dailyactivities...
1. How many hours in a typical 24-hour day do you havesomeone with you to provide physical assistance forpersonal care activities such as eating, bathing, dressing,toileting and mobility?
________ hours paid assistance________ hours unpaid (family, others)
2. Not including any regular care as reported above, howmany hours in a typical month do you occasionally haveassistance with such things as grocery shopping, laundry,housekeeping, or infrequent medical needs because of thedisability?
________ hours per month
3. Who takes responsibility for instructing and directing yourattendants and/or caregivers?
[1] _____ Self[2] _____ Someone Else[9] _____ Not applicable, does not use attendant care
Now, focus on supervision for cognitive problems instead ofphysical assistance. This includes remembering, decisionmaking, judgment, etc..
4. How much time is someone with you in your home toassist you with activities that require remembering,decision making, or judgment?
[1] _____ Someone else is always with me to observe orsupervise.
[2] _____ Someone else is always around, but they onlycheck on me now and then.
[3] _____ Sometimes I am left alone for an hour or two.[4] _____ Sometimes I am left alone for most of the day[5] _____ I have been left alone all day and all night,
but someone checks in on me.[6] _____ I am left alone without anyone checking on
me.
5. How much of the time is someone with you to help youwith remembering, decision making, or judgment whenyou go away from your home?
[1] _____ I am restricted from leaving, even withsomeone else.
[2] _____ Someone is always with me to help withremembering, decision making or judgmentwhen I go anywhere.
[3] _____ I go to places on my own as long as they arefamiliar.
[4] _____ I do not need help going anywhere.

32
6. How often do you have difficulty communicating with otherpeople?
[1] _____ I almost always have difficulty.[2] _____ I sometimes have difficulty.[3] _____ I almost never have difficulty.
7. How often do you have difficulty remembering importantthings that you must do?
[1] _____ I almost always have difficulty.[2] _____ Sometimes I have difficulty.[3] _____ I almost never have difficulty.
8. How much of your money do you control?
[1] _____ None, someone makes all money decisions forme.
[2] _____ A small amount of spending money is given to meperiodically.
[3] _____ Most of my money, but someone does help memake major decisions.
[4] _____ I make all my own money decisions (or if married,in joint participation with my partner).
Now, I have a series of questions about your typical activities.
ARE YOU UP AND ABOUT REGULARLY?
9. On a typical day, how many hours are you out of bed?____hours
10. In a typical week, how many days do you get out of yourhouse and go somewhere? ____days
11. In the last year, how many nights have you spent awayfrom your home (excluding hospitalizations?)[0]_______ none [1]_______ 1-2 [3]_______3-4[5]_______5 or more
12. Can you enter and exit your home without anyassistance from someone?___ yes ___ no
13. In your home, do you have independent access toyour sleeping area, kitchen, bathroom, telephone,and TV (or radio)? ___ yes ___ no
IS YOUR TRANSPORTATION ADEQUATE?
14. Can you use your transportation independently?___ yes ___ no
15. Does your transportation allow you to get to all theplaces you would like to go?___ yes ___ no
16. Does your transportation let you get out wheneveryou want?___ yes ___ no
17. Can you use your transportation with little or noadvance notice?___ yes ___ no
HOW DO YOU SPEND YOUR TIME?
18. How many hours per week do you spend working in ajob for which you get paid?hours ________ (occupation: )
19. How many hours per week do you spend in schoolworking toward a degree or in an accreditedtechnical training program (including hours in classand studying)? hours
20. How many hours per week do you spend in activehomemaking including parenting, housekeeping, andfood preparation? hours

33
21. How many hours per week do you spend in homemaintenance activities such as gardening, house repairsor home improvement? hours
22. How many hours per week do you spend in ongoingvolunteer work for an organization? hours
23. How many hours per week do you spend in recreationalactivities such as sports, exercise, playing cards, or goingto movies? Please do not include time spent watching TVor listening to the radio. hours
24. How many hours per week do you spend in other self-improvement activities such as hobbies or leisurereading? Please do not include time spent watching TVor listening to the radio. hours
WITH WHOM DO YOU SPEND TIME?
25. Do you live alone? ___ yes ___ no(If yes, skip to question 26.)
25a. (If you don’t live alone) do you live with a spouse orsignificant other? ___ yes ___ no
25b. How many children do you live with? ___25c. How many other relatives do you live with? ___25d. How many roommates do you live with?___25e. How many attendants do you live with?___
26. (If you don't live with a spouse or significant other) are youinvolved in a romantic relationship?___ yes ___ no ___ N/A (lives with spouse or S.O)
27. How many relatives (not in your household) do you visit,phone, or write to at least once a month? ___ relatives
28. How many business or organizational associates doyou visit, phone, or write to at least once a month?___ Associates
29. How many friends (non-relatives contacted outsidebusiness or organizational settings) do you visit, phone,or write to at least once a month? Friends
30. With how many strangers have you initiated aconversation in the last month (for example, to askinformation or place an order)?[0] none [1] 1-2 [3] 3-5 [6] 6 or more
WHAT FINANCIAL RESOURCES DO YOU HAVE?
31. Approximately what was the combined annualincome, in the last year, of all family members in yourhousehold? (consider all sources including wages andearnings, disability benefits, pensions and retirementincome, income from court settlements, investmentsand trust funds, child support and alimony,contributions from relatives, and any other source.)
$ __________________________ .
32. Approximately how much did you pay last year formedical care expenses? (Consider any amounts paidby yourself or the family members in your householdand not reimbursed by insurance or benefits.)
$ __________________________ .
For information regarding CHART please contact:
Craig HospitalResearch Department3425 S. Clarkson Street
Englewood, Colorado 80110(303) 789-8202

APPENDIX B - CHART Long Form Scoring
S A M P L E
CHART Long Form Scoring
Craig Handicap Assessment
and Reporting Technique
Scoring Form
This form is designed to allow forinterviewing and coding simultaneously;however, until you are more familiar withthe CHART, you may wish to refer to the
specific guidelines in your CHART brochure.
The letters on this form match the letterson the scoring guidelines in the CHART brochure.
Blank copies of this form are available from:
Craig HospitalResearch Department
3425 South Clarkson StreetEnglewood, Colorado 80110
(303) 789-8202
35
Revised Craig Handicap Assessment andReporting Technique Scoring Form
PHYSICALINDEPENDENCE
1. How many hours in a typical 24-hour day do you have someone withyou to provide physical assistance for personal care activities such aseating, bathing, dressing, toileting and mobility?
______ hours paid assistance______ hours unpaid (family, others)
Total the hours of paid and unpaidcare. .
+
2. Not including any regular care as reported above, how many hours in atypical month do you occasionally have assistance with such things asgrocery shopping, laundry, housekeeping, or infrequent medical needsbecause of the disability?
________ hours per month
Divide the hours of occasional care by30.
Add the sums of “A” and “B”.
( / 30 )= .
3. Who takes responsibility for instructing and directing your attendantsand/or caregivers?
Self Someone Else Not applicable, does not use attendant care
If the respondent instructs and directshis/her own attendants or caregivers,multiply the answer of “C” by 3.
If someone other than the respondentinstructs and directs the attendants orcare givers, multiply the answer of “C”by 4.
Subtract the total in “D” from 100.
X 3 or 4=
.
100minus .sum from “D” above=

36
COGNITIVEINDEPENDENCE
4. How much time is someone with you in your home to assist you with activities that requireremembering, decision making, or judgment?
1_______ Someone else is always with me to observe or supervise.2______ Someone else is always around, but they only check on me now and then.3_______ Sometimes I am left alone for an hour or two.4_______ Sometimes I am left alone for most of the day5_______ I have been left alone all day and all night, but someone checks in on me.6_______ I am left alone without anyone checking on me.
Assign points as follows: response #1 =0 points; response #2 = 1 point;response #3 = 2 points; response #4 = 3points; response #5 = 4 points; andresponse #6 = 5 points.
Multiply points in “A” by 8.
.
x8= .
+
5. How much of the time is someone with you to help you with remembering, decision making, orjudgment when you go away from your home?
1_______ I am restricted from leaving, even with someone else.2_______ Someone is always with me to help with remembering, decision making or judgment when I go
anywhere.3_______ I go to places on my own as long as they are familiar.4_______ I do not need help going anywhere.
Assign points as follows: response #1 = 0points; response #2 = 1 point; response#3 = 2 points; and response #4 = 3points.
Multiply points in “C” by 8.
.
x8= .
+
6. How often do you have difficulty communicating with other people?
1_______ I almost always have difficulty.2_______ I sometimes have difficulty.3_______ I almost never have difficulty.
Assign points as follows: response #1 = 0points; response #2 = 1 point; response#3 = 2 points.
Multiply points in “E” by 6.
.
x6= .+
7. How often do you have difficulty remembering important things that you must do.
1_______ I almost always have difficulty.2_______ Sometimes I have difficulty.3_______ I almost never have difficulty.
Assign points as follows: response #1 =0 points; response #2 = 1 point;response #3 = 2 points.
Multiply points in “G” by 6.
.
x6= .+
8. How much of your money do you control?
1_______ None, someone makes all money decisions for me.2_______ A small amount of spending money is given to me periodically.3_______ Most of my money, but someone does help me make major decisions.4_______ I make all my own money decisions (or if married, in joint participation with my partner).
Assign points as follows: response #1 = 0points; response #2 = 1 point; response#3 = 2 points; and response #4 = 3points.
Multiply points in “I” by 4.
Add the sums of “B”, “D”, “F”, “H”, and“J”.
.
x4= .
=

37
MOBILITY9. On a typical day, how many hours are you out of bed? hours Multiply the number of hours out of bed
by 2. .+
10. In a typical week, how many days do you get out of your house and gosomewhere? ________days
Multiply the number of days per weekout of the house by 5. .
+11. In the last year, how many nights have you spent away from your home
(excluding hospitalizations?) none 1-2 3-4 5 or more
Assign points as follows: no nights out =0; 1-2 nights out = 10; 3-4 nights out = 15;5 or more nights = 20.
.+
12. Can you enter and exit your home without any assistance fromsomeone? yes___ no___
For questions #12-#17, assign 5 pointsfor each “yes” response and 0 pointsfor each “no” response.
.(#12)+
13. In your home, do you have independent access to your sleeping area,kitchen, bathroom, telephone, and TV (or radio)? yes no .
(#13)+
14. Can you use your transportation independently? yes no .
(#14)+
15. Does your transportation allow you to get to all the places you wouldlike to go? ____ yes ____ no .
(#15)+
16. Does your transportation let you get out whenever you want? yes no .
(#16)+
17. Can you use your transportation with little or no advance notice? yes no
Add the sums from “A”, “B”, “C”, and“D”. If the total sum is greater than 100,enter 100.
.(#17)=
38
OCCUPATION18. How many hours per week do you spend working in a job for which you
get paid? hoursMultiply the number of hours workingby 2. .
+19. How many hours per week do you spend in school working toward a
degree or in an accredited technical training program (including hoursin class and studying)? hours
Multiply the number of hours in schoolby 2. .
+
20. How many hours per week do you spend in active homemakingincluding parenting, housekeeping, and food preparation? hours
Multiply the number of hours in activehomemaking by 2. .
+
21. How many hours per week do you spend in home maintenanceactivities such as gardening, house repairs or home improvement? hours
Multiply the number of hours in homemaintenance by 2. .
+
22. How many hours per week do you spend in ongoing volunteer work foran organization? hours
Add the number of hours in volunteerwork to the number of hours inrecreational activities and the numberof hours in other self-improvementactivities.
.(#22)+
23. How many hours per week do you spend in recreational activities suchas sports, exercise, playing cards, or going to movies? Please do notinclude time spent watching TV or listening to the radio. hours
.(#23)+
24. How many hours per week do you spend in other self-improvementactivities such as hobbies or leisure reading? Please do not includetime spent watching TV or listening to the radio. hours
Add the sums of “A”, “B”, “C”, “D”, and“E”. If the total sum is greater than 100,enter 100.
.(#24)
=

39
SOCIALINTEGRATION
25. Do you live alone? Yes No
25a. (If you don’t live alone) do you live with a spouse or significant other? 25b. How many children do you live with? 25c. How many other relatives do you live with? 25d. How many roommates do you live with? 25e. How many attendants do you live with?
Assign 30 points if living with spouse/partner ORassign 20 points if living with unrelated roommateand/or an attendant.
.+
26. (If you don't live with a spouse or significant other) are you involved in aromantic relationship? Yes No N/A
Assign 20 points if in a romantic relationship, unlesspoints are assigned in “A”. If in a romanticrelationship and points are assigned in “A”, then“B” equals 30 minus “A”. .
+27. How many relatives (not in your household) do you visit, phone, or write
to at least once a month? ________relativesAdd the number of children in household andnumber of other relatives in household to numberof relatives contacted monthly. Multiply by 5. Amaximum score for this component is 25 points.
.+
28. How many business or organizational associates do you visit, phone, orwrite to at least once a month? Associates
If living with more than one attendant, add extraattendants to number of business or organizationalassociates contacted monthly. Multiply by 2. Amaximum score for this component is 20 points.
.+
29. How many friends (non-relatives contacted outside business ororganizational settings) do you visit, phone, or write to at least once amonth? Friends
If living with more than one roommate, add extraroommate to number of friends contactedmonthly. Multiply by 10. A Maximum score for thiscomponent is 50 points. .
+
30. With how many strangers have you initiated a conversation in the lastmonth (for example, to ask information or place an order)? none 1-2 3-5 6 or more
Assign points as follows: none = 0 points; 1-2 = 10points; 3-5 = 15 points; 6 or more = 20 points.
Add the sums from “A”, “B”, “C”, “D”, “E”, and “F”.If the total sum is greater than 100, enter 100.
.
=

40
ECONOMICSELFSUFFICIENCY
31. Approximately what was the combined annual income, in the last year,of all family members in your household? (consider all sources includingwages and earnings, disability benefits, pensions and retirementincome, income from court settlements, investments and trust funds,child support and alimony, contributions from relatives, and any othersource.)
$ .
Calculate family size by addingrespondent, plus partner (if living withrespondent), plus number of children inhousehold, plus other relatives inhousehold.
.Family size
.(#31)minus
32. Approximately how much did you pay last year for medical careexpenses? (Consider any amounts paid by yourself or the familymembers in your household and not reimbursed by insurance orbenefits.)
$ .
Subtract the unreimbursed medicalexpenses from the annual income(amount in question #31 minus amountin question #32).
Determine poverty level from familysize calculated in “A”.
Divide the value from “B” by thepoverty level from “C”.
Determine points as follows: If the sum from “D” is:
0.0 to <0.5 = 0 pointsto <1.0 =25 pointsto <1.5 =50 points1.5 to <2.0 =75 points2.0 or greater =100 points
.(#32)
=
.divided by
.Poverty level
=
.Convert to points asindicated
=

APPENDIX C - CHART Short Form - Interview
S A M P L E
CHART Short Form
Craig Handicap Assessment
and Reporting Technique
Blank copies of this form are available from:
Craig HospitalResearch Department
3425 South Clarkson StreetEnglewood, Colorado 80110
(303) 789-8202

42
CHART Short Form - Interview
WHAT ASSISTANCE DO YOU NEED?People with disabilities often need assistance. We would like todifferentiate between personal care for physical disabilitiesand supervision for cognitive problems. First, focus on physical"hands on" assistance: This includes help with eating, grooming,bathing, dressing, management of a ventilator or otherequipment, transfers etc. Keeping in mind these dailyactivities...
1. How many hours in a typical 24-hour day do you havesomeone with you to provide physical assistance forpersonal care activities such as eating, bathing, dressing,toileting and mobility?
________ hours paid assistance________ hours unpaid (family, others)
Now, focus on supervision for cognitive problems instead ofphysical assistance. This includes remembering, decisionmaking, judgment, etc..
2. How much time is someone with you in your home toassist you with activities that require remembering,decision making, or judgment?
[1] _____ Someone else is always with me to observe orsupervise.
[2] _____ Someone else is always around, but they onlycheck on me now and then.
[3] _____ Sometimes I am left alone for an hour or two.[4] _____ Sometimes I am left alone for most of the day[5] _____ I have been left alone all day and all night, but
someone checks in on me.[6] _____ I am left alone without anyone checking on me.
3. How much of the time is someone with you to help youwith remembering, decision making, or judgment whenyou go away from your home?
[1] _____ I am restricted from leaving, even with someoneelse.
[2] _____ Someone is always with me to help withremembering, decision making or judgmentwhen I go anywhere.
[3] _____ I go to places on my own as long as they arefamiliar.
[4] _____ I do not need help going anywhere.
Now, I have a series of questions about your typical activities.
ARE YOU UP AND ABOUT REGULARLY?
4. On a typical day, how many hours are you out of bed?_____hours
5. In a typical week, how many days do you get out ofyour house and go somewhere? ____days
6. In the last year, how many nights have you spent awayfrom your home (excluding hospitalizations?)[0]_______ none [1]_______ 1-2 [3]_______3-4[5]_______5 or more
HOW DO YOU SPEND YOUR TIME?
7. How many hours per week do you spend working in ajob for which you get paid? hours ________(occupation: )
8. How many hours per week do you spend in schoolworking toward a degree or in an accredited technicaltraining program (including hours in class andstudying)? Hours
43
9. How many hours per week do you spend in activehomemaking including parenting, housekeeping, andfood preparation? Hours
10. How many hours per week do you spend in homemaintenance activities such as gardening, houserepairs or home improvement? Hours
11. How many hours per week do you spend inrecreational activities such as sports, exercise, playingcards, or going to movies? Please do not include timespent watching TV or listening to the radio. Hours
WITH WHOM DO YOU SPEND TIME?
12. How many people do you live with? ____
13. Is one of them your spouse or significant other?[1]____Yes [0]____No [9]____Not applicable (subject livesalone)
14. Of the people you live with how many are relatives?____
15. How many business or organizational associates do youvisit, phone, or write to at least once a month?___________ associates
16. How many friends (non-relatives contacted outsidebusiness or organizational settings) do you visit, phone,or write to at least once a month? friends
17. With how many strangers have you initiated aconversation in the last month (for example, to askinformation or place an order)?
[0] none [1] 1-2 [3] 3-5 [6] 6 or more
WHAT FINANCIAL RESOURCES DO YOU HAVE?
18. Approximately what was the combined annualincome, in the last year, of all family members in yourhousehold? (consider all sources including wages andearnings, disability benefits, pensions and retirementincome, income from court settlements, investmentsand trust funds, child support and alimony,contributions from relatives, and any other source.)
a. Less than 25,000 - If no ask e; if yes ask bb. Less than 20,000 - If no code 22500; if yes ask cc. Less than 15,000 - If no code 17500; if yes ask dd. Less than 10,000 - If no code 12500; if yes code 5000e. Less than 35,000 - If no ask f; if yes code 30000f. Less than 50,000 - If no ask g; if yes code 42500g. Less than 75,000 - If no code h; if yes code 62500h. 75,000 or more code 80000
19. Approximately how much did you pay last year formedical care expenses? (Consider any amounts paidby yourself or the family members in your householdand not reimbursed by insurance or benefits.)
"Would you say your unreimbursed medical expensesare...."
a. Less than 1000 if "no" ask b if "yes" code 500.b. Less than 2500 if "no" ask c if "yes" code 1750.c. Less than 5000 if "no" ask d if "yes" code 3750.d. Less than 10000 if "no" code e if "yes" code 7500.e. 10000 or more code 15000
For information regarding CHART please contact:Craig Hospital
Research Department3425 S. Clarkson Street
Englewood, Colorado 80110(303) 789-8202
dmellick@craighospital org

APPENDIX D - CHART Short Form - Paper
S A M P L E
CHART Short Form
Craig Handicap Assessment
and Reporting Technique
Blank copies of this form are available from:
Craig HospitalResearch Department
3425 South Clarkson StreetEnglewood, Colorado 80110
(303) 789-8202

45
CHART Short Form - Paper
WHAT ASSISTANCE DO YOU NEED?People with disabilities often need assistance. We would like todifferentiate between personal care for physical disabilitiesand supervision for cognitive problems. First, focus on physical"hands on" assistance: This includes help with eating, grooming,bathing, dressing, management of a ventilator or otherequipment, transfers etc. Keeping in mind these dailyactivities...
1. How many hours in a typical 24-hour day do you havesomeone with you to provide physical assistance forpersonal care activities such as eating, bathing, dressing,toileting and mobility?
________ hours paid assistance________ hours unpaid (family, others)
Now, focus on supervision for cognitive problems instead ofphysical assistance. This includes remembering, decisionmaking, judgment, etc..
2. How much time is someone with you in your home toassist you with activities that require remembering,decision making, or judgment?
[1] _____ Someone else is always with me to observe orsupervise.
[2] _____ Someone else is always around, but they onlycheck on me now and then.
[3] _____ Sometimes I am left alone for an hour or two.[4] _____ Sometimes I am left alone for most of the day[5] _____ I have been left alone all day and all night, but
someone checks in on me.[6] _____ I am left alone without anyone checking on me.
3. How much of the time is someone with you to help youwith remembering, decision making, or judgment whenyou go away from your home?
[1] _____ I am restricted from leaving, even with someoneelse.
[2] _____ Someone is always with me to help withremembering, decision making or judgmentwhen I go anywhere.
[3] _____ I go to places on my own as long as they arefamiliar.
[4] _____ I do not need help going anywhere.
Now, I have a series of questions about your typical activities.
ARE YOU UP AND ABOUT REGULARLY?
4. On a typical day, how many hours are you out of bed?_____hours
5. In a typical week, how many days do you get out ofyour house and go somewhere? ____days
6. In the last year, how many nights have you spent awayfrom your home (excluding hospitalizations?)[0]_______ none [1]_______ 1-2 [3]_______3-4[5]_______5 or more
HOW DO YOU SPEND YOUR TIME?
7. How many hours per week do you spend working in ajob for which you get paid? hours ________(occupation: )
8. How many hours per week do you spend in schoolworking toward a degree or in an accredited technicaltraining program (including hours in class andstudying)? Hours

46
9. How many hours per week do you spend in activehomemaking including parenting, housekeeping, andfood preparation? Hours
10. How many hours per week do you spend in homemaintenance activities such as gardening, houserepairs or home improvement? Hours
11. How many hours per week do you spend inrecreational activities such as sports, exercise, playingcards, or going to movies? Please do not include timespent watching TV or listening to the radio. Hours
WITH WHOM DO YOU SPEND TIME?
12. How many people do you live with? ____
13. Is one of them your spouse or significant other?[1]____Yes [0]____No [9]____Not applicable (subject livesalone)
14. Of the people you live with how many (others) are relatives?____
15. How many business or organizational associates do youvisit, phone, or write to at least once a month?___________ associates
16. How many friends (non-relatives contacted outsidebusiness or organizational settings) do you visit, phone,or write to at least once a month? friends
17. With how many strangers have you initiated aconversation in the last month (for example, to askinformation or place an order)?
[0] none [1] 1-2 [3] 3-5 [6] 6 or more
WHAT FINANCIAL RESOURCES DO YOU HAVE?
18. Approximately what was the combined annualincome, in the last year, of all family members in yourhousehold? (consider all sources including wages andearnings, disability benefits, pensions and retirementincome, income from court settlements, investmentsand trust funds, child support and alimony,contributions from relatives, and any other source.)
Less than 10,00010,000 – 15,00015,000 – 20,00020,000 – 25,00025-000 – 35,00035,000 – 50,00050,000 – 75,00075,000 or more
19. Approximately how much did you pay last year formedical care expenses? (Consider any amounts paidby yourself or the family members in your householdand not reimbursed by insurance or benefits.)
"Would you say your unreimbursed medical expensesare...."
Less than 1000 1,000 – 2,500 2,500 – 5,000 5,000 – 10,000 10,000 or more
For information regarding CHART please contact:Craig Hospital
Research Department3425 S. Clarkson Street
Englewood, Colorado 80110(303) 789-8202
dmellick@craighospital org
APPENDIX E - CHART Short Form Scoring
S A M P L E
CHART Short Form Scoring
Craig Handicap Assessment
and Reporting Technique
Scoring Form
This form is designed to allow forinterviewing and coding simultaneously;however, until you are more familiar withthe CHART, you may wish to refer to the
specific guidelines in your CHART brochure.
The letters on this form match the letterson the scoring guidelines in the CHART brochure.
Blank copies of this form are available from:
Craig HospitalResearch Department
3425 South Clarkson StreetEnglewood, Colorado 80110
(303) 789-8202

48
Craig Handicap Assessment and Reporting Technique Scoring Short Form
PHYSICALINDEPENDENCE
1. How many hours in a typical 24-hour day do you have someone with you to provide physicalassistance for personal care activities such as eating, bathing, dressing, toileting andmobility?
_____ hours paid assistance ______ hours unpaid (family, others)
A. Total the hours of paid and unpaid care,multiply by 4, and subtract that numberfrom 100.
100minus
.=
COGNITIVEINDEPENDENCE
2. How much time is someone with you in your home to assist you with activities that requireremembering, decision making, or judgment?
1______ Someone else is always with me to observe or supervise.2______ Someone else is always around, but they only check on me now and then.3______ Sometimes I am left alone for an hour or two.4______ Sometimes I am left alone for most of the day5______ I have been left alone all day and all night, but someone checks in on me.6______ I am left alone without anyone checking on me.
A. Assign points as follows: response #1 = 0points; response #2 = 1 point; response #3= 2 points; response #4 = 3 points; response#5 = 4 points; and response #6 = 5 points.
B. Multiply points in “A" by 11.
.
x11
= .
+
3. How much of the time is someone with you to help you with remembering, decision making,or judgment when you go away from your home?
1_______ I am restricted from leaving, even with someone else.2_______ Someone is always with me to help with remembering, decision making or
judgment when I go anywhere.3_______ I go to places on my own as long as they are familiar.4_______ I do not need help going anywhere.
C. Assign points as follows: response #1 = 0points; response #2 = 1 point; response #3= 2 points; and response #4 = 3 points.
D. Multiply points in “C" by 15.
.
x15
=
.
=
Add the sums of “B” and “D”. If the total sum isgreater than 100, enter 100.

49
MOBILITY4. On a typical day, how many hours are you out of bed? hours A. Multiply the number of hours out of bed by
3. .+
5. In a typical week, how many days do you get out of your house and go somewhere?________days
B. Multiply the number of days per week outof the house by 7. .
+6. In the last year, how many nights have you spent away from your home (excluding
hospitalizations?) none 1-2 3-4 5 or more
C. Assign points as follows: no nights out = 0;1-2 nights out = 10; 3-4 nights out = 15; 5 ormore nights = 20. If the total sum is greaterthan 100, enter 100.
.=
Add the sums of “A”, “B”, and “C”. If the totalsum is greater than 100, enter 100.
OCCUPATION7. How many hours per week do you spend working in a job for which you get paid? hours A. Multiply the number of hours working by
2.5. .+
8. How many hours per week do you spend in school working toward a degree or in anaccredited technical training program (including hours in class and studying)? hours
B. Multiply the number of hours in school by2.5. .
+
9. How many hours per week do you spend in active homemaking including parenting,housekeeping, and food preparation? hours
C. Multiply the number of hours in activehomemaking by 2.5. .
+10. How many hours per week do you spend in home maintenance activities such as gardening,
house repairs or home improvement? hoursD. Multiply the number of hours in home
maintenance by 2.5. .+
11. How many hours per week do you spend in recreational activities such as sports, exercise,playing cards, or going to movies? Please do not include time spent watching TV or listeningto the radio. hours
E. Multiply the number of recreationalactivities by 1.25 .
=Add the sums of “A”, “B”, “C”, “D”, and “E”. Ifthe total sum is greater than 100, enter 100.
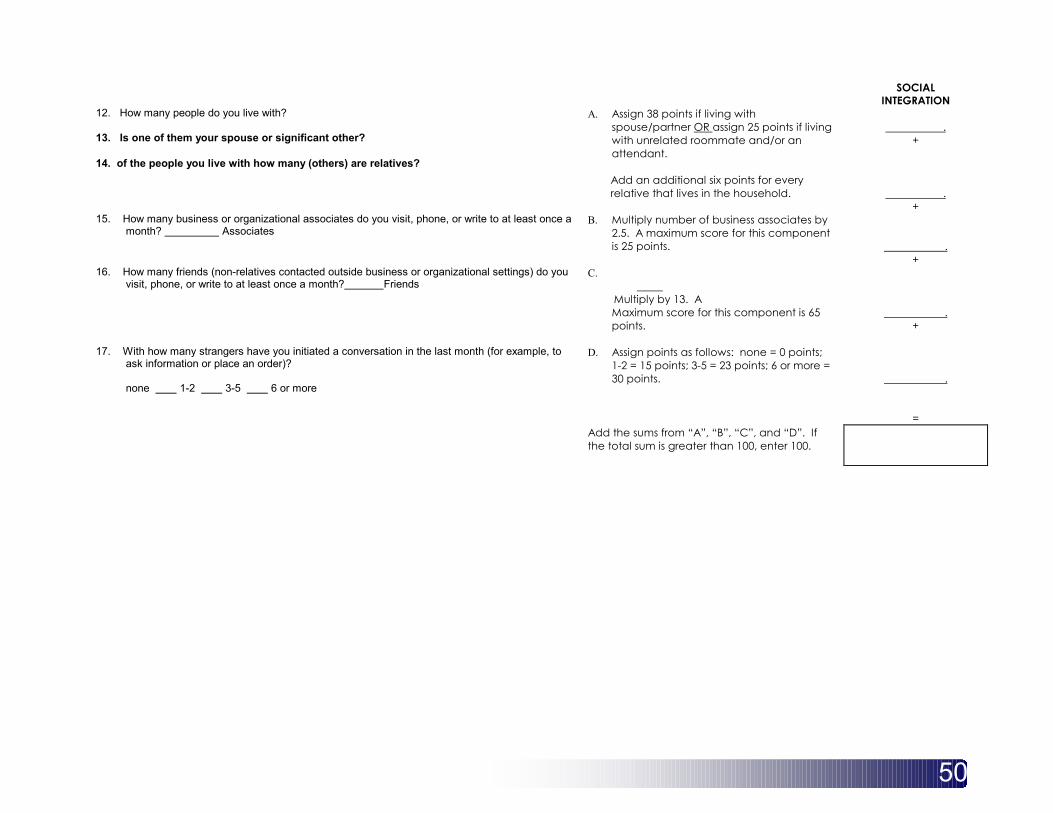
50
SOCIALINTEGRATION
12. How many people do you live with?
13. Is one of them your spouse or significant other?
14. of the people you live with how many (others) are relatives?
A. Assign 38 points if living withspouse/partner OR assign 25 points if livingwith unrelated roommate and/or anattendant.
Add an additional six points for everyrelative that lives in the household.
.+
.+
15. How many business or organizational associates do you visit, phone, or write to at least once amonth? Associates
B. Multiply number of business associates by2.5. A maximum score for this componentis 25 points. .
+16. How many friends (non-relatives contacted outside business or organizational settings) do you
visit, phone, or write to at least once a month? FriendsC.
Multiply by 13. AMaximum score for this component is 65points.
.+
17. With how many strangers have you initiated a conversation in the last month (for example, toask information or place an order)?
none 1-2 3-5 6 or more
D. Assign points as follows: none = 0 points;1-2 = 15 points; 3-5 = 23 points; 6 or more =30 points. .
=Add the sums from “A”, “B”, “C”, and “D”. Ifthe total sum is greater than 100, enter 100.

51
ECONOMICSELF
SUFFICIENCY18. Approximately what was the combined annual income, in the last year, of all family
members in your household? (consider all sources including wages and earnings, disabilitybenefits, pensions and retirement income, income from court settlements, investments andtrust funds, child support and alimony, contributions from relatives, and any other source.)
a. Less than 25,000 - If no ask e; if yes ask bb. Less than 20,000 - If no code 22500; if yes ask cc. Less than 15,000 - If no code 17500; if yes ask dd. Less than 10,000 - If no code 12500; if yes code 5000e. Less than 35,000 - If no ask f; if yes code 30000f. Less than 50,000 - If no ask g; if yes code 42500g. Less than 75,000 - If no code h; if yes code 62500h. 75,000 or more code 80000
A. Calculate family size by addingrespondent, plus partner (if living withrespondent), plus other relatives inhousehold.
.Family size
.(#19)minus
19. Approximately how much did you pay last year for medical care expenses? (Consider anyamounts paid by yourself or the family members in your household and not reimbursed byinsurance or benefits.)
a. Less than 1000 if "no" ask b if "yes" code 500.b. Less than 2500 if "no" ask c if "yes" code 1750.c. Less than 5000 if "no" ask d if "yes" code 3750.d. Less than 10000 if "no" code e if "yes" code 7500.e. 10000 or more code 15000
B. Subtract the unreimbursed medicalexpenses from the annual income(amount in question #19 minus amount inquestion #20.
C. Determine poverty level from family sizecalculated in “A”.
D. Divide the value from “B” by the poverty
level from “C”.
E. Multiply by 50
.(#20)
=
.
divided by
.Poverty level
*50=
.
=If the total sum is greater than 100, enter 100.