cramer’s twenty-five r ules - thestreet.com · cramer’s twenty-ve rules for investing numer 1 2...
TRANSCRIPT
Cramer’s TwenTy-five rules
for invesTingNumber 1 Number 2 Number 3
Number 4 Number 5 Number 6
Logo Width=3˝ Logo Width=2˝
Logo Width=0.75˝ Logo Width=0.5˝
Logo Width=1.5˝
Logo Width=1˝
. . . . . . . . . . . . . . . . . . . . . . . . . . . . . . . . . . . . . . . . . . . . . . . . . . . . . . . . . . . . . . . . . . . . . . . . . . . . . . . . . . . . . . . . . . . . . . . . . . . . . . . . . . . . . . . . . . . . . . . . . . . . . . . . . . . . . . . . . . . . . . . . . . . . . . . . . . . . . . . . . . . . . . . . . . . . .
. . . . . . . . . . . . . . . . . . . . . . . . . . . . . . . . . . . . . . . . . . . . . . . . . . . . . . . . . . . . . . . . . . . . . . . . . . . . . . . . . . . . . . . . . . . . . . . . . . . . . . . . . . . . . . . . . . . . . . . . . . . . . . . . . . . . . . . . . . . . . . . . . . . . . . . . . . . . . . . . . . . . . . . . . . . . .

Cramer’s Twenty-five rules for investing
Number 1 Number 2 Number 3
Number 4 Number 5 Number 6
Logo Width=3˝ Logo Width=2˝
Logo Width=0.75˝ Logo Width=0.5˝
Logo Width=1.5˝
Logo Width=1˝
View Our Premium Services
1
Bulls, Bears Make Money, Pigs Get SlaughteredRule 1
What would you do if I told you the Nasdaq were to go up 1,000 points between now and November? What would you do if I told you the Nasdaq was going to double by Decem-ber? How about if I told you that after it doubled, you would then catch another 1,000 points up by March?
First, I think you would tell me that I was nuts, and not worth listening to. But what if I were so persuasive that you believed me. Wouldn’t you want every penny you had in the Nasdaq right now?
Or would you say, “Nope, not for me, this one’s not worth catching. I don’t want the 1,000 points, I don’t want the double and I certainly don’t want that last 1,000 points. Way too dangerous for me.”
From the way people talk these days, with sober intonations about the market, total sobriety, you would believe the latter. You would think that people would avoid that 3,000-point move like the plague. Because we know how that 3,000-point up move turned out, we know that we simply climbed the stairs to jump off the tower.
Yet, that’s what happened six years ago, that exact same se-quence. Knowing what we know now about how hard it is to make money in the market, I think we would regard ourselves as utter fools if we avoided that incredible move simply be-cause we didn’t have to jump off the tower of Nasdaq 5000. It wasn’t inevitable.
It wasn’t inevitable unless we are pigs.
Which leads to one of my absolute favorite adages:
Bulls make money, bears make money, pigs get slaughtered.
Rules like that one — simple, nonquant and yes, nonfinancial rules — saved me in 2000.
These days there’s plenty of revisionist history on the part of financial commentators, editors and occasionally even broker-
age house personnel — if they let themselves wax philosophi-cal — about what happened when the Nasdaq bubble burst. Those who tried to capitalize on it are now ridiculed. Those who avoided it are now held up as some sort of paragon wor-thy of Diogenes.
Hardly.
The truth is that for one year of our lives, the Nasdaq gave away money to those who were bulls, but after 3,000 points, the bulls morphed into pigs and everyone who was piggish got annihilated.
So often, when I bring this adage up, people ask me “How do you know when you are being a pig?” I know there’s not sup-posed to be any stupid questions out there, but the answer is, frankly, you don’t need me to tell you. If you weren’t feeling piggish after we hit an all-time high on the Nasdaq in 2000, you needed a shrink, pronto.
Remember, my goal is to stay in the game. The people who got wiped out by the Nasdaq crash tended to be people who never took anything off the table, who never felt greedy, who got slaughtered by their own piggishness.
Unlike so many others I see and hear on television or read in articles, I have no regrets about liking the market during that period. To have avoided those 3,000 points would have been sinful. It would have been suicidal for a professional manager.
But it was my desire not to be a pig that kept me in the game in March and April of that year. That’s why I remind people every day: Have you taken your profit? Have you booked anything? Or are you being a pig? Because you never know when things you own are going to crash. You never know when the market could be wiped out. You can’t have certainty. At those times, you have only human nature to guide you.
Whenever I struggle with a stock in my Action Alerts PLUS portfolio because I have booked so many profits that I feel I don’t have enough on my sheets, I console myself with the simple lesson of Nasdaq 5000. For example, I caught the oil move in a prudent way that made me a lot when it first started but couldn’t make me as much later, simply because I had
Cramer’s Twenty-five rules for investing
Number 1 Number 2 Number 3
Number 4 Number 5 Number 6
Logo Width=3˝ Logo Width=2˝
Logo Width=0.75˝ Logo Width=0.5˝
Logo Width=1.5˝
Logo Width=1˝
View Our Premium Services
2
taken stock off because I didn’t want to be a pig. That meant I would make less money than others who were in the patch. I accepted that, as I do every time I make the decision not to be a pig.
It’s the price I have to pay for following my adage. It always seems a high price when things are going well, as it did in March 2000 when I sold so much stock.
Until I look back and realize that my desire not to be too greedy saved me so I could live to play again.
It’s OK to Pay the Taxes Rule 2
No one has ever liked to pay taxes. As long as there have been taxes, people have hated paying them. But the aversion to paying taxes on stock gains borders on the pathological. That’s why my second bedrock tenet for my 25 rules of invest-ing is:
It’s OK to pay the taxes.
When I went bearish in March 2000, I received a huge amount of angry email from people who felt aggrieved. They had bought, I don’t know, Redback Networks or InfoSpace because of me, because of something I wrote, and now they were being told to sell it.
Had I no regard for them? Had I no regard for how much in taxes they would have to pay because the gains were short-term? What was the point of making money in a compressed period of time when it meant you would have much less to show for it than if the stock were held long-term?
I had zero sympathy for these people. I had long ago made my peace with the tax man. I knew that some gains were and are simply unsustainable. Given, though, that so many people thought that if you bought and held, you always ended up with more than if you bought and sold, my discussion fell on deaf ears, an audience like the character in The Lord of the Rings, Gollum, who says, “I’m not listening, I’m not listening.”
Anyone who held on to get the long-term gain then ended
up with no gain at all. You obviated the need to pay taxes the hard way; no taxes are due when you sell at a loss.
It’s important to remember that gains, any gains, can be ephemeral. It is better to stop worrying about the tax man and take the gains when those gains appear unsustainable than to ride things back to a loss. Stop fearing the tax man; start fear-ing the loss man. You won’t regret it.
At the time of publication, Cramer had no positions in stocks mentioned.
Don’t Buy All at OnceRule 3
No broker likes to fool around with partial orders. No financial adviser has the time to buy stocks methodically over time. The game is to get the trade on, at one level, in a big way. Make the statement buy. Get the position on the sheets or in the portfolio.
And from where I sit, that’s all wrong. 100% wrong. Never buy all at once. Never sell all at once. Stage your buys. Work your orders. Try to get the best price over time.
When I first started out as a professional trader, I wanted to prove to everyone how big I was and how right I would be. If I wanted to buy Caterpillar, by golly, I wanted to buy it now, big, at one price, because I was so sure of how right I was. “Put me up on 50,000 CAT!” I would scream, as if I were the smartest guy in the universe.
What an arrogant son of a gun I was. Arrogant and wrong.
What should I have been doing? Following my rule that you don’t buy all at once. If I wanted to get 50,000 CAT in, I would buy it in units of 5,000 over time, trying to get the best price. I would put some on to start and then hope to work my way down to get a better basis.
I no longer trade institutionally. I no longer trade “in size.” But I still invest for my Action Alerts PLUS portfolio, and when I have a new name, I buy in 500-share increments over a day to get my several thousand share position on. I did it in a way that gave me a terrific price.
Cramer’s Twenty-five rules for investing
Number 1 Number 2 Number 3
Number 4 Number 5 Number 6
Logo Width=3˝ Logo Width=2˝
Logo Width=0.75˝ Logo Width=0.5˝
Logo Width=1.5˝
Logo Width=1˝
View Our Premium Services
3
Why don’t more people do it my way? Why don’t people, if they want 500 shares of ExxonMobil, buy it in 100-share increments? I think it is because they want to be big, too. They don’t want to waste their broker’s time. The broker wants to get the trade done. I know my brokers hated it when my wife, who came in to run my trading desk, took orders like mine for CAT and then broke it into small increments and worked in over a day’s time.
You must resist feeling like you are making a statement. I have bought and sold billions of shares of stock. Do you know how often I got it in at the right price? Do you know how often the last price I paid was the lowest and it was off to the races? Probably one in one hundred. And I’m pretty good at this game.
Resist the arrogance, buy slowly, even buy over a couple of days as I do for my Action Alerts PLUS portfolio. It’s humbling and it’s right.
At the time of publication, Cramer had no positions in stocks mentioned.
Buy Damaged Stocks, Not Damaged CompaniesRule 4
Let’s say Wall Street is holding a sale of solid merchandise that it has to move. And let’s say you take that merchandise home only to find it doesn’t work, has a hole in it or is missing a key part. If we were on Main Street, of course, it wouldn’t matter. There are guarantees and warranties galore on Main Street. You can take anything back.
You can’t return merchandise on Wall Street and get your money back. Nope, no way.
Which is why I always say:
You have to buy damaged stocks, not damaged companies.
Sometimes these buys are easy to discern. In 1998, when Cendant was defrauded by the management of CUC Inter-national through a series of bogus financials, the stock went from $36 to $12 in pretty much a straight line. Was that a one-day sale that should be bought? No, that was a damaged
company. It took years for Cendant to work its way back into the hearts of investors. Some say it has never recovered.
But when Eastman Chemical announced a shortfall in early 2005 because of a problem — a fixable problem — at one of its facilities, that 4-point dip was a classic panic sale, one that you had to buy. The stock subsequently moved up a quick 8 points when the division recovered in the next quarter.
Sometimes, the sales on Wall Street aren’t as obvious. I got snookered in 2004 thinking that Nortel’s accounting problems were a simple sale of a damaged stock, with the company quite whole. In fact, the company was gravely damaged by an accounting fraud, and it has looked doubtful the company would ever recover.
And sometimes the sale is so steep that it looks as if some-thing’s dreadfully wrong, when really the problem is something that over the longer term will go away.
How do we know if there is something wrong with the com-pany instead of just the stock? I think that’s too complicated a question. What I like to do is develop a list of stocks I like very much, and when Wall Street holds an en masse sale, I like to step up to the plate. I particularly like to be ready when we have multiple selloffs in the stock market because of events unrelated to the stocks I want to buy, a major shortfall of an important bellwether stock, or perhaps some macro event that doesn’t affect my micro-driven story.
Of course, sometimes you just have to deduce that the com-pany’s fortunes haven’t really changed, and the fundamentals that triggered the selloff (either in the market or in the com-pany) will be something that will reverse themselves shortly. But you never know. Which is, again, why I think that rule no. 3 must be obeyed. If you don’t buy all the stock at once, and if you take your time, it is more likely that you won’t be left holding a huge chunk of merchandise when more bad news comes around the corner.
At the time of publication, Cramer had no positions in stocks mentioned.
Diversify to Control RiskRule 5

Cramer’s Twenty-five rules for investing
Number 1 Number 2 Number 3
Number 4 Number 5 Number 6
Logo Width=3˝ Logo Width=2˝
Logo Width=0.75˝ Logo Width=0.5˝
Logo Width=1.5˝
Logo Width=1˝
View Our Premium Services
4
If you control the downside, the upside will take care of itself. I have always believed that to be the case. But controlling the downside means managing the risk.
The biggest risk out there is sector risk. I don’t care how great a tech stock was in 2000 — even eBay and Yahoo! — if you had all your eggs in that sector, you got scrambled. Same with pharma in the last several years. Or oil in 1982, when I broke into the business.
What can keep you from getting nailed by sector risk, which is about 50% of the entire risk of owning a stock?
Diversification.
It’s the only investment concept that truly works for everyone. If you can mix up enough different sectors in your portfolio, you can’t be hit by one of the myriad perfect storms that come our way far more often than you would think.
Why aren’t more people diversified? Many amateurs don’t know the stocks they buy. They end up with stocks that are frighteningly similar. When I started playing “Am I Diversified” on my radio show in 2001, I was blown away by how few people knew just how undiversified they really were.
I still field quite a few calls from people who genuinely think that owning Sun Microsystems, EMC and Microsoft is a form of diversification because they own servers and software!
They think that having Pfizer, Bristol-Myers Squibb and Procter & Gamble makes them safe!
And no matter how much I may like oil stocks at any given mo-ment, I can’t countenance a portfolio made up of ExxonMobil, Chesapeake Energy and Halliburton.
An undiversified portfolio is not just an amateur mistake, though. Many professionals don’t like to be diversified be-cause of the bizarre way money is run in this country. If you concentrate all your bets in one sector and the sector takes off, you will beat pretty much every diversified fund out there. That’s the nature of the beast. You then can market yourself as a huge success and get profiled by every magazine and take
in capital from unsuspecting folk who don’t know how much risk you truly are taking on.
Both amateur and professional are wrong; controlling risk is the key to long-term rewards and controlling risk means being diversified at all times.
At the time of publication, Cramer was long Halliburton and Microsoft.
Do Your Stock HomeworkRule 6
My kids hate homework. They think it is punishment. Some-times when I look at what they are studying, I have to admit that I find it easy to sympathize with them. What’s the rel-evance of most of the things they study? How will it help them in later life? Why bother?
Of course, that’s a terrible attitude, and, as a parent, I encour-age them to study because I want them to do well, and be-cause you never know what they eventually will be interested in.
I think many of you believe that the homework you do on stocks might be just as irrelevant to your own portfolios as schoolwork seems to my kids.
When I tell people that they have to listen to the Starbucks conference call or know what the analysts are looking for from Urban Outfitters if they are going to own those high-multiple stocks, they don’t want to hear it. They can’t understand what a scold I am.
When I remind people that doing the homework could take as much as an hour per week per position, they look at me as if I am some sort of old-fashioned teacher who is asking for way too much in this busy world in which we live.
That’s just plain wrong.
Where does the desire to own stocks with no research into the companies come from? It comes from two different views:
• If I buy it and hold it long enough, it will come back.
Cramer’s Twenty-five rules for investing
Number 1 Number 2 Number 3
Number 4 Number 5 Number 6
Logo Width=3˝ Logo Width=2˝
Logo Width=0.75˝ Logo Width=0.5˝
Logo Width=1.5˝
Logo Width=1˝
View Our Premium Services
5
• I don’t have the time — no one has the time — to be thatdiligent.
The latter point’s easy to counter: You don’t have the time? Give it to someone else. You don’t understand how to read a balance sheet? Give it to someone else. There are lots of good managers out there who will beat you simply because they are at it every day and you can’t be.
It’s the first concept, though, that I find really needs debunk-ing. Buying and holding became the be-all and end-all for many people in the 1990s. “You know what? I am just going to hold on to that CMGI because it has to go back to $100, where I bought it.” Or, “Why sell Sun Micro now? When it gets back to $70, I am going to sell it because all of the texts say that if you hold things for the long term, everything works out.”
Huh? What text says that? I don’t know of it. That’s just a fictional contortion of what the texts say.
That’s why I say: Before you buy any stock — before you pur-chase Caterpillar, before you buy Lucent — please, please, do your homework.
Listen to the conference calls. Go to the company’s Web site. Read the research. Read the news stories. Everything’s avail-able on the Web. Everything.
But if you fall back on a buy-and-hold strategy for an EMC or a Microsoft, I can assure you that you will be soundly beaten by professional managers with good track records who are actively searching for good stocks all of the time.
Remember:
Buy and homework, not buy and hold.
At the time of publication, Cramer had no positions in stocks mentioned.
No One Made a Dime by Panicking Rule 7
You see it over and over again. A stock gets hammered.
People flee after the hammering. The market gets crushed on a huge down day. People leave at the end of the day. A sector gets annihilated. Quickly. People can’t take the pain; they bolt after the annihilation.
Panic is the operating instinct in all of these cases. There’s something basic and instinctive about panic, about the desire to flee. It might work when it comes to individuals and things that might threaten us physically. But it can’t make you a dime. That’s why I say:No one ever made a dime panicking.
There will always be a better time to go, a better time to leave the table than the one brought on by panic.
Let’s take a classic panic, a run out of Biogen Idec from March 2005. As soon as I saw the panic in that stock, I wanted to run the other direction; I wanted to buy. If you bought the heart of that panic, the $36 price, you could have made a quick 5 points. If you flipped it then, you could have gotten back in and already would have been up a couple for the investible side of the ledger. But by going up again, that stock made a mockery of those who fled.
We get mini-panics all the time in the market. We might have a mini-panic in Starbucks off a weak monthly comp number, or in Panera and Whole Foods off a couple of not-so-great months. Those down-5 and down-10 situations don’t need to be chased or participated in. A better time to sell will come.
I want you to do something for me next time there is a panic. I want you to take the opposite side of the trade. When you see one of those high-speed routs of a sector or a stock, buy a little. Get a feel for it. See what I mean. The most rewarding trades you can make are those where the decks have been cleared out by panicky folks using market orders who just don’t get that the exit doors aren’t as big as they think they are.
Mind you, I am not saying that all merchandise that gets pan-icked out of is worth buying for the long term. I am saying that it’s a rare day when a stock or market that is socked that there won’t be some sort of bounce that allows you to get out at a better price than you would have if you just joined the fleeing
Cramer’s Twenty-five rules for investing
Number 1 Number 2 Number 3
Number 4 Number 5 Number 6
Logo Width=3˝ Logo Width=2˝
Logo Width=0.75˝ Logo Width=0.5˝
Logo Width=1.5˝
Logo Width=1˝
View Our Premium Services
6
masses. Buy Best-of-Breed Companies Rule 8
In cars, we buy best of breed. Not even an issue. We pay up for the brand because we know that a brand, a good brand, signifies reliability. It signifies a higher level of service, a quality of ownership that can pay dividends for years.
Why don’t so many of us feel that way in the stock market? Why are so many drawn to a Safeway or a Kroger, inferior supermarket chains, when Whole Foods Market is clearly the best of breed?
Why did so many people lose money in so many different audio component stores, when Best Buy is the only company that delivers sustainable profits in that retail sector?
Why would people want to own General Motors or Ford, just because those stocks are down a lot, when they could own best-of-breed Toyota, which is taking share and making big profits? I know they are drawn by the low dollar amount of the American carmakers, but Toyota is the cheapest and the best, a rare find.
The list goes on and on. Way too many of you are unwilling to pay up for best of breed because you think that you are get-ting short-changed. There are very few bargains out there in the world of secondary and tertiary players. I believe that when it comes to price-to-earnings multiple, investing in the more expensive stock is invariably worth it because you get piece of mind. That’s why I say:
Own the best of breed; it’s worth it.
Take Walgreen and Rite Aid. Sure, Rite Aid seems perpetually in turnaround mode and you have to love the cheaper stock. Don’t you? Not me; I have to tell you that I think Walgreen is the bargain of those two, because I never mind paying a higher price for the better company.
Forget about it. Buy best of breed. Pay up. You almost never will find yourself regretting it.
Defend Some Stocks, Not AllRule 9
When the markets are hard and unrelenting, as this one has become this year, it’s important to remember an adage that’s well-suited for a battlefield plan but is just as valuable for a portfolio plan:
He who defends everything defends nothing.
When the market’s flying and many stocks are in a bullish mode, it really doesn’t matter how much you have on, or how many positions you have. The more exposure the better.
But when things get tougher, you have to recognize that many stocks that you bought for better times may not be in good enough shape to rally. You can’t own everything you would like to own.
For example, last March you may have been playing the chemical sector with Eastman Chemical, Dow Chemical and DuPont because you saw the demand from China. But when General Motors suddenly “blew up,” you had way too many chemical companies.
I like to say, don’t defend them all, just defend some. Pick your favorite and defend that. If you try to defend them all, you simply will run out of capital or go on margin before the bot-tom. You will lose your reserve and not be ready if the market doesn’t turn in your direction.
That’s why I rank all my stocks at all times for my Action Alerts PLUS portfolio. I need to know which stocks I will defend when things get tough and which I will cut and use as sources of capital.
It’s extremely important, say, if you think that the techs are going to start rallying here, that you don’t just keep the whole complex. Pick the best stocks, the ones you know you will want to buy if they go lower and toss out the rest.
Let me give you an example. Say storage stocks seemed to be holding up rather well under tough market conditions and that sector struck me as worth defending. But that might
Cramer’s Twenty-five rules for investing
Number 1 Number 2 Number 3
Number 4 Number 5 Number 6
Logo Width=3˝ Logo Width=2˝
Logo Width=0.75˝ Logo Width=0.5˝
Logo Width=1.5˝
Logo Width=1˝
View Our Premium Services
7
mean I’d toss out a software stock that I was more worried about or eliminate an Internet stock because I couldn’t know when it would reverse. I would defend, only, say, QLogic or Brocade, but not both.
If you rank stocks on a scale of one (buy) to four (sell), as I do at the end of every week for Action Alerts PLUS, you know that when you come face-to-face with the enemy — an on-slaught of selling — you are ready to buy on the way down the ones you can truly defend — the No. 1 stocks — and you will wait on the twos until they are lower.
The nonessentials — the ones that have no catalysts and that you are using just for exposure because you thought you liked the market — they get the heave-ho immediately.
My wife, the former Trading Goddess, used to call this “cir-cling the wagons” around your best names. The few first times you do it, you will curse yourself because you will be slaugh-tering stocks you might have had on for some time.
But you must go through this process a multitude of times before you realize how right it is and before it can become second nature.
You will end up with great costs bases on the stocks you really like, and you will have enough capital left to make a dif-ference.
At the time of publication, Cramer had no positions in the stocks mentioned.
Bad Buys Won’t Become Takeovers Rule 10
Nothing’s more exciting than a takeover. Nothing’s as lucra-tive. You can put on a lifetime’s worth of moves in a day from a takeover. So people go to great extents to try to get them, including buying a lot of bad companies in the hope of catch-ing one takeover.
Funny thing about bad companies: They rarely get bids. In fact, the companies that get bids are great companies with cheap stocks, not crummy companies with expensive stocks. Yet that’s what people buy, all the time. Here’s my rule:
Never speculate on companies with bad fundamentals.
The odds are that you will end up owning something that could go down much more than you thought, but that has very limited upside. You can make much more money buying a company that is doing well and can still get a bid, than you can buying a company that is doing poorly and is unlikely to get a bid.
Any time I deviate from this rule I get burned, particularly when I approach a stock as a nontakeover story and then the fundamentals go awry and I try to shoehorn it into a takeover story. Take Nortel. After the accounting fiasco, I consoled myself that perhaps the company would be acquired because it was so cheap. That proved to be a sucker’s game, because the company simply couldn’t put out financials. Maybe one day Nortel will get a bid, like Lucent, but I have a feeling that it won’t happen soon enough to make up for the time value of money.
Some people have stayed in painful stocks believing that lightning could strike. Meanwhile, if they had moved on, they could have bought high-quality companies that moved up over time and could have done much better.
When you’re scouting for companies where the fundamentals are cheap and the takeovers are likely, remember that, unlike companies with bad fundamentals that you speculate on, if these go down you don’t need to cut and run. If they don’t get a bid, you still can win.
And you need multiple ways to win, at all times.
At the time of publication, Cramer had no positions in the stocks mentioned.
Don’t Own Too Many NamesRule 11
In my years as a hedge fund manager, I spent three hours every day analyzing the mistakes of the day before.
That was my major task, one that I completed before anyone else came into the office, generally between 4 a.m. and 7 a.m. I would analyze every losing trade — you don’t need to
Cramer’s Twenty-five rules for investing
Number 1 Number 2 Number 3
Number 4 Number 5 Number 6
Logo Width=3˝ Logo Width=2˝
Logo Width=0.75˝ Logo Width=0.5˝
Logo Width=1.5˝
Logo Width=1˝
View Our Premium Services
8
analyze the winners, they take care of themselves — and try to figure out how I could have made more money or lost less money.
I was maniacal about it.
And after a couple of years of this, I realized that good perfor-mance could be directly linked to having fewer positions.
I never will buy a stock without first taking one off. That’s a great discipline and one you should adopt, pronto. All the bad money managers I know have hundreds of positions. All the good ones have a few that they know inside out and like on the way down. That’s why I say:
Don’t own too many stocks.
I know it can be constraining. For instance, I might like several stocks in the chemicals group, say, DuPont, Dow Chemical and Eastman Chemical. But my discipline leaves room for only one, so I would own the one that I thought was the cheapest and the best.
When I lost the most money as a hedge fund manager, by the way, my “sheets,” my position sheets, were as thick as a brick. When I made the most money, my sheets were, well, one sheet of paper, double-spaced. And I ran hundreds of millions of dollars.
Please remember that whether you are a pro or an amateur, you can always have too many positions.
At the time of publication, Cramer had no positions in the stocks mentioned.
Cash Is for Winners Rule 12
The aversion to cash in this business breaks my heart. Some-times cash is such a perfect investment that it drives me crazy how few people ever recommend it. Nah, they hate the market so they are only 95% long instead of 100%. Or, they think the market stinks, so they decide to short a few highfliers against their longs.
No, No, No!
You don’t like any sectors? Sell everything and go into cash, don’t short Advanced Micro Devices vs. Intel or Nortel vs. Lucent.
You don’t think the market’s going to do anything? Don’t try paired trades, like General Motors vs. Ford, and don’t buy defensive stocks like Anheuser-Busch or General Mills. Just get out.
So many people never want to get out and go to cash, which is literally short-term Treasuries of the less-than-a-year variety. People start talking about how little cash earns — although it sure earned more than a year ago. Or they say, “Can’t be in cash, that’s for losers.” But I say:
Cash is for winners.
A lot of this cash aversion stems from something that oc-curred a decade ago, when Fidelity Magellan underperformed because it had too much cash. As a result of the weak performance, the manager was fired! But no one ever seems to get fired for bad stock-picking. The takeaway in this game ever since that high-profile firing was: Don’t dare get caught with too much cash. That’s why you see and hear all of these fund managers who have lukewarm views walking around with massively long-biased portfolios.
I grew up in a different time. I only shorted when I had an edge — I can’t short at all right now by contract, but back when I could, I didn’t short just for the sake of having some shorts on against longs. I don’t care about not having enough exposure; I care about losing money!
If I were you and I didn’t like the market or didn’t have any-thing that compelling to buy — as defined by a willingness to buy it down if the stock keeps going lower — I would go with cash. It’s never wrong when you don’t like the tape or when you can’t find anything that truly makes sense for you.
At the time of publication, Cramer was long Anheuser-Busch.
No Woulda, Shoulda, Couldas
Cramer’s Twenty-five rules for investing
Number 1 Number 2 Number 3
Number 4 Number 5 Number 6
Logo Width=3˝ Logo Width=2˝
Logo Width=0.75˝ Logo Width=0.5˝
Logo Width=1.5˝
Logo Width=1˝
View Our Premium Services
9
Rule 13
Your head matters in this game. You need to have it on right every day if you are going to see opportunities and act on them. Yet so many of us have heads clouded with thoughts that genuinely throw us off target and make us do the wrong thing.
The most damaging recurring thought you can have is this: “If only I ...” — you can fill in the rest. As in, “If only I had acted sooner on Electronic Arts.” Or, “I should have pulled the trig-ger on Nvidia ahead of that quarter.” Or, “I could have made a fortune if I had stayed short that Sun Microsystems.”
Don’t get hung up on the woulda, shoulda, couldas.
This is wasted, damaging emotion. It is destructive to the pos-itive psychology you need when you are making investment decisions. For a long time, I took it to an extreme. I would sit and be mesmerized by a couple of big misses, by things that I got wrong. I would be obsessed, hitting up the big miss over and over again.
Not anymore. With the help of my wife, the Trading Goddess, I was able to see just how destructive such a pattern of think-ing is. In fact, I have had to build in methods of tricking my mind into not playing this game.
A while ago, I absorbed a terrible loss in Charter at the $2 level. I knew that to keep myself from thinking “I could have sold the stock at $4 and change for a nice gain,” I had to take Charter off my screen. I do that with all stocks that go up huge after I leave them or that have gone down huge and I had to take the loss for fear that they then will rally and further shatter my confidence.
If you are like me, and you need help curbing this kind of de-structive thinking, go to that extreme; take the stocks off your monitor or your portfolio watch. You will be surprised how much better you perform when you stop the woulda, shoulda, couldas.
At the time of publication, Cramer had no positions in the stocks mentioned.
Expect, Don’t Fear CorrectionsRule 14
You’d think that after the dozens of corrections we’ve had in the last 20 years, we would get used to the process. You would think that we would say, “Let’s prepare for the correc-tion because it has to be right around the corner.” Yet most people I know act as if corrections are total shockers, the type of thing that never happens.
To me, they are like the rain. I expect it has to rain. I prepare for it. When it comes, I am ready. I have an umbrella and a coat or I stay indoors.
Expect corrections; don’t be afraid of them.
Of course, corrections happen at allegedly unexpected times. The last few we had were preceded by terrific days during which we made lots of money and all systems seemed go.
That’s when I worry most. I used to have a rule at my hedge fund: When I made 2% in a day on the upside, I knew I was too exposed, I knew I was too long. I knew that my portfolio would kill me if we caught a storm. So as the market lifted, or if my performance was swinging too much to the upside, I would pull back, sometimes furiously, into strength, so I would be ready for that big down day.
Sometimes it never occurred, and I had to swallow my pride days later and come back in. But when it did occur, I outper-formed by so much that my partners thought I was a genius. Plus, I was ready to buy things with the cash I had taken off the table.
For example, let’s take the oils and the oil drillers, companies like ChevronTexaco, ExxonMobil, Halliburton and Schlumberg-er. I like to pick on them because they are classic rally/correc-tion stocks. When these stocks were ramping every single day in early 2005, I knew we were setting ourselves up for a fall. So I did my best to scale out into strength.
I felt terribly naked when, for example, Kerr-McGee spiked to $81-plus and I had none left because I had been selling into strength. Sure enough, though, a week later, and it was
Cramer’s Twenty-five rules for investing
Number 1 Number 2 Number 3
Number 4 Number 5 Number 6
Logo Width=3˝ Logo Width=2˝
Logo Width=0.75˝ Logo Width=0.5˝
Logo Width=1.5˝
Logo Width=1˝
View Our Premium Services
10
already below where I had sold it. If I liked it so much, I could have bought it back.
You may not know when a storm might strike. But we do have barometric readings that help immensely. When the S&P’s proprietary oscillator registers plus 5, that signals to me a level of overbought that I regard as dangerous and I pull back aggressively and wait for a correction. That might mean that if I owned a portfolio of Intel, PNC Financial, Electronic Arts and Procter & Gamble, I might be selling up to half of those posi-tions, no matter what, in order to be ready for the storm.
If the rough weather doesn’t come, I underperform on the up-side. But think of this: I compounded at 24% after all fees for my hedge fund career, about twice what the market did during a long stretch in which it was pretty darned good. The only empirical conclusion: My method of avoiding the big down days more than made up for having less exposure on the big ramps up. Don’t Forget About BondsRule 15
“Where are the bonds?” That’s how I used to begin every phone conversation when I was on the road, away from my desk, back when I ran my hedge fund.
Yet people forget the bond market all the time. They forgot it in 2000, even though it told them the economy was softening. They forgot it in 2001, when it was clear that the cash rates were too competitive to stocks and would cause a massive selloff. That’s why I say:
Don’t forget bonds.
I was trained to focus on bonds because bonds are the com-petition to stocks, the competition I most fear. When short-term rates go sky-high, you have to expect companies that had been bought for good yields, stocks like Bank of America or BP, will sell off.
When long-term rates fall to 4%, you have to believe that the economy may be too soft to own deep cyclicals or that stocks that have high yields, like utilities — I like to watch Duke En-
ergy — will be on the move.
You need to watch more than the stocks. If this were basket-ball, I would be saying that if you just watch the man with the ball, let’s call him Citigroup, and you don’t watch what the others are doing on defense — the bonds — there’s no way you are getting to the basket. The men without the ball — the bond market — can determine the action.
Many people who got in this game in the last decade still don’t even know what bonds are. They are troubled when you say bonds went up today. They think that means interest rates are going up rather than what it really means, which is that interest rates are going down. If you don’t understand how bonds work, I think you will not be able to make nearly as much money as if you do.
By the way, a lot of younger managers think they only need to think about bonds if they own Washington Mutual, American International Group or Fannie Mae.
They don’t think bonds matter with a portfolio of Research In Motion, eBay or Qualcomm.
Wrong! When interest rates move significantly higher, no one’s going to pay a lot for the future earnings growth stocks provide.
So keep your eye on the ball, and on the men without it. Never Subsidize Losers With Winners Rule 16
Professionals and amateurs alike hate selling their dogs. They keep hoping, keep assuming, that a sinking stock is wrong in its direction. They rationalize that the weakness or lack of interest they see is and will be fleeting, and that people soon will recognize the value that the holder sees in the stock.
That’s all well and good, until you need money.
Most fund managers have fabulous marketing teams that are able to hype their funds regardless of performance. Despite that and despite the shameless way this industry supports just
Cramer’s Twenty-five rules for investing
Number 1 Number 2 Number 3
Number 4 Number 5 Number 6
Logo Width=3˝ Logo Width=2˝
Logo Width=0.75˝ Logo Width=0.5˝
Logo Width=1.5˝
Logo Width=1˝
View Our Premium Services
11
about anyone who runs money if the money-runner is willing to kick back to the sources of funds, managers do get cash calls. They periodically have to redeem shares they own for cash to send back to unlucky investors.
When they do, that tendency to keep the dogs develops a sinister side: Good stocks get sold to subsidize the losers. You then get a self-fulfilling spiral as the bad stocks stay bad. They usually keep going down. And the fund, without the good stocks, keeps sinking. They never learn my rule: Never subsidize losers with winners.
Individuals do the same thing. They have only a finite amount of capital to invest. Rather than take the medicine — the loss — they hold on to the losers and sell their winners.
My advice to anyone who is stuck in this position is quite simple: Sell the losers and wait a day. If you really want them, go buy them back the next day. I also am certain that you never will.
At the time of publication, Cramer held no positions in stocks mentioned.
Check Hope at the Door Rule 17
When I hear the word “hope,” as in, “I hope that doomed stock du jour will come back to where I bought it so I can sell it,” I get furious. Always remember:
Hope is not part of the equation.
Don’t “hope” for anything. Hope is emotion, pure and simple. And this is not a game of emotion, other than to take the other side of the desperate. Yet, I hear “hope” more than any other word, particularly with troubled tech stocks. Those stocks are filled with hopeful people betting that something good eventu-ally will happen that will drive the stocks higher.
Hoping and praying are excellent things in religion. They are integral to sports. You know that the coaches of some of these come-from-behind NCAA men’s basketball teams keep players motivated through hope.
But hope is a mistaken emotion in our business. It supplants reason, it supplants rigor — especially when it comes to low-dollar-amount stocks.
No company ever set out to have a low-dollar-amount stock. The companies fight like heck not to have them. When they have them, it is a judgment rendered by the market that is harsh, difficult to accept and ultimately, far more right than wrong. When you suffuse your thinking with hope, you end up holding on for something that most likely will never occur. Cut your losses and move on.
Remember, we don’t care where a stock has been, we care where it is going, and it is most likely headed down if you are hoping.
At the time of publication, Cramer held no positions in stocks mentioned.
Be FlexibleRule 18
The most important rule of all is:
Be flexible.
You have to be flexible because business, by nature, is dy-namic, not static. Things change. Markets change. Competi-tors start new price wars to win share. Companies execute poorly. Customers cancel orders. Events happen that make buying decisions more difficult or postpone them.
Of course, our buy-and-hold brainwashing totally precludes many of us from ever thinking like this. We have made up our minds that things are great for Coca-Cola, say, and we don’t want the facts to get in the way of the story. Or we decided in 2000 that Cisco was a winning stock and we are not going to be dissuaded by the change in the fundamentals to sell it. Our “love” for stocks is so misplaced in this rough-and-tumble world of business.
Let me tell you a story of what happened to me a couple of years ago by way of illustration. I thought that Charter Com-munications would be a terrific stock if the largest shareholder would simply pony up more money with the rest of us to
Cramer’s Twenty-five rules for investing
Number 1 Number 2 Number 3
Number 4 Number 5 Number 6
Logo Width=3˝ Logo Width=2˝
Logo Width=0.75˝ Logo Width=0.5˝
Logo Width=1.5˝
Logo Width=1˝
View Our Premium Services
12
improve the balance sheet.
Instead, the largest shareholder took a powder and the com-pany went to hedge funds and offered them the right to short as much common as they wanted to in return for lending them money. The hedge funds obliged. If the company had adopted my funding method, or if the company simply had done a huge equity offering, we would be looking at a win, not a loss. But the company made the wrong move and the stock went from being a good stock to a bad one.
Many people thought that I had gone from being a good stock picker to a bad stock picker because of Charter. Frankly, I think that management and the largest shareholder made moves that weren’t rational. It’s hard to invest with someone who exhibits irrational behavior after that person had not exhibited such behavior before. So I had to cut my losses and run. I mention all of this because the unwillingness to recog-nize this turn for the worse, as bad as it was, would have led to much larger losses than I already had accrued in the stock. This is what happens if you are inflexible (see Rule No. 18), too, if you believe too much and don’t shift when it’s clear that management doesn’t care.
Stay flexible and recognize the vicissitudes of the market and of individual businesses. Or, own bonds.
Your call, as always.
At the time of publication, Cramer held no positions in stocks mentioned.
When the Chiefs Retreat, So Should You Rule 19
Lots of guys had lots of reasons to sell Enron. I only needed one of them: The CEO quit for personal reasons.
CEOs don’t quit for personal reasons. CFOs don’t quit for personal reasons. These are fabulous jobs. You get them after giving up much of what people enjoy about life, such as fam-ily, friends and nights out. Competition is so fierce for these positions that when you finally land one, you don’t up and leave. You leave because something’s wrong at the company. Hence, my rule:
When high-level people quit a company, something is wrong.
“Aha!” you say, “I know a CEO who quit because he had an epiphany about climbing K2.” Or, “I know a CFO who left because she wanted to spend more time with her family.”
Fine. There are exceptions.
This is a game about the rule, not the exception. There will always be some situation in which it is a mistake to sell when a high-level person leaves. I don’t care.
As you can tell, if you have read the rules to date, I am giving you the stuff that has kept me in the game all these years, that literally has kept me from losing more money than I have made.
In the midst of its scandal, AIG felt like Enron to me. We have no idea what kind of reserves AIG really has at all, and the high-level departures are unnerving. This one seems like Fan-nie Mae at best, Enron at worst.
This is why on some sleepy August night with Enron at $47 a share, I told everyone and anyone that I would sell it nine ways to Sunday because Jeffrey Skilling, the man who would have given his eye teeth to get his CEO job, suddenly quit. Of course, there were those who said, “Cramer, if you had done more homework, you could have gotten out at $90.” Yeah, maybe. I didn’t.
I didn’t keep you in till zero, though, either.
At the time of publication, Cramer held no positions in stocks mentioned.
Giving Up on Value Is a SinRule 20
Patience is a virtue — giving up on value is a sin.I see so many people throwing in the towel on companies that have real assets and real worth just because they aren’t work-ing now, and it angers me. I recall an interview I did a year or so ago with the CEO of Superior Industries, a wheelmaker for auto companies. At the time, its stock was at a 52-week low. It had a big short position. It was getting lumped in with ne’er-
Cramer’s Twenty-five rules for investing
Number 1 Number 2 Number 3
Number 4 Number 5 Number 6
Logo Width=3˝ Logo Width=2˝
Logo Width=0.75˝ Logo Width=0.5˝
Logo Width=1.5˝
Logo Width=1˝
View Our Premium Services
13
do-well companies.
And I asked myself, “Why sell that one? It’s already down so much, it has a clean balance sheet, it can make acquisi-tions, buy back shares, do so many things.” But people didn’t want to wait until the cycle turned to get the profit that most certainly would come to those who waited for Superior. That’s because it was cheap and good. It was cheap because it sold at book value; it was good because it had plenty of business.
Or take the situation I see developing in banks like J.P. Mor-gan and PNC. If the Fed doesn’t tighten forever — which it won’t — at a certain point, the value in these banks will be realized. Great brands, great branches.
But no one cares.
At any given moment, I like to have a portfolio of what’s work-ing now and what will work in the future. I think that after 16 tightenings, you have to start thinking that the Fed will have an impact and when it does, the Fed will be through. When the Fed is through, you are going to want to own the financials. I think they are a lot easier to own now than Phelps Dodge or U.S. Steel are.
It takes patience. Most don’t have it. If you don’t, frankly, I think you should let someone who has patience run your money. You don’t deserve to.
And by the way, stocks like EMC and Cisco and Sun Micro don’t qualify. They are expensive, not cheap. They don’t repre-sent value ... at these prices.
Be a TV Critic Rule 21
Do you know how financial television really works?
I’ll tell you. At times, it can just be a gigantic booking machine. That’s right, people are scrambling to get money managers on who can talk, almost regardless of how good they are. And lots of times, executives say whatever they want on air, know-ing that they can get away with it.
I accept this as a given. I accept that what I hear on television is probably right, but no more than that. That’s the world in which we live. That’s the reason I follow this tenet:
Just because someone says it on TV doesn’t make it so.
Back in early 2005, a money manager came on television and knocked down Sirius by saying some negative things about it, some of which were true. I accepted the fact that he was short it and that he probably shorted the stock right before he went on and that probably what he said wasn’t right. Did you think he was right?
I think you are naive if you simply believe what you hear. The vetting process to get on television simply isn’t all that rigor-ous. When a manager says he likes EMC or Sun Microsys-tems, do you ask yourself where he bought it? Do you think he might be selling it?
When someone comes on and says that Elan is a buy, do you think, “He’s really stuck in that pig”?
If you answered yes to these inquiries, then you are armed for the daily chatter. Wait 30 Days After Warnings Rule 22
Few rules have saved me more than the 30-day preannounce-ment rule.
When Tibco Software preannounces a bad quarter, do you rush to buy it? Are you someone who put money to work in Waters right after its vicious preannouncement in spring 2005?
If you are, this rule is for you:
Always wait 30 days after an earnings preannouncement before you buy.
I designed it because I recognize how compelling some of these price adjustments are, but they often are not deep enough to make the stocks ultimately attractive.
Cramer’s Twenty-five rules for investing
Number 1 Number 2 Number 3
Number 4 Number 5 Number 6
Logo Width=3˝ Logo Width=2˝
Logo Width=0.75˝ Logo Width=0.5˝
Logo Width=1.5˝
Logo Width=1˝
View Our Premium Services
14
Here’s why. When a company preannounces a bad quarter, it isn’t just looking at the past. It is looking at its order book, its future. Believe me, if there were any hope that the company wouldn’t have to preannounce — hope in the form that maybe something could get better, not worse in the next 30 days — the company would wait.
Preannouncements signal ongoing weakness. That’s why I like to wait 30 days to see if anything has gotten better before I pull the trigger to buy.
Sure, I will miss some great opportunities. Most of the time, though, after 30 days, I find that there is more woe and an-other leg down! If there isn’t, then I might miss a point or even 2, but I will be on terra firma. That’s the only thing you want to be stepping on in any market, including this one.
Beware the Wall Street Hype Rule 23
Amateurs and professionals alike simply don’t have enough respect for the Wall Street promotion machine.
They don’t realize that balls can stay in the air much longer than they should. They don’t understand that analysts and firms get behind stocks — sometimes irrationally, sometimes greedily — and they can keep the stocks propelled in an up direction well beyond reason. That’s why I say,
Never underestimate the Wall Street promotion machine.Consider American International Group and Fannie Mae. Here are two companies with extensive banking opportuni-ties dangling from one side and good track records hanging from the other. These had been two lovey blankets for the sell side for so long that they wouldn’t give them up. Both stocks stayed up far too long, even in the post-Spitzer era, because the analysts viewed it as their job to keep the stocks up.
Now, I don’t mind admitting that things are better now than they used to be. When I owned Cabela’s right after it came public, the analysts who brought it public bent over backward not to recommend the stock, to the point that I missed the promotion machine.
Analysts now have some degree of conscience and are able to separate themselves from being flunkies for banking. But that doesn’t mean they won’t fall in love with some stocks and do everything they can to praise them long after they shouldn’t. It tends to happen particularly to winners, stocks like the online education companies or the biotechs or some of the doggier software companies. The hope never ends. The hype never ends. Not until the cracks are so obvious that it is too late to get out.
In particular, when you short a stock remember that an analyst will twist any data point into a positive to get a stock juiced. Again, that’s his job. Don’t think badly of him; just be ready to reload when he does it. Explain Your Picks Rule 24
One of the worst things that ever happened to stock pick-ing was the Internet, because it took away one of the most important brakes on the process, one of the most important warning systems, which is talking to someone about a buy. Now you can, with a stroke of a key, buy the stock of Sirius or Avaya without ever having to explain to another human being why you are doing so. This is why you should always:
Be able to explain your stock picks to someone else.
Buying stocks is a solitary event — too solitary. As I love to say, we all are prone to making mistakes, sometimes big ones. One way to cut down on these mistakes is to force yourself to articulate to someone else why you like Elan or why you think Biogen Idec is a winner.
When I was at my hedge fund, I always made every portfolio manager sell me the stock, literally sell it to me like a salesper-son, before I would buy it. If you are in a position where you are picking stocks yourself, get someone to listen to you and let you articulate your reasoning.
Recently, one of my email correspondents said that her daughter bought the stock of Sony because of the Xbox. Ouch! That would be Microsoft that makes the Xbox. A mis-take like that would have been picked up by most people who

Cramer’s Twenty-five rules for investing
Number 1 Number 2 Number 3
Number 4 Number 5 Number 6
Logo Width=3˝ Logo Width=2˝
Logo Width=0.75˝ Logo Width=0.5˝
Logo Width=1.5˝
Logo Width=1˝
View Our Premium Services
15
articulated their reasoning to others. The simple selling of the idea first, to someone else, can help you spot flaws.
I also like to ask people, “What’s going to make this EMC go up, what’s the catalyst?” Or, “Have we missed the move in this EnCana already?” And, “What’s your edge?” These are among the questions I ask. If you can’t answer, you shouldn’t be buying.
At time of publication, Cramer was long Microsoft.
There’s Always a Bull Market Rule 25
I like to end every television and radio show I have with this signoff: “There is always a bull market somewhere, and I will try to find it for you.” I say that because it’s true.
Something is always working! Maybe it’s gold, so you buy best-of-breed Newmont Mining. Maybe it’s oil, so you buy some Halliburton. Maybe it’s the chemical complex, so you pick up some Dow Chemical. I’ve seen moments where the only stocks in bull mode were in your supermarket or your medicine chest, stocks like Anheuser-Busch and PepsiCo.
Now, I know that might mean you have to do some trading. It might mean that you may have to look further and harder than your time and your inclination allow. That’s OK, too. What matters is that you don’t simply default to what’s in bear mode because you are time-constrained or intellectually lazy.
This is not just a criticism of do-it-yourselfers. Many profes-sionals stuck with the leg irons of the wrong tech stocks long after they should have. If they looked around, they might have spotted the bull market in oil, and bought something as simple as Exxon Mobil or as complex but rewarding as Ultra Pete.
Just remember:
There is always a bull market somewhere.
I will always end my shows with this tag line because it is vital for me to get you to think more opportunistically than the aver-age investor does.
Oh, and by the way, it has the added advantage of being true. For 25 years there has always been a sector that works. You just have to find it. I know it, and I am honored if you will let me help you.
At the time of publication, Cramer was long Halliburton.
The preceding report was previously published and references to specific stocks may no longer be current. The Ratings Reports on the pages that follow were originally published on the dates specified therein. This report may not be disseminated or redistributed in any manner.
TheStreet is a publisher. No content published constitutes a recommendation that any particular investment security, portfolio of securities, transaction or investment strategy is suitable for any specific person. None of the writers or contributors will advise you personally concerning the nature, potential, value or suitability of any particular invest-ment, security, portfolio of securities, transaction, investment strategy or other matter. Do not attempt to contact them seeking personalized investment advice, which they cannot provide. To the extent that any of the content published may be deemed to be invest-ment advice, such information is impersonal and not tailored to the investment needs of any specific person. The views expressed are the authors’ own opinions.
Like all investment strategies, trading in stocks involves risk and volatility. Past perfor-mance is not an indication of future results. Actual results will be based on a consumer’s individual purchase and sale decisions. For full information about historic performance of the Action Alerts PLUS portfolio, please visit http://www.TheStreet.com/staticFull/aap_performance.html
The Ratings Reports that follow provide detailed assessments of current or former charitable trust portfolio holdings illustrative of the following Rules:
Rule 1: Bulls, Bears Make Money, Pigs Get Slaughtered Ratings Report: Prudential Financial Inc. (PRU) Rule 4: Buy Damaged Stocks, Not Damaged Companies Ratings Report: Express Scripts, Inc. (ESRX) Rule 8: Buy Best-of-Breed Companies Ratings Report: Coca-Cola Co. (KO)
PRUDENTIAL FINANCIAL INCPRUNYSE:
February 26, 2012
BUY HOLD SELL
BUYBUYBUYBUYBUYRATING SINCE 12/06/2011
TARGET PRICE $70.73A+ A A- B+ B B- C+ C C- D+ D D- E+ E E- F
Annual Dividend Rate$1.45
Annual Dividend Yield2.36%
Beta2.33
Market Capitalization$28.8 Billion
52-Week Range$42.45-$66.57
Price as of 2/23/2012$61.24
Sector: Financial Services Sub-Industry: Life & Health Insurance Source: S&P
This report is for information purposes only and should not be considered a solicitation to buy or sell any security. Neither TheStreet.com Ratings nor any other party guarantees itsaccuracy or makes warranties regarding results from its usage. Redistribution is prohibited without the express written consent of TheStreet.com Ratings, Inc. Copyright(c) 2006-2010.All rights reserved.
PAGE 1Report Date: February 26, 2012
PRU BUSINESS DESCRIPTIONPrudential Financial, Inc., through its subsidiaries,
provides various financial products and services in
the United States, Asia, Europe, and Latin America.
The company operates through three divisions: The
U.S. Retirement Solutions and Investment
Management, The U.S.
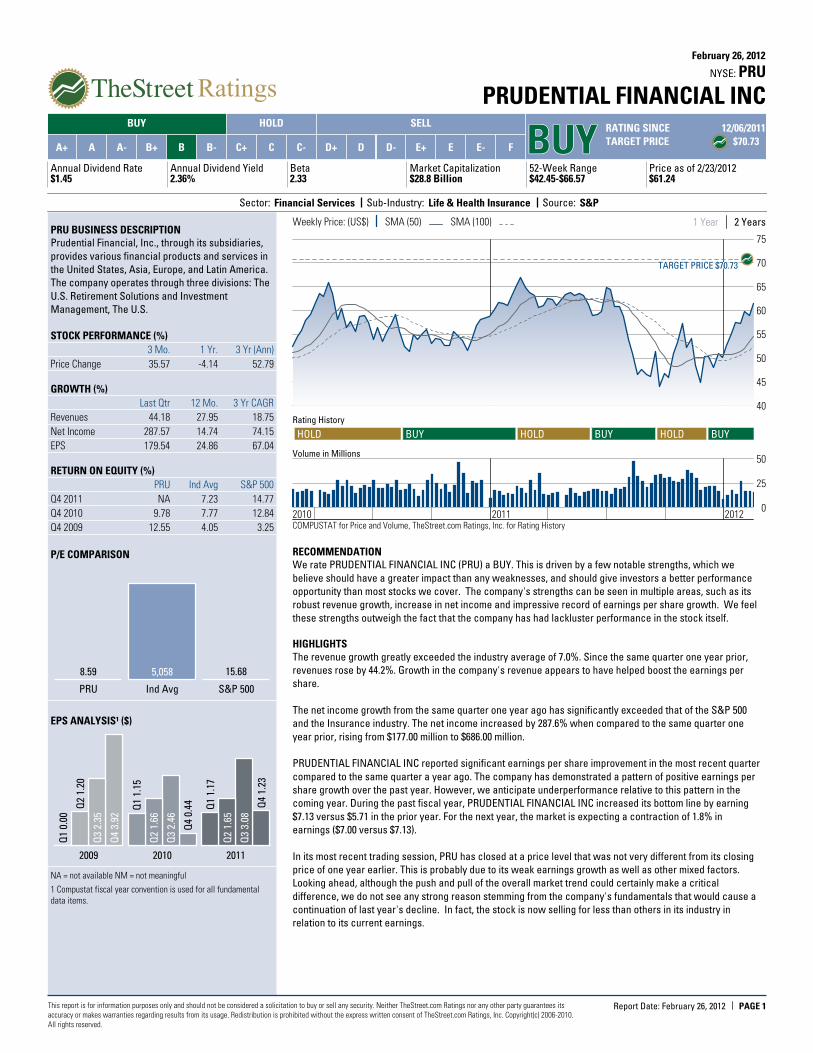
STOCK PERFORMANCE (%)
3 Mo. 1 Yr. 3 Yr (Ann)
Price Change 35.57 -4.14 52.79
GROWTH (%)
Last Qtr 12 Mo. 3 Yr CAGR
Revenues 44.18 27.95 18.75
Net Income 287.57 14.74 74.15
EPS 179.54 24.86 67.04
RETURN ON EQUITY (%)
PRU Ind Avg S&P 500
Q4 2011 NA 7.23 14.77
Q4 2010 9.78 7.77 12.84
Q4 2009 12.55 4.05 3.25
P/E COMPARISON
8.59
PRU
5,058
Ind Avg
15.68
S&P 500
EPS ANALYSIS¹ ($)
2011
Q4
1.23
Q3
3.08
Q2
1.65
Q1
1.17
2010
Q4
0.44
Q3
2.46
Q2
1.66
Q1
1.15
2009
Q4
3.92
Q3
2.35
Q2
1.20
Q1
0.00
NA = not available NM = not meaningful
1 Compustat fiscal year convention is used for all fundamentaldata items.
Weekly Price: (US$) SMA (50) SMA (100) 2 Years1 Year
2010 2011 2012
40
45
50
55
60
65
70
75
TARGET PRICE $70.73TARGET PRICE $70.73TARGET PRICE $70.73TARGET PRICE $70.73TARGET PRICE $70.73
Rating History
HOLD BUY HOLD BUY HOLD BUY
0
25
50Volume in Millions
COMPUSTAT for Price and Volume, TheStreet.com Ratings, Inc. for Rating History
RECOMMENDATIONWe rate PRUDENTIAL FINANCIAL INC (PRU) a BUY. This is driven by a few notable strengths, which we
believe should have a greater impact than any weaknesses, and should give investors a better performance
opportunity than most stocks we cover. The company's strengths can be seen in multiple areas, such as its
robust revenue growth, increase in net income and impressive record of earnings per share growth. We feel
these strengths outweigh the fact that the company has had lackluster performance in the stock itself.
HIGHLIGHTS
The revenue growth greatly exceeded the industry average of 7.0%. Since the same quarter one year prior,
revenues rose by 44.2%. Growth in the company's revenue appears to have helped boost the earnings per
share.
The net income growth from the same quarter one year ago has significantly exceeded that of the S&P 500
and the Insurance industry. The net income increased by 287.6% when compared to the same quarter one
year prior, rising from $177.00 million to $686.00 million.
PRUDENTIAL FINANCIAL INC reported significant earnings per share improvement in the most recent quarter
compared to the same quarter a year ago. The company has demonstrated a pattern of positive earnings per
share growth over the past year. However, we anticipate underperformance relative to this pattern in the
coming year. During the past fiscal year, PRUDENTIAL FINANCIAL INC increased its bottom line by earning
$7.13 versus $5.71 in the prior year. For the next year, the market is expecting a contraction of 1.8% in
earnings ($7.00 versus $7.13).
In its most recent trading session, PRU has closed at a price level that was not very different from its closing
price of one year earlier. This is probably due to its weak earnings growth as well as other mixed factors.
Looking ahead, although the push and pull of the overall market trend could certainly make a critical
difference, we do not see any strong reason stemming from the company's fundamentals that would cause a
continuation of last year's decline. In fact, the stock is now selling for less than others in its industry in
relation to its current earnings.
PRUDENTIAL FINANCIAL INCPRUNYSE:
February 26, 2012
Sector: Financial Services Life & Health Insurance Source: S&P
Annual Dividend Rate
$1.45
Annual Dividend Yield
2.36%
Beta
2.33
Market Capitalization
$28.8 Billion
52-Week Range
$42.45-$66.57
Price as of 2/23/2012
$61.24
This report is for information purposes only and should not be considered a solicitation to buy or sell any security. Neither TheStreet.com Ratings nor any other party guarantees itsaccuracy or makes warranties regarding results from its usage. Redistribution is prohibited without the express written consent of TheStreet.com Ratings, Inc. Copyright(c) 2006-2010.All rights reserved.
PAGE 2Report Date: February 26, 2012
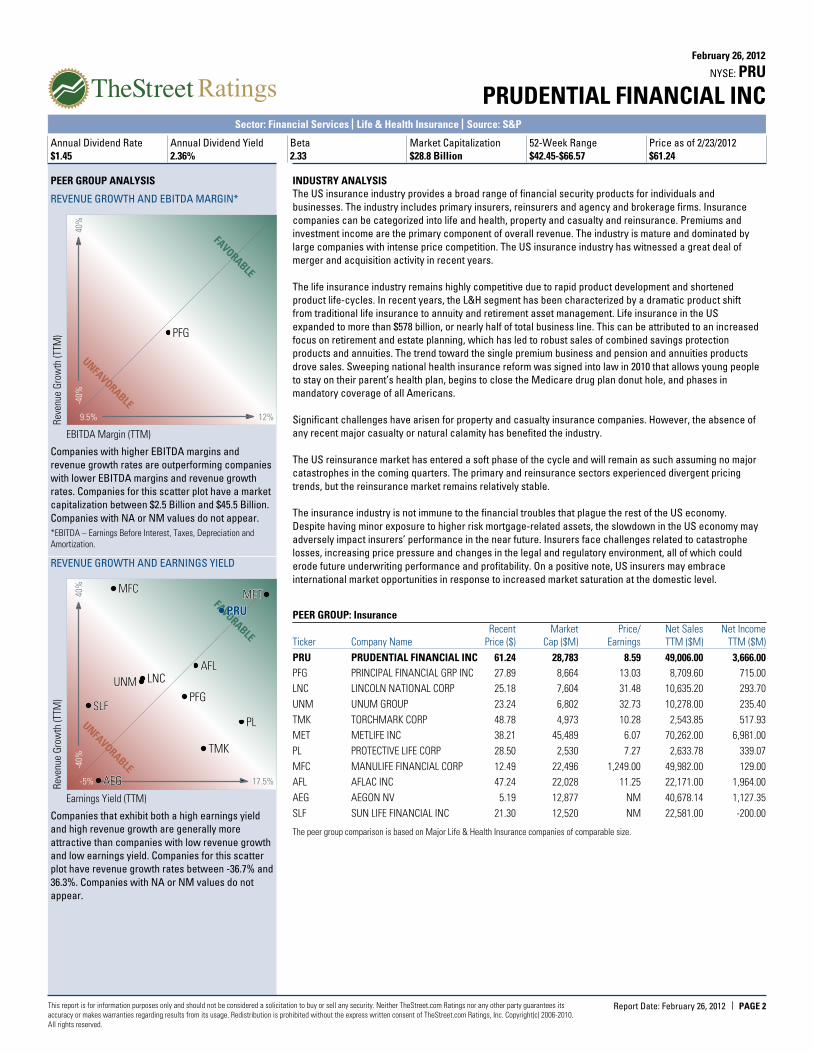
PEER GROUP ANALYSIS
REVENUE GROWTH AND EBITDA MARGIN*
EBITDA Margin (TTM)
Rev
enue
Gro
wth
(TTM
)
-40%
40%
12%9.5%
FAVORABLE
UNFAVORABLE
PFGPFGPFGPFGPFG
Companies with higher EBITDA margins and
revenue growth rates are outperforming companies
with lower EBITDA margins and revenue growth
rates. Companies for this scatter plot have a market
capitalization between $2.5 Billion and $45.5 Billion.
Companies with NA or NM values do not appear.
*EBITDA – Earnings Before Interest, Taxes, Depreciation andAmortization.
REVENUE GROWTH AND EARNINGS YIELD
Earnings Yield (TTM)
Rev
enue
Gro
wth
(TTM
)
-40%
40%
17.5%-5%
FAVORABLE
UNFAVORABLE
PFGPFGPFGPFGPFG
LNCLNCLNCLNCLNCUNMUNMUNMUNMUNM
TMKTMKTMKTMKTMK
METMETMETMETMET
PLPLPLPLPL
MFCMFCMFCMFCMFC
AFLAFLAFLAFLAFL
AEGAEGAEGAEGAEG
SLFSLFSLFSLFSLF
PRUPRUPRUPRUPRU
Companies that exhibit both a high earnings yield
and high revenue growth are generally more
attractive than companies with low revenue growth
and low earnings yield. Companies for this scatter
plot have revenue growth rates between -36.7% and
36.3%. Companies with NA or NM values do not
appear.
INDUSTRY ANALYSISThe US insurance industry provides a broad range of financial security products for individuals and
businesses. The industry includes primary insurers, reinsurers and agency and brokerage firms. Insurance
companies can be categorized into life and health, property and casualty and reinsurance. Premiums and
investment income are the primary component of overall revenue. The industry is mature and dominated by
large companies with intense price competition. The US insurance industry has witnessed a great deal of
merger and acquisition activity in recent years.
The life insurance industry remains highly competitive due to rapid product development and shortened
product life-cycles. In recent years, the L&H segment has been characterized by a dramatic product shift
from traditional life insurance to annuity and retirement asset management. Life insurance in the US
expanded to more than $578 billion, or nearly half of total business line. This can be attributed to an increased
focus on retirement and estate planning, which has led to robust sales of combined savings protection
products and annuities. The trend toward the single premium business and pension and annuities products
drove sales. Sweeping national health insurance reform was signed into law in 2010 that allows young people
to stay on their parent’s health plan, begins to close the Medicare drug plan donut hole, and phases in
mandatory coverage of all Americans.
Significant challenges have arisen for property and casualty insurance companies. However, the absence of
any recent major casualty or natural calamity has benefited the industry.
The US reinsurance market has entered a soft phase of the cycle and will remain as such assuming no major
catastrophes in the coming quarters. The primary and reinsurance sectors experienced divergent pricing
trends, but the reinsurance market remains relatively stable.
The insurance industry is not immune to the financial troubles that plague the rest of the US economy.
Despite having minor exposure to higher risk mortgage-related assets, the slowdown in the US economy may
adversely impact insurers’ performance in the near future. Insurers face challenges related to catastrophe
losses, increasing price pressure and changes in the legal and regulatory environment, all of which could
erode future underwriting performance and profitability. On a positive note, US insurers may embrace
international market opportunities in response to increased market saturation at the domestic level.
PEER GROUP: Insurance
Recent Market Price/ Net Sales Net Income
Ticker Price ($)Company Name Cap ($M) Earnings TTM ($M) TTM ($M)
PRU 61.24PRUDENTIAL FINANCIAL INC 28,783 8.59 49,006.00 3,666.00
PFG 27.89PRINCIPAL FINANCIAL GRP INC 8,664 13.03 8,709.60 715.00
LNC 25.18LINCOLN NATIONAL CORP 7,604 31.48 10,635.20 293.70
UNM 23.24UNUM GROUP 6,802 32.73 10,278.00 235.40
TMK 48.78TORCHMARK CORP 4,973 10.28 2,543.85 517.93
MET 38.21METLIFE INC 45,489 6.07 70,262.00 6,981.00
PL 28.50PROTECTIVE LIFE CORP 2,530 7.27 2,633.78 339.07
MFC 12.49MANULIFE FINANCIAL CORP 22,496 1,249.00 49,982.00 129.00
AFL 47.24AFLAC INC 22,028 11.25 22,171.00 1,964.00
AEG 5.19AEGON NV 12,877 NM 40,678.14 1,127.35
SLF 21.30SUN LIFE FINANCIAL INC 12,520 NM 22,581.00 -200.00
The peer group comparison is based on Major Life & Health Insurance companies of comparable size.
PRUDENTIAL FINANCIAL INCPRUNYSE:
February 26, 2012
Sector: Financial Services Life & Health Insurance Source: S&P
Annual Dividend Rate
$1.45
Annual Dividend Yield
2.36%
Beta
2.33
Market Capitalization
$28.8 Billion
52-Week Range
$42.45-$66.57
Price as of 2/23/2012
$61.24
This report is for information purposes only and should not be considered a solicitation to buy or sell any security. Neither TheStreet.com Ratings nor any other party guarantees itsaccuracy or makes warranties regarding results from its usage. Redistribution is prohibited without the express written consent of TheStreet.com Ratings, Inc. Copyright(c) 2006-2010.All rights reserved.
PAGE 3Report Date: February 26, 2012
COMPANY DESCRIPTIONPrudential Financial, Inc., through its subsidiaries,
provides various financial products and services in the
United States, Asia, Europe, and Latin America. The
company operates through three divisions: The U.S.
Retirement Solutions and Investment Management, The
U.S. Individual Life and Group Insurance, and The
International Insurance and Investments. The U.S.
Retirement Solutions and Investment Management
division offers individual variable and fixed annuity
products, as well as provides retirement investment and
income products and services to retirement plan
sponsors in the public, private, and not-for-profit sectors.
This division also provides investment management and
advisory services to the public and private marketplace.
The U.S. Individual Life and Group Insurance division
provides individual variable life, term life, and universal
life insurance products; and group life, long-term and
short-term group disability, long-term care, and group
corporate-owned and trust-owned life insurance
products to institutional clients. It also sells accidental
death and dismemberment, and other ancillary
coverages, as well as provides plan administrative
services. In addition, this division offers preferred
provider and indemnity dental coverage plans to clients.
The International Insurance and Investments division
provides international individual life insurance products
in Japan, Korea, and other foreign countries; and
provides proprietary and non-proprietary asset
management and investment advice and services to
retail and institutional clients internationally. In addition,
the company engages in real estate brokerage franchise
business, which involves marketing its franchises to the
real estate companies. Further, it provides institutional
clients and government agencies with various services in
connection with the relocation of their employees.
Prudential Financial was founded in 1875 and is
headquartered in Newark, New Jersey.
PRUDENTIAL FINANCIAL INC
751 Broad St
Newark, NJ 07102-3714
USA
Phone: 973-802-6000
http://www.investor.prudential.com
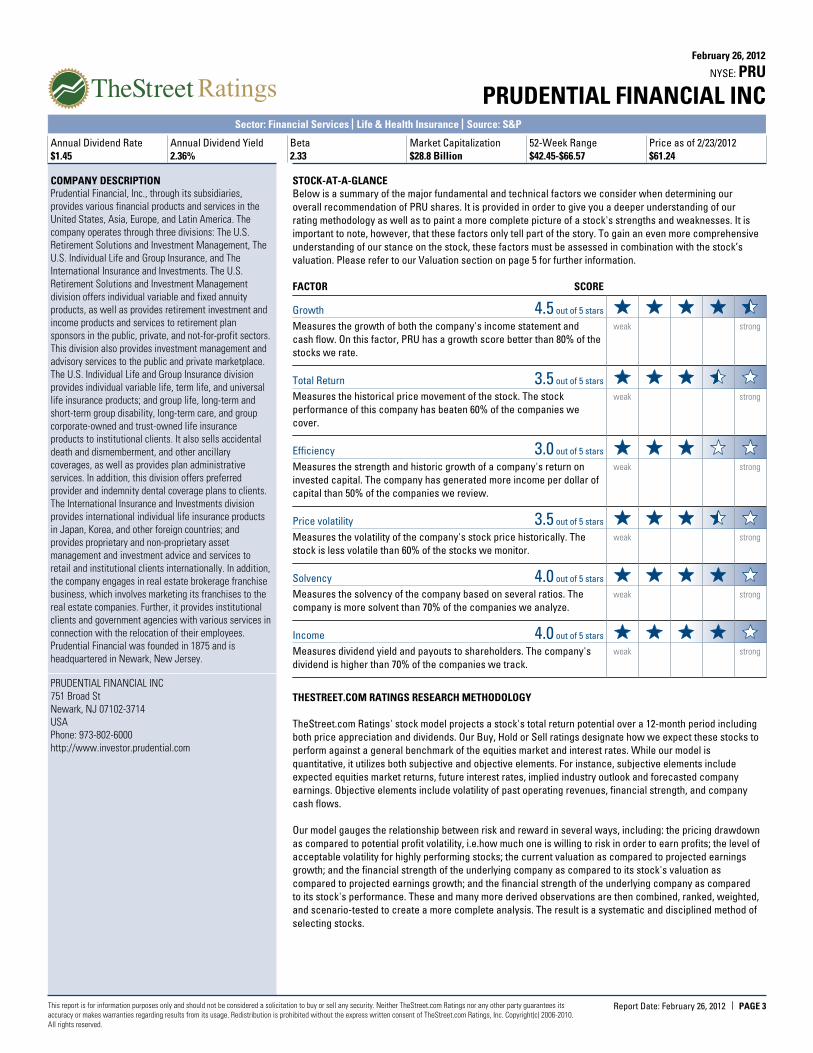
STOCK-AT-A-GLANCEBelow is a summary of the major fundamental and technical factors we consider when determining our
overall recommendation of PRU shares. It is provided in order to give you a deeper understanding of our
rating methodology as well as to paint a more complete picture of a stock's strengths and weaknesses. It is
important to note, however, that these factors only tell part of the story. To gain an even more comprehensive
understanding of our stance on the stock, these factors must be assessed in combination with the stock’s
valuation. Please refer to our Valuation section on page 5 for further information.
FACTOR SCORE
Growth out of 5 stars4.5Measures the growth of both the company's income statement and
cash flow. On this factor, PRU has a growth score better than 80% of the
stocks we rate.
weak strong
Total Return out of 5 stars3.5Measures the historical price movement of the stock. The stock
performance of this company has beaten 60% of the companies we
cover.
weak strong
Efficiency out of 5 stars3.0Measures the strength and historic growth of a company's return on
invested capital. The company has generated more income per dollar of
capital than 50% of the companies we review.
weak strong
Price volatility out of 5 stars3.5Measures the volatility of the company's stock price historically. The
stock is less volatile than 60% of the stocks we monitor.
weak strong
Solvency out of 5 stars4.0Measures the solvency of the company based on several ratios. The
company is more solvent than 70% of the companies we analyze.
weak strong
Income out of 5 stars4.0Measures dividend yield and payouts to shareholders. The company's
dividend is higher than 70% of the companies we track.
weak strong
THESTREET.COM RATINGS RESEARCH METHODOLOGY
TheStreet.com Ratings' stock model projects a stock's total return potential over a 12-month period including
both price appreciation and dividends. Our Buy, Hold or Sell ratings designate how we expect these stocks to
perform against a general benchmark of the equities market and interest rates. While our model is
quantitative, it utilizes both subjective and objective elements. For instance, subjective elements include
expected equities market returns, future interest rates, implied industry outlook and forecasted company
earnings. Objective elements include volatility of past operating revenues, financial strength, and company
cash flows.
Our model gauges the relationship between risk and reward in several ways, including: the pricing drawdown
as compared to potential profit volatility, i.e.how much one is willing to risk in order to earn profits; the level of
acceptable volatility for highly performing stocks; the current valuation as compared to projected earnings
growth; and the financial strength of the underlying company as compared to its stock's valuation as
compared to projected earnings growth; and the financial strength of the underlying company as compared
to its stock's performance. These and many more derived observations are then combined, ranked, weighted,
and scenario-tested to create a more complete analysis. The result is a systematic and disciplined method of
selecting stocks.
PRUDENTIAL FINANCIAL INCPRUNYSE:
February 26, 2012
Sector: Financial Services Life & Health Insurance Source: S&P
Annual Dividend Rate
$1.45
Annual Dividend Yield
2.36%
Beta
2.33
Market Capitalization
$28.8 Billion
52-Week Range
$42.45-$66.57
Price as of 2/23/2012
$61.24
This report is for information purposes only and should not be considered a solicitation to buy or sell any security. Neither TheStreet.com Ratings nor any other party guarantees itsaccuracy or makes warranties regarding results from its usage. Redistribution is prohibited without the express written consent of TheStreet.com Ratings, Inc. Copyright(c) 2006-2010.All rights reserved.
PAGE 4Report Date: February 26, 2012
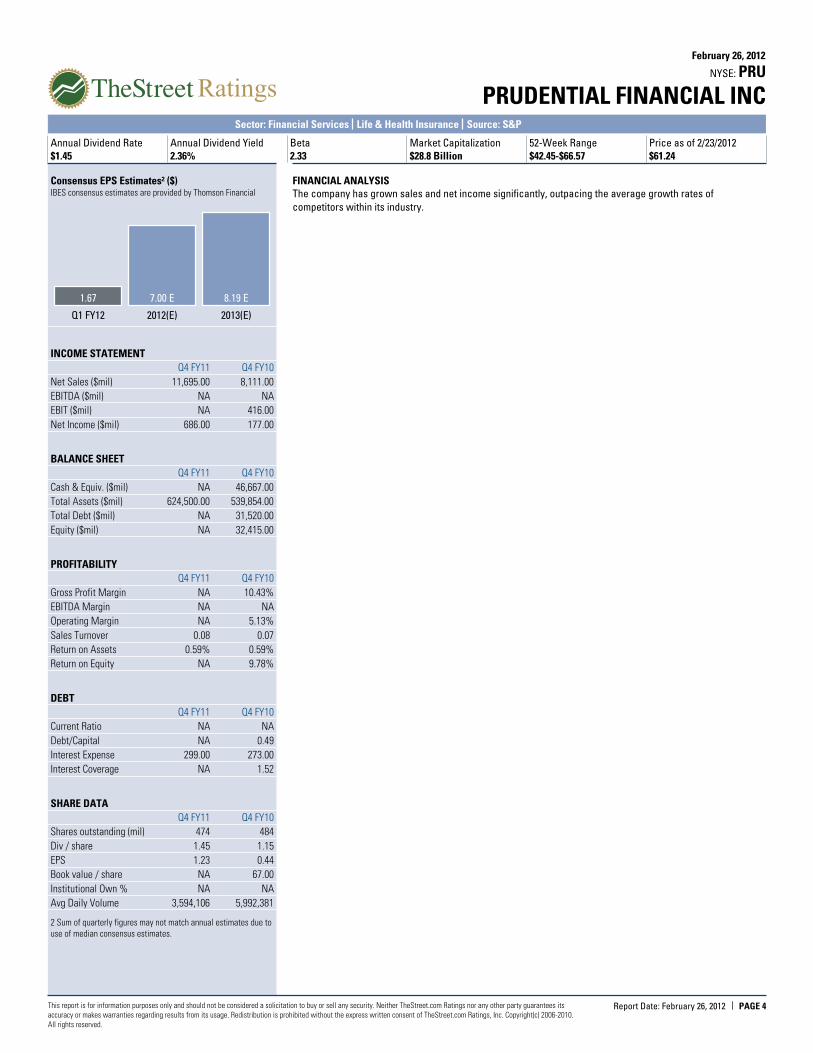
Consensus EPS Estimates² ($)IBES consensus estimates are provided by Thomson Financial
1.67
Q1 FY12
7.00 E
2012(E)
8.19 E
2013(E)
INCOME STATEMENT
Q4 FY11 Q4 FY10
Net Sales ($mil) 11,695.00 8,111.00
EBITDA ($mil) NA NA
EBIT ($mil) NA 416.00
Net Income ($mil) 686.00 177.00
BALANCE SHEET
Q4 FY11 Q4 FY10
Cash & Equiv. ($mil) NA 46,667.00
Total Assets ($mil) 624,500.00 539,854.00
Total Debt ($mil) NA 31,520.00
Equity ($mil) NA 32,415.00
PROFITABILITY
Q4 FY11 Q4 FY10
Gross Profit Margin NA 10.43%
EBITDA Margin NA NA
Operating Margin NA 5.13%
Sales Turnover 0.08 0.07
Return on Assets 0.59% 0.59%
Return on Equity NA 9.78%
DEBT
Q4 FY11 Q4 FY10
Current Ratio NA NA
Debt/Capital NA 0.49
Interest Expense 299.00 273.00
Interest Coverage NA 1.52
SHARE DATA
Q4 FY11 Q4 FY10
Shares outstanding (mil) 474 484
Div / share 1.45 1.15
EPS 1.23 0.44
Book value / share NA 67.00
Institutional Own % NA NA
Avg Daily Volume 3,594,106 5,992,381
2 Sum of quarterly figures may not match annual estimates due touse of median consensus estimates.
FINANCIAL ANALYSISThe company has grown sales and net income significantly, outpacing the average growth rates of
competitors within its industry.
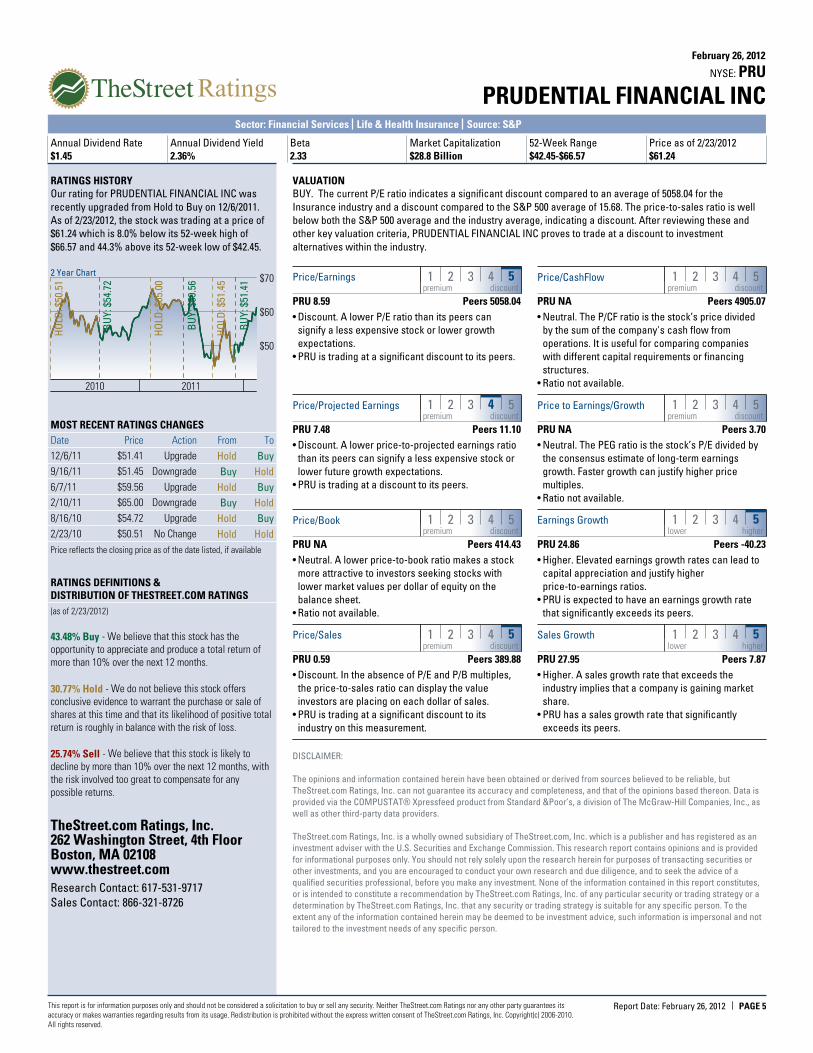
PRUDENTIAL FINANCIAL INCPRUNYSE:
February 26, 2012
Sector: Financial Services Life & Health Insurance Source: S&P
Annual Dividend Rate
$1.45
Annual Dividend Yield
2.36%
Beta
2.33
Market Capitalization
$28.8 Billion
52-Week Range
$42.45-$66.57
Price as of 2/23/2012
$61.24
This report is for information purposes only and should not be considered a solicitation to buy or sell any security. Neither TheStreet.com Ratings nor any other party guarantees itsaccuracy or makes warranties regarding results from its usage. Redistribution is prohibited without the express written consent of TheStreet.com Ratings, Inc. Copyright(c) 2006-2010.All rights reserved.
PAGE 5Report Date: February 26, 2012
RATINGS HISTORYOur rating for PRUDENTIAL FINANCIAL INC was
recently upgraded from Hold to Buy on 12/6/2011.
As of 2/23/2012, the stock was trading at a price of
$61.24 which is 8.0% below its 52-week high of
$66.57 and 44.3% above its 52-week low of $42.45.
2 Year Chart
2010 2011
$50
$60
$70
BU
Y: $
51.4
1
HO
LD: $
51.4
5
BU
Y: $
59.5
6
HO
LD: $
65.0
0
BU
Y: $
54.7
2
HO
LD: $
50.5
1
MOST RECENT RATINGS CHANGES
Date Price Action From To
12/6/11 $51.41 Upgrade Hold Buy
9/16/11 $51.45 Downgrade Buy Hold
6/7/11 $59.56 Upgrade Hold Buy
2/10/11 $65.00 Downgrade Buy Hold
8/16/10 $54.72 Upgrade Hold Buy
2/23/10 $50.51 No Change Hold Hold
Price reflects the closing price as of the date listed, if available
RATINGS DEFINITIONS &DISTRIBUTION OF THESTREET.COM RATINGS
(as of 2/23/2012)
43.48% Buy - We believe that this stock has the
opportunity to appreciate and produce a total return of
more than 10% over the next 12 months.
30.77% Hold - We do not believe this stock offers
conclusive evidence to warrant the purchase or sale of
shares at this time and that its likelihood of positive total
return is roughly in balance with the risk of loss.
25.74% Sell - We believe that this stock is likely to
decline by more than 10% over the next 12 months, with
the risk involved too great to compensate for any
possible returns.
TheStreet.com Ratings, Inc.262 Washington Street, 4th FloorBoston, MA 02108www.thestreet.comResearch Contact: 617-531-9717
Sales Contact: 866-321-8726
VALUATIONBUY. The current P/E ratio indicates a significant discount compared to an average of 5058.04 for the
Insurance industry and a discount compared to the S&P 500 average of 15.68. The price-to-sales ratio is well
below both the S&P 500 average and the industry average, indicating a discount. After reviewing these and
other key valuation criteria, PRUDENTIAL FINANCIAL INC proves to trade at a discount to investment
alternatives within the industry.
1 2 3 4 5Price/Earningspremium discount
PRU 8.59 Peers 5058.04
• Discount. A lower P/E ratio than its peers can
signify a less expensive stock or lower growth
expectations.
• PRU is trading at a significant discount to its peers.
1 2 3 4 5Price/CashFlowpremium discount
PRU NA Peers 4905.07
• Neutral. The P/CF ratio is the stock’s price divided
by the sum of the company's cash flow from
operations. It is useful for comparing companies
with different capital requirements or financing
structures.
• Ratio not available.
1 2 3 4 5Price/Projected Earningspremium discount
PRU 7.48 Peers 11.10
• Discount. A lower price-to-projected earnings ratio
than its peers can signify a less expensive stock or
lower future growth expectations.
• PRU is trading at a discount to its peers.
1 2 3 4 5Price to Earnings/Growthpremium discount
PRU NA Peers 3.70
• Neutral. The PEG ratio is the stock’s P/E divided by
the consensus estimate of long-term earnings
growth. Faster growth can justify higher price
multiples.
• Ratio not available.
1 2 3 4 5Price/Bookpremium discount
PRU NA Peers 414.43
• Neutral. A lower price-to-book ratio makes a stock
more attractive to investors seeking stocks with
lower market values per dollar of equity on the
balance sheet.
• Ratio not available.
1 2 3 4 5Earnings Growthlower higher
PRU 24.86 Peers -40.23
• Higher. Elevated earnings growth rates can lead to
capital appreciation and justify higher
price-to-earnings ratios.
• PRU is expected to have an earnings growth rate
that significantly exceeds its peers.
1 2 3 4 5Price/Salespremium discount
PRU 0.59 Peers 389.88
• Discount. In the absence of P/E and P/B multiples,
the price-to-sales ratio can display the value
investors are placing on each dollar of sales.
• PRU is trading at a significant discount to its
industry on this measurement.
1 2 3 4 5Sales Growthlower higher
PRU 27.95 Peers 7.87
• Higher. A sales growth rate that exceeds the
industry implies that a company is gaining market
share.
• PRU has a sales growth rate that significantly
exceeds its peers.
DISCLAIMER:
The opinions and information contained herein have been obtained or derived from sources believed to be reliable, but
TheStreet.com Ratings, Inc. can not guarantee its accuracy and completeness, and that of the opinions based thereon. Data is
provided via the COMPUSTAT® Xpressfeed product from Standard &Poor’s, a division of The McGraw-Hill Companies, Inc., as
well as other third-party data providers.
TheStreet.com Ratings, Inc. is a wholly owned subsidiary of TheStreet.com, Inc. which is a publisher and has registered as an
investment adviser with the U.S. Securities and Exchange Commission. This research report contains opinions and is provided
for informational purposes only. You should not rely solely upon the research herein for purposes of transacting securities or
other investments, and you are encouraged to conduct your own research and due diligence, and to seek the advice of a
qualified securities professional, before you make any investment. None of the information contained in this report constitutes,
or is intended to constitute a recommendation by TheStreet.com Ratings, Inc. of any particular security or trading strategy or a
determination by TheStreet.com Ratings, Inc. that any security or trading strategy is suitable for any specific person. To the
extent any of the information contained herein may be deemed to be investment advice, such information is impersonal and not
tailored to the investment needs of any specific person.
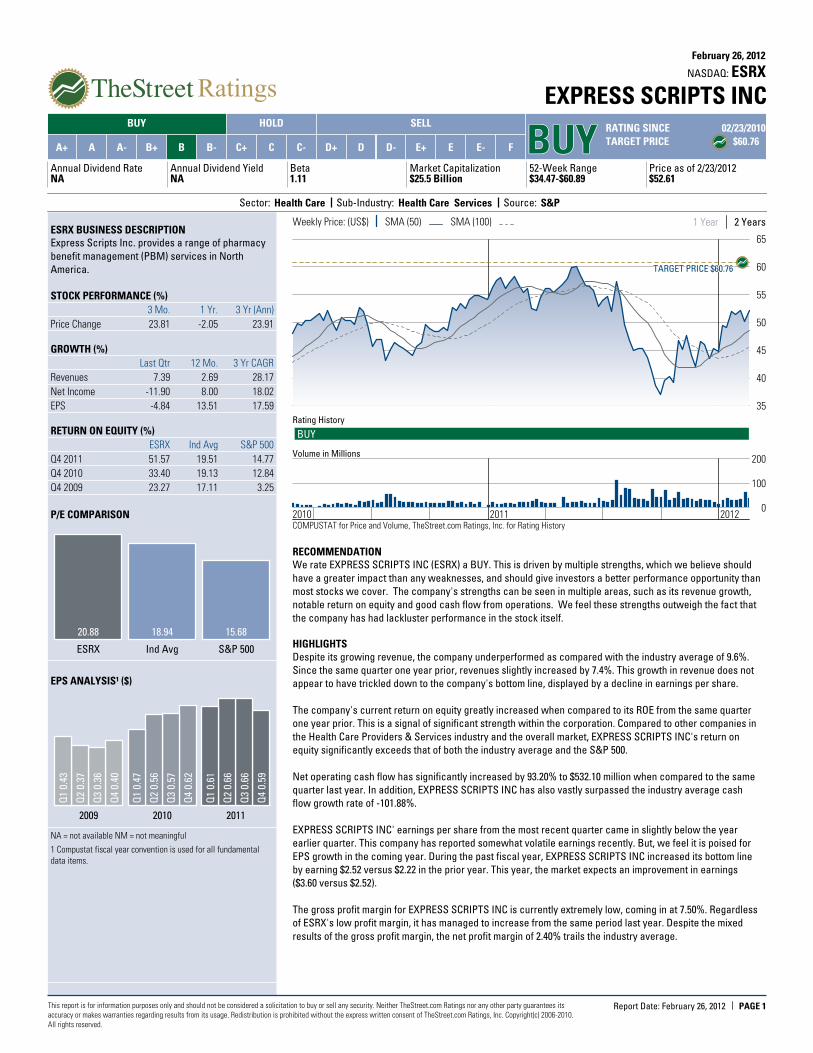
EXPRESS SCRIPTS INCESRXNASDAQ:
February 26, 2012
BUY HOLD SELL
BUYBUYBUYBUYBUYRATING SINCE 02/23/2010
TARGET PRICE $60.76A+ A A- B+ B B- C+ C C- D+ D D- E+ E E- F
Annual Dividend RateNA
Annual Dividend YieldNA
Beta1.11
Market Capitalization$25.5 Billion
52-Week Range$34.47-$60.89
Price as of 2/23/2012$52.61
Sector: Health Care Sub-Industry: Health Care Services Source: S&P
This report is for information purposes only and should not be considered a solicitation to buy or sell any security. Neither TheStreet.com Ratings nor any other party guarantees itsaccuracy or makes warranties regarding results from its usage. Redistribution is prohibited without the express written consent of TheStreet.com Ratings, Inc. Copyright(c) 2006-2010.All rights reserved.
PAGE 1Report Date: February 26, 2012
ESRX BUSINESS DESCRIPTIONExpress Scripts Inc. provides a range of pharmacy
benefit management (PBM) services in North
America.
STOCK PERFORMANCE (%)
3 Mo. 1 Yr. 3 Yr (Ann)
Price Change 23.81 -2.05 23.91
GROWTH (%)
Last Qtr 12 Mo. 3 Yr CAGR
Revenues 7.39 2.69 28.17
Net Income -11.90 8.00 18.02
EPS -4.84 13.51 17.59
RETURN ON EQUITY (%)
ESRX Ind Avg S&P 500
Q4 2011 51.57 19.51 14.77
Q4 2010 33.40 19.13 12.84
Q4 2009 23.27 17.11 3.25
P/E COMPARISON
20.88
ESRX
18.94
Ind Avg
15.68
S&P 500
EPS ANALYSIS¹ ($)
2011
Q4
0.59
Q3
0.66
Q2
0.66
Q1
0.61
2010
Q4
0.62
Q3
0.57
Q2
0.56
Q1
0.47
2009
Q4
0.40
Q3
0.36
Q2
0.37
Q1
0.43
NA = not available NM = not meaningful
1 Compustat fiscal year convention is used for all fundamentaldata items.
Weekly Price: (US$) SMA (50) SMA (100) 2 Years1 Year
2010 2011 2012
35
40
45
50
55
60
65
TARGET PRICE $60.76TARGET PRICE $60.76TARGET PRICE $60.76TARGET PRICE $60.76TARGET PRICE $60.76
Rating History
BUY
0
100
200Volume in Millions
COMPUSTAT for Price and Volume, TheStreet.com Ratings, Inc. for Rating History
RECOMMENDATIONWe rate EXPRESS SCRIPTS INC (ESRX) a BUY. This is driven by multiple strengths, which we believe should
have a greater impact than any weaknesses, and should give investors a better performance opportunity than
most stocks we cover. The company's strengths can be seen in multiple areas, such as its revenue growth,
notable return on equity and good cash flow from operations. We feel these strengths outweigh the fact that
the company has had lackluster performance in the stock itself.
HIGHLIGHTS
Despite its growing revenue, the company underperformed as compared with the industry average of 9.6%.
Since the same quarter one year prior, revenues slightly increased by 7.4%. This growth in revenue does not
appear to have trickled down to the company's bottom line, displayed by a decline in earnings per share.
The company's current return on equity greatly increased when compared to its ROE from the same quarter
one year prior. This is a signal of significant strength within the corporation. Compared to other companies in
the Health Care Providers & Services industry and the overall market, EXPRESS SCRIPTS INC's return on
equity significantly exceeds that of both the industry average and the S&P 500.
Net operating cash flow has significantly increased by 93.20% to $532.10 million when compared to the same
quarter last year. In addition, EXPRESS SCRIPTS INC has also vastly surpassed the industry average cash
flow growth rate of -101.88%.
EXPRESS SCRIPTS INC' earnings per share from the most recent quarter came in slightly below the year
earlier quarter. This company has reported somewhat volatile earnings recently. But, we feel it is poised for
EPS growth in the coming year. During the past fiscal year, EXPRESS SCRIPTS INC increased its bottom line
by earning $2.52 versus $2.22 in the prior year. This year, the market expects an improvement in earnings
($3.60 versus $2.52).
The gross profit margin for EXPRESS SCRIPTS INC is currently extremely low, coming in at 7.50%. Regardless
of ESRX's low profit margin, it has managed to increase from the same period last year. Despite the mixed
results of the gross profit margin, the net profit margin of 2.40% trails the industry average.
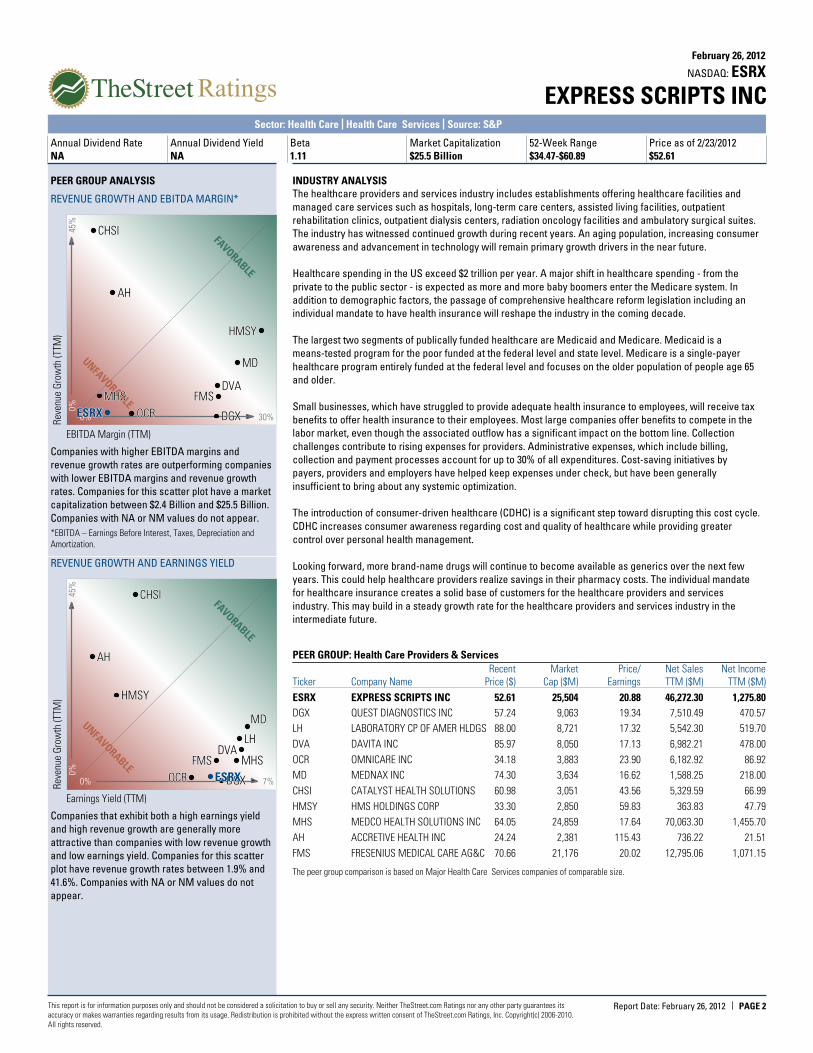
EXPRESS SCRIPTS INCESRXNASDAQ:
February 26, 2012
Sector: Health Care Health Care Services Source: S&P
Annual Dividend Rate
NA
Annual Dividend Yield
NA
Beta
1.11
Market Capitalization
$25.5 Billion
52-Week Range
$34.47-$60.89
Price as of 2/23/2012
$52.61
This report is for information purposes only and should not be considered a solicitation to buy or sell any security. Neither TheStreet.com Ratings nor any other party guarantees itsaccuracy or makes warranties regarding results from its usage. Redistribution is prohibited without the express written consent of TheStreet.com Ratings, Inc. Copyright(c) 2006-2010.All rights reserved.
PAGE 2Report Date: February 26, 2012
PEER GROUP ANALYSIS
REVENUE GROWTH AND EBITDA MARGIN*
EBITDA Margin (TTM)
Rev
enue
Gro
wth
(TTM
)
0%45
%
30%0%
FAVORABLE
UNFAVORABLE
DGXDGXDGXDGXDGX
DVADVADVADVADVA
OCROCROCROCROCR
MDMDMDMDMD
CHSICHSICHSICHSICHSI
HMSYHMSYHMSYHMSYHMSY
MHSMHSMHSMHSMHS
AHAHAHAHAH
FMSFMSFMSFMSFMS
ESRXESRXESRXESRXESRX
Companies with higher EBITDA margins and
revenue growth rates are outperforming companies
with lower EBITDA margins and revenue growth
rates. Companies for this scatter plot have a market
capitalization between $2.4 Billion and $25.5 Billion.
Companies with NA or NM values do not appear.
*EBITDA – Earnings Before Interest, Taxes, Depreciation andAmortization.
REVENUE GROWTH AND EARNINGS YIELD
Earnings Yield (TTM)
Rev
enue
Gro
wth
(TTM
)
0%45
%
7%0%
FAVORABLE
UNFAVORABLE
DGXDGXDGXDGXDGX
LHLHLHLHLHDVADVADVADVADVA
OCROCROCROCROCR
MDMDMDMDMD
CHSICHSICHSICHSICHSI
HMSYHMSYHMSYHMSYHMSY
MHSMHSMHSMHSMHS
AHAHAHAHAH
FMSFMSFMSFMSFMS
ESRXESRXESRXESRXESRX
Companies that exhibit both a high earnings yield
and high revenue growth are generally more
attractive than companies with low revenue growth
and low earnings yield. Companies for this scatter
plot have revenue growth rates between 1.9% and
41.6%. Companies with NA or NM values do not
appear.
INDUSTRY ANALYSISThe healthcare providers and services industry includes establishments offering healthcare facilities and
managed care services such as hospitals, long-term care centers, assisted living facilities, outpatient
rehabilitation clinics, outpatient dialysis centers, radiation oncology facilities and ambulatory surgical suites.
The industry has witnessed continued growth during recent years. An aging population, increasing consumer
awareness and advancement in technology will remain primary growth drivers in the near future.
Healthcare spending in the US exceed $2 trillion per year. A major shift in healthcare spending - from the
private to the public sector - is expected as more and more baby boomers enter the Medicare system. In
addition to demographic factors, the passage of comprehensive healthcare reform legislation including an
individual mandate to have health insurance will reshape the industry in the coming decade.
The largest two segments of publically funded healthcare are Medicaid and Medicare. Medicaid is a
means-tested program for the poor funded at the federal level and state level. Medicare is a single-payer
healthcare program entirely funded at the federal level and focuses on the older population of people age 65
and older.
Small businesses, which have struggled to provide adequate health insurance to employees, will receive tax
benefits to offer health insurance to their employees. Most large companies offer benefits to compete in the
labor market, even though the associated outflow has a significant impact on the bottom line. Collection
challenges contribute to rising expenses for providers. Administrative expenses, which include billing,
collection and payment processes account for up to 30% of all expenditures. Cost-saving initiatives by
payers, providers and employers have helped keep expenses under check, but have been generally
insufficient to bring about any systemic optimization.
The introduction of consumer-driven healthcare (CDHC) is a significant step toward disrupting this cost cycle.
CDHC increases consumer awareness regarding cost and quality of healthcare while providing greater
control over personal health management.
Looking forward, more brand-name drugs will continue to become available as generics over the next few
years. This could help healthcare providers realize savings in their pharmacy costs. The individual mandate
for healthcare insurance creates a solid base of customers for the healthcare providers and services
industry. This may build in a steady growth rate for the healthcare providers and services industry in the
intermediate future.
PEER GROUP: Health Care Providers & Services
Recent Market Price/ Net Sales Net Income
Ticker Price ($)Company Name Cap ($M) Earnings TTM ($M) TTM ($M)
ESRX 52.61EXPRESS SCRIPTS INC 25,504 20.88 46,272.30 1,275.80
DGX 57.24QUEST DIAGNOSTICS INC 9,063 19.34 7,510.49 470.57
LH 88.00LABORATORY CP OF AMER HLDGS 8,721 17.32 5,542.30 519.70
DVA 85.97DAVITA INC 8,050 17.13 6,982.21 478.00
OCR 34.18OMNICARE INC 3,883 23.90 6,182.92 86.92
MD 74.30MEDNAX INC 3,634 16.62 1,588.25 218.00
CHSI 60.98CATALYST HEALTH SOLUTIONS 3,051 43.56 5,329.59 66.99
HMSY 33.30HMS HOLDINGS CORP 2,850 59.83 363.83 47.79
MHS 64.05MEDCO HEALTH SOLUTIONS INC 24,859 17.64 70,063.30 1,455.70
AH 24.24ACCRETIVE HEALTH INC 2,381 115.43 736.22 21.51
FMS 70.66FRESENIUS MEDICAL CARE AG&C 21,176 20.02 12,795.06 1,071.15
The peer group comparison is based on Major Health Care Services companies of comparable size.
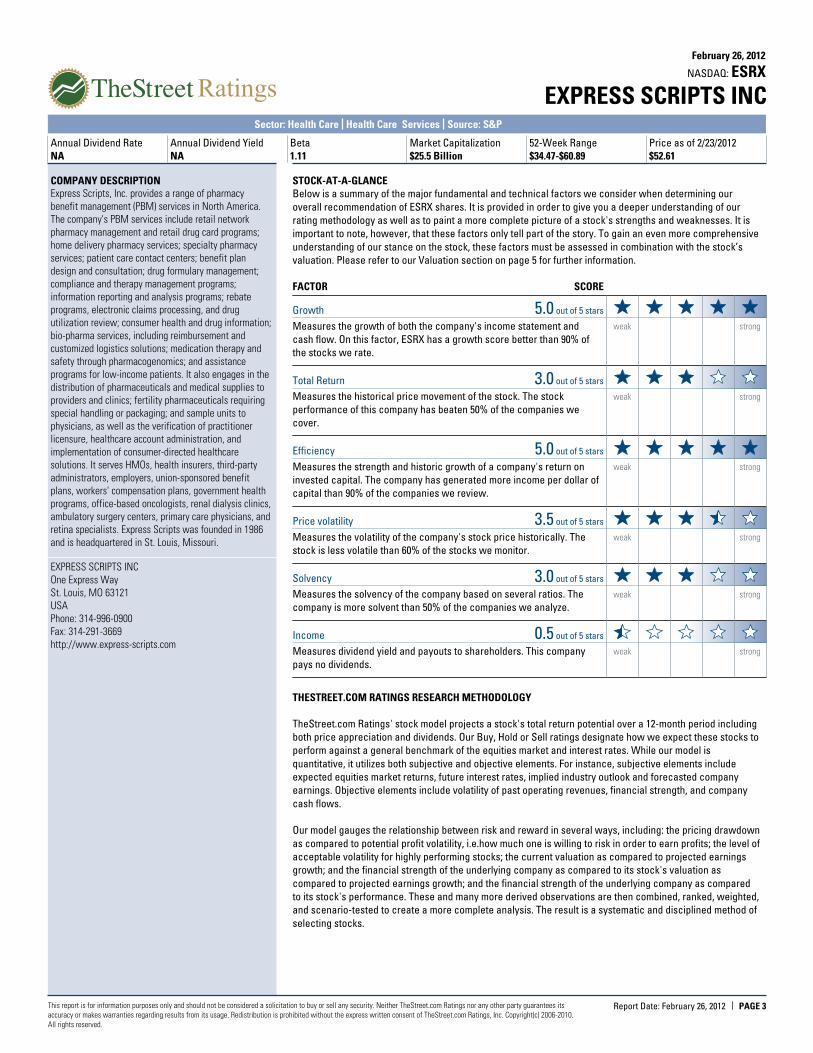
EXPRESS SCRIPTS INCESRXNASDAQ:
February 26, 2012
Sector: Health Care Health Care Services Source: S&P
Annual Dividend Rate
NA
Annual Dividend Yield
NA
Beta
1.11
Market Capitalization
$25.5 Billion
52-Week Range
$34.47-$60.89
Price as of 2/23/2012
$52.61
This report is for information purposes only and should not be considered a solicitation to buy or sell any security. Neither TheStreet.com Ratings nor any other party guarantees itsaccuracy or makes warranties regarding results from its usage. Redistribution is prohibited without the express written consent of TheStreet.com Ratings, Inc. Copyright(c) 2006-2010.All rights reserved.
PAGE 3Report Date: February 26, 2012
COMPANY DESCRIPTIONExpress Scripts, Inc. provides a range of pharmacy
benefit management (PBM) services in North America.
The company's PBM services include retail network
pharmacy management and retail drug card programs;
home delivery pharmacy services; specialty pharmacy
services; patient care contact centers; benefit plan
design and consultation; drug formulary management;
compliance and therapy management programs;
information reporting and analysis programs; rebate
programs, electronic claims processing, and drug
utilization review; consumer health and drug information;
bio-pharma services, including reimbursement and
customized logistics solutions; medication therapy and
safety through pharmacogenomics; and assistance
programs for low-income patients. It also engages in the
distribution of pharmaceuticals and medical supplies to
providers and clinics; fertility pharmaceuticals requiring
special handling or packaging; and sample units to
physicians, as well as the verification of practitioner
licensure, healthcare account administration, and
implementation of consumer-directed healthcare
solutions. It serves HMOs, health insurers, third-party
administrators, employers, union-sponsored benefit
plans, workers' compensation plans, government health
programs, office-based oncologists, renal dialysis clinics,
ambulatory surgery centers, primary care physicians, and
retina specialists. Express Scripts was founded in 1986
and is headquartered in St. Louis, Missouri.
EXPRESS SCRIPTS INC
One Express Way
St. Louis, MO 63121
USA
Phone: 314-996-0900
Fax: 314-291-3669
http://www.express-scripts.com
STOCK-AT-A-GLANCEBelow is a summary of the major fundamental and technical factors we consider when determining our
overall recommendation of ESRX shares. It is provided in order to give you a deeper understanding of our
rating methodology as well as to paint a more complete picture of a stock's strengths and weaknesses. It is
important to note, however, that these factors only tell part of the story. To gain an even more comprehensive
understanding of our stance on the stock, these factors must be assessed in combination with the stock’s
valuation. Please refer to our Valuation section on page 5 for further information.
FACTOR SCORE
Growth out of 5 stars5.0Measures the growth of both the company's income statement and
cash flow. On this factor, ESRX has a growth score better than 90% of
the stocks we rate.
weak strong
Total Return out of 5 stars3.0Measures the historical price movement of the stock. The stock
performance of this company has beaten 50% of the companies we
cover.
weak strong
Efficiency out of 5 stars5.0Measures the strength and historic growth of a company's return on
invested capital. The company has generated more income per dollar of
capital than 90% of the companies we review.
weak strong
Price volatility out of 5 stars3.5Measures the volatility of the company's stock price historically. The
stock is less volatile than 60% of the stocks we monitor.
weak strong
Solvency out of 5 stars3.0Measures the solvency of the company based on several ratios. The
company is more solvent than 50% of the companies we analyze.
weak strong
Income out of 5 stars0.5Measures dividend yield and payouts to shareholders. This company
pays no dividends.
weak strong
THESTREET.COM RATINGS RESEARCH METHODOLOGY
TheStreet.com Ratings' stock model projects a stock's total return potential over a 12-month period including
both price appreciation and dividends. Our Buy, Hold or Sell ratings designate how we expect these stocks to
perform against a general benchmark of the equities market and interest rates. While our model is
quantitative, it utilizes both subjective and objective elements. For instance, subjective elements include
expected equities market returns, future interest rates, implied industry outlook and forecasted company
earnings. Objective elements include volatility of past operating revenues, financial strength, and company
cash flows.
Our model gauges the relationship between risk and reward in several ways, including: the pricing drawdown
as compared to potential profit volatility, i.e.how much one is willing to risk in order to earn profits; the level of
acceptable volatility for highly performing stocks; the current valuation as compared to projected earnings
growth; and the financial strength of the underlying company as compared to its stock's valuation as
compared to projected earnings growth; and the financial strength of the underlying company as compared
to its stock's performance. These and many more derived observations are then combined, ranked, weighted,
and scenario-tested to create a more complete analysis. The result is a systematic and disciplined method of
selecting stocks.

EXPRESS SCRIPTS INCESRXNASDAQ:
February 26, 2012
Sector: Health Care Health Care Services Source: S&P
Annual Dividend Rate
NA
Annual Dividend Yield
NA
Beta
1.11
Market Capitalization
$25.5 Billion
52-Week Range
$34.47-$60.89
Price as of 2/23/2012
$52.61
This report is for information purposes only and should not be considered a solicitation to buy or sell any security. Neither TheStreet.com Ratings nor any other party guarantees itsaccuracy or makes warranties regarding results from its usage. Redistribution is prohibited without the express written consent of TheStreet.com Ratings, Inc. Copyright(c) 2006-2010.All rights reserved.
PAGE 4Report Date: February 26, 2012
Consensus EPS Estimates² ($)IBES consensus estimates are provided by Thomson Financial
0.79
Q1 FY12
3.60 E
2012(E)
4.31 E
2013(E)
INCOME STATEMENT
Q4 FY11 Q4 FY10
Net Sales ($mil) 12,159.90 11,322.70
EBITDA ($mil) 713.00 658.90
EBIT ($mil) 647.10 595.10
Net Income ($mil) 290.40 329.60
BALANCE SHEET
Q4 FY11 Q4 FY10
Cash & Equiv. ($mil) 5,637.90 540.00
Total Assets ($mil) 15,607.00 10,557.80
Total Debt ($mil) 8,076.30 2,493.80
Equity ($mil) 2,473.70 3,606.60
PROFITABILITY
Q4 FY11 Q4 FY10
Gross Profit Margin 7.53% 7.47%
EBITDA Margin 5.86% 5.82%
Operating Margin 5.32% 5.26%
Sales Turnover 2.96 4.27
Return on Assets 8.17% 11.19%
Return on Equity 51.57% 33.40%
DEBT
Q4 FY11 Q4 FY10
Current Ratio 1.48 0.75
Debt/Capital 0.77 0.41
Interest Expense 52.40 40.10
Interest Coverage 12.35 14.84
SHARE DATA
Q4 FY11 Q4 FY10
Shares outstanding (mil) 485 528
Div / share 0.00 0.00
EPS 0.59 0.62
Book value / share 5.10 6.83
Institutional Own % NA NA
Avg Daily Volume 6,803,623 8,673,015
2 Sum of quarterly figures may not match annual estimates due touse of median consensus estimates.
FINANCIAL ANALYSISEXPRESS SCRIPTS INC's gross profit margin for the fourth quarter of its fiscal year 2011 is essentially
unchanged when compared to the same period a year ago. Even though sales increased, the net income has
decreased. EXPRESS SCRIPTS INC has average liquidity. Currently, the Quick Ratio is 1.38 which shows that
technically this company has the ability to cover short-term cash needs. The company's liquidity has
increased from the same period last year, indicating improving cash flow.
At the same time, stockholders' equity ("net worth") has significantly decreased by 31.41% from the same
quarter last year. Together, the key liquidity measurements indicate that it is relatively unlikely that the
company will face financial difficulties in the near future.
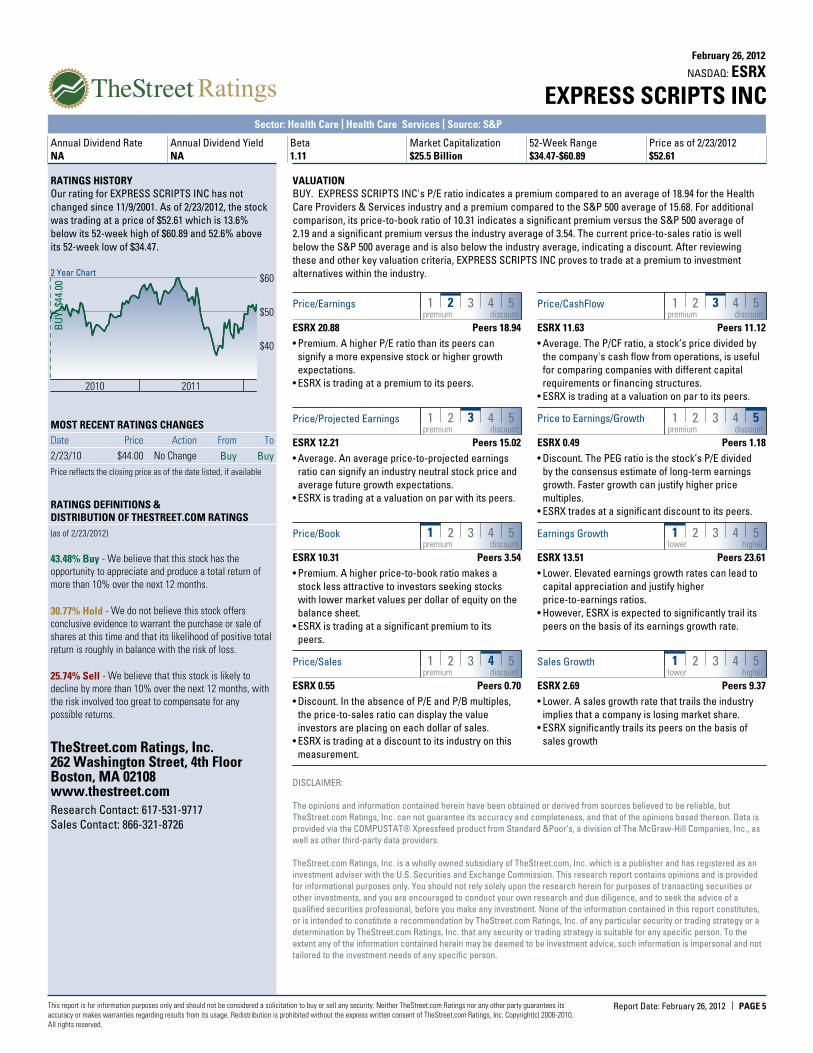
EXPRESS SCRIPTS INCESRXNASDAQ:
February 26, 2012
Sector: Health Care Health Care Services Source: S&P
Annual Dividend Rate
NA
Annual Dividend Yield
NA
Beta
1.11
Market Capitalization
$25.5 Billion
52-Week Range
$34.47-$60.89
Price as of 2/23/2012
$52.61
This report is for information purposes only and should not be considered a solicitation to buy or sell any security. Neither TheStreet.com Ratings nor any other party guarantees itsaccuracy or makes warranties regarding results from its usage. Redistribution is prohibited without the express written consent of TheStreet.com Ratings, Inc. Copyright(c) 2006-2010.All rights reserved.
PAGE 5Report Date: February 26, 2012
RATINGS HISTORYOur rating for EXPRESS SCRIPTS INC has not
changed since 11/9/2001. As of 2/23/2012, the stock
was trading at a price of $52.61 which is 13.6%
below its 52-week high of $60.89 and 52.6% above
its 52-week low of $34.47.
2 Year Chart
2010 2011
$40
$50
$60
BU
Y: $
44.0
0
MOST RECENT RATINGS CHANGES
Date Price Action From To
2/23/10 $44.00 No Change Buy Buy
Price reflects the closing price as of the date listed, if available
RATINGS DEFINITIONS &DISTRIBUTION OF THESTREET.COM RATINGS
(as of 2/23/2012)
43.48% Buy - We believe that this stock has the
opportunity to appreciate and produce a total return of
more than 10% over the next 12 months.
30.77% Hold - We do not believe this stock offers
conclusive evidence to warrant the purchase or sale of
shares at this time and that its likelihood of positive total
return is roughly in balance with the risk of loss.
25.74% Sell - We believe that this stock is likely to
decline by more than 10% over the next 12 months, with
the risk involved too great to compensate for any
possible returns.
TheStreet.com Ratings, Inc.262 Washington Street, 4th FloorBoston, MA 02108www.thestreet.comResearch Contact: 617-531-9717
Sales Contact: 866-321-8726
VALUATIONBUY. EXPRESS SCRIPTS INC's P/E ratio indicates a premium compared to an average of 18.94 for the Health
Care Providers & Services industry and a premium compared to the S&P 500 average of 15.68. For additional
comparison, its price-to-book ratio of 10.31 indicates a significant premium versus the S&P 500 average of
2.19 and a significant premium versus the industry average of 3.54. The current price-to-sales ratio is well
below the S&P 500 average and is also below the industry average, indicating a discount. After reviewing
these and other key valuation criteria, EXPRESS SCRIPTS INC proves to trade at a premium to investment
alternatives within the industry.
1 2 3 4 5Price/Earningspremium discount
ESRX 20.88 Peers 18.94
• Premium. A higher P/E ratio than its peers can
signify a more expensive stock or higher growth
expectations.
• ESRX is trading at a premium to its peers.
1 2 3 4 5Price/CashFlowpremium discount
ESRX 11.63 Peers 11.12
• Average. The P/CF ratio, a stock’s price divided by
the company's cash flow from operations, is useful
for comparing companies with different capital
requirements or financing structures.
• ESRX is trading at a valuation on par to its peers.
1 2 3 4 5Price/Projected Earningspremium discount
ESRX 12.21 Peers 15.02
• Average. An average price-to-projected earnings
ratio can signify an industry neutral stock price and
average future growth expectations.
• ESRX is trading at a valuation on par with its peers.
1 2 3 4 5Price to Earnings/Growthpremium discount
ESRX 0.49 Peers 1.18
• Discount. The PEG ratio is the stock’s P/E divided
by the consensus estimate of long-term earnings
growth. Faster growth can justify higher price
multiples.
• ESRX trades at a significant discount to its peers.
1 2 3 4 5Price/Bookpremium discount
ESRX 10.31 Peers 3.54
• Premium. A higher price-to-book ratio makes a
stock less attractive to investors seeking stocks
with lower market values per dollar of equity on the
balance sheet.
• ESRX is trading at a significant premium to its
peers.
1 2 3 4 5Earnings Growthlower higher
ESRX 13.51 Peers 23.61
• Lower. Elevated earnings growth rates can lead to
capital appreciation and justify higher
price-to-earnings ratios.
• However, ESRX is expected to significantly trail its
peers on the basis of its earnings growth rate.
1 2 3 4 5Price/Salespremium discount
ESRX 0.55 Peers 0.70
• Discount. In the absence of P/E and P/B multiples,
the price-to-sales ratio can display the value
investors are placing on each dollar of sales.
• ESRX is trading at a discount to its industry on this
measurement.
1 2 3 4 5Sales Growthlower higher
ESRX 2.69 Peers 9.37
• Lower. A sales growth rate that trails the industry
implies that a company is losing market share.
• ESRX significantly trails its peers on the basis of
sales growth
DISCLAIMER:
The opinions and information contained herein have been obtained or derived from sources believed to be reliable, but
TheStreet.com Ratings, Inc. can not guarantee its accuracy and completeness, and that of the opinions based thereon. Data is
provided via the COMPUSTAT® Xpressfeed product from Standard &Poor’s, a division of The McGraw-Hill Companies, Inc., as
well as other third-party data providers.
TheStreet.com Ratings, Inc. is a wholly owned subsidiary of TheStreet.com, Inc. which is a publisher and has registered as an
investment adviser with the U.S. Securities and Exchange Commission. This research report contains opinions and is provided
for informational purposes only. You should not rely solely upon the research herein for purposes of transacting securities or
other investments, and you are encouraged to conduct your own research and due diligence, and to seek the advice of a
qualified securities professional, before you make any investment. None of the information contained in this report constitutes,
or is intended to constitute a recommendation by TheStreet.com Ratings, Inc. of any particular security or trading strategy or a
determination by TheStreet.com Ratings, Inc. that any security or trading strategy is suitable for any specific person. To the
extent any of the information contained herein may be deemed to be investment advice, such information is impersonal and not
tailored to the investment needs of any specific person.
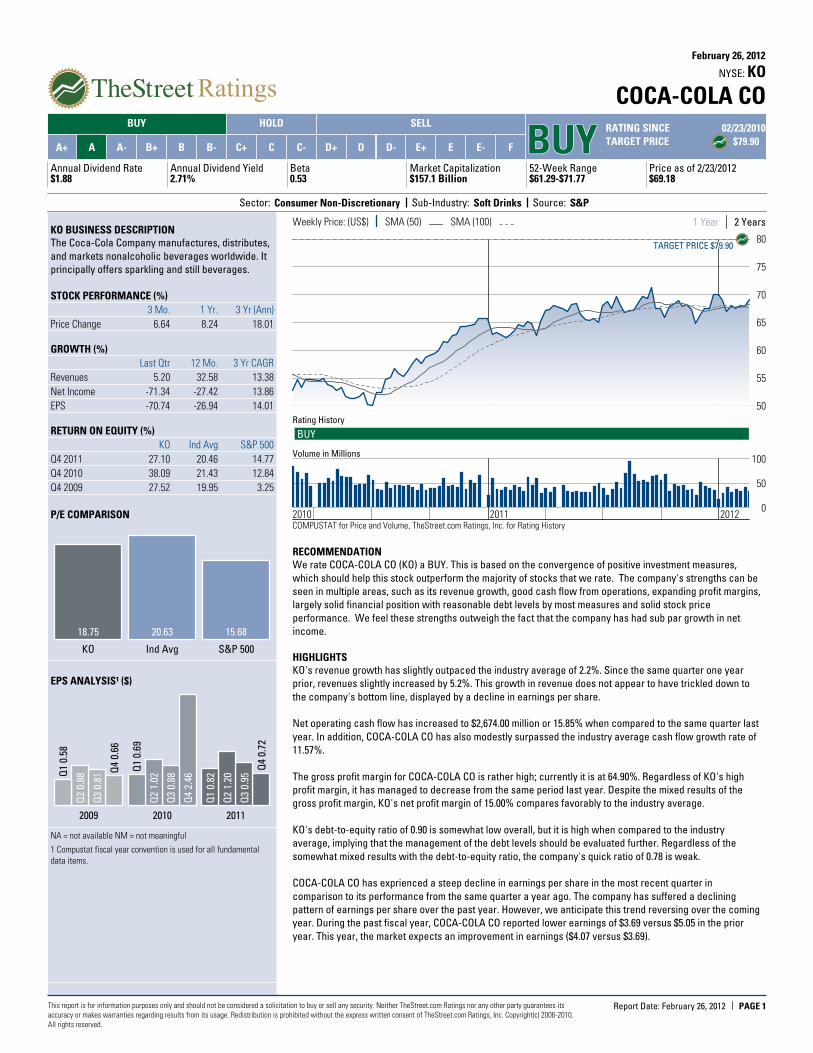
COCA-COLA COKONYSE:
February 26, 2012
BUY HOLD SELL
BUYBUYBUYBUYBUYRATING SINCE 02/23/2010
TARGET PRICE $79.90A+ A A- B+ B B- C+ C C- D+ D D- E+ E E- F
Annual Dividend Rate$1.88
Annual Dividend Yield2.71%
Beta0.53
Market Capitalization$157.1 Billion
52-Week Range$61.29-$71.77
Price as of 2/23/2012$69.18
Sector: Consumer Non-Discretionary Sub-Industry: Soft Drinks Source: S&P
This report is for information purposes only and should not be considered a solicitation to buy or sell any security. Neither TheStreet.com Ratings nor any other party guarantees itsaccuracy or makes warranties regarding results from its usage. Redistribution is prohibited without the express written consent of TheStreet.com Ratings, Inc. Copyright(c) 2006-2010.All rights reserved.
PAGE 1Report Date: February 26, 2012
KO BUSINESS DESCRIPTIONThe Coca-Cola Company manufactures, distributes,
and markets nonalcoholic beverages worldwide. It
principally offers sparkling and still beverages.
STOCK PERFORMANCE (%)
3 Mo. 1 Yr. 3 Yr (Ann)
Price Change 6.64 8.24 18.01
GROWTH (%)
Last Qtr 12 Mo. 3 Yr CAGR
Revenues 5.20 32.58 13.38
Net Income -71.34 -27.42 13.86
EPS -70.74 -26.94 14.01
RETURN ON EQUITY (%)
KO Ind Avg S&P 500
Q4 2011 27.10 20.46 14.77
Q4 2010 38.09 21.43 12.84
Q4 2009 27.52 19.95 3.25
P/E COMPARISON
18.75
KO
20.63
Ind Avg
15.68
S&P 500
EPS ANALYSIS¹ ($)
2011
Q4
0.72
Q3
0.95
Q2
1.20
Q1
0.82
2010
Q4
2.46
Q3
0.88
Q2
1.02
Q1
0.69
2009
Q4
0.66
Q3
0.81
Q2
0.88
Q1
0.58
NA = not available NM = not meaningful
1 Compustat fiscal year convention is used for all fundamentaldata items.
Weekly Price: (US$) SMA (50) SMA (100) 2 Years1 Year
2010 2011 2012
50
55
60
65
70
75
80TARGET PRICE $79.90TARGET PRICE $79.90TARGET PRICE $79.90TARGET PRICE $79.90TARGET PRICE $79.90
Rating History
BUY
0
50
100Volume in Millions
COMPUSTAT for Price and Volume, TheStreet.com Ratings, Inc. for Rating History
RECOMMENDATIONWe rate COCA-COLA CO (KO) a BUY. This is based on the convergence of positive investment measures,
which should help this stock outperform the majority of stocks that we rate. The company's strengths can be
seen in multiple areas, such as its revenue growth, good cash flow from operations, expanding profit margins,
largely solid financial position with reasonable debt levels by most measures and solid stock price
performance. We feel these strengths outweigh the fact that the company has had sub par growth in net
income.
HIGHLIGHTSKO's revenue growth has slightly outpaced the industry average of 2.2%. Since the same quarter one year
prior, revenues slightly increased by 5.2%. This growth in revenue does not appear to have trickled down to
the company's bottom line, displayed by a decline in earnings per share.
Net operating cash flow has increased to $2,674.00 million or 15.85% when compared to the same quarter last
year. In addition, COCA-COLA CO has also modestly surpassed the industry average cash flow growth rate of
11.57%.
The gross profit margin for COCA-COLA CO is rather high; currently it is at 64.90%. Regardless of KO's high
profit margin, it has managed to decrease from the same period last year. Despite the mixed results of the
gross profit margin, KO's net profit margin of 15.00% compares favorably to the industry average.
KO's debt-to-equity ratio of 0.90 is somewhat low overall, but it is high when compared to the industry
average, implying that the management of the debt levels should be evaluated further. Regardless of the
somewhat mixed results with the debt-to-equity ratio, the company's quick ratio of 0.78 is weak.
COCA-COLA CO has exprienced a steep decline in earnings per share in the most recent quarter in
comparison to its performance from the same quarter a year ago. The company has suffered a declining
pattern of earnings per share over the past year. However, we anticipate this trend reversing over the coming
year. During the past fiscal year, COCA-COLA CO reported lower earnings of $3.69 versus $5.05 in the prior
year. This year, the market expects an improvement in earnings ($4.07 versus $3.69).
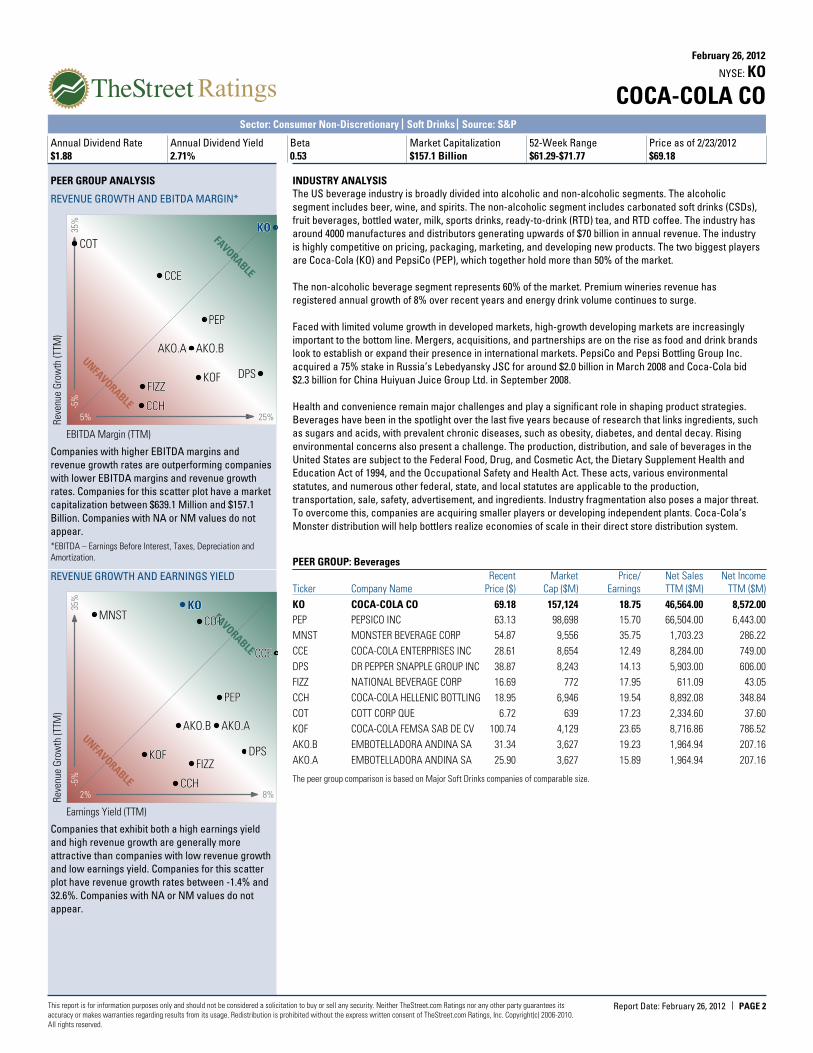
COCA-COLA COKONYSE:
February 26, 2012
Sector: Consumer Non-Discretionary Soft Drinks Source: S&P
Annual Dividend Rate
$1.88
Annual Dividend Yield
2.71%
Beta
0.53
Market Capitalization
$157.1 Billion
52-Week Range
$61.29-$71.77
Price as of 2/23/2012
$69.18
This report is for information purposes only and should not be considered a solicitation to buy or sell any security. Neither TheStreet.com Ratings nor any other party guarantees itsaccuracy or makes warranties regarding results from its usage. Redistribution is prohibited without the express written consent of TheStreet.com Ratings, Inc. Copyright(c) 2006-2010.All rights reserved.
PAGE 2Report Date: February 26, 2012
PEER GROUP ANALYSIS
REVENUE GROWTH AND EBITDA MARGIN*
EBITDA Margin (TTM)
Rev
enue
Gro
wth
(TTM
)
-5%
35%
25%5%
FAVORABLE
UNFAVORABLE
PEPPEPPEPPEPPEP
CCECCECCECCECCE
DPSDPSDPSDPSDPSFIZZFIZZFIZZFIZZFIZZ
CCHCCHCCHCCHCCH
COTCOTCOTCOTCOT
KOFKOFKOFKOFKOF
AKO.BAKO.BAKO.BAKO.BAKO.BAKO.AAKO.AAKO.AAKO.AAKO.A
KOKOKOKOKO
Companies with higher EBITDA margins and
revenue growth rates are outperforming companies
with lower EBITDA margins and revenue growth
rates. Companies for this scatter plot have a market
capitalization between $639.1 Million and $157.1
Billion. Companies with NA or NM values do not
appear.
*EBITDA – Earnings Before Interest, Taxes, Depreciation andAmortization.
REVENUE GROWTH AND EARNINGS YIELD
Earnings Yield (TTM)
Rev
enue
Gro
wth
(TTM
)
-5%
35%
8%2%
FAVORABLE
UNFAVORABLE
PEPPEPPEPPEPPEP
MNSTMNSTMNSTMNSTMNST
CCECCECCECCECCE
DPSDPSDPSDPSDPSFIZZFIZZFIZZFIZZFIZZ
CCHCCHCCHCCHCCH
COTCOTCOTCOTCOT
KOFKOFKOFKOFKOF
AKO.BAKO.BAKO.BAKO.BAKO.B AKO.AAKO.AAKO.AAKO.AAKO.A
KOKOKOKOKO
Companies that exhibit both a high earnings yield
and high revenue growth are generally more
attractive than companies with low revenue growth
and low earnings yield. Companies for this scatter
plot have revenue growth rates between -1.4% and
32.6%. Companies with NA or NM values do not
appear.
INDUSTRY ANALYSISThe US beverage industry is broadly divided into alcoholic and non-alcoholic segments. The alcoholic
segment includes beer, wine, and spirits. The non-alcoholic segment includes carbonated soft drinks (CSDs),
fruit beverages, bottled water, milk, sports drinks, ready-to-drink (RTD) tea, and RTD coffee. The industry has
around 4000 manufactures and distributors generating upwards of $70 billion in annual revenue. The industry
is highly competitive on pricing, packaging, marketing, and developing new products. The two biggest players
are Coca-Cola (KO) and PepsiCo (PEP), which together hold more than 50% of the market.
The non-alcoholic beverage segment represents 60% of the market. Premium wineries revenue has
registered annual growth of 8% over recent years and energy drink volume continues to surge.
Faced with limited volume growth in developed markets, high-growth developing markets are increasingly
important to the bottom line. Mergers, acquisitions, and partnerships are on the rise as food and drink brands
look to establish or expand their presence in international markets. PepsiCo and Pepsi Bottling Group Inc.
acquired a 75% stake in Russia’s Lebedyansky JSC for around $2.0 billion in March 2008 and Coca-Cola bid
$2.3 billion for China Huiyuan Juice Group Ltd. in September 2008.
Health and convenience remain major challenges and play a significant role in shaping product strategies.
Beverages have been in the spotlight over the last five years because of research that links ingredients, such
as sugars and acids, with prevalent chronic diseases, such as obesity, diabetes, and dental decay. Rising
environmental concerns also present a challenge. The production, distribution, and sale of beverages in the
United States are subject to the Federal Food, Drug, and Cosmetic Act, the Dietary Supplement Health and
Education Act of 1994, and the Occupational Safety and Health Act. These acts, various environmental
statutes, and numerous other federal, state, and local statutes are applicable to the production,
transportation, sale, safety, advertisement, and ingredients. Industry fragmentation also poses a major threat.
To overcome this, companies are acquiring smaller players or developing independent plants. Coca-Cola’s
Monster distribution will help bottlers realize economies of scale in their direct store distribution system.
PEER GROUP: Beverages
Recent Market Price/ Net Sales Net Income
Ticker Price ($)Company Name Cap ($M) Earnings TTM ($M) TTM ($M)
KO 69.18COCA-COLA CO 157,124 18.75 46,564.00 8,572.00
PEP 63.13PEPSICO INC 98,698 15.70 66,504.00 6,443.00
MNST 54.87MONSTER BEVERAGE CORP 9,556 35.75 1,703.23 286.22
CCE 28.61COCA-COLA ENTERPRISES INC 8,654 12.49 8,284.00 749.00
DPS 38.87DR PEPPER SNAPPLE GROUP INC 8,243 14.13 5,903.00 606.00
FIZZ 16.69NATIONAL BEVERAGE CORP 772 17.95 611.09 43.05
CCH 18.95COCA-COLA HELLENIC BOTTLING 6,946 19.54 8,892.08 348.84
COT 6.72COTT CORP QUE 639 17.23 2,334.60 37.60
KOF 100.74COCA-COLA FEMSA SAB DE CV 4,129 23.65 8,716.86 786.52
AKO.B 31.34EMBOTELLADORA ANDINA SA 3,627 19.23 1,964.94 207.16
AKO.A 25.90EMBOTELLADORA ANDINA SA 3,627 15.89 1,964.94 207.16
The peer group comparison is based on Major Soft Drinks companies of comparable size.
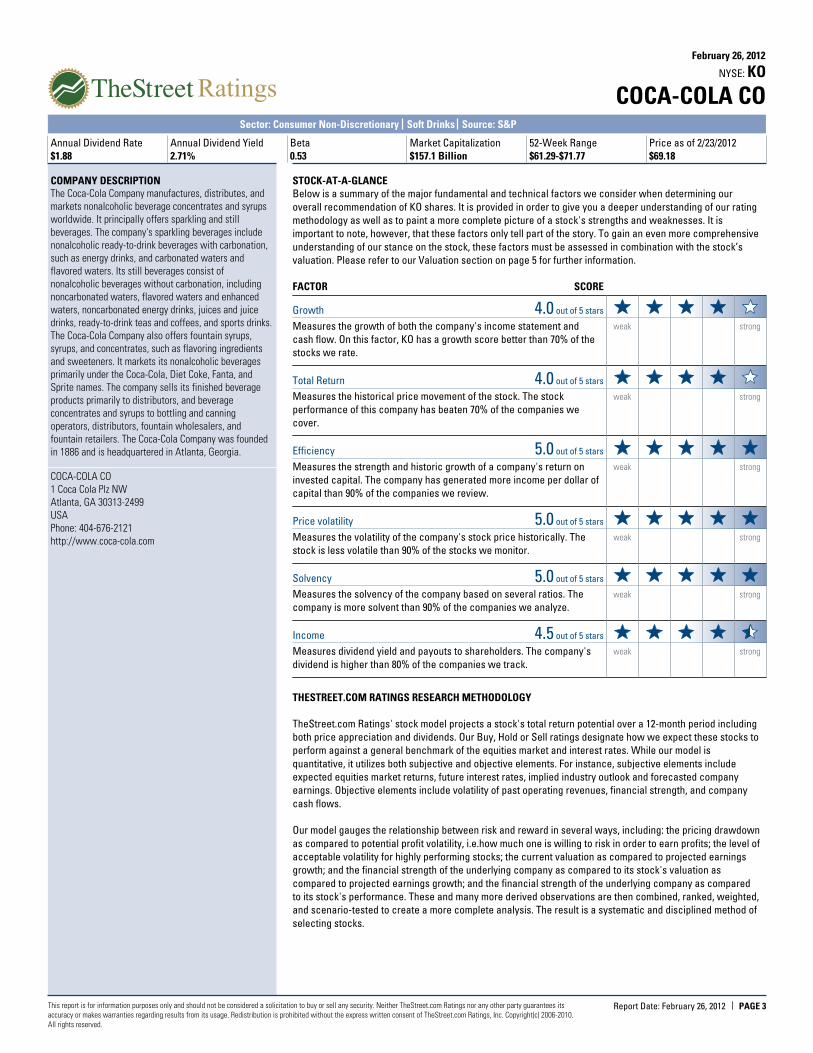
COCA-COLA COKONYSE:
February 26, 2012
Sector: Consumer Non-Discretionary Soft Drinks Source: S&P
Annual Dividend Rate
$1.88
Annual Dividend Yield
2.71%
Beta
0.53
Market Capitalization
$157.1 Billion
52-Week Range
$61.29-$71.77
Price as of 2/23/2012
$69.18
This report is for information purposes only and should not be considered a solicitation to buy or sell any security. Neither TheStreet.com Ratings nor any other party guarantees itsaccuracy or makes warranties regarding results from its usage. Redistribution is prohibited without the express written consent of TheStreet.com Ratings, Inc. Copyright(c) 2006-2010.All rights reserved.
PAGE 3Report Date: February 26, 2012
COMPANY DESCRIPTIONThe Coca-Cola Company manufactures, distributes, and
markets nonalcoholic beverage concentrates and syrups
worldwide. It principally offers sparkling and still
beverages. The company's sparkling beverages include
nonalcoholic ready-to-drink beverages with carbonation,
such as energy drinks, and carbonated waters and
flavored waters. Its still beverages consist of
nonalcoholic beverages without carbonation, including
noncarbonated waters, flavored waters and enhanced
waters, noncarbonated energy drinks, juices and juice
drinks, ready-to-drink teas and coffees, and sports drinks.
The Coca-Cola Company also offers fountain syrups,
syrups, and concentrates, such as flavoring ingredients
and sweeteners. It markets its nonalcoholic beverages
primarily under the Coca-Cola, Diet Coke, Fanta, and
Sprite names. The company sells its finished beverage
products primarily to distributors, and beverage
concentrates and syrups to bottling and canning
operators, distributors, fountain wholesalers, and
fountain retailers. The Coca-Cola Company was founded
in 1886 and is headquartered in Atlanta, Georgia.
COCA-COLA CO
1 Coca Cola Plz NW
Atlanta, GA 30313-2499
USA
Phone: 404-676-2121
http://www.coca-cola.com
STOCK-AT-A-GLANCEBelow is a summary of the major fundamental and technical factors we consider when determining our
overall recommendation of KO shares. It is provided in order to give you a deeper understanding of our rating
methodology as well as to paint a more complete picture of a stock's strengths and weaknesses. It is
important to note, however, that these factors only tell part of the story. To gain an even more comprehensive
understanding of our stance on the stock, these factors must be assessed in combination with the stock’s
valuation. Please refer to our Valuation section on page 5 for further information.
FACTOR SCORE
Growth out of 5 stars4.0Measures the growth of both the company's income statement and
cash flow. On this factor, KO has a growth score better than 70% of the
stocks we rate.
weak strong
Total Return out of 5 stars4.0Measures the historical price movement of the stock. The stock
performance of this company has beaten 70% of the companies we
cover.
weak strong
Efficiency out of 5 stars5.0Measures the strength and historic growth of a company's return on
invested capital. The company has generated more income per dollar of
capital than 90% of the companies we review.
weak strong
Price volatility out of 5 stars5.0Measures the volatility of the company's stock price historically. The
stock is less volatile than 90% of the stocks we monitor.
weak strong
Solvency out of 5 stars5.0Measures the solvency of the company based on several ratios. The
company is more solvent than 90% of the companies we analyze.
weak strong
Income out of 5 stars4.5Measures dividend yield and payouts to shareholders. The company's
dividend is higher than 80% of the companies we track.
weak strong
THESTREET.COM RATINGS RESEARCH METHODOLOGY
TheStreet.com Ratings' stock model projects a stock's total return potential over a 12-month period including
both price appreciation and dividends. Our Buy, Hold or Sell ratings designate how we expect these stocks to
perform against a general benchmark of the equities market and interest rates. While our model is
quantitative, it utilizes both subjective and objective elements. For instance, subjective elements include
expected equities market returns, future interest rates, implied industry outlook and forecasted company
earnings. Objective elements include volatility of past operating revenues, financial strength, and company
cash flows.
Our model gauges the relationship between risk and reward in several ways, including: the pricing drawdown
as compared to potential profit volatility, i.e.how much one is willing to risk in order to earn profits; the level of
acceptable volatility for highly performing stocks; the current valuation as compared to projected earnings
growth; and the financial strength of the underlying company as compared to its stock's valuation as
compared to projected earnings growth; and the financial strength of the underlying company as compared
to its stock's performance. These and many more derived observations are then combined, ranked, weighted,
and scenario-tested to create a more complete analysis. The result is a systematic and disciplined method of
selecting stocks.
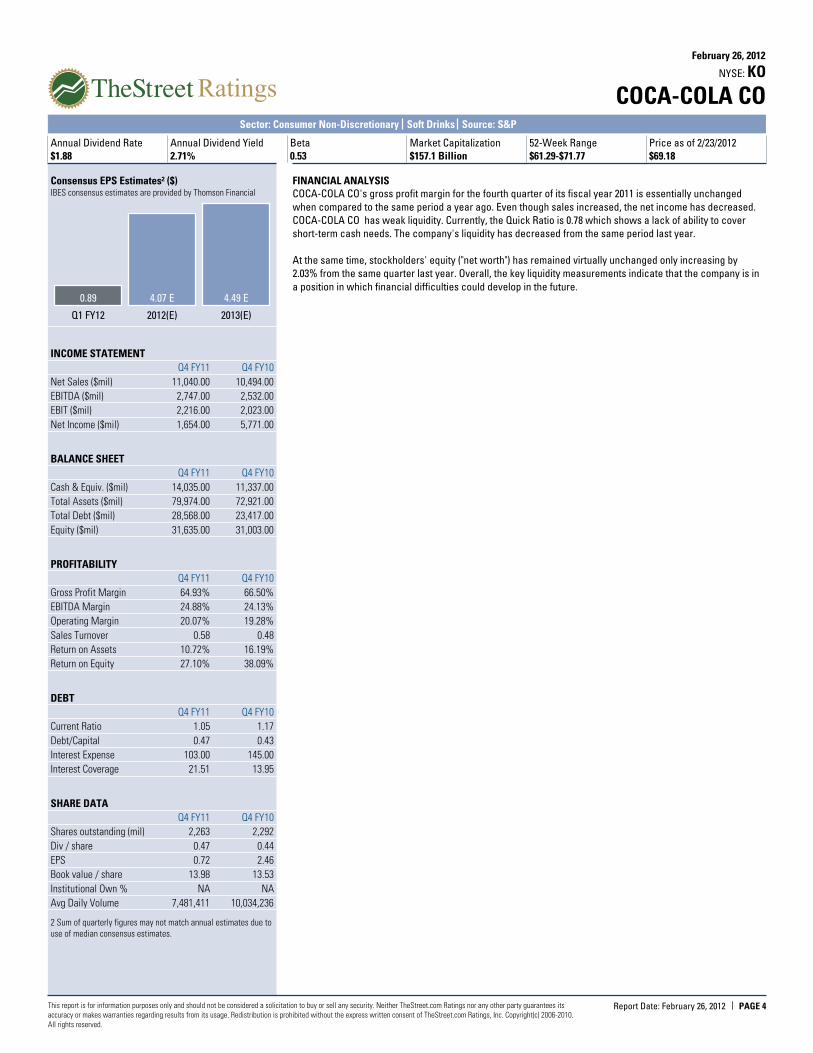
COCA-COLA COKONYSE:
February 26, 2012
Sector: Consumer Non-Discretionary Soft Drinks Source: S&P
Annual Dividend Rate
$1.88
Annual Dividend Yield
2.71%
Beta
0.53
Market Capitalization
$157.1 Billion
52-Week Range
$61.29-$71.77
Price as of 2/23/2012
$69.18
This report is for information purposes only and should not be considered a solicitation to buy or sell any security. Neither TheStreet.com Ratings nor any other party guarantees itsaccuracy or makes warranties regarding results from its usage. Redistribution is prohibited without the express written consent of TheStreet.com Ratings, Inc. Copyright(c) 2006-2010.All rights reserved.
PAGE 4Report Date: February 26, 2012
Consensus EPS Estimates² ($)IBES consensus estimates are provided by Thomson Financial
0.89
Q1 FY12
4.07 E
2012(E)
4.49 E
2013(E)
INCOME STATEMENT
Q4 FY11 Q4 FY10
Net Sales ($mil) 11,040.00 10,494.00
EBITDA ($mil) 2,747.00 2,532.00
EBIT ($mil) 2,216.00 2,023.00
Net Income ($mil) 1,654.00 5,771.00
BALANCE SHEET
Q4 FY11 Q4 FY10
Cash & Equiv. ($mil) 14,035.00 11,337.00
Total Assets ($mil) 79,974.00 72,921.00
Total Debt ($mil) 28,568.00 23,417.00
Equity ($mil) 31,635.00 31,003.00
PROFITABILITY
Q4 FY11 Q4 FY10
Gross Profit Margin 64.93% 66.50%
EBITDA Margin 24.88% 24.13%
Operating Margin 20.07% 19.28%
Sales Turnover 0.58 0.48
Return on Assets 10.72% 16.19%
Return on Equity 27.10% 38.09%
DEBT
Q4 FY11 Q4 FY10
Current Ratio 1.05 1.17
Debt/Capital 0.47 0.43
Interest Expense 103.00 145.00
Interest Coverage 21.51 13.95
SHARE DATA
Q4 FY11 Q4 FY10
Shares outstanding (mil) 2,263 2,292
Div / share 0.47 0.44
EPS 0.72 2.46
Book value / share 13.98 13.53
Institutional Own % NA NA
Avg Daily Volume 7,481,411 10,034,236
2 Sum of quarterly figures may not match annual estimates due touse of median consensus estimates.
FINANCIAL ANALYSISCOCA-COLA CO's gross profit margin for the fourth quarter of its fiscal year 2011 is essentially unchanged
when compared to the same period a year ago. Even though sales increased, the net income has decreased.
COCA-COLA CO has weak liquidity. Currently, the Quick Ratio is 0.78 which shows a lack of ability to cover
short-term cash needs. The company's liquidity has decreased from the same period last year.
At the same time, stockholders' equity ("net worth") has remained virtually unchanged only increasing by
2.03% from the same quarter last year. Overall, the key liquidity measurements indicate that the company is in
a position in which financial difficulties could develop in the future.
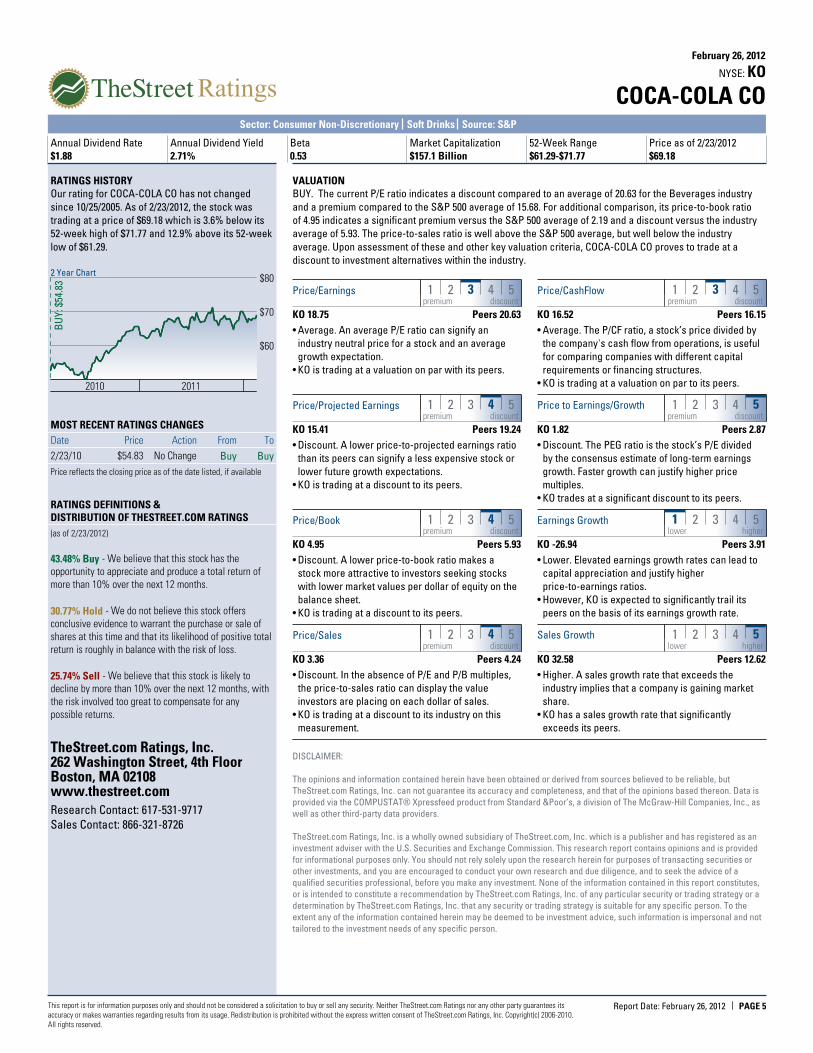
COCA-COLA COKONYSE:
February 26, 2012
Sector: Consumer Non-Discretionary Soft Drinks Source: S&P
Annual Dividend Rate
$1.88
Annual Dividend Yield
2.71%
Beta
0.53
Market Capitalization
$157.1 Billion
52-Week Range
$61.29-$71.77
Price as of 2/23/2012
$69.18
This report is for information purposes only and should not be considered a solicitation to buy or sell any security. Neither TheStreet.com Ratings nor any other party guarantees itsaccuracy or makes warranties regarding results from its usage. Redistribution is prohibited without the express written consent of TheStreet.com Ratings, Inc. Copyright(c) 2006-2010.All rights reserved.
PAGE 5Report Date: February 26, 2012
RATINGS HISTORYOur rating for COCA-COLA CO has not changed
since 10/25/2005. As of 2/23/2012, the stock was
trading at a price of $69.18 which is 3.6% below its
52-week high of $71.77 and 12.9% above its 52-week
low of $61.29.
2 Year Chart
2010 2011
$60
$70
$80
BU
Y: $
54.8
3
MOST RECENT RATINGS CHANGES
Date Price Action From To
2/23/10 $54.83 No Change Buy Buy
Price reflects the closing price as of the date listed, if available
RATINGS DEFINITIONS &DISTRIBUTION OF THESTREET.COM RATINGS
(as of 2/23/2012)
43.48% Buy - We believe that this stock has the
opportunity to appreciate and produce a total return of
more than 10% over the next 12 months.
30.77% Hold - We do not believe this stock offers
conclusive evidence to warrant the purchase or sale of
shares at this time and that its likelihood of positive total
return is roughly in balance with the risk of loss.
25.74% Sell - We believe that this stock is likely to
decline by more than 10% over the next 12 months, with
the risk involved too great to compensate for any
possible returns.
TheStreet.com Ratings, Inc.262 Washington Street, 4th FloorBoston, MA 02108www.thestreet.comResearch Contact: 617-531-9717
Sales Contact: 866-321-8726
VALUATIONBUY. The current P/E ratio indicates a discount compared to an average of 20.63 for the Beverages industry
and a premium compared to the S&P 500 average of 15.68. For additional comparison, its price-to-book ratio
of 4.95 indicates a significant premium versus the S&P 500 average of 2.19 and a discount versus the industry
average of 5.93. The price-to-sales ratio is well above the S&P 500 average, but well below the industry
average. Upon assessment of these and other key valuation criteria, COCA-COLA CO proves to trade at a
discount to investment alternatives within the industry.
1 2 3 4 5Price/Earningspremium discount
KO 18.75 Peers 20.63
• Average. An average P/E ratio can signify an
industry neutral price for a stock and an average
growth expectation.
• KO is trading at a valuation on par with its peers.
1 2 3 4 5Price/CashFlowpremium discount
KO 16.52 Peers 16.15
• Average. The P/CF ratio, a stock’s price divided by
the company's cash flow from operations, is useful
for comparing companies with different capital
requirements or financing structures.
• KO is trading at a valuation on par to its peers.
1 2 3 4 5Price/Projected Earningspremium discount
KO 15.41 Peers 19.24
• Discount. A lower price-to-projected earnings ratio
than its peers can signify a less expensive stock or
lower future growth expectations.
• KO is trading at a discount to its peers.
1 2 3 4 5Price to Earnings/Growthpremium discount
KO 1.82 Peers 2.87
• Discount. The PEG ratio is the stock’s P/E divided
by the consensus estimate of long-term earnings
growth. Faster growth can justify higher price
multiples.
• KO trades at a significant discount to its peers.
1 2 3 4 5Price/Bookpremium discount
KO 4.95 Peers 5.93
• Discount. A lower price-to-book ratio makes a
stock more attractive to investors seeking stocks
with lower market values per dollar of equity on the
balance sheet.
• KO is trading at a discount to its peers.
1 2 3 4 5Earnings Growthlower higher
KO -26.94 Peers 3.91
• Lower. Elevated earnings growth rates can lead to
capital appreciation and justify higher
price-to-earnings ratios.
• However, KO is expected to significantly trail its
peers on the basis of its earnings growth rate.
1 2 3 4 5Price/Salespremium discount
KO 3.36 Peers 4.24
• Discount. In the absence of P/E and P/B multiples,
the price-to-sales ratio can display the value
investors are placing on each dollar of sales.
• KO is trading at a discount to its industry on this
measurement.
1 2 3 4 5Sales Growthlower higher
KO 32.58 Peers 12.62
• Higher. A sales growth rate that exceeds the
industry implies that a company is gaining market
share.
• KO has a sales growth rate that significantly
exceeds its peers.
DISCLAIMER:
The opinions and information contained herein have been obtained or derived from sources believed to be reliable, but
TheStreet.com Ratings, Inc. can not guarantee its accuracy and completeness, and that of the opinions based thereon. Data is
provided via the COMPUSTAT® Xpressfeed product from Standard &Poor’s, a division of The McGraw-Hill Companies, Inc., as
well as other third-party data providers.
TheStreet.com Ratings, Inc. is a wholly owned subsidiary of TheStreet.com, Inc. which is a publisher and has registered as an
investment adviser with the U.S. Securities and Exchange Commission. This research report contains opinions and is provided
for informational purposes only. You should not rely solely upon the research herein for purposes of transacting securities or
other investments, and you are encouraged to conduct your own research and due diligence, and to seek the advice of a
qualified securities professional, before you make any investment. None of the information contained in this report constitutes,
or is intended to constitute a recommendation by TheStreet.com Ratings, Inc. of any particular security or trading strategy or a
determination by TheStreet.com Ratings, Inc. that any security or trading strategy is suitable for any specific person. To the
extent any of the information contained herein may be deemed to be investment advice, such information is impersonal and not
tailored to the investment needs of any specific person.