crawford and kasmidi 2004 - coastal resources center · (lubchenco et al. 2002, ... (crawford et...
TRANSCRIPT

WORKING PAPER
Factors Influencing Progress in EstablishingCommunity-Based Marine Protected Areas
in Likupang Sub-District of North Sulawesi, Indonesia
ByBrian R. Crawford
Associate Coastal Resources ManagerCoastal Resources CenterUniversity of Rhode Island
and
Meidiarti KasmidiExtension OfficerNorth Sulawesi
Indonesia Coastal Resources Management Project (Proyek Pesisir)
2004

1
Factors Influencing Progress in EstablishingCommunity-Based Marine Protected Areas
in Likupang Sub-district of North Sulawesi, Indonesia
By:Brian Crawford and Meidiarti Kasmidi
Abstract
Establishment of community-based small-scale no-take marine reserves is beingused with increasing frequency in the Southeast Asian region. However, there isincreasing concern that they are experiencing high failure rates. Many factorshave been hypothesized to explain the reason for failures and successes includingthe intrinsic characteristics of the community, the level of project inputs and thecharacteristics of change agents assigned to facilitate the planning process. Anempirical analysis of these hypotheses was conducted using a sample of 24villages in North Sulawesi province of Indonesia where community-based no-takemarine reserves were in the early phases of establishment. Factors found tosignificantly influence the rate of progress are village complexity, level ofdevelopment, amount of project inputs and several characteristics of communityorganizer volunteers. In particular, degree of community organizer homophilyrelative to the community was an important factor influencing progress. Level ofgender equity in public meetings and training events had no influence on progress.In addition, no field extension officer attributes were correlated with progress.These findings can be used by projects that use simultaneous interventions inmultiple communities to adjust project strategies in order to obtain economies ofscale, target communities more amenable to community-based interventions andincrease the probability of success. This can thereby result in a better return oninvestments made by local governments and international donors in community-based marine conservation initiatives.

2
Introduction
The use of marine protected areas (MPAs) has become a popular strategy to protect marinebiodiversity as well as enhance and sustain fisheries production (White and Savina 1987, Alcala1988, White 1989, Russ and Alcala 1994, 1996, Wantiez et al. 1997, McClanahan and Mangi2000, NRC 2001, McClanahan and Mangi 2001, Roberts et al. 2001, Ward et al. 2001, Halpernand Warner, 2002, White et al. 2002, Gell and Roberts 2003, Halpern 2003). However, there isincreasing concern that many MPAs are not effectively implemented (Alder 1996, McClanahan1999, Jameson et al. 2002). Community-based MPAs that incorporate community participationand empowerment are often touted as an effective alternative to top down centralized approachesto the establishment and management of MPAs. This approach is widely used in South EastAsia and the Western Pacific region, often as a component of coastal resources managementprograms (Ferrer et al. 1996, White et. al. 1996, Alcala 1998, Johannes 1998, King and Faasili1998, Veitayaki 1998, Pajaro et al. 1999, World Bank 1999). Many of these are small-scale no-take marine reserves. While size is often considered an important criteria in reserve design(Lubchenco et al. 2002, Palumbi 2002,) there is ample evidence that small scale reserves alsohave positive ecological and economic benefits (Russ and Alcala 1996, Horrill et al. 2001, Whiteet al. 2000, 2002, Halpern and Warner 2002, Halpern 2003). However, there is also concern thatcommunity-based marine protected areas (CB-MPAs), are experiencing high failure rates(Crawford et al. 2000, Pomeroy and Carlos 1997, Alcala 2001).
There is a growing body of theory (Ostrom 1997, Carr et al. 2003, Rudd et al. 2003), numerouscase studies (White 1987, 1989, Polotan-de la Cruz 1994, Pomeroy 1994, Ferrer et al. 1996,Johannes 1998, King and Faasili 1998, Veitayaki 1998, Horrill 2001) and an increasing numberof comparative analysis (White et al. 1994, Pomeroy and Carlos 1997, World Bank 1999,Pollnac et al. 2001, Francis et al. 2002, Pomeroy et al. 2002) that identify factors influencingsuccess of community-based approaches for the establishment of small scale no-take marinereserves. For instance, an empirical analysis of 45 sites the Central Visayas region of thePhilippines (Pollnac et al. 2001) identified several project intervention factors and communitycontext factors that influence success of CB-MPAs. However, it is unclear how these factorsmay be applicable in other locations of the world. In addition, many experts of CB-CRMsuggest that attributes of field workers can influence success (Crawford et al. 2000). Diffusionresearch (Rogers 1995) points to the concepts of homophily and heterophily. Homophily is thedegree to which individuals communicating are alike or not alike (heterophilous) with respect tosocial status, education, etc. Communication tends to be better in cases where individuals arehomophilous. Diffusion of innovations within an interpersonal network tend to spread rapidlywhen members of the network are homophilous. However, the introduction of a new innovationoften occurs through hetrophilous relationships between members of different interpersonalnetworks. In the case of a CB-MPA, the homophilous and heterophilous characteristics ofextension workers and community organizers can therefore be important factors influencingdiffusion of this innovation.
Pollnac et al. (2001) were not able to empirically test the role of homophily. They examined theinfluence of whether field workers were assigned part time or full time in the community andfound no statistically significant relationship. Their study sample contained only CB-MPAsunder implementation for at last three years. Hence, detailed information on attributes of field

3
workers relative to the community (degree of homophily or heterophily), other than full or parttime status, was impossible to obtain since they were no longer assigned to the villages.
Community-based coastal resources management approaches are being used with increasingfrequency in Indonesia. Projects such as the USAID-supported Indonesian Coastal ResourcesManagement Project (CRMP) (Crawford et al. 1998, Tulungen et al. 2000) and the multi-donorsupported COREMAP use community-based management strategies as major programcomponents (World Bank 2001). They have pioneered the establishment in Indonesia ofeffective models of community-based coastal management (CB-CRM) as well as theestablishment of small-scale community-based marine protected areas (CB-MPAs). Thedecentralization of marine jurisdiction to local government in 1999 (Patlis et al. 2001, Patlis2003) (National Law No. 22 of 1999) has contributed substantially to this trend (Dahuri andDutton 2000).
The Indonesian Ministry of Marine Affairs and Fisheries (Taryoto 2002) and local governments(Tulungan et al. 1999, Patlis et al. 2003) (e.g. Minahasa Law No. 2 of 2002) are now formulatingstrategies to apply CB-MPA approaches more broadly in a large number of sites. Therefore, therapid diffusion of the CB-MPA innovation throughout the country is likely to occur over the nextdecade. This is similar to the rapid expansion of that occurred in the Philippines (Pajaro et al.1999, Crawford et al. 2000, White et al. 2002) during the 1980s and 1990s.
Since substantial donor and Indonesian government investments are being made in CB-MPAapproaches, increasing the probability of their cost effective and successful adoption is essential.Hence it is useful to examine to what extent factors influencing the success of CB-MPAselsewhere in the world are applicable in Indonesia. In addition, projects such as the CRMP haveexperimented with CB-MPA initiatives that use modified intervention strategies for communitylevel organization and planning that place more emphasis on the roles of village-levelcommunity organizer volunteers and minimize the roles of external field extension agents as apotential cost savings measure. Therefore an examination of the relative importance of extensionagent and community organizer backgrounds and skills and the roles of homophily andheterophily in the diffusion process needs to be understood.
Lastly, many studies have examined the success of community-based MPAs at the time ofproject completion or years after the project has ended. However, project managers are ofteninterested in ways and means to monitor intermediate indicators of success (e.g. processmeasures such as institutions formed, laws passed, etc.) so that project strategies andinterventions can be adjusted during project implementation. By monitoring intermediatemeasures of program success, it is assumed that these milestones will ultimately lead to longer-term outcomes such as improved environmental quality, fisheries production and quality of lifefor coastal communities. Outcome monitoring therefore needs to be phased on a temporal scale(Olsen et al. 1998) as part of an adaptive management process.
Project and Site Background
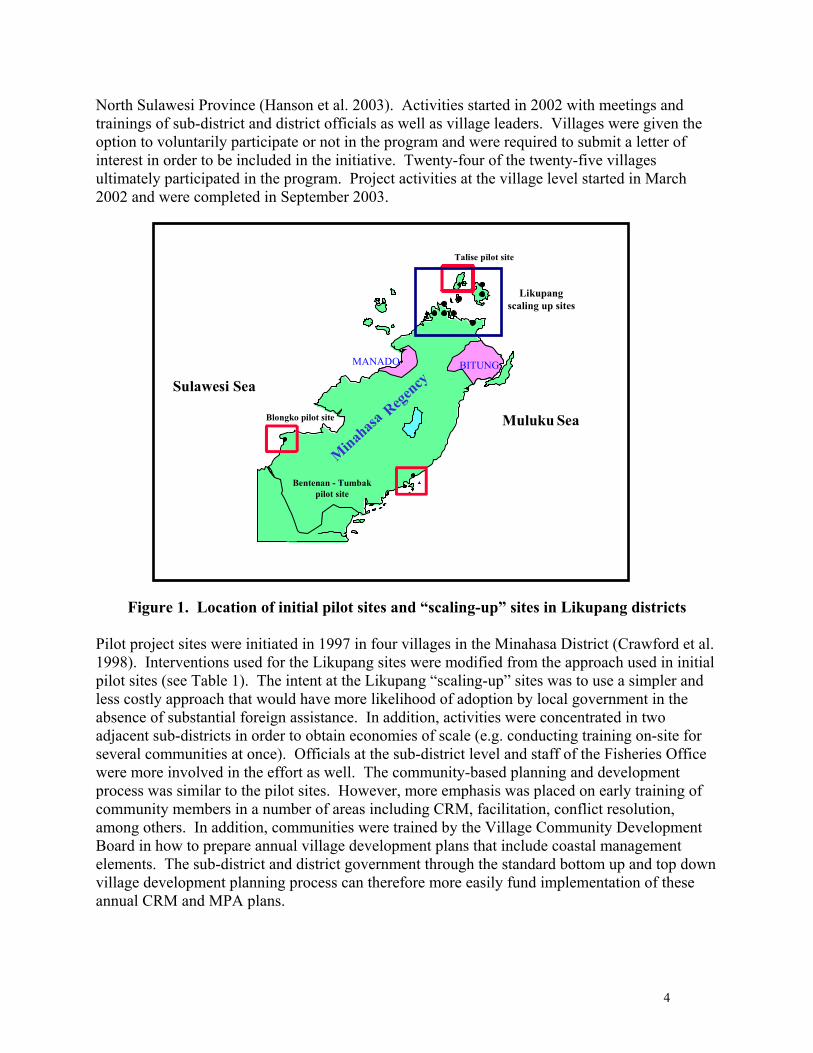
The Indonesian Coastal Resources Management Project initiated a community-based planningeffort in 24 village sites in two Likupang sub-districts of the Minahasa district (Figure 1) of
4
North Sulawesi Province (Hanson et al. 2003). Activities started in 2002 with meetings andtrainings of sub-district and district officials as well as village leaders. Villages were given theoption to voluntarily participate or not in the program and were required to submit a letter ofinterest in order to be included in the initiative. Twenty-four of the twenty-five villagesultimately participated in the program. Project activities at the village level started in March2002 and were completed in September 2003.
Figure 1. Location of initial pilot sites and “scaling-up” sites in Likupang districts
Pilot project sites were initiated in 1997 in four villages in the Minahasa District (Crawford et al.1998). Interventions used for the Likupang sites were modified from the approach used in initialpilot sites (see Table 1). The intent at the Likupang “scaling-up” sites was to use a simpler andless costly approach that would have more likelihood of adoption by local government in theabsence of substantial foreign assistance. In addition, activities were concentrated in twoadjacent sub-districts in order to obtain economies of scale (e.g. conducting training on-site forseveral communities at once). Officials at the sub-district level and staff of the Fisheries Officewere more involved in the effort as well. The community-based planning and developmentprocess was similar to the pilot sites. However, more emphasis was placed on early training ofcommunity members in a number of areas including CRM, facilitation, conflict resolution,among others. In addition, communities were trained by the Village Community DevelopmentBoard in how to prepare annual village development plans that include coastal managementelements. The sub-district and district government through the standard bottom up and top downvillage development planning process can therefore more easily fund implementation of theseannual CRM and MPA plans.
MANADO BITUNG
Bentenan - Tumbakpilot site
-
Talise pilot site
Blongko pilot site
Sulawesi Sea
Muluku Sea
Minahasa
Rege
ncy
Likupangscaling up sites

5
Table 1. Comparison of pilot site and scaling up site strategiesPilot Sites Scaling-up Sites
• Full time field extension officers • Part time field extension officers• 1-2 Community field assistants with small
financial remuneration• 3-6 Community organizers unpaid volunteers
• Ad hoc government staff to support communityplanning
• Full time government staff to support communityplanning
• Limited NGO Involvement in public educationand awareness
• Substantial NGO involvement in public educationand awareness
• Management committee established after villageplan approved
• Management committee established early in theprocess
• Community selected by provincial government • Voluntary, community self selected• Active support from regional government &
project block grants• Minimal financial support from government and
project• Village ordinance for institutionalization • District framework ordinance reinforcing village
ordinances
Another important difference in the Likupang scaling-up sites was the use of field extensionofficers and community organizers. In the pilot sites, one full time field extension officer wasassigned to the site for a period of one to two years. A part-time field assistant from thecommunity assisted them. In the scaling up sites, the project hired a team of field extensionagents (FEOs) that were supervised by an experienced team of senior extension agents involvedin the initial pilot sites. The FEOs were all relatively young, recent graduates from the localuniversity. They did not live in the villages but worked out of a provincial office in Manado.Each FEO was responsible for community organizing and planning efforts in several villages.The FEOs were assisted by a group of community organizers (COs) that were all un-paidvolunteers who were village residents and nominated by their village government.
Methodology
This paper empirically examines factors that contribute to successful CB-MPAs in Indonesia.The study analyzes information from 24 village sites in two Likupang Sub-Districts of NorthSulawesi Indonesia involved in a community based planning effort started in March 2002 by theUSAID-funded CRMP. There are over 130 coastal villages in the Minahasa District and as ofSeptember 2003, twenty-nine villages have on-going CB-CRM initiatives and established CB-MPAs. The methodology used in this study is similar to Pollnac et el. (2001), with a number ofimportant differences. This study did not directly collect data in the sample sites using a rapidassessment approach. Instead, available secondary data, information from project reports anddata provided by project staff working in the villages was used. Particular attention was paid tothe influence of FEO and CO characteristics. A different measure of success was also used andis described below. All data were collected between October 2002 and January 2003.
The dependent variable
Since these sites were in the early stages of planning at the time of the study, a progress measurewas used as the dependent variable of success. A summary score was given to each communitysite based on the number of project outputs and milestones achieved. These milestones have

6
been used by the project management team to track progress within the 24 villages in Likupang.There are eight milestone indicators of progress including:
1. Development of a coastal profile;2. Selection of a marine sanctuary site and/or;3. Selection of mangrove sanctuary site;4. Formation of a management group;5. Development of a village ordinance;6. Development of a management plan;7. Submission of a grant proposal for installation of maker buoys and signboards, and;8. Installation of sanctuary boundary marker buoys and signboards.
Each site was given a score for each indicator. A score of 0 was assigned if the milestone hadnot been achieved, 0.5 if the milestone had be partially achieved and 1 if the milestone was fullyachieved. Scores were summed for a total possible Milestone/Progress score ranging from zeroto eight. The senior project extension agent responsible for supervision of activities in Likupangscored each site for each milestone indicator.
Independent variables
Independent variables that are hypothesized to influence success of CB-MPAs were compiled.These variables were summarized from the existing literature on community-based managementand from expert focus group meetings in the Philippines by Pollnac et al. (2001) and Crawford etal. (2000). A subset of these variables considered appropriate to the local Indonesia context werereviewed with the CRMP senior extension team in North Sulawesi. Several new variables wereadded, particularly attributes of FEOs and COs that researchers and extension staff feltinfluenced success. These independent variables were organized into several categories for theanalysis – community context, project activity, extension officer and community organizervariables. Each of these independent variables represents a hypothesis that it is related to makingprogress towards establishing CB-MPAs but no explicit assumptions were made a-priori as tothe direction of that relationship.
Context variables are the intrinsic characteristics of the community including a number ofmeasures concerning village size, sociocultural complexity and various dimensions concerninglevel of development. Secondary data from the provincial Bureau of Statistics was the mainsource of information for the context variables. This was supplemented with informationprovided by senior extension officers and field extension workers assigned to each site.Information was cross checked with information contained in village profiles and CRMP reports.
Project activity variables consist of various project inputs implemented as part of the MPAestablishment and planning process including training events and formal meetings. Thisinformation was collected from project reports. FEO variables included background (e.g. age,education, ethnicity, gender) and skill attributes of the field extension officers (e.g. leadership,teamwork, communications skills). CO variables included the background (e.g. social status age,education, ethnicity, gender) and skills attributes (e.g. leadership, teamwork, communicationsskills, etc.) of the volunteer community organizers. An initial list of FEO attributes, or variables

7
compiled by the research team were reviewed with the senior project extension team and FEOsin a focus group meeting. The variables were then modified based on their assessment of whichvariables they considered most important. Data on each variable for each FEO were thenobtained by interviewing the FEOs (e.g. age, marital status) as well as by asking supervisingsenior extension staff to provide rank scores for FEO skill attributes (e.g. communications andinterpersonal skills). An identical procedure was used for determining CO variables. However,FEOs then compiled information on the community organizers and also scored each individualCO for skill attributes. Detailed information on the attributes of the FEOs and COs was an areathat the Pollnac et al. (2001) study was not able to fully address and is emphasized in thisanalysis. Summing several independent variable scores created a number of composite variablesin the categories of community context, project activities as well as FEO and CO attributes,including measures representing degree of homophily with the village community. Thevariables, data source, as well as the measure or scoring procedure are provided in Table 2.
Data Analysis
Zero order correlations were calculated between the progress measure and each independentvariable. Results are reported only for independent variables demonstrating statisticalsignificance (p<0.10). Principle component analysis (PCA) was conducted on those independentvariables that exhibited statistically significant (p<0.10) zero order correlations with the progressmeasure. A total of 15 variables were included in the initial PCA using varimax rotation.Results were reviewed for two and three principal components consecutively and variableseliminated with loadings of less than 0.5 on all factors. Two principle components were used tocalculate principle component scores for each sample village and correlations calculated with theprogress measure. Stepwise multiple regression was conducted using the progress score as thedependent variable. Fifteen independent variables with zero order correlations with the progressmeasure demonstrating a probability less than 0.10 were entered into the calculations using aforward stepwise process. Variables were sequentially entered or removed until all independentvariables in the equation had a probability of less than 0.10.
8
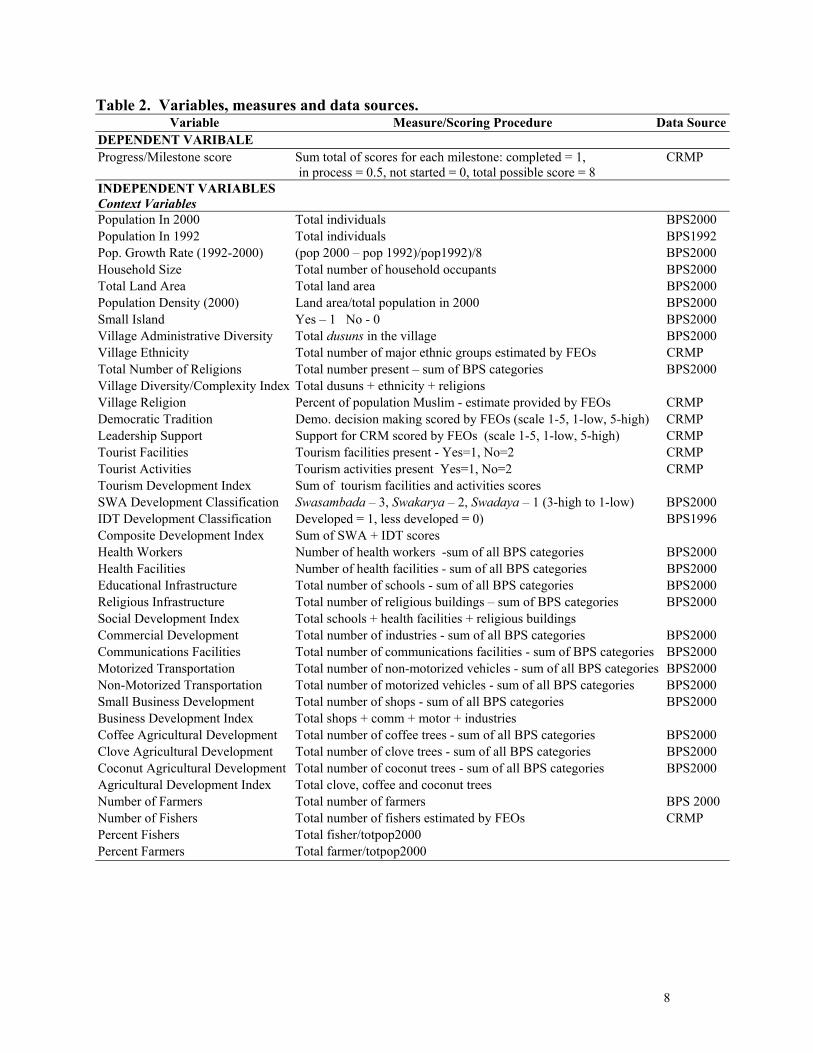
Table 2. Variables, measures and data sources.Variable Measure/Scoring Procedure Data Source
DEPENDENT VARIBALEProgress/Milestone score Sum total of scores for each milestone: completed = 1,
in process = 0.5, not started = 0, total possible score = 8CRMP
INDEPENDENT VARIABLESContext VariablesPopulation In 2000 Total individuals BPS2000Population In 1992 Total individuals BPS1992Pop. Growth Rate (1992-2000) (pop 2000 – pop 1992)/pop1992)/8 BPS2000Household Size Total number of household occupants BPS2000Total Land Area Total land area BPS2000Population Density (2000) Land area/total population in 2000 BPS2000Small Island Yes – 1 No - 0 BPS2000Village Administrative Diversity Total dusuns in the village BPS2000Village Ethnicity Total number of major ethnic groups estimated by FEOs CRMPTotal Number of Religions Total number present – sum of BPS categories BPS2000Village Diversity/Complexity Index Total dusuns + ethnicity + religionsVillage Religion Percent of population Muslim - estimate provided by FEOs CRMPDemocratic Tradition Demo. decision making scored by FEOs (scale 1-5, 1-low, 5-high) CRMPLeadership Support Support for CRM scored by FEOs (scale 1-5, 1-low, 5-high) CRMPTourist Facilities Tourism facilities present - Yes=1, No=2 CRMPTourist Activities Tourism activities present Yes=1, No=2 CRMPTourism Development Index Sum of tourism facilities and activities scoresSWA Development Classification Swasambada – 3, Swakarya – 2, Swadaya – 1 (3-high to 1-low) BPS2000IDT Development Classification Developed = 1, less developed = 0) BPS1996Composite Development Index Sum of SWA + IDT scoresHealth Workers Number of health workers -sum of all BPS categories BPS2000Health Facilities Number of health facilities - sum of all BPS categories BPS2000Educational Infrastructure Total number of schools - sum of all BPS categories BPS2000Religious Infrastructure Total number of religious buildings – sum of BPS categories BPS2000Social Development Index Total schools + health facilities + religious buildingsCommercial Development Total number of industries - sum of all BPS categories BPS2000Communications Facilities Total number of communications facilities - sum of BPS categories BPS2000Motorized Transportation Total number of non-motorized vehicles - sum of all BPS categories BPS2000Non-Motorized Transportation Total number of motorized vehicles - sum of all BPS categories BPS2000Small Business Development Total number of shops - sum of all BPS categories BPS2000Business Development Index Total shops + comm + motor + industriesCoffee Agricultural Development Total number of coffee trees - sum of all BPS categories BPS2000Clove Agricultural Development Total number of clove trees - sum of all BPS categories BPS2000Coconut Agricultural Development Total number of coconut trees - sum of all BPS categories BPS2000Agricultural Development Index Total clove, coffee and coconut treesNumber of Farmers Total number of farmers BPS 2000Number of Fishers Total number of fishers estimated by FEOs CRMPPercent Fishers Total fisher/totpop2000Percent Farmers Total farmer/totpop2000

9
Table 2. Variables, measures and data sources (continued).Variable Measure Data Source
INDEPENDENT VARIABLESProject Input and Activity VariablesTraining on Facilitation Yes – 1 No - 0 CRMPTraining on Inst. Strengthening Yes – 1 No - 0 CRMPTraining on Reef Monitoring Yes – 1 No - 0 CRMPTraining on ICM Planning Yes – 1 No - 0 CRMPTraining on Village Ordinance Yes – 1 No - 0 CRMPTraining on Management Group Yes – 1 No - 0 CRMPTraining on Proposal Yes – 1 No - 0 CRMPTraining on Environmental Ed. Yes – 1 No - 0 CRMPTotal Training Programs Summation of all training types implemented CRMPTotal Training Participants Total number of participants CRMPPercent Male Training Participants Total male participants/Total participants CRMPTotal Meetings Implemented Total number of events held CRMPTotal Number of Meeting Total number of participants CRMPPercent Male Meeting Participants Total male participants/Total participants CRMPTotal Events Total number of all training and meetings held CRMPTotal Participants Total number of participants in all events CRMPTotal Percent % Male Participants (Total male participants/Total participants)100 CRMPCommunity Organizer Attribute VariablesCO Age Sum total of ages of all COs/Number of COs CRMPCO Gender Number COs male/Total number of COs CRMPCO Marital Status Number COs married /Total number of COs CRMPCO Work Experience Total years work experience of all COs/Number of COs CRMPCO Government Experience Number with government experience/Total number for the village CRMPCO Village Organization Exp. Number of COs members of village organization/Total number COs CRMPCO Social Status Sum of rankings for all COs/No. COs (scale 1-5, 1-low, 5-high) CRMPCO Background Score Sum of % work exp + % vil org exp + % gov exCO Ethnic Homophily Total with same ethnicity as majority/total COs CRMPCO Religious Homophily Total with same religion of majority/total COs CRMPComposite Homophily Score Sum of % same Ethnic + % same Religion + % edu<10 yrs.CO Communications Skills (Avg. ranking for all COs by FEO) (scale 1-5, 1-low, 5-high) CRMPCO Leadership Skills (Avg. ranking for all COs by FEO) (scale 1-5, 1-low, 5-high) CRMPCO Organization Skills (Avg. ranking for all COs by FEO) (scale 1-5, 1-low, 5-high) CRMPCO Teamwork Skills (Avg. ranking for all COs by FEO) (scale 1-5, 1-low, 5-high) CRMPCO Interpersonal Skills (Avg. ranking for all COs by FEO) (scale 1-5, 1-low, 5-high) CRMPComposite CO Skills Score Total of comm, lead, org, team, inter. skills scoresCO Effort Total number of COs for the village CRMPField Extension Officer Attribute VariablesFEO Age Total years CRMPFEO Gender Male = 1, Female =0 CRMPFEO Education Type of Degree: Marine Science or Fisheries = 1, other =0 CRMPFEO Marital Status Married =1, not married = 0 CRMPFEO Work Experience Total years of work experience CRMPFEO Composite Background Score Total age>30=1, +edu + marital + work>3.99 =1FEO Ethnic Homophily FEO ethnicity same as most dominant ethnic group = 1, different=0 CRMPFEO Religious Homophily FEO religion same as most dominant religion = 1, different=0 CRMPComposite Homophily Score Total FEO ethnic homophily + religous homophilyFEO Communication Skills Ranking by senior extension officers (scale 1-5, 1-low, 5-high) CRMPFEO Leadership Skills Ranking by senior extension officers (scale 1-5, 1-low, 5-high) CRMPFEO Organizational Skills Ranking by senior extension officers (scale 1-5, 1-low, 5-high) CRMPFEO Analytic Skills Ranking by senior extension officers (scale 1-5, 1-low, 5-high) CRMPComposite FEO Skills Score Total of com, lead, org, analy skills scoresFEO Effort 1/total number of villages assigned to FEO CRMP

10
Results
The following are the results of the analysis of factors associated with progress inestablishing community-based MPAs at village sites in Likupang. Table 3 shows thestatistically significant (p<0.10) Pearson correlation coefficients for each independentvariable relative to the dependent variable of success (milestone score of progress). Theseare organized into four areas - community attributes, project activities, community organizerattributes and field extension officer attributes. The table shows the correlation coefficient,and corresponding probability for each statistically significant variable with a p < 0.10 usedin the analysis.
Table 3. Correlation of milestone scores with selected independent variablesIndependent Variables Pearson
CorrelationProbability
Community AttributesPopulation (2000) -0.481 0.017*Village Administrative Diversity -0.437 0.033*Leadership Support 0.384 0.064Social Development Index -0.371 0.075Small Business Development -0.408 0.048*Communications Development -0.484 0.017*Business Development Index -0.456 0.025*Total Number of Clove Trees -0.399 0.054Agricultural Development Index -0.471 0.020*Project ActivitiesReef Monitoring Training 0.414 0.044*Management Group Training 0.575 0.003**Proposal Development Training 0.517 0.010*Total Trainings Implemented 0.573 0.003**Total Training Participants 0.462 0.023*Total Meetings Implemented 0.471 0.020*Total Meeting Participants 0.349 0.094Total Events Implemented 0.575 0.003**Total Participants 0.397 0.055Community Organizer AttributesPercent with Work Experience -0.454 0.026*Average Years of Work Experience -0.354 0.089Composite Homophily Score 0.382 0.066Average Communications Skills Score -0.395 0.056Total Number of Community Organizers 0.504 0.012*Extension Officer Attributes None significant
N = 24 * p<0.05 ** p<0.01
Village characteristics or context factors associated with better progress that are statisticallysignificant at the 0.10 alpha level include:
• Village Population and Administrative Diversity – Villages with smaller total populationand a smaller number of sub-villages tend to have higher Milestone/Progress scores.
• Social Development Index – The social development index consisting of total number ofeducational, religious and health facilities was inversely correlated with theMilestone/Progress Score.
• Communications Development, Small Business Development and Business DevelopmentIndex - Villages with fewer communications facilities, fewer small businesses and a lowercomposite business development index (total communications facilities, commercialestablishments, small businesses, motorized transportation units and tourism facilities)

11
tend to have higher milestone/progress scores. Several other development indicators werenot significant.
• Leadership Support – Villages with a higher score on leadership support tend to havehigher milestone/progress scores.
• Farming- Two farming variables were inversely correlated with the milestone/progressscore including the number of clove trees (an indicator of agricultural development) andthe total agricultural development index. However, several of the individual agriculturaldevelopment indicators were not significant.
Clove trees are usually not abundant in coastal areas and are typically found at higherelevations. Therefore, this variable may be an indicator of the degree to which the villageland area is coastal. The two significant agricultural related variables suggest that villageswith less dependence on farming (and by inference more dependence of marine resourcessuch as fisheries) tend have higher milestone/progress scores.
We would expect that number of fishers would be positively correlated with themilestone/progress score as this was a consistent result in the Pollnac et al. (2001) study. Inthis study, it was positively correlated but not statistically significant. The small number offishers and low variance in the data may be a factor contributing to this explanation. Inaddition, many households in Minahasa have multiple occupations (Pollnac et al. 1997, 1998,Sukmara et al. 2001). For instance a household or individual may farm, fish and be involvedin other productive activities. Hence by using only one occupational class, individualsclassified or self-identified as farmers may also fish as a part-time occupation. Thereforeusing this measure taken from census data, village profiles or village leaders may under-represent the actual number of households and individuals who rely to some extent onfishing. Number of boats was not significant either.
It should be noted that all community context variables, with the exception of leadershipsupport, were negatively correlated with the progress score. Hence, in general, smallervillages with less development tend to have higher progress scores. The relationship ofvillage population to progress is similar to the results of the Pollnac et al. (2001) study.However, the correlation with many of the development indicators differed with that ofPollnac et al. (2001) where no development measures were significantly correlated withsuccess. This was surprising. We must bear in mind however, that different successmeasures were used and measured at a different time in the project cycle. Hence, while lessdeveloped villages in this case tend to make faster progress (higher progress score), it maynot be important over the long term after projects are completed. Hence, we may be able tomake faster progress in smaller less developed villages, but longer project time framesapplied in larger more developed villages may ultimately result in equal long term success aswell. The village size and level of development therefore may be important if projecttimeframes are short or project resources limited. It is also possible that level of developmentis important in Indonesia but not in the Philippines due some other supra variable that differsbetween these nations. More research is needed in this area.
Activity indicators related to faster progress are:
• Training effort – Villages with a greater number of total trainings implemented andgreater number of participants attending trainings tend to have higher milestone/progressscores. These process measures of project activities can be viewed as capacitydevelopment and public participation indicators.

12
• Types of training - Three types of training were directly correlated with themilestone/progress score. These were manta tow, management group and proposaltraining. Several training courses such as on facilitation techniques and CRM trainingwere not statistically significant. However, on examination of the raw data, these courseswere implemented in a majority of villages so the variance was quite low. Total numberof training courses implemented therefore is a more meaningful indicator.
• Meeting effort – The more meetings held and the larger the number of participantsattending meetings, the greater the likelihood of a higher milestone/progress score.
• Total number of events and participants – Total number of events and total number ofparticipants was positively correlated with the Milestone/Progress Score.
The large number of project activity variables positively correlated with higher progressscores is not surprising. Without project inputs, it is difficult to see how communities couldmake significant progress. This reinforces many findings that emphasize the importance bothpublic participation and capacity development. Rudd (2003) has emphasized the need forcapacity development to build social capital especially in decentralized systems where localgovernment institutions are weak. This type of situation is found in Indonesia.
Community organizer characteristics associated with progress include:
• Work Experience – The percent of COs with work experience and average years of COwork expereince was inversely correlated with the milestone/progress score.
• Total Number of Community Organizers – The number of community organizers wasdirectly correlated with the Milestone/Progress Score.
• Community Organizer Homophily Score – CO homophily was directly correlated with themilestone/progress score
• Communications Skills –The average communications skills score for all communityorganizers in the village was inversely correlated with the milestone/progress score.
The fact that work experience was indirectly correlated with progress was opposite ourexpectations. Project extension officers were queried about this result. They felt that certainindividuals in the community have little free time to devote to volunteer activities and areengaged in food production and/or income generating activities. Hence, those with greaterwork experience may be more gainfully employed on a full time basis and less able to devotetime to community organizing activities. Therefore, work experience may be an indirectindicator of total amount of time COs are able to devote to project activities.
Total number of COs is likely related to total time or effort devoted to community organizingwithin the community. More people means more effort that results in faster progress.
The positive correlation between progress and CO homophily corresponds with otherresearch on extension. The COs act as an important link for diffusion of the CB-MPAinnovation in the village. Since the community selects and therefore respects the COs , theyare likely opinion leaders within the community, increasing the likelihood of adoption of theCB-MPA innovation by others within the community. Once COs accept the innovation basedon information they obtain through trainings organized and implemented by the fieldextension agents they likely diffuse the innovation rapidly within their own homophilousintra-community communications network. Many extension agents have remarked that crossvisits between the older pilot sites and new scaling up sites were very influential inmotivating new communities to experiment with CB-MPAs. One study in North Sulawesi

13
demonstrated that knowledge of the Blongko village MPA rules diffused from Blongko toneighboring villages primarily through fisher households (Crawford et al. 2000), a relativelyhomophilous group. Fisher to fisher and community to community communication channelsare therefore likely to represent homophilous communication networks.
The inverse correlation between communications skills and progress scores was opposite ourexpectations as good communicators can spread information more rapidly. However, FEOsranked the communications skills of COs and if FEOs are hetrophilous in relation to the COs,communication between them is more difficult. Hence, a low communication rank by theFEO may represent the ability of the CO to communicate with the FEO, not the ability of theCO to communicate effectively with village residents. COs with higher communicationrankings may be more homophilous with the FEO and by inference, more heterophilous withmembers of their own community. Therefore a low communication skills rank by the FEOmay be an indirect indicator of CO homophily with others in the community, resulting in aninverse correlation with the progress measure. More research is needed in this area. Forinstance, methodologically, CO interpersonal communications and leadership skills may bemore accurately ranked by community peers rather than FEOs and therefore could provide adifferent result.
There were no statistically significant extension officer characteristics associated withprogress. This is a surprising finding since many experts, particularly in the Philippines,consider their role crucial in the planning and development process (Crawford et al. 2000).However, Pollnac et al. (2001) found no relationship between part time or full time status offield extension workers in the Philippines. CRMP staff in North Sulawesi are of a similaropinion as experts in the Philippines and also felt that the role of FEOs is very important.One possible explanation may be that there was not enough variance in the data to carry out auseful analysis. This could have been caused by a reluctance of senior extension officers togive a wide range of scores to FEOs. Another explanation may be that they all have adequateand similar capacity to perform their responsibilities based on hiring requirements andorientation training provided, creating a relatively uniform level of capabilities among thegroup. Hiring requirements and initial training were based on lessons from assignment ofFEOs in the original pilot sites. Hence, they may all have minimal or essential characteristicsdeemed important.
While homophily can be important, it was not significant in this case of FEOs. However, allthe FEOs were from the local province and have some knowledge of local dialects such asManadonese. The results may have differed if the sample included FEOs from more far-flung locations of Indonesia, such as Java with no knowledge of local dialects and culture.The local FEOs therefore may be homophilous relative to a possible national pool of FEOs.However, there may be another explanation.
New ideas often enter a system through individuals with higher status that are consideredopinion leaders (Rogers 1995). These individuals are often heterphilous with mostcommunity residents. COs may view FEOs as opinion leaders of higher status since theylead training courses and are university graduates. In this case, we could view COs ascommunity innovators that accept new ideas from the outside through communicationsnetworks (e.g training courses) with heterophilous FEOs (heterophilous relative to the COs).
A third explanation is also possible. The roles and skills of FEOs may be less criticalcompared to other factors such as context and activity variables as well as the role of the COs

14
as noted above. The fact that the FEOs are not living full time in the community may be areason that their backgrounds and skills are less critical for progress compared to the COs. Incases where FEOs are assigned full time to the community and where there is less use ofCOs, some FEO attributes may be important and therefore should not necessarily be de-emphasized based on results in this particular analysis. More research on communicationnetworks and the role of homophily and heterophily is needed.
No gender variables in the project activities, FEO or CO categories were significantlycorrelated with progress. This also goes against the conventional wisdom that stresses theneed for gender equity as an important aspect of the quality of community participation.However, the establishment of a CB-MPA in the marine waters of the village involvesstakeholders that are primarily fishers, which are mostly male. Some women fish, manyglean the reef flats and women are often involved in shore based fisheries activities such asmarketing or processing (Pollnac et al. 1997a, 1997b, Pollnac et al. 1998, Crawford et al.1999, Kussoy et al. 1999). However, males dominate activities on the water they are themost important stakeholders in determining MPA location as well as allowable andprohibited activities. In all villages, male participation exceeded 50 percent of participants intraining events and meetings and was an average of 83 and 75 percent respectively. Hence itwould seem that a process with a high level of male participation in this case is appropriate.It is likely that if a significant number of villages had percentages of male participation below50 percent (female dominated project training and meeting activities), we may have had adifferent result.
Principle component analysis using two and then three factors were compared. Two ratherthan three components resulted in a better interpretation of the data even though theeigenvalue for three factors was approximately half the eigenvalue of two factors. Datareduction using three components resulted in the third component having only one variablewith a loading greater that 0.5, hence, it did not contribute to a better interpretation or asignificant reduction of the data. Loadings for each variable on the two principle componentanalysis were examined and two variables - total number of COs and total number of clovetrees - were eliminated since they demonstrated low loadings (< 0.5) on both factors.Thirteen variables were then used in the final analysis. The loadings for each variable usingtwo components are provided in Table 4. Factor loadings and Scree plots are presented in
Table 4. Component loadingsVariable Community Complexity Project Effort
Business Development Index 0.960 -0.121Communications Index 0.957 -0.150Population (2000) 0.938 -0.237Small Business Development 0.917 -0.193Number of Dusuns 0.787 -0.148Percent COs with Work Experience 0.558 0.060Agricultural Development Index 0.520 -0.170Total Events -0.193 0.922Total Meetings Implemented -0.008 0.884Total Training Implemented -0.100 0.861Proposal Development Training -0.231 0.750Total Trainings Implemented -0.027 0.693Management Group Training -0.233 0.682
Percent of Total Variance Explained 37.801 31.271N = 24

15
Figure 2. The first component is interpreted as community complexity since all of thevariables loading strongest and positively on this component are various communitycharacteristics such as population size and administrative diversity of the village as well asseveral different development characteristics. Even the percent of COs with work experiencecan loosely be considered a community characteristic in relation to the project context. Thesecond component is interpreted as project effort since all the variables loading highest andpositively on this component are project inputs (number of events) or outputs (numberpersons trained). Hence this component tends to be a holistic measure of project activity –total effort.
Figure 2. Plot of factor loadings for two principle componentsand Scree plot using thirteen variables
Factor Loadings Plot
-1.0 -0.5 0.0 0.5 1.0FACTOR(1)
-1.0
-0.5
0.0
0.5
1.0
FAC
TOR
(2)
TRAIN6TRAIN7
TOTEVENTSTOTTRIMP
TOTTPART
TOTMIMP
BUSDEVTOTCOMPOP00TOTSHOPDUSUNS
COPERWK
AGDEV
Scree Plot
0 5 10 15 20Number of Factors
0
1
2
3
4
5
6
7
Eige
n val
ue
Both principle components – community complexity and project effort – are correlated withthe milestone/progress score (Table 5). Community complexity is negatively correlated withprogress. This is expected since all of the variables loading most strongly on this componentare individually, negatively correlated with progress. Again, this reinforces results from theindividual zero order correlations that less developed, smaller villages with feweradministrative divisions make faster progress. This fits with Ostrom’s (1994) institutionaldesign principles for community-based management of common pool resources wherebysmaller more homogeneous groups tend to be more successful.
Table 5. Correlations between principle components and milestone scorePrinciple Component R Prob.Community Complexity -0.442 0.030Project Effort 0.574 0.003
N = 24
Stepwise forward multiple regression using the milestone/progress score as the dependentvariable resulted in three independent variables being entered into the equation (Table 6).One case was eliminated in this analysis due to missing data. Total number of events, COhomophily score and average years of CO work experience were included in the model.Total number of events and homophily score contributed positively to the progress score. COwork experience contributed negatively. Total number of events and homophily scorecontributed more strongly to the result (higher standardized coefficients). It is interesting tonote that again, total project effort is an important predictor variable. It suggests that shortcuts made on project inputs, not unusual when managers are faced with budget limitations,

16
will not produce favorable results and may be a primary reason why many CB-CRM effortstend to fail.
Table 6. Results of Forward Stepwise RegressionIndependent Variable Coefficient Std Error Std Coef Tol. df F P
Total Number of Events 0.219 0.057 0.564 0.95435 1 14.639 0.001CO Homohpily score 0.011 0.003 0.443 0.99134 1 9.394 0.006Avg. Yrs. of CO Work Experience -0.140 0.079 -0.261 0.96074 1 3.155 0.091
N = 23, R = 0.765, R-Squared = 0.586
Conclusions and Recomendations
There are remarkable similarities between the results of this study in Indonesia and thoseobtained by Pollnac et al. (2001) in the Philippines. Villages with smaller populations andstronger leadership support were predictors of success in the Philippines study and weresignificant in this analysis as well. Hence, these factors seem to have widespreadapplicability for community-based management programs. Villages with less administrativediversity (number of sub-villages) also had higher progress scores in this study. This mayalso be an indicator of village population. Regardless, smaller less complicated communitiestend to be easier to achieve progress.
There were also a number of unexpected differences between the Philippine and Indonesiastudies. Several development indicators were correlated with progress in this study whereasnone were correlated with success in the Philippines. Data used from the Indonesia censusstatistics as the basis for development and complexity measures may be better indicators thanthose used in the Philippines. However, the community complexity PCA factor as well asevery community attribute correlated with progress are also significantly correlated withpopulation (see Table 7). Hence, most of the development indicators used in Indonesia mayonly be surrogate measures of village size. Further research is needed to determine whetherthese results and the differences in indicators truly reflect accurate levels of development, orjust village size or complexity. Village complexity fits well with community-basedmanagement theory and this may be the underlying causal factor of the empirical resultsgenerated.
Table 7. Correlations between village population in 2000with selected independent variablesVariable R P
Village Administrative Diversity 0.813 0.000Leadership Support -0.406 0.049Social Development Index 0.477 0.019Small Business Development 0.925 0.000Communications Development 0.918 0.000Business Development Index 0.923 0.000Total Number of Clove Trees 0.345 0.099Agricultural Development Index 0.456 0.025Community Complexity PCA Factor 0.938 0.000
N=24
Communities located on small islands were not significantly correlated with progress in theLikupang case, which is in contrast to the Philippines. However, communities located onsmall islands in the Philippines were related to smaller populations. There was no significant

17
difference in mean population sizes between mainland and small island communities in thisstudy. Hence, population size rather than physical geography may play a more importantdeterminant role.
Tourism was not a predictor of success in Indonesia as it was for one analysis the PhilippinesPollnac (in press). This may be due to the fact that Likupang project activities have notemphasized tourism development and no CB-MPAs in North Sulawesi at this time areearning revenues from diver tourism. This is in contrast to the Philippines where some CB-MPA sites are earning significant revenues from rural sites such as on Apo Island inmunicipalities located in proximity to the large urban centers (White et al. 2001). It may alsobe too early in the process for any of the Indonesian CB-MPAs to have obtained tourismbenefits yet. The Pollnac (in press) study in the Philippines was undertaken after the CB-MPAs had been established for at least three years, allowing substantial time to startgenerating benefits in the form of dive tourism revenues. In contrast, only a few of theIndonesian MPAs were formally established at the time of this analysis and several sites aremangrove MPAs that have no potential as dive tourism sites. The lack of emphasis onpromoting dive tourism revenues in the MPA development and management strategy inIndonesia may also be a factor.
CRM and facilitation trainings were not significantly correlated with progress even thoughsenior project managers felt this was important. This is may be due to the fact that mostvillages had received this training so at this stage in the process little variance is exhibited inthe data. This does not mean these training events are unimportant, and they may well be.However, they did not seem to be useful individual indicators for this analysis.
FEO characteristics were not significantly correlated with progress. Hence it would seemthat the range of variation in the background and skills of the current cohort of FEOs isadequate. This should be factored into hiring policies in the future. In addition, the trainingand orientation that these FEOs received prior to and during their field service should also beprovided to new inexperienced hires.
Communications skills of COs was inversely correlated with progress. Several possibleexplanations have been provided for this unusual result. Given the uncertainty inunderstanding the reasons behind this, it should not be used as a recommendation in COselection practices until further research has been undertaken. In future sites, projects shouldwork closely with the villages to select as many COs as possible since the total number ofCOs was significantly correlated with progress. They can be of any age, marital status orgender. However, they should have homophilous characteristics in relation to the generalcommunity with respect to ethnicity, religion and educational attainment. This analysis alsosuggests government experience or membership in community organizations should not be arequirement
The role of COs is of particular importance, especially if FEOs are not assigned full time tothe village. It is important to note that in a country that has been torn recently by social strifebetween various religious and ethnic groups, homophilic characteristics such as religion andethnicity of FEOs had little bearing on progress in the case of Likupang. This may be due tothe highly diverse social characteristics between and among coastal communities in Minahasawhere typically there is a rich mixture of individuals with different religions and ethnicbackgrounds. Therefore, in spite of heterophilous characteristics of outside change agents notresident in the community, they may still be accepted as opinion leaders by the COs selected

18
by the community. However, as previously mentioned, homophilous characteristics of COsincluding ethnicity, religion and educational attainment do seem to be important at the intra-community level.
Interestingly, no gender variables were significantly correlated with progress in this analysis,either with respect to the project activity variables or with respect to FEO and COcharacteristics. This would seem to go against conventional wisdom. There are two possibleexplanations. First, gender may not be important to achieving the success measures usedhere. It should be noted that the progress score quantifies outputs such as ordinances, plansand organizations and does not measure any variables concerning individual behaviors orattitudes or social equity. Therefore the outputs could conceivably be achieved with little orno inputs from female members of the community, particularly if village institutions are maledominated, which tends to be the case. In addition, the primary stakeholders for MPAdesignation are fishers, a male dominated activity. However, another possibility is that theproject has adequately addressed gender issues so that they do not show up as a relevantfactor towards making progress. Extension officers have often remarked on the importanceof informal participation and education, which is not captured in any of the more formalprogress measures such as attendance at public meetings and training events. Therefore, wehave no way of assessing how informal interactions have influenced results.
A better understanding is needed of how FEOs and COs influence success. In this study,FEO backgrounds and skills did not seem to be important. Until more research is conducted,hiring FEOs with the characteristics that experienced extension agents suggest would bewise. Many characteristics of COs also seemed unimportant except homophilouscharacteristics and total number of COs. In addition, the relationship of lower COcommunications skills with progress is also puzzling. Different ways of measuring skillattributes should be tested to validate these initial findings and to rule out possiblemethodological biases.
In summary, specific recommendations particularly for large-scale projects working atmultiple sites, are as follows:
• Concentrate activities in villages with relatively smaller populations and with a smallnumber of sub-villages.
• Choose villages with less farming and more fishing orientation as well as those with lowlevels of social and communications infrastructure, as well as less business development.
• Use existing and readily available village census statistics to prioritize villages targetedfor community-based interventions based on criteria suggested above.
• Select villages where local leadership support for the project is strong. Assess thiscarefully before inviting villages to participate in the program.
• Select COs that have ample time to devote to community organizing and encouragecommunities to select as many volunteers as possible.
• Select COs that are homophilous with the general population of the community.• Maximize the number of training events and participants to build community capacity.• Ensure a highly participatory process that allows for maximum input from community
members through formal meetings as well as informal discussions.
This type of analysis provides insights into how simple project monitoring programs could bedesigned using the measures found significant in this study. Progress/milestone scores can beused to assess progress of all villages using a consistent monitoring system easily tracked by

19
supervising staff. In addition, monitoring of number of training events and meetings as wellas total number of participants in all events would seem to be valid indicators of intermediateprogress.
It must be kept in mind that the above mentioned relationships are probabilities and thereforedo not predict with absolute certainty whether any particular site will be successful, orwhether any particular FEO or CO will perform adequately. However, we can increase thelikelihood of success through several strategies. First, careful community selection should beaccomplished through a triage process using key context variables and assessments ofleadership support. A community-based approach is not appropriate for all villages and oneswhere the likelihood of success is low should not be asked to participate in the program. Thisis particularly important where project resources are not sufficient to have all villagesparticipate and therefore some selection criteria and culling process will be necessary.Projects that are working in multiple sites can choose a subset of all potential sites where theprobability of success will be greatest. If there is a need or desire to include all villages,projects should plan on a longer time frame and greater resource inputs for those villageswhere success is less likely (more difficult). However, this strategy does not considerecological criteria in the community selection process. Ideally an additional layer ofecological criteria should be considered, especially for establishing an interconnectednetwork of CB-MPAs.
Based on these findings, strategies for projects that use simultaneous interventions inmultiple communities should be adjusted. This includes targeting villages more amenable tocommunity-based interventions. This is likely to increase the probability of success andresult in a better return on investments made by local governments and international donorsin community-based marine conservation initiatives.
Acknowledgements
We would like to thank the staff of the Indonesia Coastal Resources Management Project inNorth Sulawesi for their cooperation and assistance in collecting the data used in this study.In particular, their expert opinion on extension officer and community organizer attributes toempirically test were invaluable. Their expressed interest and desire to apply these results insubsequent activities is commendable.
References Cited
Alcala, A.C. 1988. Effects of marine reserves on coral fish abundance and yields of Philippine coral reefs.Ambio 17(3): 194-199.
Alcala, A.C. 1998. Community-based coastal resource management in the Philippines: a case study. Ocean andCoastal Management. 38:179-186.
Alcala, A.C. 2001. Marine Reserves in the Philippines: Historical Development, Effects and Influence onMarine Conservation Policy. The Bookmark Inc. Makati City, Philippines. 115p.
Alder, J. 1996. Have tropical marine protected areas worked? An initial analysis of their success. CoastalManagement 24:97-114.
BPS. 1992 Statistik Potensi Desa Tahun 1992. Biro Pusat Statistik, Sulawesi Utara, Indonesia.
BPS. 1996 Statistik Potensi Desa se-Sulawesi Utara1996. Biro Pusat Statistik, Sulawesi Utara, Indonesia.
BPS. 2000. Statistik Potensi Desa Tahun 2000. Biro Pusat Statistik, Sulawesi Utara, Indonesia.

20
Carr, M., et al. 2003. Comparing marine and terrestrial ecosystems: implications for the design of coastalmarine reserves. Ecological Applications 13(1):90-107.
Crawford, B.R., I. Dutton, C. Rotinsulu, L. Hale. 1998. Community-Based Coastal Resources Management inIndonesia: Examples and Initial Lessons from North Sulawesi. pp. 299-309. In: Proceedings: InternationalTropical Marine Ecosystem Management Symposium, Townsville, Australia.
Crawford, B.R., P. Kussoy, A Siahainenia and R.B. Pollnac, 1999. Socioeconomic Aspects of coastal resourcesuse in Talise, North Sulawesi. Proyek Pesisir Publication. University of Rhode Island, Coastal ResourcesCenter, Narragansett, Rhode Island, USA. 67p.
Crawford, B., M. Balgos and C. R. Pagdilao. 2000. Community-Based Marine Sanctuaries in the Philippines: AReport on Focus Group Discussions. Coastal Management Report # 2224. PCAMRD Book Series No. 30.Coastal Resources Center, University of Rhode Island, Narragansett, RI, USA, and Philippine Council forAquatic and Marine Research and Development, Los Banos, Laguna, Philippines. 84p.
CRMP. 2002. Project Monitoring and Performance Reports. Indonesia Coastal Resources Management Project.Coastal Resources Center, University of Rhode Island, Narragansett Rhode Island, USA.
Dahuri, R. and I. Dutton. 1999. Integrated Coastal and Ocean Management Enters a New Era in Indonesia.Integrated Coastal Zone Management 1: 11-16.
Ferrer, E. M., L. Polotan-Dela Cruz and M. Agoncillo-Domingo (Eds.). 1996. Seeds of hope: A collection ofcase studies on community based coastal resources management in the Philippines. College of SocialWork and Community Development, University of the Philippines, Diliman, Quezon City, Philippines.223p.
Francis, J. A. Nilsson and D. Waruinge. 2002. Marine protected areas in the East Africa region: how successfulare they? Ambio 31(7-8): 503-511.
Gell, F.R. and C.M. Roberts. 2003. The fishery effects of marine reserves and fishery closures. WWF-US.Washington D.C. USA.
Halpern, B.S. and R.R. Warner. 2002. Marine reserves have rapid and lasting effects. Ecology Letters 5: 361-366.
Halpern, B.S. 2003. The impact of marine reserves: do reserves work and does size matter? EcologicalApplications 13(1): 117-137.
Hanson, A. I. Augustine, C.A. Courtney, Akhmad Fauzi, Sarah Gammage, Koesoebiono. 2003. Proyek Pesisir:an assessment of the coastal resource management project (CRMP) in Indonesia. Coastal ResourcesCenter, University of Rhode Island, Narragansett Rhode Island USA. 158p.
Horrill, J.C., H. Kalombo and S. Makoloweka. 2001. Collaborative Reef and Reef Fisheries Management inTanga, Tanzania. Tanga Coastal Zone Conservation and Development Programme, IUCN Eastern AfricaProgramme. 37p.
Jameson, S.C., M. Tupper and J.M. Ridley. 2002. Three screen doors: can marine “protected” areas beeffective? Marine Pollution Bulletin 44:1177-1183.
Johannes, R.E. 1998. Government-supported, village-based management of marine resources in Vanuatu.Ocean and Coastal Management 40: 165-186.
King, M. and U. Faasili. 1998. A network of small, community-owned village fish reserves in Samoa. Parks8(2):11-16.
Kussoy, P., B.R. Crawford, M. Kasmidi dan A. Siahainenia. 1999. Aspek Sosial-Economi untuk PemanfaatanSumberdaya Pesisir di Desa Blongko Sulawesi Utara. Technical Report. Coastal Resources Center,University of Rhode Island, Narragansett, Rhode Island, USA.
Lubchenco, J. S. Gaines, R. Warner, S. Arame and B. Simler. (eds.) 2002. The science of marine reserves.Partnership for interdisciplinary studies of coastal oceans (http//www.piscoweb.org). 22p.
McClanahan, T.R. 1999. Is there a future for coral reef parks in poor tropical countries? Coral Reefs 18: 321-325.
McClanahan, T.R. and Kaunda-Arara. 1996. Fishery recovery in a coral reef marine park and its effects on theadjacent fishery. Conservation Biology 10: 1187-1199.

21
McClanahan, T.R. and Mangi, S. 2001. Spillover of exploitable fishes from a marine park and its effect on theadjacent fishery. Ecological Applications 10: 1792-1805.
Minahasa Law No. 2 of 2002 on integrated community-based management of coastal resources. (PeraturanDaerah Kabupaten Minahasa Nomor 2, Tahun 2002, Tentang Pengelolaan Sumberdaya Wilayah PesisirTerpadu Berbasis Masyarakat di Kabupaten Minahasa Dengan Rahmat Tuhan Yang Maha Esa BupatiMinahasa.
National Law No. 22 of 1999 on regional autonomy (Undang-Undang Republik Indonesia No. 22, 1999,Tentang Pemerintahan Daerah Dengen Rahmat Tuhan Yang Maha Esa Presiden Republik Indonesia)
NRC. 1999. Sustaining Marine Fisheries. Committee on Ecosystem Management for Sustainable MarineFisheries, National Research Council. National Academy Press. Washington D. C. 164p.
NRC. 2001. Marine Protected Areas: Tools for Sustaining Ocean Ecosystems. National Research Council.National Academy Press. Washington DC. 272p.
Olsen, S.B., J. Tobey and L.Z. Hale. 1998. A learning based approach to coastal management. Ambio 27(8):611-619.
Ostrom. E. 1994. Institutional analysis, design principles and threats to sustainable community governance andmanagement of the commons. pp. 34-50. In: Pomeroy, R. S. (ed.), Community management and commonproperty of coastal fisheries in Asia and the Pacific: concepts, methods and experiences. ICLARM(International Center for Living Aquatic Resources Management) Conference Proceedings 45. ICLARM,Manila, Philippines.
Pajaro, M., F. Olano, B. San Juan. 1999. Documentation and review of marine protected areas in thePhilippines: a preliminary report. Haribon Foundation for the Conservation of Natural Resources. MetroManila, Philippines.
Palumbi, S. 2002. Marine reserves as a tool for ecosystem based management and conservation. Pew OceansCommission, Arlington, Virginia.
Patlis, J., R. Dahuri, M.K. Knight and J. Tulungen. 2001. Integrated management in a decentralized Indonesia:how it can work. Pesisir dan Lautan (Journal of Coastal and Marine Resources) 4(1): 24-39.
Patlis, J. 2003. The role of law and legal institutions in determining the sustainability of integrated coastalmanagement projects in Indonesia. Jurnal Pesisir dan Lautan (Journal of Coastal and Marine ResourcesSpecial Edition).
Patlis, J., N. A. Tangkilisan, D. Kawar, M.E. Ering, J. Tulungen, R. Titahelu, M. Knight. 2003. Case studydeveloping a district law in Minahasa on community-based integrated coastal management. CoastalResources Center, University of Rhode Island, Narragansett, Rhode Island, USA. 60p.
Pollnac, R.B. (in press) Multiple Component Assessment of Coral Reef Marine Protected Areas. WorldResources Institute.
Pollnac, R.B., C. Rotinsulu and A. Soemodinoto. 1997a. Rapid Assessment of Coastal Management Issues onthe Coast of Minahasa. Proyek Pesisir Technical Report No: TE-97/01-E. Coastal Resources Center,University of Rhode Island, Narragansett, Rhode Island, USA. 67p.
Pollnac, R.B., F. Sondita, B. Crawford, E. Mantjoro, C. Rotinsulu and A. Siahainenia. 1997b. BaselineAssessment of Socioeconomic Aspects of Resources Use in the Coastal Zone of Bentenan and Tumbak.Proyek Pesisir Technical Report No: TE-97/02-E. Coastal Resources Center, University of Rhode Island,Narragansett, Rhode Island, USA. 79p.
Pollnac, R.B., B. Crawford, C. Rotinsulu, P. Kussoy and A. Siahainenia. 1998. An Examination andComparison of Rumbia and Minanga: Control Villages for the Coastal Resource Management ProjectSites at Bentenan and Tumbak.” Proyek Pesisir Publication TE-98/01-E. Coastal Resources Center,University of Rhode Island, Narragansett, Rhode Island, USA. pp. 41.
Pollnac, R. B., B.R. Crawford and M. Gorospe. 2001. Factors Influencing the Success of Community-BasedMarine Protected Areas in the Visayas, Philippines. Ocean and Coastal Management 44:683-710.
Pajaro, M., F. Olano, B. San Juan. 1999. Documentation and review of marine protected areas in thePhilippines: a preliminary report. Haribon Foundation for the Conservation of Natural Resources. MetroManila, Philippines.

22
Polotan-de la Cruz, L. 1993. Our Life Our Sea. Proceedings of the seminar workshop on community-basedcoastal resources management. February 7-12, 1993, Silliman University, Dumaguete City, Philippines.Voluntary Services Overseas, Quezon City, Philippines. 95p.
Pomeroy, R. S. (ed.). 1994. Community management and common property of coastal fisheries in Asia and thePacific: concepts, methods and experiences. ICLARM (International Center for Living Aquatic ResourcesManagement) Conference Proceedings 45. ICLARM, Manila, Philippines.
Pomeroy, R.S. 1995. Community-based and co-management institutions for sustainable coastal fisheriesmanagement in Southeast Asia. Ocean and Coastal Management 27(3): 143-162.
Pomeroy, R. and M.B. Carlos. 1997. Community-based coastal resources management in the Philippines: areview and evaluation of programs and projects, 1984-1994. Marine Policy 21(5): 445-464.
Rogers, E. M. 1995. Diffusion of Innovations. The Free Press. New York.
Rudd, M.A., M.H. Tupper, H. Folmer and G.C. van Kooten. 2003. Policy analysis for tropical marine reserves:challenges and directions. Fish and Fisheries 4: 65-85.
Russ, G.R. and A.C. Alcala. 1994. Sumilon Island Reserve: 20 years of hopes and frustrations. Naga: TheICLARM Quarterly 7(3): 8-12.
Russ, G.R. and A. Alcala. 1996. Do marine reserves export adult fish biomass? Evidence from Apo Island,Central Philippines. Marine Ecology 132:1-9.
Sukmara, A., B.R. Crawford, dan R.B. Pollnac. 2001. Pengelolaan Sumberdaya Pesisir Berbasis-Masyarakat:Penilaian Sementara Terhadap Desa Proyek Pesisir di Talise, Minahasa, Sulawesi Utara. Technical ReportTE-01/05-I. University of Rhode Island, Coastal Resources Center, Narragansett, Rhode Island, USA. 55p.
Taryoto, A.H.W. 2002. Towards Decentralized Integrated Coastal Management Policy in Indonesia. Ministryof Marine Affairs and Fisheries, Jakarta, Indonesia.13p.
Tulungen, J.T,. B.P. Devi dan C. Rotinsulu. 2000. Pengelolaan Pengembangan, Persetujuan dan PelaksanaanRencana Pembangunan dan Pengelolaan Sumberdaya Wilayah Pesisir Berbasis-Masyarakat di SulawesiUtara. Dalam: Proceeding Konferensi Nasional II: Pengelolaan Sumberdaya Pesisir dan Lautan,Makkassar, Sulawesi Selatan. 15 – 17 Mei 2000.
Tulungan, J.T., S. Putra, F. Pua and B. Crawford. 1999. Decentralized Coastal Resources Management inIndonesia: the Case of North Sulawesi Province. Regional Development Journal. (In Indonesian -Decentralisasi Pengelolaan Sumberdaya Wilayah Pesisir di Indonesia: Kasus Propinsi Sulawesi Utara)Jurnal Pembangunan Daerah 3(2): 43-53.
Veitayaki, J. 1998. Traditional and community-based marine resources management system in Fiji: anevolving integrated process. Coastal Management 26:47-60.
Wantiez, L., P. Thollot and M. Kulbicki. 1997. Effects of marine reserves on coral reef fish communities fromfive islands in New Caledonia. Coral Reefs 16: 215-224.
Ward, T.J., D. Heinemann and N. Evans. 2001. The role of reserves as fisheries managemernt tools: a reviewof concepts, evidence and international experience. Bureau of Rural Sciences; Agriculture, Fisheries andForestry – Australia. Canberra, Australia, 192p.
White, A.T. 1989. Two community-based marine reserves: lessons for coastal management. P. 85-96. In T.E.Chua and D. Pauly (eds.) ICLARM Conf. Proc. 19. Ministry of Science, Technology and theEnvironment, Kuala Lumpur, Johor State Economic Planning Unit, Jahore Bahru, Malaysia, andInternational Center for Living Aquatic Resources management, Metro Manila, Philippines. 254p.
White, A.T. and G.C. Savina. 1987. Reef fish yield and non-reef catch of Apo Island, Negros, Philippines.Asian Marine Biology 4: 67-76.
White, A. T., L.Z. Hale, Y. Renard and L. Cortesi. (eds.) 1994. Collaborative and community-basedmanagement of coral reefs: lessons from experience. Kumarian Press, West Hartford, Connecticut, USA.124p.
White, A.T., H.P. Vogt and T. Arin. 2000. Philippine Coral Reefs under threat: the economic losses caused byreef destruction. Marine Pollution Bulletin 40(7): 598-605.
White, A.T., C.A. Courtney and A. Salamanca. 2002. Experience with Marine Protected Area Planning andManagement in the Philippines. Coastal Management, 30:1-26.

23
World Bank. 1998. Project Appraisal Document: Coral Reef Rehabilitation and Management Project. RuralDevelopment and Natural Resources Sector Unit, Indonesia Country Management Unit, East Asia andPacific Region, World Bank. Washington D.C. USA.
World Bank. 1999. Voices from the village: a comparative study of coastal resource management in the PacificIslands. Pacific Islands Discussion Paper Series Number 9. World Bank, East Asia and Pacific Region,Papua New Guinea and Pacific Islands Country Management Unit. Washington DC, USA.