crawfordsville community school corporation …
TRANSCRIPT
1
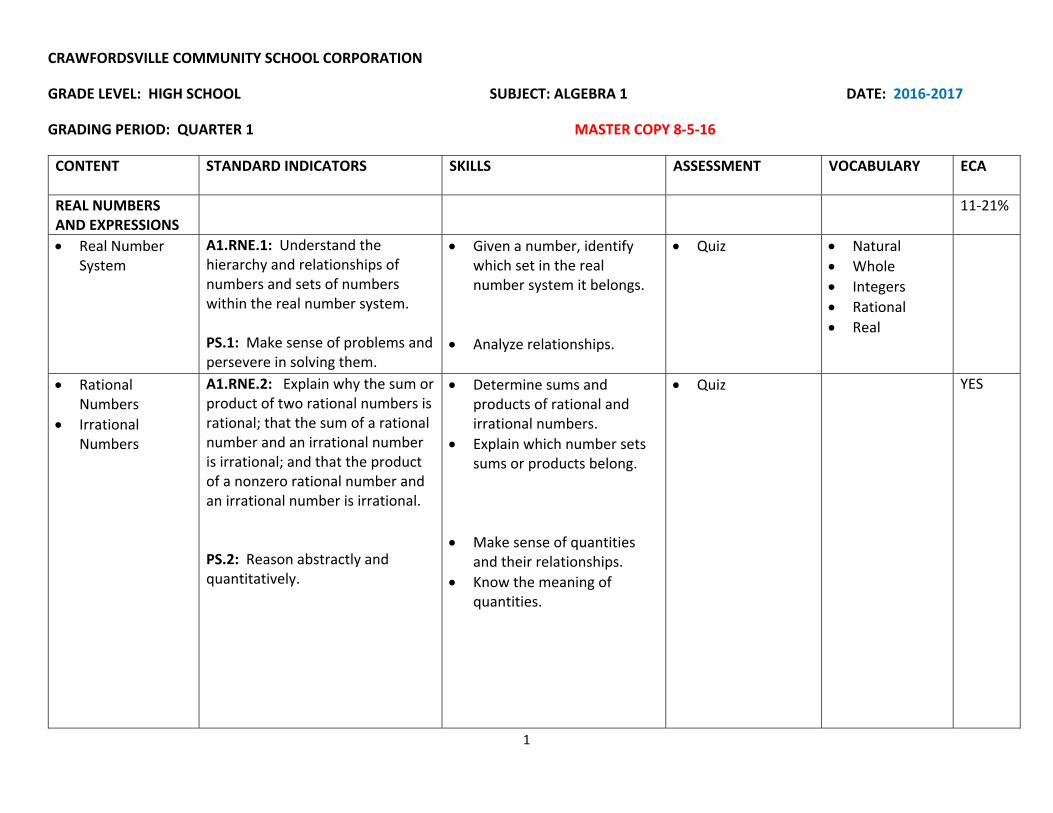
CRAWFORDSVILLE COMMUNITY SCHOOL CORPORATION
GRADE LEVEL: HIGH SCHOOL SUBJECT: ALGEBRA 1 DATE: 2016‐2017
GRADING PERIOD: QUARTER 1 MASTER COPY 8‐5‐16
CONTENT
STANDARD INDICATORS SKILLS ASSESSMENT VOCABULARY ECA
REAL NUMBERS AND EXPRESSIONS
11‐21%
Real Number System
A1.RNE.1: Understand the hierarchy and relationships of numbers and sets of numbers within the real number system. PS.1: Make sense of problems and persevere in solving them.
Given a number, identify which set in the real number system it belongs.
Analyze relationships.
Quiz
Natural Whole Integers Rational Real
Rational Numbers
Irrational Numbers
A1.RNE.2: Explain why the sum or product of two rational numbers is rational; that the sum of a rational number and an irrational number is irrational; and that the product of a nonzero rational number and an irrational number is irrational. PS.2: Reason abstractly and quantitatively.
Determine sums and products of rational and irrational numbers.
Explain which number sets sums or products belong.
Make sense of quantities
and their relationships. Know the meaning of
quantities.
Quiz
YES
2
CONTENT
STANDARD INDICATORS SKILLS ASSESSMENT VOCABULARY ECA
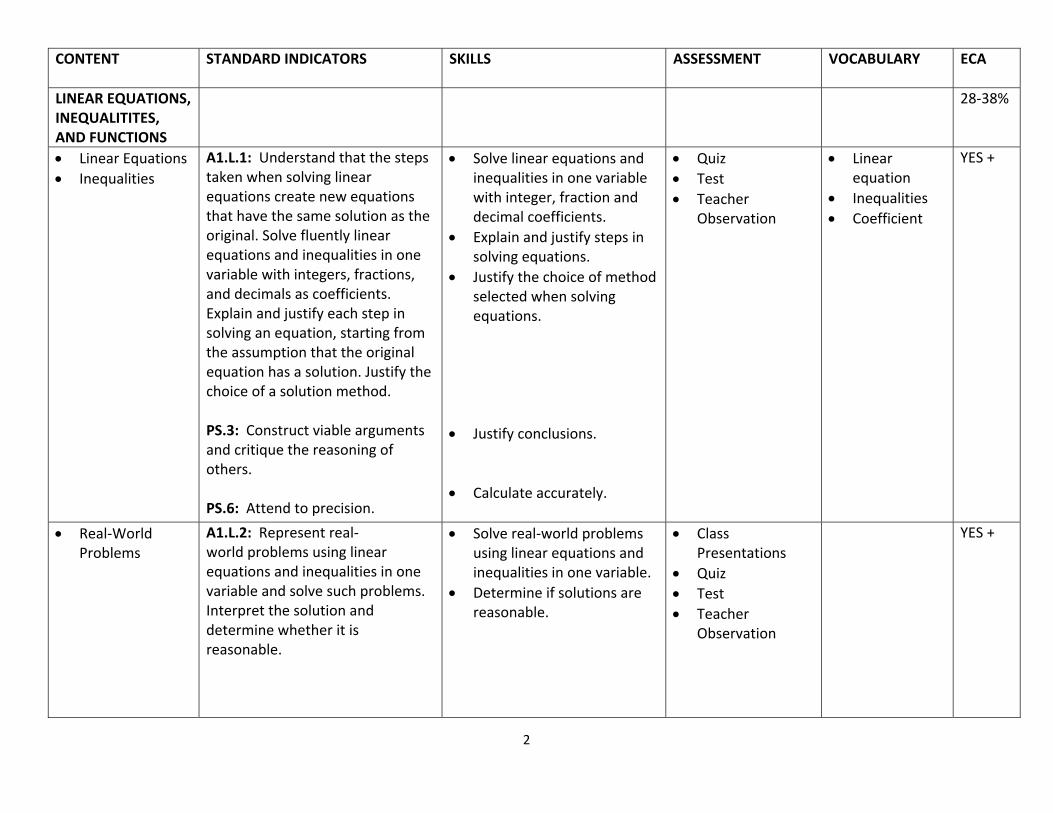
LINEAR EQUATIONS, INEQUALITITES, AND FUNCTIONS
28‐38%
Linear Equations Inequalities
A1.L.1: Understand that the steps taken when solving linear equations create new equations that have the same solution as the original. Solve fluently linear equations and inequalities in one variable with integers, fractions, and decimals as coefficients. Explain and justify each step in solving an equation, starting from the assumption that the original equation has a solution. Justify the choice of a solution method. PS.3: Construct viable arguments and critique the reasoning of others. PS.6: Attend to precision.
Solve linear equations and inequalities in one variable with integer, fraction and decimal coefficients.
Explain and justify steps in solving equations.
Justify the choice of method selected when solving equations.
Justify conclusions. Calculate accurately.
Quiz Test Teacher
Observation
Linear equation
Inequalities Coefficient
YES +
Real‐World Problems
A1.L.2: Represent real‐ world problems using linear equations and inequalities in one variable and solve such problems. Interpret the solution and determine whether it is reasonable.
Solve real‐world problems using linear equations and inequalities in one variable.
Determine if solutions are reasonable.
Class Presentations
Quiz Test Teacher
Observation
YES +
3
CONTENT
STANDARD INDICATORS SKILLS ASSESSMENT VOCABULARY ECA
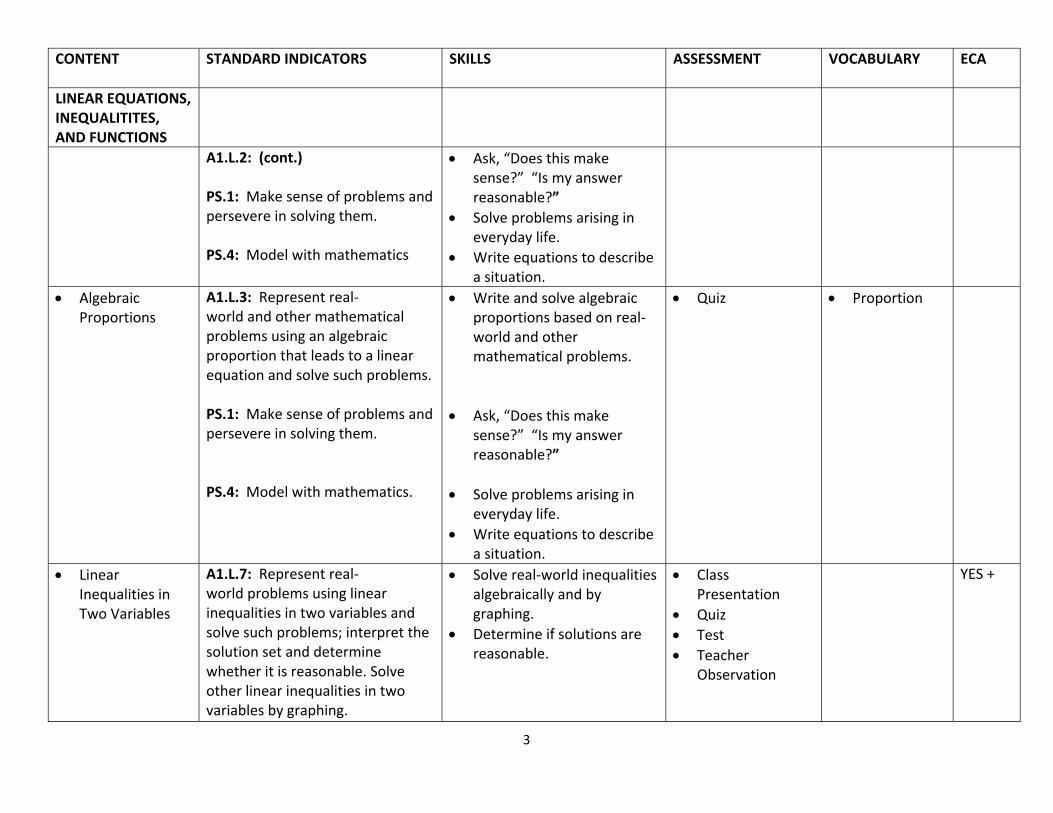
LINEAR EQUATIONS, INEQUALITITES, AND FUNCTIONS
A1.L.2: (cont.) PS.1: Make sense of problems and persevere in solving them. PS.4: Model with mathematics
Ask, “Does this make sense?” “Is my answer reasonable?”
Solve problems arising in everyday life.
Write equations to describe a situation.
Algebraic Proportions
A1.L.3: Represent real‐ world and other mathematical problems using an algebraic proportion that leads to a linear equation and solve such problems. PS.1: Make sense of problems and persevere in solving them. PS.4: Model with mathematics.
Write and solve algebraic proportions based on real‐ world and other mathematical problems.
Ask, “Does this make
sense?” “Is my answer reasonable?”
Solve problems arising in everyday life.
Write equations to describe a situation.
Quiz Proportion
Linear Inequalities in Two Variables
A1.L.7: Represent real‐ world problems using linear inequalities in two variables and solve such problems; interpret the solution set and determine whether it is reasonable. Solve other linear inequalities in two variables by graphing.
Solve real‐world inequalities algebraically and by graphing.
Determine if solutions are reasonable.
Class Presentation
Quiz Test Teacher
Observation
YES +
4
CONTENT
STANDARD INDICATORS SKILLS ASSESSMENT VOCABULARY ECA
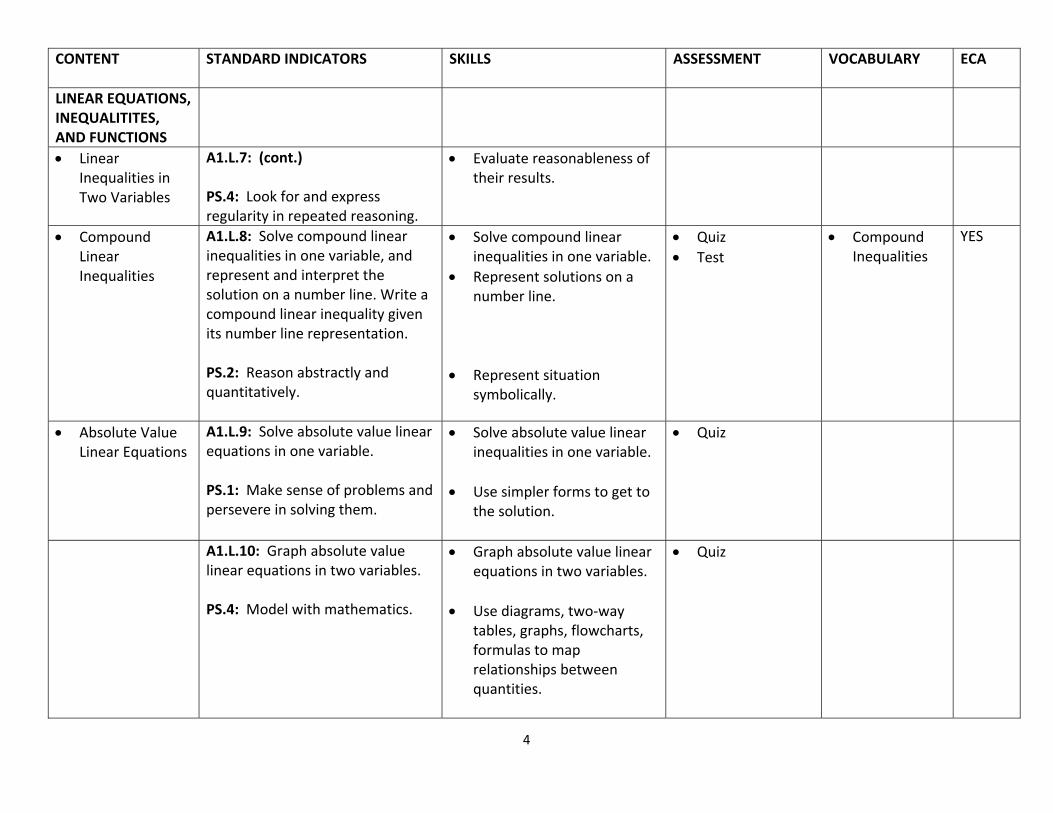
LINEAR EQUATIONS, INEQUALITITES, AND FUNCTIONS
Linear Inequalities in Two Variables
A1.L.7: (cont.) PS.4: Look for and express regularity in repeated reasoning.
Evaluate reasonableness of their results.
Compound Linear Inequalities
A1.L.8: Solve compound linear inequalities in one variable, and represent and interpret the solution on a number line. Write a compound linear inequality given its number line representation. PS.2: Reason abstractly and quantitatively.
Solve compound linear inequalities in one variable.
Represent solutions on a number line.
Represent situation
symbolically.
Quiz Test
Compound Inequalities
YES
Absolute Value Linear Equations
A1.L.9: Solve absolute value linear equations in one variable. PS.1: Make sense of problems and persevere in solving them.
Solve absolute value linear inequalities in one variable.
Use simpler forms to get to the solution.
Quiz
A1.L.10: Graph absolute value linear equations in two variables. PS.4: Model with mathematics.
Graph absolute value linear equations in two variables.
Use diagrams, two‐way
tables, graphs, flowcharts, formulas to map relationships between quantities.
Quiz
5
CONTENT
STANDARD INDICATORS SKILLS ASSESSMENT VOCABULARY ECA
LINEAR EQUATIONS, INEQUALITITES, AND FUNCTIONS
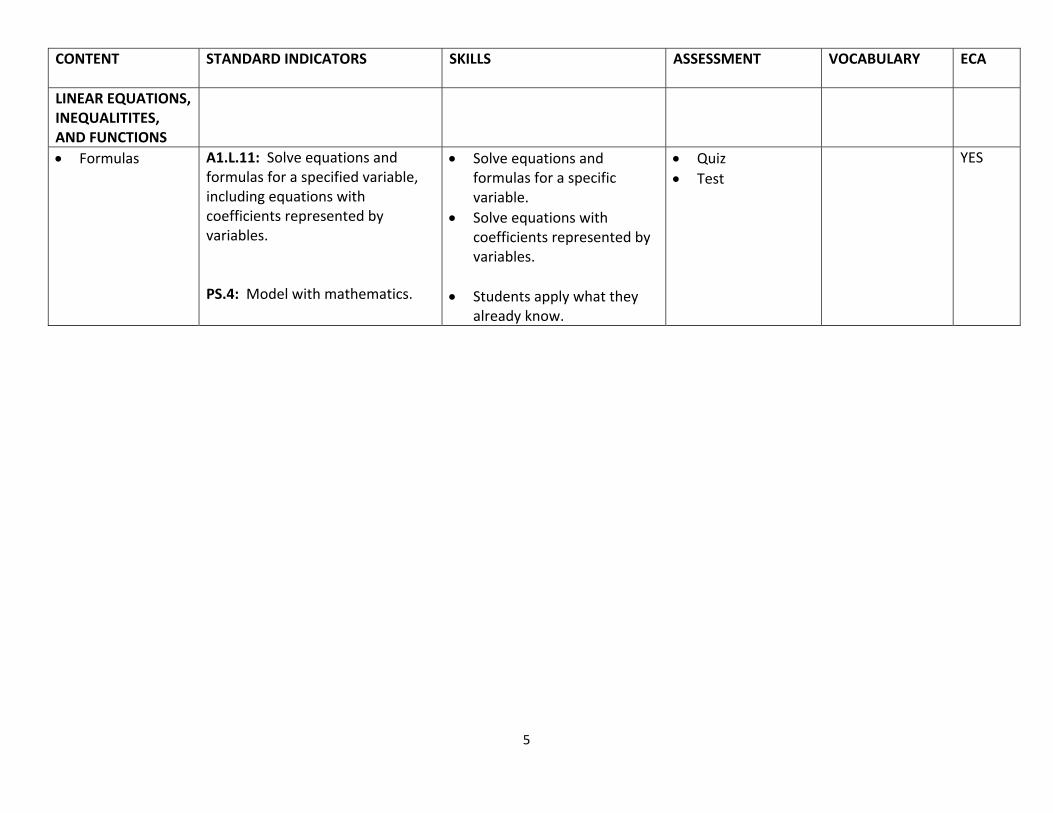
Formulas A1.L.11: Solve equations and formulas for a specified variable, including equations with coefficients represented by variables. PS.4: Model with mathematics.
Solve equations and formulas for a specific variable.
Solve equations with coefficients represented by variables.
Students apply what they
already know.
Quiz Test
YES
1
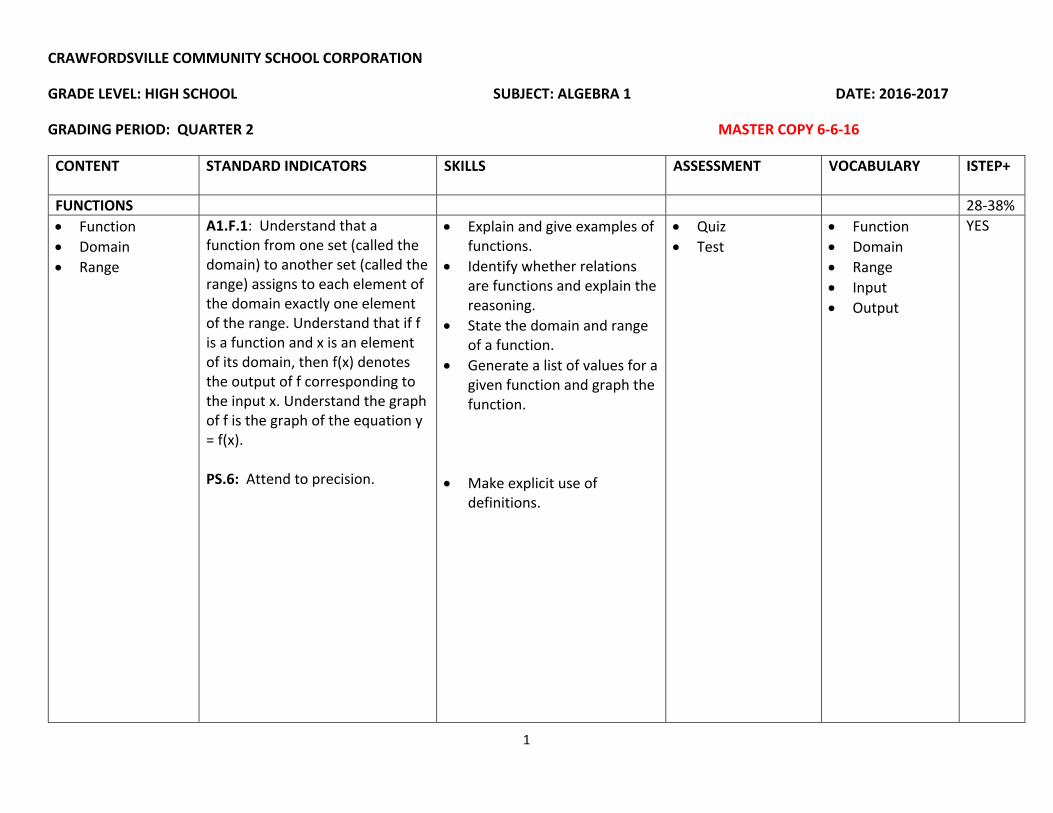
CRAWFORDSVILLE COMMUNITY SCHOOL CORPORATION
GRADE LEVEL: HIGH SCHOOL SUBJECT: ALGEBRA 1 DATE: 2016‐2017
GRADING PERIOD: QUARTER 2 MASTER COPY 6‐6‐16
CONTENT
STANDARD INDICATORS SKILLS ASSESSMENT VOCABULARY ISTEP+
FUNCTIONS 28‐38% Function Domain Range
A1.F.1: Understand that a function from one set (called the domain) to another set (called the range) assigns to each element of the domain exactly one element of the range. Understand that if f is a function and x is an element of its domain, then f(x) denotes the output of f corresponding to the input x. Understand the graph of f is the graph of the equation y = f(x). PS.6: Attend to precision.
Explain and give examples of functions.
Identify whether relations are functions and explain the reasoning.
State the domain and range of a function.
Generate a list of values for a given function and graph the function.
Make explicit use of definitions.
Quiz Test
Function Domain Range Input Output
YES

2
CONTENT
STANDARD INDICATORS SKILLS ASSESSMENT VOCABULARY ISTEP+
FUNCTIONS 28‐38% Function
relationships Graphs of
functions Qualitative
descriptions Independent and
dependent variables
A1.F.2: Describe qualitatively the functional relationship between two quantities by analyzing a graph (e.g., where the function is increasing or decreasing, linear or nonlinear, has a maximum or minimum value). Sketch a graph that exhibits the qualitative features of a function that has been verbally described. Identify independent and dependent variables and make predictions about the relationship. PS.5: Use appropriate tools strategically.
Identify graphs of functions that represent varying rates of change.
Identify independent and dependent variables in real‐life situations.
Sketch graphs of real‐life applications of functions.
Use pencil/paper, concrete
models, protractor, calculator, spreadsheet, computer algebra system, graphing calculators, geometric software, statistical package.
Quiz Test
Qualitative Independent
variables Dependent
variables
YES

3
CONTENT
STANDARD INDICATORS SKILLS ASSESSMENT VOCABULARY ISTEP+
FUNCTIONS 28‐38% Domain Range
A1.F.3: Identify the domain and range of relations represented in tables, graphs, verbal descriptions, and equations. PS.4: Model with mathematics.
Identify the domain and range of a relation given in different forms (ex. tables, graphs, verbal descriptions, and equations).
Use diagrams, two‐way
tables, graphs, flowcharts, formulas to map relationships between quantities.
Quiz Relation
Function notation
AI.F.4: Understand and interpret statements that use function notation in terms of a context; relate the domain of the function to its graph and to the quantitative relationship it describes. PS.4: Model with mathematics.
Evaluate functions given in function notation for different values of the domain.
Interpret statements that use function notation in terms of real‐life problems.
Show the relationship between the domain of a function and its graph.
Solve problems using
representations.
Quiz Test
YES
4
CONTENT
STANDARD INDICATORS SKILLS ASSESSMENT VOCABULARY ISTEP+
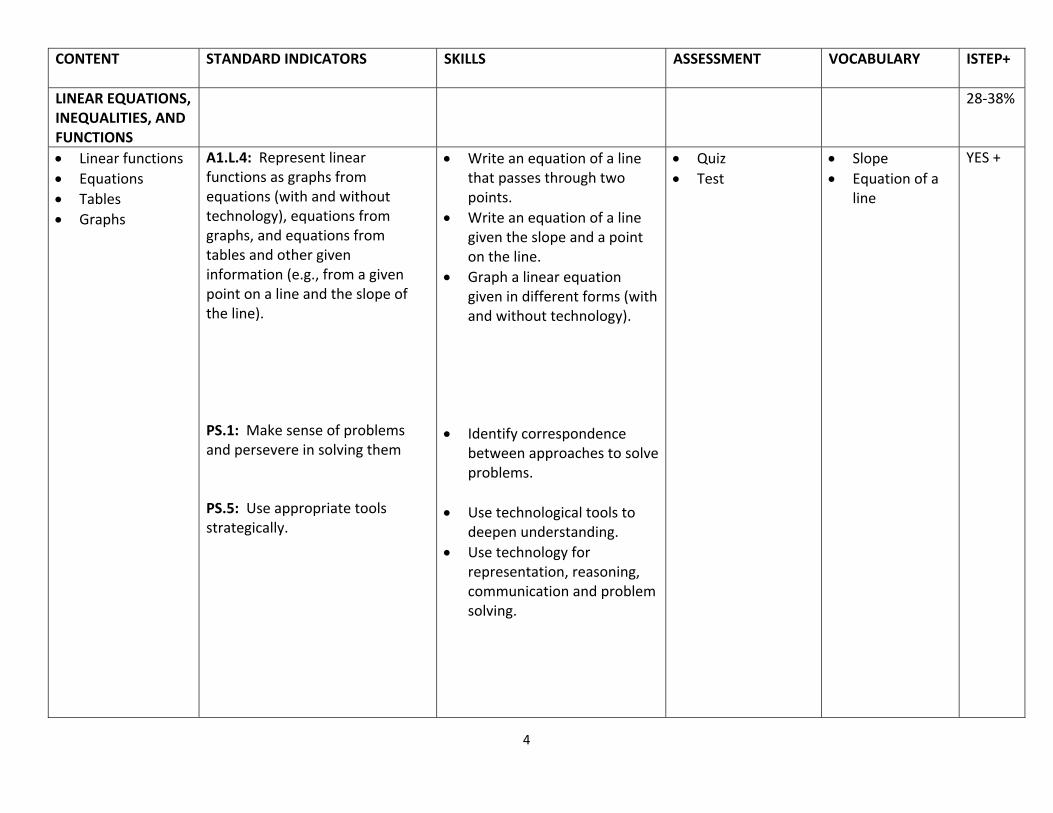
LINEAR EQUATIONS, INEQUALITIES, AND FUNCTIONS
28‐38%
Linear functions Equations Tables Graphs
A1.L.4: Represent linear functions as graphs from equations (with and without technology), equations from graphs, and equations from tables and other given information (e.g., from a given point on a line and the slope of the line). PS.1: Make sense of problems and persevere in solving them PS.5: Use appropriate tools strategically.
Write an equation of a line that passes through two points.
Write an equation of a line given the slope and a point on the line.
Graph a linear equation given in different forms (with and without technology).
Identify correspondence
between approaches to solve problems.
Use technological tools to
deepen understanding. Use technology for
representation, reasoning, communication and problem solving.
Quiz Test
Slope Equation of a
line
YES +

5
CONTENT
STANDARD INDICATORS SKILLS ASSESSMENT VOCABULARY ISTEP+
LINEAR EQUATIONS, INEQUALITIES, AND FUNCTIONS
28‐38%
Real‐world problems
Linear functions Equations,
graphs and tables
AI.L.5: Represent real‐world problems that can be modeled with a linear function using equations, graphs, and tables; translate fluently among these representations, and interpret the slope and intercepts. PS.4: Model with mathematics.
Write a linear equation representing a real‐world problem.
Define the variables, graph the equation, determine intercepts and slope.
Solve problems arising in
everyday life. Write equations to describe
a situation. Analyze a problem in the
community. Students apply what they
know.
Quiz Test
X‐intercept Y‐intercept
YES +
Slope‐intercept form
Point‐slope form Standard form
A1.L.6: Translate among equivalent forms of equations for linear functions, including slope‐ intercept, point‐slope, and standard. Recognize that different forms reveal more or less information about a given situation. PS.1: Make sense of problems and persevere in solving them.
Write equations in slope‐intercept form.
Write equations in point‐slope form.
Write equations in standard form.
Describe how the different forms of a linear equation reveal more or less information about a given situation.
Compare relationships.
Quiz Test
Slope‐intercept form
Point‐slope form
Standard form
YES
6
CONTENT
STANDARD INDICATORS SKILLS ASSESSMENT VOCABULARY ISTEP+
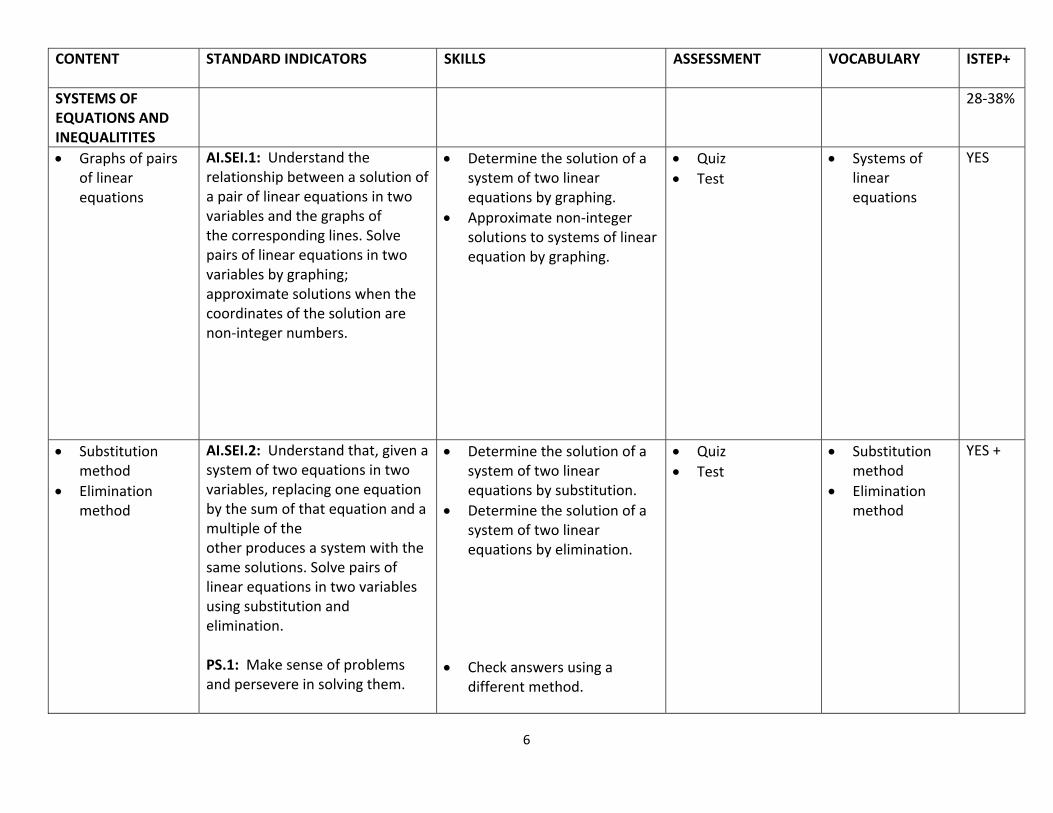
SYSTEMS OF EQUATIONS AND INEQUALITITES
28‐38%
Graphs of pairs of linear equations
AI.SEI.1: Understand the relationship between a solution of a pair of linear equations in two variables and the graphs of the corresponding lines. Solve pairs of linear equations in two variables by graphing; approximate solutions when the coordinates of the solution are non‐integer numbers.
Determine the solution of a system of two linear equations by graphing.
Approximate non‐integer solutions to systems of linear equation by graphing.
Quiz Test
Systems of linear equations
YES
Substitution method
Elimination method
AI.SEI.2: Understand that, given a system of two equations in two variables, replacing one equation by the sum of that equation and a multiple of the other produces a system with the same solutions. Solve pairs of linear equations in two variables using substitution and elimination. PS.1: Make sense of problems and persevere in solving them.
Determine the solution of a system of two linear equations by substitution.
Determine the solution of a system of two linear equations by elimination.
Check answers using a
different method.
Quiz Test
Substitution method
Elimination method
YES +

7
CONTENT
STANDARD INDICATORS SKILLS ASSESSMENT VOCABULARY ISTEP+
SYSTEMS OF EQUATIONS AND INEQUALITITES
28‐38%
Real‐world problems
AI.SEI.3: Write a system of two linear equations in two variables that represents a real‐world problem and solve the problem with and without technology. Interpret the solution and determine whether the solution is reasonable. PS.4: Model with mathematics.
Use a system of equations in two variables to solve real‐world problems.
Explain the solution in context of the problem and discuss whether it is reasonable or not.
Solve problems arising in
everyday life. Write equations to describe
a situation. Analyze a problem in the
community. Students apply what they
know. Solve problems using
representations.
Quiz Test
YES +

8
CONTENT
STANDARD INDICATORS SKILLS ASSESSMENT VOCABULARY ISTEP+
DATA ANALYSIS AND STATISTICS
9‐19%
Scatter plots AI.DS.2: Graph bivariate data on a scatter plot and describe the relationship between the variables. PS.5: Use appropriate tools strategically. PS.8: Look for and express regularity in repeated reasoning.
Create a scatter plot and describe the relationship between the two variables.
Use pencil/paper, concrete
models, protractor, spreadsheet, graphing calculators.
Make decisions to choose appropriate tools to solve the problem.
Use technological tools to deepen understanding.
Evaluate reasonableness of
their results.
Quiz Test
Bivariate data Scatter plot
YES
Line of best‐fit Correlation
coefficient
A1.DS.3: Use technology to find a linear function that models a relationship for a bivariate data set to make predictions; interpret the slope and y‐intercept, and compute (using technology) and interpret the correlation coefficient.
Use graphing calculators and/or computer software to find the best‐fit line of a bivariate data set.
Compute the correlation coefficient and describe the relationship that exists between the two variables.
State the meaning of the slope and intercepts of the best fit line in terms of real‐world problems.
Quiz Test
Best‐fit line Correlation
coefficient
YES

9
CONTENT
STANDARD INDICATORS SKILLS ASSESSMENT VOCABULARY ISTEP+
DATA ANALYSIS AND STATISTICS
9‐19%
A1.DS.3: (cont.) PS.5: Use appropriate tools strategically. PS.8: Look for and express regularity in repeated reasoning.
Use pencil/paper, concrete models, protractor, calculator, spreadsheet, computer algebra system, graphing calculators, geometric software, statistical package.
Make decisions to choose appropriate tools to solve the problem.
Use technological tools to deepen understanding.
Evaluate reasonableness of
their results.

1
CRAWFORDSVILLE COMMUNITY SCHOOL CORPORATION
GRADE LEVEL: HIGH SCHOOL SUBJECT: ALGEBRA 1 DATE: 2016‐2017
GRADING PERIOD: QUARTER 3 MASTER COPY 6‐6‐2016
CONTENT
STANDARD INDICATORS SKILLS ASSESSMENT VOCABULARY ISTEP+
REAL NUMBERS AND EXPRESSIONS
11‐21%
Rational exponents
AI.RNE.3: Rewrite and evaluate numeric expressions with positive rational exponents using the properties of exponents.
Use the properties of exponents evaluate and simplify expressions with rational exponents.
Quiz Test Teacher
observation Peer evaluation
Rational exponents
YES
Square roots of non‐perfect square Integers and Monomials
AI.RNE.4: Simplify square roots of non‐perfect square integers and algebraic monomials.
Simplify square roots of non‐perfect square monomial expressions.
Quiz Test Teacher
observation Peer evaluation
Monomial Non‐Perfect
Square
YES
Algebraic Rational Expressions
AI.RNE.5: Simplify algebraic rational expressions, with numerators and denominators containing monomial bases with integer exponents, to equivalent forms.
Simplify fractions involving monomial numerators and denominators with both positive and negative exponents.
Quiz Test Teacher
observation Peer evaluation
Algebraic rational expressions
YES

2
CONTENT
STANDARD INDICATORS SKILLS ASSESSMENT VOCABULARY ISTEP+
REAL NUMBERS AND EXPRESSIONS
11‐21%
Polynomials Difference of
two squares Perfect square
trinomials
AI.RNE.6: Factor common terms from polynomials and factor polynomials completely. Factor the difference of two squares, perfect square trinomials, and other quadratic expressions.
Factor polynomial expressions using greatest common factors, grouping and special factoring patterns (difference of squares).
Polynomials Factoring Difference of
two squares Perfect square
trinomials
YES
Compute with polynomials
AI.RNE.7: Understand polynomials are closed under the operations of addition, subtraction, and multiplication with integers; add, subtract, and multiply polynomials and divide polynomials by monomials.
Add, subtract, multiply and divide polynomial expressions.
Quiz Test Teacher
observation Peer evaluation
YES
LINEAR EQUATIONS, INEQUALITIES AND FUNCTIONS
28‐38%
Linear Inequalities in two variables
Solve real world problems
AI.L.7: Represent real‐world problems using linear inequalities in two variables and solve such problems; interpret the solution set and determine whether it is reasonable. Solve other linear inequalities in two variables by graphing.
Write and solve linear inequalities that represent real‐world situations.
Graph linear inequalities to represent solution sets.
Quiz Test Teacher
observation Peer evaluation
Linear Inequalities
Solution sets
YES
3
CONTENT
STANDARD INDICATORS SKILLS ASSESSMENT VOCABULARY ISTEP+
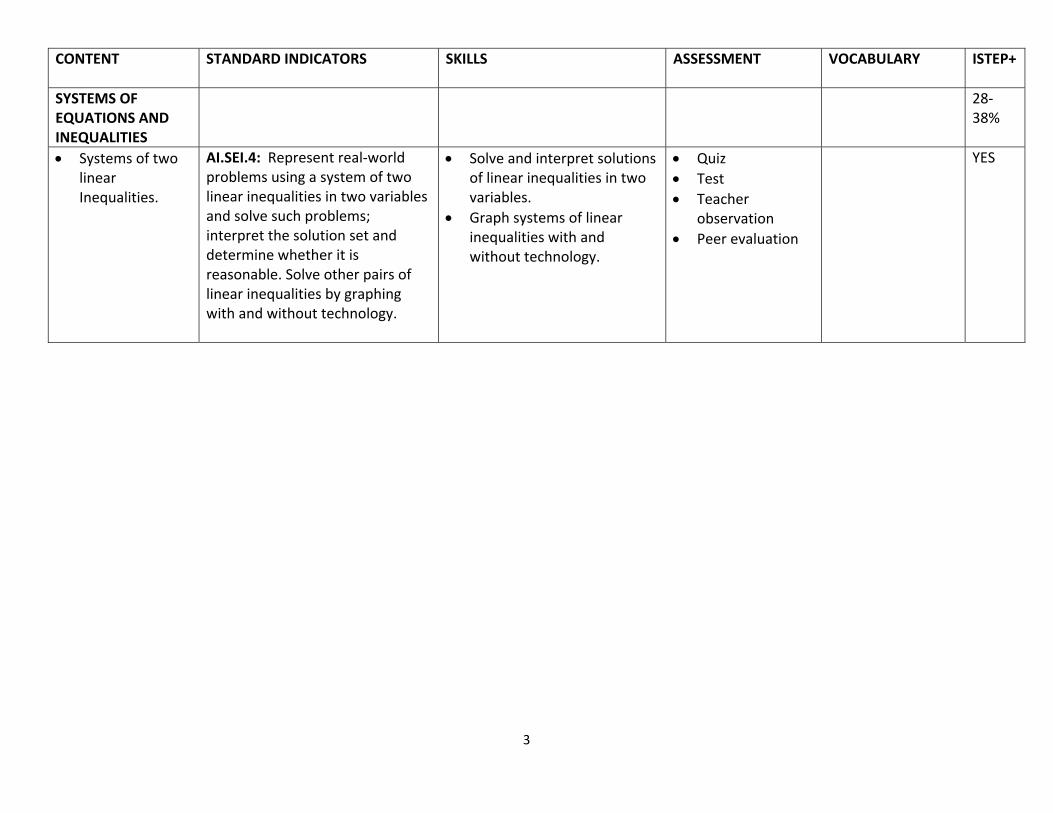
SYSTEMS OF EQUATIONS AND INEQUALITIES
28‐38%
Systems of two linear Inequalities.
AI.SEI.4: Represent real‐world problems using a system of two linear inequalities in two variables and solve such problems; interpret the solution set and determine whether it is reasonable. Solve other pairs of linear inequalities by graphing with and without technology.
Solve and interpret solutions of linear inequalities in two variables.
Graph systems of linear inequalities with and without technology.
Quiz Test Teacher
observation Peer evaluation
YES
1
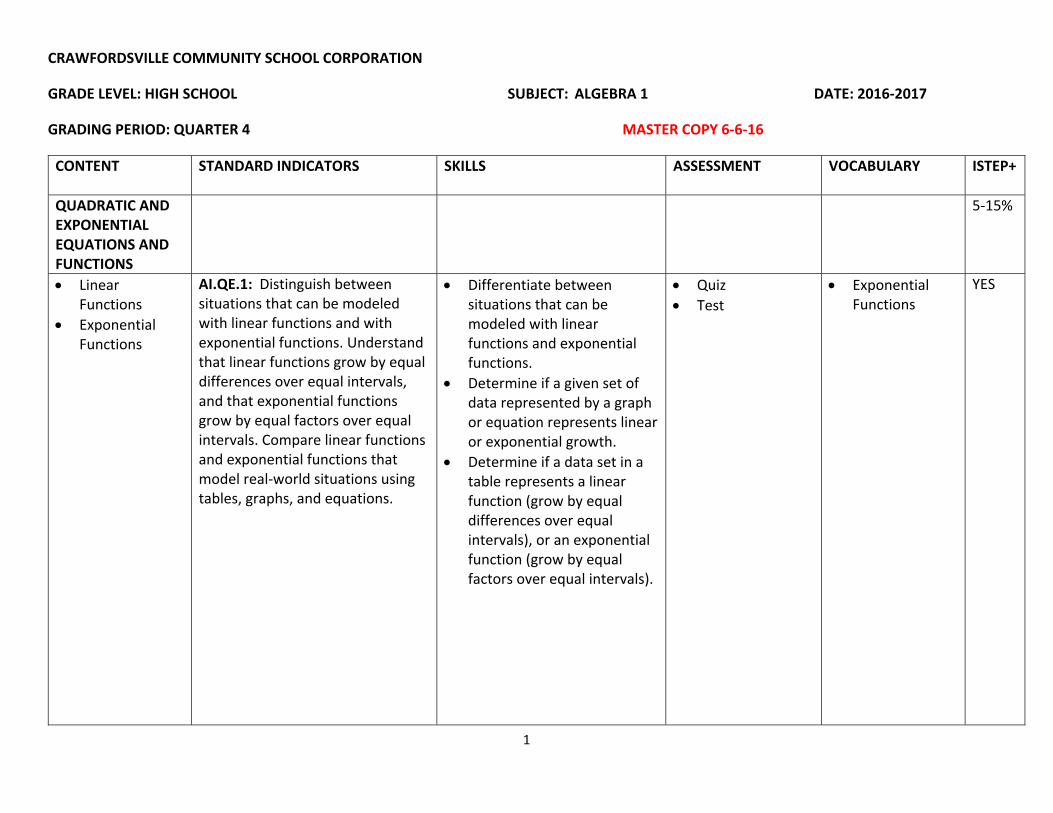
CRAWFORDSVILLE COMMUNITY SCHOOL CORPORATION
GRADE LEVEL: HIGH SCHOOL SUBJECT: ALGEBRA 1 DATE: 2016‐2017
GRADING PERIOD: QUARTER 4 MASTER COPY 6‐6‐16
CONTENT
STANDARD INDICATORS SKILLS ASSESSMENT VOCABULARY ISTEP+
QUADRATIC AND EXPONENTIAL EQUATIONS AND FUNCTIONS
5‐15%
Linear Functions
Exponential Functions
AI.QE.1: Distinguish between situations that can be modeled with linear functions and with exponential functions. Understand that linear functions grow by equal differences over equal intervals, and that exponential functions grow by equal factors over equal intervals. Compare linear functions and exponential functions that model real‐world situations using tables, graphs, and equations.
Differentiate between situations that can be modeled with linear functions and exponential functions.
Determine if a given set of data represented by a graph or equation represents linear or exponential growth.
Determine if a data set in a table represents a linear function (grow by equal differences over equal intervals), or an exponential function (grow by equal factors over equal intervals).
Quiz Test
Exponential Functions
YES

2
CONTENT
STANDARD INDICATORS SKILLS ASSESSMENT VOCABULARY ISTEP+
QUADRATIC AND EXPONENTIAL EQUATIONS AND FUNCTIONS
5‐15%
Exponential models of real‐world situations
AI.QE.2: Represent real‐world and other mathematical problems that can be modeled with exponential functions using tables, graphs, and equations of the form y = ab^x (for integer values of x > 1, rational values of b > 0 and b ≠ 1 ); translate fluently among these representations and interpret the values of a and b.
Use tables, graphs and equations of the form y = ab^x to represent exponential functions.
Define what the variables in an exponential equation represent.
Write exponential equations to model real‐world problems.
Quiz Test
Graph exponential equations.
Graph quadratic equations.
A1.QE.3: Graph exponential and quadratic equations in two variables with and without technology.
Graph exponential equations in two variables with and without technology.
Graph quadratic equations in two variables with and without technology.
Quiz Test
Quadratic equations
YES
Solve quadratic equations
AI.QE.4: Solve quadratic equations in one variable by inspection (e.g., for x^2 = 49), finding square roots, using the quadratic formula, and factoring, as appropriate to the initial form of the equation.
Solve quadratic equations by: Factoring Finding square roots Using the quadratic
formula
Quiz Test
Quadratic Formula
YES

3
CONTENT
STANDARD INDICATORS SKILLS ASSESSMENT VOCABULARY ISTEP+
QUADRATIC AND EXPONENTIAL EQUATIONS AND FUNCTIONS
5‐15%
Solve real‐world problems involving quadratic equations
AI.QE.5: Represent real‐world problems using quadratic equations in one or two variables and solve such problems with and without technology. Interpret the solution and determine whether it is reasonable.
Solve real‐world problems using quadratic equations.
Explain if the solution is reasonable to the application.
Quiz Test
YES
Zeros of quadratic functions
Lines of symmetry
Extreme values
AI.QE.6: Use the process of factoring to determine zeros, lines of symmetry, and extreme values in real‐world and other mathematical problems involving quadratic functions; interpret the results in the real‐world contexts.
Determine the zeros, line of symmetry, maximum and/or minimum values for a quadratic function.
Quiz Test
Zeros of a function
Line of symmetry
Minimum and maximum values of a function
YES
Relationships between solutions of quadratic equations
AI.QE.7: Describe the relationships among the solutions of a quadratic equation, the zeros of the function, the x‐intercepts of the graph, and the factors of the expression.
Given the solutions to a quadratic equation, describe the relationship between the zeros, the factors, the graph and the equation itself.
Quiz Test
YES
4
CONTENT
STANDARD INDICATORS SKILLS ASSESSMENT VOCABULARY ISTEP+
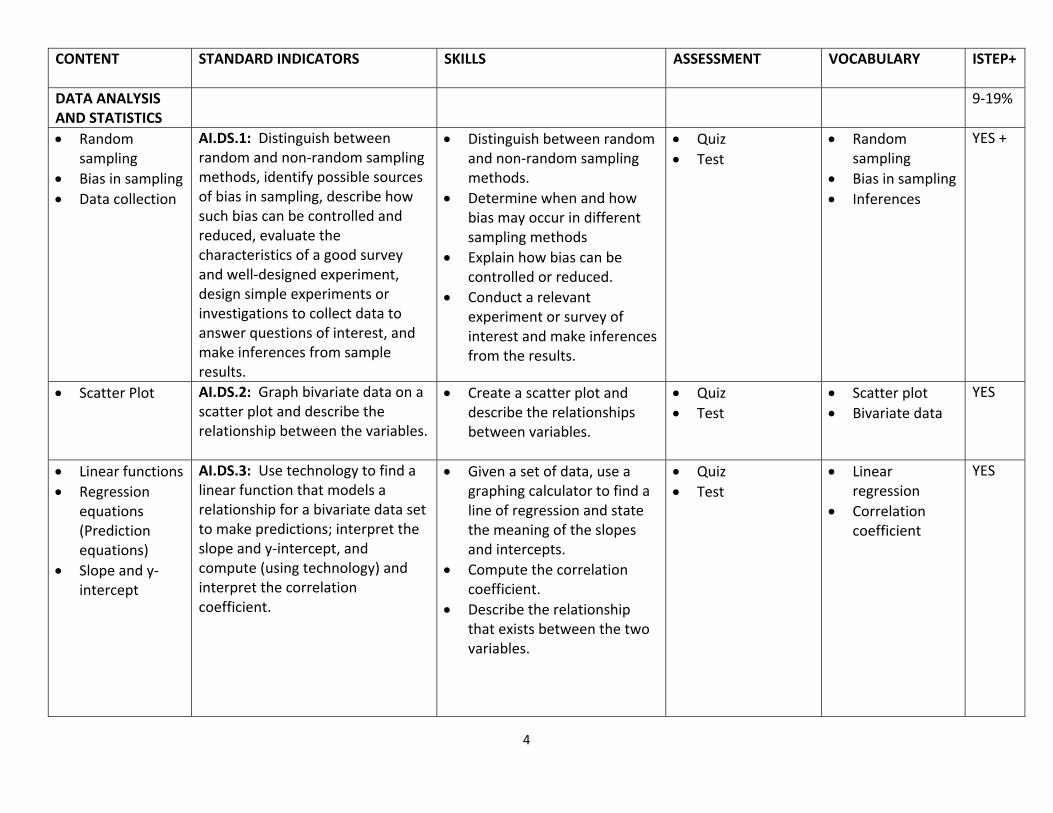
DATA ANALYSIS AND STATISTICS
9‐19%
Random sampling
Bias in sampling Data collection
AI.DS.1: Distinguish between random and non‐random sampling methods, identify possible sources of bias in sampling, describe how such bias can be controlled and reduced, evaluate the characteristics of a good survey and well‐designed experiment, design simple experiments or investigations to collect data to answer questions of interest, and make inferences from sample results.
Distinguish between random and non‐random sampling methods.
Determine when and how bias may occur in different sampling methods
Explain how bias can be controlled or reduced.
Conduct a relevant experiment or survey of interest and make inferences from the results.
Quiz Test
Random sampling
Bias in sampling Inferences
YES +
Scatter Plot AI.DS.2: Graph bivariate data on a scatter plot and describe the relationship between the variables.
Create a scatter plot and describe the relationships between variables.
Quiz Test
Scatter plot Bivariate data
YES
Linear functions Regression
equations (Prediction equations)
Slope and y‐intercept
AI.DS.3: Use technology to find a linear function that models a relationship for a bivariate data set to make predictions; interpret the slope and y‐intercept, and compute (using technology) and interpret the correlation coefficient.
Given a set of data, use a graphing calculator to find a line of regression and state the meaning of the slopes and intercepts.
Compute the correlation coefficient.
Describe the relationship that exists between the two variables.
Quiz Test
Linear regression
Correlation coefficient
YES

5
CONTENT
STANDARD INDICATORS SKILLS ASSESSMENT VOCABULARY ISTEP+
DATA ANALYSIS AND STATISTICS
Correlation Causation
AI.DS.4: Distinguish between correlation and causation.
Make decisions about the validity of conclusions based on correlation and/or causation of two variables.
Quiz Test
Causation
Frequencies Relative
frequencies Two‐way tables Joint, marginal
and relative frequencies
AI.DS.5: Understand that patterns of association can also be seen in bivariate categorical data by displaying frequencies and relative frequencies in a two‐way table. Construct and interpret a two‐way table summarizing data on two categorical variables collected from the same subjects. Use relative frequencies calculated for rows or columns (including joint, marginal, and conditional relative frequencies) to describe possible associations and trends in the data.
Construct table on two categorical variables collected from the same subjects. (EX. Age vs. height)
Interpret and summarize data.
Quiz Test
Frequency Relative
frequency Relative joint
frequency Relative
marginal frequency
Conditional relative frequency
YES
Misleading data AI.DS.6: Understand that statistics and data are non‐neutral and designed to serve a particular interest. Analyze the possibilities for whose interest might be served and how the representations might be misleading.
Analyze claims made from data collection that may lead to misleading results.
Explain why the claims are misleading and who’s interest is being served.
Quiz Test
Statistics YES